

Spatiotemporal Variations of Glacier Mass Balance in the Tomur Peak Region Based on Multi-Source Altimetry Remote Sensing Data


 , ,
, ,
Abstract
:
1. Introduction
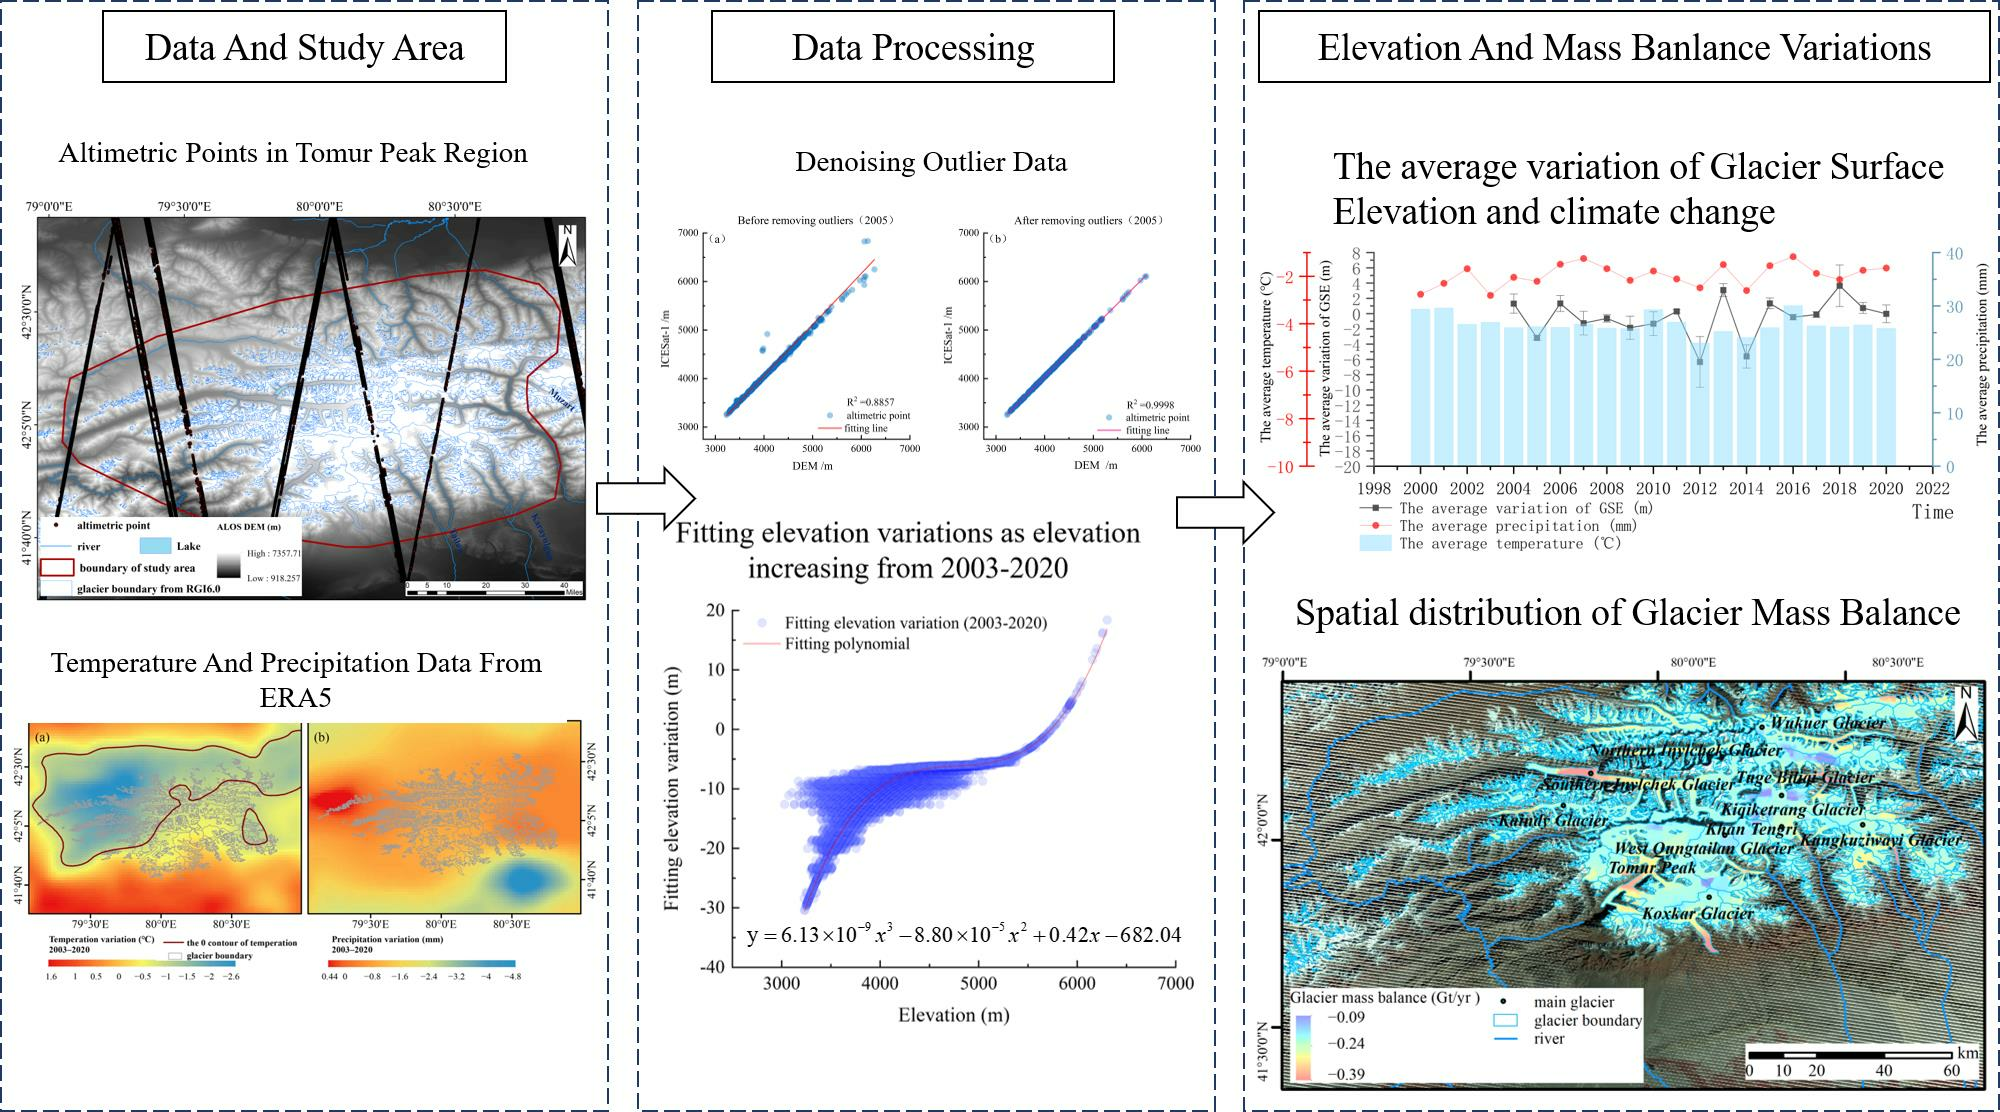
2. Data and Methods
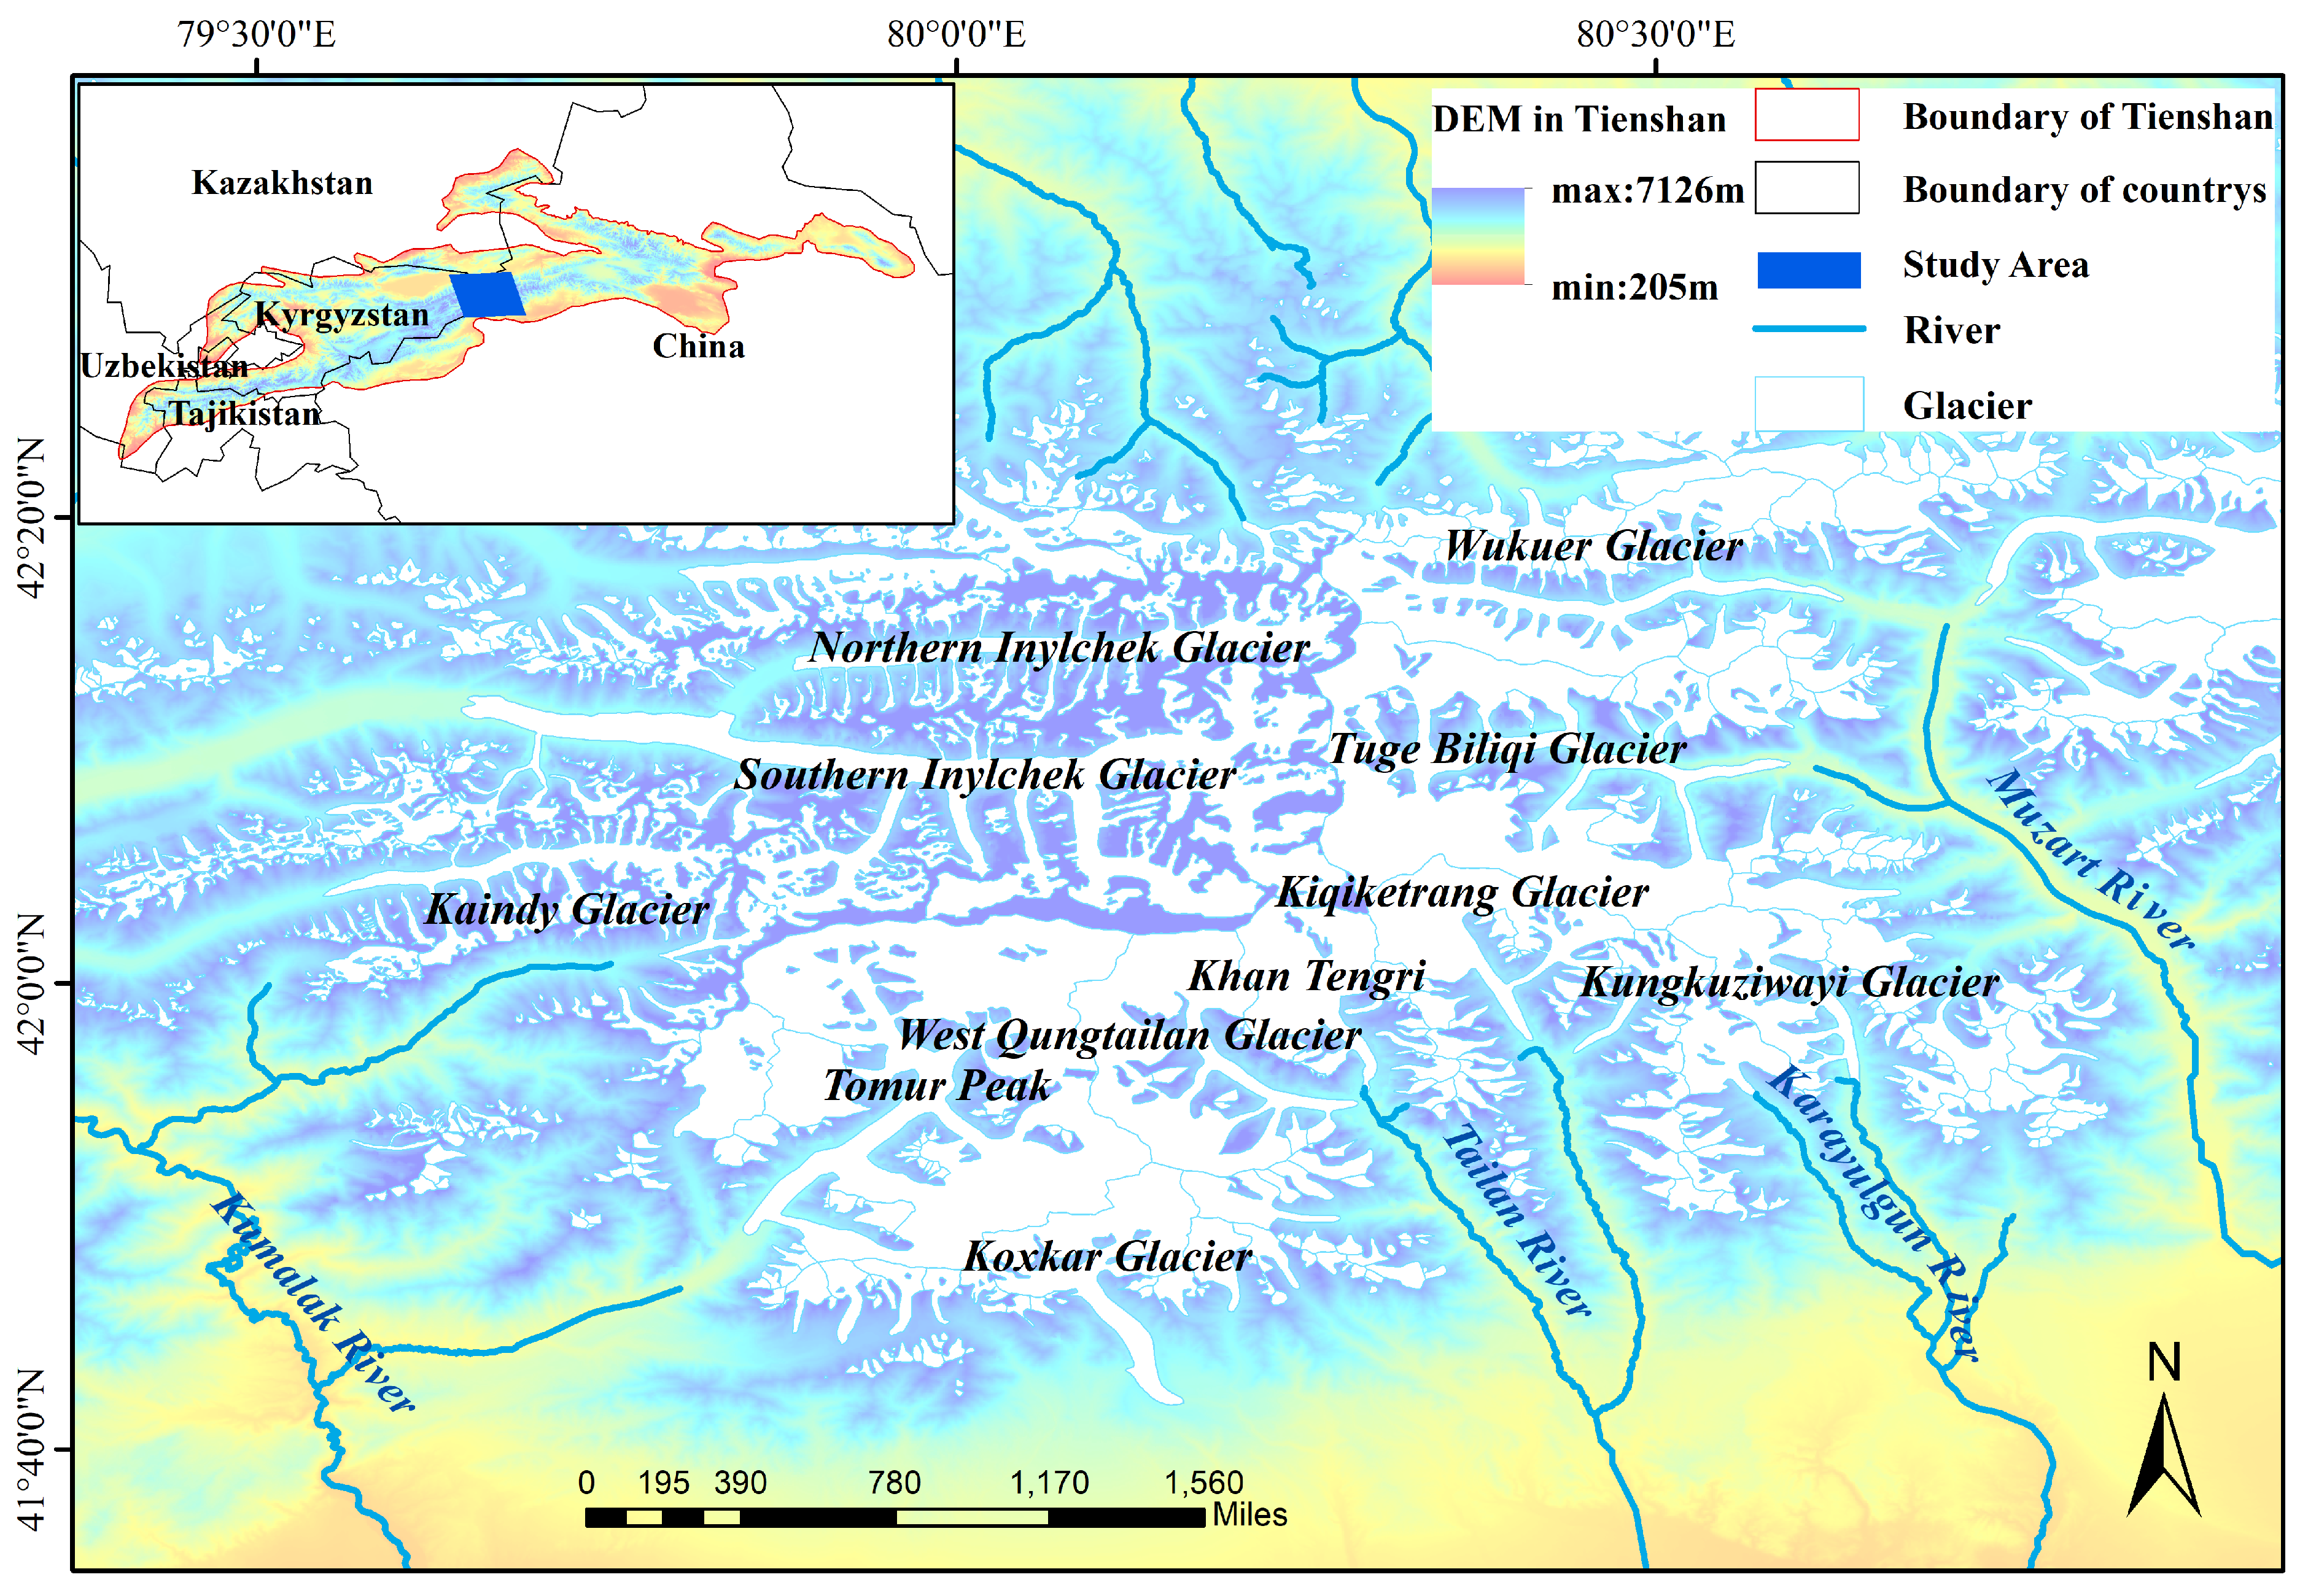
2.1. Study Area
2.2. Data
2.2.1. ICESat-1 and ICESat-2 Laser Altimetry Data
2.2.2. CryoSat-2 Radar Altimetry Data
2.2.3. ALOS DEM
2.2.4. Auxiliary Data
2.3. Time-Series Reconstruction of Glacier Surface Elevation Variations
2.3.1. Altimetric Point Denoising
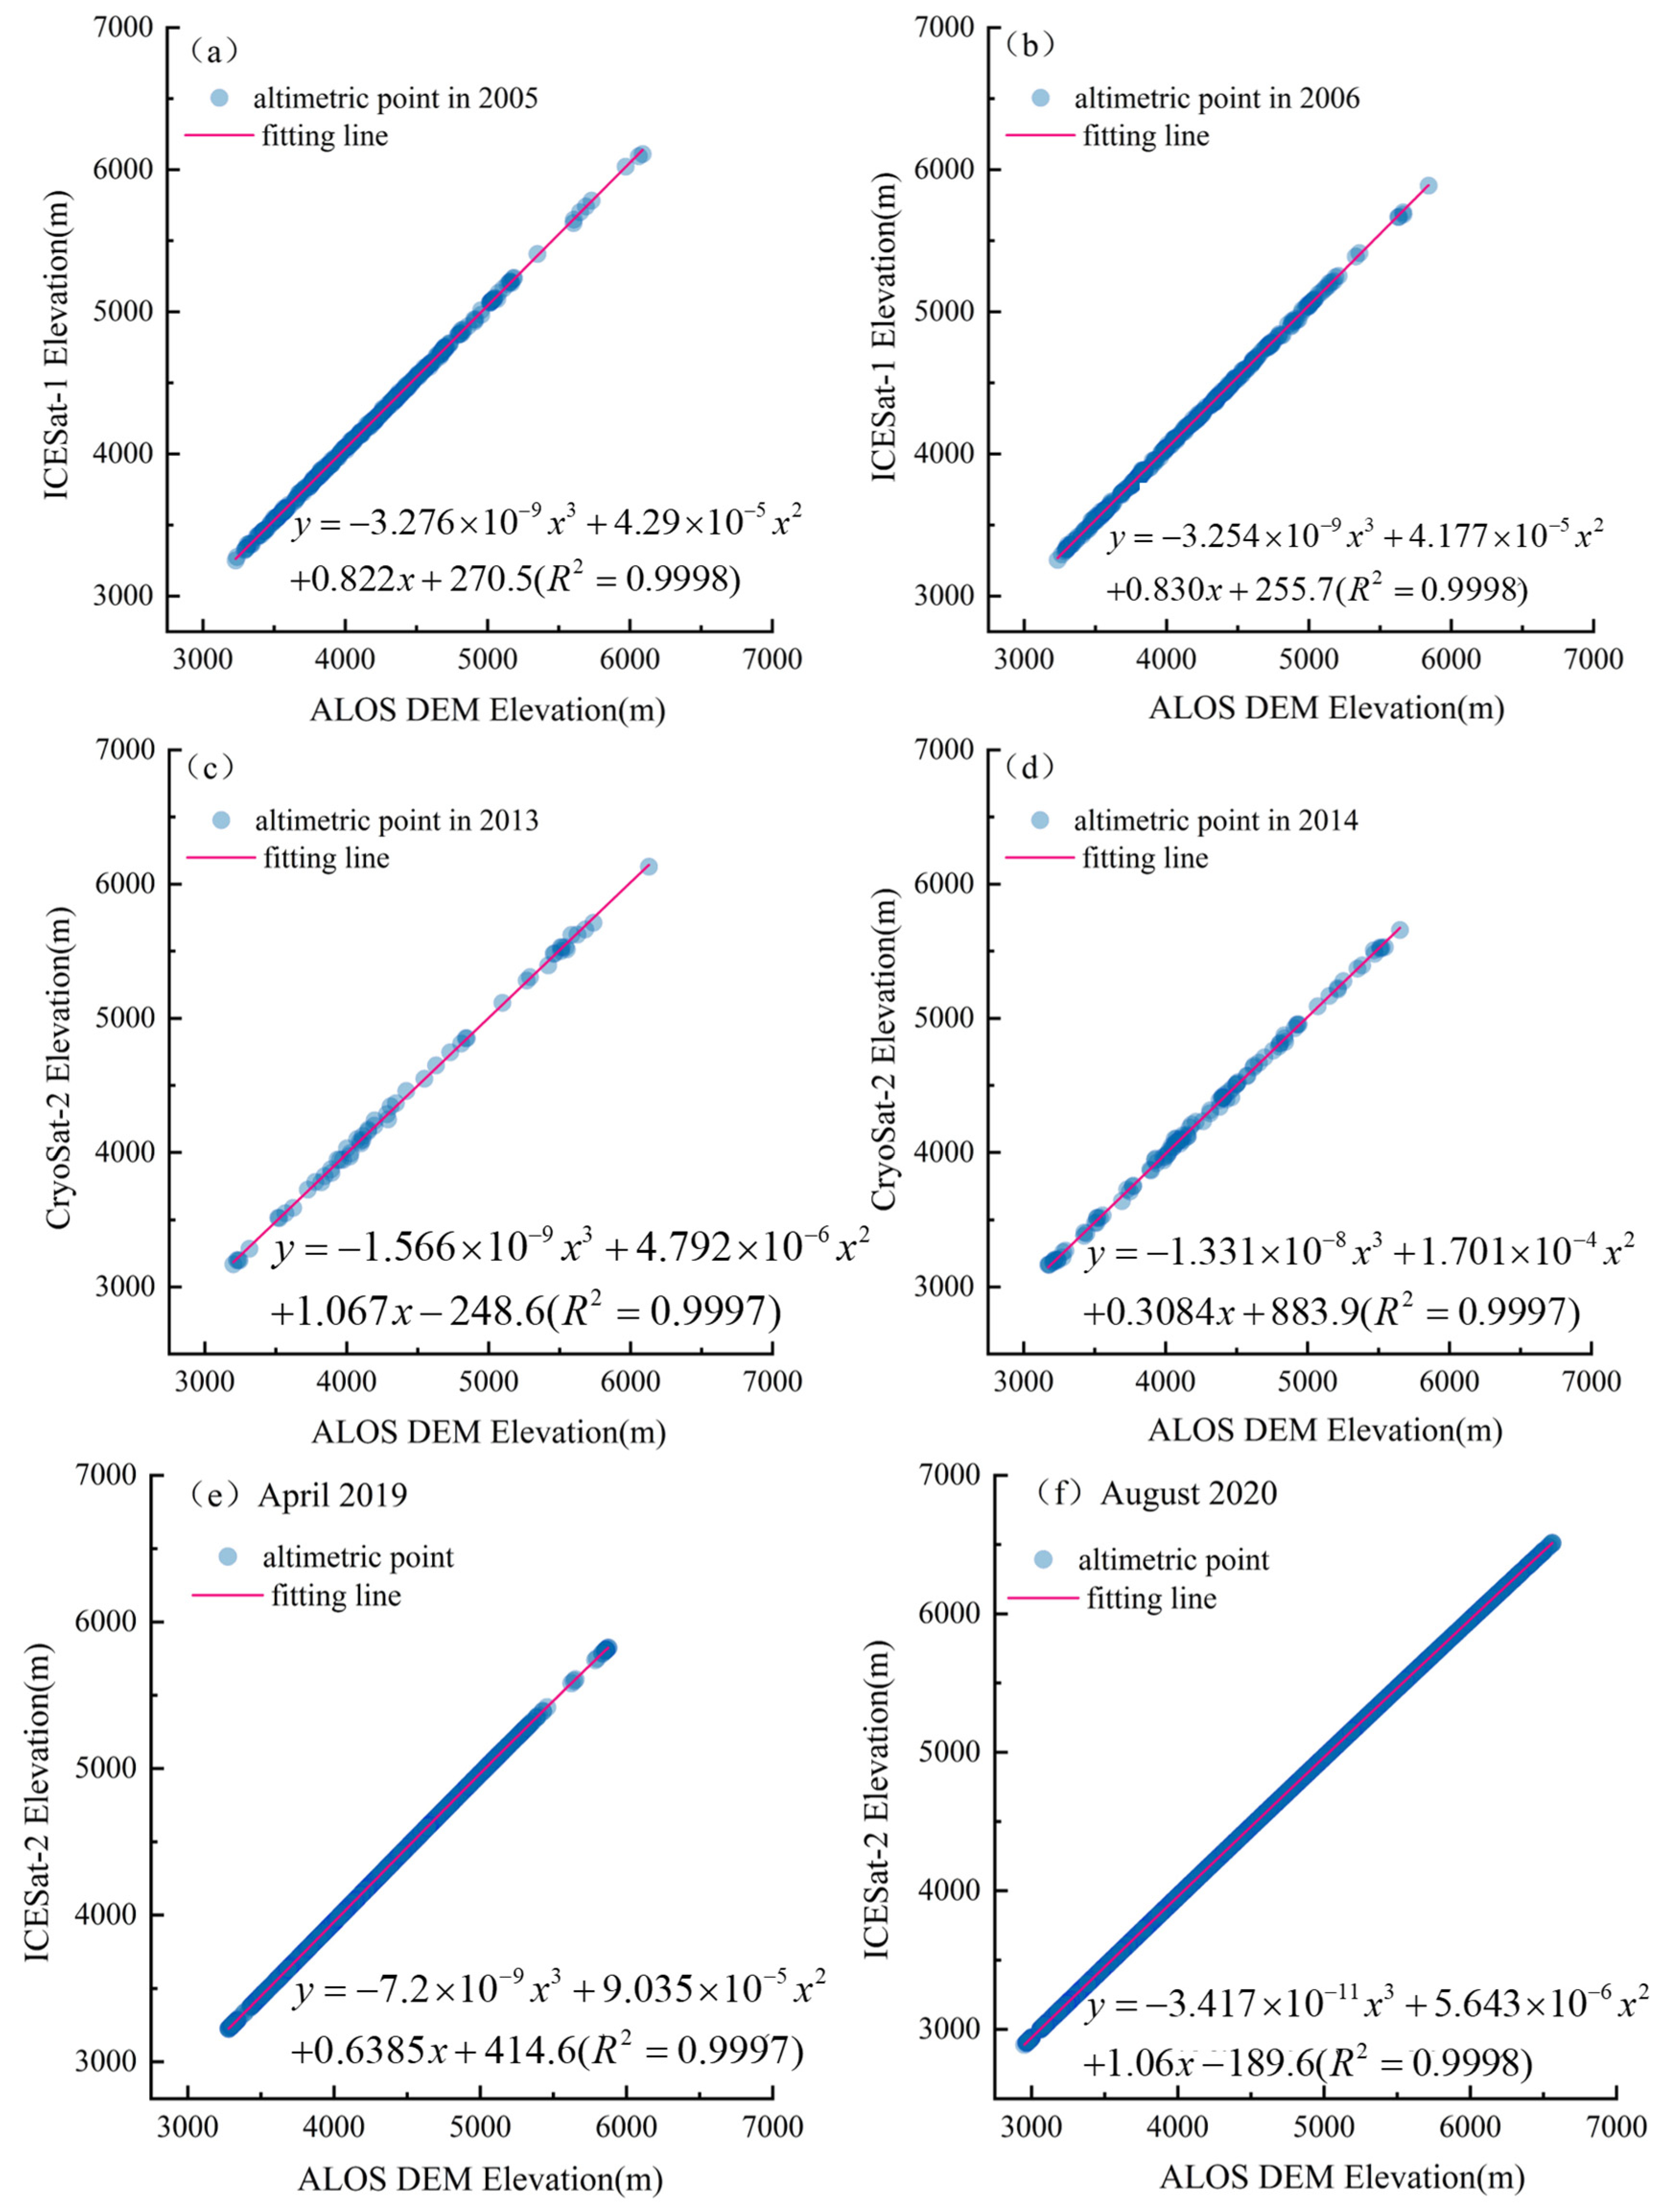
2.3.2. Construction of the Polynomial Fitting Function Model
2.3.3. Accuracy Assessment for the Polynomial Fitting Function Model
2.4. Glacier Mass Balance Estimation
3. Results
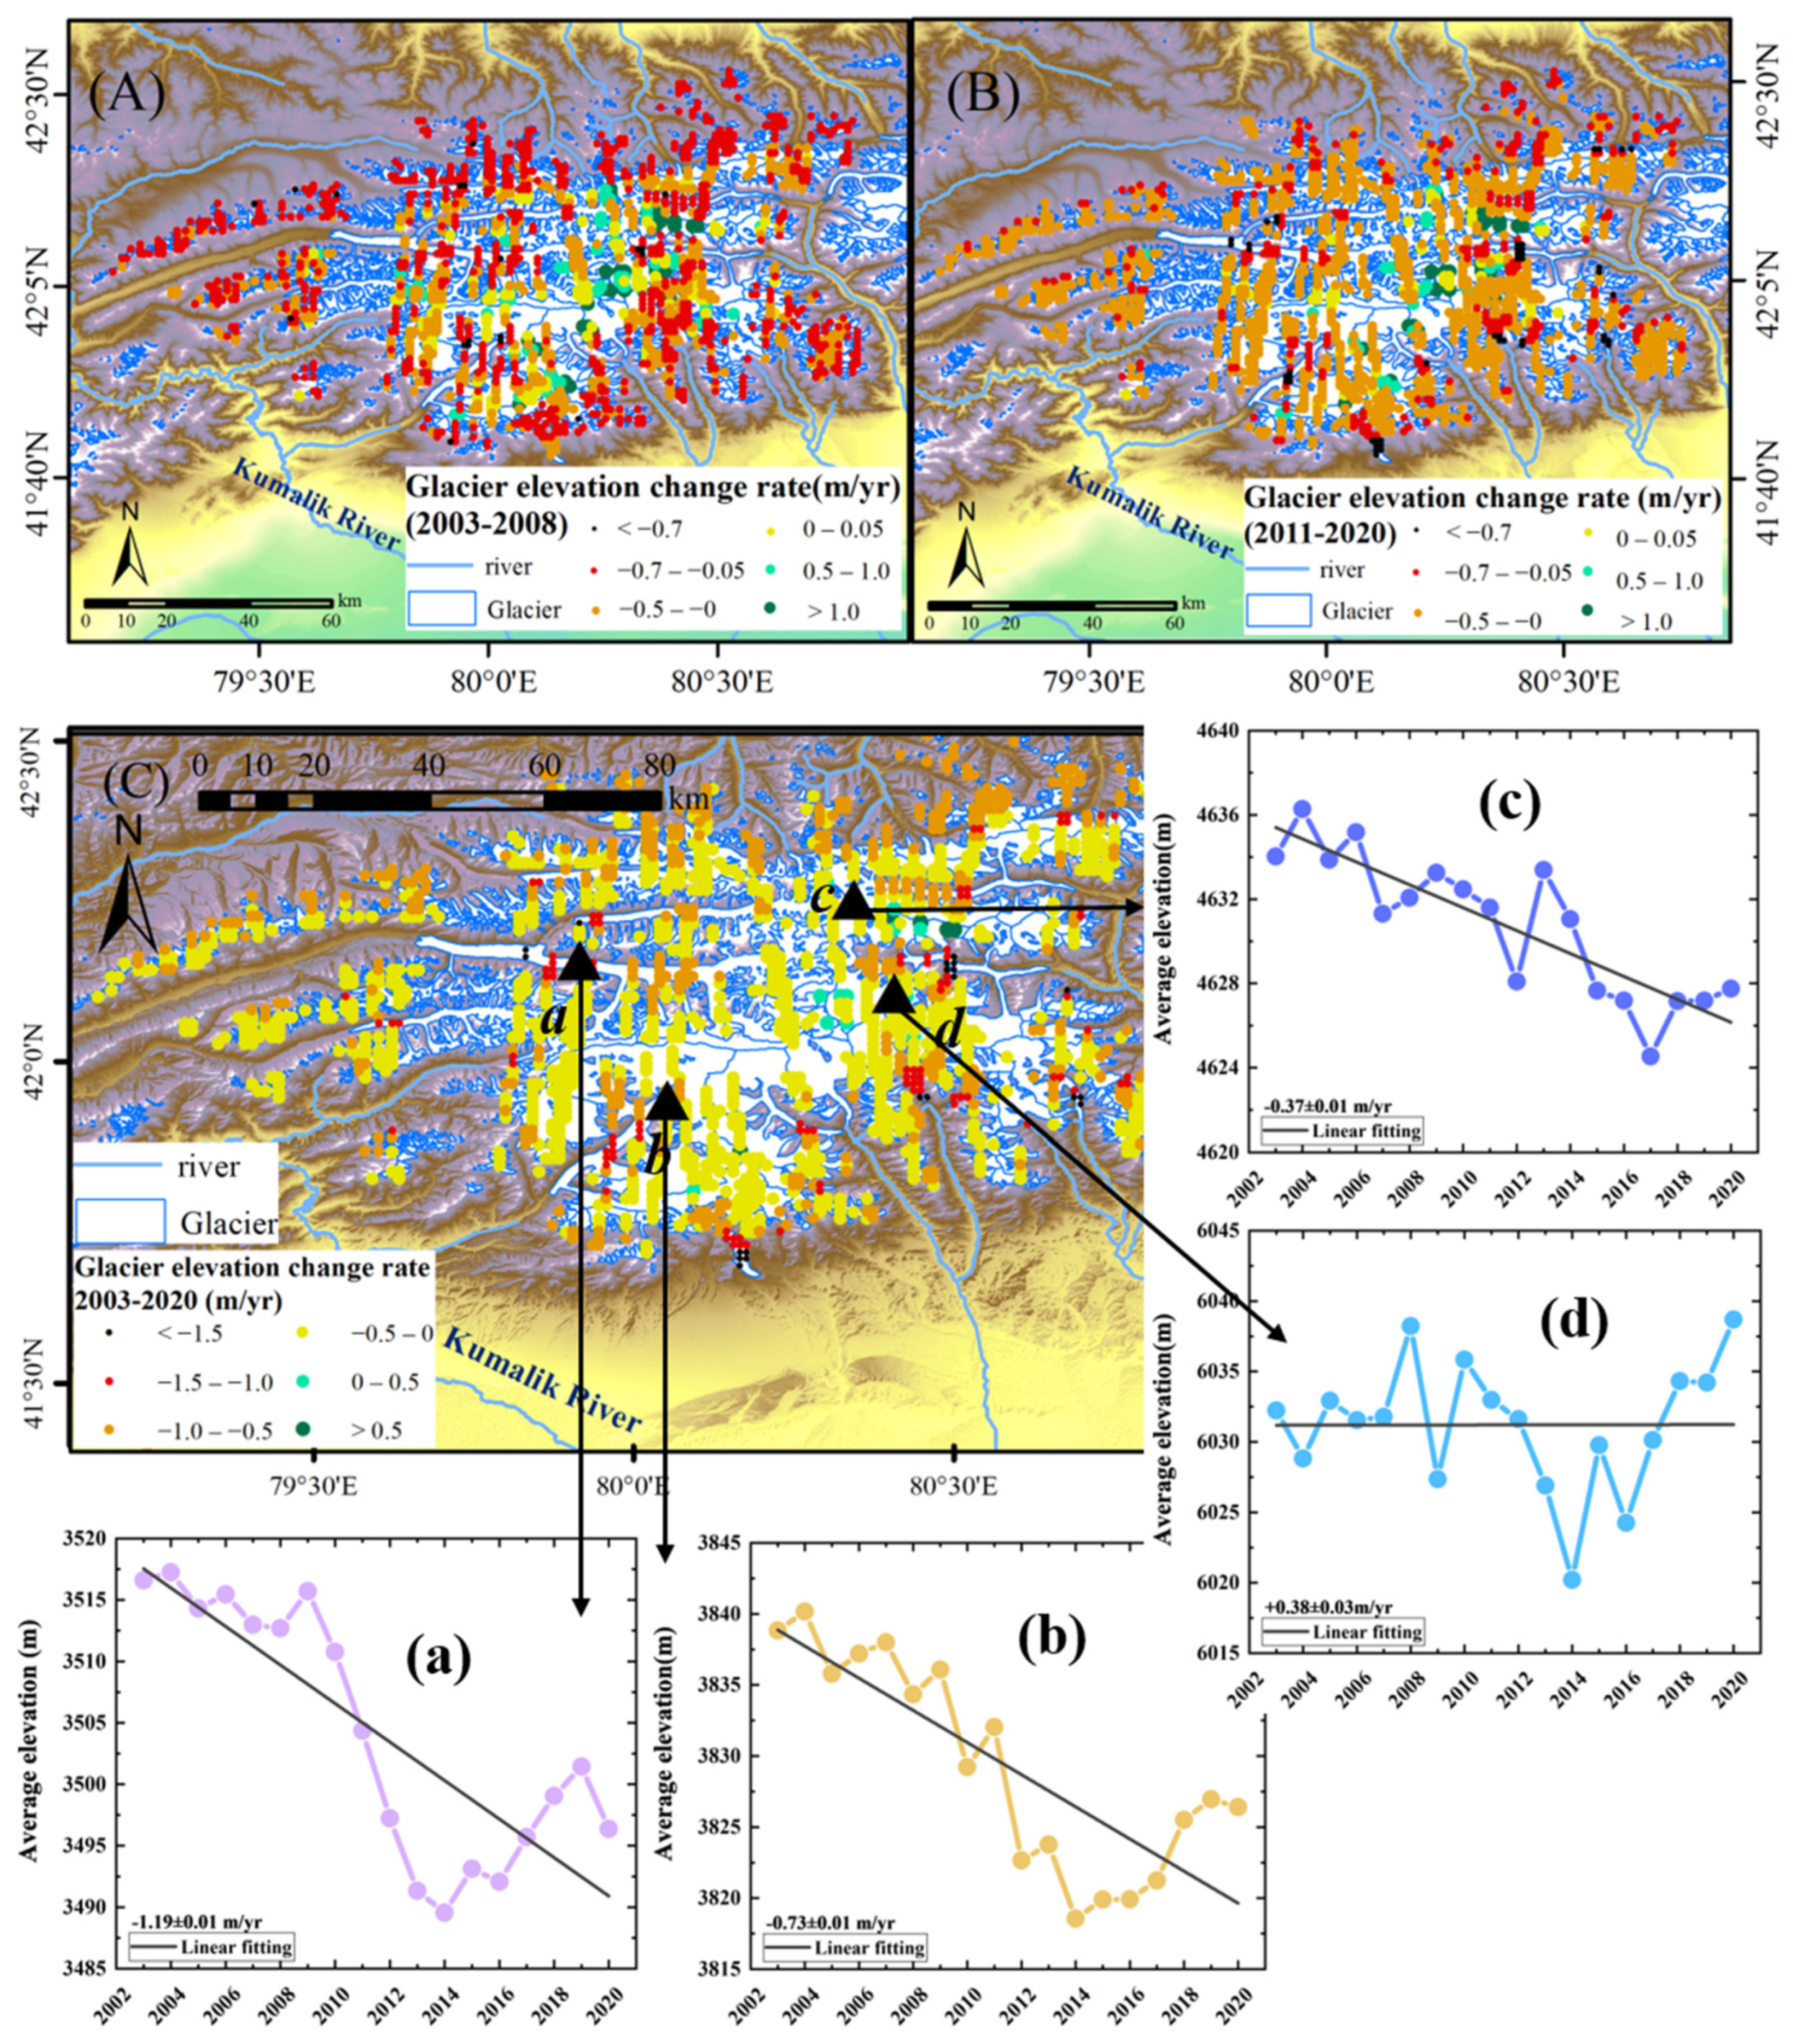
3.1. Surface Elevation Variations in the Tomur Peak Region
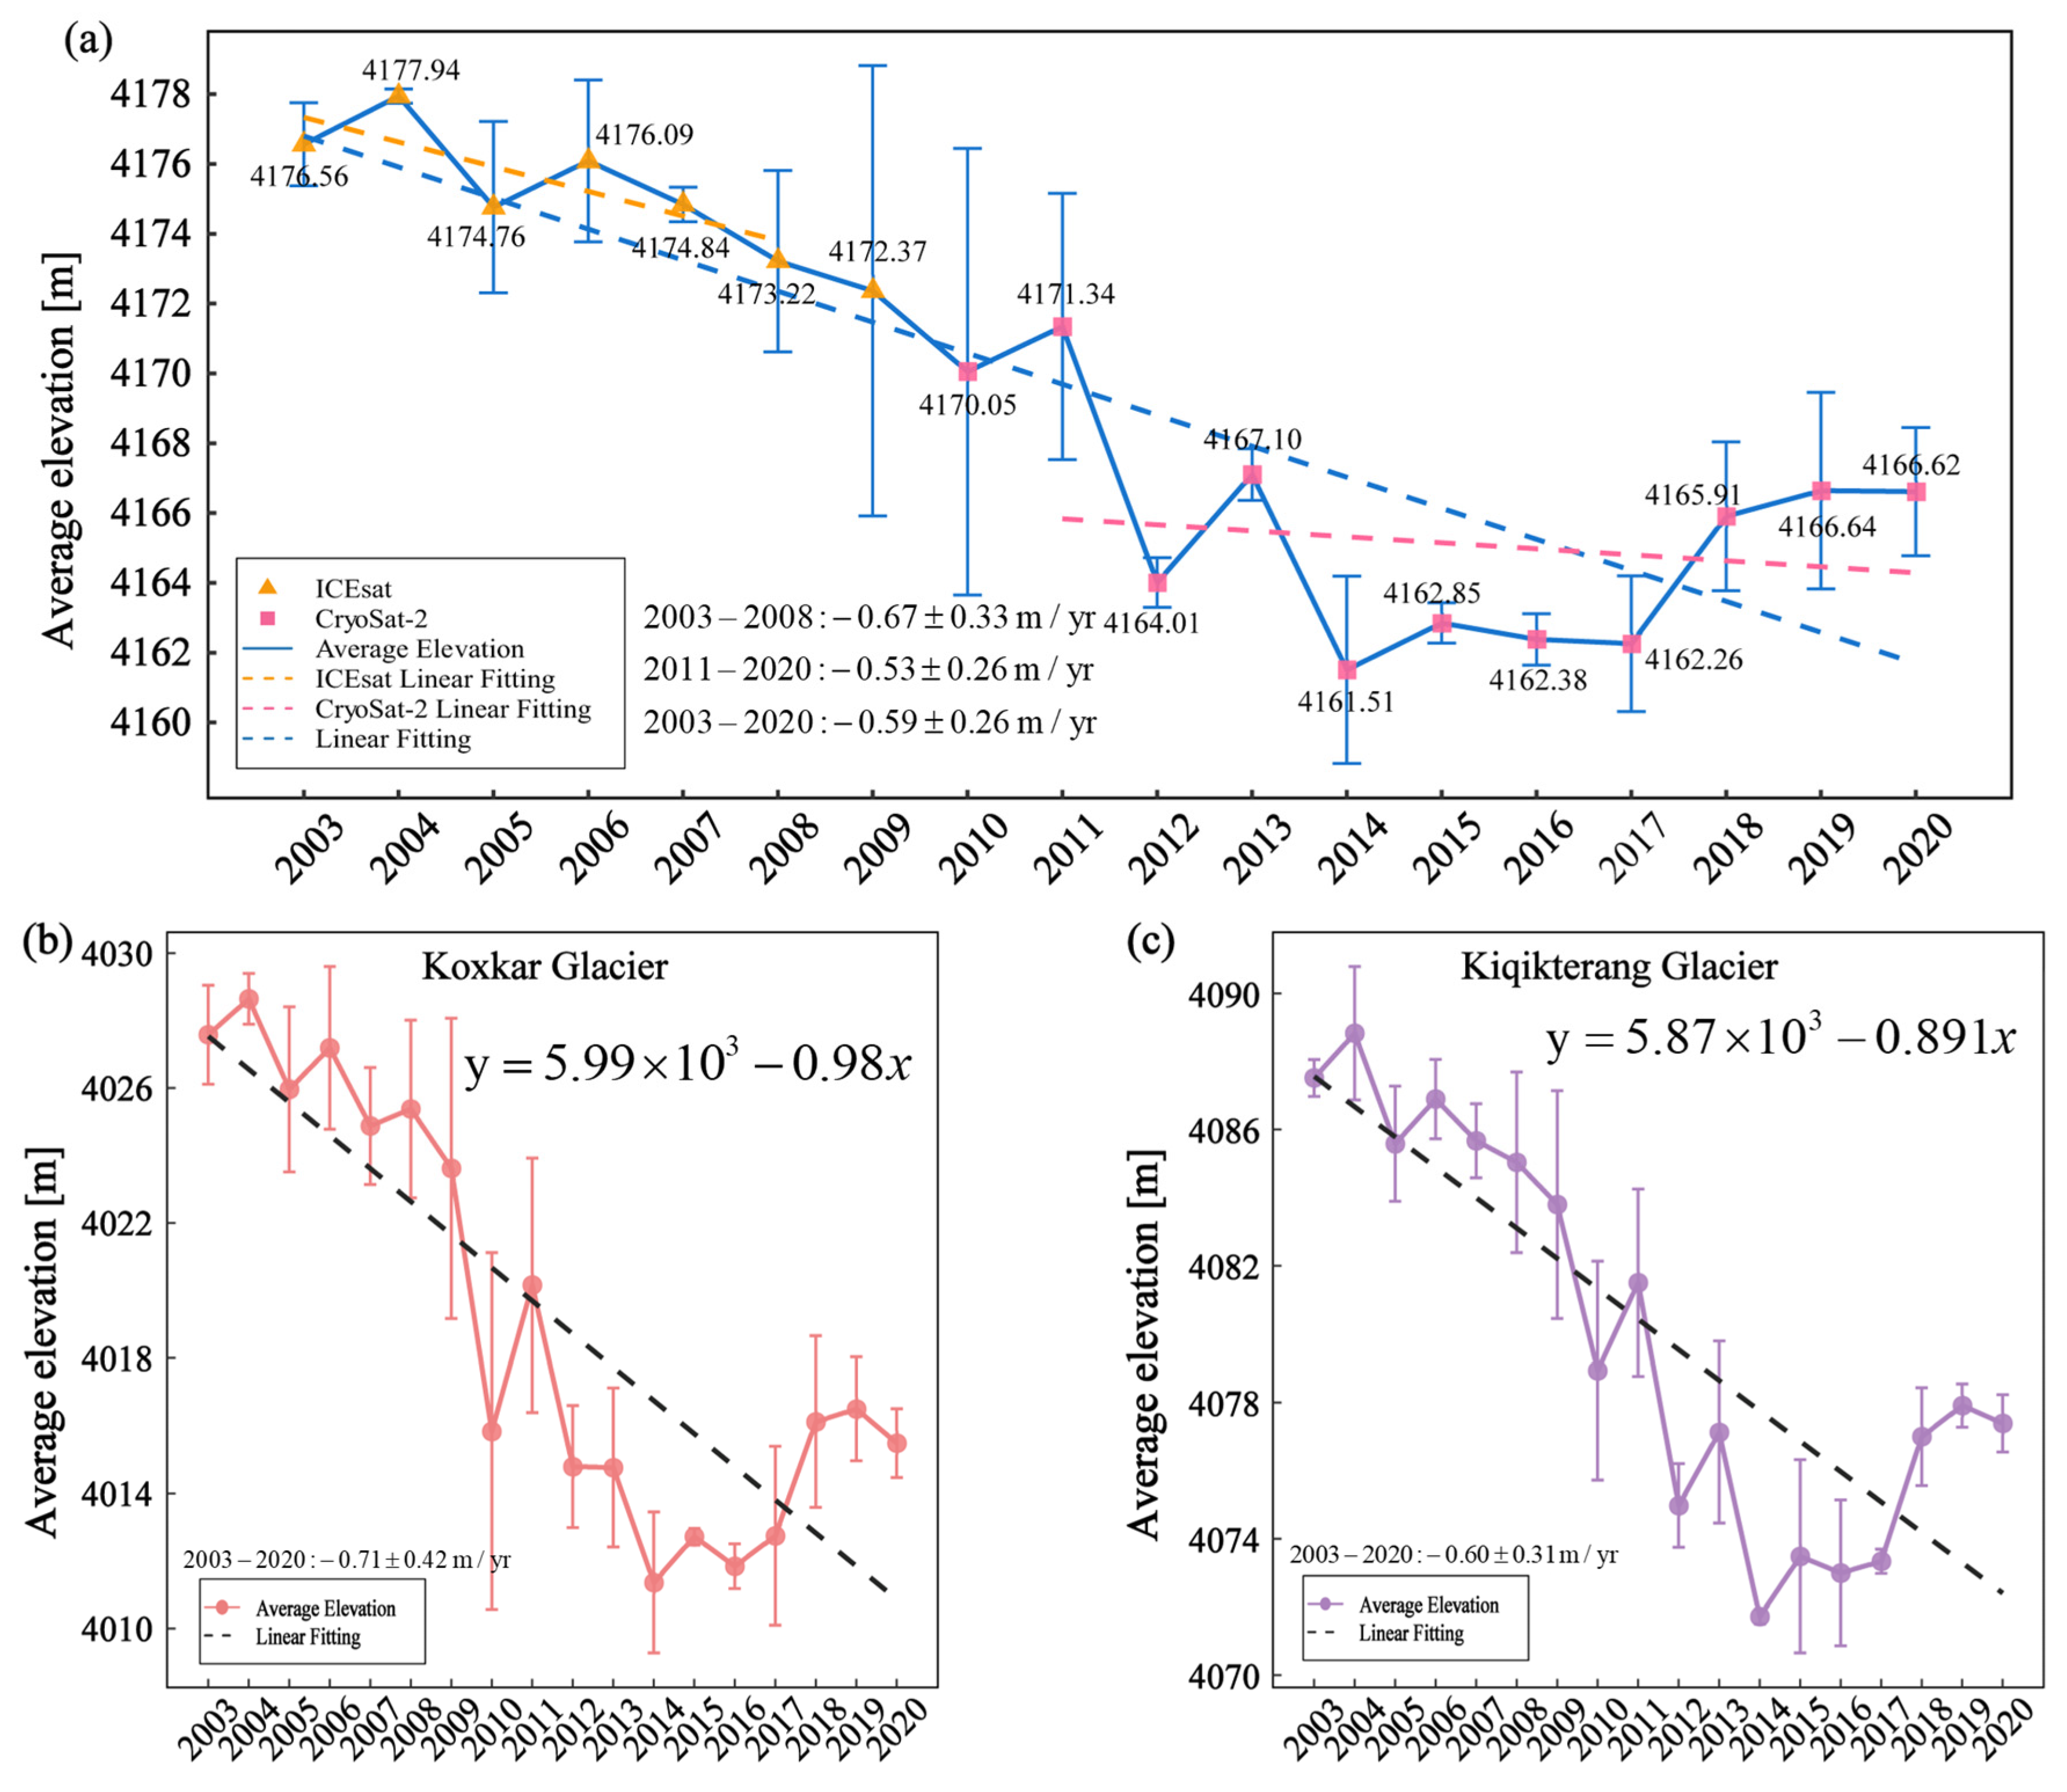
3.1.1. Interannual Variations in Glacier Surface Elevation in the Tomur Peak Region
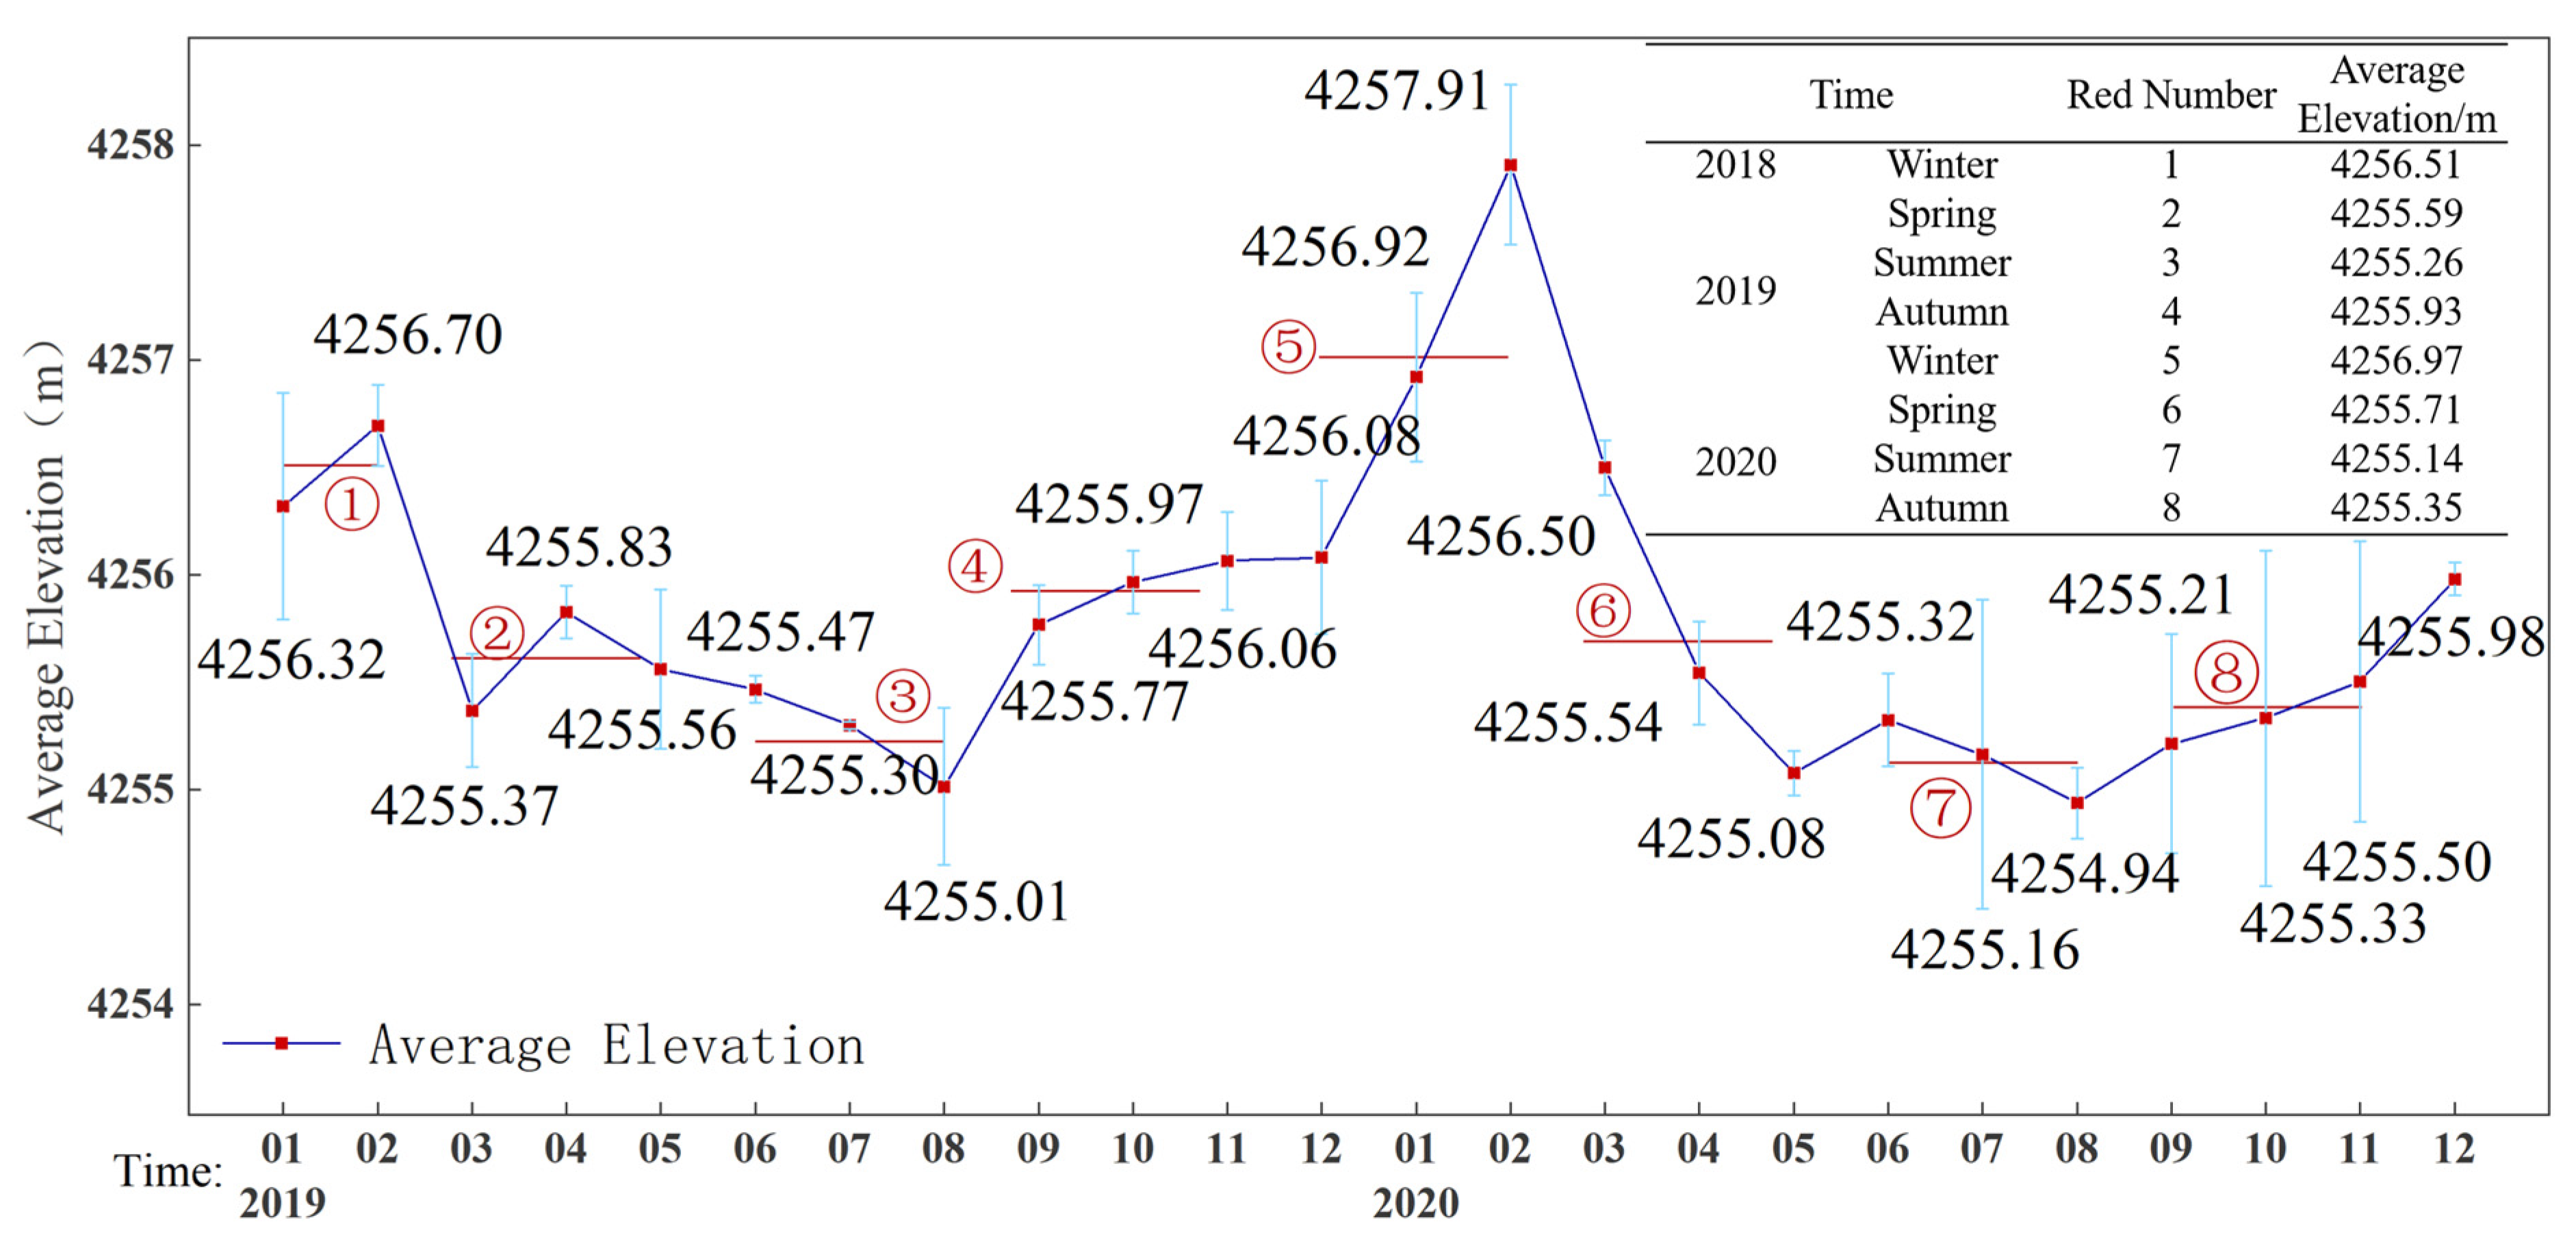
3.1.2. Monthly Variations in Glacier Surface Elevation in the Tomur Peak Region
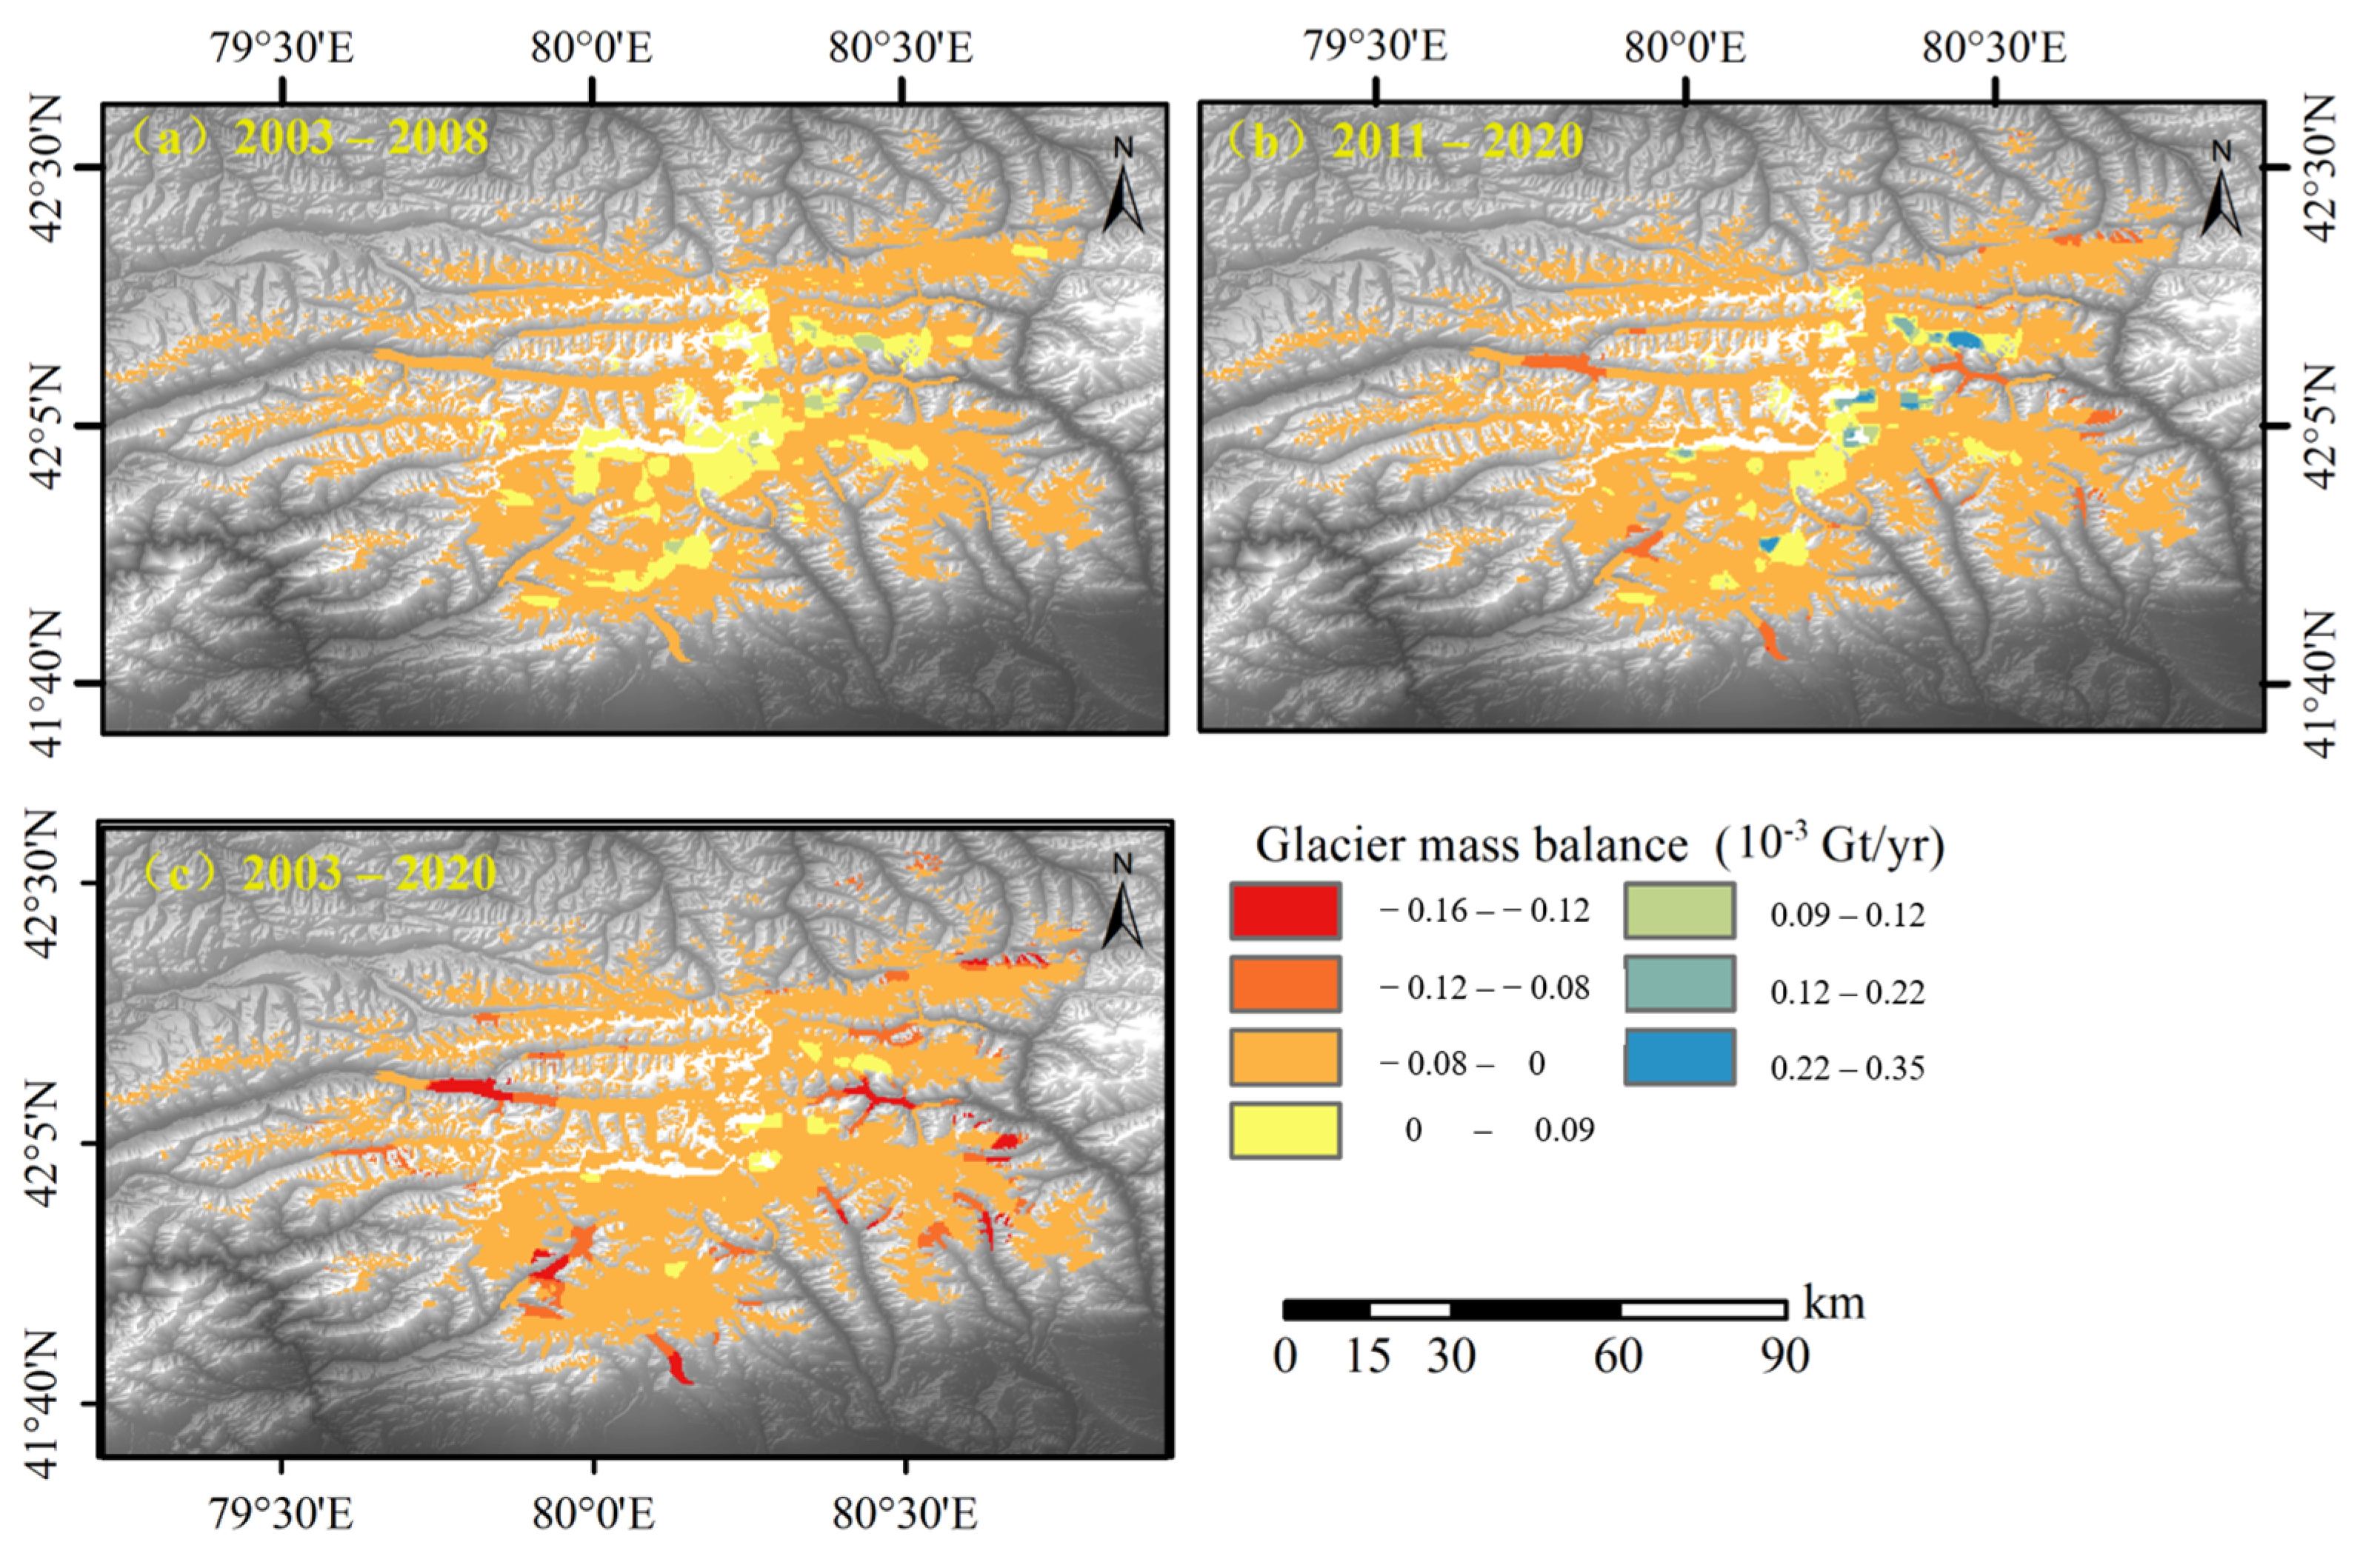
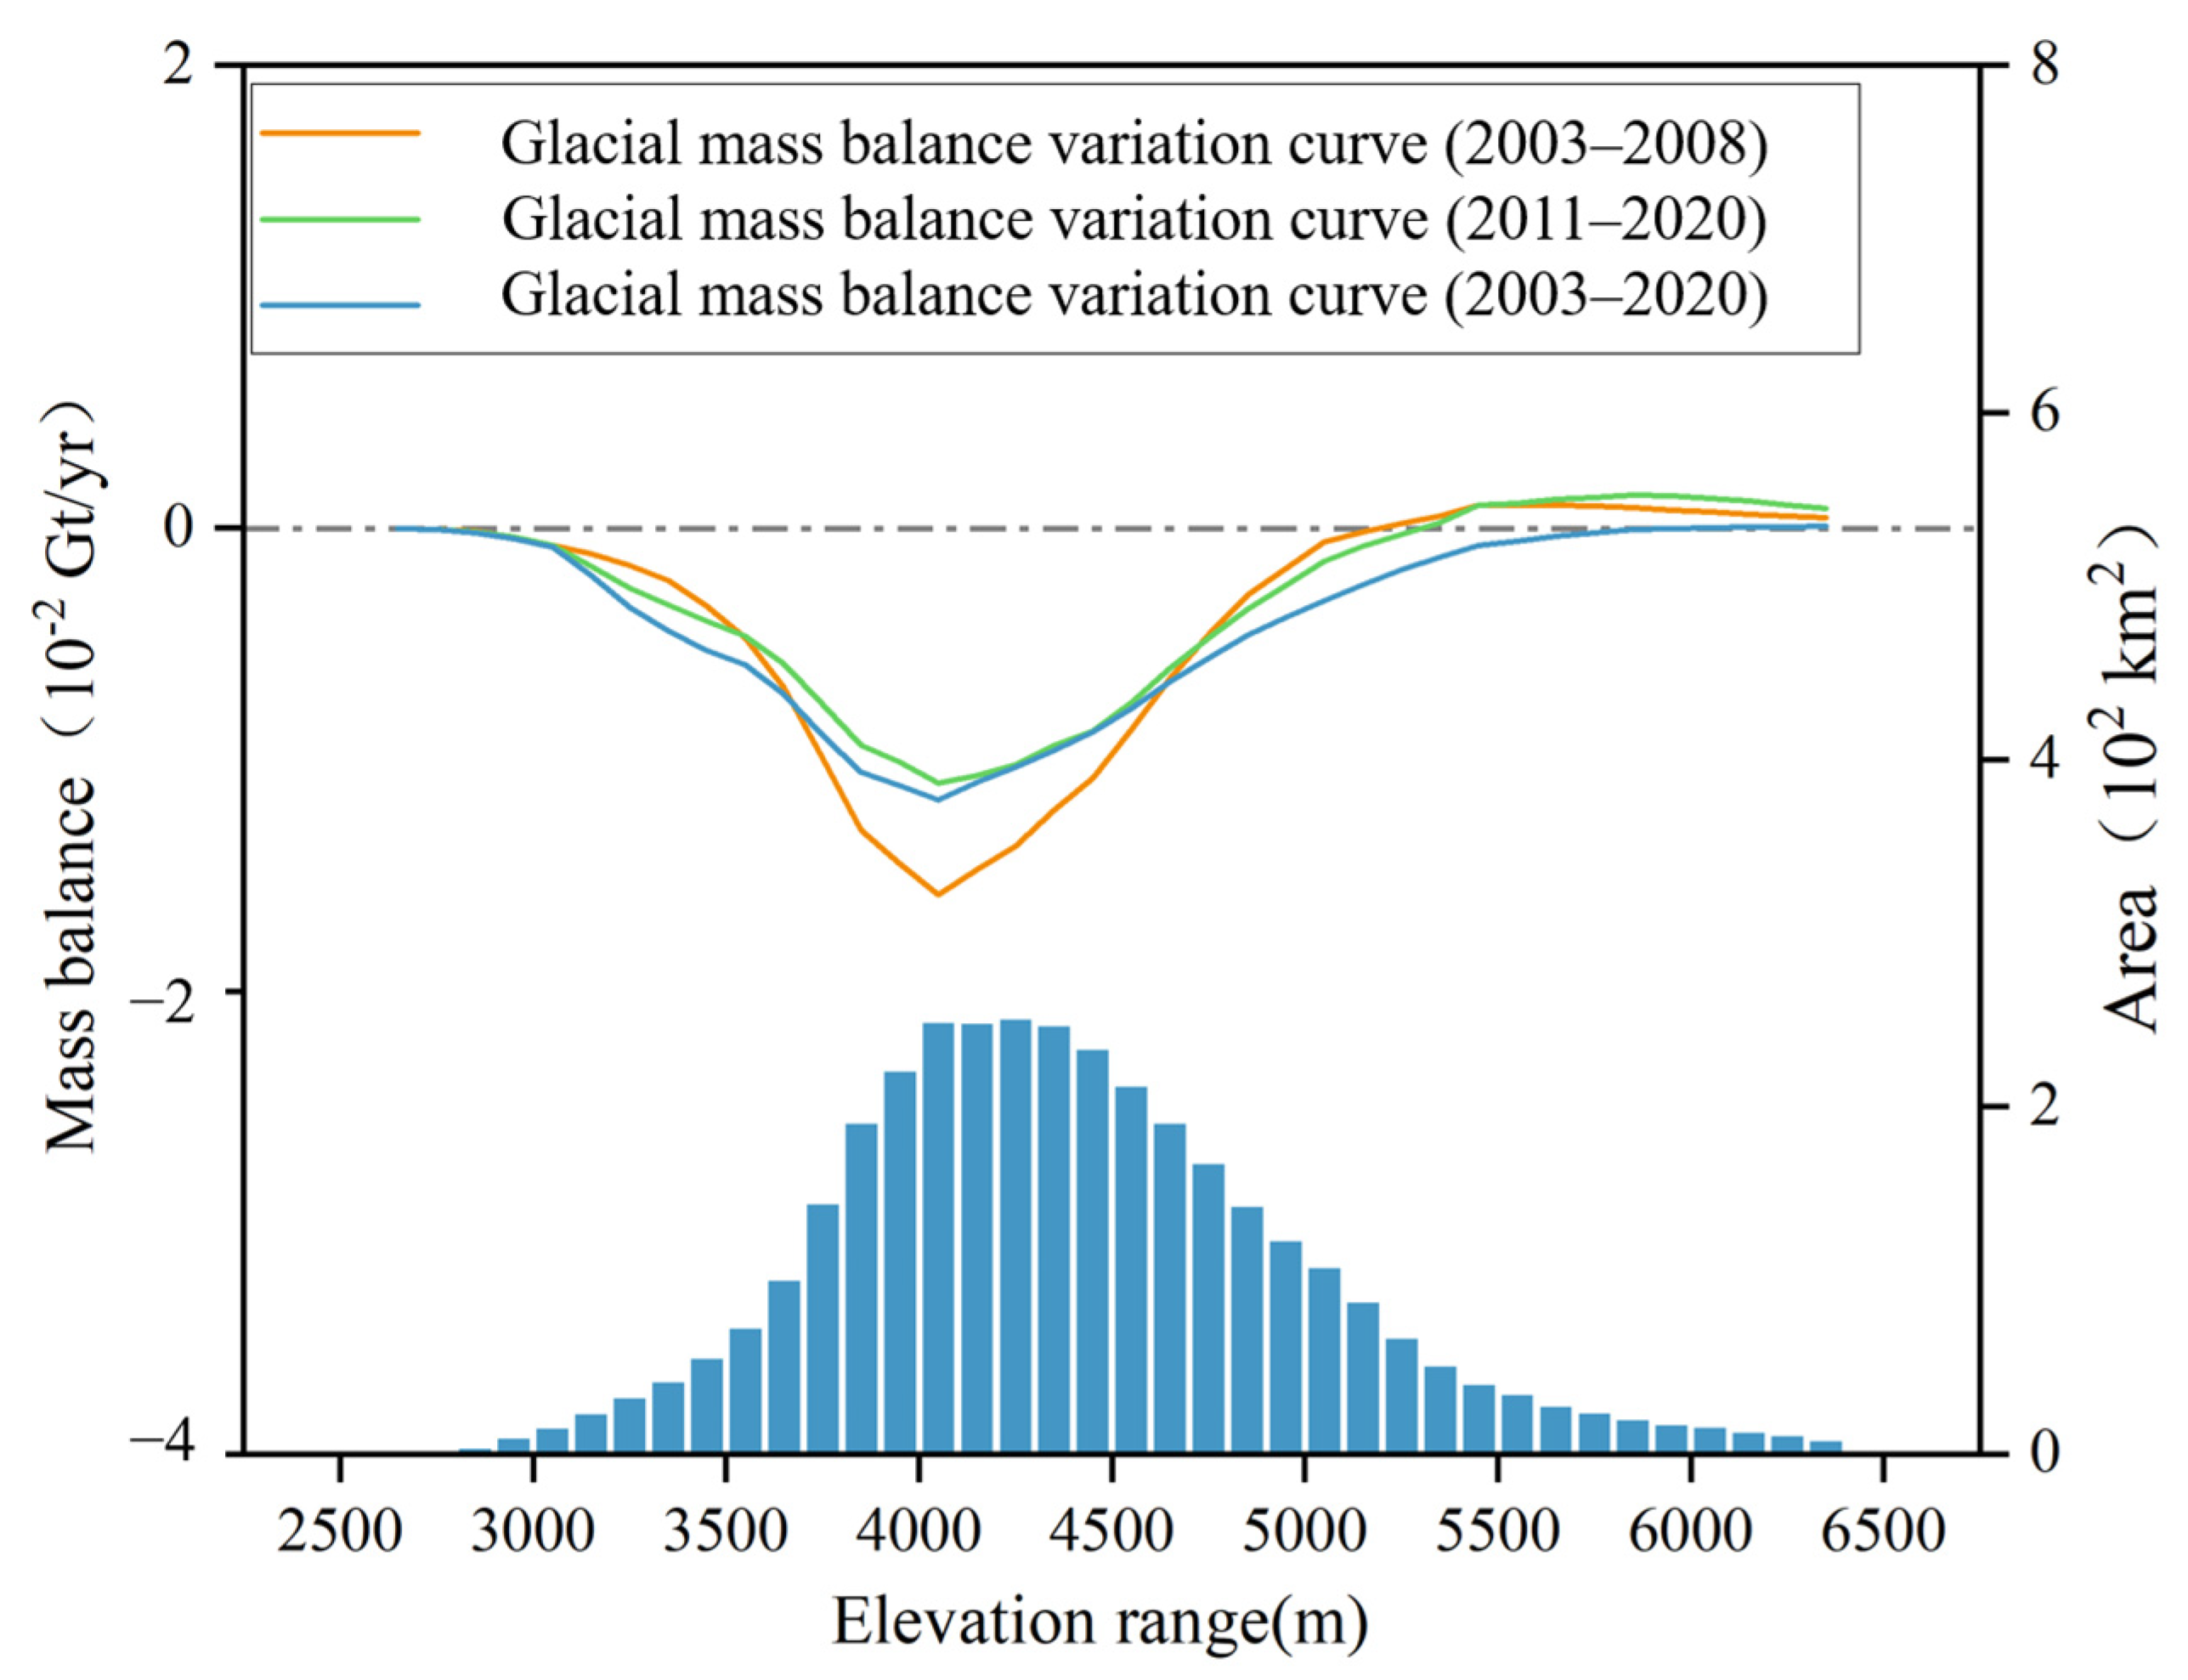
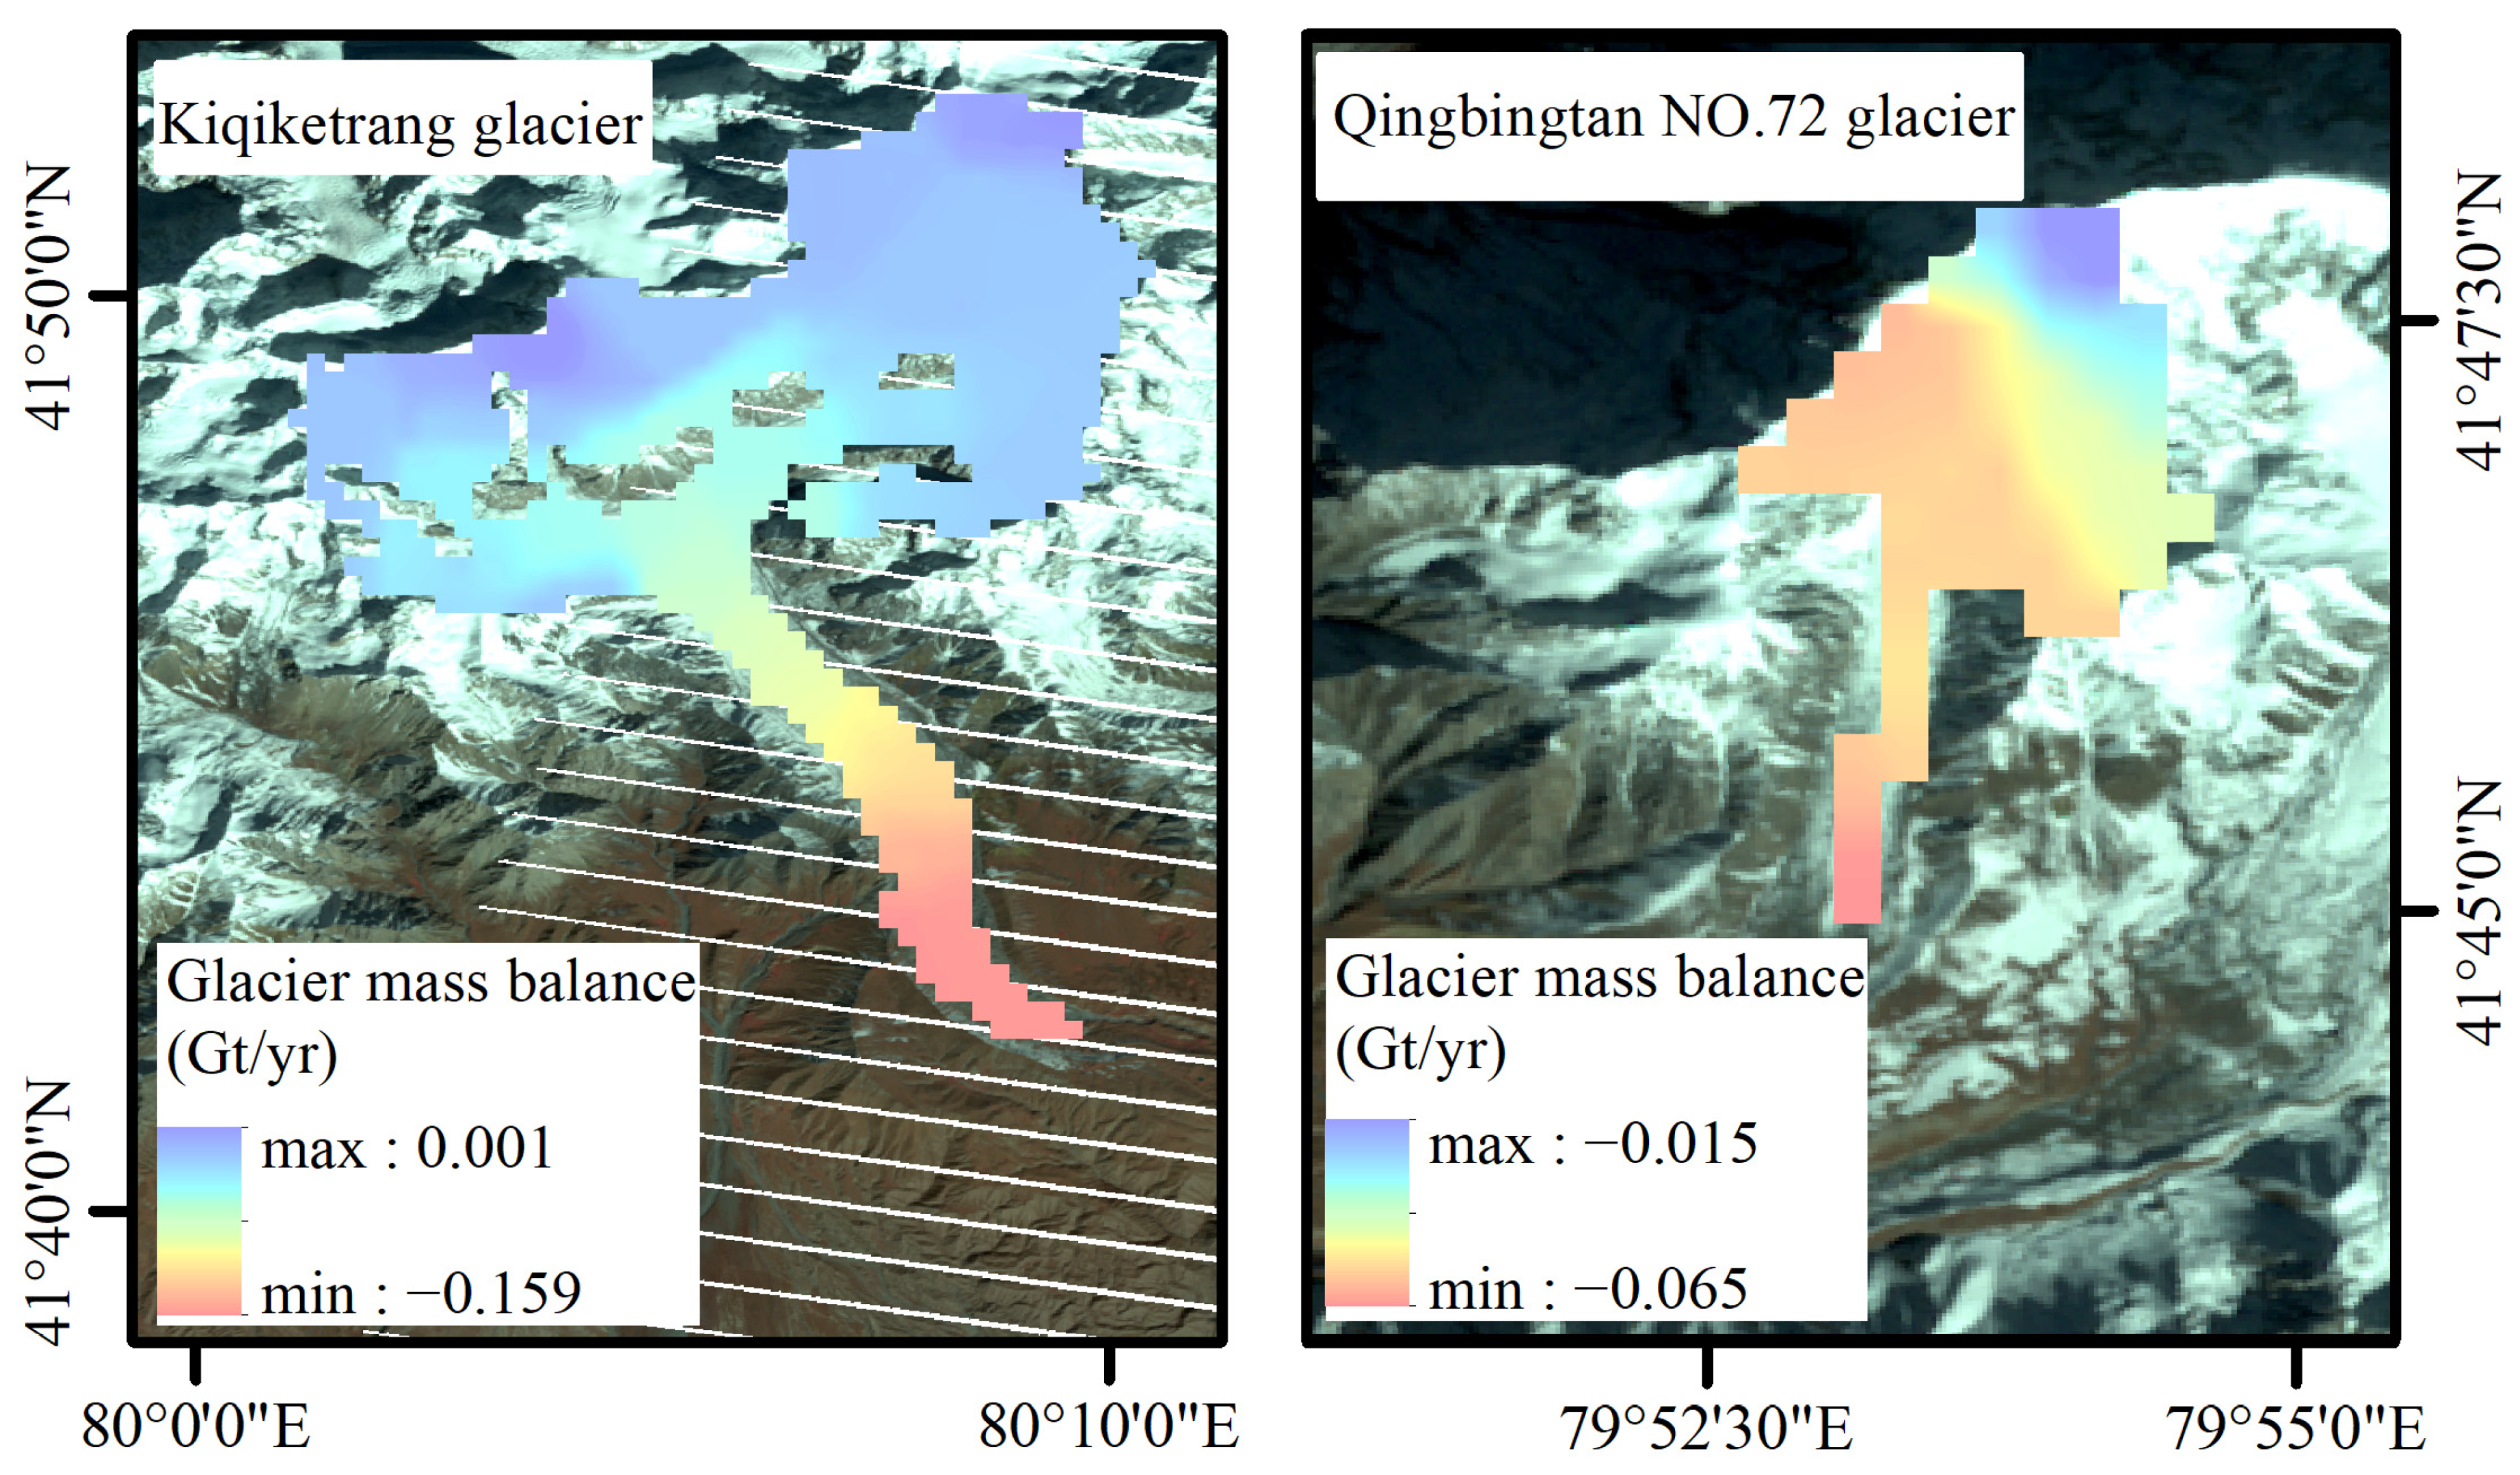
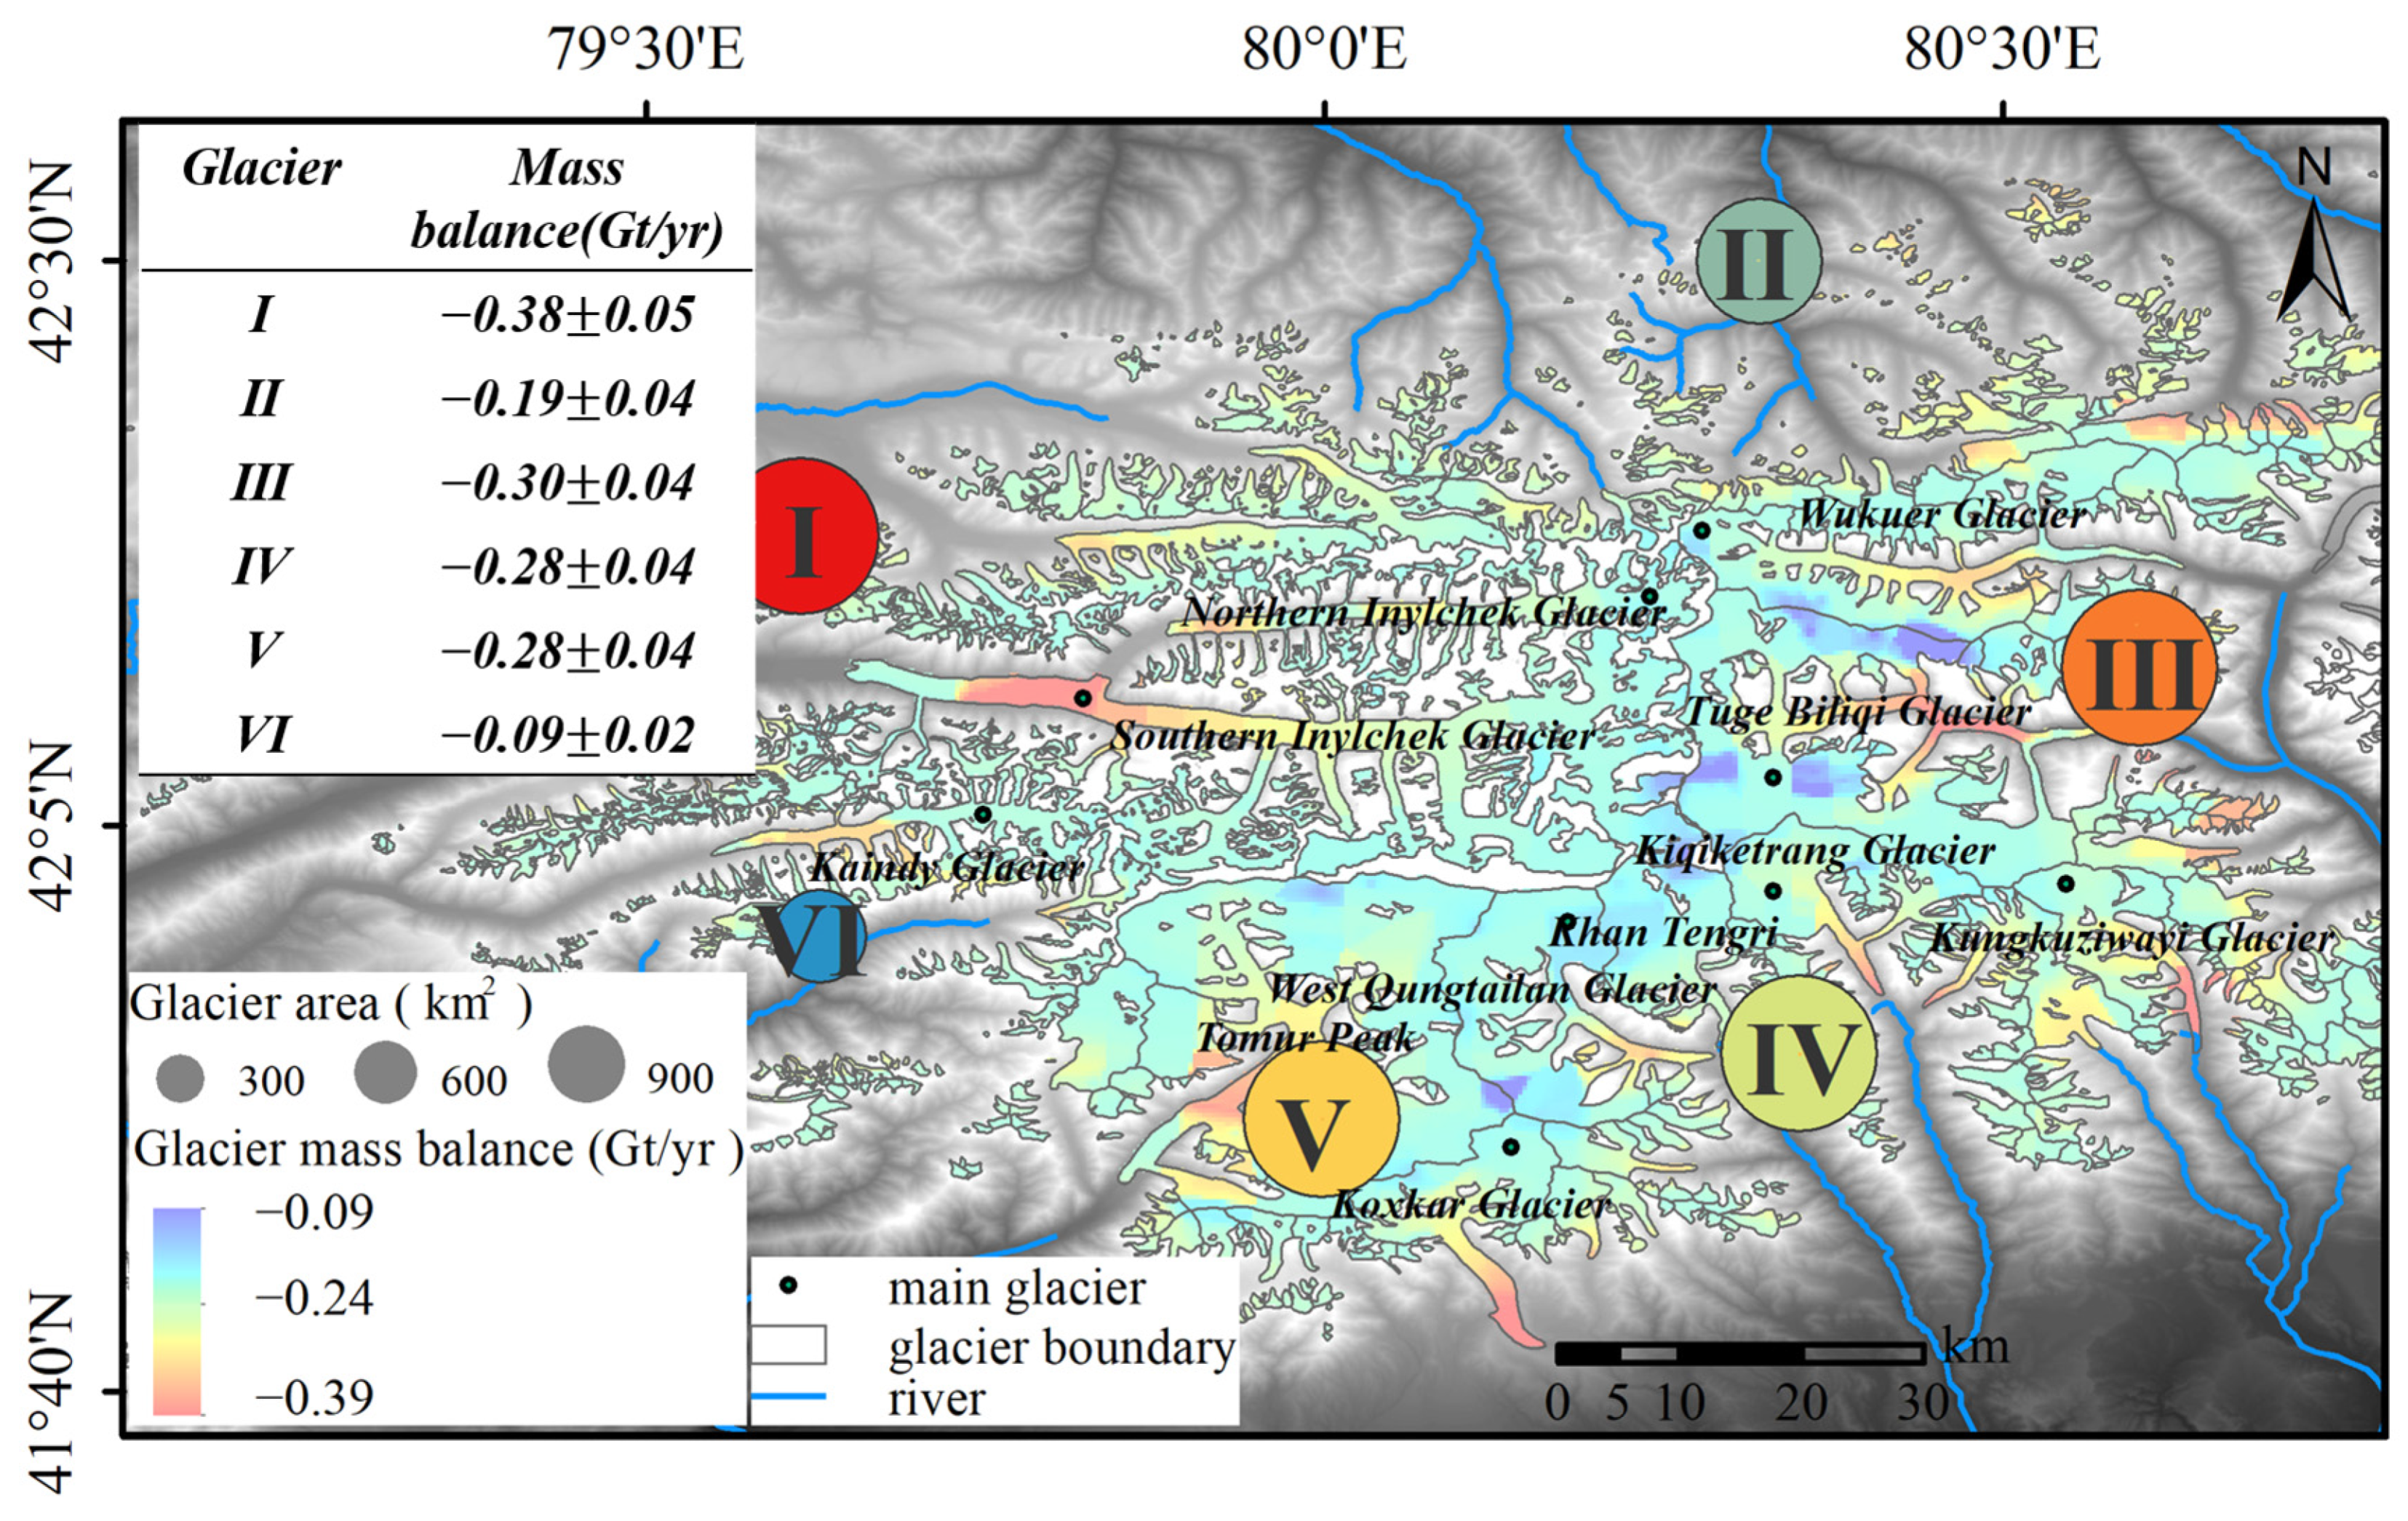
3.2. Spatial Distribution of Glacier Mass Balance in the Tomur Peak Region
4. Discussion
4.1. Analysis of Glacier Variations in the Tomur Peak Region
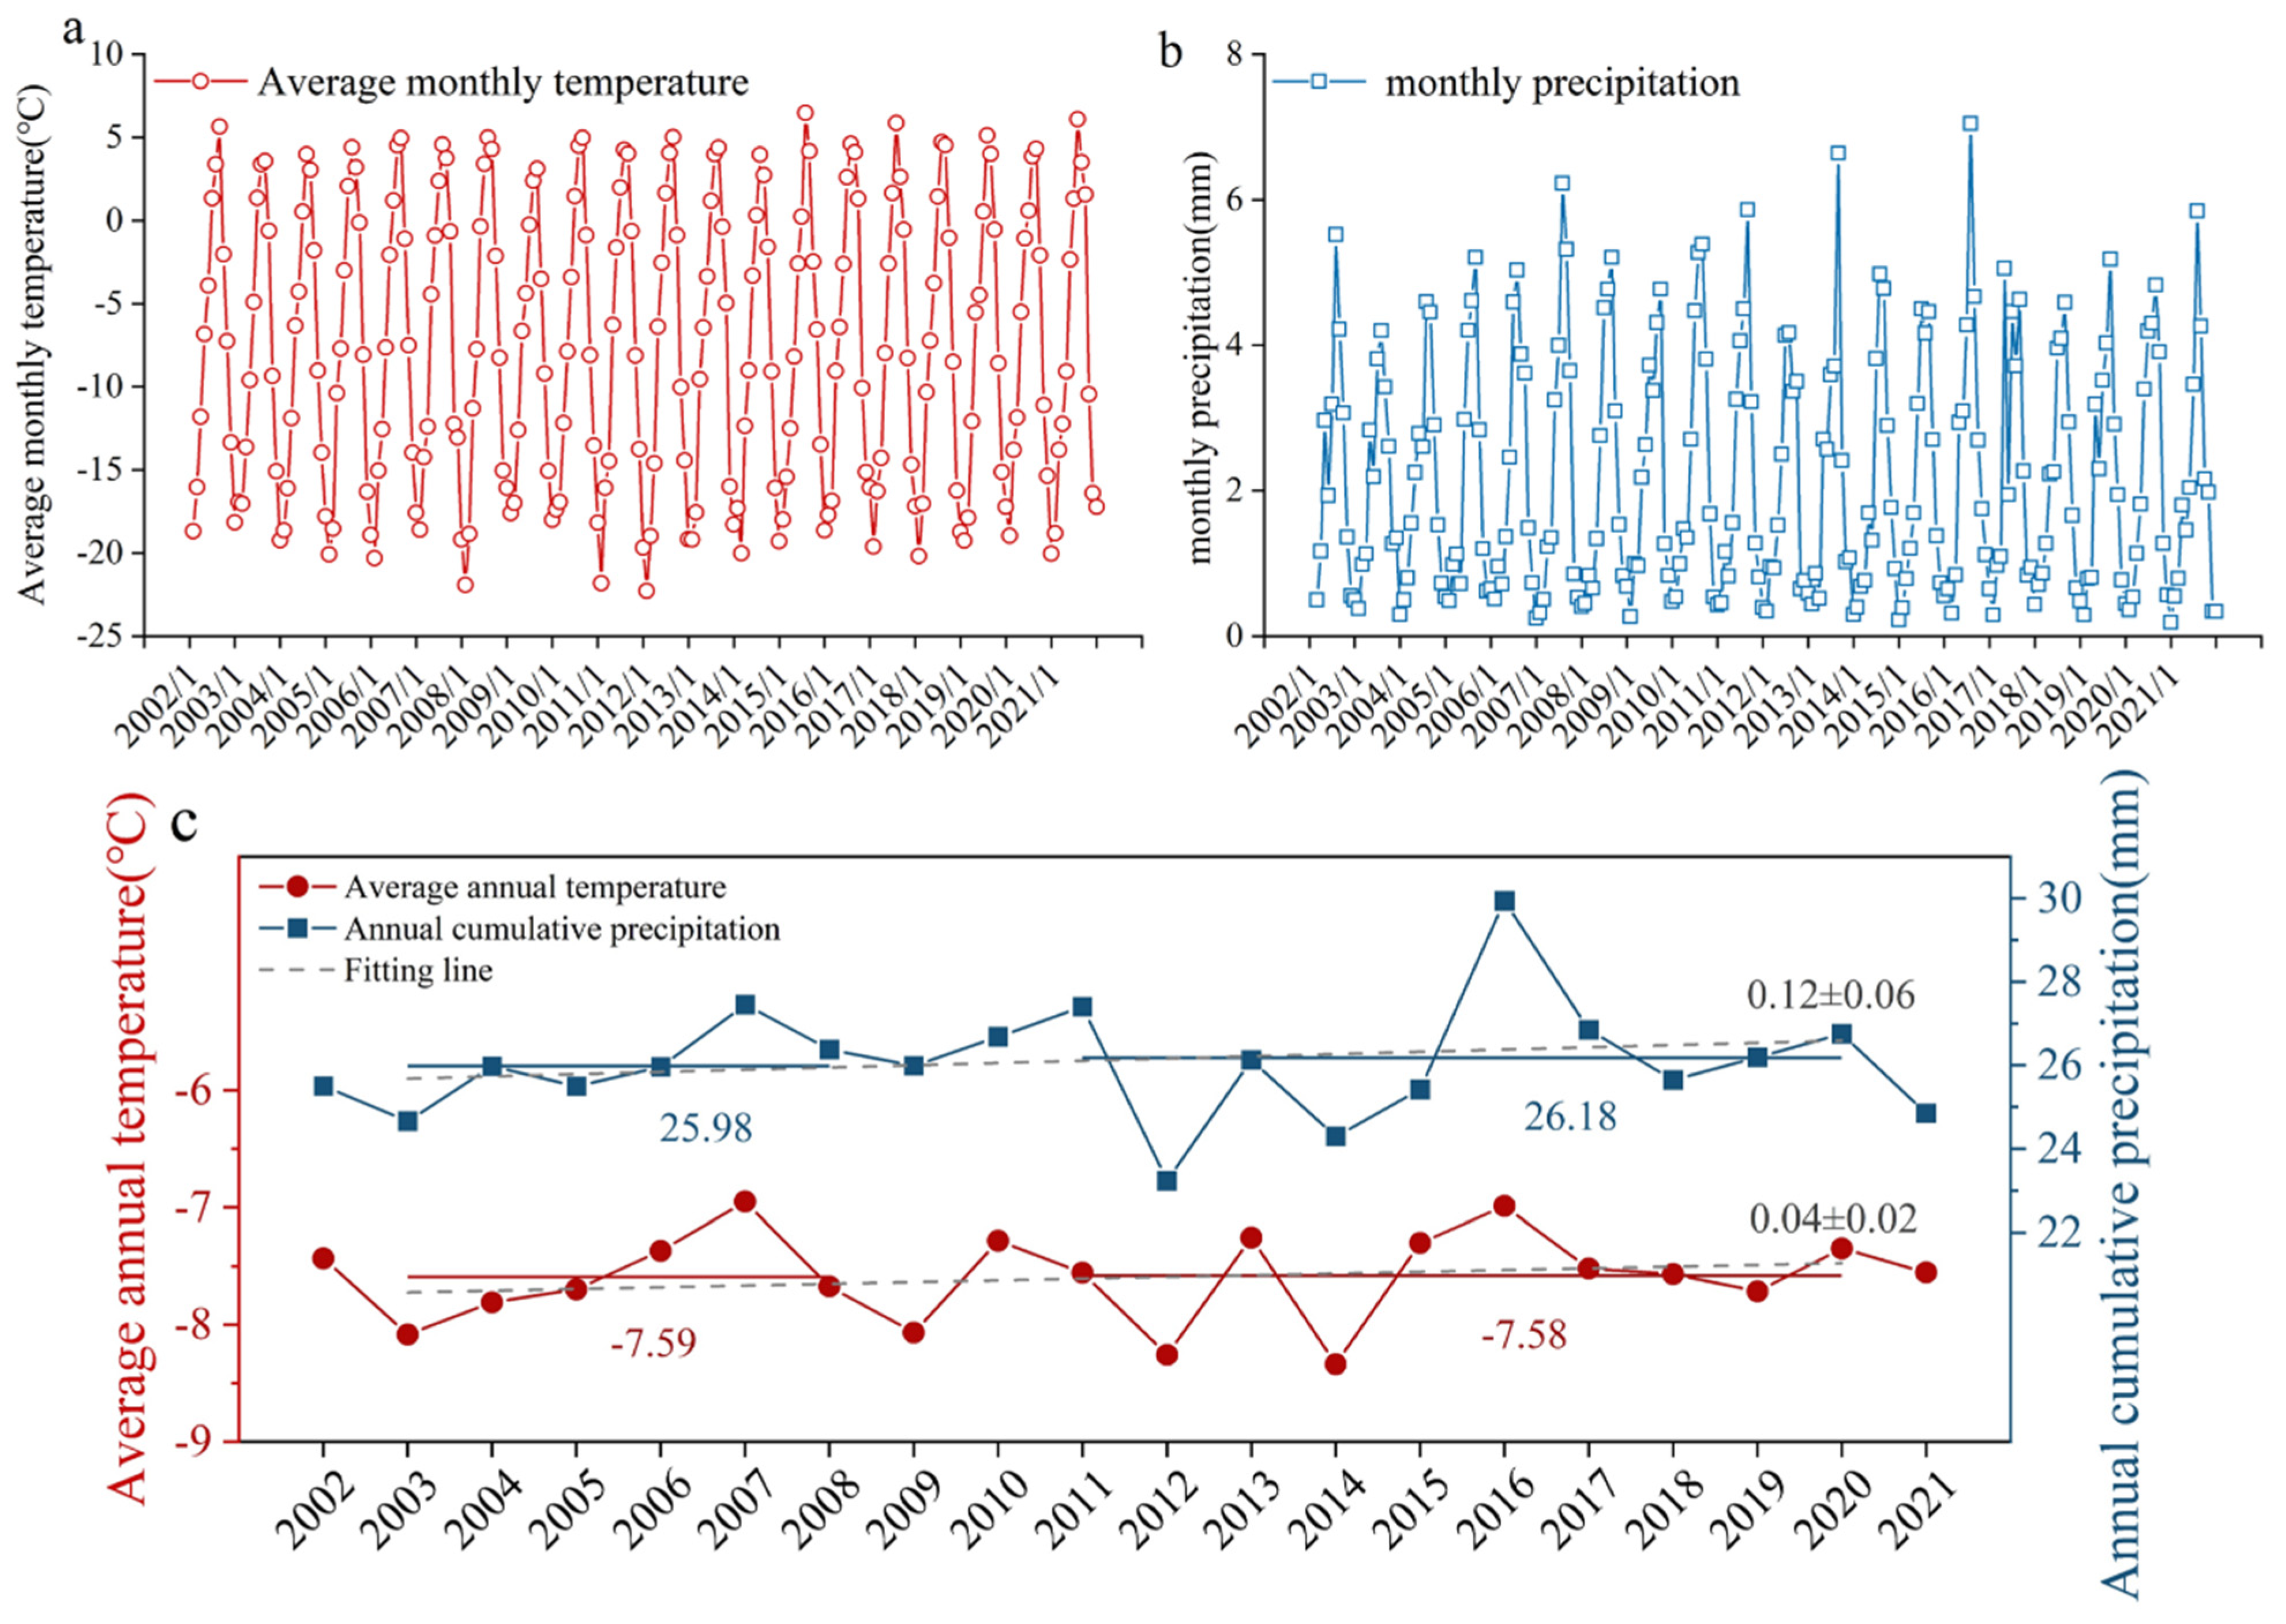
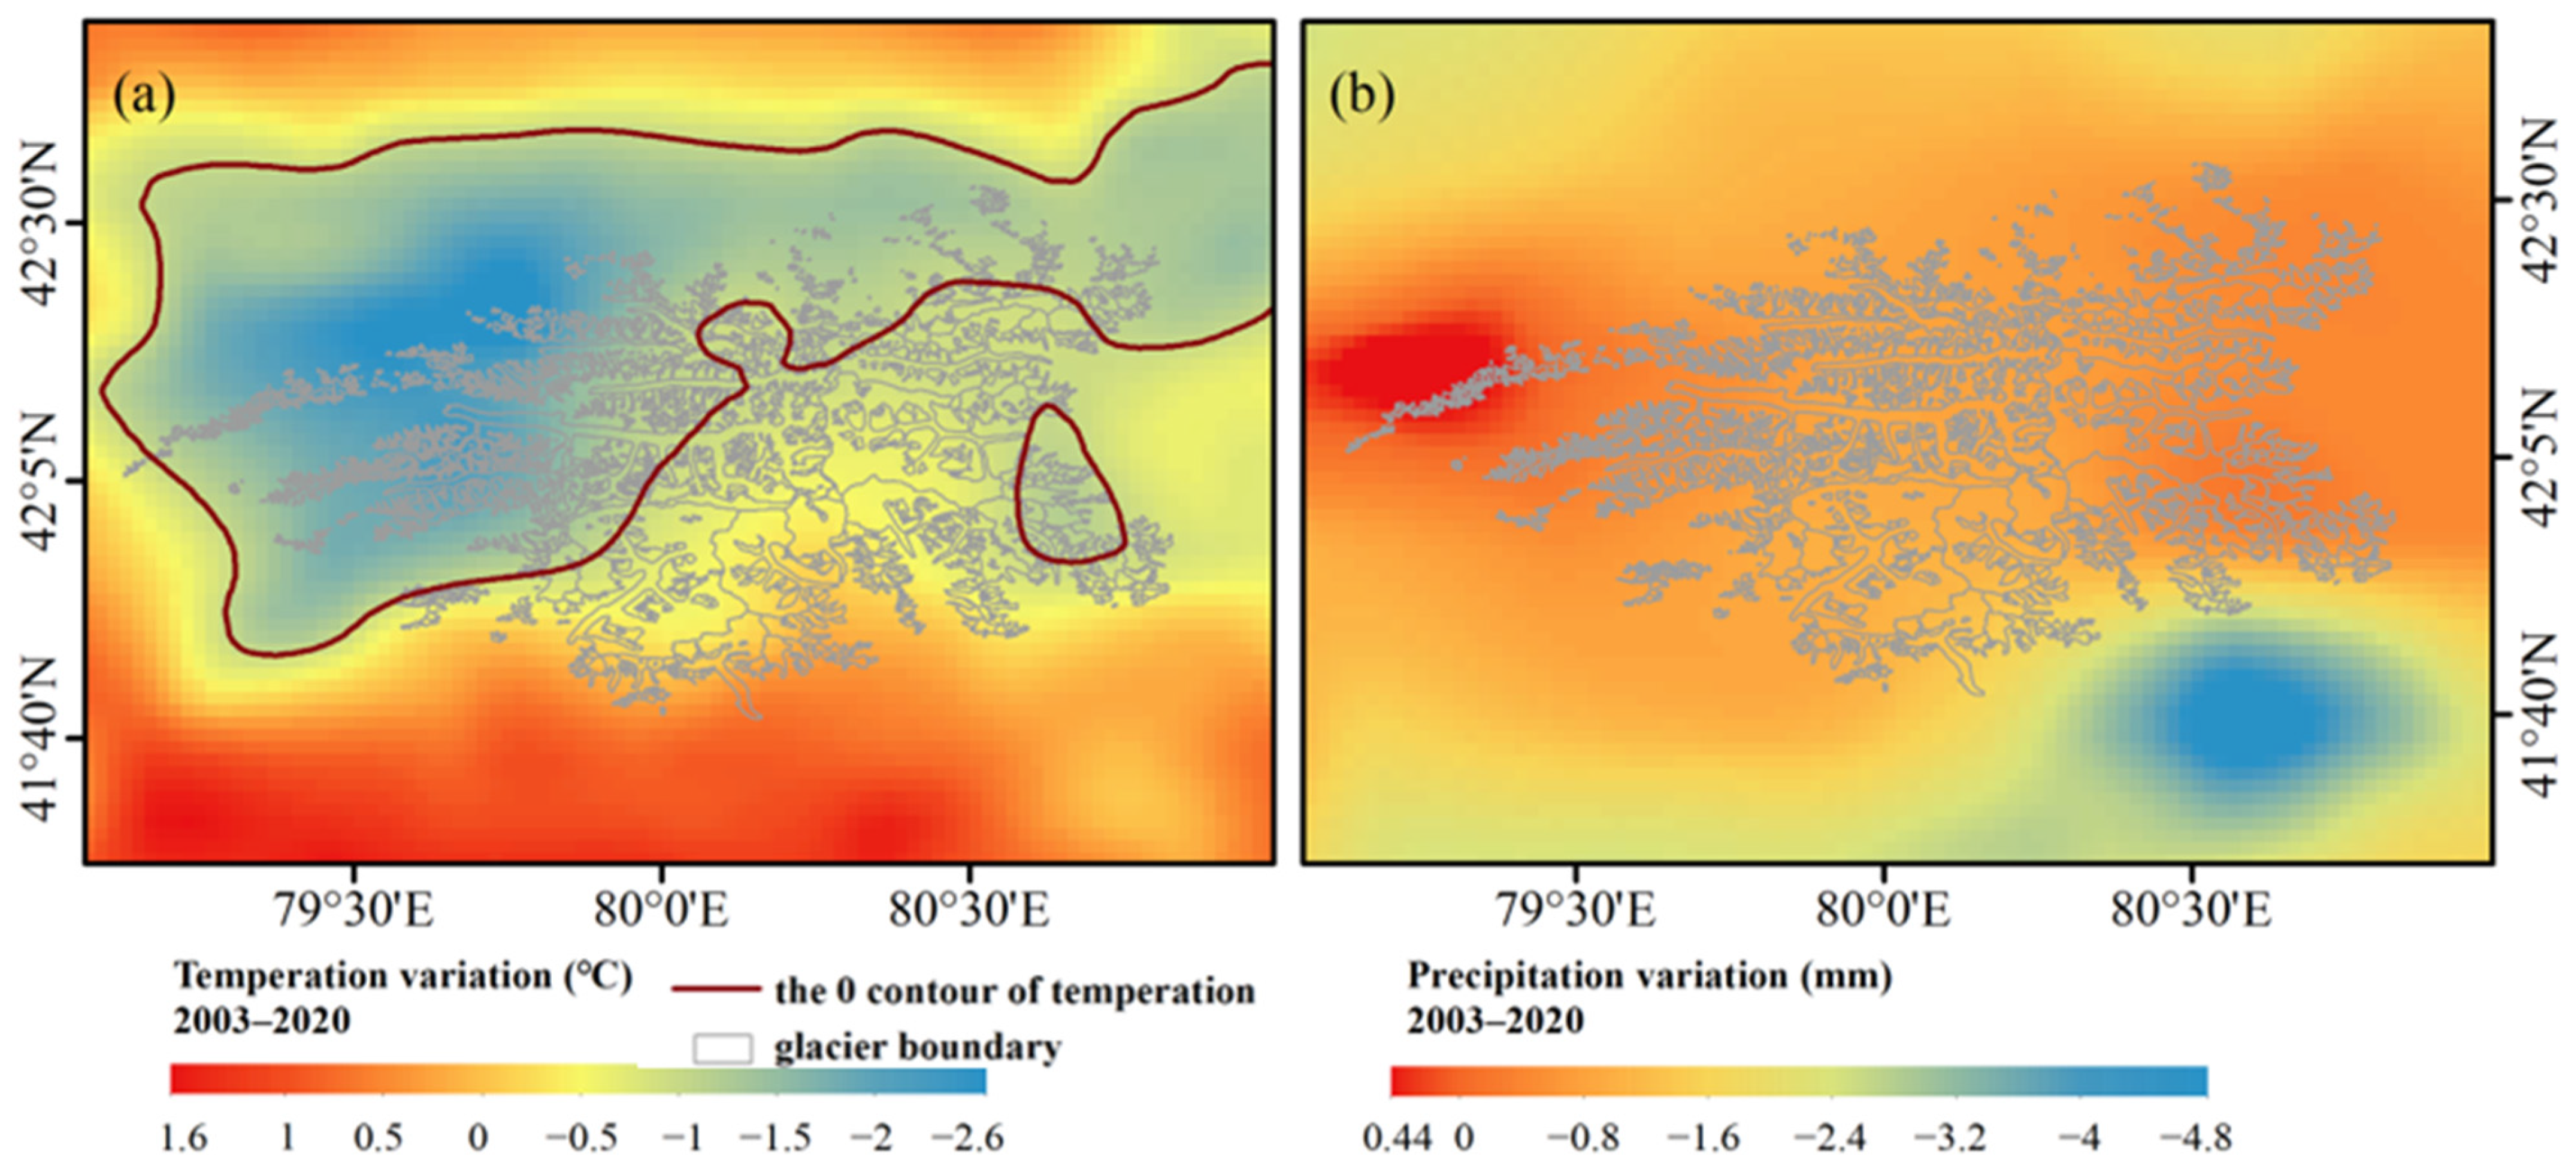
4.2. Analysis of Factors Influencing Mass Balance Variations in the Tomur Peak Region
5. Conclusions
Author Contributions
Funding
Data Availability Statement
Acknowledgments
Conflicts of Interest
References
- Minchew, B.; Joughin, I. Toward a Universal Glacier Slip Law. Science 2020, 368, 29–30. [Google Scholar] [CrossRef] [PubMed]
- Yan, Q.; Owen, L.A.; Guo, C.; Zhang, Z.; Zhang, J.; Wang, H. Widespread Glacier Advances across the Tian Shan during Marine Isotope Stage 3 Not Supported by Climate-Glaciation Simulations. Fundam. Res. 2023, 3, 102–110. [Google Scholar] [CrossRef]
- Sugiyama, S.; Kanna, N.; Sakakibara, D.; Ando, T.; Asaji, I.; Kondo, K.; Wang, Y.; Fujishi, Y.; Fukumoto, S.; Podolskiy, E.; et al. Rapidly Changing Glaciers, Ocean and Coastal Environments, and Their Impact on Human Society in the Qaanaaq Region, Northwestern Greenland. Polar Sci. 2021, 27, 100632. [Google Scholar] [CrossRef]
- Mao, G.; Ji, M.; Jiao, N.; Su, J.; Zhang, Z.; Liu, K.; Chen, Y.; Liu, Y. Monsoon Affects the Distribution of Antibiotic Resistome in Tibetan Glaciers. Environ. Pollut. 2023, 317, 120809. [Google Scholar] [CrossRef] [PubMed]
- Thomson, L.; Brun, F.; Braun, M.; Zemp, M. Editorial: Observational Assessments of Glacier Mass Changes at Regional and Global Level. Front. Earth Sci. 2021, 8, 641710. [Google Scholar] [CrossRef]
- Talukder, B.; Matthew, R.; vanLoon, G.W.; Bunch, M.J.; Hipel, K.W.; Orbinski, J. Melting of Himalayan Glaciers and Planetary Health. Curr. Opin. Environ. Sustain. 2021, 50, 98–108. [Google Scholar] [CrossRef]
- Duan, H.; Yao, X.; Zhang, Y.; Jin, H.; Wang, Q.; Du, Z.; Hu, J.; Wang, B.; Wang, Q. Lake Volume and Potential Hazards of Moraine-Dammed Glacial Lakes–A Case Study of Bienong Co, Southeastern Tibetan Plateau. Cryosphere 2023, 17, 591–616. [Google Scholar] [CrossRef]
- Hussain, W.; Khan, M.A. Climate Change-Induced Glacial Lake Outburst Floods in Hunza Valley of Pakistan: An Assessment of Indigenous Farming Community Perceptions and Adaptation. Environ. Dev. Sustain. 2023, 25, 1–25. [Google Scholar] [CrossRef]
- Ji, Q.; Yan, S.; He, Y.; Lu, X.; Ma, Z. Spatio-Temporal Patterns of Snow Cover in the Tien Shan, China from 2000 to 2019 Based on Cloud-Free Data Supported by Google Earth Engine. Remote Sens. Lett. 2023, 14, 265–276. [Google Scholar] [CrossRef]
- Bai, C.; Wang, F.; Wang, L.; Xu, C.; Yue, X.; Yang, S.; Wang, P.; Bi, Y.; Wei, H. Dynamic Monitoring of Debris-Covered Glacier Surface Velocity and Ice Thickness of Mt. Tomur, Tian Shan, China. Remote Sens. 2022, 15, 150. [Google Scholar] [CrossRef]
- Zemp, M.; Hoelzle, M.; Haeberli, W. Six Decades of Glacier Mass-Balance Observations: A Review of the Worldwide Monitoring Network. Ann. Glaciol. 2009, 50, 101–111. [Google Scholar] [CrossRef]
- Yan, L.; Wang, J.; Shao, D. Glacier Mass Balance in the Manas River Using Ascending and Descending Pass of Sentinel 1A/1B Data and SRTM DEM. Remote Sens. 2022, 14, 1506. [Google Scholar] [CrossRef]
- Li, Z.; Wang, N.; Chang, J.; Zhang, Q. The Formation of an Ice-Contact Proglacial Lake and Its Impact on Glacier Change: A Case Study of the Tanymas Lake and Fedchenko Glacier. Remote Sens. 2023, 15, 2745. [Google Scholar] [CrossRef]
- Zhang, Y.; Chao, N.; Li, F.; Yue, L.; Wang, S.; Chen, G.; Wang, Z.; Yu, N.; Sun, R.; Ouyang, G. Reconstructing Long-Term Arctic Sea Ice Freeboard, Thickness, and Volume Changes from Envisat, CryoSat-2, and ICESat-2. JMSE 2023, 11, 979. [Google Scholar] [CrossRef]
- Zhang, Q.; Zhang, L.; Ouyang, Z.; Chen, Z.; Zhao, D.; Chen, W. Glacier Elevation Change during Two Periods in the Lenglongling Mountains Derived from Bistatic SAR Interferometry. Geocarto Int. 2022, 27, 1–14. [Google Scholar] [CrossRef]
- Berthier, E.; Arnaud, Y.; Baratoux, D.; Vincent, C.; Rémy, F. Recent Rapid Thinning of the “Mer de Glace” Glacier Derived from Satellite Optical Images: THINNING OF GLACIER FROM SATELLITE DATA. Geophys. Res. Lett. 2004, 31, L17401. [Google Scholar] [CrossRef]
- Wang, D.; Kääb, A. Modeling Glacier Elevation Change from DEM Time Series. Remote Sens. 2015, 7, 10117–10142. [Google Scholar] [CrossRef]
- Lhakpa, D.; Fan, Y.; Cai, Y. Continuous Karakoram Glacier Anomaly and Its Response to Climate Change during 2000–2021. Remote Sens. 2022, 14, 6281. [Google Scholar] [CrossRef]
- Ali, N.; Ye, Q.; Zhang, X.; Ji, X.; Hu, Y.; Zhu, L.; Ali, A. Glacier Changes in India’s Dhauliganga Catchment over the Past Two Decades. Remote Sens. 2022, 14, 5692. [Google Scholar] [CrossRef]
- Liu, L.; Jiang, L.; Wang, H.; Sun, Y. Existence of Glacier Anomaly in the Interior and Northern Tibetan Plateau between 2000 and 2012. Remote Sens. 2022, 14, 2962. [Google Scholar] [CrossRef]
- Erfani Jazi, Z.; Motagh, M.; Klemann, V. Inferring Mass Loss by Measuring Contemporaneous Deformation around the Helheim Glacier, Southeastern Greenland, Using Sentinel-1 InSAR. Remote Sens. 2022, 14, 3956. [Google Scholar] [CrossRef]
- KääB, A. Glacier Volume Changes Using ASTER Satellite Stereo and ICESat GLAS Laser Altimetry. IEEE Trans. Geosci. Remote Sens. 2008, 46, 2823–2830. [Google Scholar] [CrossRef]
- Slater, T.; Shepherd, A.; McMillan, M.; Leeson, A.; Gilbert, L.; Muir, A.; Munneke, P.K.; Noël, B.; Fettweis, X.; van den Broeke, M.; et al. Increased Variability in Greenland Ice Sheet Runoff from Satellite Observations. Nat. Commun. 2021, 12, 6069. [Google Scholar] [CrossRef] [PubMed]
- Wang, J.; Yang, Y.; Wang, C.; Li, L. Accelerated Glacier Mass Loss over Svalbard Derived from ICESat-2 in 2019–2021. Atmosphere 2022, 13, 1255. [Google Scholar] [CrossRef]
- Zhao, F.; Long, D.; Li, X.; Huang, Q.; Han, P. Rapid Glacier Mass Loss in the Southeastern Tibetan Plateau since the Year 2000 from Satellite Observations. Remote Sens. Environ. 2022, 270, 112853. [Google Scholar] [CrossRef]
- Fan, Y.; Ke, C.-Q.; Zhou, X.; Shen, X.; Yu, X.; Lhakpa, D. Glacier Mass-Balance Estimates over High Mountain Asia from 2000 to 2021 Based on ICESat-2 and NASADEM. J. Glaciol. 2022, 69, 1–13. [Google Scholar] [CrossRef]
- Goel, V.; Morris, A.; Moholdt, G.; Matsuoka, K. Synthesis of Field and Satellite Data to Elucidate Recent Mass Balance of Five Ice Rises in Dronning Maud Land, Antarctica. Front. Earth Sci. 2022, 10, 975606. [Google Scholar] [CrossRef]
- Pieczonka, T.; Bolch, T.; Kröhnert, M.; Peters, J.; Liu, S. Glacier Branch Lines and Glacier Ice Thickness Estimation for Debris-Covered Glaciers in the Central Tien Shan. J. Glaciol. 2018, 64, 835–849. [Google Scholar] [CrossRef]
- Zhang, Q.; Chen, Y.; Li, Z.; Fang, G.; Xiang, Y.; Li, Y.; Ji, H. Recent Changes in Water Discharge in Snow and Glacier Melt-Dominated Rivers in the Tienshan Mountains, Central Asia. Remote Sens. 2020, 12, 2704. [Google Scholar] [CrossRef]
- Baojuan, H.; Zhongqin, L.; Meiping, S.; Wenbin, W.; Shang, J.; Kaiming, L. Change in Glacier Area and Thickness in the Tomur Peak, Western Chinese Tien Shan over the Past Four Decades. J. Earth Syst. Sci. 2015, 124, 353–363. [Google Scholar] [CrossRef]
- Yang, S.; Wang, F.; Xie, Y.; Zhao, W.; Bai, C.; Liu, J.; Xu, C. Delineation Evaluation and Variation of Debris-Covered Glaciers Based on the Multi-Source Remote Sensing Images, Take Glaciers in the Eastern Tomur Peak Region for Example. Remote Sens. 2023, 15, 2575. [Google Scholar] [CrossRef]
- Li, Y.; Chen, Y.; Li, Z. Developing Daily Cloud-Free Snow Composite Products From MODIS and IMS for the Tienshan Mountains. Earth Space Sci. 2019, 6, 266–275. [Google Scholar] [CrossRef]
- Deng, G.; Tang, Z.; Hu, G.; Wang, J.; Sang, G.; Li, J. Spatiotemporal Dynamics of Snowline Altitude and Their Responses to Climate Change in the Tienshan Mountains, Central Asia, during 2001–2019. Sustainability 2021, 13, 3992. [Google Scholar] [CrossRef]
- Li, Z.; Li, J.; Ding, X.; Wu, L.; Ke, L.; Hu, J.; Xu, B.; Peng, F. Anomalous Glacier Changes in the Southeast of Tuomuer-Khan Tengri Mountain Ranges, Central Tianshan. J. Geophys. Res. Atmos. 2018, 123, 6840–6863. [Google Scholar] [CrossRef]
- Ma, Q.; Li, Z.; Lei, H.; Chen, Z.; Liu, J.; Wang, S.; Su, T.; Feng, G. Interannual Variability of Extreme Precipitation during the Boreal Summer over Northwest China. Remote Sens. 2023, 15, 785. [Google Scholar] [CrossRef]
- Ma, Q.; Li, Z.; Chen, Z.; Su, T.; Wu, Y.; Feng, G. Moisture Changes with Increasing Summer Precipitation in Qilian and Tienshan Mountainous Areas. Atmos. Sci. Lett. 2023, 24, e1154. [Google Scholar] [CrossRef]
- Sun, T.; Qi, J.; Huang, H. Discovering Forest Height Changes Based on Spaceborne Lidar Data of ICESat-1 in 2005 and ICESat-2 in 2019: A Case Study in the Beijing-Tianjin-Hebei Region of China. For. Ecosyst. 2020, 7, 53. [Google Scholar] [CrossRef]
- Chen, J.; Duan, Z. Monitoring Spatial-Temporal Variations of Lake Level in Western China Using ICESat-1 and CryoSat-2 Satellite Altimetry. Remote Sens. 2022, 14, 5709. [Google Scholar] [CrossRef]
- Magruder, L.; Neumann, T.; Kurtz, N. ICESat-2 Early Mission Synopsis and Observatory Performance. Earth Space Sci. 2021, 8, e2020EA001555. [Google Scholar] [CrossRef]
- Zhang, Y.; Pang, Y.; Cui, D.; Ma, Y.; Chen, L. Accuracy Assessment of the ICESat-2/ATL06 Product in the Qilian Mountains Based on CORS and UAV Data. IEEE J. Sel. Top. Appl. Earth Obs. Remote Sens. 2021, 14, 1558–1571. [Google Scholar] [CrossRef]
- Satake, Y.; Nakamura, K. Temporal Variations in Ice Thickness of the Shirase Glacier Derived from Cryosat-2/SIRAL Data. Remote Sensing 2023, 15, 1205. [Google Scholar] [CrossRef]
- Morris, A.; Moholdt, G.; Gray, L. Spread of Svalbard Glacier Mass Loss to Barents Sea Margins Revealed by CryoSat-2. J. Geophys. Res. Earth Surf. 2020, 125, e2019JF005357. [Google Scholar] [CrossRef]
- Meloni, M.; Bouffard, J.; Parrinello, T.; Dawson, G.; Garnier, F.; Helm, V.; Di Bella, A.; Hendricks, S.; Ricker, R.; Webb, E.; et al. CryoSat Ice Baseline-D Validation and Evolutions. Cryosphere 2020, 14, 1889–1907. [Google Scholar] [CrossRef]
- Müller, F.L.; Paul, S.; Hendricks, S.; Dettmering, D. Monitoring Arctic Thin Ice: A Comparison between CryoSat-2 SAR Altimetry Data and MODIS Thermal-Infrared Imagery. Cryosphere 2023, 17, 809–825. [Google Scholar] [CrossRef]
- Du, W.; Liu, X.; Guo, J.; Shen, Y.; Li, W.; Chang, X. Analysis of the Melting Glaciers in Southeast Tibet by ALOS-PALSAR Data. Terr. Atmos. Ocean. Sci. 2019, 30, 7–19. [Google Scholar] [CrossRef]
- Singh, G.; Nela, B.R.; Bandyopadhyay, D.; Mohanty, S.; Kulkarni, A.V. Discovering Anomalous Dynamics and Disintegrating Behaviour in Glaciers of Chandra-Bhaga Sub-Basins, Part of Western Himalaya Using DInSAR. Remote Sens. Environ. 2020, 246, 111885. [Google Scholar] [CrossRef]
- Xie, Z.; Haritashya, U.K.; Asari, V.K.; Young, B.W.; Bishop, M.P.; Kargel, J.S. GlacierNet: A Deep-Learning Approach for Debris-Covered Glacier Mapping. IEEE Access 2020, 8, 83495–83510. [Google Scholar] [CrossRef]
- Doke, R.; Kikugawa, G.; Itadera, K. Very Local Subsidence Near the Hot Spring Region in Hakone Volcano, Japan, Inferred from InSAR Time Series Analysis of ALOS/PALSAR Data. Remote Sens. 2020, 12, 2842. [Google Scholar] [CrossRef]
- Li, F.; Maussion, F.; Wu, G.; Chen, W.; Yu, Z.; Li, Y.; Liu, G. Influence of Glacier Inventories on Ice Thickness Estimates and Future Glacier Change Projections in the Tian Shan Range, Central Asia. J. Glaciol. 2023, 69, 266–280. [Google Scholar] [CrossRef]
- Zhang, D.; Zhou, G.; Li, W.; Zhang, S.; Yao, X.; Wei, S. A New Global Dataset of Mountain Glacier Centerlines and Lengths. Earth Syst. Sci. Data 2022, 14, 3889–3913. [Google Scholar] [CrossRef]
- Bonshoms, M.; Ubeda, J.; Liguori, G.; Körner, P.; Navarro, Á.; Cruz, R. Validation of ERA5-Land Temperature and Relative Humidity on Four Peruvian Glaciers Using on-Glacier Observations. J. Mt. Sci. 2022, 19, 1849–1873. [Google Scholar] [CrossRef]
- Gurdiel, I.; Rada, C.; Malz, P.; Braun, M.; Casassa, G. Glacier Inventory and Recent Variations of Santa Inés Icefield, Southern Patagonia. Arct. Antarct. Alp. Res. 2022, 54, 202–220. [Google Scholar] [CrossRef]
- Hersbach, H.; Bell, B.; Berrisford, P.; Hirahara, S.; Horányi, A.; Muñoz-Sabater, J.; Nicolas, J.; Peubey, C.; Radu, R.; Schepers, D.; et al. The ERA5 Global Reanalysis. Q. J. R. Meteorol. Soc. 2020, 146, 1999–2049. [Google Scholar] [CrossRef]
- Du, W.; Zheng, Y.; Li, Y.; Bao, A.; Li, J.; Ma, D.; Gao, X.; Pan, Y.; Wang, S. Recent Seasonal Spatiotemporal Variations in Alpine Glacier Surface Elevation in the Pamir. Remote Sens. 2022, 14, 4923. [Google Scholar] [CrossRef]
- Shen, C.; Jia, L.; Ren, S. Inter- and Intra-Annual Glacier Elevation Change in High Mountain Asia Region Based on ICESat-1&2 Data Using Elevation-Aspect Bin Analysis Method. Remote Sens. 2022, 14, 1630. [Google Scholar] [CrossRef]
- Zhen, W.; Huiwen, Z.; Shiyin, L.; Junyin, C. Influence of Debris Cover on Glacier Response to Climate Change: Insights from Koxkar Glacier Using Dynamic Simulation. Arab. J. Geosci. 2019, 12, 506. [Google Scholar] [CrossRef]
- Cai, X.; Xu, C.; Li, Z. Glacier Changes and Its Effect on Water Resources in the Upper Reaches of Aksu River, Tien Shan, China, from 1989 to 2016. Arab. J. Geosci. 2022, 15, 565. [Google Scholar] [CrossRef]
- Chen, J.; Du, W.; Kang, S.; Qin, X.; Sun, W.; Liu, Y.; Luo, L.; He, J.; Jiang, Y.; Sun, W. Comparison of Energy and Mass Balance Characteristics between Two Glaciers in Adjacent Basins in the Qilian Mountains. Clim. Dyn. 2023, 61, 1535–1550. [Google Scholar] [CrossRef]
- Zhang, Q.; Chen, Y.; Li, Z.; Li, Y.; Xiang, Y.; Bian, W. Glacier Changes from 1975 to 2016 in the Aksu River Basin, Central Tianshan Mountains. J. Geogr. Sci. 2019, 29, 984–1000. [Google Scholar] [CrossRef]
- Wang, J.; Tang, Z.; Deng, G.; Hu, G.; You, Y.; Zhao, Y. Landsat Satellites Observed Dynamics of Snowline Altitude at the End of the Melting Season, Himalayas, 1991–2022. Remote Sens. 2023, 15, 2534. [Google Scholar] [CrossRef]
- Hayat, H.; Raup, B.; Muhammad, S.; Liu, S.; Khan, R.; Baig, S.U.; Ahmad Tahir, A. Heterogeneous Mass Balance of Selected Glaciers in the Hindu Kush, Karakoram, and Himalaya between 2000 and 2018. Eur. J. Remote Sens. 2023, 56, 2173086. [Google Scholar] [CrossRef]
- Vincent, C.; Thibert, E. Brief Communication: Non-Linear Sensitivity of Glacier Mass Balance to Climate Attested by Temperature-Index Models. Cryosphere 2023, 17, 1989–1995. [Google Scholar] [CrossRef]


| Kolmogorov-Smirnov Test | Shapiro-Wilk Test | ||||
|---|---|---|---|---|---|
| Statistics | Degrees of Freedom | Significance | Statistics | Degrees of Freedom | Significance |
| 0.111 | 564 | 0.000 | 0.925 | 564 | 0.000 |
| ICESat-1 | CryoSat-2 | ICESat-2 | ICESat-2 | ICESat-2 | |||||
|---|---|---|---|---|---|---|---|---|---|
| Time | R2 | Time | R2 | Time | R2 | Time | R2 | Time | R2 |
| 2003 | 0.9998 | 2010 | 0.9995 | Janurary 2019 | 0.9998 | September 2019 | 0.9998 | May 2020 | 0.9997 |
| 2004 | 0.9997 | 2011 | 0.9997 | February 2019 | 0.9998 | October 2019 | 0.9997 | June 2020 | 0.9998 |
| 2005 | 0.9998 | 2012 | 0.9996 | March 2019 | 0.9997 | November 2019 | 0.9998 | July 2020 | 0.9998 |
| 2006 | 0.9998 | 2013 | 0.9996 | April 2019 | 0.9997 | December 2019 | 0.9997 | August 2020 | 0.9998 |
| 2007 | 0.9997 | 2014 | 0.9997 | May 2019 | 0.9998 | Janurary 2020 | 0.9997 | September 2020 | 0.9997 |
| 2008 | 0.9998 | 2015 | 0.9998 | June 2019 | 0.9998 | February 2020 | 0.9998 | October 2020 | 0.9998 |
| 2009 | 0.9998 | 2016 | 0.9997 | July 2019 | 0.9997 | March 2020 | 0.9997 | November 2020 | 0.9997 |
| 2017 | 0.9997 | August 2019 | 0.9997 | April 2020 | 0.9995 | December 2020 | 0.9998 | ||
| 2018 | 0.9996 | ||||||||
| 2019 | 0.9996 | ||||||||
| 2020 | 0.9998 | ||||||||
| Time | The Average Variation in GSE in Tomur Peak Region (m) | The Average Variation in GSE in the Koxkar Glacier (m) | The Average Variation in GSE in the Kiqikterang Glacier (m) |
|---|---|---|---|
| 2003–2004 | 1.31 ± 1.26 | 1.07 ± 0.73 | 1.31 ± 0.66 |
| 2004–2005 | −3.18 ± 0.31 | −2.68 ± 2.01 | −3.25 ± 1.03 |
| 2005–2006 | 1.33 ± 1.05 | 1.23 ± 0.24 | 1.31 ± 0.32 |
| 2006–2007 | −1.25 ± 1.54 | −2.32 ± 1.90 | −1.23 ± 1.07 |
| 2007–2008 | −0.62 ± 0.50 | 0.50 0.44 | −0.63 ± 0.82 |
| 2008–2009 | −1.85 ± 1.51 | −1.76 ± 2.74 | −1.24 ± 1.53 |
| 2009–2010 | −1.32 ± 1.56 | −7.78 ± 7.03 | −4.87 ± 3.97 |
| 2010–2011 | 0.29 ± 0.22 | 4.32 ± 3.76 | 2.57 ± 1.85 |
| 2011–2012 | −6.33 ± 3.33 | −5.36 ± 2.15 | −6.53 ± 3.79 |
| 2012–2013 | 3.09 ± 0.84 | −0.03 ± 0.58 | 2.15 ± 1.85 |
| 2013–2014 | −5.60 ± 1.52 | −3.40 ± 1.21 | −5.40 ± 4.15 |
| 2014–2015 | 1.34 ± 0.70 | 1.36 ± 1.12 | 1.76 ± 0.78 |
| 2015–2016 | −0.47 ± 0.37 | −0.88 ± 0.50 | −0.49 ± 0.26 |
| 2016–2017 | −0.12 ± 0.38 | 0.90 ± 0.71 | 0.34 ± 0.18 |
| 2017–2018 | 3.65 ± 2.72 | 3.38 ± 0.61 | 3.66 ± 0.71 |
| 2018–2019 | 0.74 ± 0.71 | 0.38 ± 0.24 | 0.91 ± 0.78 |
| 2019–2020 | −0.03 ± 1.16 | −1.01 ± 0.47 | −0.52 ± 0.72 |
| Elevation Range (m) | Number of Altimetric Points | Glacier Area (km2) | 2003–2008 | 2011–2020 | 2003–2020 | |||
|---|---|---|---|---|---|---|---|---|
| dh/dt (m/yr) | GMB (Gt/yr) | dh/dt (m/yr) | GMB (Gt/yr) | dh/dt (m/yr) | GMB (Gt/yr) | |||
| <4000 | 11,938 | 901.71 | −0.65 ± 0.07 | −0.59 ± 0.05 | −0.58 ± 0.14 | −0.51 ± 0.03 | −0.78 ± 0.24 | −0.61 ± 0.04 |
| 4000–5000 | 18,357 | 2056.29 | −0.43 ± 0.23 | −0.92 ± 0.05 | −0.36 ± 0.06 | −0.74 ± 0.03 | −0.38 ± 0.07 | −0.80 ± 0.03 |
| >5000 | 1470 | 522.48 | +0.27 ± 0.30 | +0.08 ± 0.01 | +0.33 ± 0.25 | +0.10 ± 0.01 | −0.18 ± 0.19 | −0.11 ± 0.01 |
| Total | 31,765 | 3480.47 | −0.47 ± 0.32 | −1.42 ± 0.05 | −0.41 ± 0.26 | −1.15 ± 0.04 | −0.53 ± 0.26 | −1.51 ± 0.04 |
Disclaimer/Publisher’s Note: The statements, opinions and data contained in all publications are solely those of the individual author(s) and contributor(s) and not of MDPI and/or the editor(s). MDPI and/or the editor(s) disclaim responsibility for any injury to people or property resulting from any ideas, methods, instructions or products referred to in the content. |
© 2023 by the authors. Licensee MDPI, Basel, Switzerland. This article is an open access article distributed under the terms and conditions of the Creative Commons Attribution (CC BY) license (https://creativecommons.org/licenses/by/4.0/).
Share and Cite
Cheng, C.; Du, W.; Li, J.; Bao, A.; Ge, W.; Wang, S.; Ma, D.; Pan, Y. Spatiotemporal Variations of Glacier Mass Balance in the Tomur Peak Region Based on Multi-Source Altimetry Remote Sensing Data. Remote Sens. 2023, 15, 4143. https://doi.org/10.3390/rs15174143
Cheng C, Du W, Li J, Bao A, Ge W, Wang S, Ma D, Pan Y. Spatiotemporal Variations of Glacier Mass Balance in the Tomur Peak Region Based on Multi-Source Altimetry Remote Sensing Data. Remote Sensing. 2023; 15(17):4143. https://doi.org/10.3390/rs15174143
Chicago/Turabian StyleCheng, Chaoying, Weibing Du, Junli Li, Anming Bao, Wen Ge, Shuangting Wang, Dandan Ma, and Yaming Pan. 2023. "Spatiotemporal Variations of Glacier Mass Balance in the Tomur Peak Region Based on Multi-Source Altimetry Remote Sensing Data" Remote Sensing 15, no. 17: 4143. https://doi.org/10.3390/rs15174143
APA StyleCheng, C., Du, W., Li, J., Bao, A., Ge, W., Wang, S., Ma, D., & Pan, Y. (2023). Spatiotemporal Variations of Glacier Mass Balance in the Tomur Peak Region Based on Multi-Source Altimetry Remote Sensing Data. Remote Sensing, 15(17), 4143. https://doi.org/10.3390/rs15174143