
Comparison of FY-4A/AGRI SST with Himawari-8/AHI and In Situ SST

Abstract
:1. Introduction
2. Materials and Methods
2.1. Materials
2.1.1. FY-4A/AGRI Data
2.1.2. Himawari-8/AHI Data
2.1.3. In Situ SST
2.2. Method
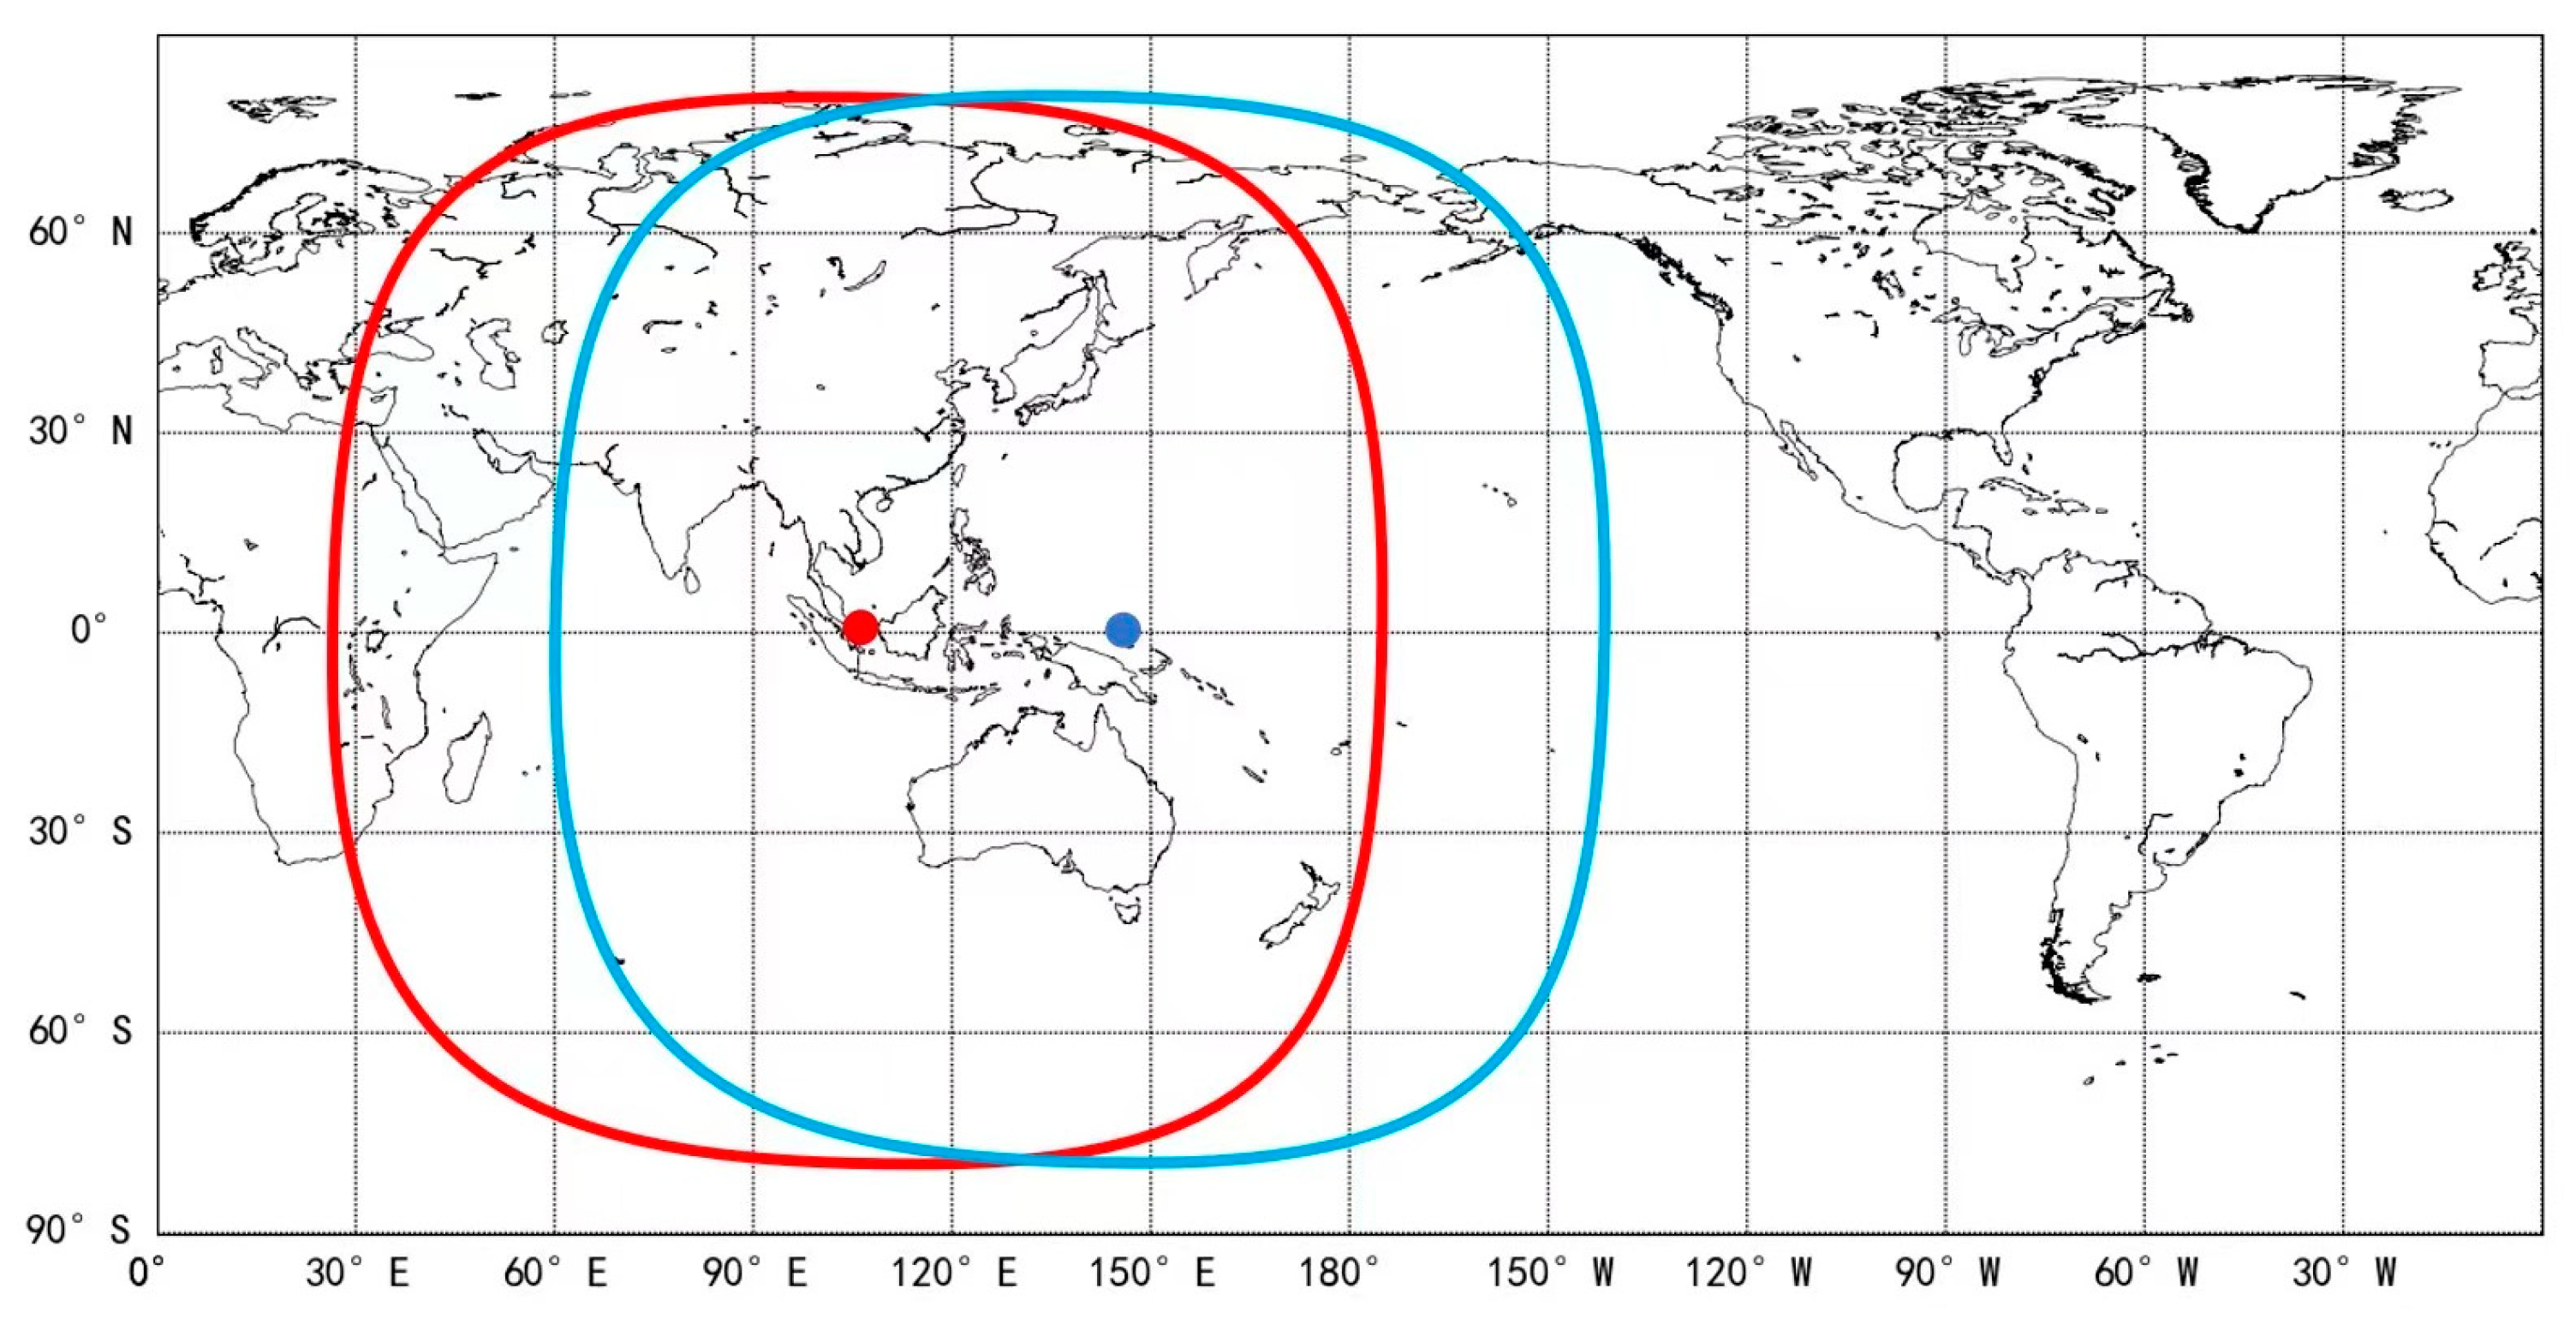
2.2.1. Study Area
2.2.2. Matching Method
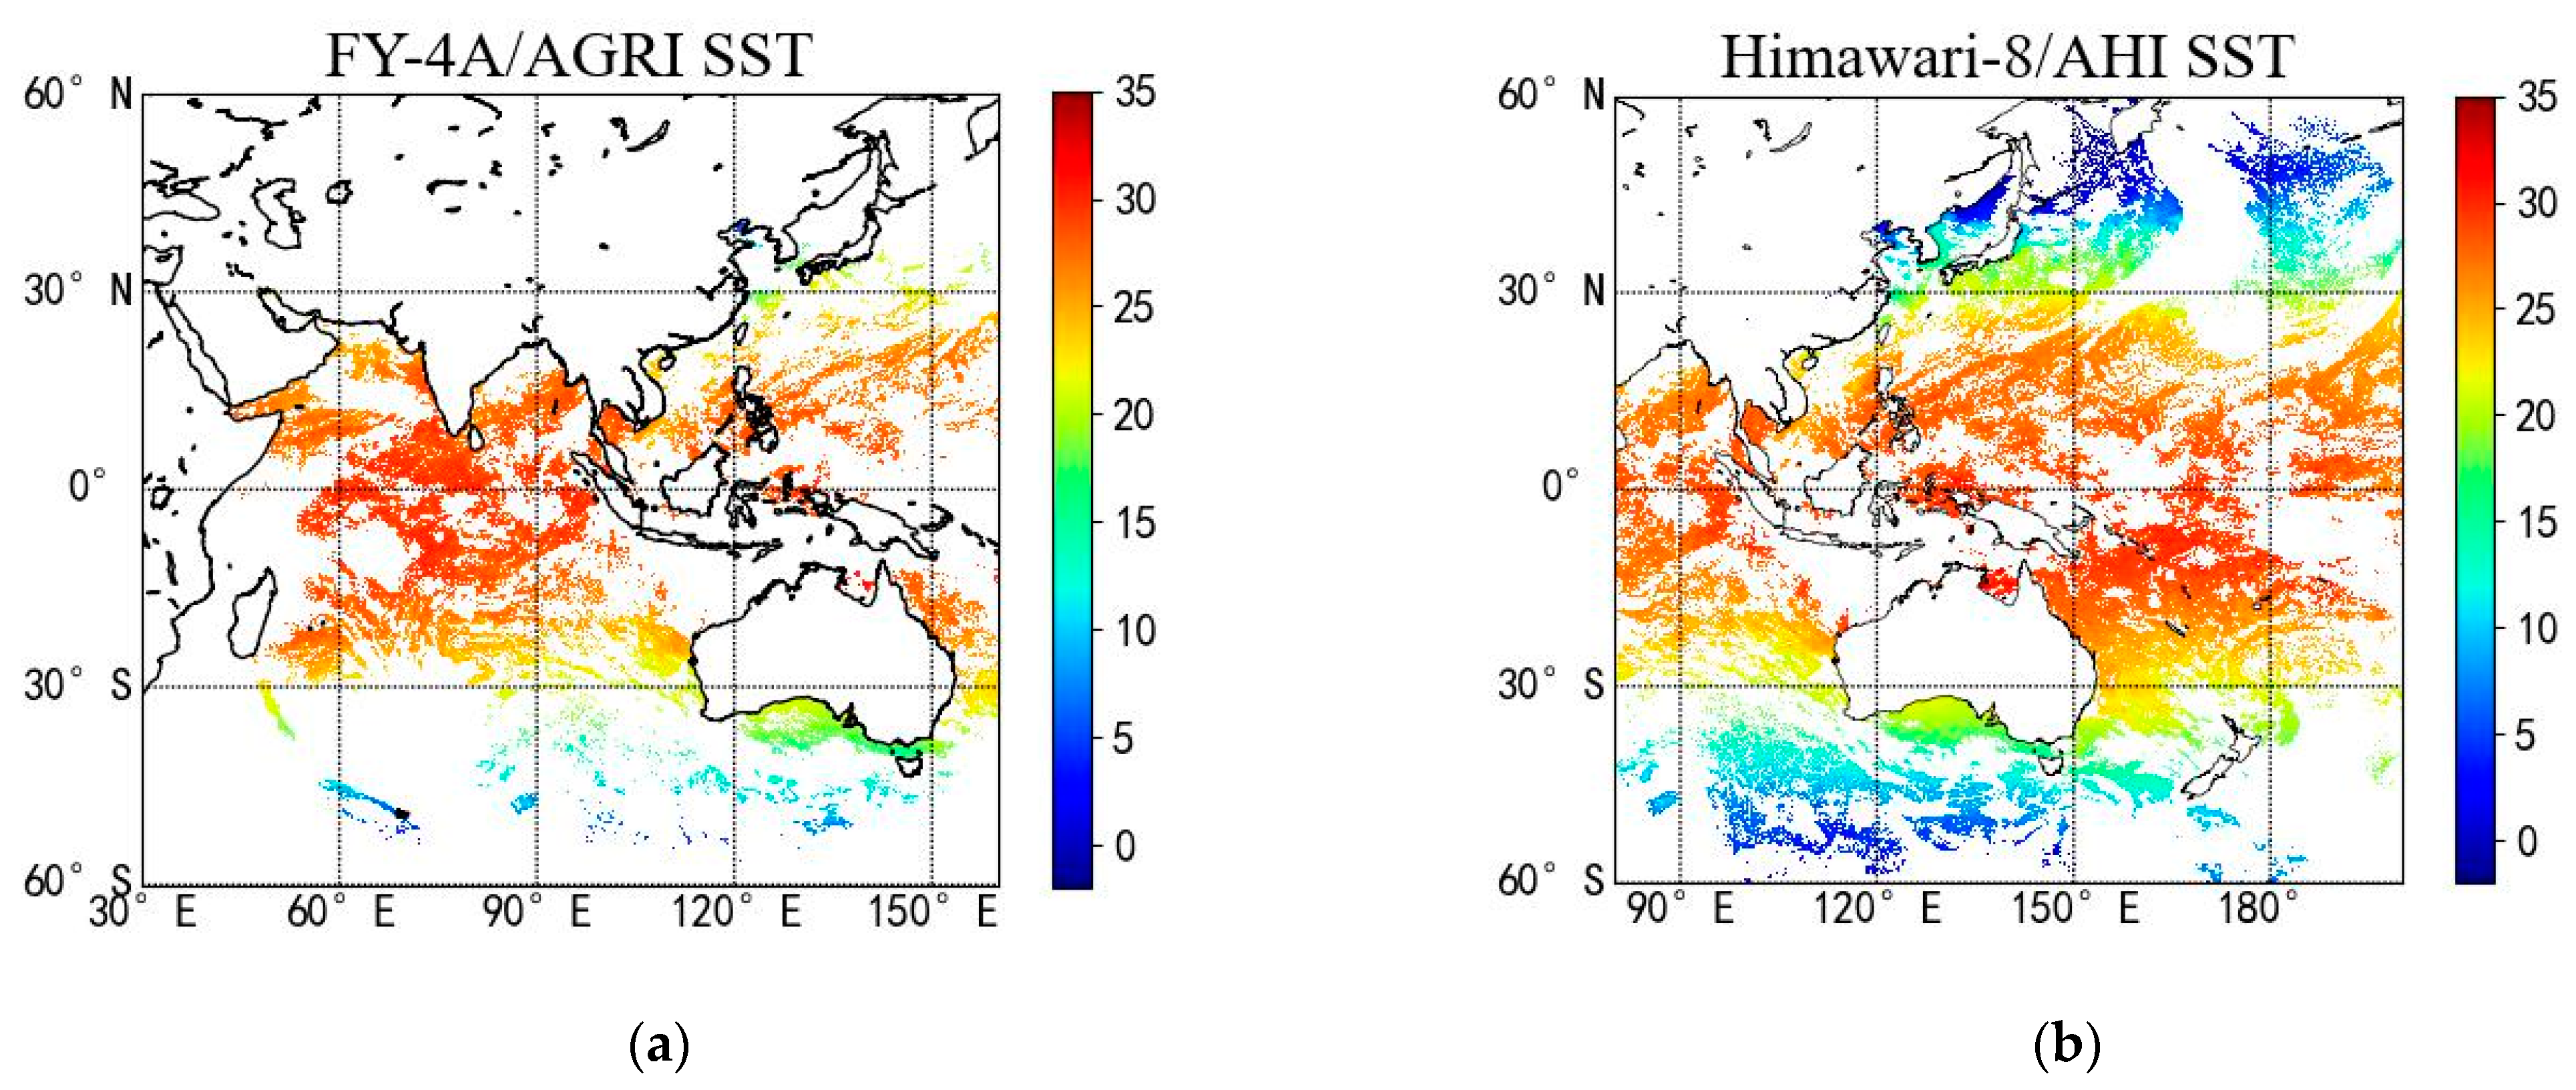
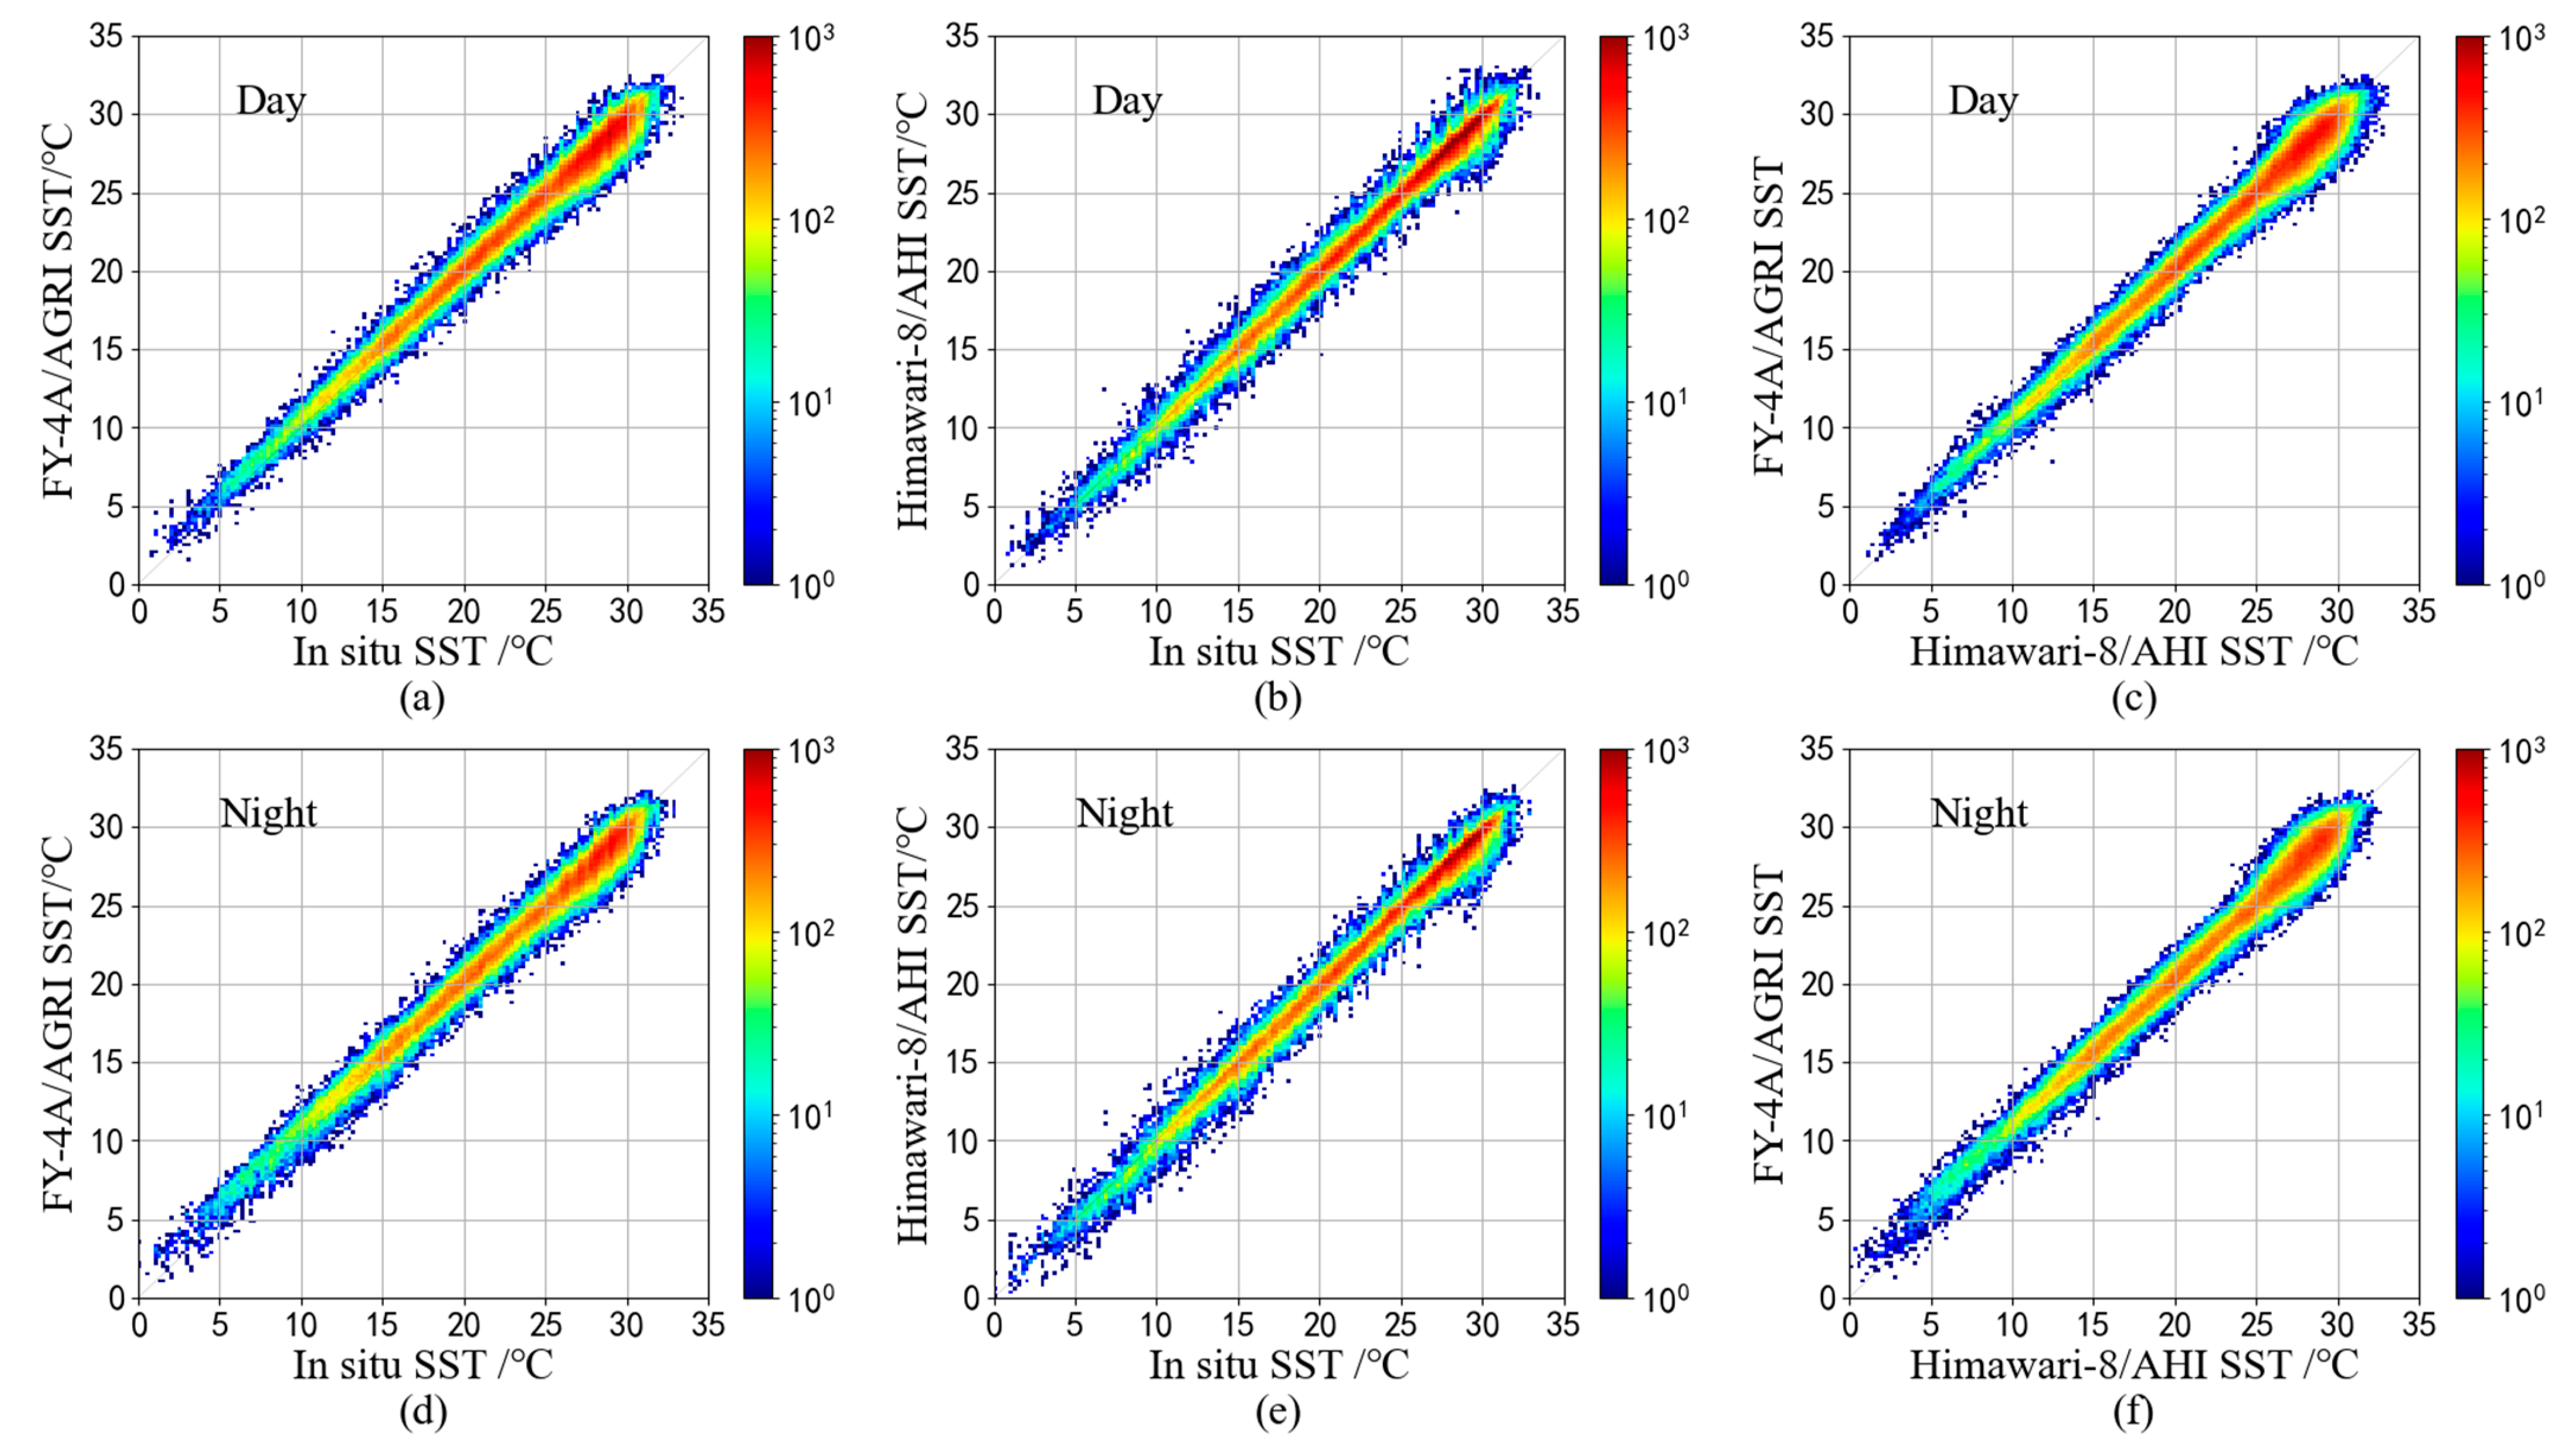
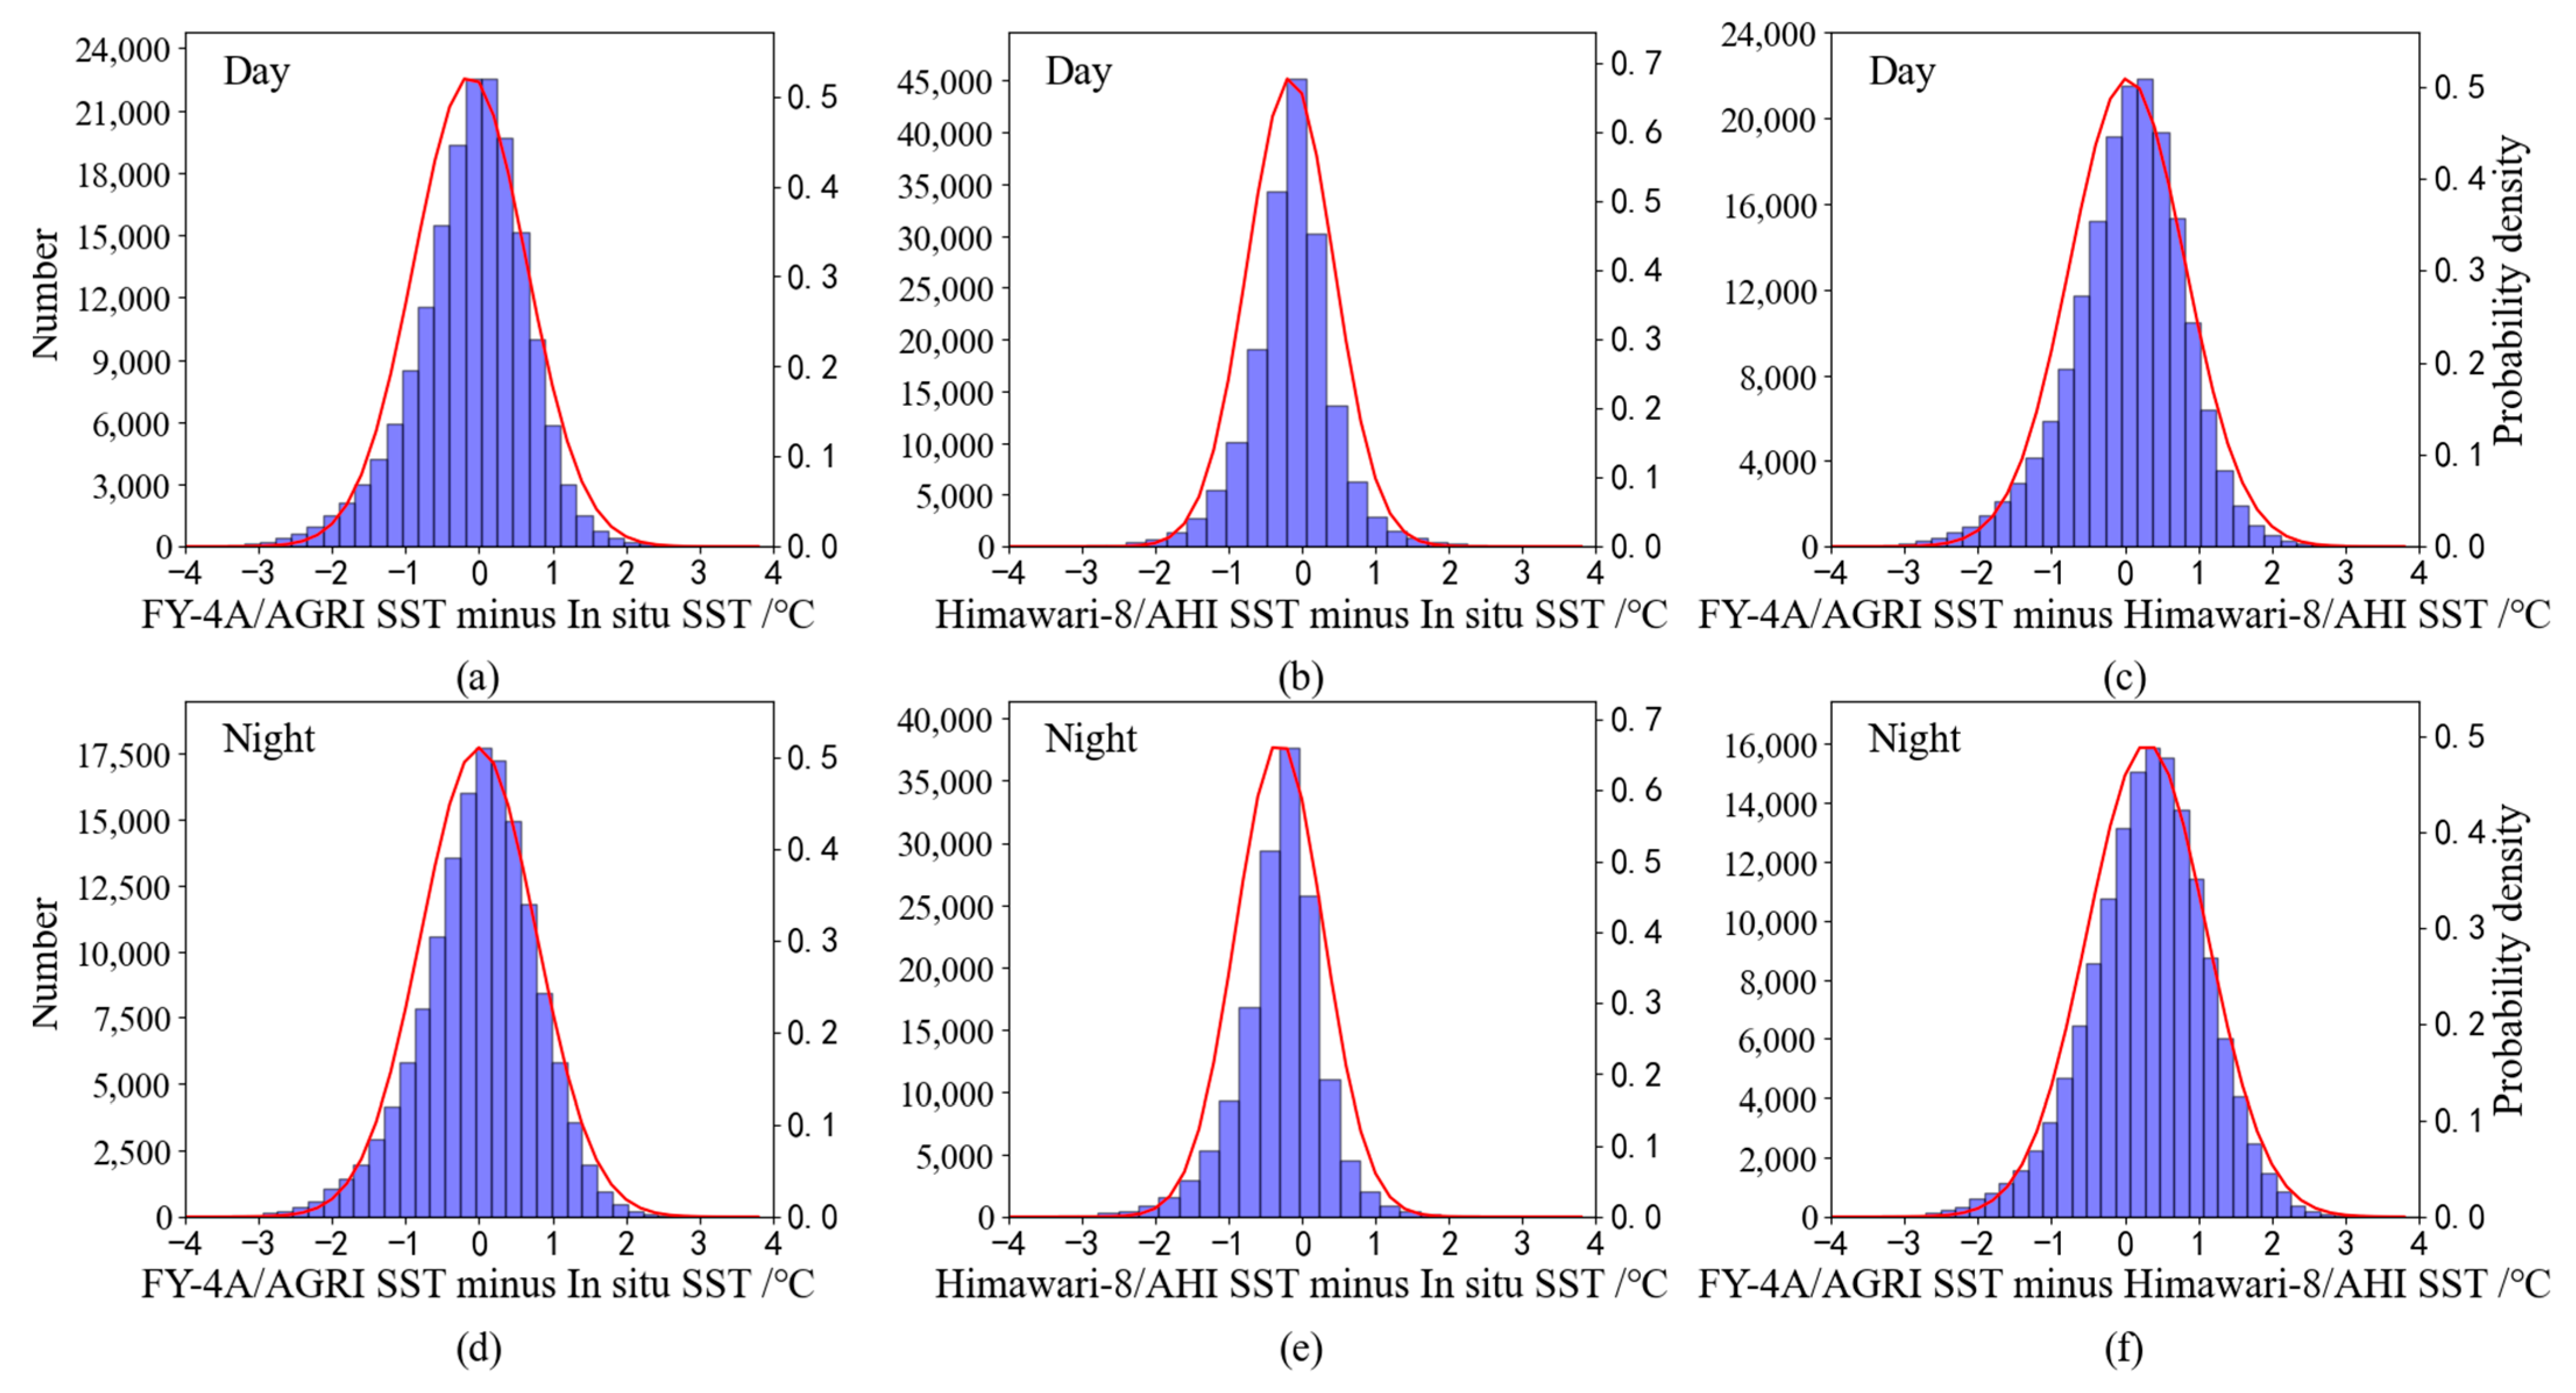
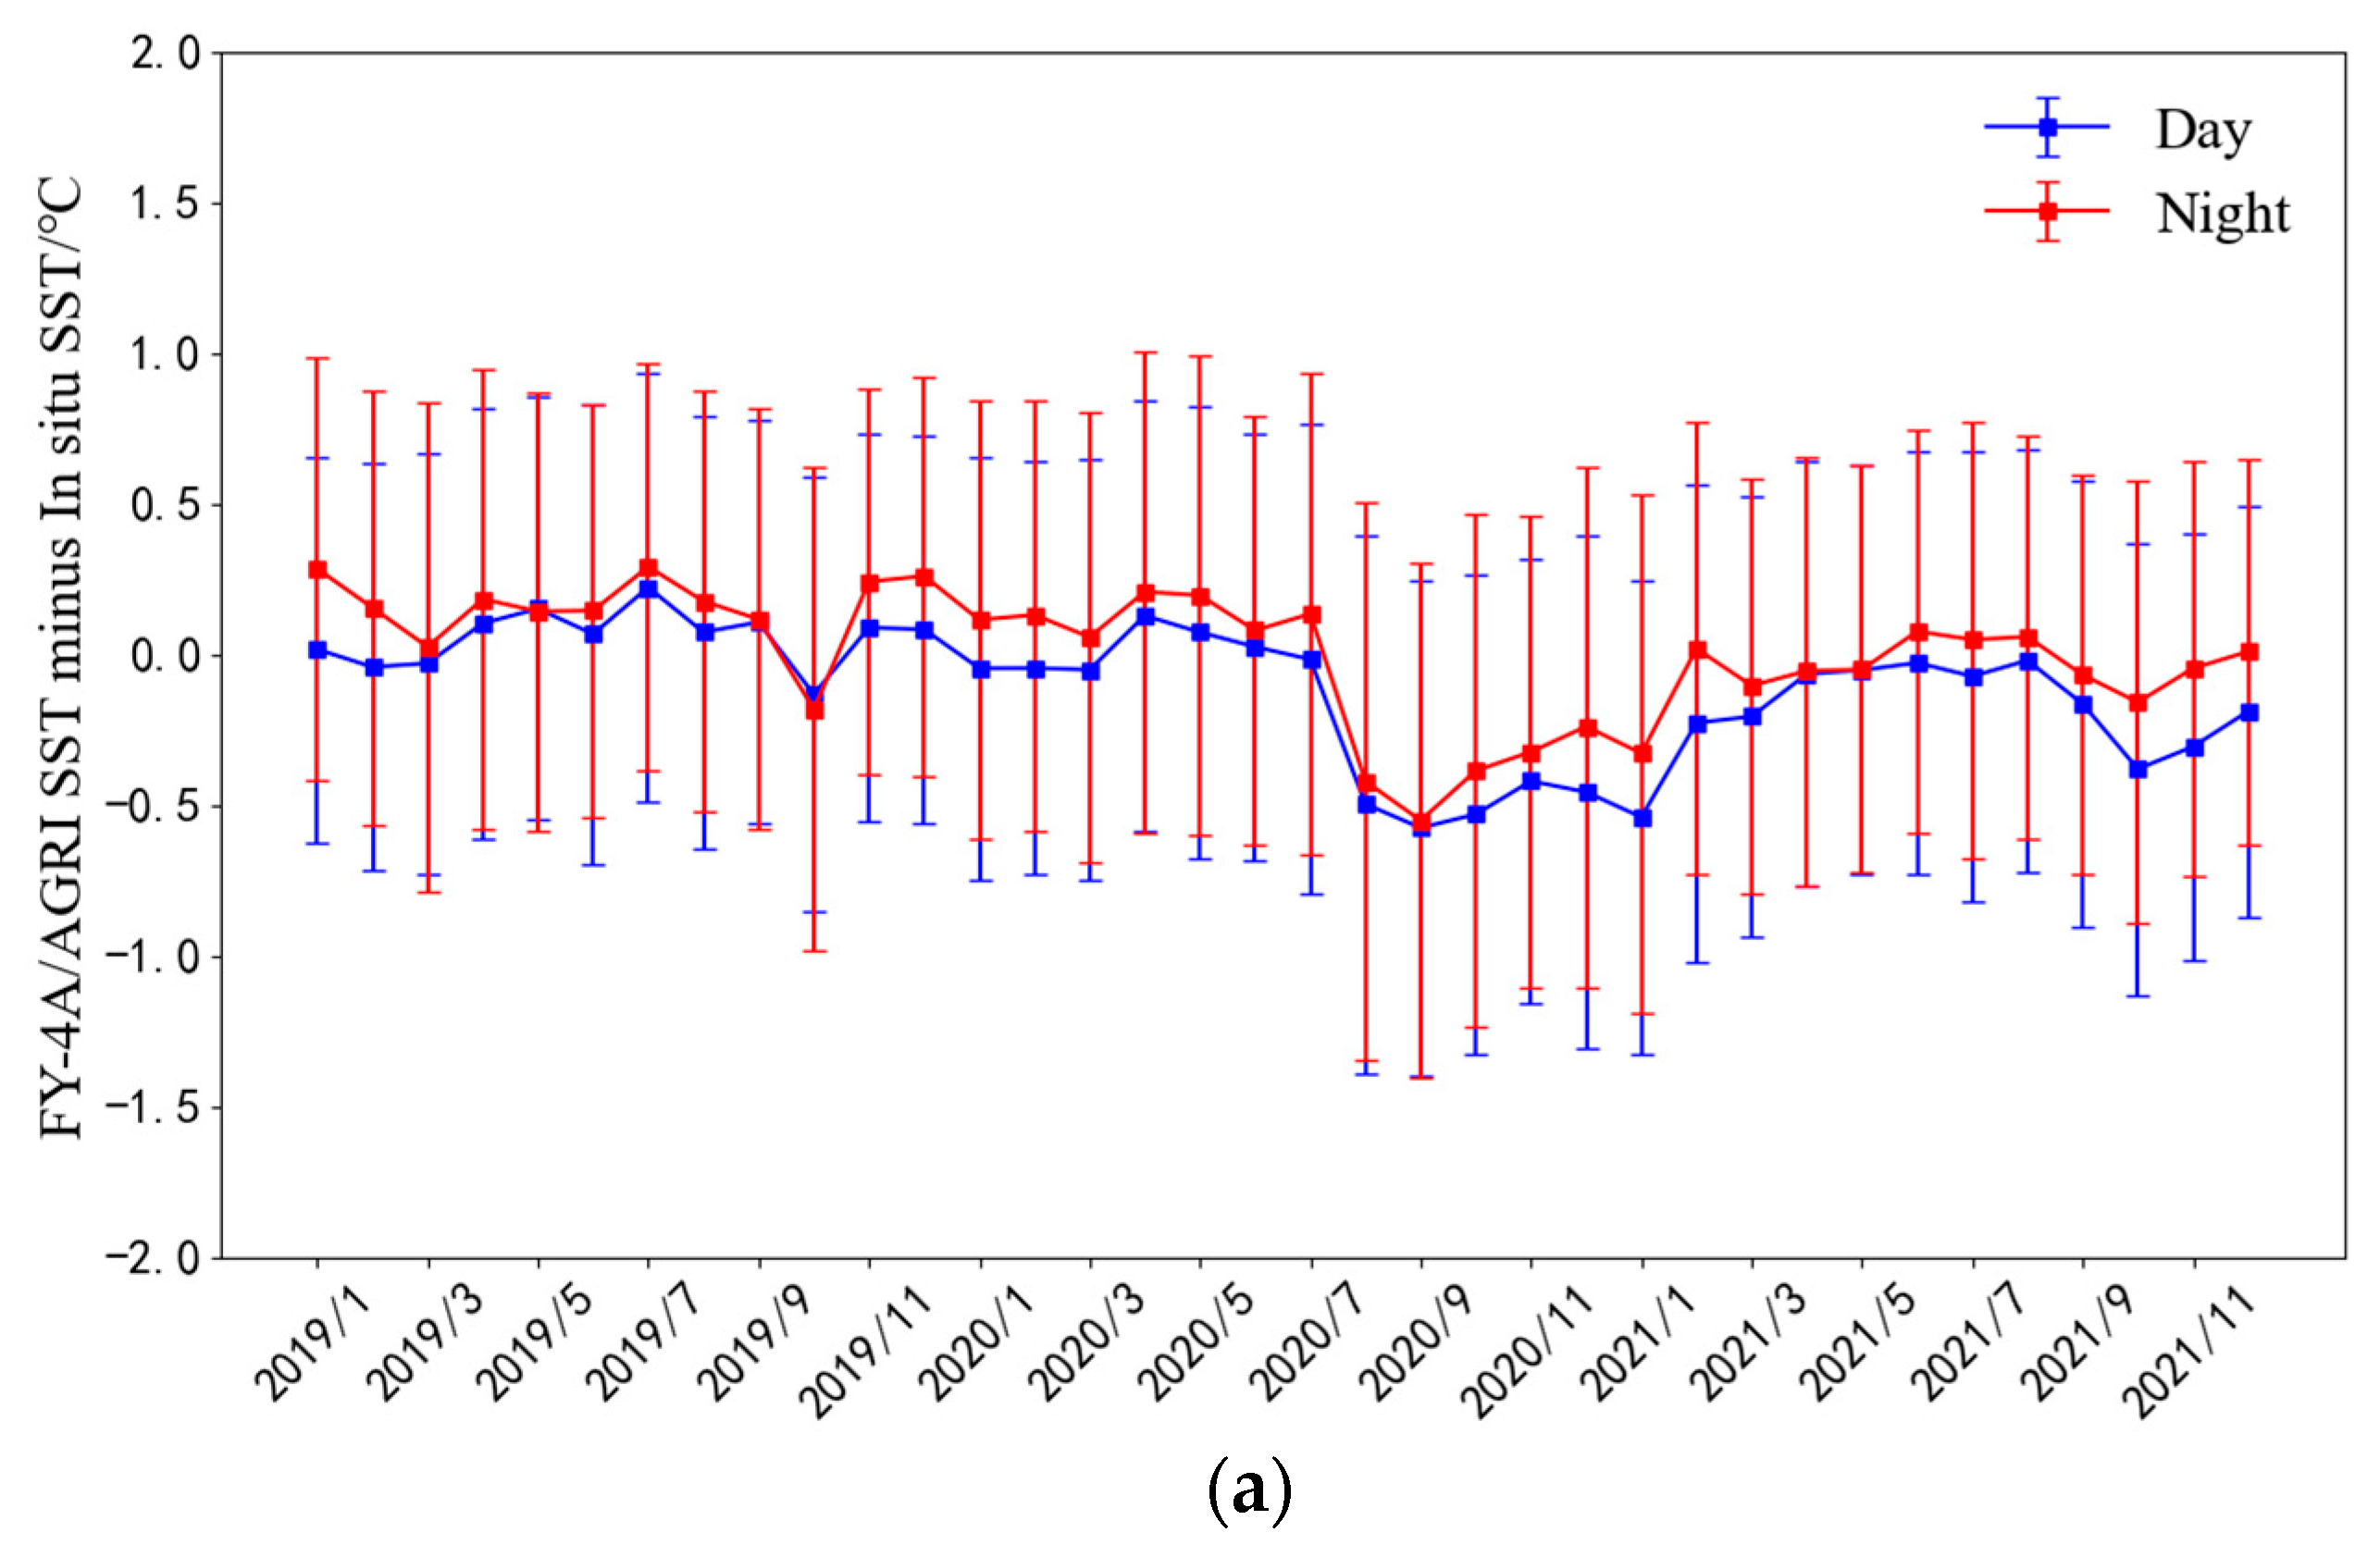
3. Results
4. Discussion
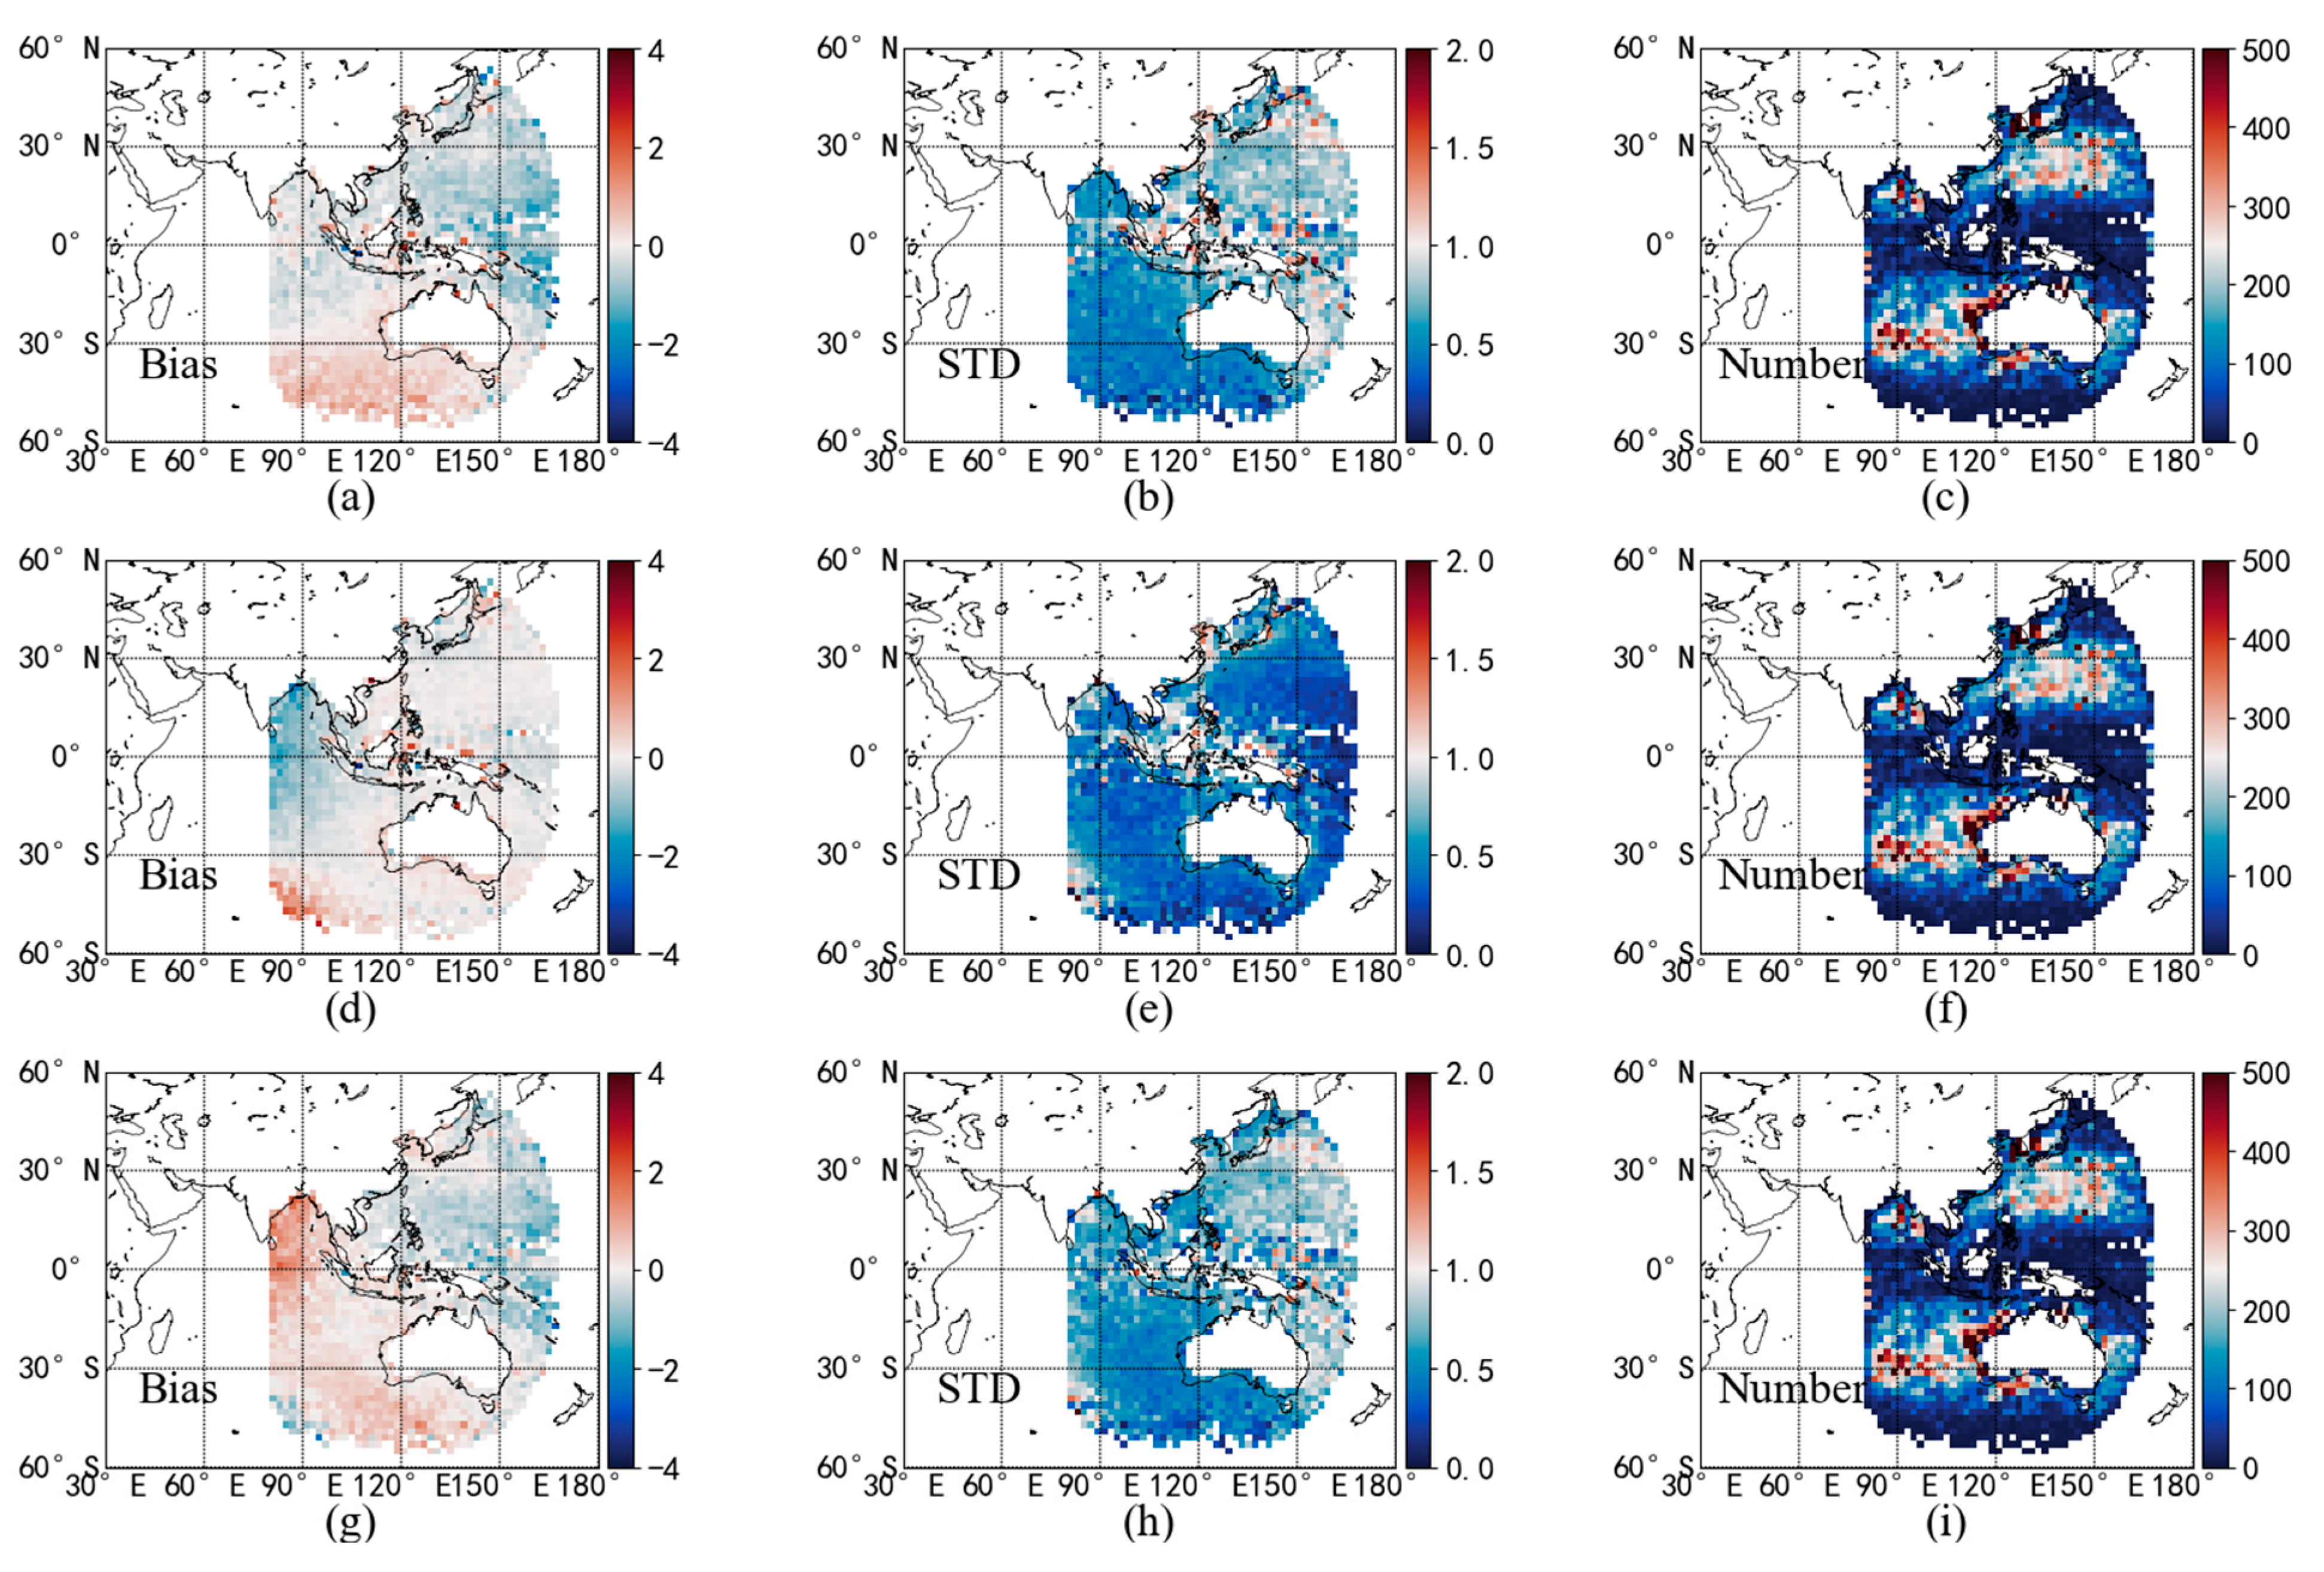
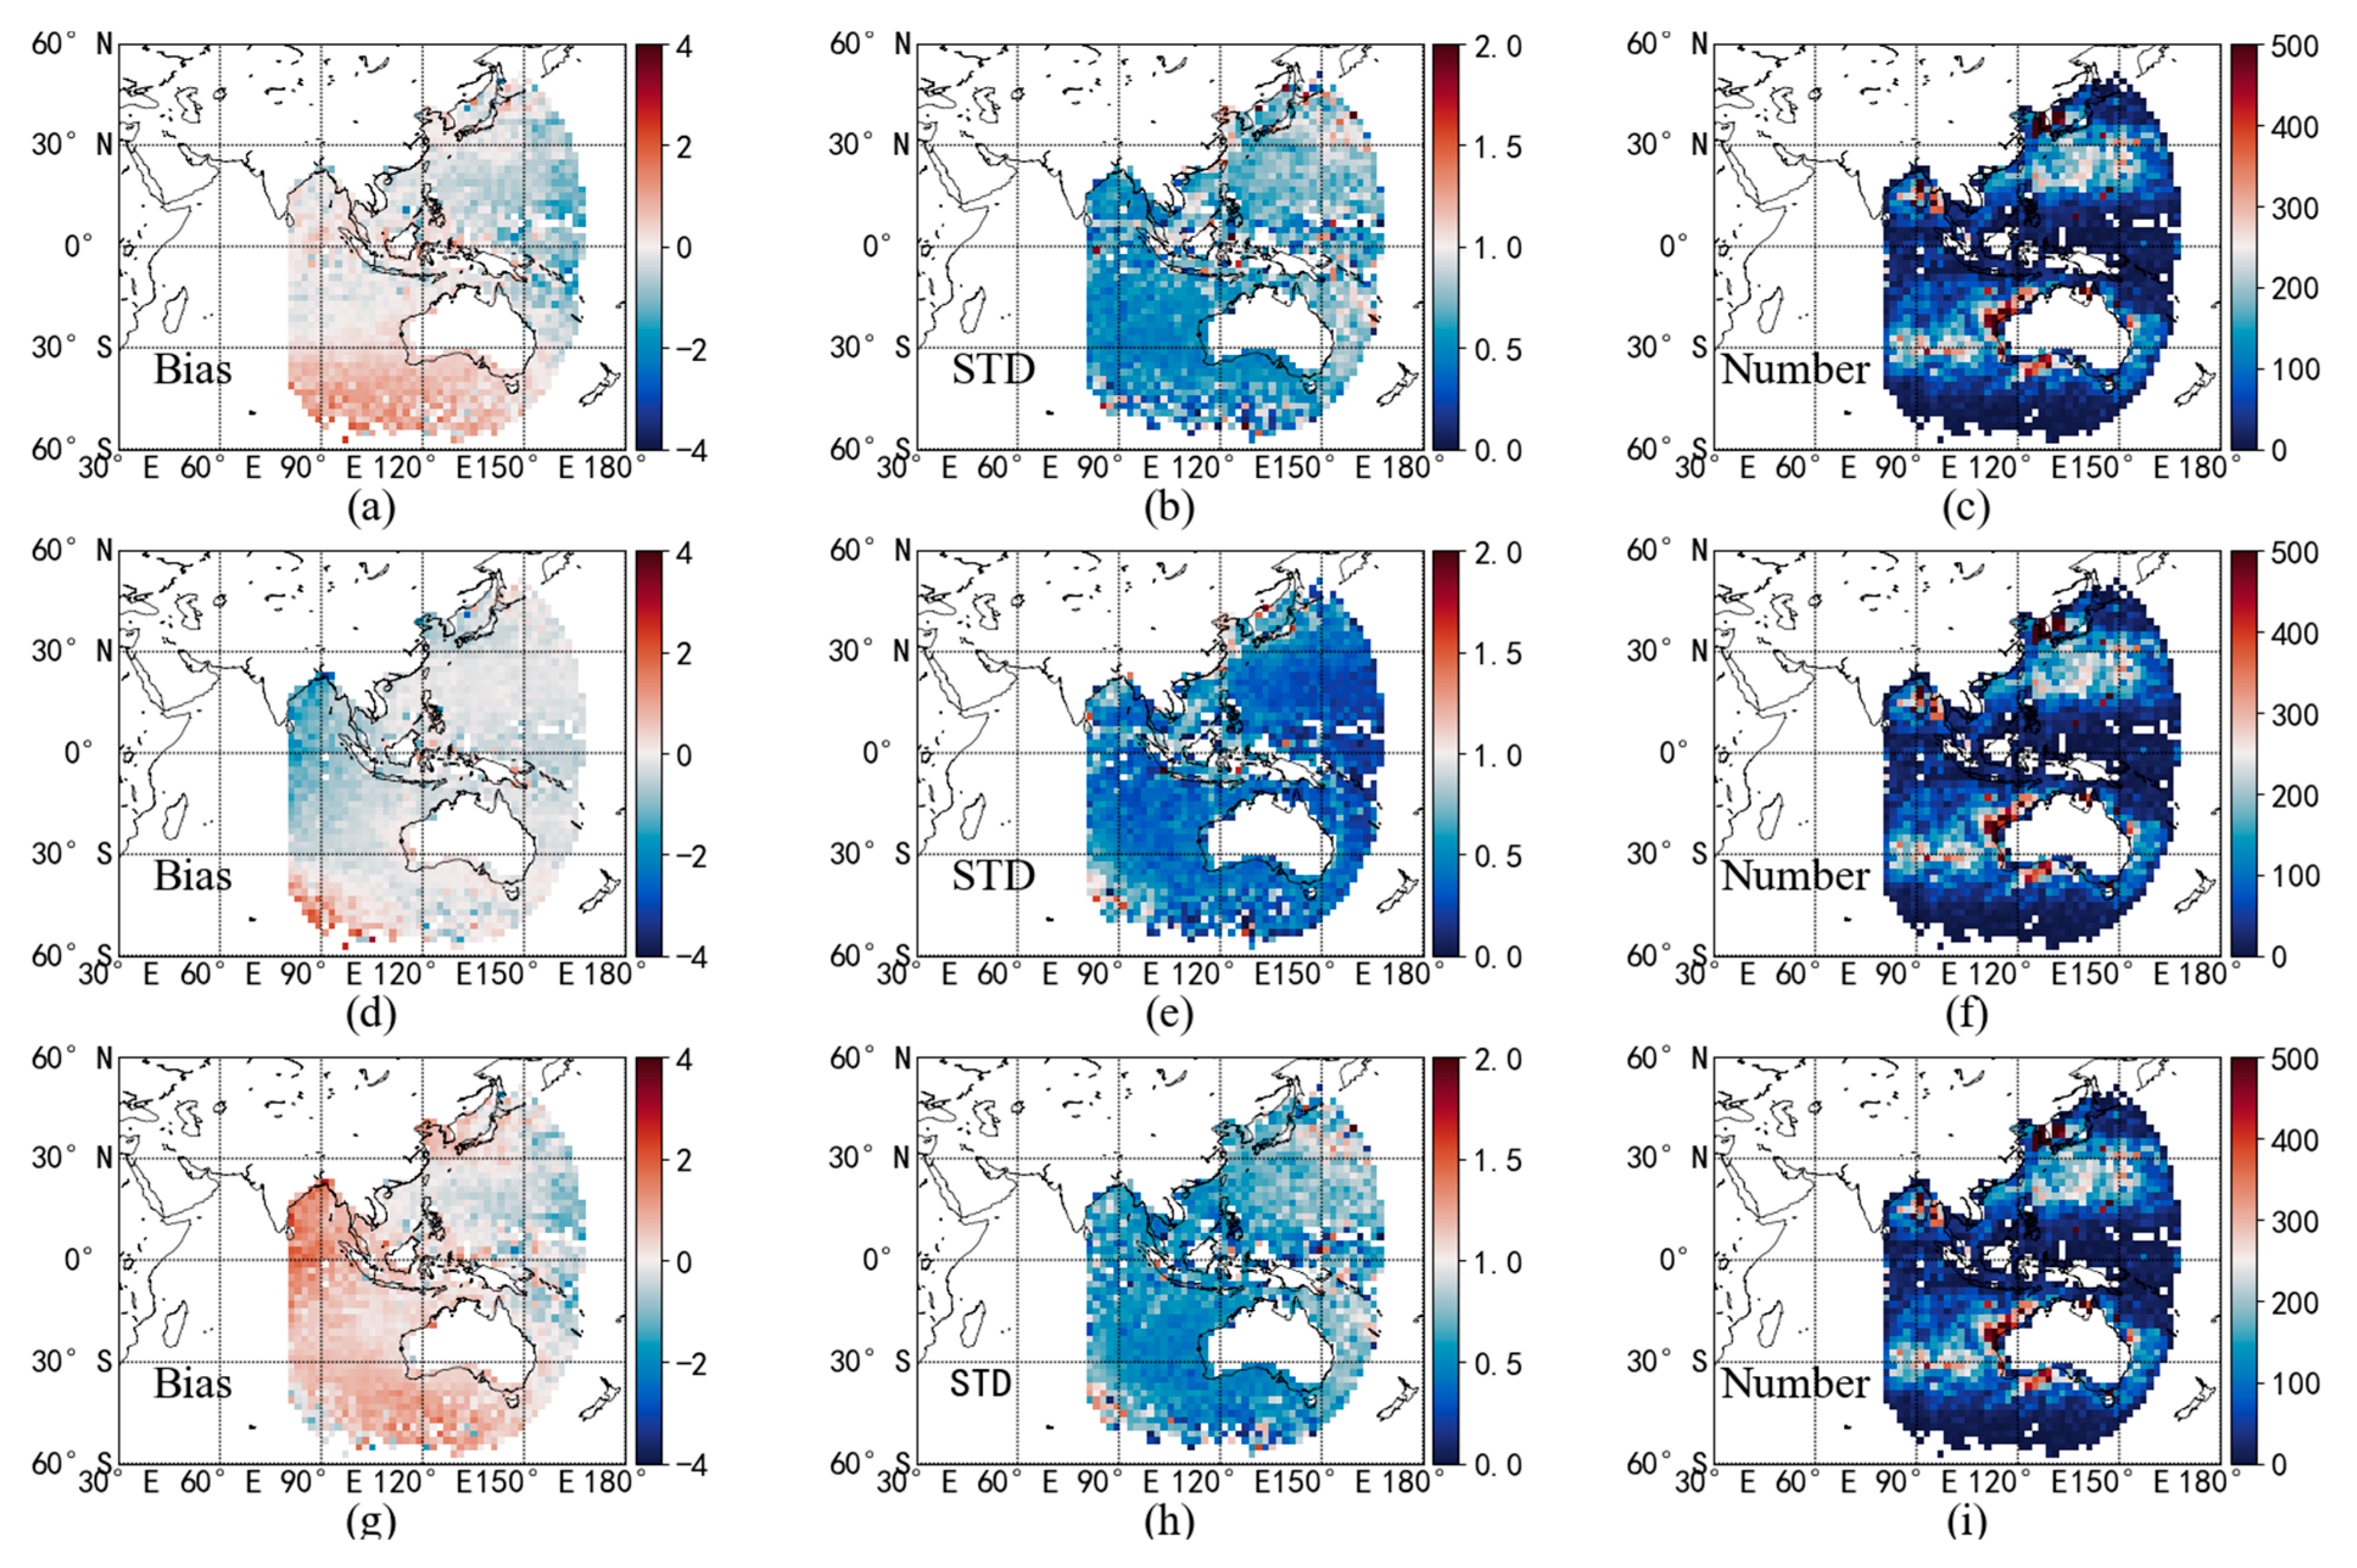
4.1. Spatial Distribution of SST Bias
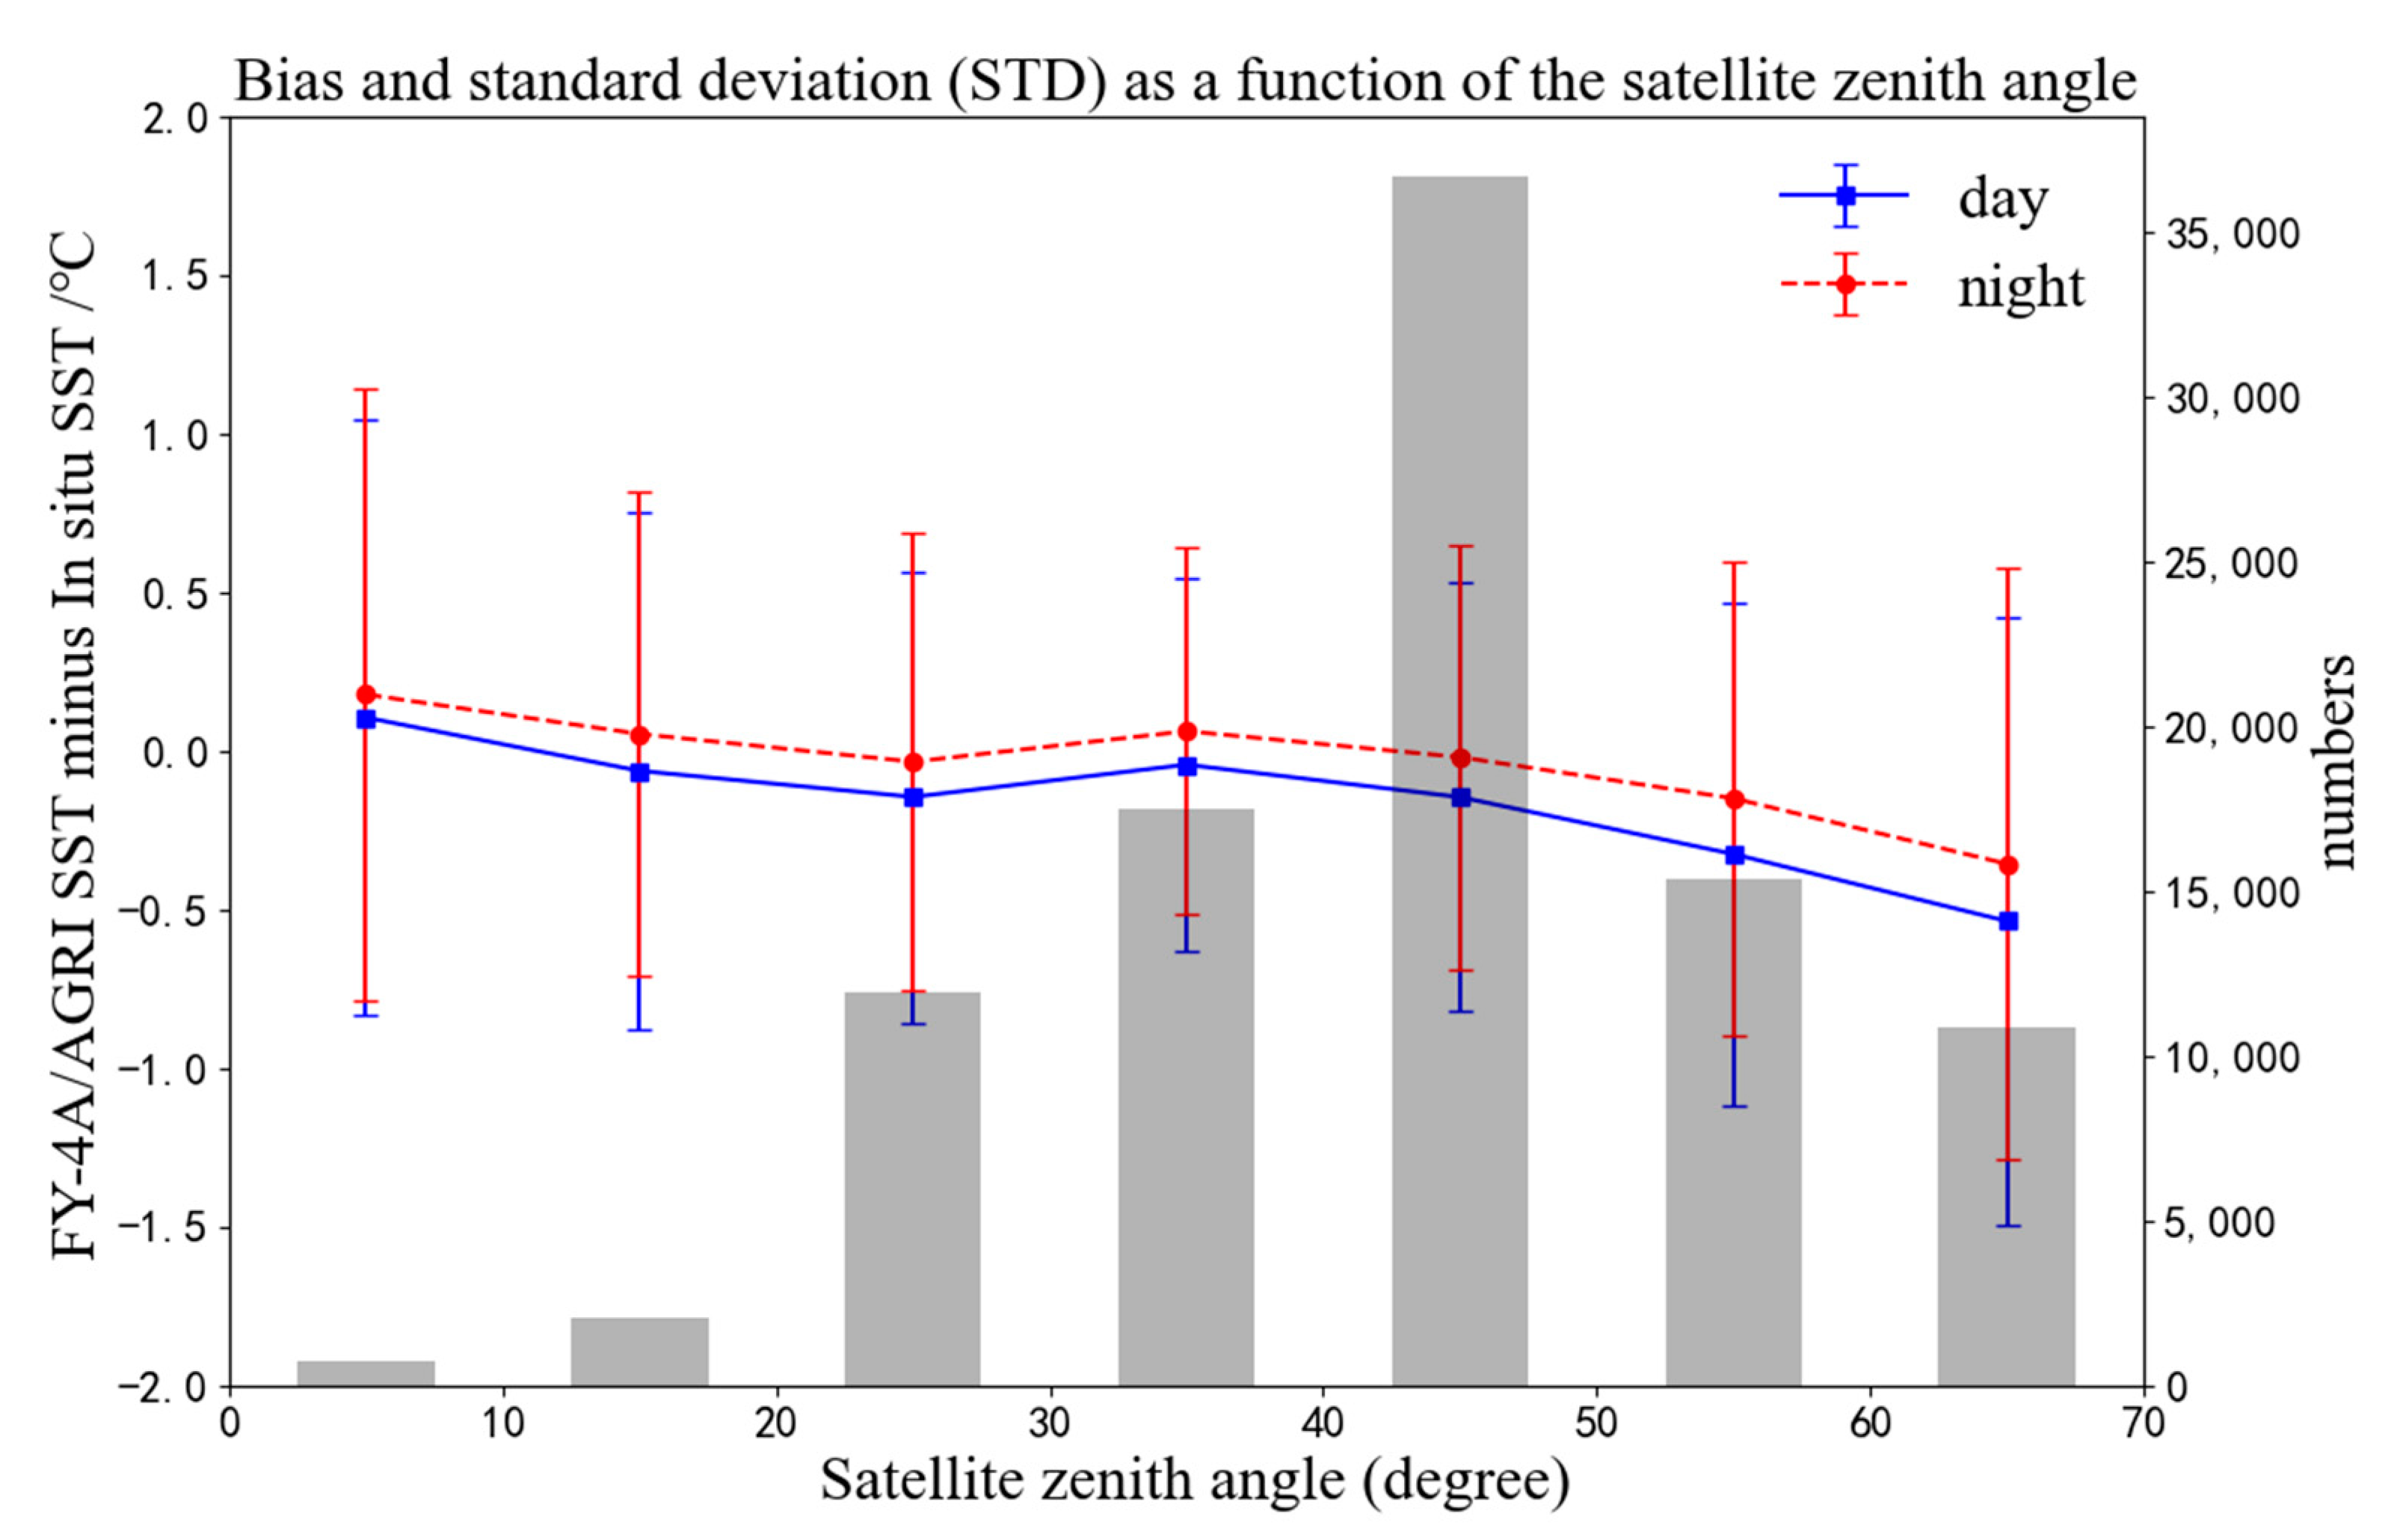
4.2. Relationship between SST Accuracy and Satellite Zenith Angle
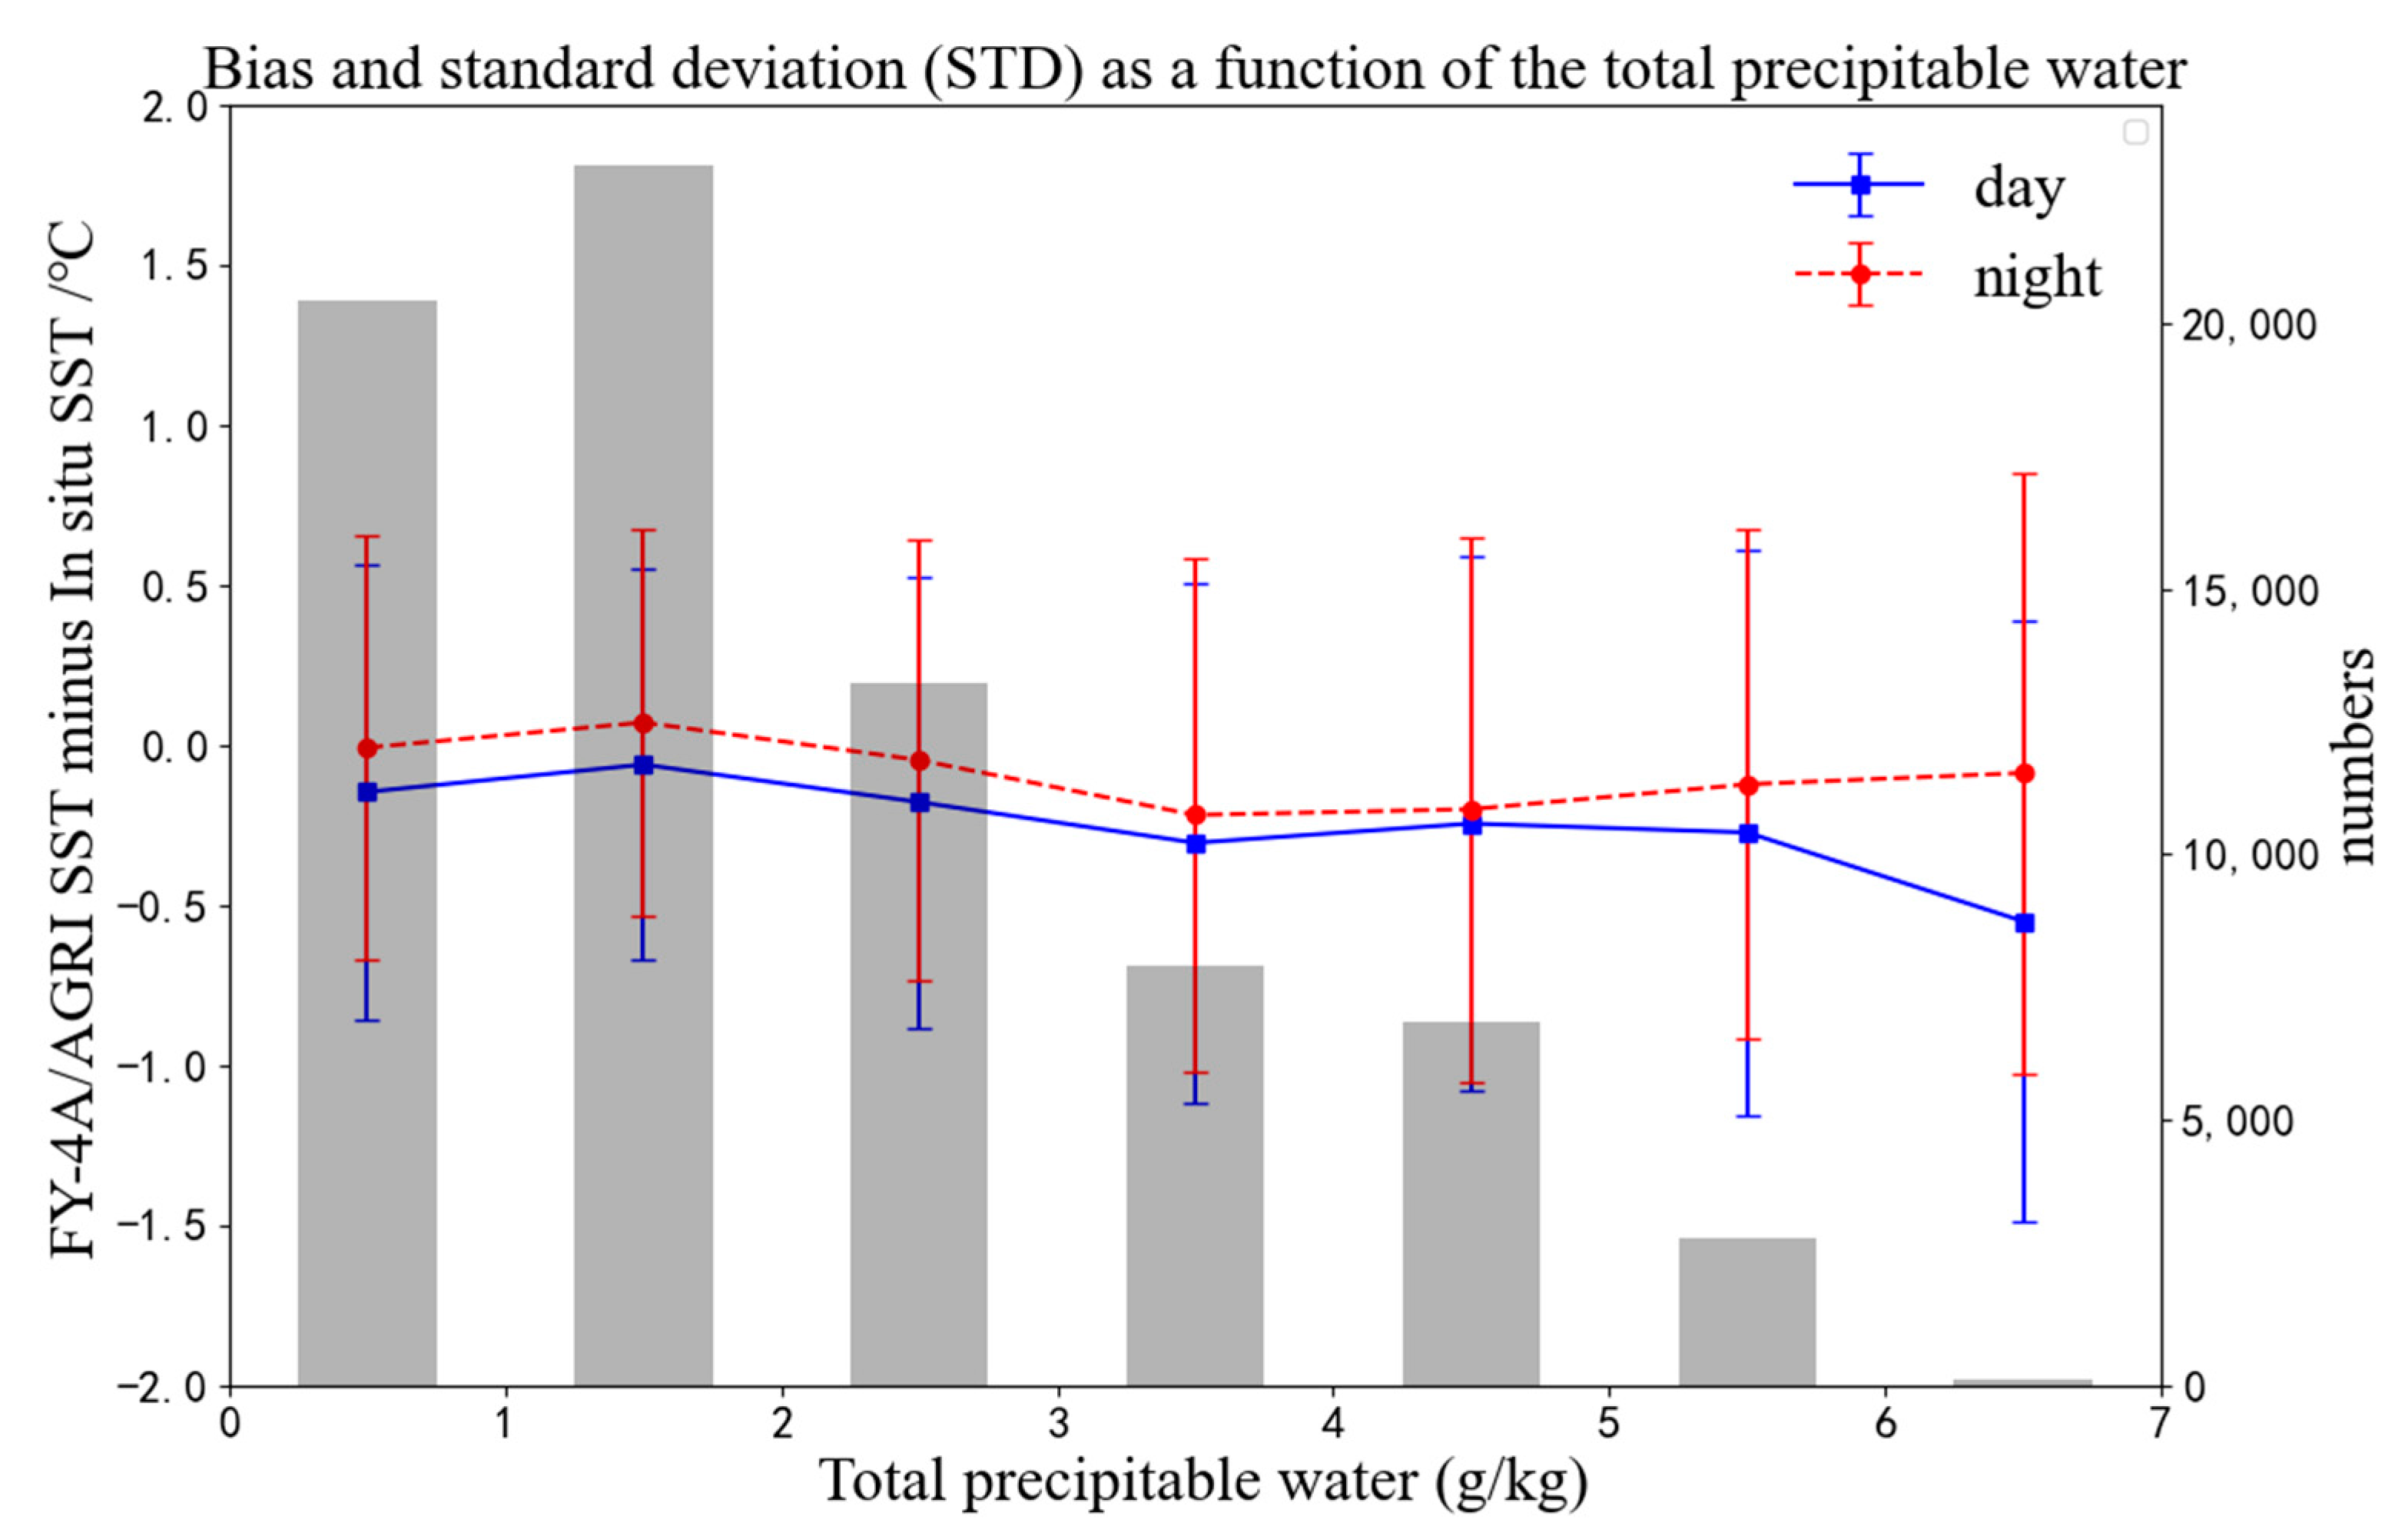
4.3. Relationship between SST Accuracy and Water Vapor
5. Conclusions
Author Contributions
Funding
Data Availability Statement
Acknowledgments
Conflicts of Interest
References
- Wanninkhof, R.; Asher, W.E.; Ho, D.T.; Sweeney, C.; McGillis, W.R. Advances in quantifying air-sea gas exchange and environmental forcing. Ann. Rev. Mar. Sci. 2009, 1, 213–244. [Google Scholar] [CrossRef]
- Tandeo, P.; Chapron, B.; Ba, S.; Autret, E.; Fablet, R. Segmentation of mesoscale ocean surface dynamics using satellite SST and SSH observations. IEEE Trans. Geosci. Remote Sens. 2014, 52, 4227–4235. [Google Scholar] [CrossRef]
- Martin, S. An Introduction to Ocean Remote Sensing, 2nd ed.; Cambridge University Press: Cambridge, UK, 2014; pp. 219–241. [Google Scholar]
- Maul, G.A. Application of GOES visible-infrared data to quantifying mesoscale ocean surface temperatures. J. Geophys. Res. 1981, 86, 8007–8021. [Google Scholar] [CrossRef]
- Bates, J.J.; Smith, W.L. Sea surface temperature: Observations from geostationary satellites. J. Geophys. Res. 1985, 90, 11609. [Google Scholar] [CrossRef]
- Minnett, P.J.; Álvera-Azcárate, A.; Chin, T.M.; Corlett, G.K.; Gentemann, C.L.; Karagali, I.; Li, X.; Marsouin, A.; Marullo, S.; Maturi, E.; et al. Half a century of satellite remote sensing of sea-surface temperature. Remote Sens. Environ. 2019, 233, 111366. [Google Scholar] [CrossRef]
- Maturi, E.; Harris, A.; Merchant, C.; Mittaz, J.; Potash, B.; Meng, W.; Sapper, J. NOAA’s sea surface temperature products from operational geostationary satellites. Bull. Am. Meteorol. Soc. 2008, 89, 1877–1888. [Google Scholar] [CrossRef]
- Merchant, C.J.; Harris, A.R.; Maturi, E.; Embury, O.; MacCallum, S.N.; Mittaz, J.; Old, C.P. Sea Surface Temperature Estimation from the Geostationary Operational Environmental Satellite-12 (GOES-12). J. Atmos. Oceanic Technol. 2009, 26, 570–581. [Google Scholar] [CrossRef]
- Azevedo, M.H.; Rudorff, N.; Aravéquia, J.A. Evaluation of the ABI/GOES-16 SST Product in the Tropical and Southwestern Atlantic Ocean. Remote Sens. 2021, 13, 192. [Google Scholar] [CrossRef]
- Ignatov, A. GOES-R Advanced Baseline Imager (ABI) Algorithm Theoretical Basis Document for Sea Surface Temperature. NOAA NESDIS Center for Satellite Applications and Research. 2010. Available online: https://www.star.nesdis.noaa.gov/goesr/documents/ATBDs/Baseline/ATBD_GOES-R_SST-v2.0_Aug2010.pdf (accessed on 20 August 2023).
- Petrenko, B.; Ignatov, A.; Kihai, Y.; Dash, P. Sensor-specific error statistics for SST in the advanced clear-sky processor for oceans. J. Atmos. Ocean. Technol. 2016, 33, 345–359. [Google Scholar] [CrossRef]
- Luo, B.; Minnett, P.J. Skin sea surface temperatures from the GOES-16 ABI validated with those of the shipborne M-AERI. IEEE Trans. Geosci. Remote Sens. 2021, 59, 9902–9913. [Google Scholar] [CrossRef]
- Tanahashi, S.; Kawamura, H.; Matsuura, T.; Takajashi, T.; Yusa, H. Improved estimates of wide-ranging sea surface temperature from GMS S-VISSR data. J. Oceanogr. 2000, 56, 345–358. [Google Scholar] [CrossRef]
- Kawamura, H.; Qin, H.; Sakaida, F.; Setiawan, R.Y. Hourly sea surface temperature retrieval using the Japanese geostationary satellite, multi-functional transport satellite (MTSAT). J. Oceanogr. 2010, 66, 61–70. [Google Scholar] [CrossRef]
- Ditri, A.; Minnett, P.; Liu, Y.; Kilpatrick, K.; Kumar, A. The accuracies of Himawari-8 and MTSAT-2 sea-surface temperatures in the tropical Western Pacific Ocean. Remote Sens. 2018, 10, 212. [Google Scholar] [CrossRef]
- Bessho, K.; Date, K.; Hayashi, M.; Ikeda, A.; Imai, T.; Inoue, H.; Kumagai, Y.; Miyakawa, T.; Murata, H.; Ohno, T.; et al. An introduction to Himawari-8/9—Japan’s new-generation geostationary meteorological satellites. J. Meteorol. Soc. Jpn. 2016, 94, 151–183. [Google Scholar] [CrossRef]
- Kurihara, Y.; Murakami, H.; Kachi, M. Sea surface temperature from the new Japanese geostationary meteorological Himawari-8 satellite. Geophys. Res. Lett. 2016, 43, 1234–1240. [Google Scholar] [CrossRef]
- Kramar, M.; Ignatov, A.; Petrenko, B.; Kihai, Y.; Dash, P. Near Real Time SST Retrievals from Himawari-8 at NOAA Using ACSPO System. In Proceedings of the Ocean Sensing and Monitoring VIII SPIE, Baltimore, MD, USA, 17–21 April 2016; Available online: https://www.star.nesdis.noaa.gov/pub/sod/osb/mkramar/paper_SPIE16/07/SPIE_Proc_9827-21_Kramar.pdf (accessed on 20 August 2023).
- Beggs, H. Ch 14: Temperature. In Earth Observation: Data Processing and Applications.; Harrison, B.A., Anstee, J.A., Dekker, A., Phinn, S., Mueller, N., Byrne, G., Eds.; CRCSI: Melbourne, Australia, 2020; Volume 3B, Applications—Surface Waters; pp. 245–279. [Google Scholar]
- Kusuma, D.W.; Murdimanto, A.; Aden, L.Y.; Sukresno, B.; Jatisworo, D.; Hanintyo, R. Sea surface temperature dynamics in Indonesia. IOP Conf. Ser. Earth Environ. Sci. 2017, 98, 012038. [Google Scholar] [CrossRef]
- Sukresno, B.; Hanintyo, R.; Kusuma, D.W.; Jatisworo, D.; Murdimanto, A. Three-way error analysis of sea surface temperature (SST) between Himawari-8, buoy, and MUR SST in Savu Sea. Int. J. Remote Sens. Earth Sci. 2018, 15, 25. [Google Scholar] [CrossRef]
- Yang, M.L.; Guan, L.; Beggs, H.; Morgan, N.; Kurihara, Y.; Kachi, M. Comparison of Himawari-8 AHI SST with shipboard skin SST measurements in the Australian region. Remote Sens. 2020, 12, 1237. [Google Scholar] [CrossRef]
- Tu, Q.; Hao, Z. Validation of sea surface temperature derived from Himawari-8 by JAXA. IEEE J. Sel. Top. Appl. Earth Obs. Remote Sens. 2020, 13, 448–459. [Google Scholar] [CrossRef]
- Wang, P.; Zhu Ge, X.Y.; Chen, B.J.; Lu, Y.L.; Xiao, Y.X.; Xia, F. Retrieval of sea surface temperature in all sky conditions based on AHI observations. J. Meteorol. Sci. 2020, 40, 249–256. (In Chinese) [Google Scholar]
- Hsu, P.C. Evaluation of wind and solar insolation influence on ocean near-surface temperature from in situ observations and the geostationary Himawari-8 satellite. Remote Sens. 2022, 14, 4975. [Google Scholar] [CrossRef]
- Aminou, D. MSG’s SEVIRI Instrument. ESA Bull. 2002, 111, 15–17. [Google Scholar]
- Schmid, J. The SEVIRI Instrument. In Proceedings of the 2000 EUMETSAT Meteorological Satellite Data User’s Conference, Bologna, Italy, 29 May–2 June 2000; Available online: https://www-cdn.eumetsat.int/files/2020-04/pdf_ten_msg_seviri_instrument.pdf (accessed on 20 August 2023).
- Le Borgne, P.; Legendre, G.; Péré, S. Comparison of MSG/SEVIRI and drifting buoy derived diurnal warming estimates. Remote Sens. Environ. 2012, 124, 622–626. [Google Scholar] [CrossRef]
- Castro, S.L.; Wick, G.A.; Buck, J.J.H. Comparison of diurnal warming estimates from unpumped Argo data and SEVIRI satellite observations. Remote Sens. Environ. 2014, 140, 789–799. [Google Scholar] [CrossRef]
- Tyagi, G.; Babu, K.N.; Mathur, A.K.; Solanki, H.A. INSAT-3D and MODIS retrieved sea surface temperature validation and assessment over waters surrounding the Indian subcontinent. Int. J. Remote Sens. 2018, 39, 1575–1592. [Google Scholar] [CrossRef]
- Woo, H.J.; Park, K.A.; Li, X.; Lee, E.Y. Sea surface temperature retrieval from the first Korean geostationary satellite COMS data: Validation and error assessment. Remote Sens. 2018, 10, 1916. [Google Scholar] [CrossRef]
- Jiang, G.; Liu, R. Retrieval of sea and land surface temperature from SVISSR/FY-2C/D/E measurements. IEEE Trans. Geosci. Remote Sens. 2014, 52, 6132–6140. [Google Scholar] [CrossRef]
- Yang, J.; Zhang, Z.; Wei, C.; Lu, F.; Guo, Q. Introducing the new generation of Chinese geostationary weather satellites, Fengyun-4. Bull. Am. Meteorol. Soc. 2017, 98, 1637–1658. [Google Scholar] [CrossRef]
- Zhang, P.; Guo, Q.; Chen, B.Y.; Feng, X. The Chinese next-generation geostationary meteorological satellite FY-4 compared with the Japanese himawari-8/9 satellites. Adv. Meteorol. Sci. 2015, 6, 1–2016. [Google Scholar]
- Min, M.; Wu, C.Q.; Li, C.; Liu, X.; Xu, N.; Wu, X.; Chen, L.; Wang, F.; Sun, F.; Qin, D.; et al. Developing the scienceproduct algorithm testbed for Chinese next-generation geostationary meteorological satellites: Fengyun-4 series. J. Meteor. Res. 2017, 31, 708–719. [Google Scholar] [CrossRef]
- Cui, P.; Wang, S.J.; Lu, F.; Xiao, M. FY-4A/AGRI sea surface temperatures product and quality inspection. J. Appl. Meteorol. 2023, 34, 257–269. (In Chinese) [Google Scholar]
- Li, Q.; He, Q.; Chen, C. Retrieval of daily mean VIIRS SST products in China seas. Remote Sens. 2021, 13, 5158. [Google Scholar] [CrossRef]
- He, Q.J.; Hu, X.; Wu, Y.W. Evaluation and improvement of FY-4A/AGRI sea surface temperature data. IEEE J. Sel. Top. Appl. Earth Obs. Remote Sens. 2023, 16, 267–277. [Google Scholar] [CrossRef]
- Wang, Y.Z.; Liu, H.L.; Zhang, Y.; Duan, M.Z.; Tang, S.H.; Deng, X.B. Validation of FY-4A AGRI layer precipitable water products using radiosonde data. Atmos. Res. 2021, 253, 105502. [Google Scholar] [CrossRef]
- Xu, F.; Ignatov, A. In situ SST quality monitor (iQuam). J. Atmos. Ocean. Technol. 2014, 31, 164–180. [Google Scholar] [CrossRef]
- He, X.W.; Xu, N.; Feng, X.H.; Hu, X.Q.; Xu, H.L.; Peng, Y. Assessing Radiometric Calibration of FY-4A/AGRI Thermal Infrared Channels Using CrIS and IASI. IEEE Trans. Geosci. Remote Sens. 2021, 60, 1–12. [Google Scholar] [CrossRef]
- O’Carroll, A.G.; Eyre, J.R.; Saunders, R.W. Three-Way Error Analysis between AATSR, AMSR-E, and In Situ Sea Surface Temperature Observations. J. Atmos. Ocean. Technol. 2008, 25, 1197–1207. [Google Scholar] [CrossRef]
- Gentemann, C.L. Three way validation of MODIS and AMSR-E sea surface temperatures. J. Geophys. Res. Oceans 2014, 119, 2583–2598. [Google Scholar] [CrossRef]
- O’Carroll, A.G.; August, T.; Le Borgne, P.; Marsouin, A. The accuracy of SST retrievals from Metop-A IASI and A VHRR using the EUMETSAT OSI-SAF matchup dataset. Remote Sens. Environ. 2012, 126, 184–194. [Google Scholar] [CrossRef]


| N | Bias (°C) | Median (°C) | STD (°C) | RSD (°C) | RMSE (°C) | |
|---|---|---|---|---|---|---|
| Daytime | ||||||
| AGRI SST-Buoy SST | 176,178 | −0.12 | −0.05 | 0.76 | 0.68 | 0.77 |
| AHI SST-Buoy SST | −0.15 | −0.13 | 0.58 | 0.44 | 0.61 | |
| AGRI SST-AHI SST | 0.04 | 0.10 | 0.78 | 0.70 | 0.78 | |
| Nighttime | ||||||
| AGRI SST-Buoy SST | 150,152 | −0.00 | 0.05 | 0.78 | 0.72 | 0.78 |
| AHI SST-Buoy SST | −0.30 | −0.25 | 0.60 | 0.45 | 0.67 | |
| AGRI SST-AHI SST | 0.30 | 0.34 | 0.81 | 0.76 | 0.86 | |
| σ (°C) | ||||||||
|---|---|---|---|---|---|---|---|---|
| Daytime | Nighttime | |||||||
| year | 2019 | 2020 | 2021 | 2019–2021 | 2019 | 2020 | 2021 | 2019–2021 |
| AGRI | 0.55 | 0.71 | 0.64 | 0.65 | 0.59 | 0.75 | 0.61 | 0.67 |
| AHI | 0.45 | 0.44 | 0.42 | 0.43 | 0.46 | 0.44 | 0.45 | 0.45 |
| Buoy | 0.41 | 0.39 | 0.38 | 0.39 | 0.39 | 0.39 | 0.39 | 0.39 |
Disclaimer/Publisher’s Note: The statements, opinions and data contained in all publications are solely those of the individual author(s) and contributor(s) and not of MDPI and/or the editor(s). MDPI and/or the editor(s) disclaim responsibility for any injury to people or property resulting from any ideas, methods, instructions or products referred to in the content. |
© 2023 by the authors. Licensee MDPI, Basel, Switzerland. This article is an open access article distributed under the terms and conditions of the Creative Commons Attribution (CC BY) license (https://creativecommons.org/licenses/by/4.0/).
Share and Cite
Yang, C.; Guan, L.; Sun, X. Comparison of FY-4A/AGRI SST with Himawari-8/AHI and In Situ SST. Remote Sens. 2023, 15, 4139. https://doi.org/10.3390/rs15174139
Yang C, Guan L, Sun X. Comparison of FY-4A/AGRI SST with Himawari-8/AHI and In Situ SST. Remote Sensing. 2023; 15(17):4139. https://doi.org/10.3390/rs15174139
Chicago/Turabian StyleYang, Chang, Lei Guan, and Xiaohui Sun. 2023. "Comparison of FY-4A/AGRI SST with Himawari-8/AHI and In Situ SST" Remote Sensing 15, no. 17: 4139. https://doi.org/10.3390/rs15174139
APA StyleYang, C., Guan, L., & Sun, X. (2023). Comparison of FY-4A/AGRI SST with Himawari-8/AHI and In Situ SST. Remote Sensing, 15(17), 4139. https://doi.org/10.3390/rs15174139