Article

A Comprehensive Multi-Metric Index for Health Assessment of the Poyang Lake Wetland

1
Key Laboratory of Poyang Lake Wetland and Watershed Research (Jiangxi Normal University), Ministry of Education, Nanchang 330022, China
2
School of Geography and Environment, Jiangxi Normal University, Nanchang 330022, China
3
Analytical & Testing Center, Jiangxi Normal University, Nanchang 330022, China
4
School of Life Sciences, Jiangxi Normal University, Nanchang 330022, China
*
Author to whom correspondence should be addressed.
Remote Sens. 2023, 15(16), 4061; https://doi.org/10.3390/rs15164061
Submission received: 2 August 2023 / Accepted: 15 August 2023 / Published: 17 August 2023

Abstract

:
The Poyang Lake wetland is home to many unique and threatened species. However, it has been severely degraded in recent decades due to the joint effects of human influence and climate change. Here we establish a wetland health index (WHI) for Poyang Lake, which considers five types of attributes (biological, water quality, sediment, land use and remote sensing, and socio-economic attributes) of the wetland to evaluate wetland conditions. Forty-nine variables across five categories were assembled as candidate metrics for the WHI through field surveys conducted in 2019 at 30 sample sites. Principal component analyses were performed to identify the most important variables in each of the five categories as the primary metrics of each index category (e.g., biological index). Eighteen variables were finally selected from the five categories to construct the WHI. The WHI scores varied from 0.34 to 0.80 at the 30 sample sites, with a mean of 0.55. The Poyang Lake wetland is generally in fair condition according to our WHI scores. Sample sites where connected rivers flow into the lake were assessed to be in a poor condition, highlighting the importance of reducing pollution input from rivers for wetland conservation. Scores of individual indices of the five categories were not highly correlated (0.29 ≤ pairwise Spearman’s r ≤ 0.69), suggesting that information provided by each index is different and might be complementary. The composite WHI as well as the individual category indices can provide comprehensive information on wetland conditions that would facilitate the development of more targeted and effective strategies for wetland management.

1. Introduction

Wetlands provide a variety of irreplaceable ecosystem services on Earth [1]. However, wetlands have been severely threatened due to accelerated human disturbance and climate change [2]. Nearly 50% of all wetlands worldwide have been lost or converted into other land use types [3]. The remaining wetlands are at high risk of degradation owing to unsustainable use of water resources, environmental pollution, and biological invasion [4]. The development of tools for wetland status assessment is a critical priority for wetland management and conservation [5].
The concept of ecosystem health has been proposed for the improved assessment and management of ecosystems [6]. There are many different definitions for ecosystem health, the most widely accepted of which says that a healthy ecosystem has the ability to maintain its structure and function over time in the face of external stress [7,8]. Various indicators have been proposed to quantify wetland health [9,10]. Biological indicators including species, communities, and even biological processes are highly emphasized in current methods for ecosystem health assessment [11]. This is because biological organisms are sensitive to changes in physico-chemical and biological conditions, and exhibit direct and indirect biotic effects of environmental stresses while many physical or chemical investigations are unable to do so [12]. For example, the index of biotic integrity is usually composed of several attributes of biological communities (e.g., species richness and number of invasive species) that respond to environmental stresses in predictive ways [13].
In addition, water and soil are the most basic elements in an ecosystem. Water quality and soil parameters (especially nutrient parameters) are routinely measured in environmental monitoring programs, and are also essential components in wetland health assessment [14]. Landscape and land use patterns have been considered closely linked with ecosystem health [15]. The deterioration of ecosystem health is attributed to the expansion of human-altered land use (including farmland and built-up land) and the degradation of natural land cover (e.g., forest and grassland) [16]. For example, Singh et al. [17] evaluated the wetland health of a Ramsar site (Kaabar Tal) in India using various landscape and remote sensing variables, such as Shannon’s diversity index, patch density, and the normalized difference vegetation index. Socio-economic development including urbanization, population growth, and intensification of agriculture is the primary driving force for landscape and land use changes, and is also a fundamental factor responsible for wetland loss and degradation [18].
The above-mentioned factors have complex influences on the condition of an ecosystem, and multiple types of indicators for wetland health assessment have been considered. For example, the US Environmental Protection Agency assesses coastal wetland health of the Great Lakes using a three-level approach. At each of the levels, either landscape or site-specific physico-chemical and biological variables are collected for wetland health assessment (https://www.epa.gov/wetlands/wetlands-monitoring-and-assessment, accessed on 20 March 2021). Chen et al. [19] evaluated the health of wetlands in northern China based on a comprehensive dataset on water quality, soil properties, biological communities, landscape, and socio-economic development. A large number of variables are usually involved in wetland health assessment, and measurement of these variables is laborious, costly, and time consuming. There may also be problems such as duplication of information when the variables are dependent on each other or strongly correlated. Identifying a subset of variables that are relatively independent of each other but still contain a large proportion of variance in the original dataset can be a more efficient strategy for wetland health assessment.
Poyang Lake is the largest freshwater lake in China and is also one of the only two large lakes that has direct hydrological connections with the Yangtze River. The water level of Poyang Lake significantly fluctuates in different seasons; reaching as low as 6 m in the dry season and a maximum of 22 m in the rainy season, as a result of the large seasonal variations of rainfall in its catchment as well as the large seasonal water level variations of the Yangtze River [20]. The lakebed is exposed in winter, which provides indispensable habitats for many wetland organisms especially wintering migratory birds. The Poyang Lake wetland is recognized as one of the 35 protection priority areas in China owing to its critical role in biodiversity conservation [21]. However, the Poyang Lake region is densely populated and has experienced fast economic development in past decades. This rapid socio-economic development has brought a number of threats to the Poyang Lake wetland including water and soil pollution, land reclamation, sand mining, and recreation. Current available methods for wetland health assessment in Poyang Lake are mostly based on single biological or landscape metrics, whereas a comprehensive index that takes account of a majority of important elements of the wetland ecosystem would be preferred. Here, we develop five distinct indices (i.e., biological, water quality, sediment, land use and remote sensing, and socio-economic indices) for Poyang Lake to evaluate the wetland conditions from different perspectives. These indices are then aggregated into a comprehensive index to give an overall evaluation of the wetland health.

2. Materials and Methods
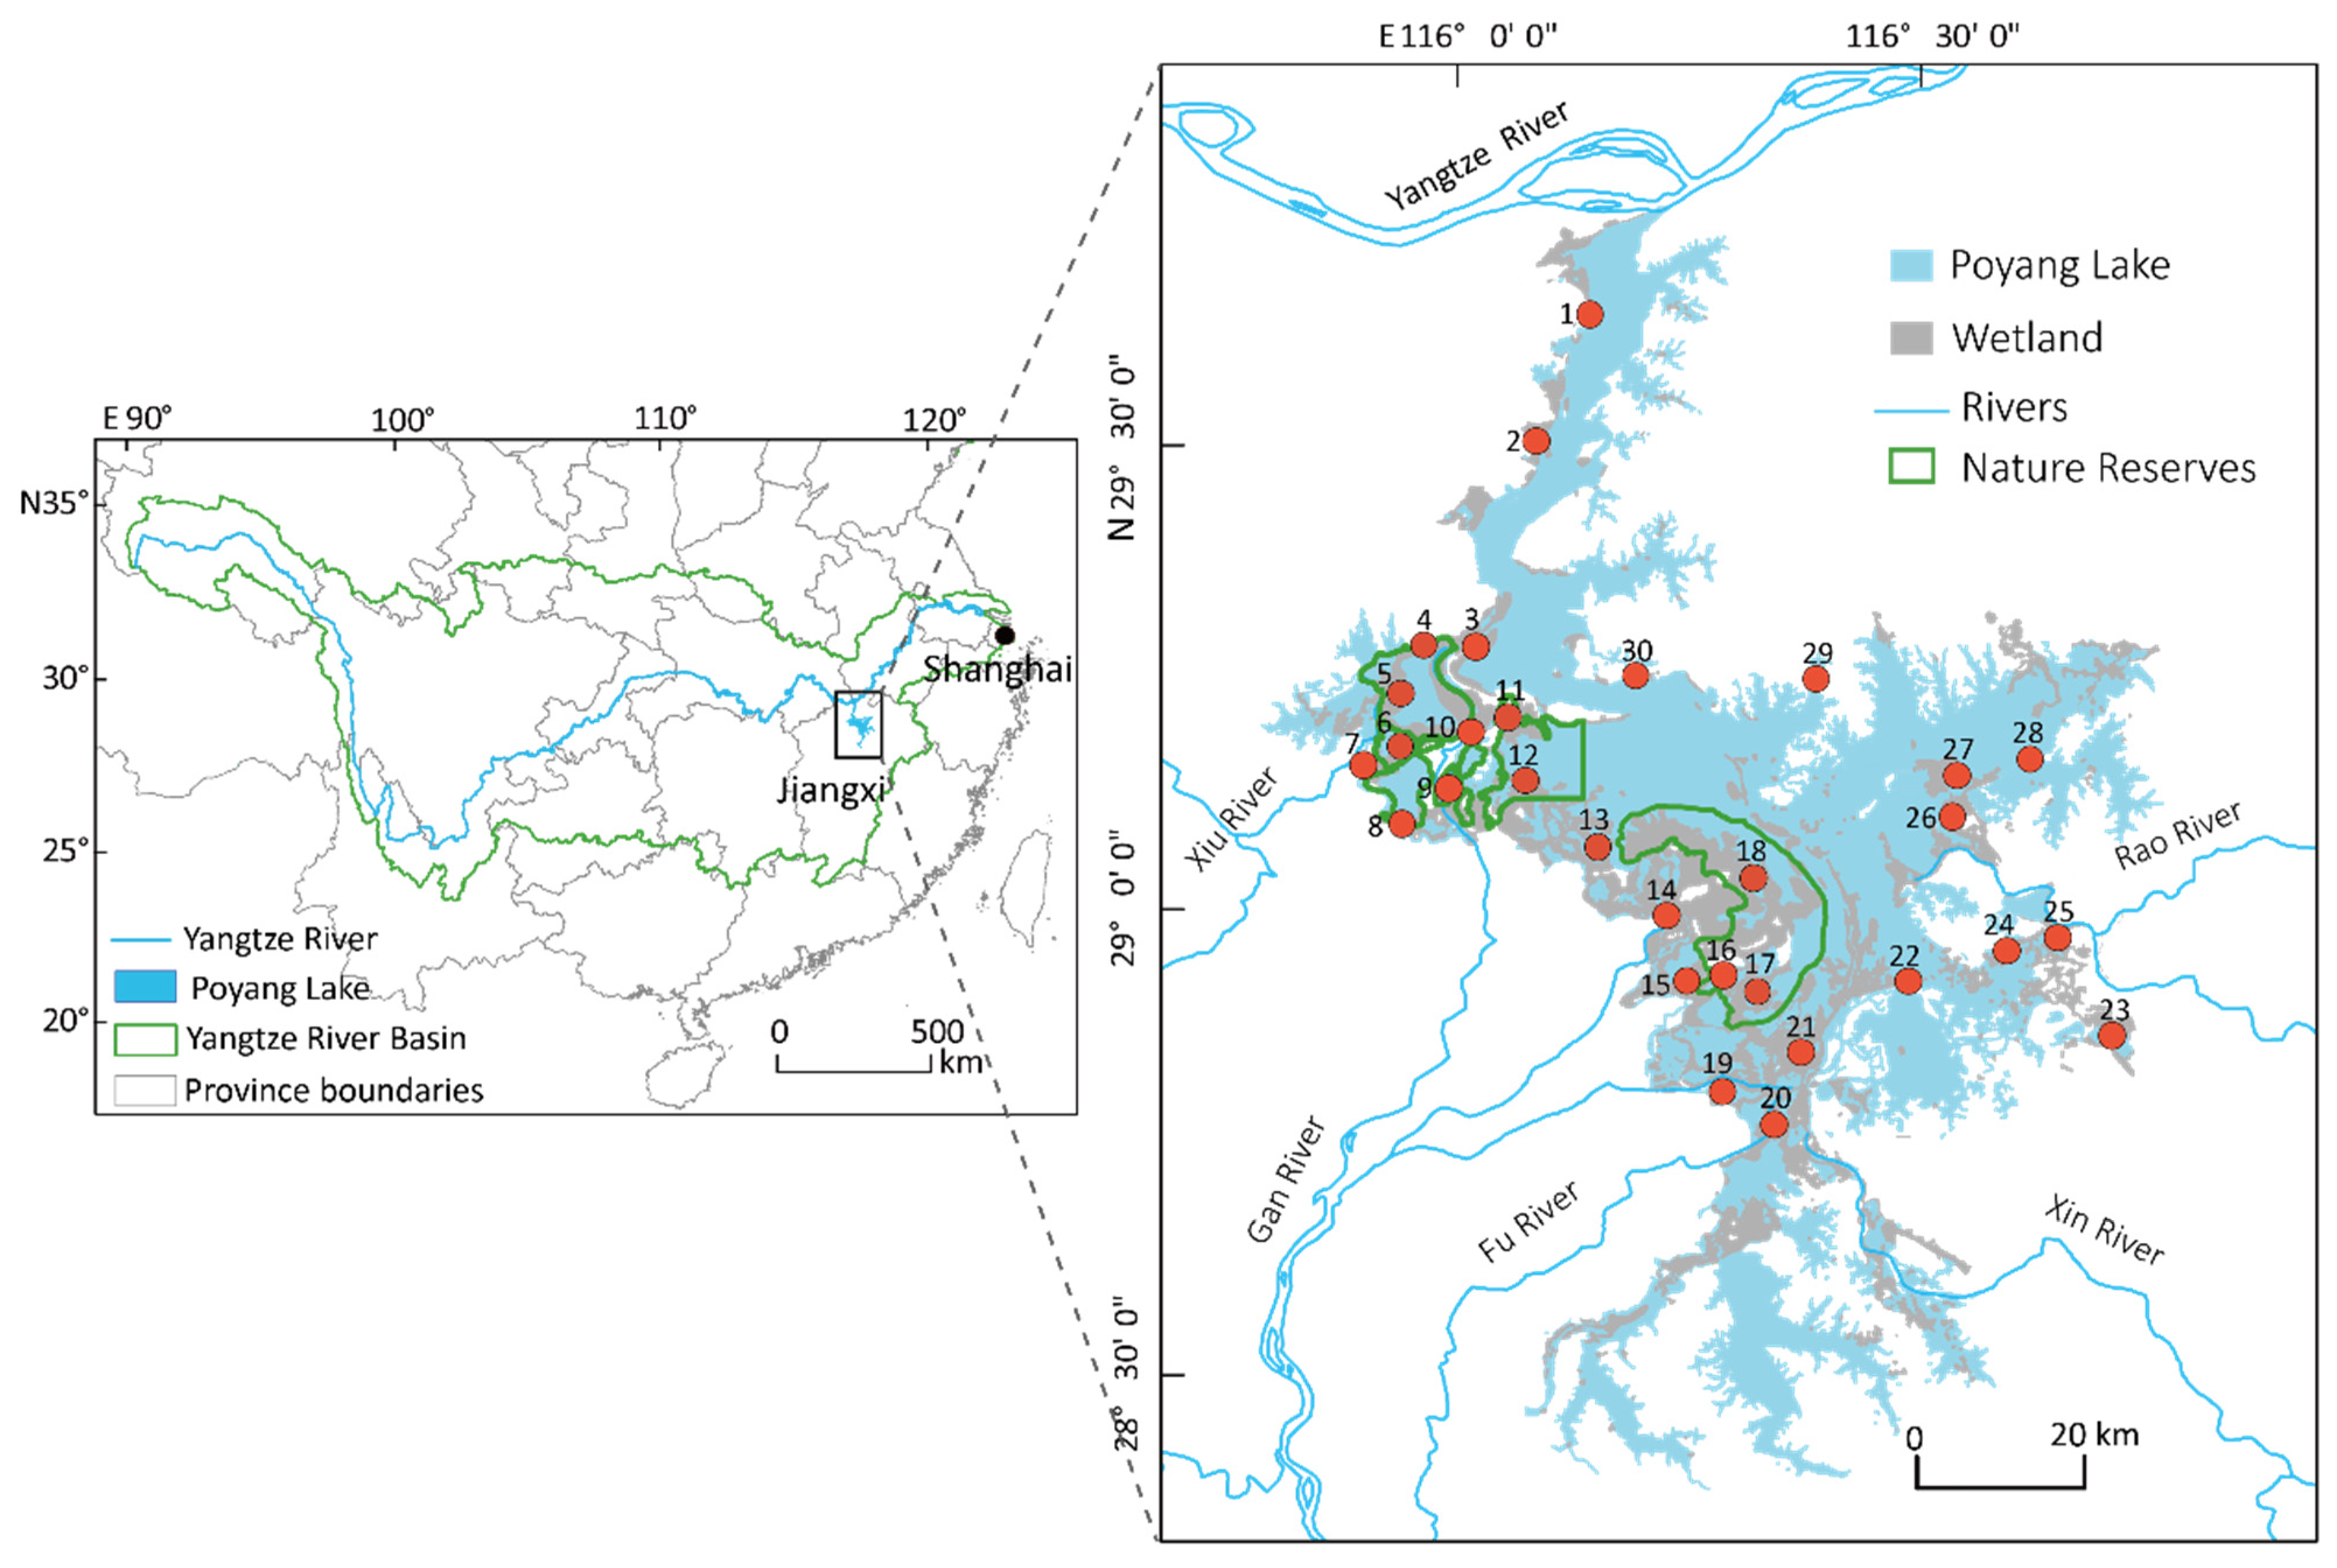
2.1. Study Area

Poyang Lake is situated south of the lower reach of the Yangtze River, and is located within the northern part of Jiangxi Province (Figure 1). Five major rivers (Xiu, Gan, Fu, Rao, and Xin Rivers) flow into the lake that discharges into the Yangtze River through a northern channel [20]. Annual precipitation is about 1500 mm in this region, most of which occurs in summer. The surface water area of the lake exceeds 4000 km2 in summer, while it is less than 1000 km2 in winter. The wetland areas exposed in winter are home of many unique biological organisms especially wintering migratory birds, including 98% of all white cranes, 95% of all oriental white storks, and 70% of all white-napped cranes in the world [22].
The Poyang Lake region contains two major cities (Nanchang and Jiujiang cities) and ten counties which are densely populated at a population density of more than 400 people per km2. The economy in this region has rapidly grown, increasing at a rate of nearly 9% per year [23]. This region has become one of the most economically active regions of southern China. Land use in this region consists of forest, farmland, built-up land, and open waters, among which forest and farmland are the main types of land use [24]. Agriculture is highly intensified in this region, and reclaiming farmland from the lake has significantly reduced wetland area and further accelerated the wetland ecosystem degradation.

2.2. Field Surveys and Data Collections

2.2.1. Biological Variables

Macrophytes and benthic macroinvertebrates are among the most abundant and diverse biological groups in Poyang Lake. Macrophytes are primary producers, while benthic macroinvertebrates play critical roles in promoting detritus decomposition and nutrient cycling. They are immobile or have weak mobility, and are very sensitive to environmental changes in their habitats; thus, they are the most widely applied indicator taxa for wetland biotic integrity [25]. Five attributes of macrophyte assemblages and six attributes of benthic macroinvertebrate assemblages that have been shown to respond to stress gradients in predictive ways were selected as the indicators for biotic integrity in the Poyang Lake wetland. The macrophyte metrics were species richness, numbers of tolerant species, invasive species, and submerged species, and the Shannon–Wiener index of macrophytes [26]. The benthic macroinvertebrate metrics included numbers of all taxa and predator taxa, density of benthic macroinvertebrates (number of individuals per 1 m2), the Shannon–Wiener index of benthic macroinvertebrates, average score per taxon (ASPT) index, and percent of Diptera taxa (relative to the total number of taxa) [27]. The ASPT index rates benthic families based on their sensitivity to dissolved oxygen depletion.
Field surveys were conducted at 30 sample sites during the spring (April and May) and autumn (September and October) of 2019. The sample sites were primarily selected through a randomization process. Factors such as site accessibility and inundation status were also considered, i.e., only sites that were accessible and located in seasonally flooded areas were included in the sample (Figure 1). Macrophytes have two growing periods in a year, i.e., one in spring and the other in autumn. This is because the above-ground parts of macrophytes that grow in spring die when they have experienced a long-term (more than two months) extremely high water level in summer (water depth > 4 m), and some species re-germinate after the water recedes in autumn.
Three transects from lake shore to deep water were set up for macrophyte surveys at each sample site. The distance between two transects was greater than 50 m. A transect was divided into two zones, i.e., meadow and aquatic vegetation zones. Five 1.0 m2 quadrats were equidistantly arranged along the transect in each zone. Every individual in the quadrat was identified to the species level, and the relative abundance of species was recorded as approximate coverage values.
Benthic macroinvertebrates at the water–sediment interface of each sample site were quantitatively collected by a D-frame dip net (mesh diameter 0.5 mm, diameter 30 cm, depth 16 cm). The water depth of the sampling area was between 5 cm and 1.50 m. The D-frame dip net swept an area of 2 × 2 m to collect benthic macroinvertebrates as a sample, and three samples were collected from each site. The samples were washed repeatedly with water to remove sediments. All benthic individuals in the leftovers were picked up and put into 250 mL plastic bottles and preserved with 95% ethanol. Samples of benthic macroinvertebrates were observed under an anatomical microscope or a light microscope, and the lowest taxon (usually species or genera) was identified as far as possible. All samples were counted and recorded after identification.

2.2.2. Water Quality Variables

Water pollution caused by agricultural runoff and domestic and industrial sewage discharges is one of the most prominent environmental problems in Poyang Lake [28]. Water quality surveys were carried out concurrently with biological sampling at the 30 sample sites. Water quality variables (i.e., pH, dissolved oxygen, electric conductivity, and chlorophyll a) were measured using handheld meters (YSI 6600 V2-4 data sonde, YSI Inc., Yellow Springs, OH, USA). Three bottles of 250 mL water were sampled at each sample site and stored in a refrigerated incubator. Total nitrogen, nitrate nitrogen, ammonium nitrogen, total phosphorus, total suspended solids, and biochemical oxygen demand in manganese were measured in the laboratory according to the “Water and Wastewater Monitoring Method” [29].

2.2.3. Sediment Variables

Sediments are the sinks of various pollutants that can be released into water bodies. Surface sediment (0–10 cm) was acquired using a Peterson mud picker as a sample, and three samples were collected at each sample site, which were spaced at least 50 m apart from each other. Sediment samples were dried in a freezing dryer, crushed, and homogenized using 100-mesh sieves. Total phosphorus, total nitrogen, total organic carbon, and heavy metal (four major pollutants, i.e., Zn, Cu, Cd, and Pb) contents were measured according to the “Protocols for Standard Observation and Measurement in Aquatic Ecosystems” [30].

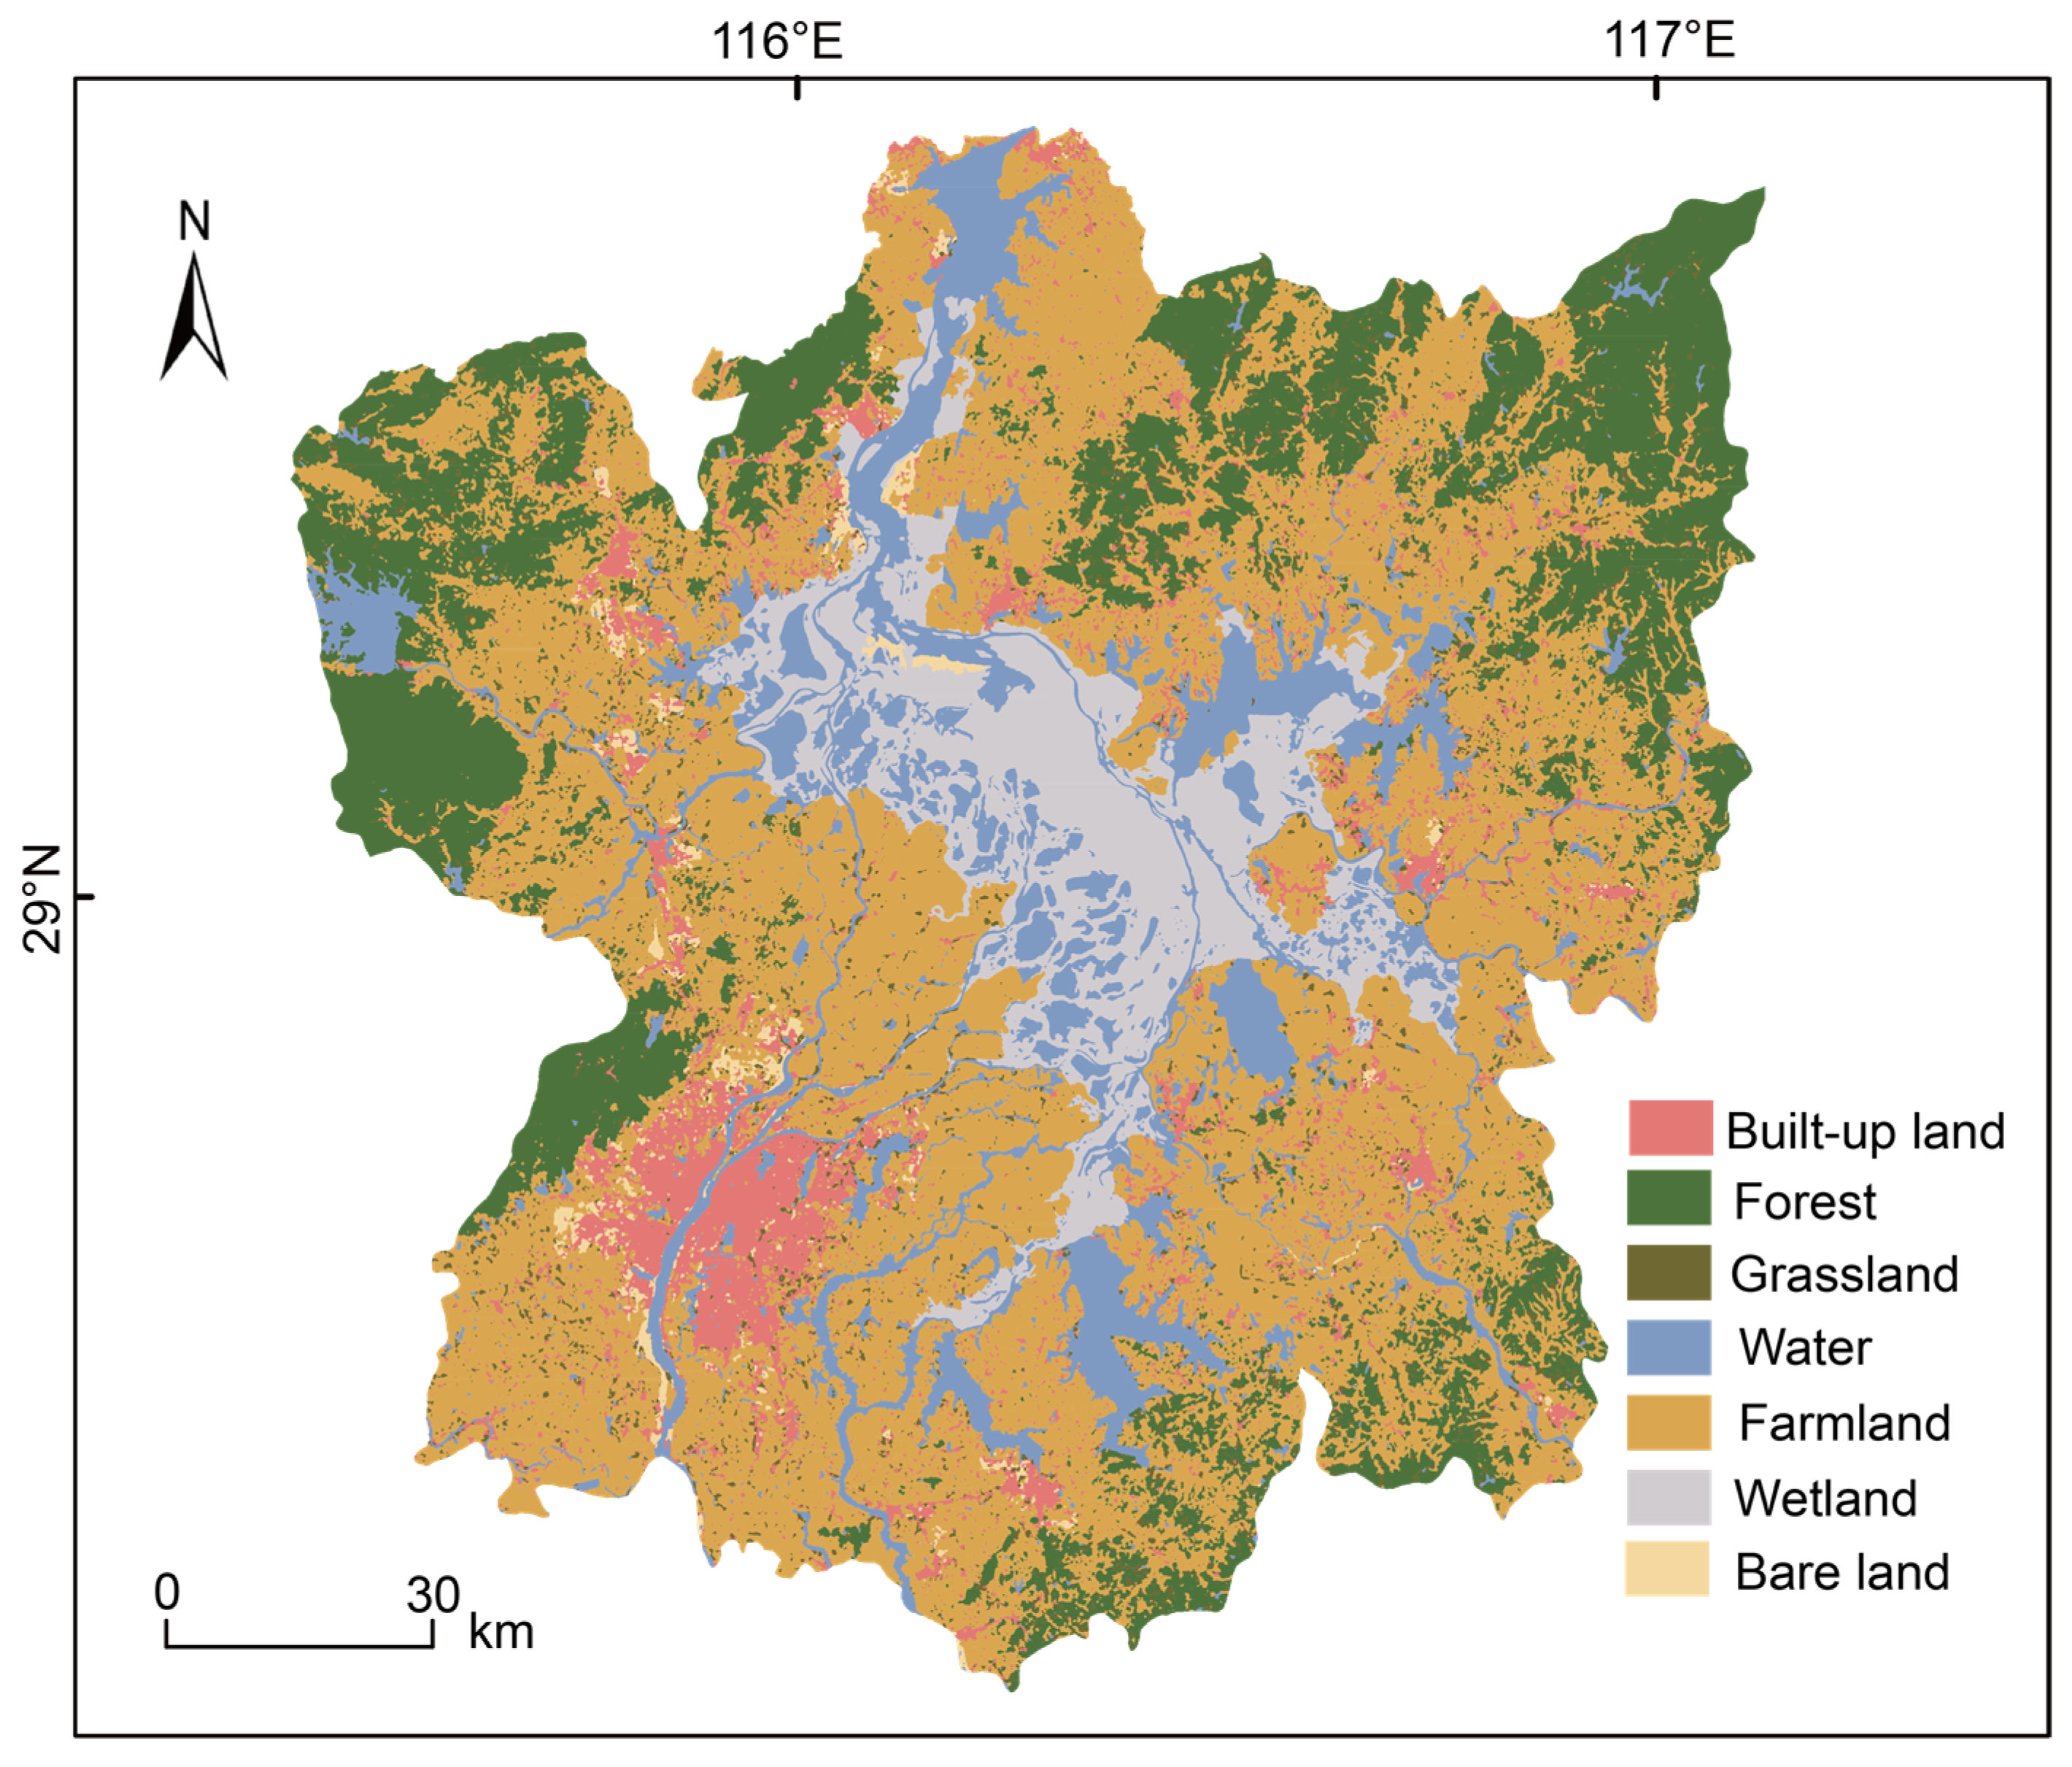
2.2.4. Land Use and Remote Sensing Variables

The upsurge of industrialization and urbanization has dramatically changed land use and landscape patterns in and around the Poyang Lake wetland. Land use and landscape modification can influence ecological processes including nutrient cycling, soil erosion, sediment transport, and primary production. Higher proportions of human-altered land cover (built-up land and farmland) and fragmented landscapes are usually associated with degraded ecosystems [15,31,32].
Landsat-8 OLI images of 2019 for the Poyang Lake region were acquired on the website of the United States Geological Survey (https://earthexplorer.usgs.gov, accessed on 25 June 2020) (Table 1). The images have a spatial resolution of 30 m, and only images with low cloud coverage (<5%) were processed for land use classification. Multi-band images (bands 2, 3, 4, and 8) were stacked to create a composite image. Radiometric correction was conducted by calibrating the offset, gain, and dark subtraction techniques. Atmospheric correction was performed to rectify the distortion caused by cloud cover, haze, and noise by using the FLAASH tool. Geometric correction was undertaken to avoid geometric distortion. The above image processing and corrections were made by using ENVI 5.3. Land use identification was carried out by using the maximum likelihood supervised classification. Ground truth data from 249 sites representing various types of land use in the Poyang Lake region were used as the training data in the supervised classification. A visual interpretation approach was employed to determine the land use of approximately 2% of the study area where the automatic classification was not successful in separating some classes. The land use was classified into seven categories, i.e., forest, farmland, built-up land, water, grassland, wetland, and bare land. Ground truth data from 120 sites that were independent of the training data were used to evaluate the accuracy of the land use classification.
The percent of forest, built-up land, and farmland within the 1-km buffer zone of each sample site was used as the primary metrics for wetland health. Land use within a 1-km buffer zone has important impacts on the environmental quality and biotic integrity of wetlands [34,35,36]. In addition, seven landscape variables, namely Shannon’s diversity index (SHDI), the connectance index (CONNECT), the aggregation index (AI), patch density (PD), the largest patch index (LPI), patch richness density (PRD), and mean patch size (AREA_MN), all of which have been previously used to assess wetland health in other regions [37,38,39,40] (Table 2), were also considered as candidate metrics for wetland health in Poyang Lake. These metrics generally reflect landscape fragmentation, the connectivity and aggregation of landscape patches, and the intensity of human-caused landscape changes, and were computed in Fragstats 4.2.
In addition, two remote sensing variables (i.e., normalized difference vegetation index (NDVI) and modified normalized difference built-up index (MNDBI)), which were used for wetland health assessment in other regions [38,41], were also considered in this study (Table 2). The NDVI measures the density of green vegetation cover and has been widely used for terrestrial ecosystem monitoring [42,43], while the MNDBI is a measure of impervious land cover [44]. The expansion of impervious land cover is one of the main causes of environmental degradation in the regions that have been experiencing rapid urbanization [45,46]. The modified normalized difference water index (MNDWI) was also evaluated as a potential indicator for wetland conditions, but it displayed weak correlations with human disturbance gradients [35], and was thus not included as a candidate metric in this study. The NDVI and MNDBI were calculated in the Google Earth Engine (GEE) platform using the equations shown in Table 2 based on the Sentinel-2A MSI images acquired in 2019 [33] (Table 1). Sentinel-2 images have a higher spatial resolution of 10–20 m compared to Landsat 8 images. This higher resolution enables Sentinel-2 to capture intricate details (e.g., narrow countryside roads and dykes) with greater precision and clarity. Only images with low cloud coverage (<5%) were processed for the remote sensing variable calculation. The SWIR2 band has a spatial resolution of 20 m, while the NIR band has a resolution of 10 m. The 20 m band was down-sampled to 10 m using bilinear interpolation before the MNDBI calculation.
Table 2. Landscape and remote sensing variables used in this study.
Variables
(Abbreviation)
DescriptionCalculationReferences
Shannon’s diversity index (SHDI)Patch diversity in landscape S H D I = i = 1 m P i ln P i [47]
Connectance index (CONNECT)Functional connectedness of the corresponding patch type C O N N E C T = i = 1 m j k n c i j k i = 1 m n i n i 1 2 × 100 [37,48]
Aggregation index (AI)Tendency of a particular land use type to be aggregated A I = i = 1 m g i i m a x g i i P i × 100 [37,49]
Patch density (PD)Number of patches per unit area P D = N A × 100 × 10000 [47]
Largest patch index (LPI)Percentage of total landscape area in the largest patch (%) L P I = m a x a i j A × 100 [47]
Mean patch size (AREA_MN)Mean size of the landscape patches A R E A _ M N = A N 1 1000 [47]
Patch richness density (PRD)Number of patch types per unit area P R D = m A × 100 × 10000 [47]
Normalized difference vegetation index (NDVI)Intensity of green vegetation growth in satellite images N D V I = ( N I R R E D ) ( N I R + R E D ) [17]
Modified normalized difference built-up index (MNDBI)Impervious land cover in landscape M N D B I = ( S W I R 2 N I R ) ( S W I R 2 + N I R ) [44]
Pi is the proportion of the landscape occupied by land use type i; m is the number of patch types present in the landscape; cijk is joining between patch j and k of the same patch type based on a user-specified threshold distance; ni is number of patches in the landscape of patch type i; n is the number of land use types; gii and max-gii are the number and maximum number of like adjacencies (joins) between pixels of land use type i using single-count method, respectively; A is total landscape area; N is total number of patches in the landscape; aij is the area of patch j of land use type i; NIR is the near-infrared band; RED is the red band; SWIR2 is the shortwave infrared band.

2.2.5. Socio-Economic Variables

Socio-economic variables that indicate human population size, economic development, energy consumption, the effort on environmental protection, education levels of local residents, and the intensity of aquiculture and agricultural production were considered [50]. These include population density, GDP, GDP per capita, total energy consumption, unit GDP energy consumption, environmental protection investment, total output of aquatic products, average ordinary high school students per 10,000 population, and chemical fertilization intensity. Data of the above-mentioned variables for the 2019 year at the smallest level of political administrative units (unincorporated villages) where the 30 sample sites were located were obtained from statistical bulletins of the corresponding counties or provided by local governments.

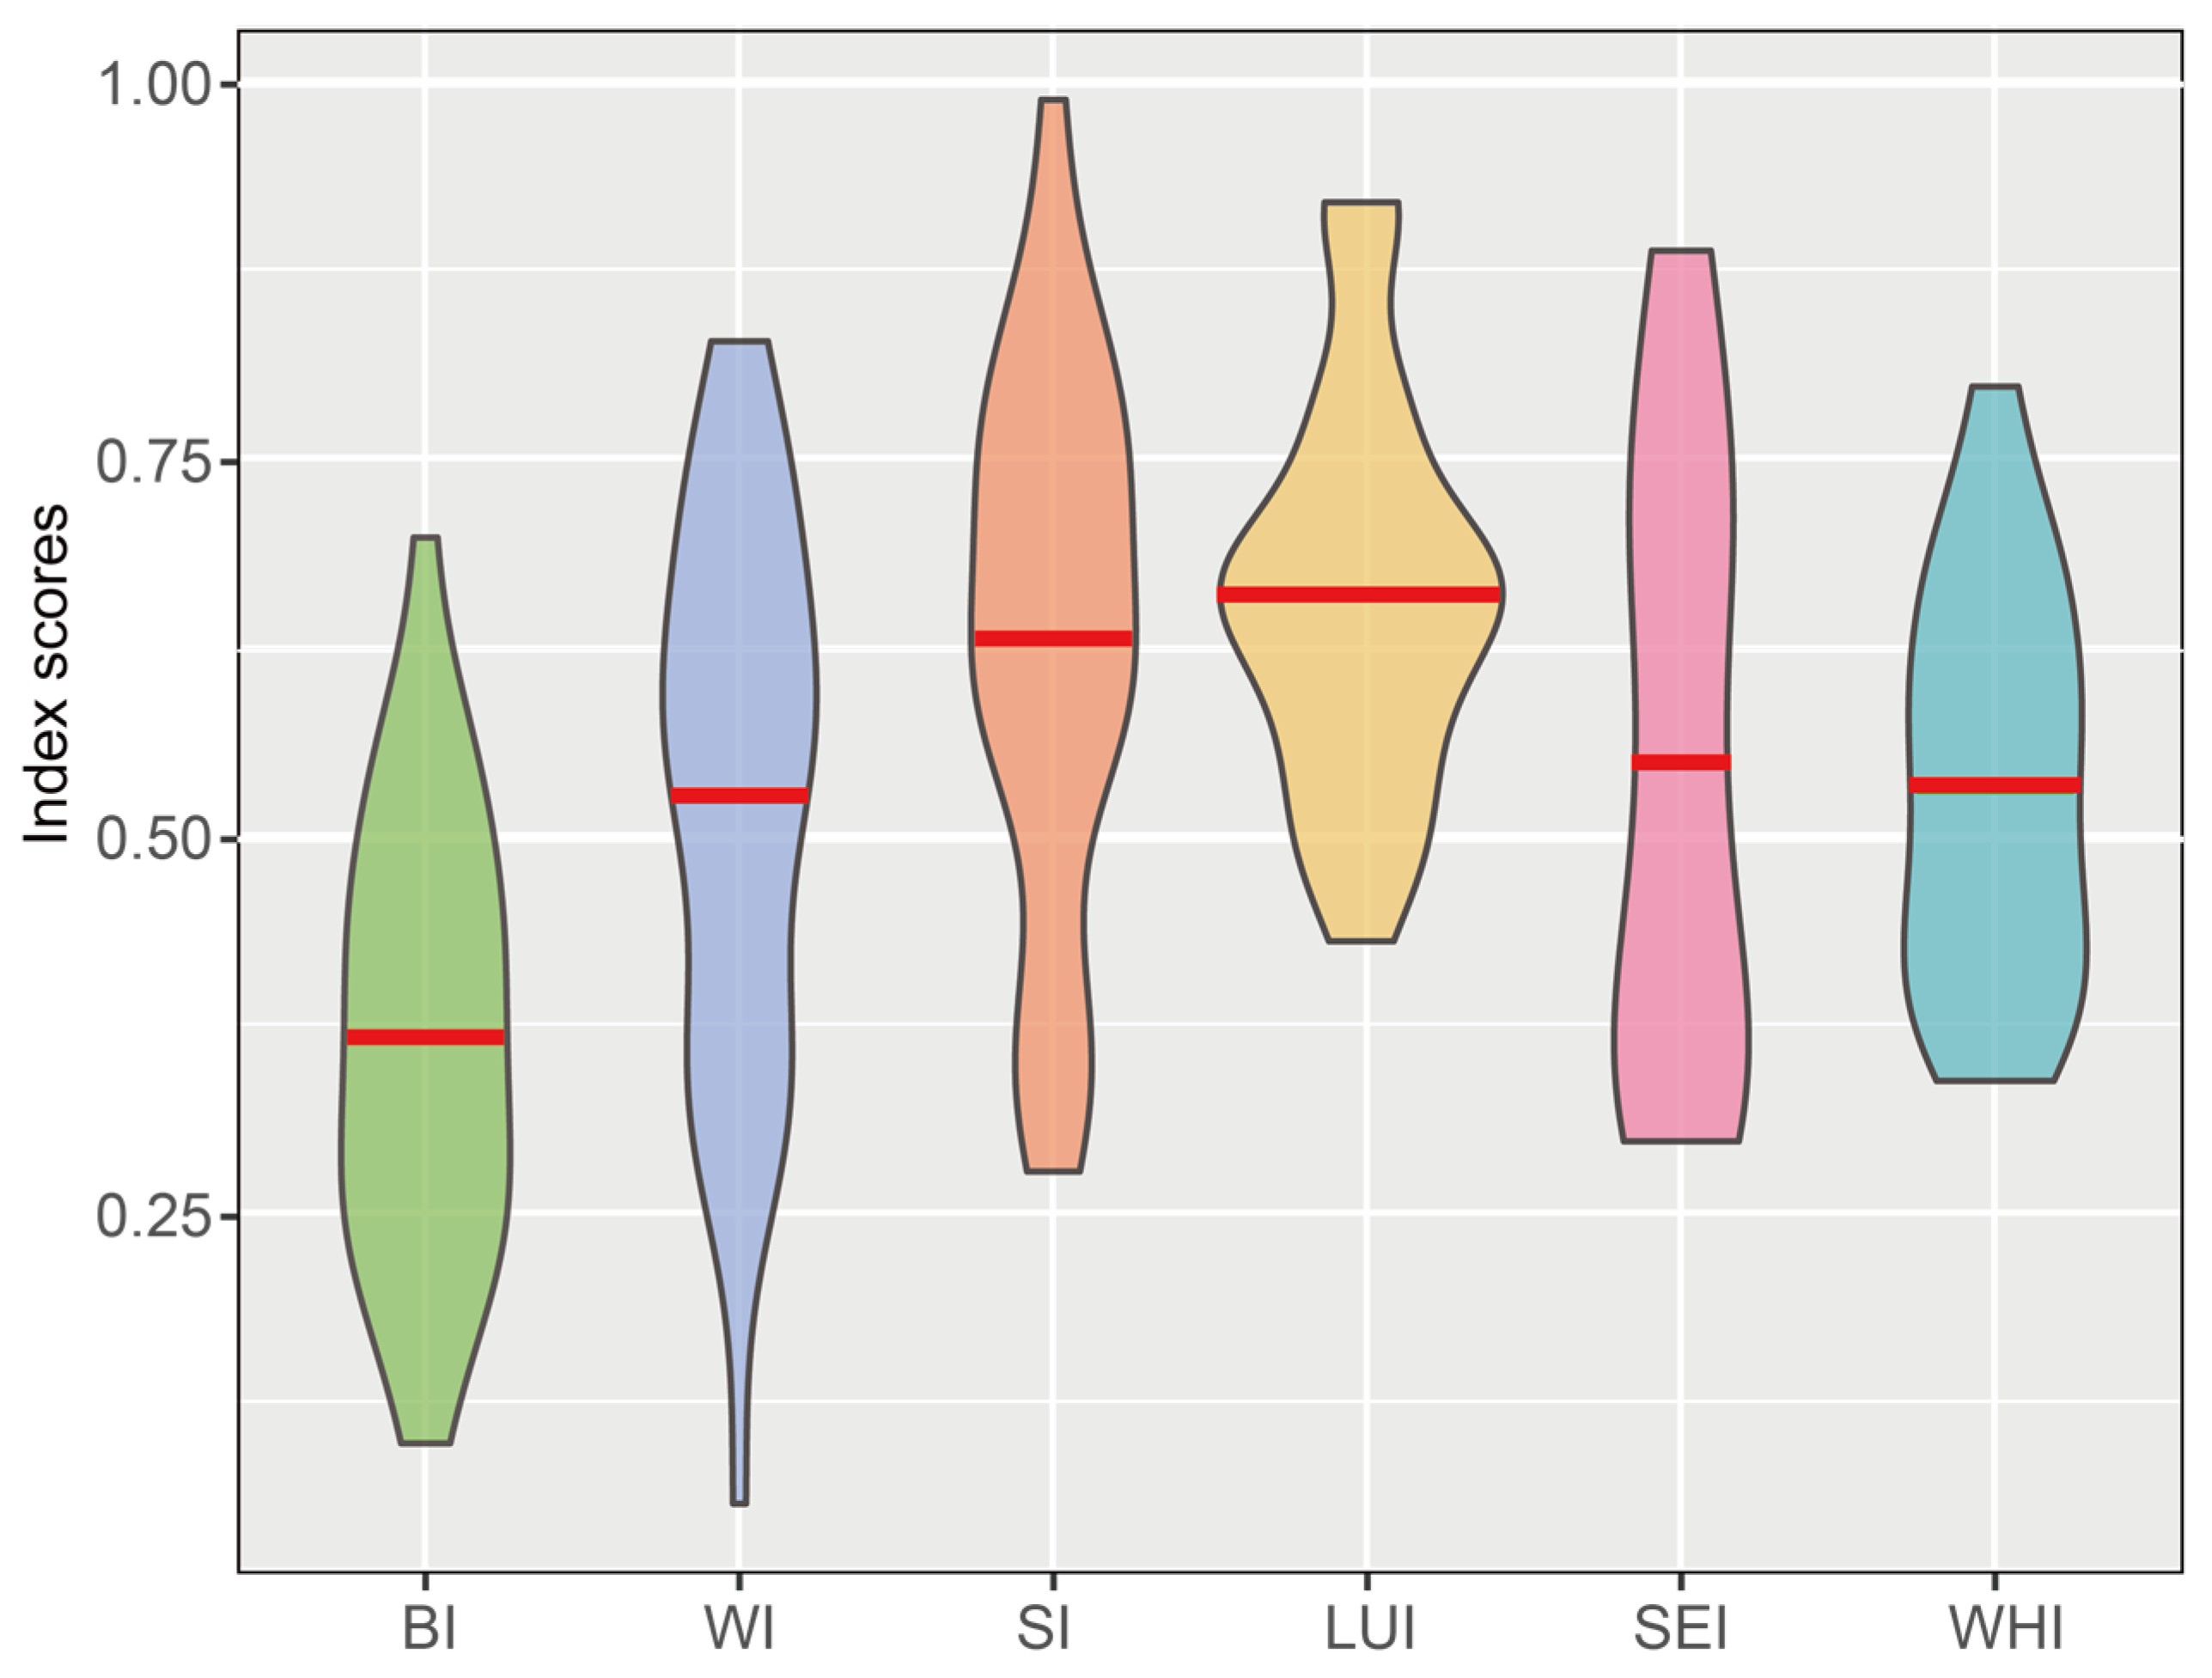
2.3. Metric Selection and Wetland Health Assessment

Principal component analysis (PCA) was performed to identify the most important variables in each variable category. PCA is a widely used method to select independent variables by discarding strongly correlated and redundant variables. The first principal component (PC1) in PCA explains the largest amount of variance in the dataset, while variance explained by the remaining PCs decreases. If the first few PCs account for most of the total variance (≥75%) and do not omit much of variability, the PCs are representative of the original variables and therefore reduce the number of variables required.
PCA analysis was conducted on variables of each category to identify the most important variables in this category. The first k PCs whose accumulative contribution rate was ≥0.75 were considered in subsequent analyses. The most important variable in each of the k PCs was identified as the one with the highest loading, through which k variables were selected to represent all variables in this category. The weight of each selected variable was calculated using:
W i = P i × | S i | i k P i × | S i |
where Wi is the weight of the selected variable in the ith PC, Pi is the proportion of variance explained by the ith PC, and Si is the loading of the variable in the ith PC.
The magnitude of variance of different variables varied dramatically, thus, all selected variables were scaled to vary from 0 to 1. If a higher value of a variable indicated a worse wetland condition (e.g., pollutant concentrations), the values were reversed by subtracting the values from 1 (i.e., 1 minus the scaled values). The score of each category was calculated by:
H = i k W i × V i
where H is the score indicating wetland conditions, and Wi and Vi are the weight and scaled value of the selected variable in the ith PC, respectively. The overall WHI score was calculated as the mean score of all the five categories. The wetland health of each sample site was assessed according to the WHI scores: excellent (0.81–1), good (0.61–0.80), fair (0.41–0.60), poor (0.21–0.40), and very poor (0–0.20).

3. Results

3.1. Biological Index

Eleven biological variables were subjected to PCA analysis, and the first four principal components (PCs) described 82% of the variance in the data (Table 3). Shannon–Wiener diversity indices of benthic macroinvertebrate and macrophyte assemblages, number of invasive macrophyte species, and density of benthic macroinvertebrates were the most important variables in the first four PCs, with a loading of 0.89, 0.86, 0.74, and 0.58, respectively. Scores of the biological index that was comprised of the four selected metrics ranged between 0.10 and 0.70 at the 30 sample sites, with a mean of 0.37 (Figure 2).

3.2. Water Quality Index

Ten water quality variables were used in the PCA analysis; the first three PCs captured 77% of the total variance (Table 4). Electrical conductivity and total suspended solids had the highest loadings (0.54) in PC1 that solely explained 44% of the variance in the original dataset; 21% and 12% of the total variance was explained by PC2 and PC3, and total phosphorus (0.51) and total nitrogen (0.37) had the highest loadings in the two PCs, respectively. The water quality index scores calculated using the four selected variables varied from 0.06 to 0.83 at the 30 sample sites, with an average of 0.53 (Figure 2).

3.3. Sediment Index

The first three PCs of the PCA analysis using seven sediment variables captured 36%, 25%, and 14% of the total variance, respectively (Table 5). Total phosphorus, total nitrogen, and Cu concentration were the most important variables in the first three PCs, with a loading of 0.68, 0.64, and 0.53, respectively. The sediment index scores with the three selected variables ranged between 0.28 and 0.99 at the 30 sample sites, with a mean of 0.63 (Figure 2).

3.4. Land Use Index

Land use classification accuracy, assessed using the validation dataset, was found to be 90.83%. Farmland and forest were identified as the predominant land use types, covering 46.35% and 19.26% of the total area, respectively (Figure 3). The first four PCs of the PCA analysis using 12 land use and remote sensing variables explained 80% of all variance in the original dataset. PC1, PC2, PC3, and PC4 captured 38%, 18%, 15%, and 10% of the total variance, respectively (Table 6). Shannon’s diversity index, the connectance index, and the percents of farmland and forest were the most important variables in the first four PCs. The land use index scores calculated using the four selected variables ranged between 0.44 and 0.90 at the 30 sample sites, with a mean of 0.65 (Figure 2).

3.5. Socio-Economic Index

Nine socio-economic variables subjected to the PCA analysis; the first three PCs accounted for 81% of the total variance (Table 7). Total output of aquatic products, GDP, and Unit GDP energy consumption were the most important variables in the first three components, with a loading of 0.98, 0.95, and 0.85, respectively. The socio-economic index scores with the three selected variables varied from 0.30 to 0.89, with a mean of 0.55 (Figure 2).

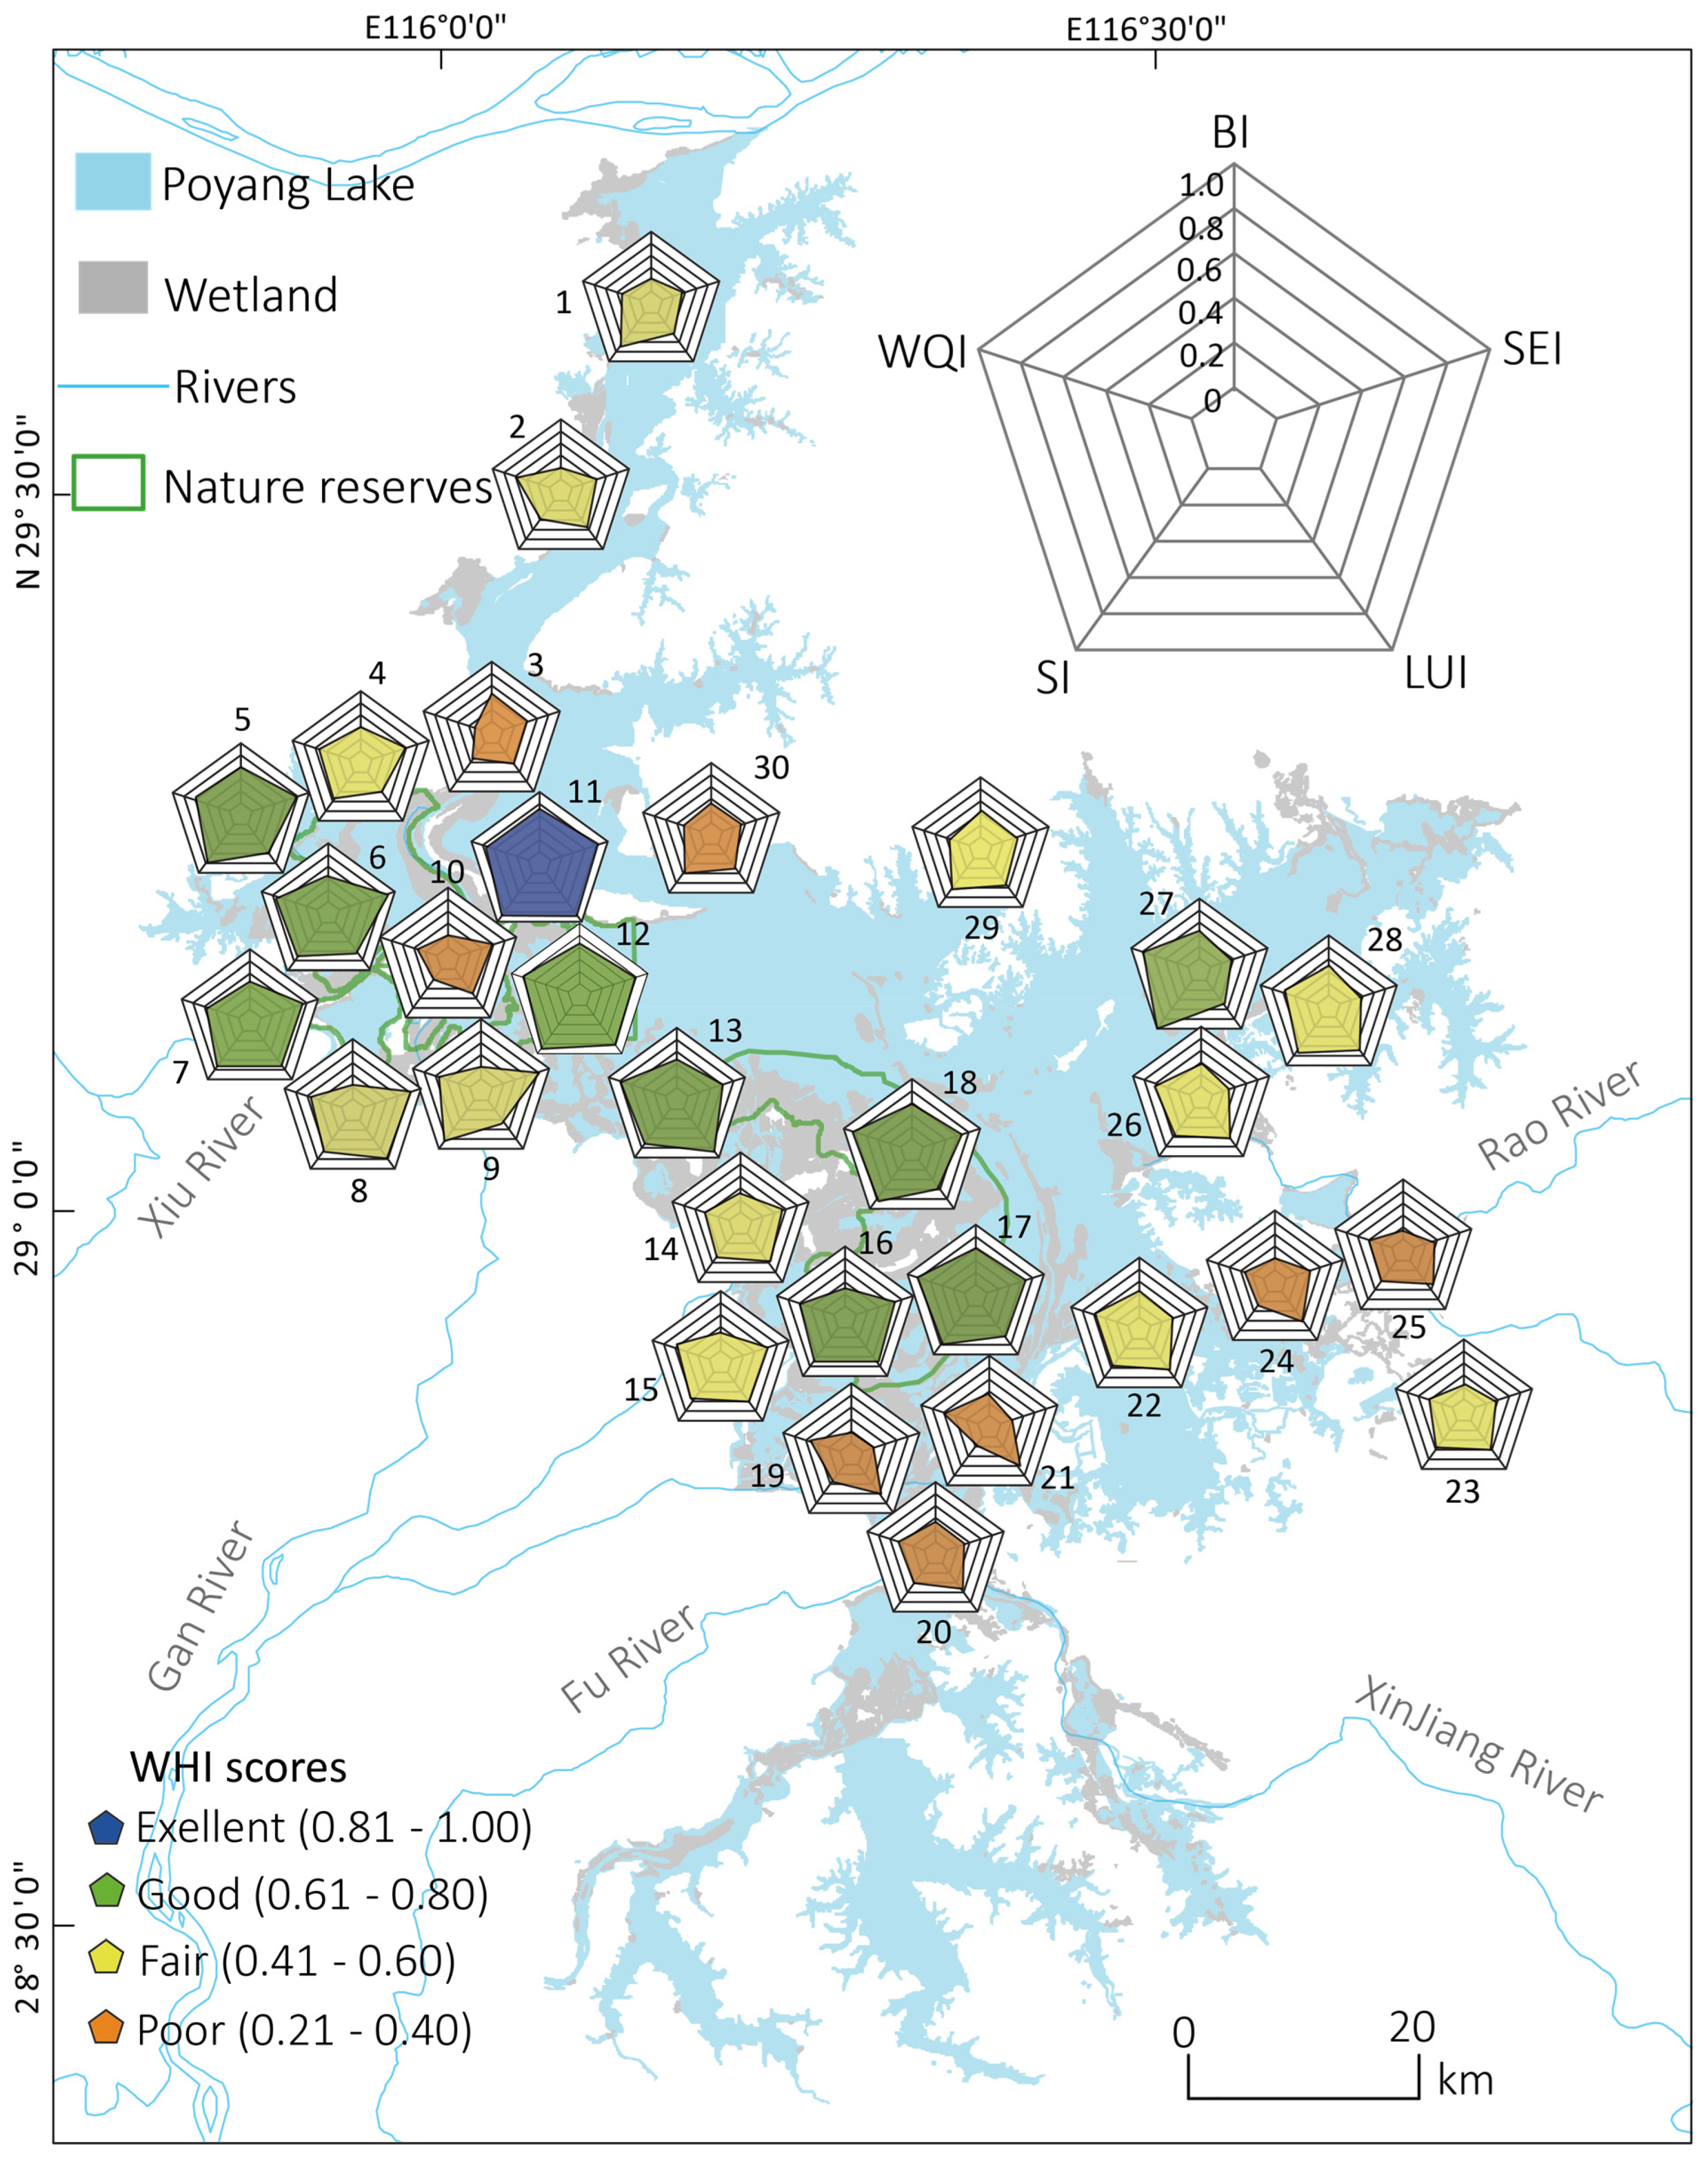
3.6. Wetland Health Index (WHI)

Eighteen variables from the five categories were finally selected for the overall WHI index based on the PCA analyses. The WHI index scores varied between 0.34 and 0.80 at the 30 sample sites, with a mean of 0.55 (Figure 2). One site was classified as excellent, nine were good, twelve were fair, and eight were poor (Figure 4). There were no sample sites assessed to be in a very poor condition. The Poyang Lake wetland was generally in a fair condition according to the mean value. WHI scores were strongly correlated with scores of individual indices of the five categories (Spearman’s r ranging between 0.63 and 0.91; Table 8). Pairwise Spearman’s correlations between scores of the five categories varied from 0.29 to 0.69, with an average of 0.48.

4. Discussion

4.1. Biological Index

Four biological variables, namely the Shannon–Wiener diversity indices of benthic macroinvertebrate and macrophyte assemblages, density of benthic macroinvertebrates and number of invasive macrophyte species, were selected to consist of the biological index (Table 3). The Shannon–Wiener diversity of biological assemblages is often used to indicate biotic integrity [51,52], while the density of benthic macroinvertebrates is an effective descriptor of the intensity of human disturbance [53]. This is since areas with higher habitat quality tend to have higher species diversity and abundance when abiotic conditions (e.g., climate) are similar [54]. In field surveys, we found that sample sites which suffered stronger human disturbance (e.g., aquaculture and sewage discharges) usually had higher numbers and coverage of invasive species. Human disturbance causes the deterioration of wetland environments (e.g., water pollution). Native species are more sensitive to environmental changes and less tolerant to disturbance than invasive species.
In contrast to the indices of biotic integrity for the Poyang Lake wetland that were developed in our previous studies [26,27], the four selected variables are simpler to measure, as they only require distinguishing between different species rather than identifying organisms at the species level. This ease of measurement reduces the need for highly specialized species identification skills and thus enhances the feasibility of using biological indices for wetland health assessment.

4.2. Water Quality Index

Four variables, namely total nitrogen, total phosphorus, electrical conductivity, and total suspended solids, were selected as water quality index metrics of the Poyang Lake wetland (Table 4). Nitrogen and phosphorus are always the two major pollutants in Poyang Lake due to highly intensified agriculture and high population density in its catchment [55]. Water nitrogen and phosphorus concentrations have sharply increased in the last two decades owing to the rapid economic growth [56]. Eutrophication is a worldwide issue that has significantly degraded aquatic ecosystems [57]. This issue is particularly pronounced in the lower part of the Yangtze basin, which represents one of the most economically active regions in China. Nearly 60% of the lakes in this region were in eutrophic and hypertrophic status [58,59]. Local governments should consider adaptive measures, including implementing effective water recycling and treatment systems, establishing vegetation along lakeshores, and promoting sustainable agricultural practices, to control the accelerated nutrient pollution.
Electrical conductivity is a measurement of water to conduct electricity, and is one of the most important parameters for assessing water quality [60]. Suspended solids are another important pollutant in Poyang Lake due to the large-scale sand mining activities that have caused a large increase in sediment concentration in the water. In addition, sand mining can lead to the destruction and alteration of aquatic habitats, including the loss of vegetation and disturbance of fish and other wildlife species [61]. Sand extracted from lakes and rivers has a variety of uses such as concrete production, construction, and road building. There is a growing demand for sand with the rapid expansion of urban areas. Nevertheless, it is crucial to regulate and manage sand mining activities effectively to find a balance between environmental sustainability and economic development.

4.3. Sediment Index

Total nitrogen, total phosphorus, and Cu were included in the sediment index for the Poyang Lake wetland (Table 5). Nitrogen and phosphorus concentrations in sediments from areas where the five major rivers discharge into the lake were much higher than that in other parts of the lake [62], suggesting that river input is a major cause of nitrogen and phosphorus accumulation in sediment. In addition, there are many copper mines in the catchment of Poyang Lake, among which the Dexing Copper Mine is the largest open-pit copper mine in Asia and second in the world. A recent study reported that the sediment in Poyang Lake was moderately to heavily polluted by Cu [63], which is supported by the findings of this study. Heavy metal pollution (especially Cu) in sediment has been considered to be one of the most prominent environmental issues in Poyang Lake [64]. Taking measures to decrease the release of heavy metals during mining and smelting operations within the catchment area is of utmost importance in addressing the issue of heavy metal pollution in Poyang Lake.

4.4. Land Use Index

Percents of farmland and forest were identified as the most important land use variables and were included in the land use index (Table 6). Farmland and forest are the two major land cover types in the Poyang Lake catchment. A large proportion of farmland surrounding a wetland is usually associated with a deteriorated wetland environment, because pollutants such as nutrients, pesticides, and fine soil particles generated from agriculture can be transported into the water bodies. In contrast, dense vegetation in forests can serve as a natural filter that can effectively reduce pollutants in surface run-off. Our results indicate that increasing natural land cover (e.g., forests) in the surrounding areas of Poyang Lake (especially within the 1-km buffer zone) is crucial for reducing non-point source pollution. In addition, Shannon’s diversity and connectance indices were also included. The land cover in and surrounding the Poyang Lake wetland would be open water, grassland, and forest if it had not been modified by human activities. The increase in human-altered land cover such as farmland and built-up land increases landscape diversity as well as fragmentation. The connectance index assesses the level of landscape connectivity, which supports the movement of environmental and biological elements between different patches. Improving the connectivity of habitat patches is particularly important as it enhances the resilience of spatially structured populations of organisms to external disturbances [35].

4.5. Socio-Economic Index

Total output of aquatic products, GDP, and unit GDP energy consumption were our main socio-economic index metrics (Table 7). Fishing and aquaculture have been important sources of income and food for local people, and have significant effects on the diversity and productivity of biological communities [65]. A 10-year fishing ban in the Yangtze River and its main tributaries (including Poyang Lake) began in 2020 for protecting the aquatic biodiversity that has experienced dramatic declines [66]. GDP is a financial measurement of total economic activity in a region that has been considered as the primary driving force of environmental changes (including climate and land use changes) [67]. Unit GDP energy consumption measures energy use efficiency. Rapid increases in energy consumption and low energy efficiency are responsible for the recent increase in environmental degradation. A study spanning a period of 46 years (from 1971 to 2017) in four countries (Indonesia, Mexico, Nigeria, and Turkey) [68] showed that environmental quality was deteriorated by energy consumption through a negative effect on the ecological footprint. Improving energy use efficiency (e.g., accessing clean energy technology) is essential to mitigate the negative effects of social and economic development on the environment.

4.6. Comprehensive Assessment of the Poyang Lake Wetland

The WHI scores indicated that the Poyang Lake wetland was generally in a fair condition (Figure 4), which is consistent with previous results [20,35]. The assessment results for specific sample sites may differ from those in previous studies. For example, site 29 was assessed to be in a very poor condition by using the benthic macroinvertebrate-based index of biotic integrity (B-IBI) [27]. However, it was classified as fair by using the WHI index. This is because this site had relatively high sediment and land use scores although the biological score was very low (Figure 4). Most of the sample sites located within national nature reserves were in excellent and good conditions, suggesting that strict control of human disturbance is particularly important for wetland conservation. In contrast, sample sites in the areas where the connected rivers discharge into the lake were mainly in a poor condition, indicating that river pollution has large influences on the wetland conditions.
The biological index scores were found to be the lowest when compared to the scores of other indices (Figure 2). Biological organisms, particularly submerged macrophytes and benthic macroinvertebrates, are highly vulnerable to environmental changes. They have the ability to indicate the synergistic, accumulative, and indirect effects of various pollutants, which are frequently undetectable through solely relying on physical or chemical investigations. Our results indicate that the restoration of biological integrity is crucial for improving wetland health in Poyang Lake. In contrast, scores of the land use index were the highest among all the five individual indices. This can be attributed to the relatively low population density within the 1-km buffer zone of Poyang Lake where the risk of flooding is high (e.g., the summer flood in 2020).
Scores of the individual category indices were not highly correlated with each other (Table 8), suggesting that the information provided by the indices might be complementary. In particular, the socio-economic index had the lowest correlations with other indices, probably because socio-economic variables are less directly linked with ecosystem health when compared with biological, water quality, and sediment variables. The WHI index can provide more comprehensive information on the status of wetland health than individual metric indices. For example, site 8 had relatively low biological scores but high scores on land use and landscape (Figure 4). This is because this site is located in a national nature reserve where land use alteration is strictly prohibited. However, this site is adjacent to a popular scenic spot where tourists enjoy the unique wetland landscape and watch migratory birds in winter, which might present direct and indirect disturbance on the biological communities. Such information could be helpful for developing more targeted and effective strategies to improve wetland conditions.

5. Conclusions

Eighteen variables from five categories (i.e., biological, water quality, sediment, land use and remote sensing, and socio-economic variables) were selected as metrics of the WHI index for Poyang Lake. The wetland was assessed to be in a fair condition according to the WHI scores. Wetland areas near river mouths were generally in a poor condition, suggesting that reducing pollution from rivers is critical for wetland protection. The biological index had the lowest scores among the individual indices of the five categories, highlighting the importance of the restoration of biological integrity for improving wetland health in Poyang Lake. The five individual indices and the WHI index developed here can provide comprehensive and complementary information on wetland health status, which would facilitate the development of more targeted and effective policies for wetland management and conservation.

Author Contributions

Conceptualization, W.Y. and Q.Y.; data curation, W.Y., B.Y. and Q.Y.; formal analysis, W.Y., J.Z., Y.X., Q.H., C.F., M.C., B.Y. and Q.Y.; funding acquisition, W.Y., Q.H., C.F., M.C. and Q.Y.; investigation, W.Y., J.Z., Y.X., Q.H., M.C., B.Y. and Q.Y.; methodology, W.Y., J.Z., Y.X., C.F., M.C., B.Y. and Q.Y.; project administration, W.Y., Q.H. and Q.Y.; resources, W.Y., C.F. and Q.Y.; software, J.Z. and B.Y.; supervision, C.F. and Q.Y.; validation, W.Y., J.Z. and Y.X.; visualization, W.Y., J.Z., Y.X. and Q.Y.; writing—original draft, W.Y., J.Z., Y.X., Q.H., C.F., M.C. and Q.Y.; writing—review and editing, W.Y., J.Z., Y.X., Q.H., M.C., B.Y. and Q.Y. All authors have read and agreed to the published version of the manuscript.

Funding

This research was funded by National Natural Science Foundation of China (grant numbers 41967055, 32060275), Natural Science Foundation of Jiangxi Province (grant numbers 20212BAB203023, 20212ACB203006, 20202BABL213044), and the Platform of Poyang Lake Wetland Ecosystem Monitoring and Early Warning hosted by Jiangxi Nature Reserve Construction Center and Key Laboratory of Poyang Lake Wetland and Watershed Research (Jiangxi Normal University), Ministry of Education (grant number 2202-360000-04-01-502976).

Data Availability Statement

The data presented in this study are available from the corresponding author upon reasonable request.

Conflicts of Interest

The authors declare no conflict of interest.

References

  1. Neubert, M.G.; Caswell, H. Alternatives to resilience for measuring the responses of ecological systems to perturbations. Ecology 1997, 78, 653–665. [Google Scholar] [CrossRef]
  2. Hu, S.; Niu, Z.; Chen, Y.; Li, L.; Zhang, H. Global wetlands: Potential distribution, wetland loss, and status. Sci. Total Environ. 2017, 586, 319–327. [Google Scholar] [CrossRef] [PubMed]
  3. Davidson, N.C. How much wetland has the world lost? Long-term and recent trends in global wetland area. Mar. Freshw. Res. 2014, 65, 934–941. [Google Scholar] [CrossRef]
  4. Fluet-Chouinard, E.; Stocker, B.D.; Zhang, Z.; Malhotra, A.; Melton, J.R.; Poulter, B.; Kaplan, J.O.; Goldewijk, K.K.; Siebert, S.; Minayeva, T.; et al. Extensive global wetland loss over the past three centuries. Nature 2023, 614, 281–286. [Google Scholar] [CrossRef] [PubMed]
  5. Ruaro, R.; Gubiani, É. A scientometric assessment of 30 years of the Index of Biotic Integrity in aquatic ecosystems: Applications and main flaws. Ecol. Indic. 2013, 29, 105–110. [Google Scholar] [CrossRef]
  6. Costanza, R. Ecosystem health and ecological engineering. Ecol. Eng. 2012, 45, 24–29. [Google Scholar] [CrossRef]
  7. Costanza, R.; Mageau, M. What is a healthy ecosystem? Aquat. Ecol. 1999, 33, 105–115. [Google Scholar] [CrossRef]
  8. Rapport, D.J.; Costanza, R.; McMichael, A.J. Assessing ecosystem health. Trends Ecol. Evol. 1998, 13, 397–402. [Google Scholar] [CrossRef]
  9. Schaeffer, D.J.; Herricks, E.E.; Kerster, H.W. Ecosystem health: I. Measuring ecosystem health. Environ. Manag. 1988, 12, 445–455. [Google Scholar] [CrossRef]
  10. Bentley, S.B.; Tomscha, S.A.; Deslippe, J.R. Indictors of wetland health improve following small-scale ecological restoration on private land. Sci. Total Environ. 2022, 837, 155760. [Google Scholar] [CrossRef]
  11. Burkhard, B.; Müller, F.; Lill, A. Ecosystem Health Indicators. In Ecological Indicators. Vol. [2] of Encyclopedia of Ecology; Jøgensen, S.E., Fath, B.D., Eds.; Elsevier: Oxford, UK, 2007; Volume 3, pp. 154–196. [Google Scholar]
  12. Zaghloul, A.; Saber, M.; Gadow, S.; Awad, F. Biological indicators for pollution detection in terrestrial and aquatic ecosystems. Bull. Natl. Res. Cent. 2020, 44, 127. [Google Scholar] [CrossRef]
  13. Whittier, T.R.; Stoddard, J.L.; Larsen, D.P.; Herlihy, A.T. Selecting reference sites for stream biological assessments: Best professional judgment or objective criteria. J. N. Am. Benthol. Soc. 2007, 26, 349–360. [Google Scholar] [CrossRef]
  14. Bhatti, S.G.; Tabinda, A.B.; Yasin, F.; Yasar, A.; Butt, H.I.; Wajahat, R. Spatio-temporal variations in physico-chemical parameters and potentially harmful elements (PHEs) of Uchalli Wetlands Complex (Ramsar site), Pakistan. Environ. Sci. Pollut. Res. 2018, 25, 33490–33507. [Google Scholar] [CrossRef]
  15. Xu, D.; Cai, Z.; Xu, D.; Lin, W.; Gao, J.; Li, L. Land use change and ecosystem health assessment on Shanghai-Hangzhou Bay, Eastern China. Land 2022, 11, 867. [Google Scholar] [CrossRef]
  16. Wang, Z.; Liu, Y.; Li, Y.; Su, Y. Response of ecosystem health to land use changes and landscape patterns in the Karst mountainous regions of Southwest China. Int. J. Environ. Res. Public Health 2022, 19, 3273. [Google Scholar] [CrossRef] [PubMed]
  17. Singh, M.; Sinha, R. Hydrogeomorphic indicators of wetland health inferred from multi-temporal remote sensing data for a new Ramsar site (Kaabar Tal), India. Ecol. Indic. 2021, 127, 107739. [Google Scholar] [CrossRef]
  18. Liu, W.; Cui, L.; Guo, Z.; Wang, D.; Zhang, M. Wetland ecosystem health improvement from ecological conservation and restoration offset the decline from socio-economic development. Land Degrad. Dev. 2023, 34, 283–295. [Google Scholar] [CrossRef]
  19. Chen, W.; Cao, C.; Liu, D.; Tian, R.; Wu, C.; Wang, Y.; Qian, Y.; Ma, G.; Bao, D. An evaluating system for wetland ecological health: Case study on nineteen major wetlands in Beijing-Tianjin-Hebei region, China. Sci. Total Environ. 2019, 666, 1080–1088. [Google Scholar] [CrossRef]
  20. You, Q.; Fang, N.; Jian, M.; Hu, Q.; Yao, B.; Liu, D.; Yang, W. A reliability-resilience-vulnerability framework for measuring the influence of changes in water level fluctuations on lake conditions. Ecol. Indic. 2022, 134, 108468. [Google Scholar] [CrossRef]
  21. Wu, X.; Lin, X.; Zhang, Y.; Gao, J.; Guo, L.; Li, J. Impacts of climate change on ecosystem in Priority Areas of Biodiversity Conservation in China. Chin. Sci. Bull. 2014, 59, 4668–4680. [Google Scholar] [CrossRef]
  22. Tullos, D. Assessing the influence of environmental impact assessments on science and policy: An analysis of the Three Gorges Project. J. Environ. Manag. 2009, 90, S208–S223. [Google Scholar] [CrossRef] [PubMed]
  23. Statistic Bureau of Jiangxi. Jiangxi Statistical Yearbook; China Statistic Press: Beijing, China, 2012–2021. [Google Scholar]
  24. Zhang, Q.; Ye, X.-C.; Werner, A.D.; Li, Y.-L.; Yao, J.; Li, X.-H.; Xu, C.-Y. An investigation of enhanced recessions in Poyang Lake: Comparison of Yangtze River and local catchment impacts. J. Hydrol. 2014, 517, 425–434. [Google Scholar] [CrossRef]
  25. Vondracek, B.; Koch, J.D.; Beck, M.W. A comparison of survey methods to evaluate macrophyte index of biotic integrity performance in Minnesota lakes. Ecol. Indic. 2014, 36, 178–185. [Google Scholar] [CrossRef]
  26. Yang, W.; You, Q.; Fang, N.; Xu, L.; Zhou, Y.; Wu, N.; Ni, C.; Liu, Y.; Liu, G.; Yang, T.; et al. Assessment of wetland health status of Poyang Lake using vegetation-based indices of biotic integrity. Ecol. Indic. 2018, 90, 79–89. [Google Scholar] [CrossRef]
  27. You, Q.; Yang, W.; Jian, M.; Hu, Q. A comparison of metric scoring and health status classification methods to evaluate benthic macroinvertebrate-based index of biotic integrity performance in Poyang Lake wetland. Sci. Total Environ. 2021, 761, 144112. [Google Scholar] [CrossRef]
  28. Gao, W.; Gao, B.; Yan, C.; Liu, Y. Evolution of anthropogenic nitrogen and phosphorus inputs to Lake Poyang Basin and its’ effect on water quality of lake. Acta Sci. Circumstantiae 2016, 36, 3137–3145. [Google Scholar]
  29. Ministry of Environmental Protection of the People’s Republic of China. Environmental Quality Standard for Surface Water (GB3838-2002). Available online: http://kjs.mep.gov.cn/hjbhbz/bzwb/shjbh/shjzlbz/200206/t20020601_66497.htm (accessed on 12 April 2019).
  30. Cai, Q.; Cao, M.; Huang, X. Protocols for Standard Observation and Measurement in Aquatic Ecosystems; China Environmental Science Press: Beijing, China, 2007. [Google Scholar]
  31. Xie, X.; Fang, B.; Xu, H.; He, S.; Li, X. Study on the coordinated relationship between urban land use efficiency and ecosystem health in China. Land Use Policy 2021, 102, 105235. [Google Scholar] [CrossRef]
  32. Heller, N.E.; McManus Chauvin, K.; Skybrook, D.; Barnosky, A.D. Including stewardship in ecosystem health assessment. Nat. Sustain. 2023, 6, 731–741. [Google Scholar] [CrossRef]
  33. Gorelick, N.; Hancher, M.; Dixon, M.; Ilyushchenko, S.; Thau, D.; Moore, R. Google Earth Engine: Planetary-scale geospatial analysis for everyone. Remote Sens. Environ. 2017, 202, 18–27. [Google Scholar] [CrossRef]
  34. Uzarski, D.G.; Burton, T.M.; Cooper, M.J.; Ingram, J.W.; Timmermans, S.T. Fish habitat use within and across wetland classes in coastal wetlands of the five Great Lakes: Development of a fish-based index of biotic integrity. J. Great Lakes Res. 2005, 31, 171–187. [Google Scholar] [CrossRef]
  35. Liu, D.; Liu, L.; You, Q.; Hu, Q.; Jian, M.; Liu, G.; Cong, M.; Yao, B.; Xia, Y.; Zhong, J.; et al. Development of a landscape-based multi-metric index to assess wetland health of the Poyang Lake. Remote Sens. 2022, 14, 1082. [Google Scholar] [CrossRef]
  36. Huang, W.; Mao, J.; Zhu, D.; Lin, C. Impacts of land use and land cover on water quality at multiple buffer-zone scales in a lakeside city. Water 2020, 12, 47. [Google Scholar] [CrossRef]
  37. Zhang, L.; Hou, G.; Li, F. Dynamics of landscape pattern and connectivity of wetlands in western Jilin Province, China. Environ. Dev. Sustain. 2020, 22, 2517–2528. [Google Scholar] [CrossRef]
  38. Sun, T.; Lin, W.; Chen, G.; Guo, P.; Zeng, Y. Wetland ecosystem health assessment through integrating remote sensing and inventory data with an assessment model for the Hangzhou Bay, China. Sci. Total Environ. 2016, 566–567, 627–640. [Google Scholar] [CrossRef]
  39. Jafary, P.; Sarab, A.A.; Tehrani, N.A. Ecosystem health assessment using a fuzzy spatial decision support system in Taleghan Watershed before and after dam construction. Environ. Process. 2018, 5, 807–831. [Google Scholar] [CrossRef]
  40. Wu, C.; Chen, W. Indicator system construction and health assessment of wetland ecosystem—Taking Hongze Lake Wetland, China as an example. Ecol. Indic. 2020, 112, 106164. [Google Scholar] [CrossRef]
  41. Mohibul, S.; Sarif, M.N.; Parveen, N.; Khanam, N.; Siddiqui, M.A.; Naqvi, H.R.; Nasrin, T.; Siddiqui, L. Wetland health assessment using DPSI framework: A case study in Kolkata Metropolitan Area. Environ. Sci. Pollut. Res. 2023. [Google Scholar] [CrossRef]
  42. Skidmore, A.K.; Coops, N.C.; Neinavaz, E.; Ali, A.; Schaepman, M.E.; Paganini, M.; Kissling, W.D.; Vihervaara, P.; Darvishzadeh, R.; Feilhauer, H.; et al. Priority list of biodiversity metrics to observe from space. Nat. Ecol. Evol. 2021, 5, 896–906. [Google Scholar] [CrossRef]
  43. Higgins, S.I.; Conradi, T.; Muhoko, E. Shifts in vegetation activity of terrestrial ecosystems attributable to climate trends. Nat. Geosci. 2023, 16, 147–153. [Google Scholar] [CrossRef]
  44. Hu, Y. Investigation of a modified normalized built-up undex and a post processing scheme for BUILT-UP extraction in urban area. Geomat. Sci. Technol. 2017, 5, 83–92. [Google Scholar] [CrossRef]
  45. Hou, Y.; Ding, W.; Liu, C.; Li, K.; Cui, H.; Liu, B.; Chen, W. Influences of impervious surfaces on ecological risks and controlling strategies in rapidly urbanizing regions. Sci. Total Environ. 2022, 825, 153823. [Google Scholar] [CrossRef] [PubMed]
  46. Gupta, S.; Islam, S.; Hasan, M. Analysis of impervious land-cover expansion using remote sensing and GIS: A case study of Sylhet sadar upazila. Appl. Geogr. 2018, 98, 156–165. [Google Scholar] [CrossRef]
  47. McGarigal, K.; Marks, B.J. FRAGSTATS: Spatial Pattern Analysis Program for Quantifying Landscape Structure; U.S. Department of Agriculture, Forest Service, Pacific Northwest Research Station: Washington, DC, USA, 1995.
  48. Spanowicz, A.G.; Jaeger, J.A.G. Measuring landscape connectivity: On the importance of within-patch connectivity. Landsc. Ecol. 2019, 34, 2261–2278. [Google Scholar] [CrossRef]
  49. He, H.S.; DeZonia, B.E.; Mladenoff, D.J. An aggregation index (AI) to quantify spatial patterns of landscapes. Landsc. Ecol. 2000, 15, 591–601. [Google Scholar] [CrossRef]
  50. Faridah-Hanum, I.; Yusoff, F.M.; Fitrianto, A.; Ainuddin, N.A.; Gandaseca, S.; Zaiton, S.; Norizah, K.; Nurhidayu, S.; Roslan, M.; Hakeem, K.R.; et al. Development of a comprehensive mangrove quality index (MQI) in Matang Mangrove: Assessing mangrove ecosystem health. Ecol. Indic. 2019, 102, 103–117. [Google Scholar] [CrossRef]
  51. Wu, N.; Cai, Q.; Fohrer, N. Development and evaluation of a diatom-based index of biotic integrity (D-IBI) for rivers impacted by run-of-river dams. Ecol. Indic. 2012, 18, 108–117. [Google Scholar] [CrossRef]
  52. Costa, P.; Schulz, U. The fish community as an indicator of biotic integrity of the streams in the Sinos River basin, Brazil. Braz. J. Biol. 2010, 70, 1195–1205. [Google Scholar] [CrossRef]
  53. Raphahlelo, M.E.; Addo-Bediako, A.; Luus-Powell, W.J. Distribution and diversity of benthic macroinvertebrates in the Mohlapitsi River, South Africa. J. Freshw. Ecol. 2022, 37, 145–160. [Google Scholar] [CrossRef]
  54. Yamashina, C.; Hara, M.; Fujita, T. The effects of human disturbance on the species composition, species diversity and functional diversity of a Miombo woodland in northern Malawi. Afr. J. Ecol. 2021, 59, 216–224. [Google Scholar] [CrossRef]
  55. Li, B.; Yang, G.; Wan, R. Multidecadal water quality deterioration in the largest freshwater lake in China (Poyang Lake): Implications on eutrophication management. Environ. Pollut. 2020, 260, 114033. [Google Scholar] [CrossRef]
  56. Fang, N.; You, Q.; Yang, W.; Xu, L.; Zhou, Y.; Ni, C. Eutrophication and Water Quality Assessment in the Poyang Lake Wetlands. In Chinese Water System Volume 3: Poyang Lake Basin; Yue, T., Nixdorf, E., Zhou, C., Xu, B., Zhao, N., Fan, Z., Huang, X., Chen, C., Kolditz, O., Eds.; Springer: Berlin/Heidelberg, Germany, 2018; pp. 91–98. [Google Scholar]
  57. Kakade, A.; Salama, E.-S.; Han, H.; Zheng, Y.; Kulshrestha, S.; Jalalah, M.; Harraz, F.A.; Alsareii, S.A.; Li, X. World eutrophic pollution of lake and river: Biotreatment potential and future perspectives. Environ. Technol. Innov. 2021, 23, 101604. [Google Scholar] [CrossRef]
  58. Jin, X.; Xu, Q.; Huang, C. Current status and future tendency of lake eutrophication in China. Sci. China Ser. C Life Sci. 2005, 48, 948–954. [Google Scholar]
  59. Qin, B.; Zhang, Y.; Zhu, G.; Gao, G. Eutrophication control of large shallow lakes in China. Sci. Total Environ. 2023, 881, 163494. [Google Scholar] [CrossRef]
  60. Zhang, D.; Wang, P.; Cui, R.; Yang, H.; Li, G.; Chen, A.; Wang, H. Electrical conductivity and dissolved oxygen as predictors of nitrate concentrations in shallow groundwater in Erhai Lake region. Sci. Total Environ. 2022, 802, 149879. [Google Scholar] [CrossRef]
  61. Koehnken, L.; Rintoul, M.S.; Goichot, M.; Tickner, D.; Loftus, A.-C.; Acreman, M.C. Impacts of riverine sand mining on freshwater ecosystems: A review of the scientific evidence and guidance for future research. River Res. Appl. 2020, 36, 362–370. [Google Scholar] [CrossRef]
  62. Wu, Z. The Influence of River-lake Relation Change on the Poyang Lake Sediments Nitrogen/Phosphorus Form and Release Risk. Master’s Thesis, Nanchang University, Nanchang, China, 2014. [Google Scholar]
  63. Wang, M.; Liu, J.; Lai, J. Metals Pollution and Ecological Risk Assessment of Sediments in the Poyang Lake, China. Bull. Environ. Contam. Toxicol. 2019, 102, 511–518. [Google Scholar] [CrossRef] [PubMed]
  64. Feng, Y.; Chenglin, L.; Bowen, W. Evaluation of heavy metal pollution in the sediment of Poyang Lake based on stochastic geo-accumulation model (SGM). Sci. Total Environ. 2019, 659, 1–6. [Google Scholar] [CrossRef]
  65. Jennings, S.; Kaiser, M.J. The Effects of Fishing on Marine Ecosystems. In Advances in Marine Biology; Blaxter, J.H.S., Southward, A.J., Tyler, P.A., Eds.; Academic Press: Cambridge, MA, USA, 1998; Volume 34, pp. 201–352. [Google Scholar]
  66. Wang, H.; Wang, P.; Xu, C.; Sun, Y.; Shi, L.; Zhou, L.; Jeppesen, E.; Chen, J.; Xie, P. Can the “Ten-Year Fishing Ban” rescue biodiversity of the Yangtze River? Innovation 2022, 3, 100235. [Google Scholar]
  67. Ren, Y.; Zhang, F.; Li, J.; Zhao, C.; Jiang, Q.; Cheng, Z. Ecosystem health assessment based on AHP-DPSR model and impacts of climate change and human disturbances: A case study of Liaohe River Basin in Jilin Province, China. Ecol. Indic. 2022, 142, 109171. [Google Scholar] [CrossRef]
  68. Agbede, E.A.; Bani, Y.; Azman-Saini, W.N.W.; Naseem, N.A.M. The impact of energy consumption on environmental quality: Empirical evidence from the MINT countries. Environ. Sci. Pollut. Res. 2021, 28, 54117–54136. [Google Scholar] [CrossRef]
Figure 1. Sample sites (30 total) for environmental and biological data in the Poyang Lake wetland.
Remotesensing 15 04061 g001
Figure 2. Violin plots showing the distribution of scores of five individual indices and the overall wetland health index (WHI). Red bars indicate the mean values. BI, biological index; WI, water quality index; SI, sediment index; LUI, land use index; SEI, socio-economic index.
Remotesensing 15 04061 g002
Figure 3. Land use map of the Poyang Lake region in 2019.
Remotesensing 15 04061 g003
Figure 4. Radar plots visually indicating the contribution of biological (BI), water quality (WQI), sediment (SI), land use (LUI) and socio-economic (SEI) indices on the wetland health index (WHI) scores at 30 sample sites in the Poyang Lake wetland. The numbers in the radar plot in the top right of the figure show axis tick values.
Remotesensing 15 04061 g004
Table 1. Summary of satellite imagery datasets used in this study.
DatasetSpatial ResolutionAcquisition DateNumberSource
Landsat 8 OLI Surface Reflectance30 m19 August 2019
20 September 2019
11 September 2019
Path 121, Row 39
Path 121, Row 40
Path 122, Row 40
The United States Geological Survey (https://earthexplorer.usgs.gov)
Sentinel-2 Level 2A10 m
(Bands 4, 8)
20 m
(Band 12)
2 October 2019
2 October 2019
19 October 2019
19 October 2019
50RLT
50RLS
50RMT
50RMS
GEE catalogue [33]
Table 3. Results of principal component analysis (PCA) with 11 biological variables at 30 sample sites in the Poyang Lake wetland.
VariablesPC1PC2PC3PC4
 Number of macrophyte species0.020.710.490.15
Macrophyte Shannon–Wiener index0.450.860.050.18
Number of invasive macrophyte species−0.430.100.740.27
 Number of submerged species0.480.73−0.23−0.3
 Number of tolerant macrophyte species0.53−0.22−0.60.24
 Number of benthic macroinvertebrate taxa0.81−0.150.050.19
 Number of predator taxa0.82−0.110.200.10
 Percent of Diptera0.070.58−0.340.53
Density of benthic macroinvertebrates−0.570.14−0.230.58
Benthic macroinvertebrate Shannon–Wiener index0.89−0.220.250.19
 Average score per taxon index0.80−0.160.260.12
Proportion of variance0.380.210.140.09
Cumulative proportion0.380.590.730.82
The variables with the highest loadings in each principal component (PC) are highlighted in bold.
Table 4. Results of principal component analysis (PCA) with 10 water quality variables at 30 sample sites in the Poyang Lake wetland.
VariablesPC1PC2PC3
 pH0.020.43−0.33
Total suspended solids0.54−0.16−0.20
Electrical conductivity0.54−0.17−0.21
 Dissolved oxygen−0.080.48−0.05
Total phosphorus0.120.510.26
 Ammonium nitrogen0.33−0.170.30
 Nitrate nitrogen0.280.370.28
Total nitrogen0.370.270.37
 Chlorophyll a−0.24−0.190.34
 Biochemical oxygen demand in manganese0.41−0.16−0.16
Proportion of variance0.440.210.12
Cumulative proportion0.440.650.77
The variables with the highest loadings in each principal component (PC) are highlighted in bold.
Table 5. Results of principal component analysis (PCA) with seven sediment variables at 30 sample sites in the Poyang Lake wetland.
VariablesPC1PC2PC3
Total nitrogen0.320.640.39
Total phosphorus0.680.44−0.02
 Total organic carbon−0.02−0.590.42
Cu0.43−0.240.53
 Zn0.45−0.24−0.25
 Cd0.38−0.120.03
 Pb0.35−0.19−0.47
Proportion of variance0.360.250.14
Cumulative proportion0.360.610.75
The variables with the highest loadings in each principal component (PC) are highlighted in bold.
Table 6. Results of principal component analysis (PCA) with 12 land use and remote sensing variables at 30 sample sites in the Poyang Lake wetland.
VariablesPC1PC2PC3PC4
Percent of farmland0.110.22−0.620.06
Percent of forest0.090.17−0.06−0.83
 Percent of built-up land0.30−0.19−0.24−0.09
Shannon’s diversity index0.43−0.120.14−0.05
Connectance index0.010.560.180.03
 Patch richness density−0.320.340.210.18
 Patch density0.350.400.130.13
 Largest patch index−0.360.26−0.130.11
 Mean patch size−0.30−0.34−0.030.01
 Aggregation index−0.40−0.20−0.14−0.07
 NDVI0.25−0.04−0.390.44
 MNDBI0.18−0.240.500.19
Proportion of variance0.380.180.150.10
Cumulative proportion0.380.560.710.81
The variables with the highest loadings in each principal component (PC) are highlighted in bold. NDVI, normalized difference vegetation index; MNDBI, modified normalized difference built-up index.
Table 7. Results of principal component analysis (PCA) with nine socio-economic variables at 30 sample sites in the Poyang Lake wetland.
VariablesPC1PC2PC3
 Population density0.200.60−0.62
GDP0.100.950.21
 GDP per capita−0.590.72−0.01
 Total energy consumption0.70−0.48−0.19
Unit GDP energy consumption−0.31−0.270.85
 Environmental protection investment0.62−0.580.02
Total output of aquatic products0.980.110.07
 Average ordinary high school students per 10,000 population0.470.200.63
 Chemical fertilization intensity0.700.670.12
Proportion of variance0.450.260.10
Cumulative proportion0.450.710.81
The variables with the highest loadings in each principal component (PC) are highlighted in bold.
Table 8. Pairwise Spearman’s correlation coefficients between scores of five individual indices and the overall wetland health index (WHI).
BIWISILUISEI
WI0.58 ***----
SI0.67 ***0.69 ***---
LUI0.31 ns0.51 **0.29 ns--
SEI0.34 ns0.45 **0.50 **0.48 **-
WHI0.74 ***0.91 ***0.85 ***0.63 ***0.68 ***
BI, biological index; WI, water quality index; SI, sediment index; LUI, land use index; SEI, socio-economic index. **, p < 0.01; ***, p < 0.001; ns, not significant.
Disclaimer/Publisher’s Note: The statements, opinions and data contained in all publications are solely those of the individual author(s) and contributor(s) and not of MDPI and/or the editor(s). MDPI and/or the editor(s) disclaim responsibility for any injury to people or property resulting from any ideas, methods, instructions or products referred to in the content.

