Abstract
The glaciers in northwest China are mainly distributed in the northern part of the Himalayas, the Kunlun Mountains, and the Tianshan Mountains. Glaciers are an important freshwater resource in the northern part of the Kunlun Mountains, and the melting of glaciers and snow provides an assured source of water for rivers on the southern edge of the Tarim Basin. Based on the first glacier inventory dataset on China (1968), the second glacier inventory dataset on China (2009), and the glacier inventory dataset on Western China in 2018, this study used DEM data, Landsat remote sensing images, and ERA5 atmospheric reanalysis data to investigate glacier change and its influencing factors with respect to the northern part of the Kunlun Mountains. The results showed that there were 9273 glaciers in the northern part of the Kunlun Mountains in 2018, with an area of about 11,762.72 km2, an ice inventory of about 1168.53 km3, and an average length per glacier of about 1.68 km. The glaciers were mainly distributed at altitudes of 5300–6100 m (7574.66 km2). From 1968 to 2018, the number of glaciers in the northern stretch of the Kunlun Mountains increased by 343, while the glacier area decreased by 2452.80 km2 (−0.14%/a). From 2009 to 2018, the glacier area at the altitude of 4900 m to 6100 m decreased in the northern section of the Kunlun Mountains, and the glacier area at the remaining altitude increased slightly (10.67 km2). From 1968 to 2018, the glacier area and glacier length in all river basins decreased. The relative rate of glacier area change in the Qarqan River basin from 2009 to 2018 was five times that of 1968–2009, and this needs significant attention. From 1968 to 2018, both temperature and precipitation increased to varying degrees, and the increase in precipitation was beneficial to the accumulation of glaciers. Therefore, the increase in temperature was the main cause of glacier change in the northern section of the Kunlun Mountains.
1. Introduction
As an important indicator of global climate change [1], the cryosphere covers about 33% of the earth’s land surface [2], and it mainly consists of ice, snow, and frozen soil [3]; furthermore, it is an important part of the earth’s water system. In the Sixth Assessment Report of the IPCC, it was pointed out that over the next few decades, global warming will occur faster than predicted, the cryosphere will shrink rapidly, the mass loss of glaciers in most regions will continue to increase [4], and most mountain glaciers will shrink at an accelerated rate under the influence of global warming [5,6,7]. In the Paris Agreement in 2015, 195 countries proposed to maintain global temperature rise to within 1.5 °C; if the global temperature rise is 1.5 °C, the temperature in the high mountain areas of Asia will warm by 2.1 ± 0.1 °C. By the end of this century, only 64 ± 7% of the ice reserves in the glaciers in the high mountain areas of Asia will be retained [8,9,10,11,12]. Mountain glaciers, as a unique drought-resistant water source, are an important umbrella for arid and semi-arid regions that may protect a large number of people from drought [13,14]. About 800 million people depend on glacial meltwater from the high mountains of Asia. Understanding the changes of glaciers in the Kunlun Mountains will help prevent landslides, mudflows, drought, and flood disasters in Northwest China and alleviate local water shortages and the fragile ecological environment.
Globally, glaciers are mainly distributed in the polar regions and Mount Qomolangma in addition to the glaciers that are widely distributed in High-Mountain Asia. Crustal uplift has produced many mountains and plateaus in Western China. The unique climate in High-Mountain Asia provides favorable conditions for the development of glaciers, making China the region with the most extensive distribution of glaciers in the middle and low latitudes. The second glacier inventory of China showed that there were 48,571 glaciers in China in the 21st century, with a total area of 5.18 × 10⁴ km2, accounting for about 0.54% of China’s land area. Among the 14 mountain systems in China, the Kunlun Mountains have the largest number of glaciers [15]. Many scholars around the world have carried out research on glacier changes in the Kunlun Mountains. Muhammad and Tian [16] assessed the change in glacier mass in the West Kunlun Mountains (WKS) and compared the data from two glacier inventories in China; they found that the glacier area shrank by about 3.4 ± 3.1% from 1970 to 2010. Gardelle et al. [17] compared the digital elevation models (DEMs) between 2000 and 2008–2011 and found that there was a slight increase in the mass of the glaciers in Central Karakoram. Brun et al. [7] determined that the mass balance of the glaciated areas in High-Mountain Asia was about 92% by using a digital elevation model on data derived from satellite stereoscopic images and found that the mass balance within the region changed by −4.0 ± 1.5 Gt yr−1. Kumar et al. [18] quantified the change in mass budget of 24 glaciers in the Eastern Karakoram region by using geodetic surveying technology and found that the mass loss rate of glaciers in the region increased slightly from 2000 to 2014; this was due to the “Karakoram anomaly”, but, in the last decade, this phenomenon has gradually been disappearing. Cao et al. [19] calculated the glacier area and glacier mass balance at different time periods in the West Kunlun Mountains from 1970 to 2018 and studied the change in glacier surface elevation, showing that the glaciers in the Kunlun Mountains also showed a receding trend. In the context of a warming climate, most of the above scholars’ research results show that the glacier area and mass in most areas of the Kunlun Mountains have presented a decreasing trend over the last century, indicating that regional and global glacier and water resources will face severe challenges.
The Kunlun Mountains are among the most important mountain systems in Western China. As an important passage within the Silk Road Economic Belt, the northern part of the Kunlun Mountains is closely related to the sustainable development and utilization of water resources and the high-quality development of the region’s economy and ecology [20]. In spring, the melting of glaciers and snow in the high mountains in the northern part of the Kunlun Mountains provides a sufficient supply of water for rivers in the southern margin of the Tarim Basin. Under the general background of increased warming, the ecological environment of the basin is becoming extremely fragile [21]. It is critical to study glacier changes in the northern part of the Kunlun Mountains to create an economic foundation with which to provide ecological and environmental protection and establish restoration programs for local ecosystems, such as grasslands and oases, in order to assess and warn people of regional natural disaster risks to promote the rational management of water resources [9,22]. In the literature, there is a lack of systematic analysis and collation of glacier changes in the northern part of the Kunlun Mountains; therefore, a comprehensive understanding of glacier dynamics is highly important for the development of regional strategies for adapting to climate change and for the analysis of climate sensitivity [14,23].
This study uses the first and the second glacier inventory datasets of China and the 2018 Western glacier inventory data on China, combined with DEM data, Landsat remote sensing image data, and ERA5 Atmospheric Reanalysis data, to study glacial change and its influencing factors in the northern part of the Kunlun Mountains. This study fills the gap in glacier research with respect to this area. It provides scientific knowledge and theoretical support for understanding the variation characteristics of glacier resources, watershed disaster management, and the sustainable development of water resources in this region.
2. Study Area
The Kunlun Mountains are located in the north of the Qinghai–Tibet Plateau between Xinjiang and Tibet in Western China, ranging from the east of Pamir Plateau in the west to Xinjiang and Tibet and north to the territory of Qinghai province. The total length of the mountains is about 2500 km, spanning about 100–200 km in the north–south direction [24]. The Kunlun Mountains have a large span from east to west (they are wider in the east than in the west), with a total area of more than 500,000 km2 and an average elevation of 7649 m. The terrain is complex and gradually lowers from south to north, and 26.5% of this area is at an altitude greater than 25°. This complex terrain causes frequent mountain flood disasters [25]. The northern part of the Kunlun Mountains is located on the southern margin of the Tarim Basin, where a temperate desert climate is predominant and the total precipitation in the region is scarce. With an increase in altitude, the climate changes to that of an alpine desert zone, and the total annual precipitation increases slightly [26]. From east to west, the four basins in the northern part of the Kunlun Mountains are the Qarqan River, the Kriya River, the Hotan River, and the Yarkant River (Figure 1). The Qarqan River originates from Ulugh Muztagh in the northern part of the Kunlun Mountains, and the whole river spans over 800 km. The total precipitation in the basin is very low, and most precipitation occurs in the high mountainous area above 5000 m [27]. The Kriya River originates from Usstenge Mountain, the main peak of the Kunlun Mountains, with a total length of 438 km. The annual average temperature in the river basin is only 9.53 °C, and it is a typical glacier meltwater recharge river [28]. The upper reaches of the Hotan River basin are composed of the Yulong Kashi River and the Karrakashi River. The basin is cold and dry, with scarce precipitation and obvious signs of extreme droughts [29]. The Yarkant River originates from the northern part of the Karakoram Mountains. The climate in the basin is dry, and the rate of evaporation is high. There is little rain in this region throughout the year. These aspects characterize the river basin as having an arid continental climate [30]. There are a large number of glaciers in the four basins in the northern part of the Kunlun Mountains, and the source of replenishment of the basins is mainly meltwater from melting glaciers in the summer.
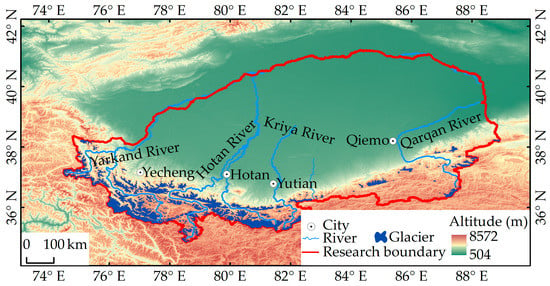
Figure 1.
Overview of the study area, including the extent of the study area, the main rivers and cities, elevation, and glacier distribution.
3. Materials and Methods
3.1. Data
3.1.1. Glacier Inventory Data
A glacier inventory is a systematic and integral arrangement of glaciers, and it can more intuitively reflect changes in glacier numbers and area [31]. The first glacier inventory data on China stemmed from the first glacier inventory work carried out from 1978 to 2002. Aerial topographic maps and aerial photographs from the 1950s to the 1980s were the main data sources. The data sources of the first and the second glacier inventory datasets on China mainly correspond to the years 1968 and 2009, respectively. The data were downloaded from the National Cryosphere Desert Data Center (http://www.ncdc.ac.cn/portal/, accessed on 1 November 2022). The 2018 glacier inventory dataset was collected in 2008. It was based on the second glacier inventory dataset on China. It was obtained using 315 Landsat remote sensing images, SRTM, and other data sources, which were combined with ArcGIS, Google Earth, and other software products enabling artificial visual interpretation; subsequently, the extraction of glacier boundaries and the updating of the glacier attributes in Western China from 2017 to 2018 were performed. The time source of the glacier data is mainly 2018. Data were downloaded from Chinese science website (http://www.csdata.org/p/551/, accessed on 1 November 2022).
3.1.2. DEM Data
A Digital Elevation Model (DEM) can accurately depict topography, and it is widely used in the study of topography, geomorphology, hydrological change, and construction engineering [32]. In this paper, DEM data were used to process the glacier area in ArcGIS software. At the same time, the length, slope, orientation, and altitude distribution of the glaciers were also processed and analyzed. The DEM used in this paper consists of the digital elevation data provided by GDEMN2. The spatial resolution of this dataset is 30 m, and it was downloaded from the Geospatial Data Cloud website (https://www.gscloud.cn/#page1/2, accessed on 1 December 2022).
3.1.3. Landsat Remote Sensing Images
Due to the harsh environments and complex climatic conditions of mountain glaciers, it is difficult for people to enter glacial areas for investigation and research; therefore, satellite remote sensing data (e.g., Landsat 1/2/3 MSS, 4/5 TM, 7 ETM+, 8/9 OLI, etc.) are often used to monitor and study glaciers [33,34,35]. The satellite remote sensing images used in this paper were downloaded from the United States Geological Survey website (https://earthexplorer.usgs.gov/, accessed on 1 November 2022) (Table 1). The images were acquired over a 6–9-month period in one year. To the greatest extent possible, images taken on sunny days were employed, so as to reduce the effects of clouds, rain, snow, and many other factors on the images. In this paper, based on Landsat remote sensing images combined with DEM data, the glacier boundaries of typical glaciers were manually revised through manual visual interpretation.

Table 1.
The remote sensing data used in this study.
3.1.4. Meteorological Data
Temperature and precipitation are the most basic elements used to analyze climate change [36,37]. ERA5 atmospheric re-analysis data combine satellite data with a variety of observation data, such as ground and upper-air data, to form a long time series of high-resolution data, which have been unanimously recognized as credible by the majority of scholars and widely used in the research of global meteorology and climate, weather, and weather model forecasting [38,39]. This study employed ERA5 temperature and precipitation data from 1968 to 2018 as the temperature and precipitation data in the northern stretch of the Kunlun Mountains. The data were downloaded from the Copernicus Climate Change Service platform website (https://cds.climate.copernicus.eu/, accessed on 5 December 2022) and have a spatial resolution of 0.1°.
Using the GEE (Google Earth Engine) platform, we averaged (or aggregated) the atmospheric reanalysis data of ERA5 in May to obtain the annual ERA5 data. On this basis, mask extraction was carried out on the glacier area to obtain the annual atmospheric reanalysis data of EAR5 in the region. The average temperature and total annual precipitation data of the glacier area in the summer (June, July, and August) were stored in TIFF format on Google Drive cloud platform. Using PyCharm programming software and GDAL package based on Python language, the annual atmospheric reanalysis data of EAR5 in the glacier area were converted into an array; then, the grid values were numerally counted to obtain the annual summer temperature and total precipitation data for the study area. Using the pymannkendall package of the Python language, the annual atmospheric reanalysis data of EAR5 in the glacier area were tested and analyzed using the MK trend at the spatial level, and the spatial distribution diagram of the annual rate of change in temperature every 2 m and the annual total precipitation data in the glacier area were obtained. The above steps were repeated. The significance test results regarding the annual 2 m summer temperature and annual total precipitation data in the spatial plane of the glacier area were obtained.
3.2. Methods
3.2.1. Methods of Calculating Ice Volume
Ice volume is one of the important indicators for studying glacier change and its impact on rivers, and studying the change in ice volume plays a key role in the regional and even global natural environment, economic development, and social development [40]. The most commonly used method for estimating ice volume is the volume–area empirical formula. This formula is simple and easy to understand, and it can be easily and quickly calculated [41]. The formula is as follows:
where V is ice volume (km3); A is the glacier area (km2); and c and r are empirical coefficients. Radić and Hock [42], Grinsted [43], and Liu et al. [44] put forward three empirical coefficients for estimating ice volume; the average of the three results yields the ice volume.
3.2.2. Methods of Extracting Glacier Length
Glacier length is another important indicator for studying glacier change, and it comprises the maximum length of a glacier and the average length of a glacier. Maximum glacier length is the maximum distance of a glacier’s axis, and the average length is the average of the maximum distance of each glacier or fim–basin to the end of the glacier [45]. For the extraction of glacier length, this paper adopts an automatic method for deriving glacier centerlines based on GlS proposed by Yao et al. [46], which is mainly based on the first and the second glacier inventory datasets of China and the 2018 glacier inventory data and integrates DEM to obtain the highest and lowest elevations in the glacier outline. We assume that each glacier has only one highest and one lowest elevation. The highest and lowest elevation near the glacier can be obtained by sorting the automatically extracted elevation points according to their elevation values; then, the points on the glacier outline nearest to them, which are the highest and lowest elevations of the glacier, can be determined through proximity analysis. Subsequently, the glacier outline was segmented, the Euclidean metric method was used to divide the glacier into two regions, and the common edge of the region was ascertained as the streamline in the glacier [32]. The corresponding algorithm is shown in Figure 2.
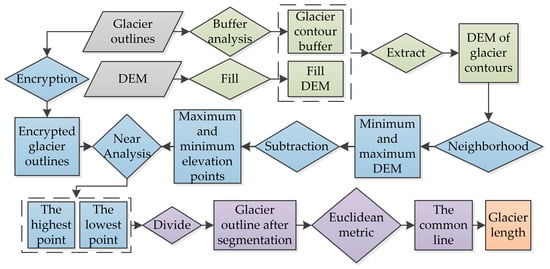
Figure 2.
The main algorithm used to determine the length of a glacier.
3.2.3. Method of Calculating Glacier Area Change
The time span of the three glacier inventory datasets in the four basins in the northern part of the Kunlun Mountains is relatively large. In order to facilitate the comparison of glacier change in different river basins, this paper adopts two calculation methods, namely, the change rate of glacier area (length) and the relative rate of glacier area (length) change [47], whose formulae are as follows:
where VGC is the rate of glacier area (length) change [km2/a (km/a)]; PVGAC is the relative rate of glacier area (length) change (%/a); GAr and GAs are the area (length) of the glacier in the latter period and the previous period, respectively; Ys−r is the time interval of the glacier data sources in two periods; and the unit is year.
4. Results
4.1. The Glaciers in the Northern Part of the Kunlun Mountains in 2018
4.1.1. Glaciers in Areas of Different Sizes
According to an evaluation and revision of the glacier volume data of the northern part of the Kunlun Mountains in 2018, there were 9273 glaciers in the northern part of the Kunlun Mountains in 2018, covering an area of about 11,762.72 km2 and accounting for an ice volume of about 1168.53 km3 and an average length of about 1.68 km. The glaciers in the northern part of the Kunlun Mountains were predominantly glaciers with an area of <1 km2. There were 7387 of these glaciers, accounting for 79.66% of the total number of glaciers (Figure 3a). The glaciers in this region predominantly had an area of >2 km2, amounting to a total area of 8573.67 km2, which accounts for 72.89% of the total glacier area (Figure 3a). The ice volume was dominated by glaciers with an area of >10 km2, and the ice volume of glaciers was about 833.34 km3, accounting for about 71.32% of the total glacier volume (Figure 3b). The increase in the average length of glaciers was consistent with the increase in glacier area: the average length of glaciers with an area of <0.1 km2 was about 0.39 km, and the average length of glaciers with an area of >100 km2 was about 30.55 km (Figure 3b). There are only eight glaciers with an area of more than 100 km2 in the region, covering an area of about 1525.11 km2 (11.76%) and amounting to a glacier volume of about 362.78 km3. The largest glacier is Insukati glacier, which has an area of 352.13 km2. The glacier code was G076053E36033N, corresponding to Xinjiang.
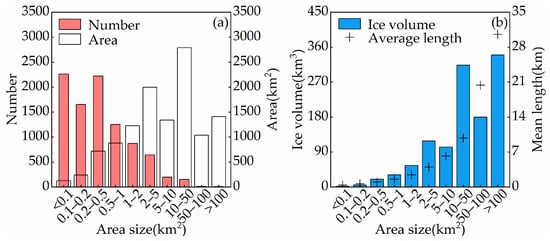
Figure 3.
The number, area, ice volume, and average length of glaciers in regions of different sizes in the northern part of the Kunlun Mountains in 2018. (a) Number and area of glaciers. (b) Ice volume and average length.
4.1.2. Glaciers in Different River Basins
According to the statistics on glaciers in different river basins (Table 2), it was found that the Hotan River basin had the largest number of glaciers, totaling 3890 and accounting for 41.95% of the total number of glaciers, followed by the Yarkant River basin, containing a total of 3447 glaciers that accounted for 37.17% of the total number of glaciers, and the Qarqan River basin, which had the fewest glaciers, with a total of 959 that accounted for 10.34% of the total number of glaciers. In terms of glacier area, the area of glaciers in the Hotan River basin was the largest, amounting to 4995.67 km2 (42.47%), followed by the Yarkant River basin, whose glacier area was 4636.17 km2 (39.41%), while the Qarqan River basin had the smallest glacier area, amounting to 757.90 km2 (6.44%). In terms of ice volume, the ice volume in the Hotan River basin was the highest, amounting to 515.34 km3 (44.10%), followed by the Yarkant River basin, whose ice volume was 497.81 km3 (42.60%), while the ice volume in the Qarqan River basin was the lowest, amounting to 59.86 km3 (5.12%). In terms of the average length of the glaciers, the average length of glaciers in the Kriya River basin was the longest, amounting to 1.84 km, while the average length of glaciers in the Qarqan River was the shortest, amounting to 1.14 km. In conclusion, the number, area, and ice volume of the glaciers in the Hotan River basin were the largest, while the Kriya River had the highest average glacier length.

Table 2.
The statistics on glaciers in the northern part of the Kunlun Mountains in different basins.
4.1.3. The Difference in Glacier Elevation and the Average Glacier Length
The absolute elevation of mountains is the main topographic factor affecting the distribution of mountain glaciers. According to Figure 4, the following values, namely, R2 = 0.71 and P < 0.05, show that there was a strong correlation between glacier length and glacier elevation difference in the northern part of the Kunlun Mountains; the greatoer the glacier elevation difference, the longer the glacier length, and vice versa. There were 6088 glaciers with an elevation difference less than 500 m, of which 4990 glaciers were less than 1 km in length (81.93%). There were 2510 glaciers with an elevation difference between 500 m and 1000 m, among which 2505 glaciers were less than 10 km in length (99.80%). There were 672 glaciers with an elevation difference of more than 1000 m, and their glacier lengths were all less than 50 km.
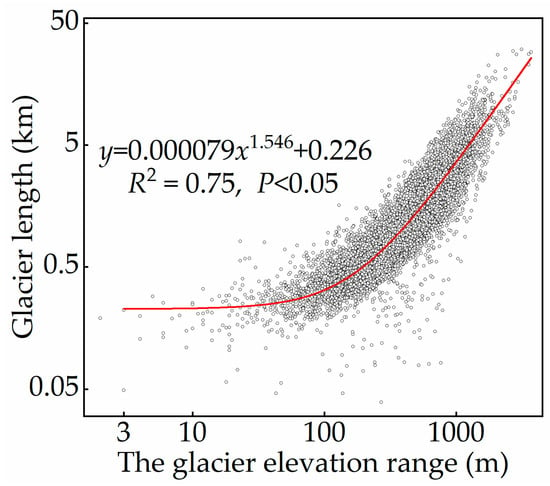
Figure 4.
Fitting of glacier length and glacier elevation difference in the northern part of the Kunlun Mountains.
4.2. The Glacier Change in the Northern Part of the Kunlun Mountains from 1968 to 2018
4.2.1. Glacier Change in Areas of Different Sizes
According to the three glacier inventories of the northern part of the Kunlun Mountains, the number of glaciers in the northern part of the Kunlun Mountains increased by 343, the glacier area decreased by 2452.82 km2 from 1968 to 2018, and the relative rate of area change was −0.14%/a. According to our research, only the number of glaciers with an area of <0.2 km2 increased slightly, with an increase of 1471, and the glacier area increased by 93.11 km2 (Figure 5). From 1968 to 2018, the number of glaciers with an area of 0.5–1 km2 decreased the most, namely, the number of glaciers was reduced by 344, while the number of glaciers with an area of 50–100 km2 decreased the least, only experiencing the loss of 1 glacier. The area of glaciers with an area of >100 km2 decreased the most: the area was reduced by 506.00 km2. The area of glaciers with an area of 50–100 km2 decreased the least: the area was reduced by 92.02 km2. The area of glaciers with an area of >100 km2 decreased the fastest, and the relative rate of glacier area change was −0.61%/a. The area of glaciers with an area of 50–100 km2 decreased the slowest, and the relative rate of glacier area change was −0.17%/a.
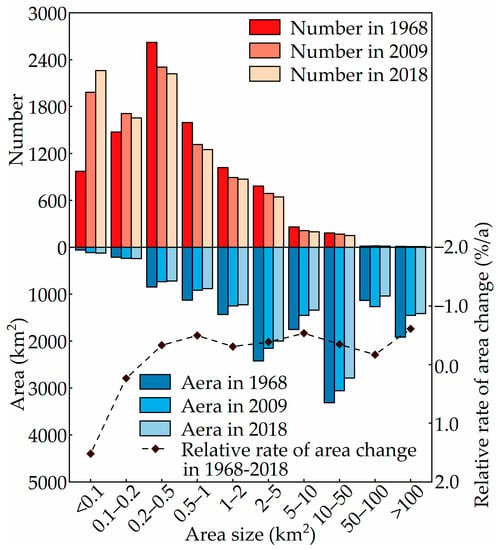
Figure 5.
Glacier change in different areas in the northern part of the Kunlun Mountains.
In 2018, the northern part of the Kunlun Mountains predominantly featured glaciers with an area grade of 1 km2 (79.66%). This was mainly due to the disintegration and fragmentation of the medium and the large-area glaciers in the studied region; as a result, the number of small-area glaciers continues to increase (Figure 3a). Taking the G078568E35262N glacier as an example, the area of this glacier decreased by 0.78 km2 from 1991 to 2020: its area was 1.97 km2 in 1991, decreasing to 1.19 km2 in 2019 (Figure 6a,b). The glacier coded as G075142E37537N split between 1990 and 2020 (Figure 6c,d). This glacier’s area was 3.10 km2 in 1990; in 2020, the glacier split into four parts, whose areas were 0.03 km2, 0.03 km2, 0.16 km2, 0.81 km2, and 1.13 km2, respectively.
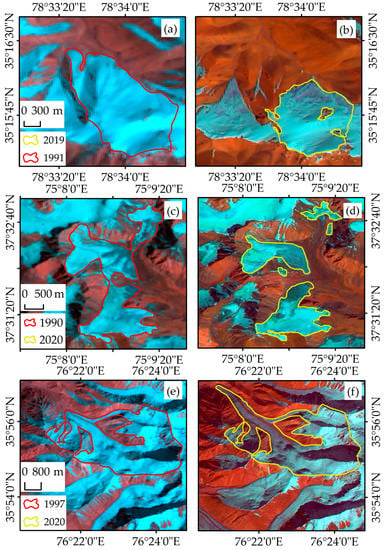
Figure 6.
The fragmentation and change of the glaciers. (a) Background: Landsat TM image obtained on 28 August 1991 (bands 5, 4, and 3); (b) background: Landsat OLI image obtained on 10 September 2019 (bands 6, 5, 2, and 4); (c) background: Landsat TM image obtained on 7 August 1990 (bands 5, 4, and 3); (d) background: Landsat OLI image obtained on 25 August 2020 (bands 6, 5, 2, and 4); (e) background: Landsat TM image obtained on 20 September 1997 (bands 5, 4, and 3); (f) background: Landsat OLI image obtained on 21 October 2019 (bands 6, 5, 2, and 4).
In addition, since most of the glaciers in the upper reaches of the Yarkant River basin belong to the glaciers of the Karakoram region and since the glacier anomaly in the Karakoram region is an undisputed fact, there are some leaping glaciers in the region. Taking G076384E35917N as an example (Figure 6e,f), the area of the glacier surges from 1997 to 2020. The glacier’s area was 10.75 km2 in 1997, increasing to 11.40 km2 in 2020; thus, the glacier’s area increased by 0.65 km2, and the glacier advanced to the northwest by about 1.52 km.
4.2.2. The Glacier Change at Different Elevation Intervals
The changes in glacier area at different elevations were studied in various basins in the northern part of the Kunlun Mountain range. It was found that the glacier area at different elevations in the Qarqan River basin decreased in two periods from 1968 to 2009 and from 2009 to 2018. The median elevation of glacier area in 1968, 2009, and 2018 increased, corresponding to a decrease in glacier area (Figure 7a). Glacier loss was concentrated between 4500 and 4900 m (Figure 7b). From 1968 to 2018, glaciers between 4500 m and 4900 m above sea level reduced the fastest (−0.48%/a). In the Kriya River basin, except for the period from 2009 to 2018, the glacier area at an altitude of 3700 m to 4100 m increased slightly (0.011 km2), while the glacier area in the rest of the periods decreased, and the glacier loss was mainly concentrated between 4900 m and 6100 m. The median elevation of glacier area increased in 2009 and 2018, which also corresponded to a decrease in glacier area (Figure 7c,d). From 1968 to 2018, glaciers with elevations between 3700 m and 4100 m reduced the fastest (−0.79%/a). In the Hotan River basin, during the period from 2009 to 2018, the glacier area increased slightly between the altitudes of 3700 m and 4900 m (3.48 km2), while the glacier area decreased in the rest of the period, and the glacier loss was mainly concentrated between 4900 and 6100m. The median glacier area in 2009 was higher than that in 1968 and slightly lower than that in 2018 (Figure 7e,f). From 1968 to 2018, glaciers between 4500 m and 4900 m above sea level reduced the fastest (−0.86%/a). In the Yarkant River basin, from 1968 to 2009, the glacier area decreased, while the glacier area at most altitudes increased from 2009 to 2018 (10.01 km2), and the glacier loss was concentrated between 4900 m and 6100 m (Figure 7g,h). The median glacier area in 2009 was higher than that in 1968 and slightly lower than that in 2018. Overall, the glacier area in the northern part of the Kunlun Mountains decreased from 1968 to 2009. From 2009 to 2018, the glacier area at an altitude of 4900 m to 6100 m decreased, while the glacier area at the remaining altitudes increased slightly (10.67 km2). From 1968 to 2018, glaciers between 4500 m and 4900 m above sea level reduced the fastest (−0.58%/a). The median elevations of glacier area in the northern part of the Kunlun Mountains in 1968, 2009, and 2018 were 5759.34 m, 4781.18 m, and 5781.65 m, respectively, reflecting the decrease in glacier area in the northern part of the Kunlun Mountains from 1968 to 2009 and the stability of glacier area from 2009 to 2018 (Figure 8a,b).
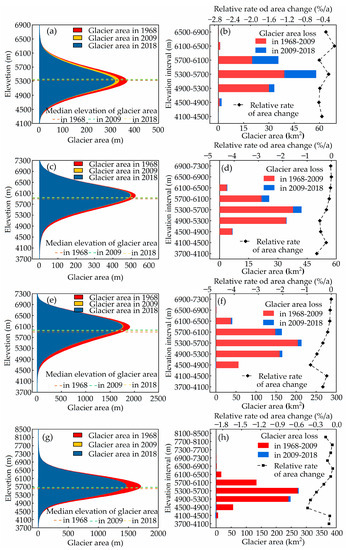
Figure 7.
The glacier area changes at different altitude intervals in different basins in the northern part of the Kunlun Mountains. (a) The Qarqan River basin: The change in glacier area with elevation and the median elevation of glacier area in 1968, 2009, and 2018. (b) The Qarqan River basin: The relative rate of glacier area changes and the loss of glacier area at different altitude intervals from 1968 to 2009 and 2009 to 2018. (c) The Kriya River basin: The change in glacier area with elevation and the median elevation of glacier area in 1968, 2009, and 2018. (d) The Kriya River basin: The relative rate of glacier area changes and the loss of glacier area at different altitude intervals from 1968 to 2009 and 2009 to 2018. (e) The Hotan River basin: The change in glacier area with elevation and the median elevation of glacier area in 1968, 2009, and 2018. (f) The Hotan River basin: The relative rate of glacier area changes and the loss of glacier area at different altitude intervals from 1968 to 2009 and 2009 to 2018. (g) The Yarkant River basin: The change in glacier area with elevation and the median elevation of glacier area in 1968, 2009, and 2018. (h) The Yarkant River basin: The relative rate of glacier area changes and the loss of glacier area at different altitude intervals from 1968 to 2009 and 2009 to 2018.
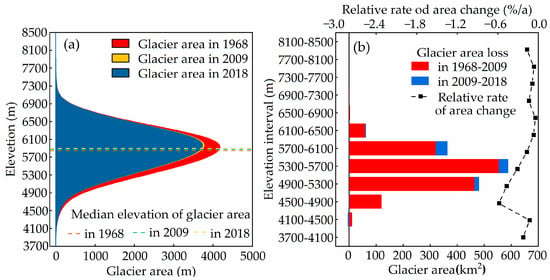
Figure 8.
The glacier area changes at different altitude intervals in the northern part of the Kunlun Mountains. (a) The change in glacier area with elevation and the median elevation of glacier area in 1968, 2009, and 2018. (b) The relative rate of glacier area changes and the loss of glacier area at different altitude intervals from 1968 to 2009 and 2009 to 2018.
4.2.3. The Glacier Change in Different River Basins
From 1968 to 2018, the glaciers in the Hotan River basin decreased the most, with an area of 995.50 km2, and the glaciers in the Qarqan River basin decreased the least, with an area of 413.02 km2. The length of glaciers in the Qarqan River basin was shortened the most, by 0.21 km, and the length of glaciers in the Yarkant River basin was shortened the least, by 0.03 km. The glacier area in the Qarqan River basin decreased the fastest (−0.87%/a), and the glacier area in the Yarkant River basin decreased the slowest (−0.35%/a). The glacier length in the Qarqan River basin decreased the fastest (−0.33%/a), and the average glacier length in the Hotan River basin decreased the slowest (−0.03%/a).
The relative rate of area change in the northern part of the Kunlun Mountains from 1968 to 2009 and 2009 to 2018 showed decreasing trends: the relative rates of glacier area change were −0.39%/a and −1.36%/a, respectively (Figure 9). From 1968 to 2009, the glacier area of the Qarqan River basin decreased the fastest, as its relative rate of glacier area change was −0.47%/a, followed by the Kriya River basin (−0.43%/a), while the glacier area of the Hotan River basin decreased the slowest (−0.28%/a). From 2009 to 2018, the glacier area in the Qarqan River basin decreased the fastest, presenting a relative rate of glacier area change of −2.43% /a, followed by the Kriya River basin (−2.03%/a), while the glacier area change of the Yarkant River basin decreased the slowest (−0.18%/a).
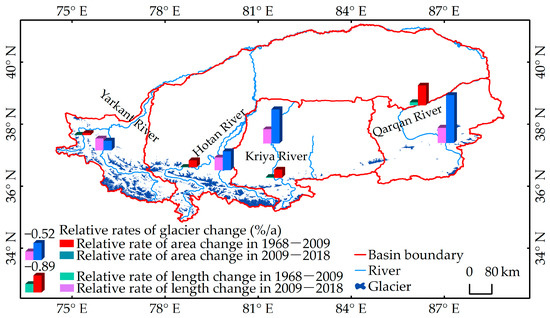
Figure 9.
The change in glacier area and length in different basins in the northern part of the Kunlun Mountains.
During the two periods of 1968–2009 and 2009–2018, the relative rate of glacier length change in the northern part of the Kunlun Mountains also showed a decreasing trend (Figure 8). From 1968 to 2009, the glacier length in the Qarqan River basin decreased the fastest, presenting a relative rate of glacier length change of −0.15%/a, followed by the Kriya River basin (−0.04%/a), while the glacier length in the Hotan River basin decreased the slowest (−0.01%/a). From 2009 to 2018, the glacier length in the Qarqan River basin decreased the fastest, presenting a relative rate of glacier length change of −1.03%/a, followed by the Kriya River basin (−0.43%/a), while that of the Yarkant River basin was the slowest (−0.11%/a). The relative rate of change in glacier area in the Qarqan River basin was the largest during the two periods of 1968–2009 and 2009–2018, and the relative rate of glacier area change in the latter stage was about five times that of the previous stage. The relative rate of glacier length change in the Qarqan River basin was also the greatest during the two periods of 1968–2009 and 2009–2018. This phenomenon should attract great attention to the glaciers in the Qarqan basin in the northern part of the Kunlun Mountains.
4.3. The Influencing Factors of Glacier Change in the Northern Part of the Kunlun Mountains
4.3.1. Climate Change
The average summer temperature and the annual precipitation in the glaciated area in the northern part of the Kunlun Mountains increased slightly from 1968 to 2018 (Figure 10). The overall average summer temperature in the glacier area decreased over this 50-year-period. The temperature fluctuated between −1 °C and 3 °C, and the average summer temperature was 0.92 °C. The temperature showed a rising trend, and the temperature change rate was 0.2 °C/10a. In the studied period, the highest temperature in summer in the glacier area was recorded in 1994 (2.40 °C), and the lowest temperature was recorded in 1983 (−0.75 °C). The annual precipitation in the glacier area was 447.2 mm during the analyzed 50-year-period, and the total annual precipitation increased slowly year by year; the precipitation change rate was 12.21 mm/10a. In the studied period, the highest annual precipitation occurred in 2017 (525.0 mm), and the lowest value occurred in 1968 (358.2 mm). In summary, the rate of change in the average summer temperature and annual precipitation were relatively slow, but the overall temperature and precipitation still showed an increasing trend.
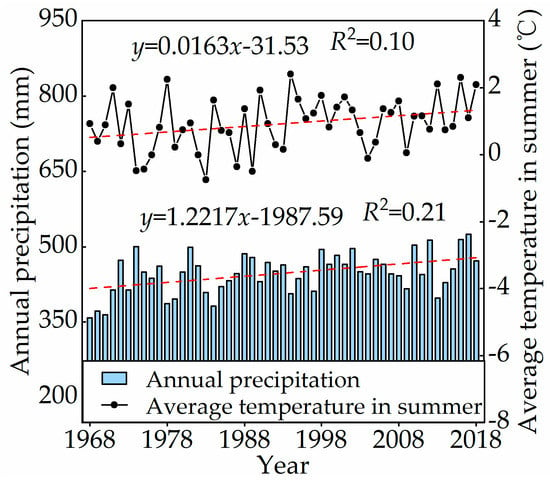
Figure 10.
Interannual changes in average temperature in summer and annual precipitation from 1968 to 2018 in glaciated area in the northern part of the Kunlun Mountains.
From 1968 to 2018, the average summer temperature in the glaciated area in the northern part of the Kunlun Mountains was 0.20 °C (Figure 11a), and the amount of annual precipitation was 438.3 mm (Figure 11b). The spatial distribution of the summer temperature and annual average precipitation in the glaciated area was not uniform and generally showed a gradually increasing trend from south to north; this is mainly related to the topography of the northern part of the Kunlun Mountains. The average summer temperature in the Qarqan River basin was the highest (2.53 °C), followed by that in the Yarkant River basin (2.39 °C), while that in the Hotan River basin was the lowest (0.46 °C). The annual precipitation in the Yarkant River basin was the highest (479.5 mm), followed by that in the Kriya River basin (470.5 mm), while that in the Hotan River basin was the lowest (462.3 mm).
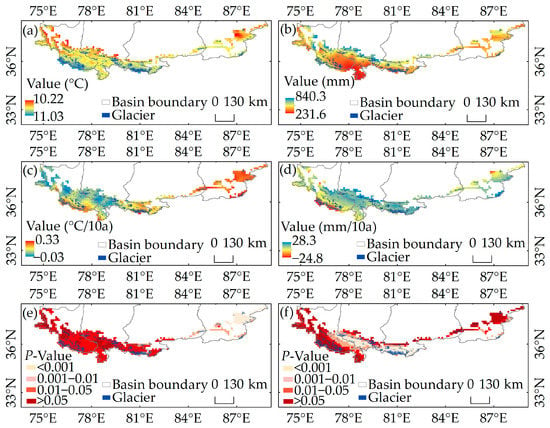
Figure 11.
Spatial distribution of the average summer temperature and the annual precipitation in glaciated area in the northern part of the Kunlun Mountains from 1968 to 2018. (a) Spatial distribution of the average summer temperature (°C). (b) Spatial distribution of the annual precipitation (mm). (c) The rate of change in summer temperature (°C/10a). (d) The rate of change in annual precipitation (mm/10a). (e) Significance test regarding average summer temperature. (f) Significance test regarding annual precipitation.
The spatial variation of the average summer temperature and annual precipitation was inconsistent in the glaciated area in the northern part of the Kunlun Mountains. For the most part, the summer temperature in the glaciated area presented a warming trend (Figure 11c), and the average temperature change rate was 0.15 °C/10a. The average rate of change in summer temperature in the Qarqan River basin was the fastest (0.27 °C/10a), followed by the Kriya River basin (0.20 °C/10a), while the spatial rate of change in summer temperature in the Yarkant River basin was the slowest (0.09 °C/10a). The annual precipitation change rate in the glaciated area was 11.5 mm/10a, with a trend of slow hydration (Figure 11d). The annual precipitation change rate in the Hotan River basin was the largest (16.0 mm/10a), followed by that of the Kriya River basin (15.0 mm/10a), while the annual precipitation change rate of the Yarkant River basin was the smallest (8.7 mm/10a).
We conducted a significance test on the average summer temperature change rates and annual precipitation in the glaciated area (Figure 11e,f) and found that the summer temperature change rates in the Qarqan River basin and the Kriya River basin passed the significance test, while some areas in the Hotan River basin and the Yarkant River basin did not pass the significance test. Small regions in the Kriya River basin and the Hotan River basin did not pass the significance test with respect to the precipitation change rate, while some parts of the Qarqan River basin and the Yarkant River basin did not pass the significance test. Changes in temperature and precipitation are unstable in mountainous areas due to their complex topography, so it is normal for some areas in mountainous regions to fail a significance test.
4.3.2. Topographic Factors
Topography plays an important role in glacier change. The orientation of a glacier affects the water and heat balance of the glacier in a region, thereby affecting the retreat of the glacier. As shown in Figure 12a, the glacier area in the glaciers oriented northwards was the largest in 1968, 2009, and 2018, and the area of these glaciers was 3505.33 km2, 3315.00 km2, and 3300.86 km2, respectively. During two periods from 1968 to 2009 and 2009 to 2018, the glacier area in all orientations showed a decreasing trend. From 2009 to 2018, the glacier area decreased slightly and remained basically unchanged. From 1968 to 2018, the area of the northeast-oriented glaciers decreased the most, decreasing by 343.46 km2 (18.60%), while the area of the south-oriented glaciers decreased the least, decreasing by 158.84 km2 (9.07%). Figure 12b shows that from 1968 to 2018, the area of the glaciers facing southwest decreased the fastest, for which the relative rate of glacier area change was −0.38%/a. The area of the glaciers facing north decreased the slowest, for which the relative rate of glacier area change was −0.16%/a.
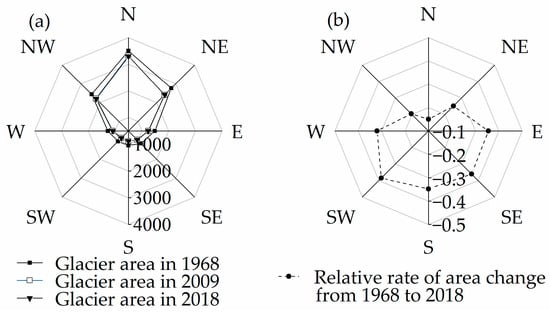
Figure 12.
The change in glacier area in different orientations in the northern part of the Kunlun Mountains. (a) Glacier area of different orientations on the northern part of the Kunlun Mountains in 1968, 2009 and 2018. (b) Relative rate of glacier area change in different orientations on the northern part of the Kunlun Mountains from 1968 to 2018.
Slope is another major topographic factor affecting glacier area change. It affects temperature through its influence on solar radiation. As shown in Figure 13, the glaciers in the northern part of the Kunlun Mountains were concentrated in the average slope range of 0°–30°, and glaciated areas in all parts decreased from 1968 to 2018. Among them, the area of each slope glacier decreased slightly from 2009 to 2018, remaining essentially unchanged. The area of glaciers with an average slope between 20° and 30° decreased the most, decreasing by 485.08 km2 (26.76%), and the area of glaciers with an average slope between 70° and 80° decreased the least, decreasing by 0.86 km2 (0.04%). The area of glaciers with an average slope of 30°–40° decreased the fastest, for which the relative rate of glacier area change was −0.37%/a. The area of glaciers with an average slope of 60°–70° decreased the slowest, for which the relative rate of glacier area change was −0.06%/a.
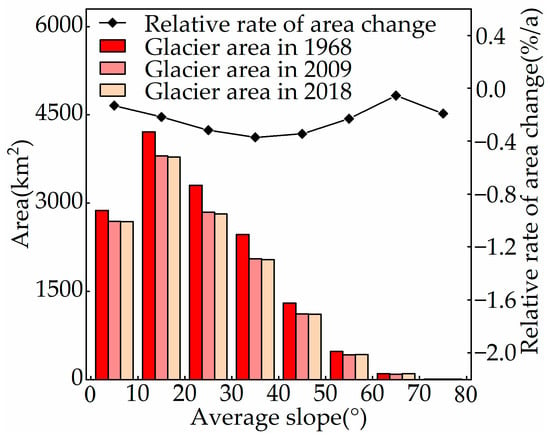
Figure 13.
The glacier area change of different regions in the northern part of the Kunlun Mountains.
5. Discussion
The four basins in the northern part of the Kunlun Mountains are part of the Tarim River basin, so we refer to previous studies on the area and variation of glaciers in the Tarim River basin. Liu et al. [48] showed that the glacier area in the Tarim River basin decreased by 1307.2 km2 (6.6%) from 1963 to 1999. Shangguan et al. [49] studied the changes of 7665 glaciers among 11665 glaciers in seven basins in the Tarim River by comparing the inventory of glaciers in China in the 1960s with Landsat images taken around the year 2000 and found that the glacier area decreased by 3.3%. In summary, the glacier area of the Tarim River basin showed a decreasing trend from the 1960s to the early 21st century, and the glacier area shrank. Based on the first and second glacier inventories in China, the 2018 glacier inventory DEM data, and Landsat remote sensing image data, this paper studied the glacier changes in four basins in the northern part of the Kunlun Mountains. It was found that the glacier area decreased from 1968 to 2009 and from 2009 to 2018, amounting to a total decrease of 4452.01 km. The glacier area decreased by about 1940.31 km2 from 1968 to 2009 and by about 1011.35 km2 from 2009 to 2018. This study is mainly based on the first and the second glacier inventory datasets of China and the glacier inventory data of 2018, combined with DEM data and a small number of remote sensing image data, so a slight deviation in the results is within the acceptable range.
Theoretically speaking, with the influence of global warming, most glaciers are in a state of retreat, so the glaciers in the Tarim River basin would behave the same way. Based on the general trends, glacier retreat in a short period of time will increase river water volume and increase the instability of a river via glacier meltwater recharge. With the continuous retreat of a glacier, the meltwater produced by the glacier will decrease, and the rivers primarily supplied by the meltwater of the glacier, especially smaller tributaries, will face the threat of gradual desiccation [50]. Liu et al. [51] simulated the summer glacier runoff of a typical glacier in the Tarim River basin using the degree day model and pointed out that since 1957, both the runoff of mountain pass and glacier in this basin have experienced a change from a decrease to an increase, especially in the 1990s; the increase in glacier runoff accounted for 1/3 of the increase in mountain runoff. However, in the 1980s, when there was less mountain runoff, the amount of glacier runoff increased, indicating that the influence of glacier retreat on the increase in runoff over a short period of time had strengthened. Regarding the change in glacier runoff over long time scales, glacier runoff levels usually increase before reaching a peak, proceeding to decrease after this point. Simply put, the overall trend of change will first increase, reach a peak, and then decrease. The theory of glacier runoff change in the Tarim River basin should be the same, but the large-scale and long-term glacier runoff simulation change in the Tarim River basin (four basins in the northern part of the Kunlun Mountains) still needs further research and discussion.
As some glaciers in the upper reaches of the Yarkant River basin belong to the Karakoram, we have counted these glaciers separately. It was found that in 1968, there were 1712 glaciers belonging to the Karakoram in the Yarkant River basin, with a total glacier area of 4105.99 km2. In 2009, there were 1903 glaciers with a total area of 3602.62 km2, and in 2018, there were 2504 glaciers with a total area of 3806.39 km2. By comparing the above data, it can be gleaned that from 1968 to 2009, the number of glaciers belonging to the Karakoram in the Yarkant River basin increased, while the area decreased, and the increase in number was mainly due to the fragmentation and disintegration of large-scale glaciers. However, from 2009 to 2018, the number of glaciers in the Yarkant River basin belonging to the Karakoram was still increasing, but the area was also increasing, constituting a phenomenon known as the Karakoram anomaly. In fact, this phenomenon existed before 2009, but due to the large time span from 1968 to 2009, the phenomenon of glacier stability or expansion in the Karakoram in some years was “masked”. Guan et al. [52] studied surging glaciers in West Kunlun from 1972 to 2020 using remote sensing image data and found that among 423 glaciers, 10 were surging glaciers and 3 were potential surging glaciers. Ke et al. [53] updated the 2013 information on the West Kunlun glaciers using remote sensing image data and DEM data. The results of the corresponding study showed that the average mass increase rate of the glaciers is 0.20 ± 0.04 m/a, and about half of the glaciers increase in mass faster in the melting area than in the accumulation area. The study of glacier changes in the Yarkant River basin in the cited paper shows that the glacier area in the Yarkant River basin decreased the least from 2009 to 2018 and that the relative rate of glacier area change was the slowest (−0.18%/a). However, the glacier area in the Karakoram has increased, while the glacier area in the whole river basin still decreased slightly. The results of this paper are slightly different, mainly due to the difference in the study years of the data and data sources, but they still indicate that the Karakoram glacier in the Yarkant River basin exhibits an essentially stable or expanding phenomenon, and the glacier in the whole basin exhibits weak retreat.
6. Conclusions
In this study, the glacier changes in the northern part of the Kunlun Mountains were studied, and the influencing factors of the glacier changes were analyzed. It was found that there were 9273 glaciers in the northern part of the Kunlun Mountains in 2018, with an area of about 11,762.72 km2, an ice inventory of about 1168.53 km3, and an average length of about 1.68 km. The glaciers were mainly distributed between 5300 m and 6100 m above sea level, and the glacier area was 7574.66 km2 (64.64%). The glaciers predominantly featured an area of <1 km2, totaling 7387. Most of the glaciers in the region had an area of >2 km2, amounting to a total of 8573.67 km2. There was a strong correlation between glacier length and elevation difference in the northern part of the Kunlun Mountains, for which the R2 was 0.75. According to the statistics regarding the glaciers in different basins, the quantities, area, and ice inventories in the Hotan River basin were the largest, corresponding to values of 3890 (41.95%), 4995.67 km2 (42.47%), and 515.34 km3 (44.10%), respectively, while the average length of glaciers in the Kriya River basin was the longest, equaling 1.84 km.
From 1968 to 2018, the number of glaciers in the northern part of the Kunlun Mountains increased by 343, the glacier area decreased by 2452.80 km2, and the relative rate of area change was −0.14%/a. The number of glaciers with an area of <0.2 km2 increased slightly, increasing by 1471, and the glacial area of the glaciers with an area of >100 km2 decreased the fastest (−0.61%/a). The glacier area at different elevations in the Qarqan River basin and the Kriya River basin decreased in two periods from 1968 to 2009 and from 2009 to 2018. Glacier loss was concentrated between 4500 and 4900 m in the Qarqan River basin. In the Hotan River basin, from 2009 to 2018, the glacier area increased slightly between the altitudes of 3700 m and 4900 m (3.48 km2). In the Yarkant River basin, the glacier area decreased from 1968 to 2009, while the glacier area at most altitudes increased from 2009 to 2018 (10.01 km2). The glacier losses were concentrated between 4900 and 6100 m in the Kriya River basin, the Hotan River basin, and the Yarkant River basin. Overall, the glacier area in the northern part of the Kunlun Mountains decreased from 1968 to 2009. From 2009 to 2018, the glacier area at altitudes of 4900 m to 6100 m decreased, while the glacier area at the remaining altitudes increased slightly (10.67 km2). From 1968 to 2018, glaciers between 4500 m and 4900 m above sea level reduced the fastest (−0.58%/a).
The relative rate of area change in the northern part of the Kunlun Mountains from 1968 to 2009 and 2009 to 2018 showed a decreasing trend, presenting values of −0.39%/a and −1.36%/a, respectively. The relative rate of glacier length change in the northern part of the Kunlun Mountains also showed a decreasing trend. From 1968 to 2009, the glacier length in the Qarqan River basin decreased the fastest (−0.15%/a), while from 2009 to 2018, the glacier length in the Qarqan River basin decreased the fastest (−1.03%/a). From 1968 to 2009, the glacier area of the Qarqan River basin decreased the fastest (−0.47%/a). From 2009 to 2018, the glacier area in the Qarqan River basin decreased the fastest (−2.43%/a). Additionally, the relative rate of glacier area change in the Qarqan River basin from 2009 to 2018 was five times that of 1968–2009. This phenomenon should arouse great attention with respect to the glaciers in the Qarqan basin in the northern part of the Kunlun Mountains.
In addition, from 1968 to 2018, the glacier area of glaciers facing southwest decreased the fastest (−0.38%/a), while the glacier area of the glaciers facing north decreased the slowest (−0.16%/a). The area of glaciers with an average slope of 30°–40° decreased the fastest (−0.37%/a). The area of glaciers with an average slope of 60°–70° decreased the slowest (−0.06%/a).
From 1968 to 2018, both temperature and precipitation increased to varying degrees, and the increase in precipitation was conducive to the accumulation of glaciers, while the increase in temperature just about compensated for the impact of the increase in precipitation on glaciers. Therefore, rising temperatures are the main cause of glacier change in the northern part of the Kunlun Mountains.
Author Contributions
Conceptualization, S.N. and M.S.; methodology, S.N. and X.Y.; software, S.N. and C.Z.; validation, S.N., M.S. and W.W.; resources, S.N. and M.S.; data curation, S.N. and G.W.; writing—original draft preparation, S.N.; writing—review and editing, S.N.; All authors have read and agreed to the published version of the manuscript.
Funding
This research was funded by the National Natural Science Foundation of China (No. 42161027), the Third Xinjiang Scientific Expedition Program (No. 2021xjkk0801), the Natural Science Foundation of Gansu Province (No. 21JR7RA143), the National Natural Science Foundation of China (No. 42071089), the Wetland Protection and Restoration Program (No. QHDY2022-12-12A), and the Higher Education Innovation Fund Project of Gansu Province (No. 2021KYZZ02141).
Data Availability Statement
The authors thank the National Cryosphere Desert Data Center (http://www.ncdc.ac.cn/portal/) and the Chinese science website (http://www.csdata.org/p/551/), all accessed on 1 November 2022.
Acknowledgments
In this article, we sincerely appreciate the server resources provided by Google Earth Engine. We sincerely thank the NASA Earthdata Search website for providing remote sensing images.
Conflicts of Interest
The authors declare that there were conflicts of interest involved in this study.
References
- Qin, D.H.; Zhou, B.T.; Xiao, C.D. Cryospheric change and its impact on climate in China. J. Meteorol. Res. 2014, 28, 732–1746. [Google Scholar] [CrossRef]
- Edwards, T.L.; Nowicki, S.; Marzeion, B.; Hock, R.; Goelzer, H.; Seroussi, H.; Jourdain, N.C.; Slater, D.A.; Turner, F.E.; Smith, C.J.; et al. Projected land ice contributions to twenty-first-century sea level rise. Nature 2021, 593, 74–182. [Google Scholar] [CrossRef] [PubMed]
- Mauro, B.D. A darker cryosphere in a warming world. Nat. Clim. Change 2020, 10, 979–980. [Google Scholar] [CrossRef]
- Kikstra, J.S.; Nicholls, Z.R.; Smith, C.J.; Lewis, J.; Lamboll, R.D.; Byers, E.; Sandstad, M.; Meinshausen, M.; Gidden, M.J.; Rogelj, J.; et al. The IPCC Sixth Assessment Report WGIII climate assessment of mitigation pathways: From emissions to global temperatures. Geosci. Model Dev. 2022, 15, 9075–9109. [Google Scholar] [CrossRef]
- Rasul, G.; Pasakhala, B.; Mishra, A.; Pant, S. Adaptation to mountain cryosphere change: Issues and challenges. Clim. Dev. 2020, 12, 297–309. [Google Scholar] [CrossRef]
- Miles, E.; McCarthy, M.; Dehecq, A.; Kneib, M.; Fugger, S.; Pellicciotti, F. Health and sustainability of glaciers in High Mountain Asia. Nat. Commun. 2021, 12, 2868. [Google Scholar] [CrossRef]
- Brun, F.; Berthier, E.; Wagnon, P.; Kääb, A.; Treichler, D. A spatially resolved estimate of High Mountain Asia glacier mass balances from 2000 to 2016. Nat. Geosci. 2017, 10, 668–673. [Google Scholar] [CrossRef]
- Kraaijenbrink, P.D.A.; Bierkens, M.F.P.; Lutz, A.F.; Immerzeel, W.W. Impact of a global temperature rise of 1.5 degrees Celsius on Asia’s glaciers. Nature 2017, 549, 257–260. [Google Scholar] [CrossRef]
- Sakai, A.; Fujita, K. Contrasting glacier responses to recent climate change in high-mountain Asia. Sci. Rep. 2017, 7, 13717. [Google Scholar] [CrossRef]
- Sommer, C.; Malz, P.; Seehaus, T.C.; Lippl, S.; Zemp, M.; Braun, M.H. Rapid glacier retreat and downwasting throughout the European Alps in the early 21st century. Nat. Commun. 2020, 11, 3209. [Google Scholar] [CrossRef]
- Rounce, D.R.; Hock, R.; Maussion, F.; Hugonnet, R.; Kochtitzky, W.; Huss, M.; Berthier, E.; Brinkerhoff, D.; Compogno, L.; Copland, L.; et al. Global glacier change in the 21st century: Every increase in temperature matters. Science 2023, 379, 78–83. [Google Scholar] [CrossRef] [PubMed]
- Armstrong, M.; David, I.; Staal, A.; Abrams, J.F.; Winkelmann, R.; Sakschewski, B.; Loriani, S.; Fetzer, I.; Cornell, S.; Rockström, J.; et al. Exceeding 1.5 C global warming could trigger multiple climate tipping points. Science 2022, 377, eabn7950. [Google Scholar] [CrossRef]
- Pritchard, H.D. Asia’s shrinking glaciers protect large populations from drought stress. Nature 2019, 569, 649–654. [Google Scholar] [CrossRef]
- Kääb, A.; Berthier, E.; Nuth, C.; Gardelle, J.; Arnaud, Y. Contrasting patterns of early twenty-first-century glacier mass change in the Himalayas. Nature 2012, 488, 495–498. [Google Scholar] [CrossRef]
- Dehecq, A.; Gourmelen, N.; Gardner, A.S.; Brun, F.; Goldberg, D.; Nienow, P.W.; Berthier, E.; Vincent, C.; Wagnon, P.; Trouvé, E. Twenty-first century glacier slowdown driven by mass loss in High Mountain Asia. Nat. Geosci. 2019, 12, 22–27. [Google Scholar] [CrossRef]
- Muhammad, S.; Tian, L. Changes in the ablation zones of glaciers in the western Himalaya and the Karakoram between 1972 and 2015. Remote Sens. Environ. 2016, 187, 505–512. [Google Scholar] [CrossRef]
- Gardelle, J.; Berthier, E.; Arnaud, Y.; Kääb, A. Region-wide glacier mass balances over the Pamir-Karakoram-Himalaya during 1999–2011. Cryosphere 2013, 7, 1263–1286. [Google Scholar] [CrossRef]
- Kumar, A.; Negi, H.S.; Kumar, K.; Shekhar, C.; Kanda, N. Quantifying mass balance of East-Karakoram glaciers using geodetic technique. Polar Sci. 2019, 19, 24–39. [Google Scholar] [CrossRef]
- Cao, B.; Guan, W.J.; Li, K.J.; Wen, Z.L.; Han, H.; Pan, B.T. Area and mass changes of glaciers in the West Kunlun Mountains based on the analysis of multi-temporal remote sensing images and DEMs from 1970 to 2018. Remote Sens. 2020, 12, 2632. [Google Scholar] [CrossRef]
- Nie, Y.; Pritchard, H.D.; Liu, Q.; Hennig, T.; Wang, W.L.; Wang, X.M.; Liu, S.Y.; Nepal, S.; Samyn, D.; Hewitt, K.; et al. Glacial change and hydrological implications in the Himalaya and Karakoram. Nat. Rev. Earth Environ. 2021, 2, 91–106. [Google Scholar] [CrossRef]
- Liu, J.; Wu, Y.M.; Gao, X. Increase in occurrence of large glacier-related landslides in the high mountains of Asia. Sci. Rep. 2021, 11, 1635. [Google Scholar] [CrossRef]
- Lin, H.; Li, G.; Cuo, L.; Hooper, A.; Ye, Q.H. A decreasing glacier mass balance gradient from the edge of the Upper Tarim Basin to the Karakoram during 2000–2014. Sci. Rep. 2017, 7, 6712. [Google Scholar] [CrossRef] [PubMed]
- Lhakpa, D.; Fan, Y.; Cai, Y. Continuous Karakoram Glacier Anomaly and Its Response to Climate Change during 2000–2021. Remote Sens. 2022, 14, 6281. [Google Scholar] [CrossRef]
- Brahmbhatt, R.M.; Bahuguna, I.M.; Rathore, B.P.; Singh, S.K.; Rajawat, A.S.; Shah, R.D.; Kargel, J.S. Satellite monitoring of glaciers in the Karakoram from 1977 to 2013: An overall almost stable population of dynamic glaciers. Cryosphere Discuss. 2015, 9, 1555–1592. [Google Scholar]
- Azam, M.F.; Kargel, J.S.; Shea, J.M.; Nepal, S.; Haritashya, U.K.; Srivastsva, S.; Maussion, F.; Qazi, N.; Chevallier, P.; Dimri, A.P.; et al. Glaciohydrology of the himalaya-karakoram. Science 2021, 373, eabf3668. [Google Scholar] [CrossRef]
- Xu, Y.P.; Gao, Y.J. An analysis of water resource characteristics of the rivers in the northern slope of the Kunlun Mountains. Chin. Geogr. Sci. 1995, 5, 365–373. [Google Scholar] [CrossRef]
- Ye, Z.X.; Chen, S.F.; Zhang, Q.F.; Liu, Y.C.; Zhou, H.H. Ecological water demand of Taitema Lake in the lower reaches of the Tarim River and the Cherchen River. Remote Sens. 2022, 14, 832. [Google Scholar] [CrossRef]
- An, P.; Yu, L.P.; Wang, Y.X.; Miao, X.D.; Wang, C.S.; Lai, Z.P.; Shen, H.Y. Holocene incisions and flood activities of the Keriya River, NW margin of the Tibetan plateau. J. Asian Earth Sci. 2020, 191, 104224. [Google Scholar] [CrossRef]
- Li, B.F.; Zheng, J.L.; Shi, X.; Chen, Y.N. Quantifying the impact of mountain precipitation on runoff in Hotan River, northwestern China. Front. Earth Sci. 2020, 14, 568–577. [Google Scholar] [CrossRef]
- Ye, Z.X.; Chen, Y.N.; Zhang, Q.F.; Liu, Y.C.; Zhang, X.Q. Research on Sediment Discharge Variations and Driving Factors in the Tarim River Basin. Remote Sens. 2022, 14, 5848. [Google Scholar] [CrossRef]
- Alifu, H.; Hirabayashi, Y.; Johnson, B.A.; Vuillaume, J.F.; Kondoh, A.; Urai, M. Inventory of glaciers in the Shaksgam valley of the Chinese Karakoram mountains, 1970–2014. Remote Sens. 2018, 10, 1166. [Google Scholar] [CrossRef]
- Zhang, C.; Yao, X.J.; Liu, S.Y.; Zhang, D.H.; Xu, J.L. Variation of glacier length in the Altun Mountains during 1970–2016. J. Glaciol. Geocryol. 2021, 43, 49–60. [Google Scholar]
- Zhou, S.G.; Yao, X.J.; Zhang, D.H.; Zhang, Y.; Liu, S.Y.; Min, Y.F. Remote sensing monitoring of advancing and surging glaciers in the Tien Shan, 1990–2019. Remote Sens. 2021, 13, 1973. [Google Scholar] [CrossRef]
- Yang, J.; Gong, P.; Fu, R.; Zhang, M.H.; Chen, J.M.; Liang, S.L.; Xu, B.; Shi, J.C.; Dickinson, R. The role of satellite remote sensing in climate change studies. Nat. Clim. Change 2013, 3, 875–883. [Google Scholar] [CrossRef]
- Tak, S.; Keshari, A.K. Investigating mass balance of Parvati glacier in Himalaya using satellite imagery based model. Sci. Rep. 2020, 10, 12211. [Google Scholar] [CrossRef] [PubMed]
- Irwandi, H.; Rosid, M.S.; Mart, T. Effects of Climate change on temperature and precipitation in the Lake Toba region, Indonesia, based on ERA5-land data with quantile mapping bias correction. Sci. Rep. 2023, 13, 2542. [Google Scholar] [CrossRef] [PubMed]
- Nick, F.M.; Vieli, A.; Andersen, M.L.; Joughin, I.; Payne, A.; Edwards, T.L.; Pattyn, F.; Roderik, S.W. Future sea-level rise from Greenland’s main outlet glaciers in a warming climate. Nature 2013, 497, 235–238. [Google Scholar] [CrossRef]
- Jiao, D.L.; Xu, N.N.; Yang, F.; Xu, K. Evaluation of spatial-temporal variation performance of ERA5 precipitation data in China. Sci. Rep. 2021, 11, 17956. [Google Scholar] [CrossRef]
- Xie, W.H.; Yi, S.Z.; Leng, C.; Xia, D.F.; Li, M.L.; Zhong, Z.W.; Ye, J.F. The evaluation of IMERG and ERA5-Land daily precipitation over China with considering the influence of gauge data bias. Sci. Rep. 2022, 12, 8085. [Google Scholar] [CrossRef]
- Shannon, S.; Smith, R.; Wiltshire, A.; Payne, T.; Huss, M.; Betts, R.; Caesar, J.; Koutroulis, A.; Jones, D.; Harrison, S. Global glacier volume projections under high-end climate change scenarios. Cryosphere 2019, 13, 325–350. [Google Scholar] [CrossRef]
- Sun, M.P.; Liu, S.Y.; Yao, X.J.; Guo, W.Q.; Xu, J.L. Glacier changes in the Qilian Mountains in the past half-century: Based on the revised First and Second Chinese Glacier Inventory. J. Geogr. Sci. 2018, 28, 206–220. [Google Scholar] [CrossRef]
- Radić, V.; Hock, R. Regional and global volumes of glaciers derived from statistical upscaling of glacier inventory data. J. Geophys. Res. Earth Surf. 2010, 115, F01010. [Google Scholar] [CrossRef]
- Grinsted, A. An estimate of global glacier volume. Cryosphere 2013, 7, 141–151. [Google Scholar] [CrossRef]
- Liu, S.Y.; Sun, W.X.; Shen, Y.P.; Li, G. Glacier changes since the Little Ice Age maximum in the western Qilian Shan, northwest China, and consequences of glacier runoff for water supply. J. Glaciol. 2003, 49, 117–124. [Google Scholar]
- Huston, A.; Siler, N.; Roe, G.H.; Pettit, E.; Steiger, N.J. Understanding drivers of glacier-length variability over the last millennium. Cryosphere 2021, 15, 1645–1662. [Google Scholar] [CrossRef]
- Yao, X.J.; Liu, S.Y.; Zhu, Y.; Gong, P.; An, L.N.; Li, X.F. Design and implementation of an automatic method for der iving glacier centerlines based on GIS. J. Glaciol. Geocryol. 2015, 37, 1563–1570. [Google Scholar]
- Zhang, Y.; Yao, X.J.; Zhou, S.G.; Zhang, D.H. Glacier changes in the Sanjiangyuan Nature Reserve of China during 2000–2018. J. Geogr. Sci. 2022, 32, 259–279. [Google Scholar] [CrossRef]
- Liu, S.Y.; Ding, Y.J.; Shangguan, D.H.; Zhang, Y.; Li, J.; Han, H.D.; Wang, J.; Xie, C.W. Glacier retreat as a result of climate warming and increased precipitation in the Tarim river basin, northwest China. Ann. Glaciol. 2006, 43, 91–96. [Google Scholar] [CrossRef]
- Shangguan, D.H.; Liu, S.Y.; Ding, Y.J.; Ding, L.F.; Xu, J.L.; Jing, L. Glacier changes during the last forty years in the Tarim Interior River basin, northwest China. Prog. Nat. Sci. 2009, 19, 727–732. [Google Scholar] [CrossRef]
- Yao, T.D.; Yao, Z.J. lmpacts of Glacial Reretreat on Runoff on Tibetan Plateau. Chin. J. Nat. 2010, 32, 4–8. [Google Scholar]
- Liu, S.Y.; Ding, Y.J.; Zhang, Y.; Shangguan, D.H.; Li, J.; Han, H.D.; Wang, J.; Xie, C.W. lmpact of the Glacial Change on Water Resources in the Tarim River Basin. Acta Geogr. Sin. 2006, 61, 482–490. [Google Scholar]
- Guan, W.J.; Cao, B.; Pan, B.T.; Chen, R.; Shi, M.H.; Li, K.J.; Zhao, X.R.; Sun, X.D. Updated Surge-Type Glacier Inventory in the West Kunlun Mountains, Tibetan Plateau, and Implications for Glacier Change. J. Geophys. Res. Earth Surf. 2021, 127, e2021JF006369. [Google Scholar] [CrossRef]
- Ke, L.H.; Ding, X.L.; Song, C.Q. Heterogeneous changes of glaciers over the western Kunlun Mountains based on ICESat and Landsat-8 derived glacier inventory. Remote Sens. Environ. 2015, 168, 13–23. [Google Scholar] [CrossRef]
Disclaimer/Publisher’s Note: The statements, opinions and data contained in all publications are solely those of the individual author(s) and contributor(s) and not of MDPI and/or the editor(s). MDPI and/or the editor(s) disclaim responsibility for any injury to people or property resulting from any ideas, methods, instructions or products referred to in the content. |
© 2023 by the authors. Licensee MDPI, Basel, Switzerland. This article is an open access article distributed under the terms and conditions of the Creative Commons Attribution (CC BY) license (https://creativecommons.org/licenses/by/4.0/).