Article

Daytime Sea Fog Identification Based on Multi-Satellite Information and the ECA-TransUnet Model

1
Remote Sensing Information and Digital Earth Center, College of Computer Science and Technology, Qingdao University, Qingdao 266071, China
2
Key Laboratory of Digital Earth Science, Aerospace Information Research Institute, Chinese Academy of Sciences, Beijing 100094, China
3
First Institute of Oceanography, State Oceanic Administration, Qingdao 266061, China
*
Author to whom correspondence should be addressed.
Remote Sens. 2023, 15(16), 3949; https://doi.org/10.3390/rs15163949
Submission received: 26 June 2023 / Revised: 16 July 2023 / Accepted: 3 August 2023 / Published: 9 August 2023

Abstract

:
Sea fog is a weather hazard along the coast and over the ocean that seriously threatens maritime activities. In the deep learning approach, it is difficult for convolutional neural networks (CNNs) to fully consider global context information in sea fog research due to their own limitations, and the recognition of sea fog edges is relatively vague. To solve the above problems, this paper puts forward an ECA-TransUnet model for daytime sea fog recognition, which consists of a combination of a CNN and a transformer. By designing a two-branch feed-forward network (FFN) module and introducing an efficient channel attention (ECA) module, the model can effectively take into account long-range pixel interactions and feature channel information to capture the global contextual information of sea fog data. Meanwhile, to solve the problem of insufficient existing sea fog detection datasets, we investigated sea fog events occurring in the Yellow Sea and Bohai Sea and their territorial waters, extracted remote sensing images from Moderate Resolution Imaging Spectroradiometer (MODIS) data at corresponding times, and combined data from the Cloud-Aerosol Lidar and Infrared Pathfinder Satellite Observation (CALIPSO), cloud and sea fog texture features, and waveband feature information to produce a manually annotated sea fog dataset. Our experiments showed that the proposed model achieves 94.5% accuracy and an 85.8% F1 score. Compared with the existing models relying only on CNNs such as UNet, FCN8s, and DeeplabV3+, it achieves state-of-the-art performance in sea fog recognition.

1. Introduction

Sea fog is a water vapor condensation phenomenon that results from the massive accumulation of water droplets or ice crystals in the lower atmosphere over the ocean [1]. The horizontal visibility of the atmosphere in sea fog is less than 1 km [2]. Sea fog poses significant risks to aviation and maritime transportation because of its low visibility, leading to accidents and resulting in serious safety concerns and economic losses [3,4]. The Yellow Sea and Bohai Sea are critical maritime transportation and development zones in China, and they are also prone to frequent occurrences of sea fog. [5]. According to statistics, more than 50% of maritime accidents that occurred in the Yellow Sea from 1981 to 2010 were due to sea fog [6]. Therefore, effective monitoring of sea fog is crucial for the safety of human life, property, and social activities.
Satellite remote sensing technology is the primary tool for sea fog monitoring. It provides more real-time, accurate, and large-scale sea fog information compared with ground-based observatories [7,8,9]. Sea fog and clouds have a small brightness temperature (TB) difference in the 3.7 µm and 11 µm channels compared to each other [10,11,12], respectively; therefore, the dual-channel difference (DCD) [13] method is often employed for distinguishing between sea spray and clouds. For example, Ellrod et al. [14] tried to perform night-time fog detection based on the DCD method using a geostationary operational environmental satellite and experimentally demonstrated that the DCD method can effectively detect sea fog in the absence of cloud occlusion. Zhang et al. [15] identified sea fog by conducting a comparative analysis of the relative frequency of BT between sea fog and low clouds. Han et al. [16] used the reflectivity difference between fog and other objects at 0.63 µm and the DCD method for daytime and night-time sea fog monitoring. In addition, the thresholding method is typically used for sea fog monitoring. Ryu et al. [17] proposed a sea fog detection algorithm using Himawari-8 satellite data, based on the reflectance of visible (VIS) and near-infrared (NIR) bands, which can be applied to optical satellites without shortwave infrared (SWIR) bands. Wu et al. [18] constructed an automatic sea fog monitoring algorithm based on Moderate Resolution Imaging Spectroradiometer (MODIS) data using several variables such as the normalized snow index (NDSI), the normalized difference of near-infrared water vapor index (NWVI), etc. These investigations described earlier proved that the algorithm can effectively identify sea fog under various weather conditions. The detection of sea fog using the threshold method is stable and straightforward, but simple combinations of thresholds are not able to handle sea fog monitoring in complex scenarios, and using multiple combinations of thresholds requires more statistical work and experimental data.
The deep learning approach has the ability to autonomously learn feature information from data [19] and has been increasingly utilized into the process of remote sensing data analysis in recent years [20,21,22,23,24,25]. For example, convolutional neural networks (CNNs) were used to classify terrestrial fog in Anhui Province, China [26]. Jeon et al. [27] used a migration learning model (CNN-TL) to identify sea fog while verifying the effect of different combinations of bands on sea fog identification. Zhu et al. [28] applied UNet [29], a semantic segmentation model in the field of deep learning, to sea fog monitoring and combined MODIS data to identify the specific range. The purpose of semantic segmentation is to obtain the classification of each pixel, which provides a new method for remote sensing classification. Zhou et al. [30] proposed a two-branch sea fog detection network (DB-SFNet) to achieve comprehensive and accurate sea fog monitoring by combining sea fog events recorded by the Geostationary Ocean Color Imager (GOCI). To address the scarcity of sea fog samples, Huang et al. [31] performed sea fog sample augmentation by using generative adversarial networks (GANs) [32]. Currently, most of the deep learning applications for sea fog monitoring studies are based on CNNs. The capability of CNNs is unquestionable, but they also have their own limitations and cannot model long-range dependencies well [33,34]. In sea fog images, clouds and fog have high similarity and mask each other, and more global context information needs to be considered.
Recently, the ViT model [35] was proposed, so transformers started to be applied more in the realm of computer vision, which provides a new research idea for image processing. In remote sensing images, different semantic classes may have similar size and spectral features, which are not easily distinguishable, so remote sensing images need to focus on more global contextual information. Transformers have also been applied in remote sensing images [36,37,38,39]. It is difficult for CNNs to model contextual information, and transformers based on a self-attentive mechanism can better model the global context, and a combination of the two can bring out greater capabilities, based on which TransUnet was first proposed to be applied in the field of medical image segmentation while having great potential, but the segmentation capability on remote sensing sea fog recognition has not been proven [40].
In this study, we selected MODIS data for sea fog studies. Cloud-Aerosol Lidar and Infrared Pathfinder Satellite Observation (CALIPSO) is used to differentiate between clouds and sea fog by obtaining atmospheric vertical profile information and is also applied to sea fog verification [41,42,43]. Therefore, in the process of creating sea fog samples, we utilize CALIPSO data to assist in addition to combining different cloud and sea fog texture features [27] and MODIS band features. Furthermore, we propose an ECA-TransUnet model for daytime sea fog monitoring. Through enhancement of the transformer and the incorporation of the attention mechanism, the model was enabled to achieve superior performance for sea fog detection. Finally, we used fifth generation of global climate reanalysis data (ERA5) to analyze the meteorological conditions for sea fog generation.
The overall structure of this paper consists of seven sections. The Section 2 presents the study area and the data used. The Section 3 introduces the ECA-TransUnet model. The Section 4 shows the data pre-processing and experimental setup, and the Section 5 compares the experimental results of different models and also analyzes the meteorological conditions that produce sea fog. The Section 6 is a discussion, and the Section 7 concludes the study.

2. Materials

2.1. Study Area

In this study, we selected the Yellow and Bohai seas and their territorial coastal waters close to China as our main study area. These seas experience cold, dry winters and warm, humid summers due to their proximity to the northwest Pacific Ocean [44]. Affected by the warm and humid air, sea fog is mainly concentrated in April-July of the year, mostly in advective fog [45]. The specific study area is shown in Figure 1.

2.2. Data

2.2.1. MODIS Data

Aqua/MODIS L1B data were selected as the primary data for sea fog monitoring. MODIS has 36 bands with a spectral range of 0.4–14.4 μm, providing comprehensive and detailed data support for our study due to its long runtime and wide band. The MODIS and CALIPSO observation intervals differ by approximately 1.5 min, which is relatively consistent in time and space. [46]. The MYD021KM data products we used were downloaded from Google Earth Engine (https://ladsweb.modaps.eosdis.nasa.gov/, accessed on 14 June 2022). We selected 30 MODIS images from 2013 to 2018.

2.2.2. CALIPSO Data

Cloud-Aerosol Lidar with Orthogonal Polarization (CALIOP) is the first satellite-based polarimetric lidar capable of observing the state of the global atmosphere for observing aerosols and micron-sized cloud particles and obtaining information on the vertical profile configuration of the atmosphere. In the process of sea fog sample classification, we chose Vertical Feature Mask (VFM) data, a secondary data product of CALIPSO, to assist in the work. This data allows for obtaining a vertical profile of the atmosphere with a horizontal resolution of 333 m. The profile includes target object types such as cloud, aerosol, surface, and clear sky and their corresponding altitudes. A certain distinction between clouds and fog can be made using this data. The CALIOP VFM product used in this article was downloaded from https://subset.larc.nasa.gov/calipso/login.php, accessed on 26 July 2022.

2.2.3. Fifth Generation of Global Climate Reanalysis Data

We utilized the fifth generation of global climate reanalysis data (ERA5) from the European Centre for Medium-Range Weather Forecasts (ECMWF) to analyze the meteorological conditions in the area where sea fog occurs in terms of wind direction, wind speed, pressure, and temperature differences to analyze the causes of sea fog. The selected meteorological data consists primarily of a 10 m u-wind component, a 10 m v-wind component, mean sea level pressure, surface air temperature (SAT), and sea surface temperature (SST). The ERA-5 product used in this paper was downloaded from: https://cds.climate.copernicus.eu/cdsapp#!/dataset/reanalysis-era5-single-levels?tab=form, accessed on 20 December 2022.

3. Method

The work of this study is divided into two parts: the production of the sea fog dataset and model training. The overall workflow is shown in Figure 2. First, MODIS images with sea fog events were selected and combined with sea fog texture features, MODIS waveband features, and CALIPSO radar data for manual interpretation to generate sea fog samples. We trained the model by inputting the generated sea fog data, and the performance of each model was analyzed through model comparison, while the model results were analyzed by ERA5 meteorological data for sea fog meteorology.
In this section, we first introduce the general structure of the proposed ECA-TransUnet model. This is followed by an explanation of the improvement of the FFN in the transformer module, and a detailed depiction of the ECA module is introduced in the decoder section.

3.1. ECA-TransUnet Network Model

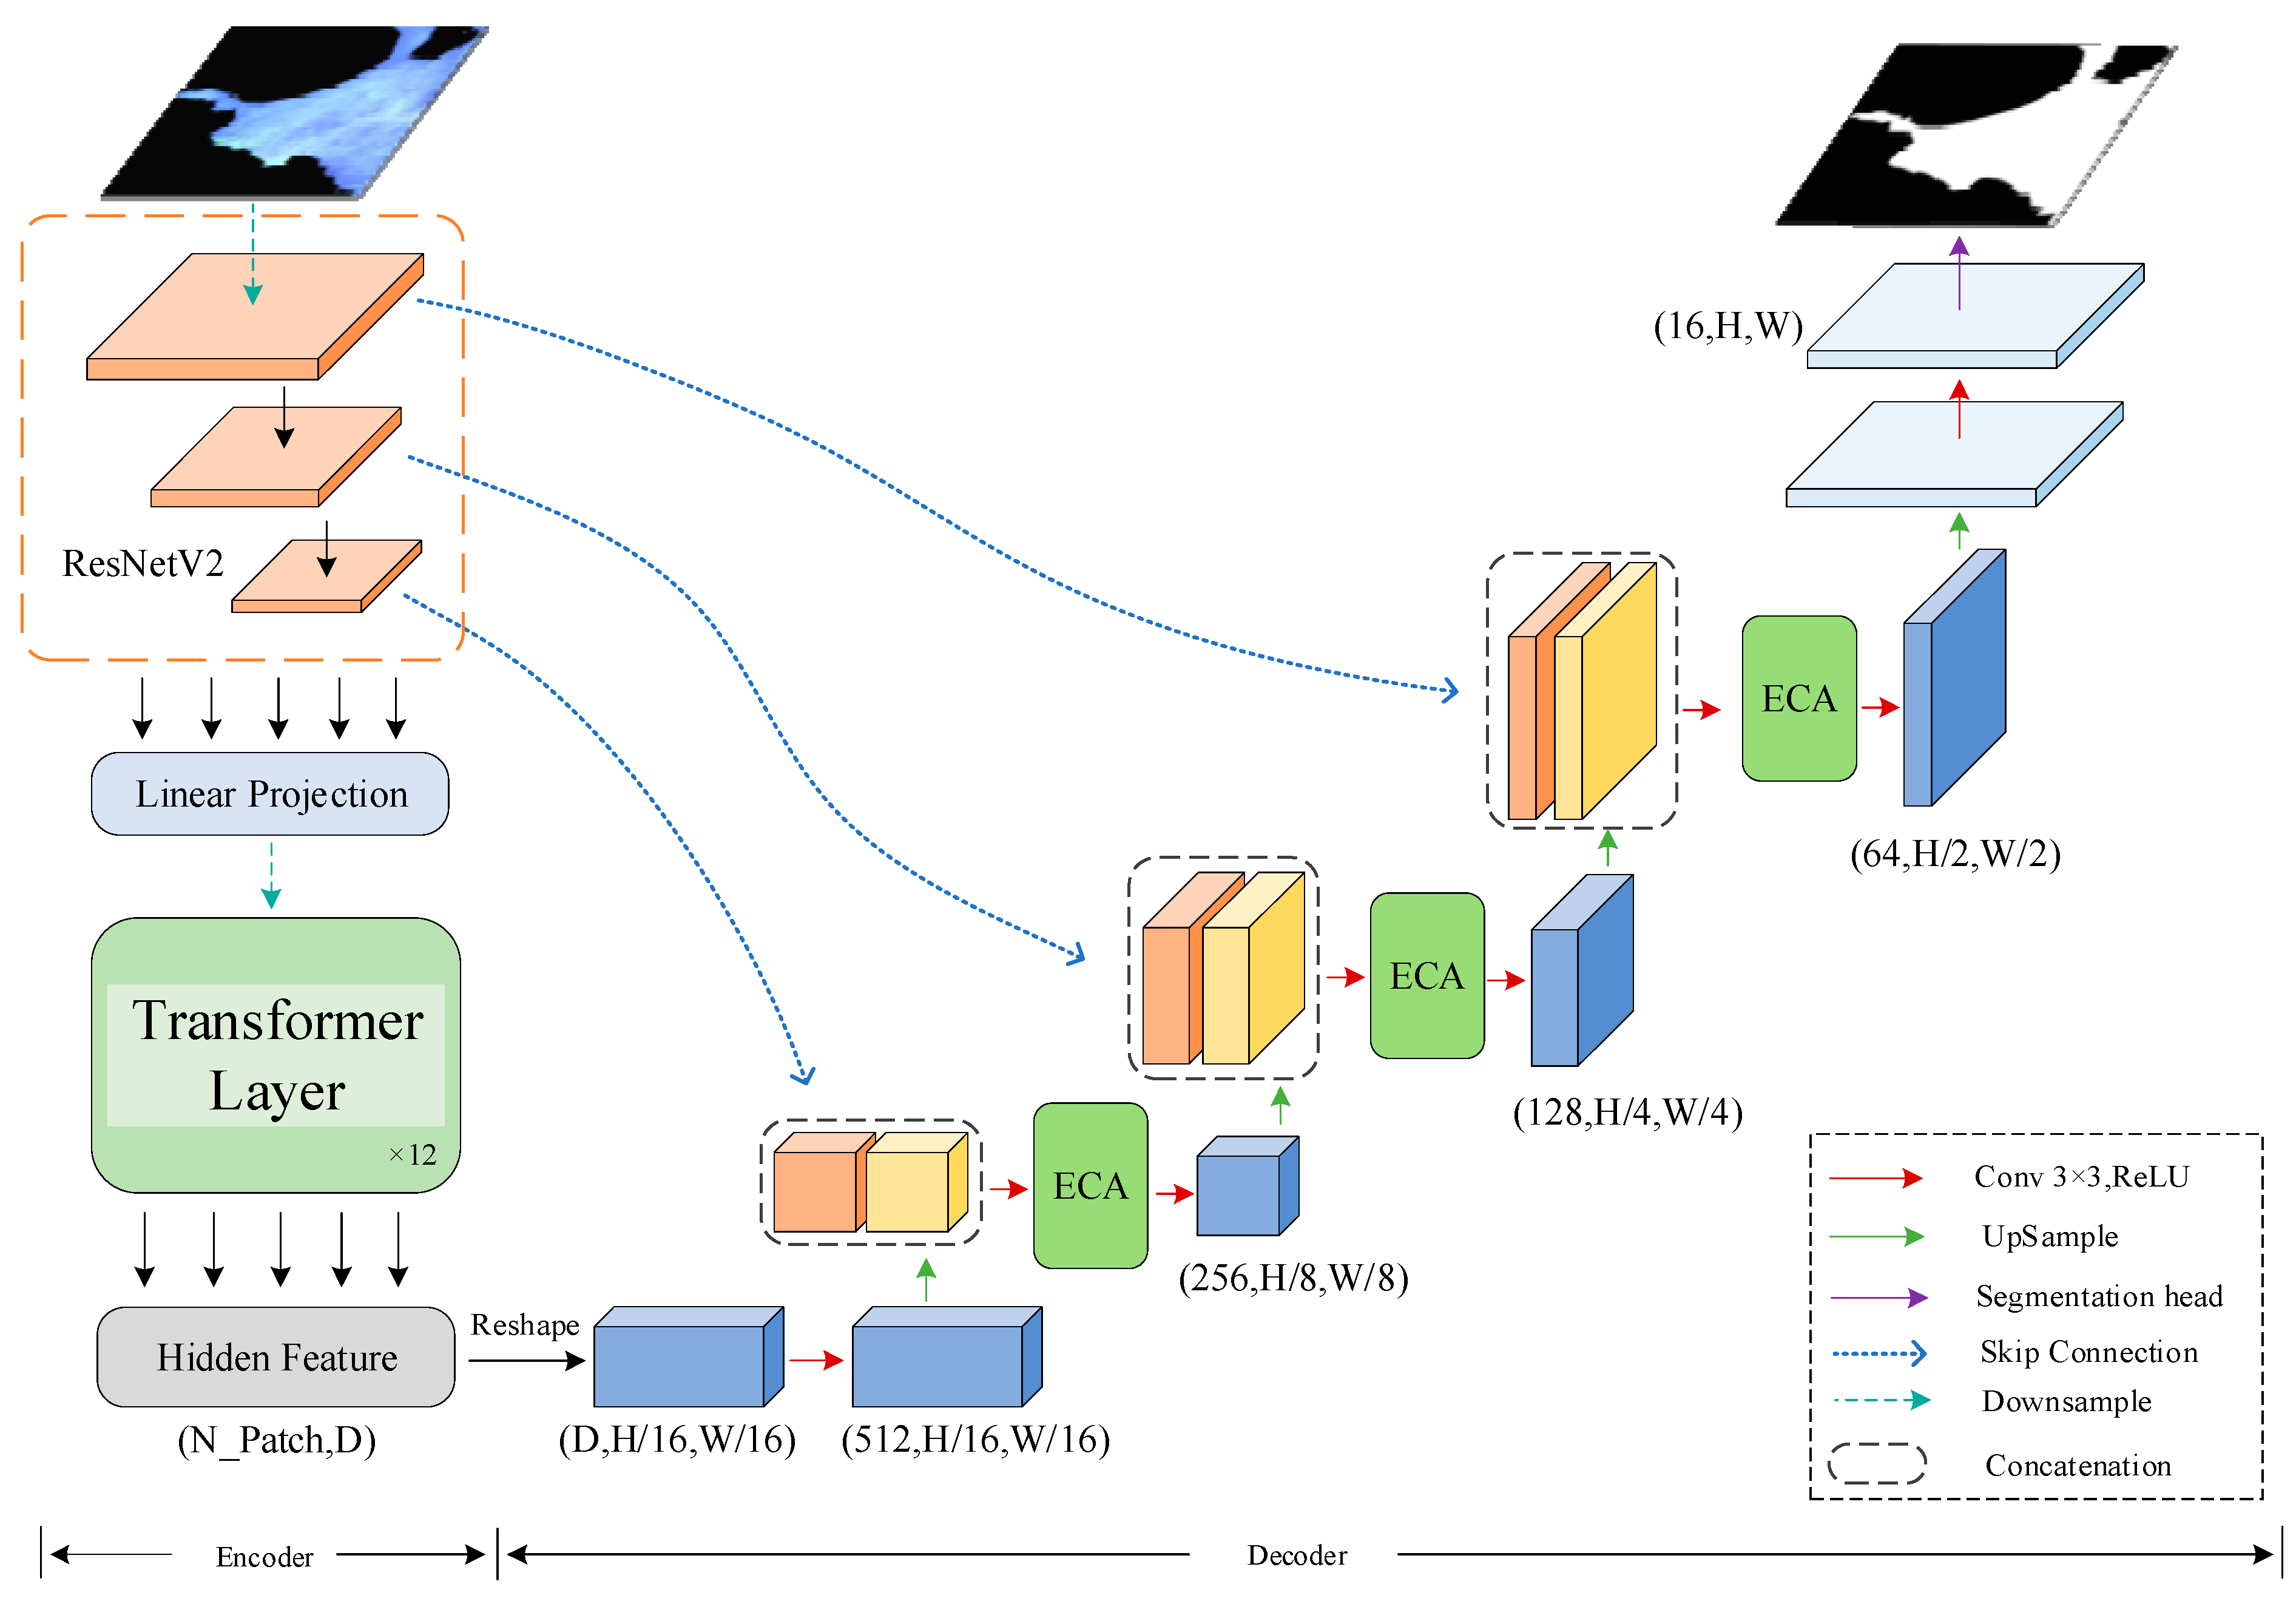
The overall network architecture of the ECA-TransUnet model is depicted in Figure 3. The model structure is segmented into two parts: an encoder and a decoder. In the encoder part, a CNN and transformer are used in series to extract image features. After the CNN extracts the image feature information, it will pass the feature information into the transformer module. However, the transformer’s global self-attention mechanism ignores position information, so the position embedding operation is performed before going on. In this way, the image is converted to sequence information processing, which enables better long-range modeling. To further improve the model, some enhancements were made to the FFN part of the transformer module. These enhancements include the use of two parallel branches to filter the feature information and suppress less informative features in the feature transmission, allowing more useful information to be passed into the network hierarchy. The ECA module is added to each layer of the decoder, for most of the existing attention mechanisms are to achieve better performance of the network through relatively complex structures, while the ECA module involves only a few parameters. This allows the performance of the network to improve while simultaneously diminishing the complexity of the network and focusing more on the channel information of the characteristics.

3.2. FFN Improvement

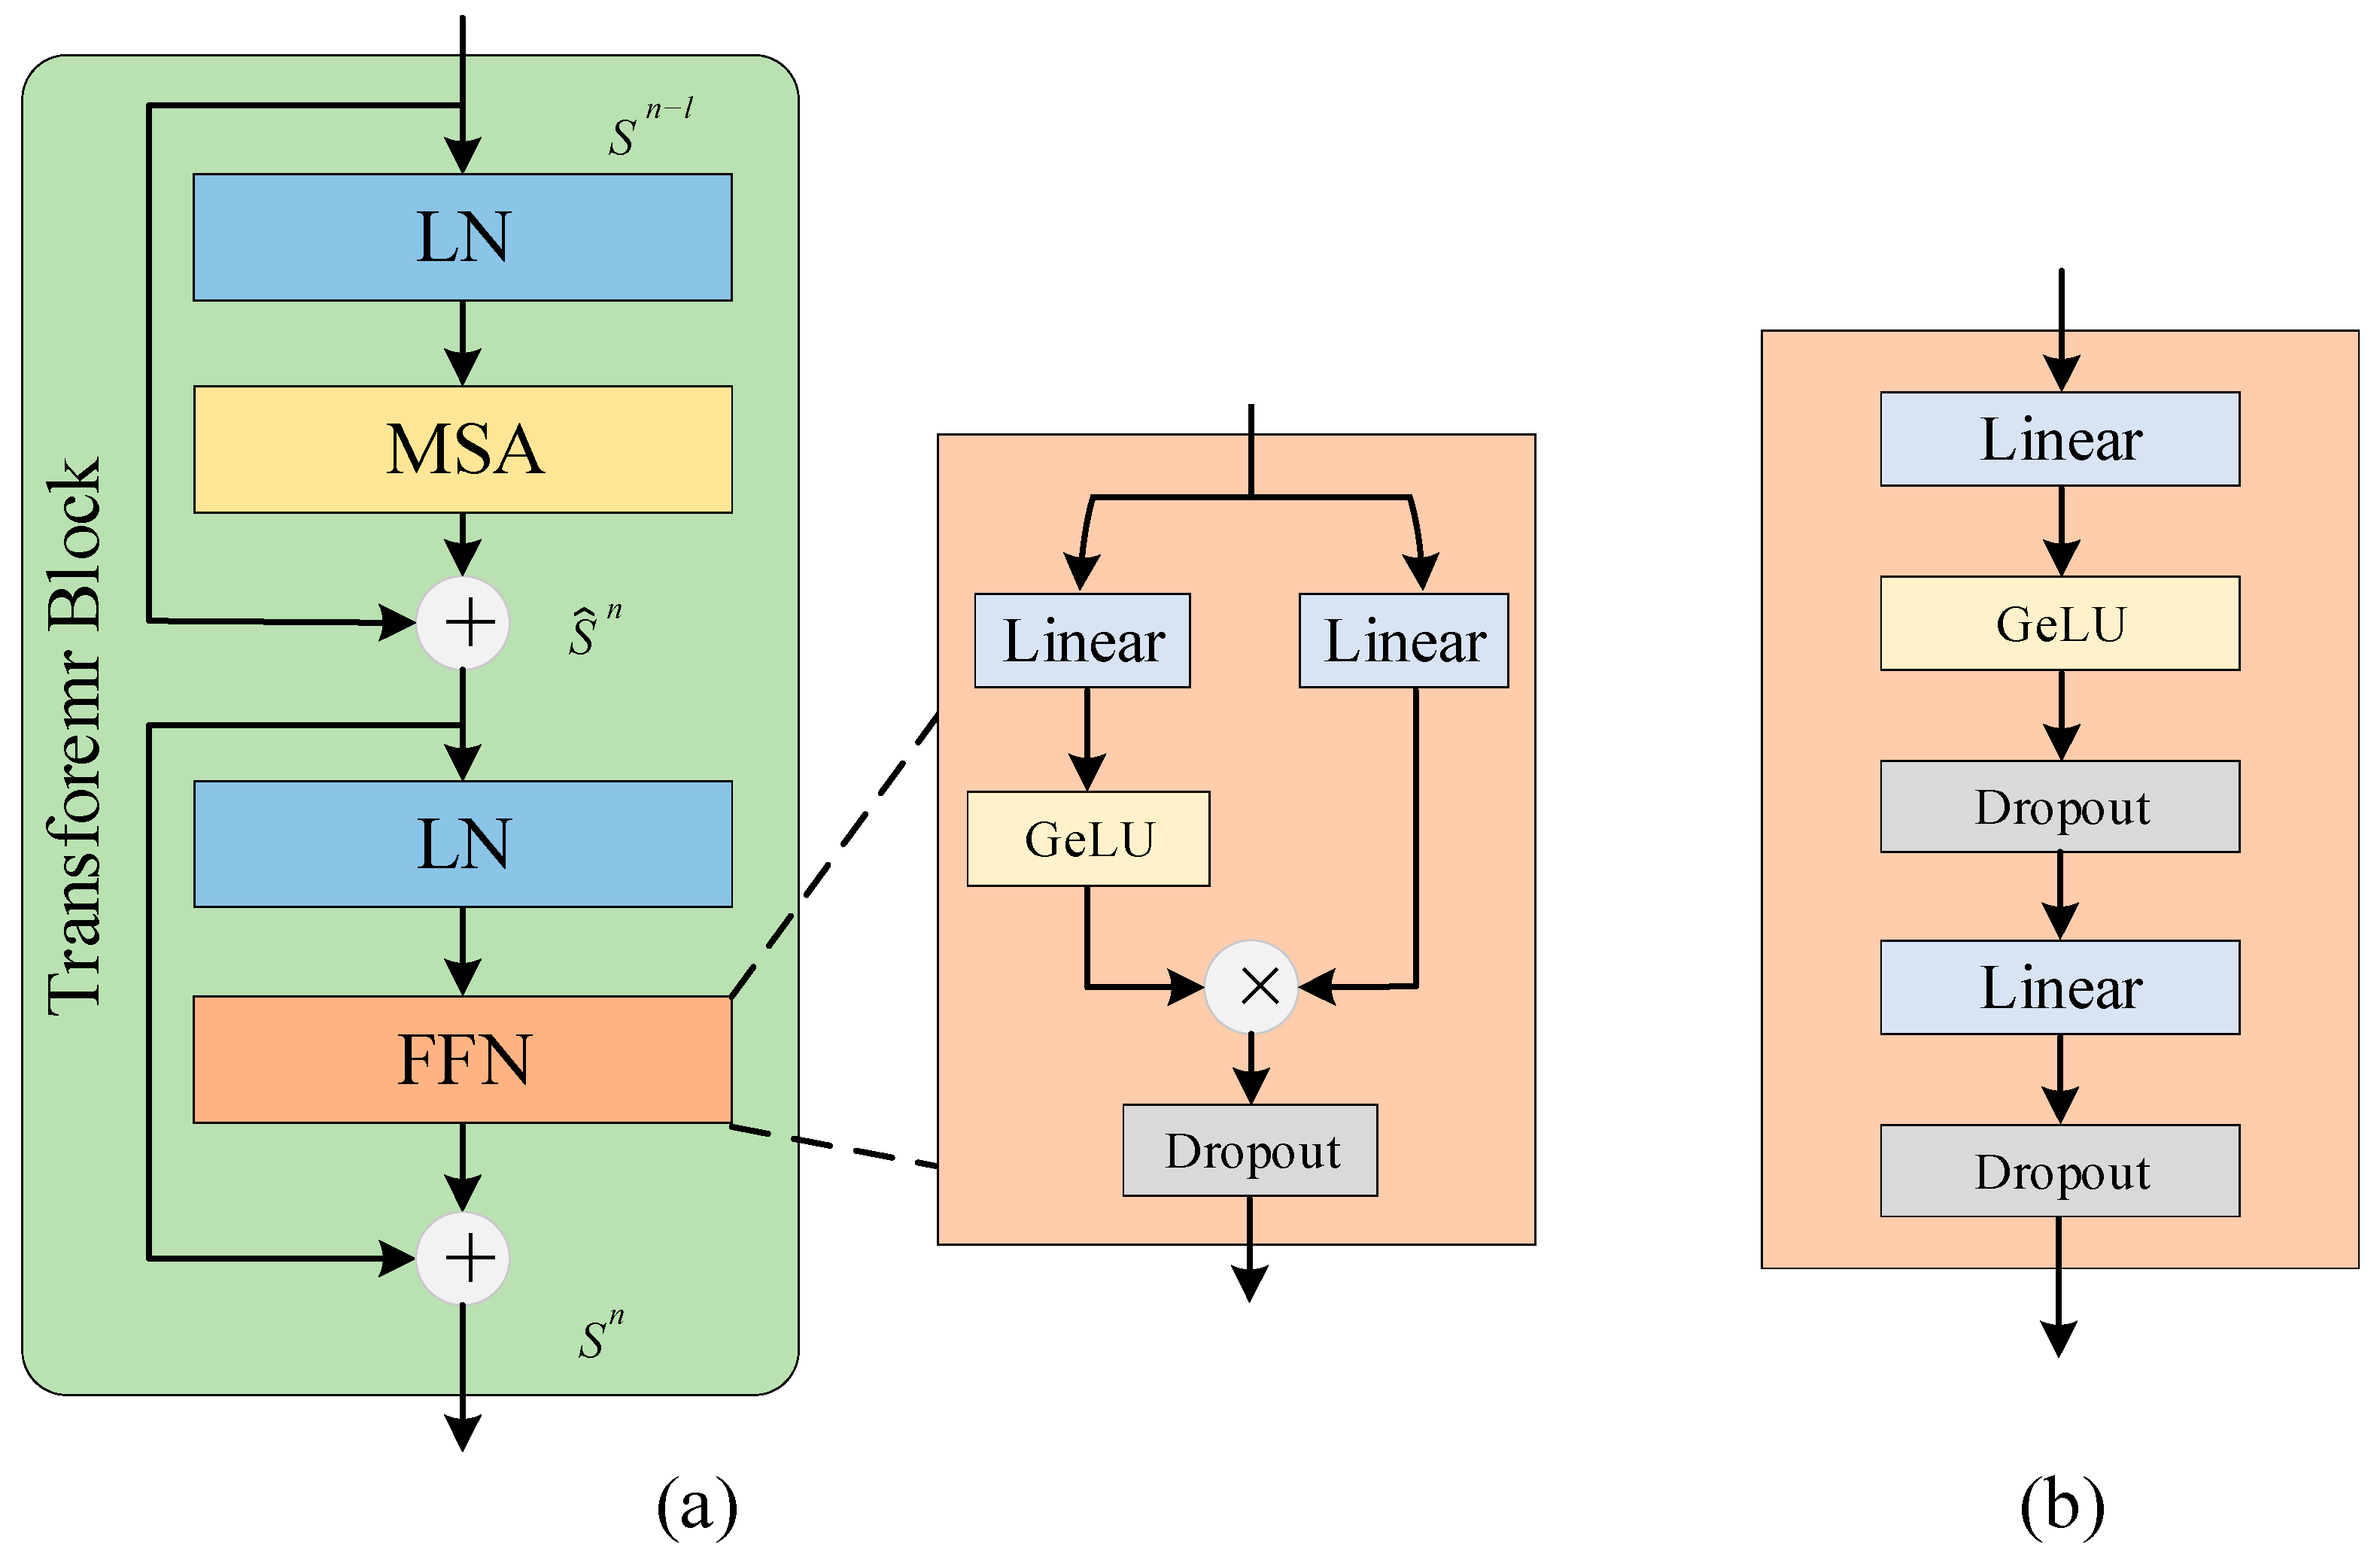
The transformer module introduced into the encoder part implements the extraction of global context information. It mainly consists of two main parts: the multi-headed attention (MSA) mechanism and the FFN [47]. Figure 4b shows the standard FFN module structure, which consists of two linear transformation layers, and the GeLu activation function is added between the two linear layers, with an overall single-branch structure. Figure 4a indicates the improved FFN module, which changes from a single branch to a two-branch structure, where one branch is nonlinearly activated by the GeLu activation function after passing through the linear transformation layer, which can retain better feature information. The other branch is passed through the linear layer, and then the two parallel branches are multiplied element by element to further enhance the superior feature information, and the final output is passed through the dropout layer. The design of the two-branch structure allows the model to focus on the details of each layer and other complementary layers, which can retain and enhance the superior feature information.

3.3. ECA Model

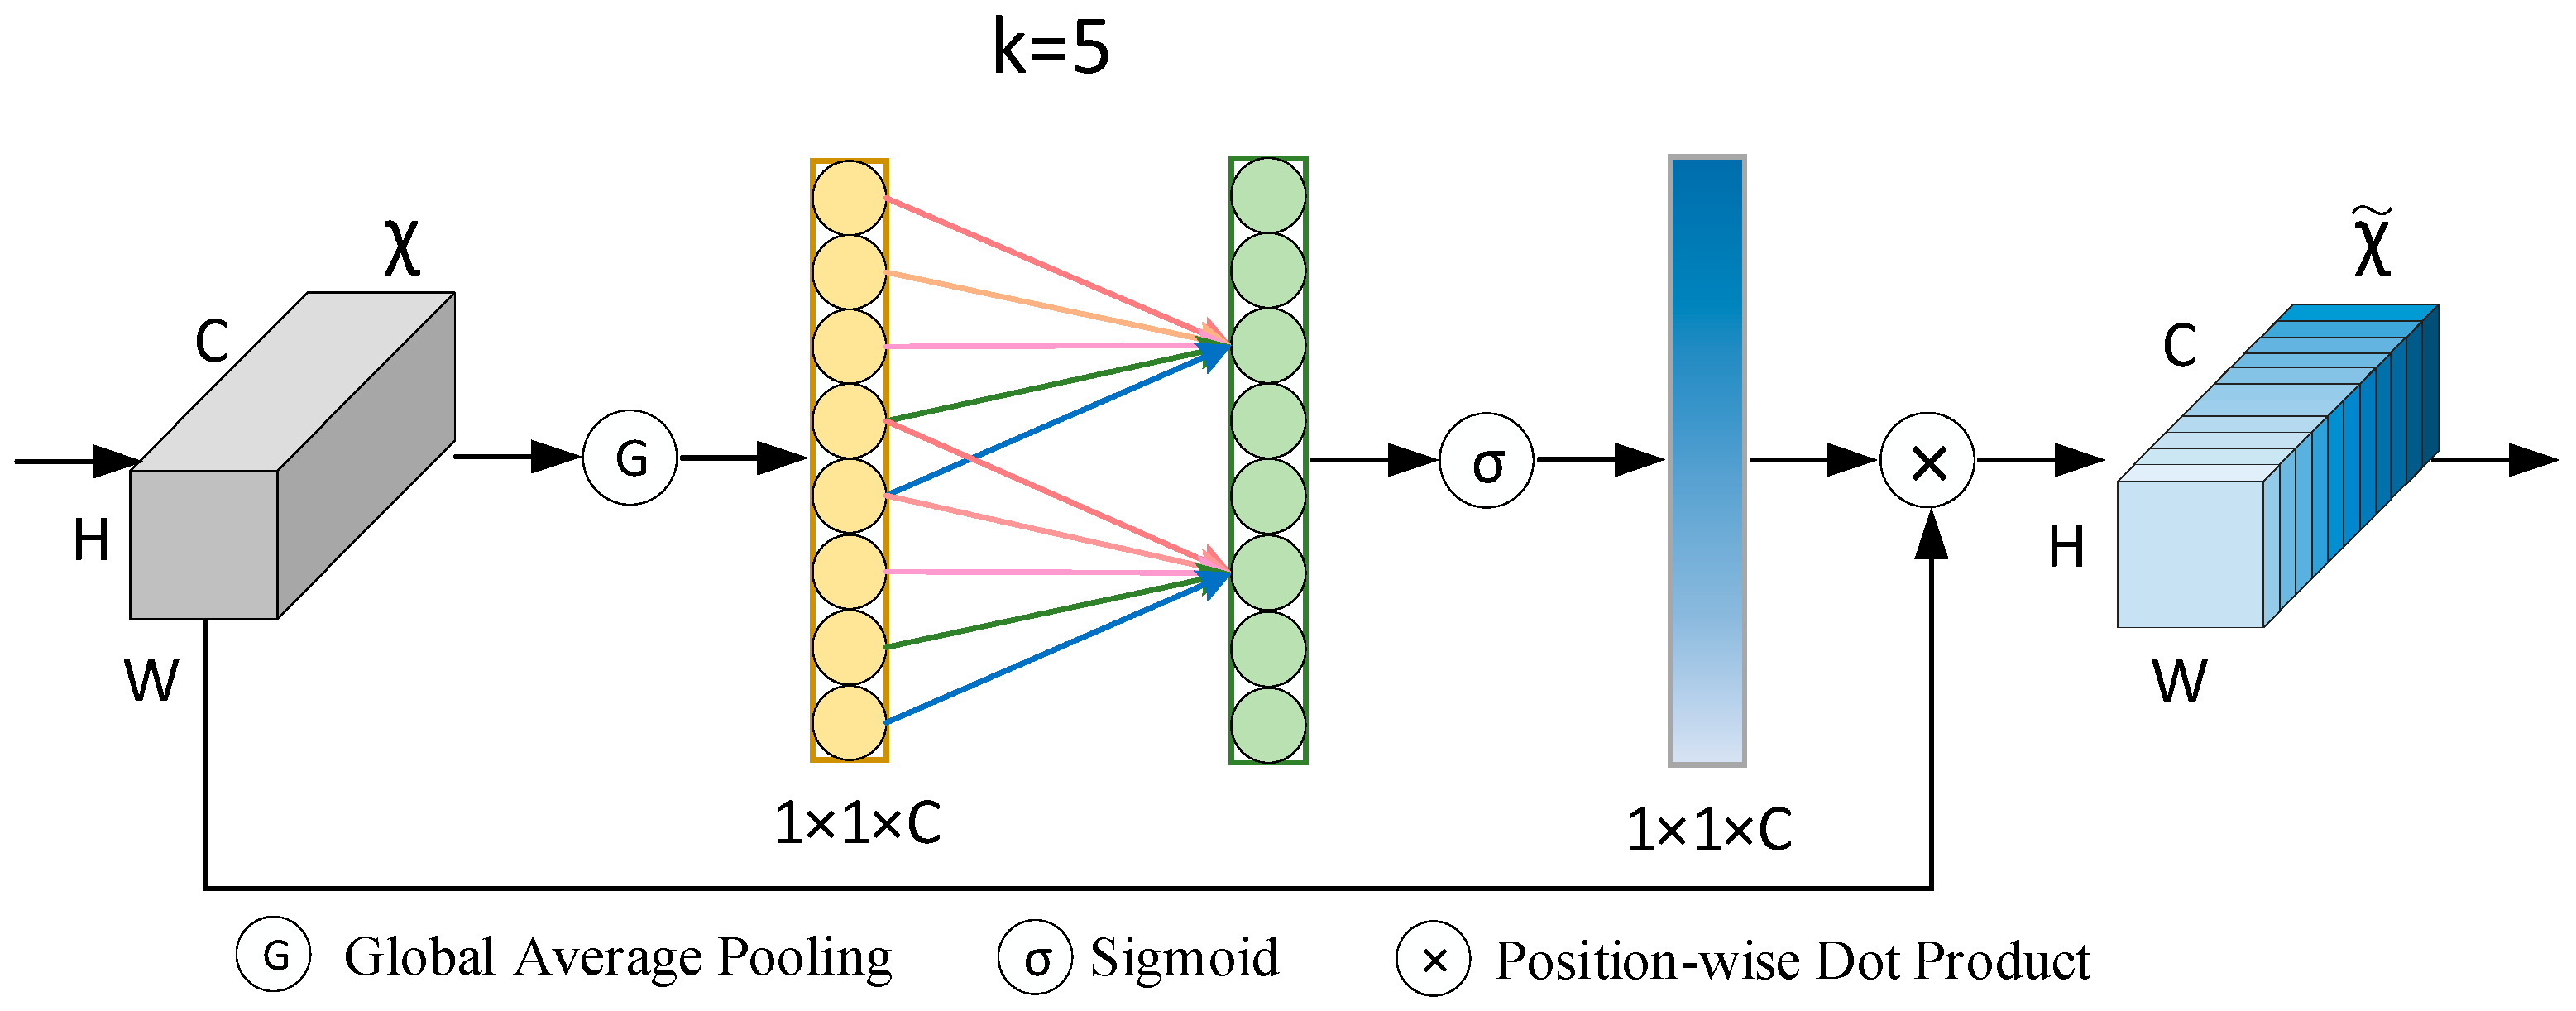
The proposed ECA attention mechanism is based on the SE module [48]. The ECA attention mechanism first performs a global average pooling operation on the input feature maps, and then uses a 1-dimensional convolution of convolution kernel size k to achieve local cross-channel interaction with shared weights. The weights ω of each channel are obtained after the sigmoid activation function, as shown in (1). The size k of the convolution kernel can be chosen adaptively according to the given number of channels in the nonlinear mapping. After obtaining the dependencies between channels, the weights are multiplied with the corresponding elements of the original input feature map, the calculated weights are added to the feature map, and, finally, the feature map is output.
ω = σ C 1 D k y
where ω is the channel weight, σ is the sigmoid activation function, C1D denotes 1D convolution, and k is the number of parameter information. Compared to the SE module, the ECA module reduces the side effects associated with predicting channel attention by avoiding the operation of dimensionality reduction. Second, unlike the original approach of capturing the dependencies of all channels, ECA employs appropriate cross-channel interactions to improve the efficiency of the network, achieving better performance with a small number of parameters.
In the decoder part of the network, the ECA module [49] is added after feature fusion. The overall structure of this attention mechanism is shown in Figure 5.
In the whole network model architecture, the improvement of the FFN allows the network to prioritize the important feature information during feature transmission. Additionally, the inclusion of an ECA module after feature fusion in the decoder helps the network to better focus on channel information, leading to improved overall performance.

Precision Evaluation

In this study, the statistical prediction results per unit pixel are obtained for true positive samples (TPs), false negative samples (FNs), false positive samples (FPs), and true negative samples (TNs) based on the confusion matrix. Four metrics, accuracy, recall, intersection ratio (IoU), and F1-score, were selected to evaluate the performance of the model in sea fog identification [50]. The sensitivity and specificity of the model were measured comprehensively.
Accuracy = TP + TN TP + FP + FN + TN
Recall = TP TP + FN
IoU = TP TP + FP + FN
F 1 = 2 TP 2 TP + FP + FN
where TP: sea fog present and detected, FN: sea fog is present but not detected, FP: sea fog is not present but detected, and TN: sea fog does not exist and is not detected.

4. Data Pre-Processing and Experiment

4.1. Data Pre-Processing

We used MODIS L1B data in conducting the sea fog monitoring study. MODIS data of large volume and a broad spectral range are applied in several fields of remote sensing. Among the established sea fog samples, the sea fog data were selected from a total of 30 MODIS sea fog images of the Yellow Sea, Bohai Sea, and the territorial waters of China from 2013 to 2018.
During MODIS data preprocessing, the data were subjected to radiometric calibration, solar zenith angle correction, geometric correction, bowtie processing, band synthesis, and land-ocean masking operations. Bands 1, 17, and 32 of MODIS were adopted for the sea fog samples based on previous studies [51]. Table 1 shows the details of the three bands.
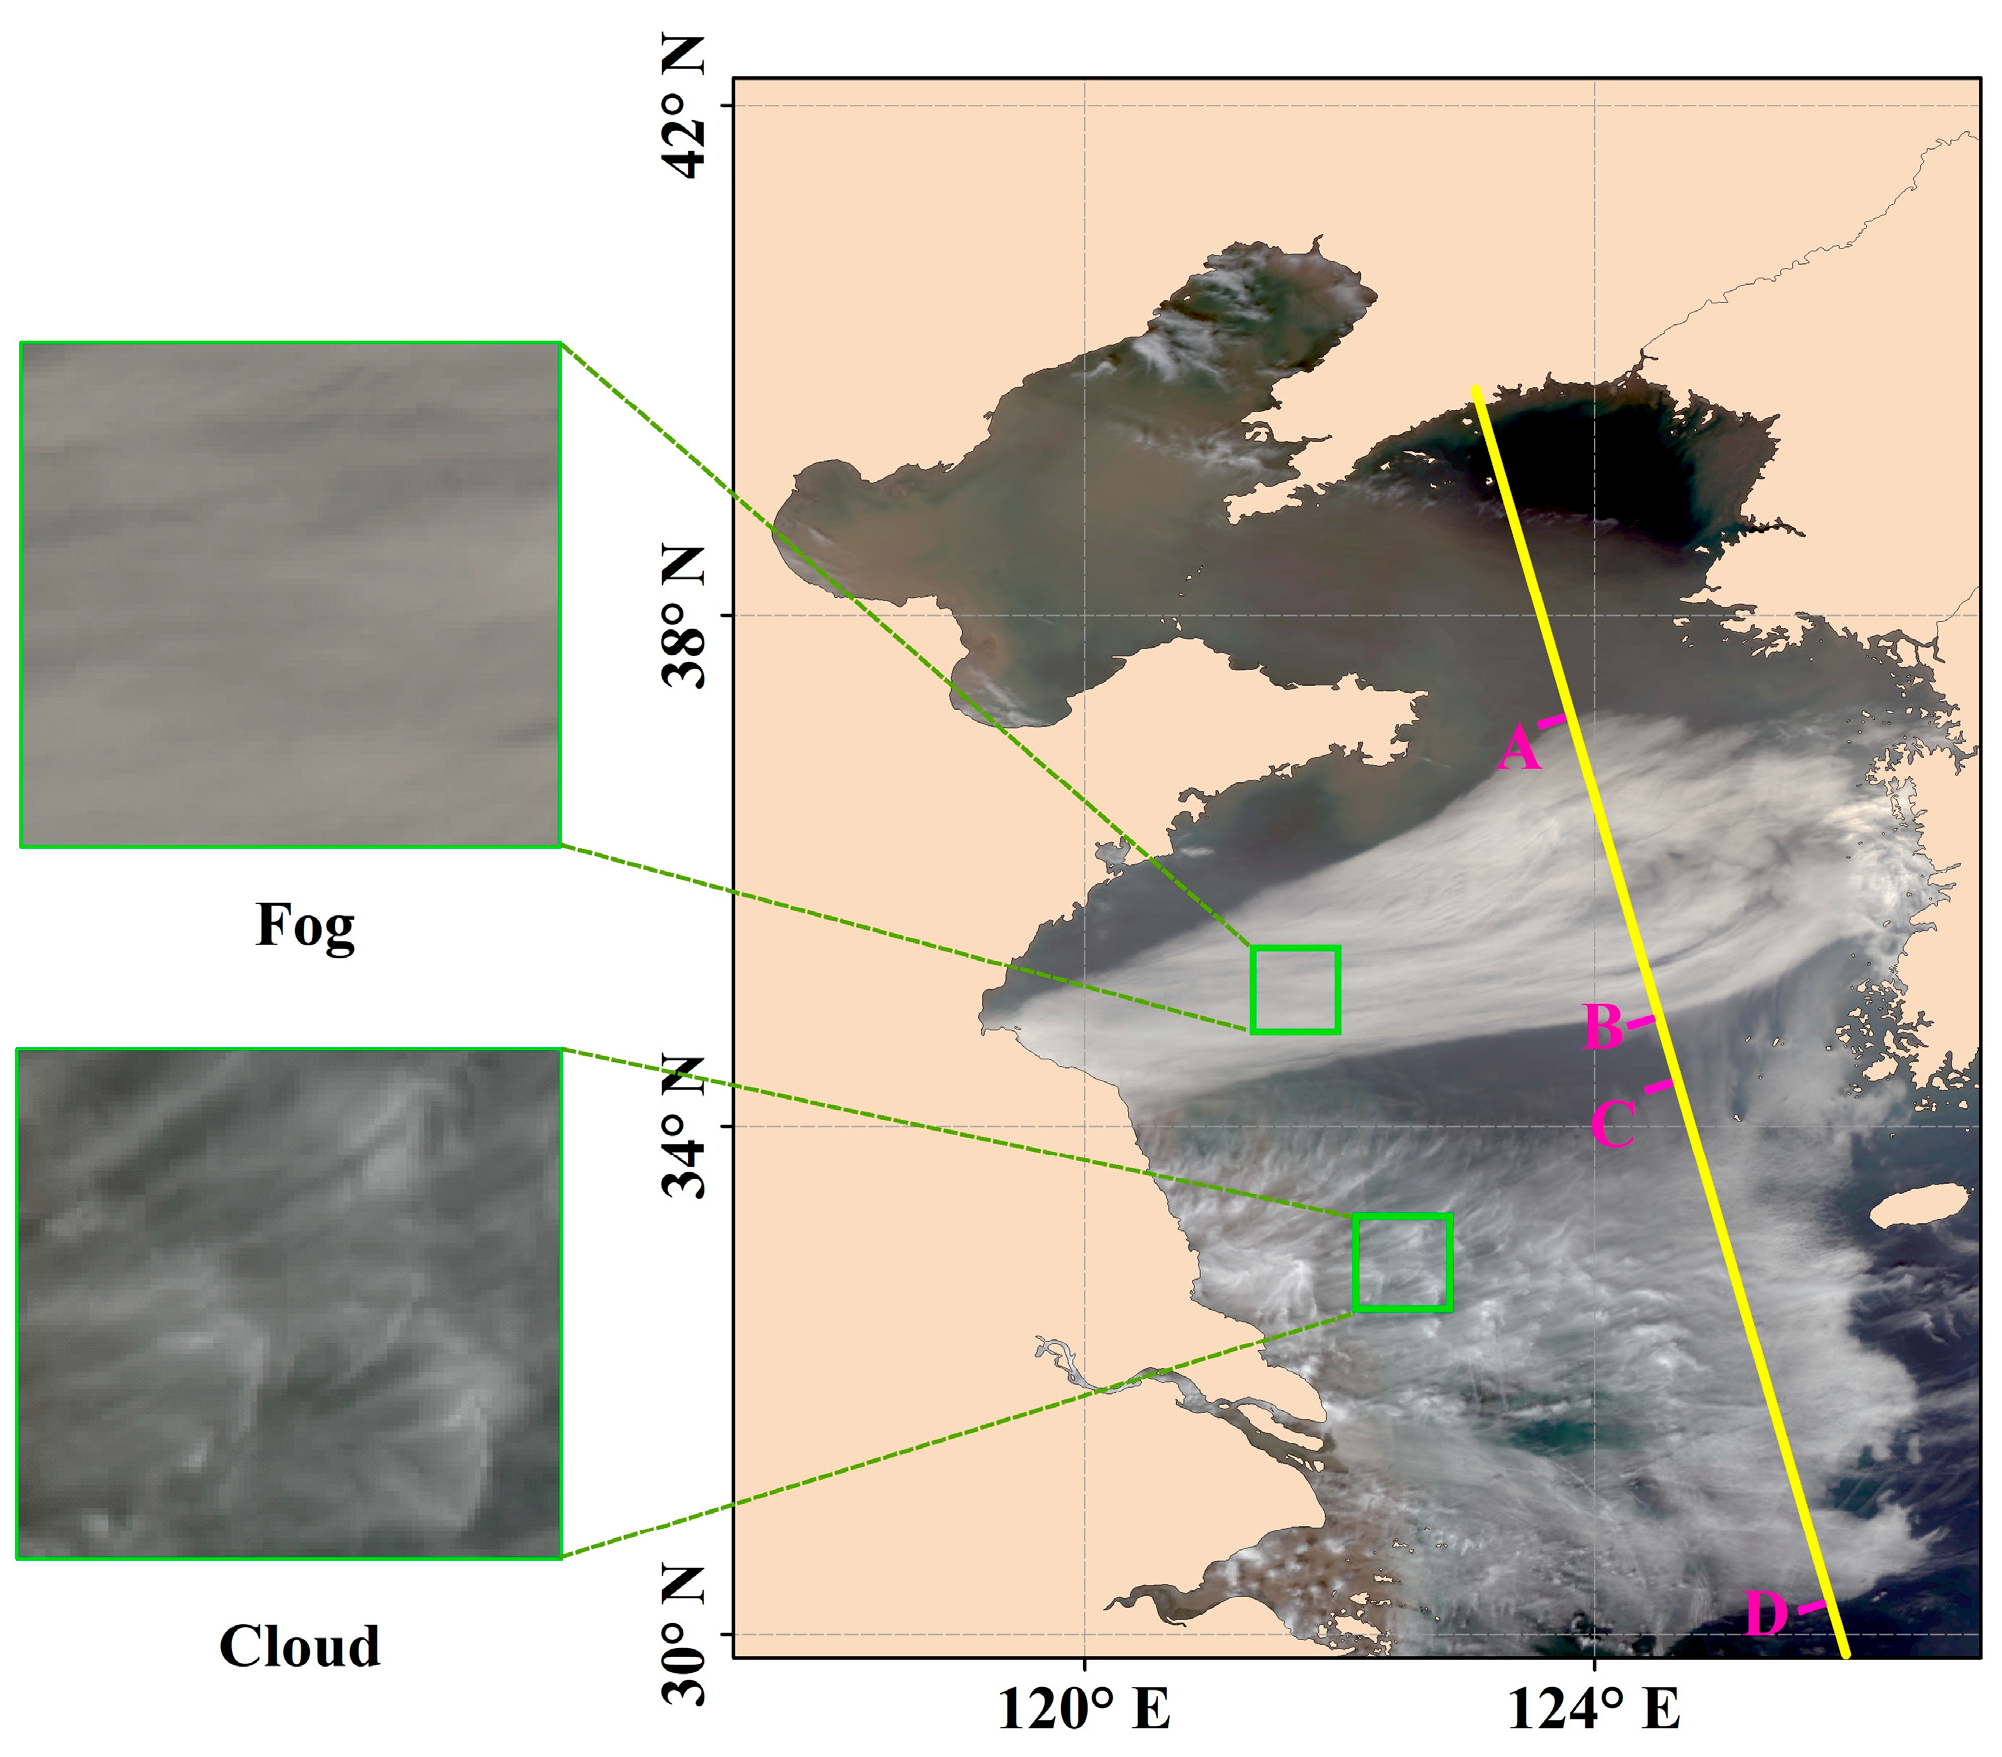
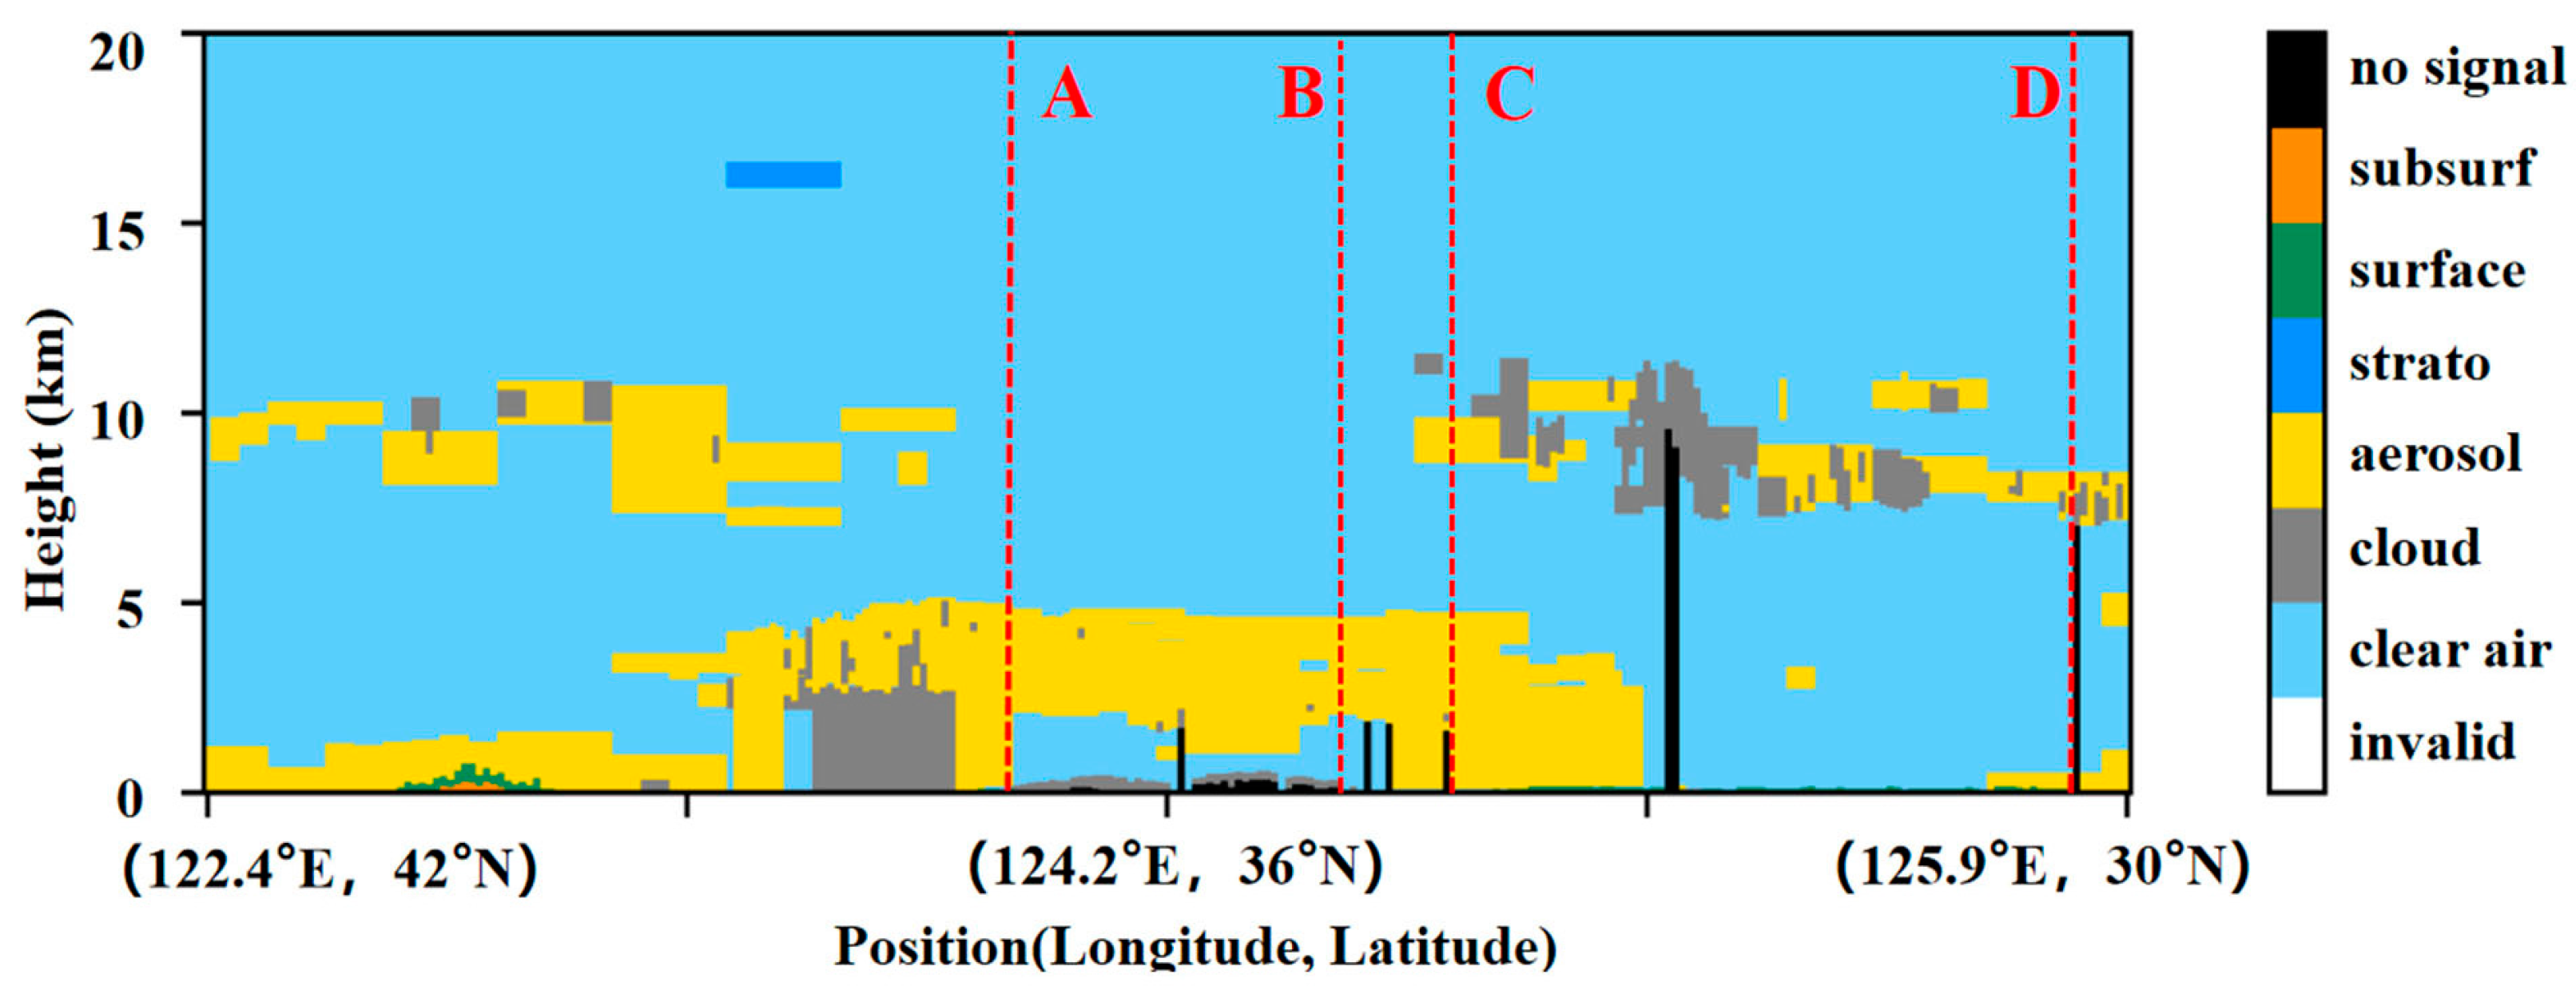
In the process of sea fog labeling, CALIPSO’s VFM product is used to assist in a distinction between clouds and sea fog. The MODIS image from 29 March 2018 was used as an example. Figure 6 shows the MODIS image from 26 March 2018, the yellow line in Figure 6 is the trajectory line of CALIPSO, and Figure 7 shows the vertical section of this trajectory line. In order to facilitate the analysis, we divided the track line of CALIPSO in Figure 6 (yellow line in Figure 6) into two segments, AB and CD, which correspond to the areas labeled AB and CD in Figure 7.
Relying on subjective human judgment alone, areas AB and CD are likely to be labeled as sea fog based on the MODIS imagery in Figure 6. However, the vertical profile from CALIPSO in Figure 7 reveals that there are clouds present in the CD area at an altitude of approximately 10 km above sea level. Therefore, the AB area should be labeled as sea fog and the CD area should be labeled as a mixture of sea fog and clouds.
In addition to using CALIPSO data to assist in the production of the sea fog samples, certain distinctions can be made by the textural features of sea spray and clouds [27]. As seen in the comparison of the two areas on the left side of Figure 6, the texture of sea mist tends to be finer and smoother compared to the rough texture of clouds.
We combined various approaches (CALIPSO data, sea fog texture features, and MODIS waveband combinations) to assist in sea fog identification in the process of producing sea fog sample datasets to minimize the subjectivity of manual labeling. Ultimately, the sea fog dataset was divided into two categories: sea fog and others (land, clouds, and sea).

4.2. Experimental Setup

To facilitate the experimentation process, the sea fog images and labels are randomly cropped to a size of 256 × 256. Moreover, data augmentation [52] is a method to increase the number and diversity of training samples by transforming the original data, which aims to change the appearance, shape, or characteristics of the data so as to make the model more robust and generalizable. We used random rotation, horizontal and vertical flipping, and cropping operations to further expand this data based on the existing sea spray data, and then input it into the model for training.
In the experiments, we set batch_size = 8 and the number of iterations to 80, and the initial learning rate was set to 0.0001. During training of the model, the RMSprop optimizer was used, while the learning rate was dynamically adjusted during the training process with the exponential decay strategy, and the learning rate calculation formula for exponential decay is defined as follows:
ExponentialLR = Base lr × decay _ rate global _ step decay _ steps
where Base_lr is the initial learning rate, decay_rate is the decay coefficient, global_step is the number of training iterations, and decay_steps is the decay rate, i.e., how many rounds to update the parameters.
Considering the characteristics of the unbalanced sea fog samples, the area occupied by the ground and the sea surface is larger, while the sea fog is relatively smaller. In order to improve the accuracy and stability of the model, the focal loss function was used in the process of network training [53]; it is able to solve the problem of category imbalance by decreasing the weight of easily categorized samples during the training process. The focal loss function is defined as follows:
FL p t = α t 1 p t γ log p t
p t = p      i f   y = 1 1 p     o t h e r w i s e
where the focusing parameter γ smoothly adjusts the rate at which the easy examples reduce their weights, pt responds to the proximity of the actual category to the predicted category, and p ∈ [0, 1] is the estimated probability of the model for y = 1.
Eventually, when the model stopped training, the accuracy of the model stabilized at 98.3%.

5. Results

5.1. Model Comparison and Evaluation

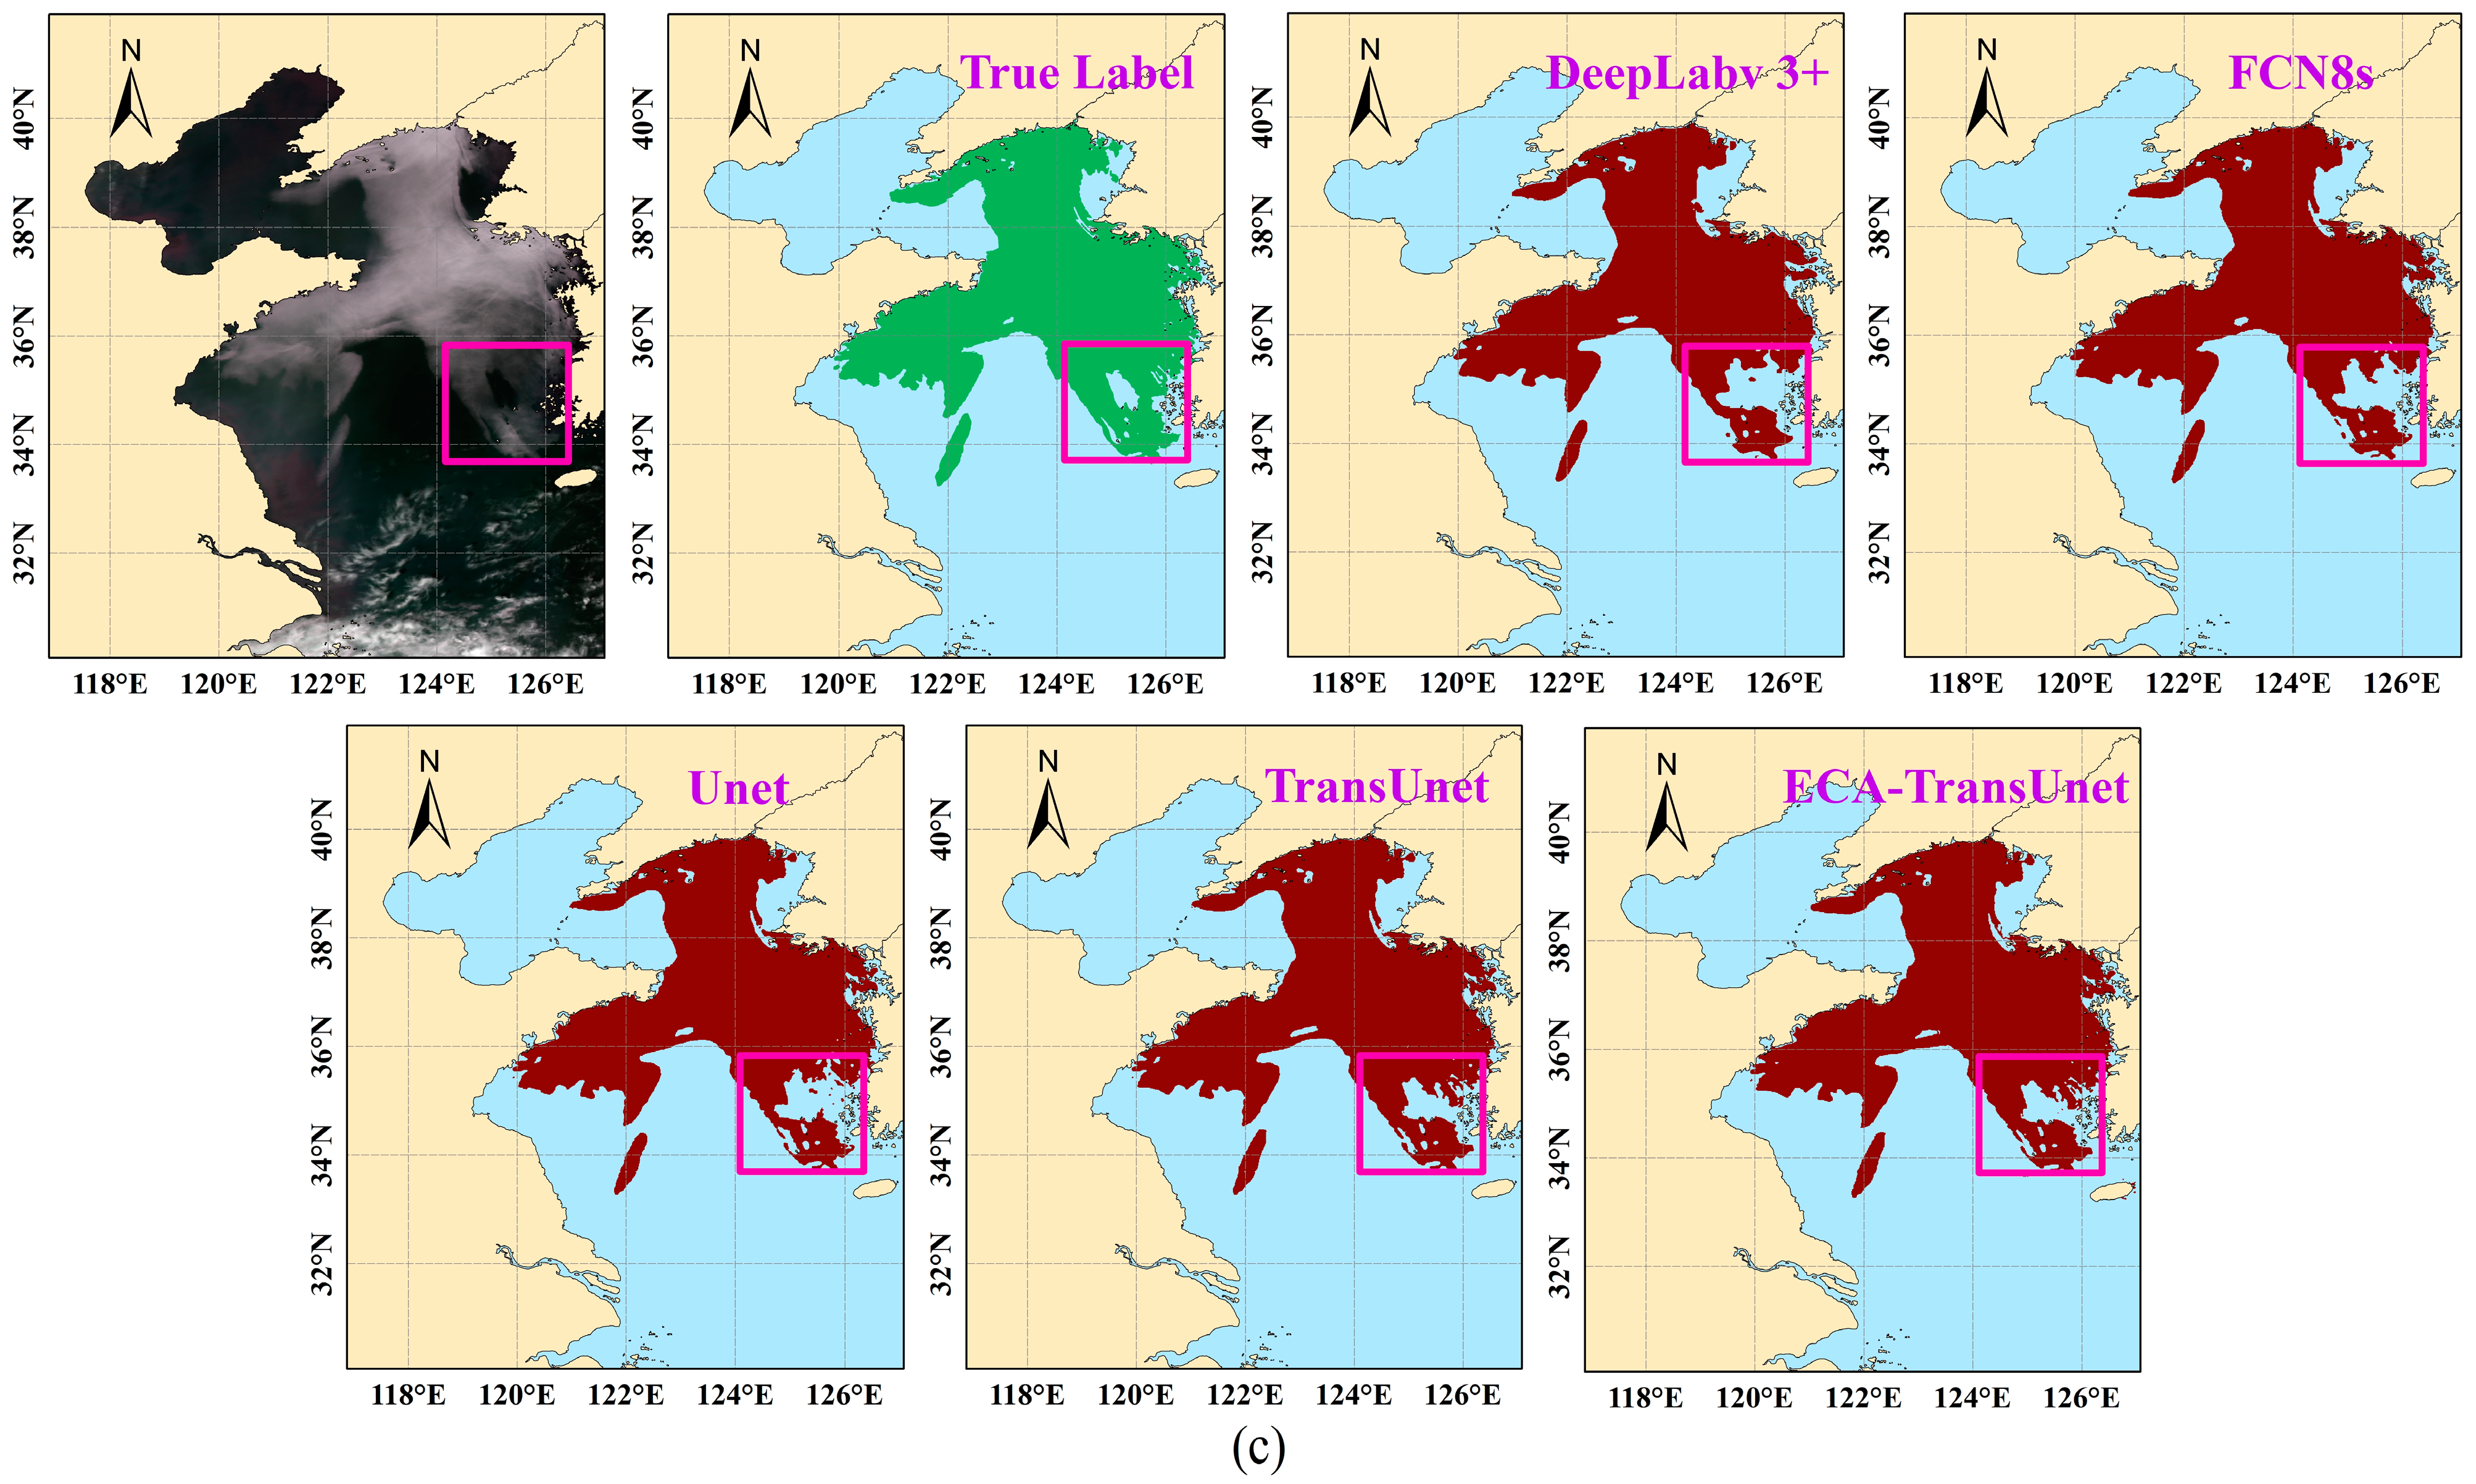
For the presentation of the model results, we selected three days with sea fog events in the Yellow and Bohai seas: 3 June 2013, 12 July 2013, and 26 March 2018. In addition to our proposed ECA-TransUnet model, it was also compared with some other CNN models, including the DeepLabV3+ [54], FCN8s [55], UNet [29], and TransUnet [40] models. Figure 8 illustrates the detailed outcomes of sea fog identification for each model.
As seen in Figure 8a, the ECA-TransUnet model performs better in identifying small, scattered sea fog areas than other models, and the overall sea fog areas identified are approximately the same as the labeled sea fog areas. Figure 8b shows that the ECA-TransUnet model is relatively more accurate in separating sea fog and clouds. Across the three groups of sea fog events, the DeepLabV3+ model presents relatively poor prediction results for the overall sea fog, and the ECA-TransUnet model can identify the sea fog area better than the traditional CNN model. In order to depict the sea spray identification results of each model more distinctly, we have labeled some areas of Figure 8 (red boxes), which will be magnified and exhibited in the follow-up. The ECA-TransUnet model shows some ambiguity for some specific thinner sea fog edge recognition, but the overall sea fog detection results are closest to the true labels. It is worth noting that although we use various auxiliary methods for sea fog labeling, the manual labeling process still has some errors, particularly the distinction between sea fog and low clouds. This is a challenging task in sea fog monitoring since the texture features of sea fog and low clouds can be similar, and also, the two can transform into each other under certain conditions.
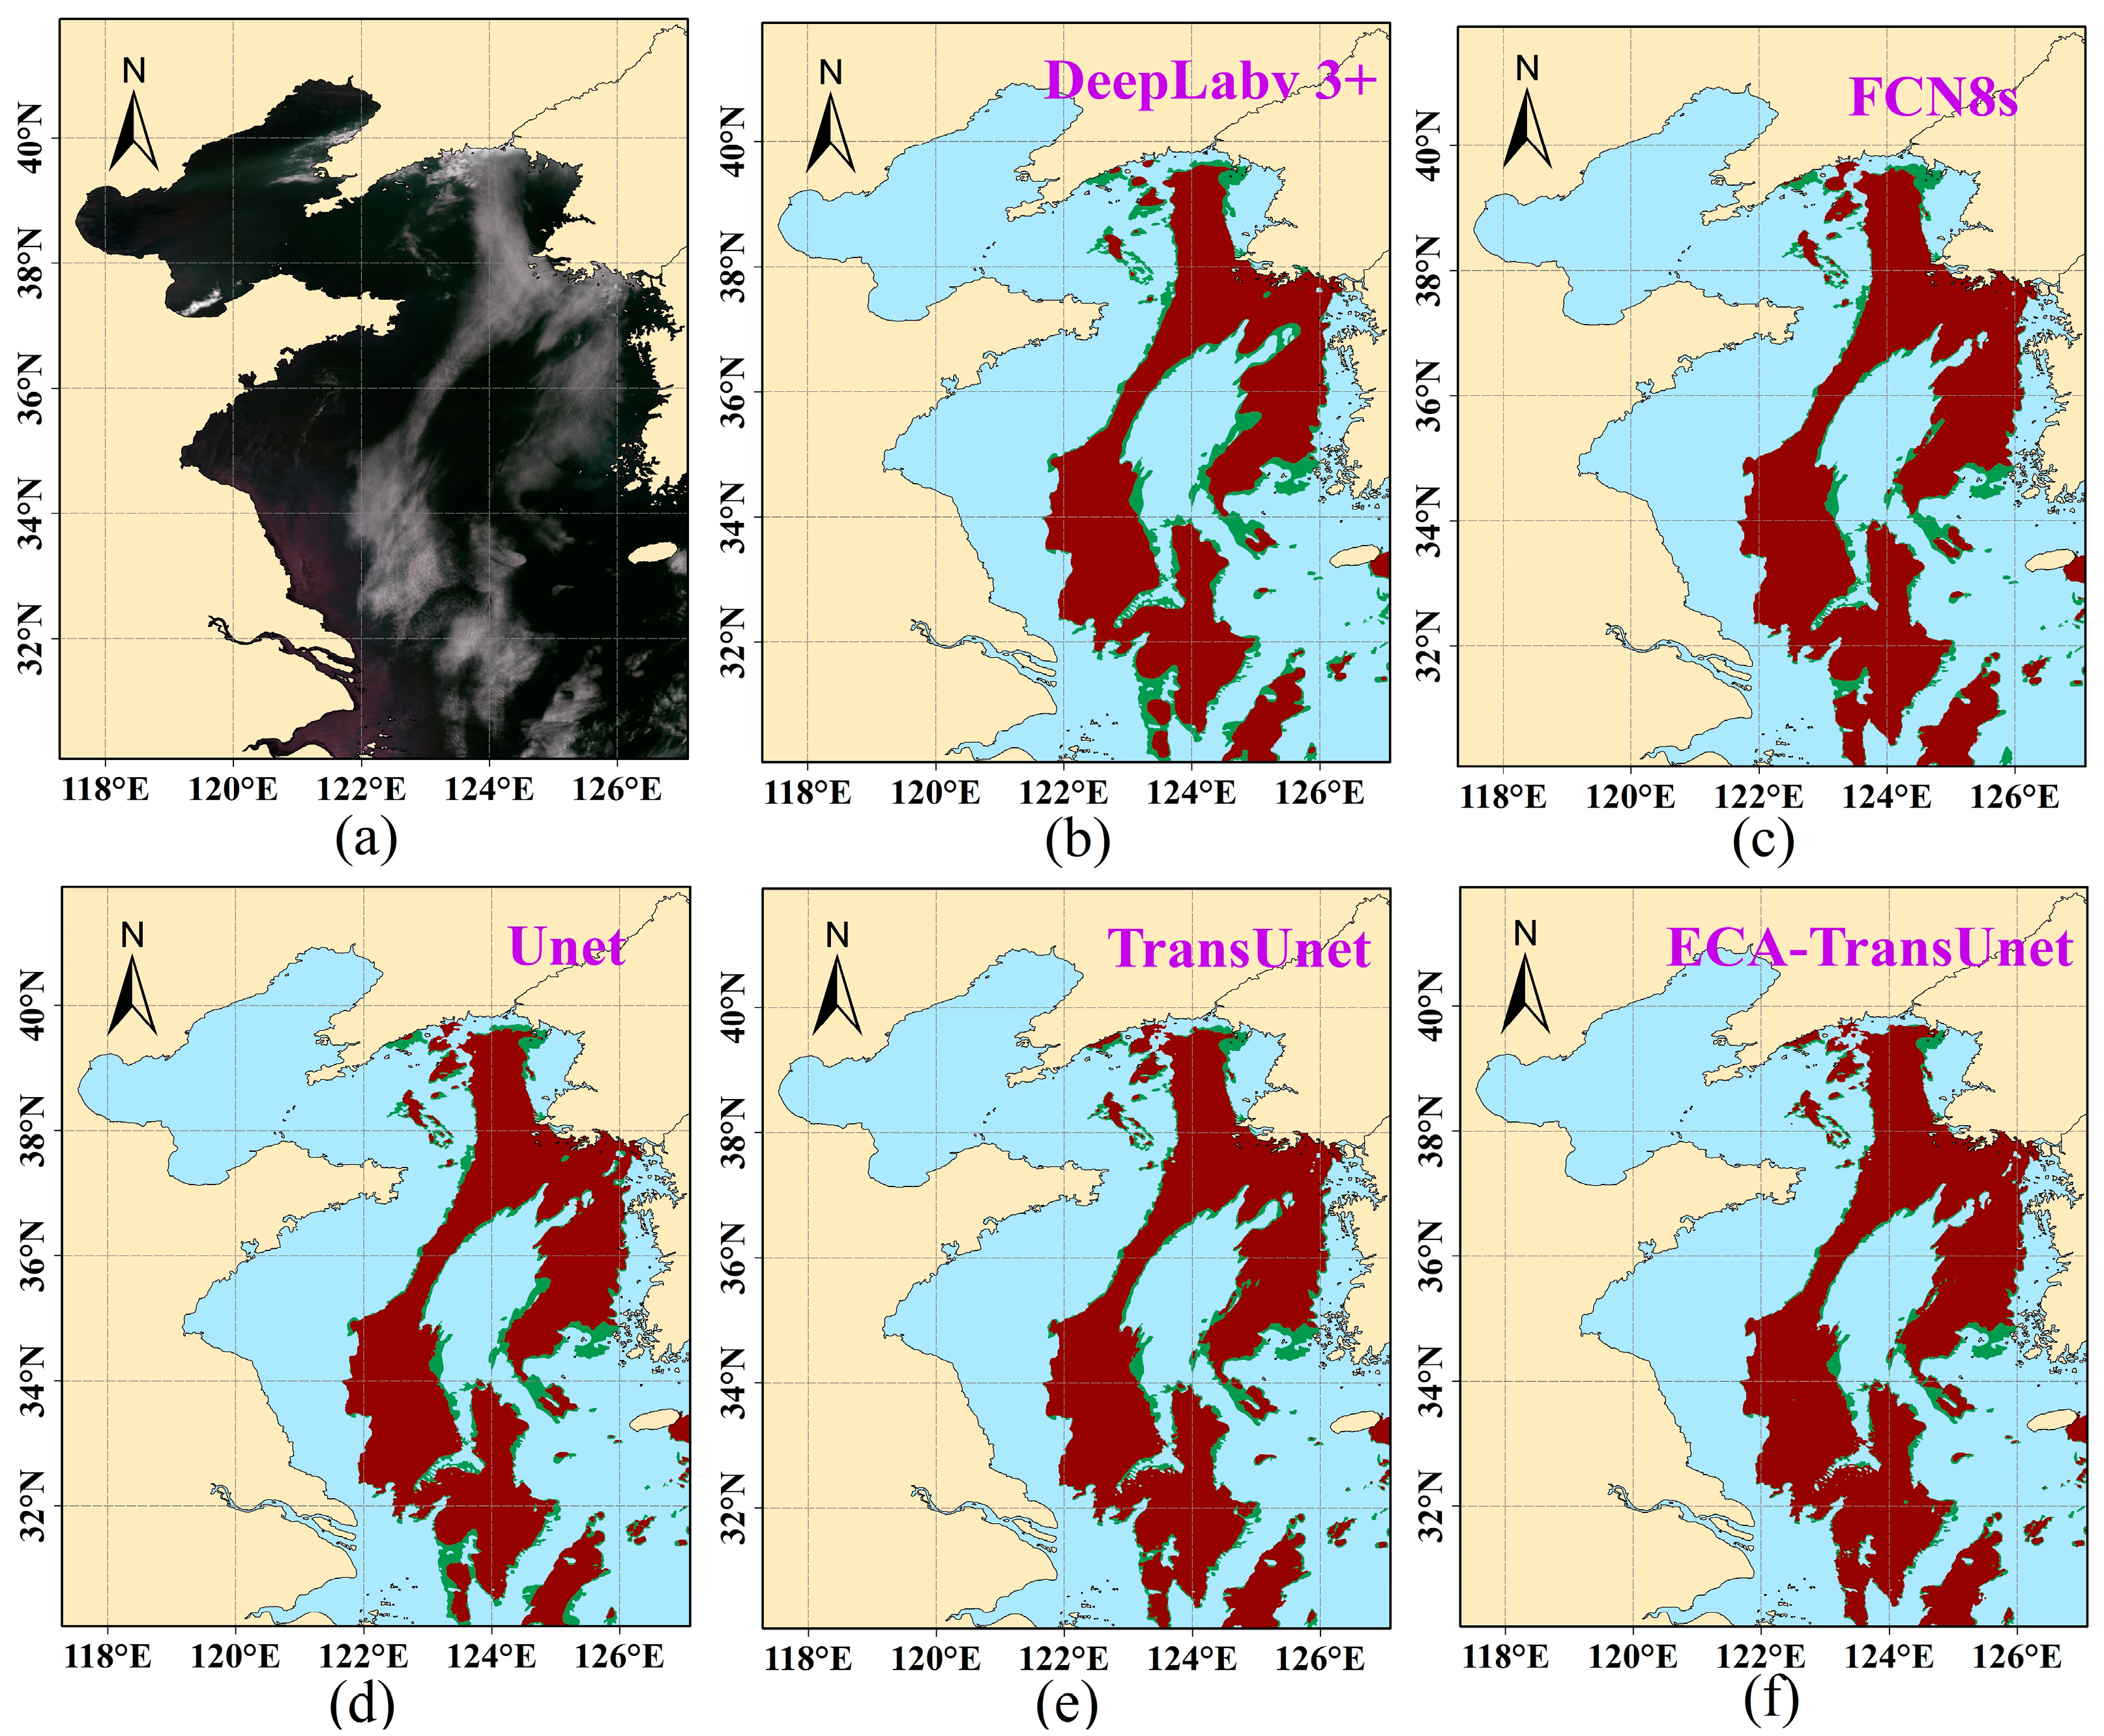
There are some variations in the ability of the different models to recognize sea fog, which is reflected in their ability to distinguish between clouds and fog as well as their recognition of thinner sea fog edges. The ECA-TransUnet model performs better overall in these tasks. To more clearly compare the results of the different models, we present the sea fog results of each model overlaid with the sea fog labels for the event on 3 June 2013 as an example in Figure 9.
Figure 9 illustrates that the overall sea fog results of the ECA-TransUnet model (Figure 9f in red) match more closely with the labeled green areas and can identify some irregular sea fog edges more accurately. In addition to comparing the sea fog results of the different models visually, we also show the differences of each model for sea fog recognition specifically through the evaluation metrics of the models. We evaluated a test set of sea fog data.
Table 2 illustrates the evaluation metrics of each model for sea fog recognition in the test set. The combination of a transformer and a convolutional neural network shows better parameter metrics than most traditional convolutional neural network models. The ECA-TransUnet model improves by 1.49% and 3.95% on Acc and the IoU, respectively, relative to the TransUnet model. On the IoU, ECA-TransUnet is 8.81% higher relative to DeepLabV3+. It is clear from the evaluation metrics that our proposed ECA-TransUnet model has better experimental results in the identification of sea fog relative to several other models.
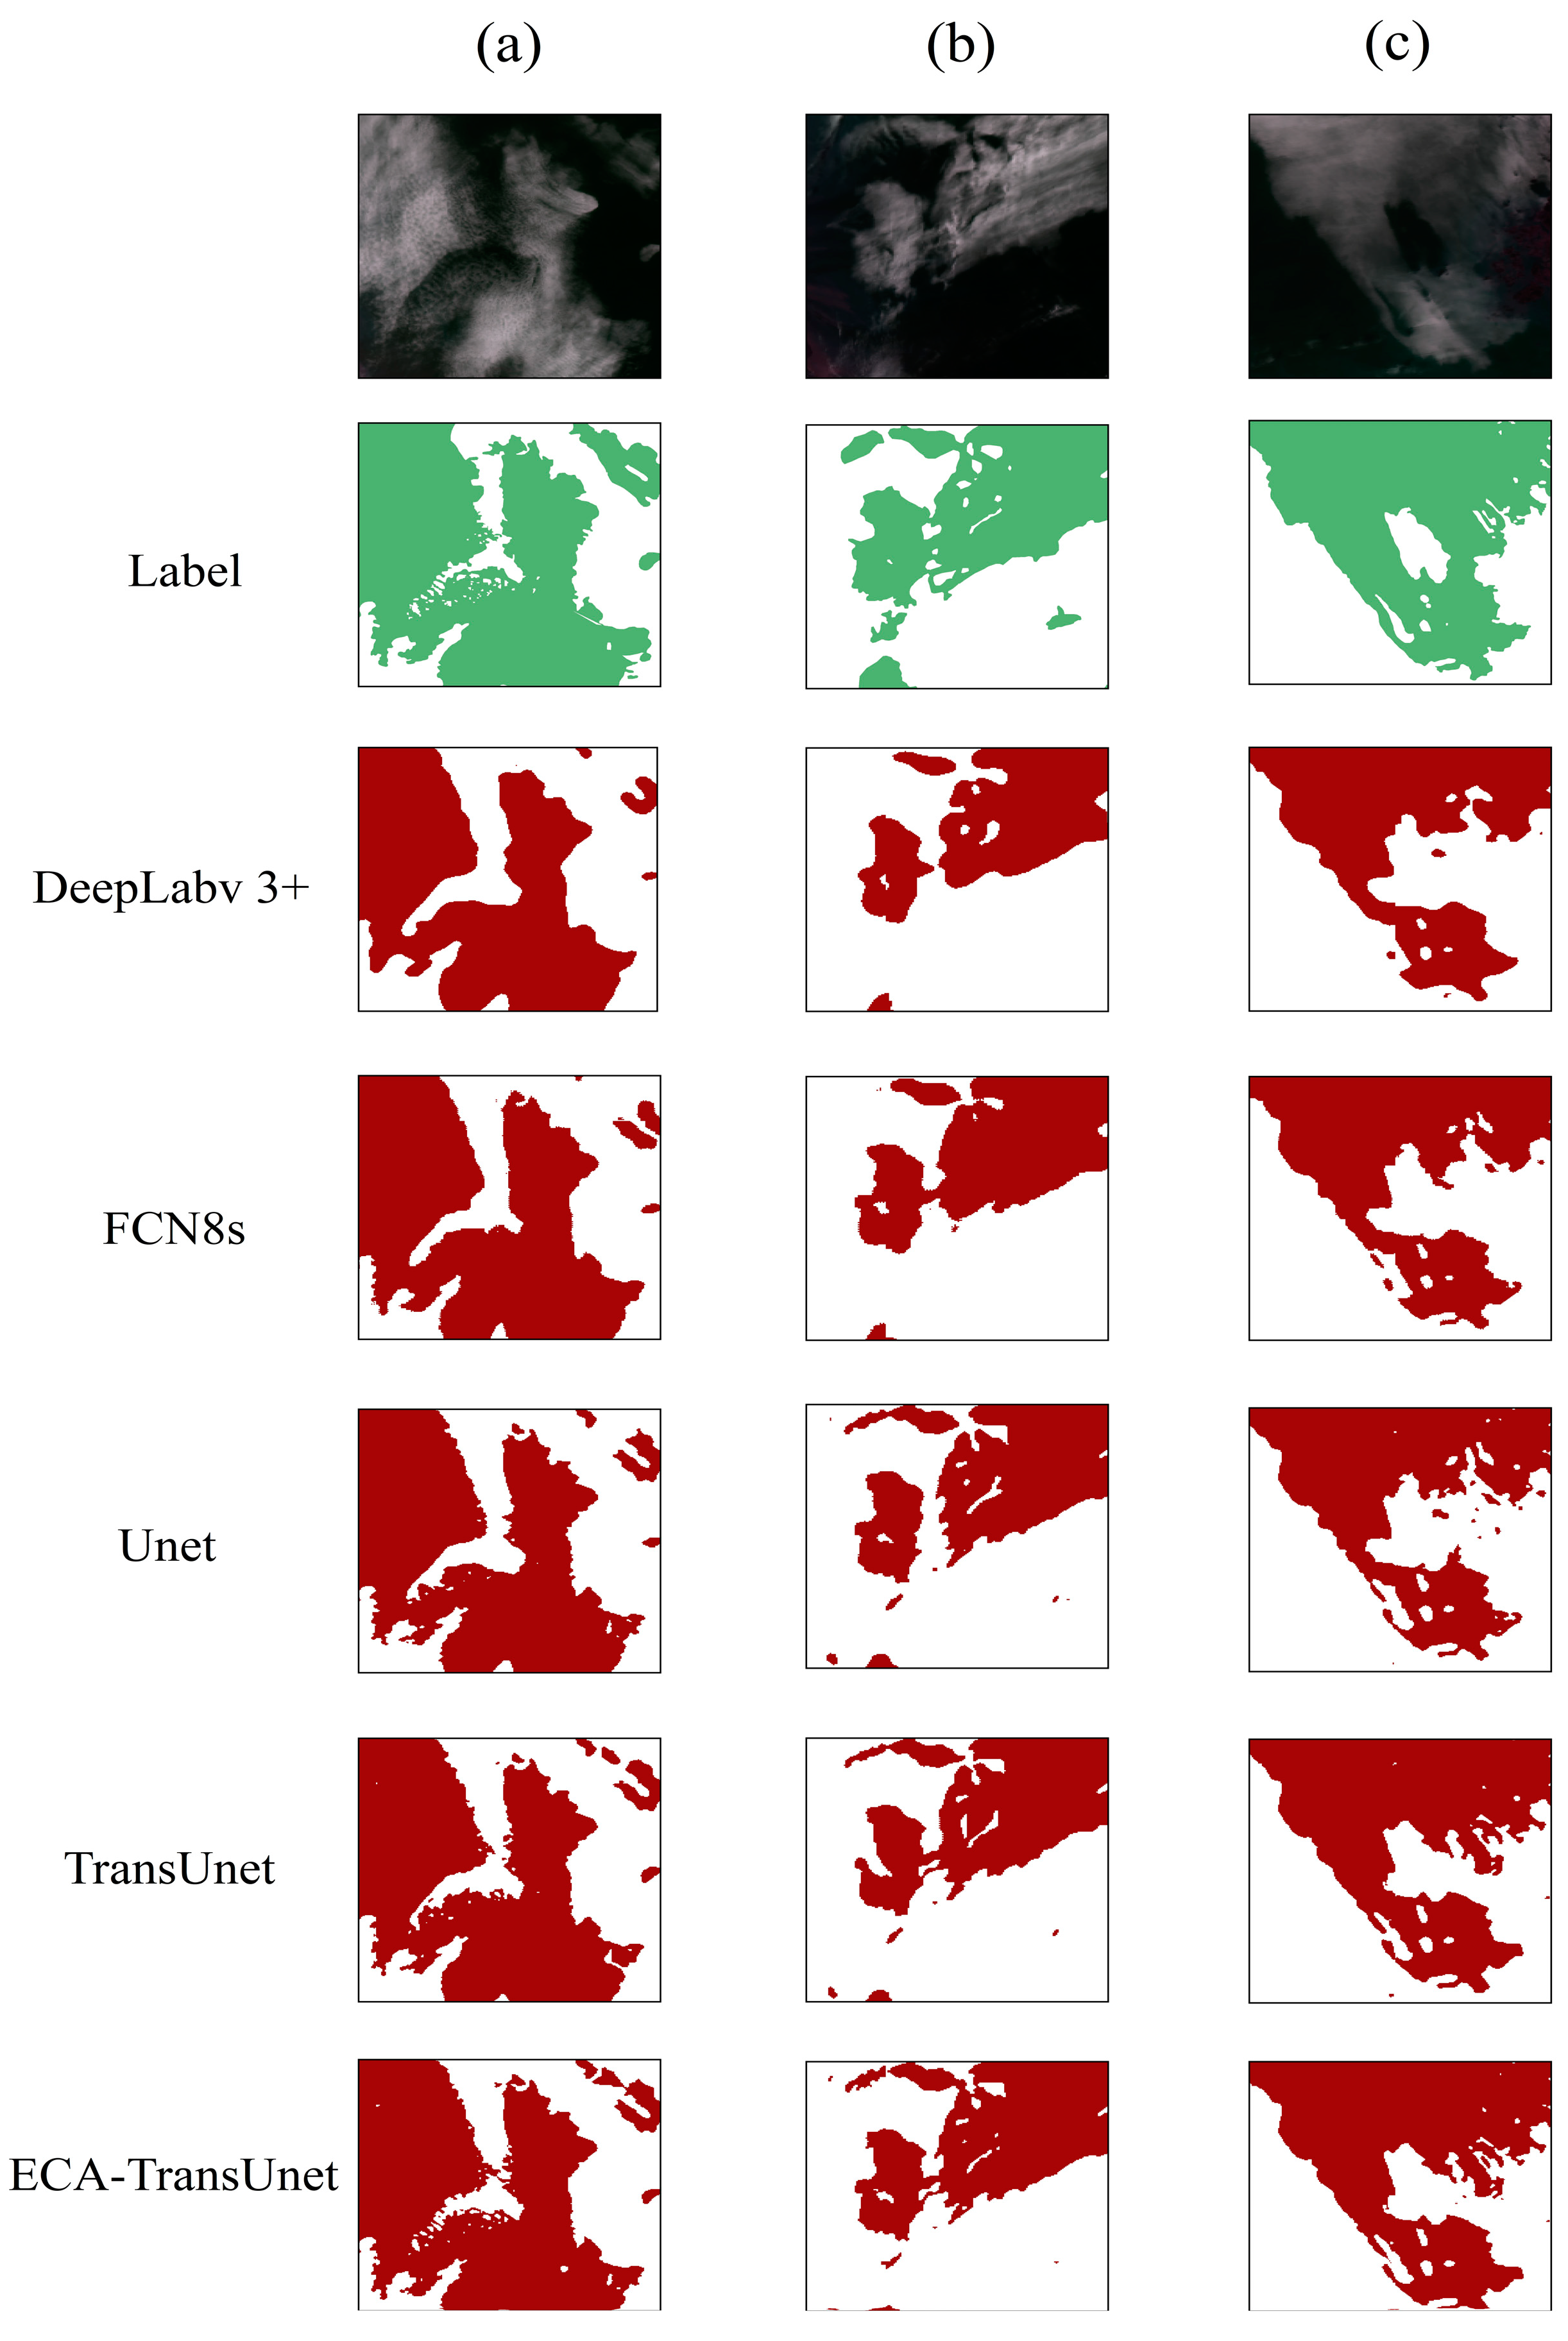
In order to observe the effect of each model on sea fog recognition more distinctly, we marked some areas with rectangular boxes for the three sea fog events in Figure 8 and then zoomed in on the marked areas to show the specific results as shown in Figure 10.
Figure 10a,b exhibits the outcomes of each model in terms of sea fog recognition, and it is apparent that ECA-TransUnet demonstrates superior performance in capturing intricate sea fog details compared to other models. Furthermore, the overall extent of sea fog recognized by ECA-TransUnet closely aligns with the ground truth label. In Figure 10c, ECA-TransUnet overlooks some of the thinner sea fog areas in the sea fog identification results, but the overall sea fog recognition performance is unmatched among other models.

5.2. The Meteorological Conditions of Sea Fog Generation Analysis

Meteorological data from ERA5, including the 10 m u-wind component, 10 m v-wind component, mean sea level pressure, SAT and SST, are used to analyze the meteorological conditions in the area of sea fog occurrence and validate the sea fog results identified by the ECA-TransUnet model. We selected two sea fog events for the analysis.
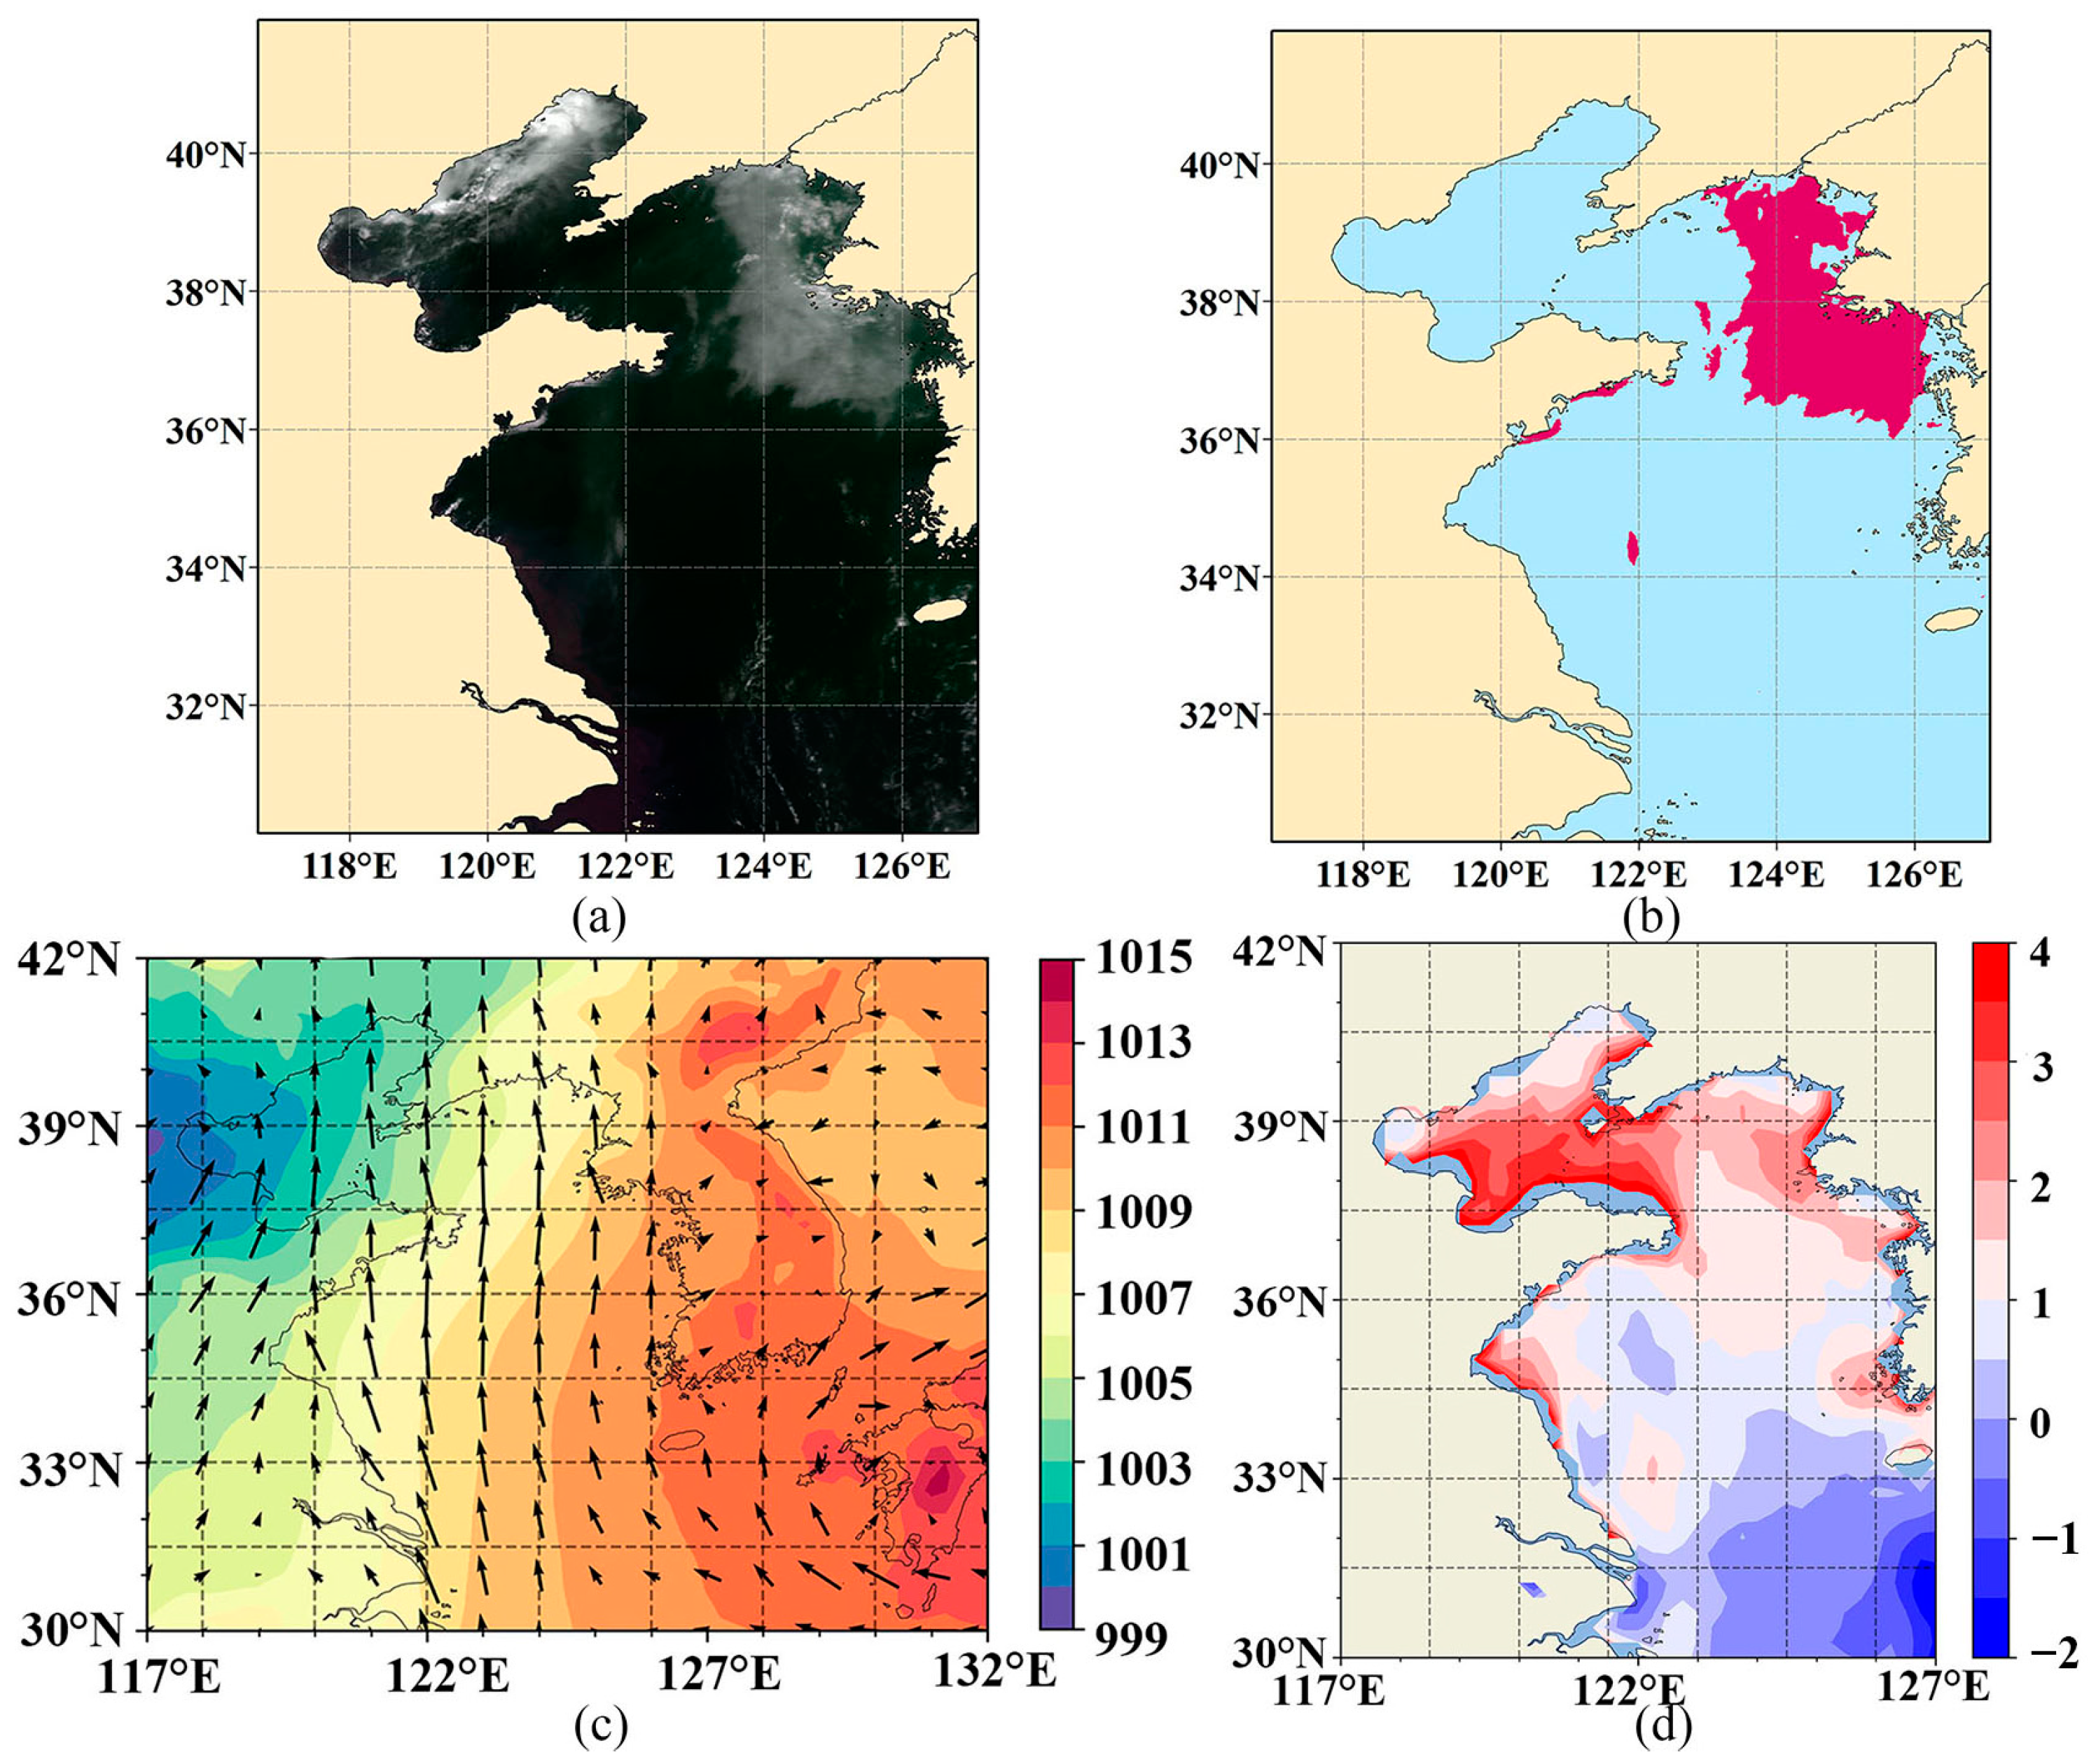
Firstly, the analysis of the sea fog event in the Yellow and Bohai seas on 25 July 2016, is shown in Figure 11. The red area in Figure 11b is the sea fog area identified by the ECA-TransUnet model, and Figure 11c shows the superimposed sea surface mean pressure and wind direction corresponding to the time of sea fog. The warm and humid south wind was transported to the distant sea by the influence of the high-pressure area in the southeastern part of the Korean Peninsula. The difference between the surface air temperature and the sea surface temperature (SAT-SST) exceeded 0.5 °C, which is consistent with the sea fog generation meteorological conditions. Under this meteorological condition, the ECA-TransUnet model identifies the overall sea fog range.
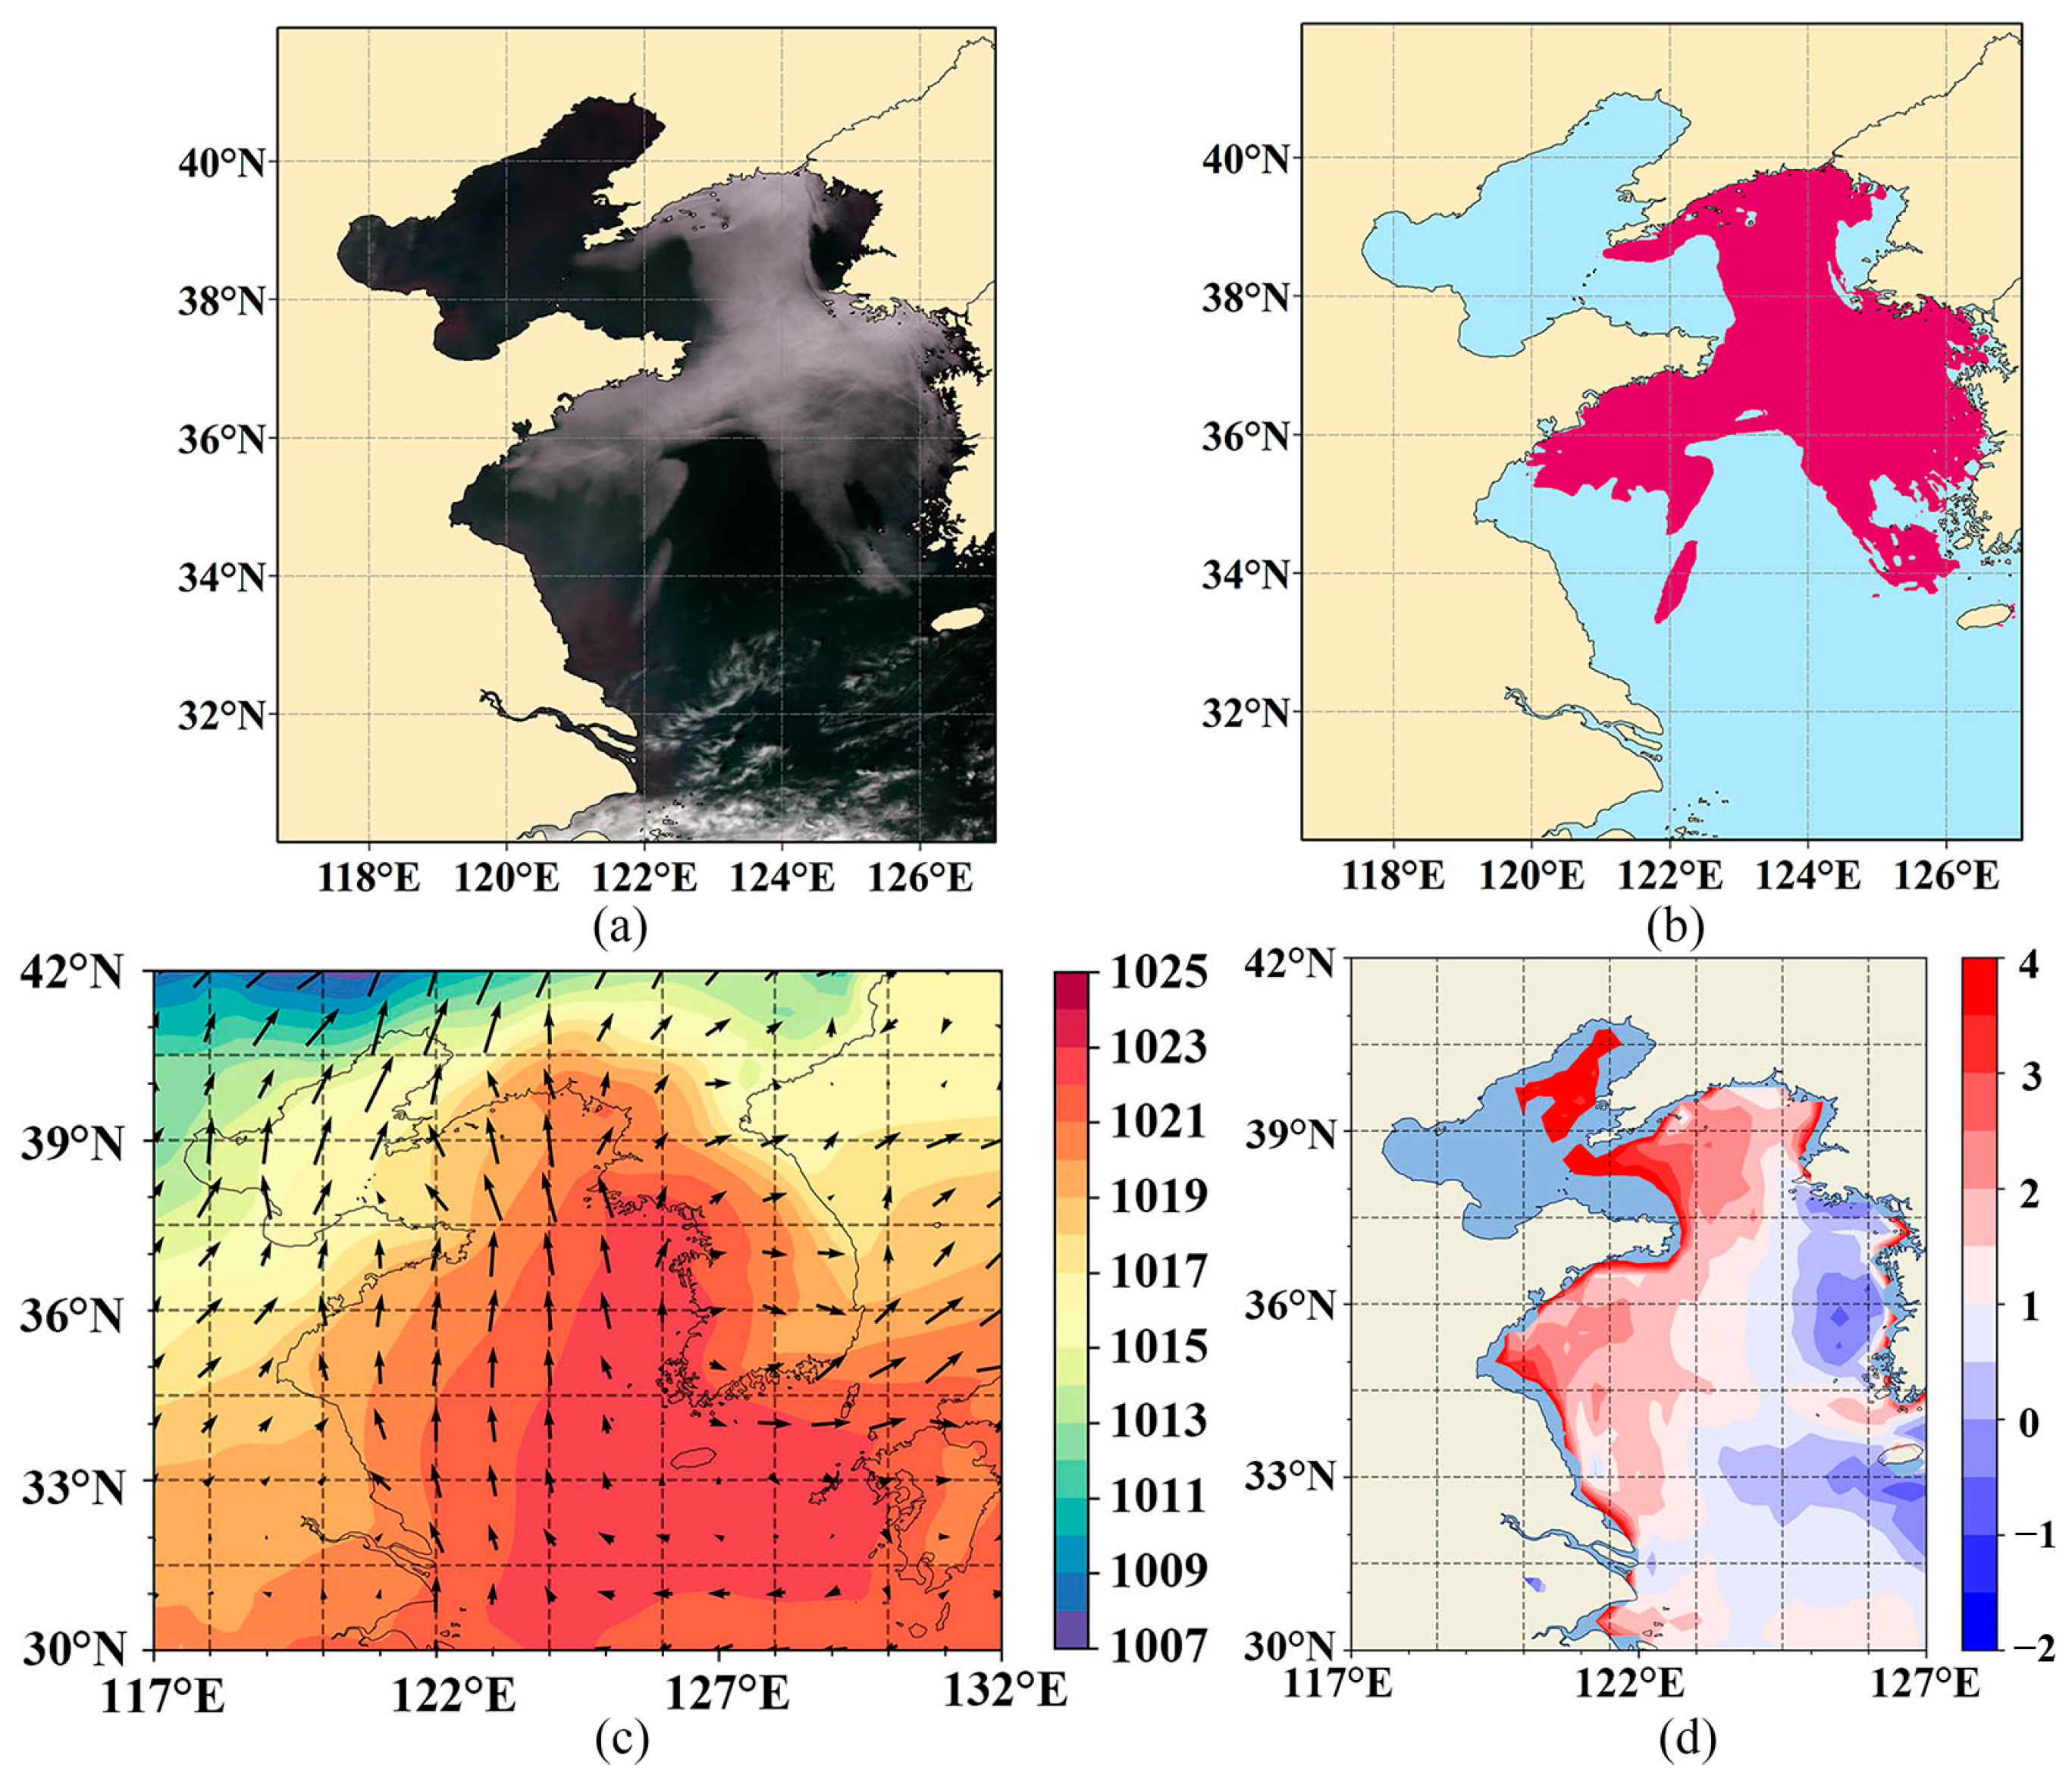
The other sea fog event was dated 26 March 2018. Figure 12c shows the superposition of the mean sea surface pressure and wind direction corresponding to the time of sea fog. It can be seen that there is a high-pressure area at sea level in the southern part of the Korean Peninsula, and the southeastern winds move far offshore after passing through the sea fog region, and the difference between the surface air temperature and the sea surface temperature (SAT-SST) is greater than 0.5 °C due to the influence of the sea surface pressure and wind direction, which is consistent with the meteorological conditions for sea fog generation. The sea fog region identified by the ECA-TransUnet model has some correctness for the overall sea fog region except for a small area in the western part of the Korean Peninsula.

6. Discussion

We have combined the TransUnet network with ECA modules and improved the FFN module to propose an ECA-TransUnet model for daytime sea fog recognition. The combination of a transformer and a CNN can make up for the deficiency of CNNs in establishing long-range dependencies and improve the ability of the model to capture global contextual information. In order to verify the effectiveness of the improvement of the model (ECA-TransUnet), we conducted ablation experiments and proposed two variants of the model: TransUnet-block1: in the decoder part, the ECA module is added after each layer of feature fusion, and the rest remains unchanged, and TransUnet-block2: only the FFN module is improved.
As shown in Table 3, ECA-TransUnet has better evaluation metrics compared with several other models, and it can be initially verified that our improvement of the model (ECA-TransUnet) is effective and can improve the ability to identify sea fog.
Sea fog monitoring by deep learning methods has improved automation. However, it is worth noting that in the process of producing sea fog datasets, manual labeling inevitably leads to certain errors, especially the distinction between sea fog and low clouds, which were grouped together in previous studies [56,57], and how to effectively distinguish between sea fog and low clouds is a problem that needs to be noted in subsequent research. In addition, land and ocean masks were performed during the data processing, and the problem of sea fog identification under remote sensing intricate images should be considered in future research.

7. Conclusions

In this paper, we used MODIS remote sensing images and combined various approaches (CALIPSO data, cloud and sea fog texture features, and MODIS waveband features) to produce sea fog samples with improved accuracy in manual labeling and proposed an ECA-TransUnet model for monitoring sea fog in the Yellow and Bohai seas during the daytime.
We designed a new FFN module in the ECA-TransUnet network to make the model more focused on the better-performing feature information through a dual branch structure and added an ECA module in the decoder part of the model to further consider channel information. To address the extreme class imbalance in the sea fog sample data, we employed the focal loss function to improve the accuracy of the model in identifying daytime sea fog. Our proposed ECA-TransUnet model demonstrated improved performance in sea fog identification compared to some traditional CNN models, with an accuracy of 94.5%. In addition, we also analyzed the meteorological conditions of sea fog generation using ERA5 weather data. The range of sea fog identified by ECA-TransUnet is consistent with the conditions of sea fog generation, which indicates that the proposed model is feasible for daytime sea fog monitoring.

Author Contributions

H.L.: data curation, conceptualization, writing—original draft preparation, software, methodology, validation, and formal analysis; J.Z.: conceptualization, funding acquisition, writing—review and editing, and supervision; Y.M.: software, visualization, and writing—review; S.Z.: coding, visualization, and writing—review; X.Y. writing—reviewing and editing. All authors have read and agreed to the published version of the manuscript.

Funding

This research was jointly funded by the National Natural Science Fund of China (No. 41871253), the Open Fund of Key Laboratory of Urban Land Resources Monitoring and Simulation, Ministry of Natural Resources (No. KF-2021-06-081), the Central Guiding Local Science and Technology Development Fund of Shandong—Yellow River Basin Collaborative Science and Technology Innovation Special Project (No. YDZX2023019), the Shandong Natural Science Foundation of China (No. ZR2020QE281, No. ZR2017ZB0422), Central Guiding Local Science and Technology Development Fund of Shandong—Yellow River Basin Collaborative Science and Technology Innovation Special Project (No. YDZX2023019), and the “Taishan Scholar” Project of Shandong Province (No. TSXZ201712).

Data Availability Statement

Not applicable.

Conflicts of Interest

The authors declare no conflict of interest.

References

  1. Bendix, J. A Satellite-Based Climatology of Fog and Low-Level Stratus in Germany and Adjacent Areas. Atmos. Res. 2002, 64, 3–18. [Google Scholar] [CrossRef]
  2. Gultepe, I.; Tardif, R.; Michaelides, S.C.; Cermak, J.; Bott, A.; Bendix, J.; Mueller, M.D.; Pagowski, M.; Hansen, B.; Ellrod, G.; et al. Fog Research: A Review of Past Achievements and Future Perspectives. Pure Appl. Geophys. 2007, 164, 1121–1159. [Google Scholar] [CrossRef]
  3. Zhang, S.; Li, M.; Meng, X.; Fu, G.; Ren, Z.; Gao, S. A Comparison Study Between Spring and Summer Fogs in the Yellow Sea-Observations and Mechanisms. Pure Appl. Geophys. 2012, 169, 1001–1017. [Google Scholar] [CrossRef]
  4. Han, J.H.; Kim, K.J.; Joo, H.S.; Han, Y.H.; Kim, Y.T.; Kwon, S.J. Sea Fog Dissipation Prediction in Incheon Port and Haeundae Beach Using Machine Learning and Deep Learning. Sensors 2021, 21, 5232. [Google Scholar] [CrossRef] [PubMed]
  5. Fu, G.; Guo, J.; Xie, S.-P.; Duane, Y.; Zhang, M. Analysis and High-Resolution Modeling of a Dense Sea Fog Event over the Yellow Sea. Atmos. Res. 2006, 81, 293–303. [Google Scholar] [CrossRef]
  6. Heo, K.-Y.; Park, S.; Ha, K.-J.; Shim, J.-S. Algorithm for Sea Fog Monitoring with the Use of Information Technologies. Meteorol. Appl. 2014, 21, 350–359. [Google Scholar] [CrossRef]
  7. Mahdavi, S.; Amani, M.; Bullock, T.; Beale, S. A Probability-Based Daytime Algorithm for Sea Fog Detection Using GOES-16 Imagery. IEEE J. Sel. Top. Appl. Earth Obs. Remote Sens. 2021, 14, 1363–1373. [Google Scholar] [CrossRef]
  8. Du, P.; Zeng, Z.; Zhang, J.; Liu, L.; Yang, J.; Qu, C.; Jiang, L.; Liu, S. Fog Season Risk Assessment for Maritime Transportation Systems Exploiting Himawari-8 Data: A Case Study in Bohai Sea, China. Remote Sens. 2021, 13, 3530. [Google Scholar] [CrossRef]
  9. Wang, Y.; Qiu, Z.; Zhao, D.; Ali, M.A.; Hu, C.; Zhang, Y.; Liao, K. Automatic Detection of Daytime Sea Fog Based on Supervised Classification Techniques for FY-3D Satellite. Remote Sens. 2023, 15, 2283. [Google Scholar] [CrossRef]
  10. Fu, G.; Guo, J.; Pendergrass, A.; Li, P. An Analysis and Modeling Study of a Sea Fog Event over the Yellow and Bohai Seas. J. Ocean Univ. China 2008, 7, 27–34. [Google Scholar] [CrossRef]
  11. Yang, J.-H.; Yoo, J.-M.; Choi, Y.-S. Advanced Dual-Satellite Method for Detection of Low Stratus and Fog near Japan at Dawn from FY-4A and Himawari-8. Remote Sens. 2021, 13, 1042. [Google Scholar] [CrossRef]
  12. Ahn, M.; Sohn, E.; Hwang, B. A New Algorithm for Sea Fog/Stratus Detection Using GMS-5 IR Data. Adv. Atmos. Sci. 2003, 20, 899–913. [Google Scholar] [CrossRef]
  13. Eyre, J.R. Detection of fog at night using Advanced Very High Resolution Radiometer (AVHRR) imagery. Meteorol. Mag. 1984, 113, 266–271. [Google Scholar]
  14. Ellrod, G.P. Advances in the detection and analysis of fog at night using GOES multispectral infrared imagery. Weather. Forecast. 1995, 10, 606–619. [Google Scholar] [CrossRef]
  15. Zhang, S.; Yi, L. A Comprehensive Dynamic Threshold Algorithm for Daytime Sea Fog Retrieval over the Chinese Adjacent Seas. Pure Appl. Geophys. 2013, 170, 1931–1944. [Google Scholar] [CrossRef]
  16. Han, J.-H.; Suh, M.-S.; Yu, H.-Y.; Roh, N.-Y. Development of Fog Detection Algorithm Using GK2A/AMI and Ground Data. Remote Sens. 2020, 12, 3181. [Google Scholar] [CrossRef]
  17. Ryu, H.-S.; Hong, S. Sea Fog Detection Based on Normalized Difference Snow Index Using Advanced Himawari Imager Observations. Remote Sens. 2020, 12, 1521. [Google Scholar] [CrossRef]
  18. Wu, X.; Li, S. Automatic Sea Fog Detection over Chinese Adjacent Oceans Using Terra/MODIS Data. Int. J. Remote Sens. 2014, 35, 7430–7457. [Google Scholar] [CrossRef]
  19. LeCun, Y.; Bengio, Y.; Hinton, G. Deep learning. Nature 2015, 521, 436. [Google Scholar] [CrossRef]
  20. Zhang, L.; Zhang, L.; Du, B. Deep Learning for Remote Sensing Data A Technical Tutorial on the State of the Art. IEEE Geosci. Remote Sens. Mag. 2016, 4, 22–40. [Google Scholar] [CrossRef]
  21. Luo, H.; Chen, C.; Fang, L.; Khoshelham, K.; Shen, G. MS-RRFSegNet: Multiscale Regional Relation Feature Segmentation Network for Semantic Segmentation of Urban Scene Point Clouds. IEEE Trans. Geosci. Remote Sens. 2020, 58, 8301–8315. [Google Scholar] [CrossRef]
  22. Zhao, J.; Zhou, Y.; Shi, B.; Yang, J.; Zhang, D.; Yao, R. Multi-Stage Fusion and Multi-Source Attention Network for Multi-Modal Remote Sensing Image Segmentation. ACM Trans. Intell. Syst. Technol. 2021, 12, 1–20. [Google Scholar] [CrossRef]
  23. Ding, L.; Zhang, J.; Bruzzone, L. Semantic Segmentation of Large-Size VHR Remote Sensing Images Using a Two-Stage Multiscale Training Architecture. IEEE Trans. Geosci. Remote Sens. 2020, 58, 5367–5376. [Google Scholar] [CrossRef]
  24. Yu, Y.; Bao, Y.; Wang, J.; Chu, H.; Zhao, N.; He, Y.; Liu, Y. Crop Row Segmentation and Detection in Paddy Fields Based on Treble-Classification Otsu and Double-Dimensional Clustering Method. Remote Sens. 2021, 13, 901. [Google Scholar] [CrossRef]
  25. Bi, H.; Xu, L.; Cao, X.; Xue, Y.; Xu, Z. Polarimetric SAR Image Semantic Segmentation With 3D Discrete Wavelet Transform and Markov Random Field. IEEE Trans. Image Process. 2020, 29, 6601–6614. [Google Scholar] [CrossRef]
  26. Zhang, J.; Lu, H.; Xia, Y.; Han, T.; Miao, K.; Yao, Y.; Liu, C.; Zhou, J.P.; Chen, P.; Wang, B. Deep convolutional neural network for fog detection. In Intelligent Computing Theories and Application, Proceedings of the 14th International Conference on Intelligent Computing, Wuhan, China, 15–18 August 2018; Springer: Berlin/Heidelberg, Germany, 2018; pp. 1–10. [Google Scholar]
  27. Jeon, H.-K.; Kim, S.; Edwin, J.; Yang, C.-S. Sea Fog Identification from GOCI Images Using CNN Transfer Learning Models. Electronics 2020, 9, 311. [Google Scholar] [CrossRef]
  28. Zhu, C.; Wan, J.; Liu, S.; Xiao, Y. Sea Fog Detection Using U-Net Deep Learning Model Based on Modis Data. In Proceedings of the 2019 10th Workshop on Hyperspectral Imaging and Signal Processing: Evolution in Remote Sensing (WHISPERS), Amsterdam, The Netherlands, 24–26 September 2019. [Google Scholar]
  29. Olaf, R.; Philipp, F.; Thomas, B. U-Net: Convolutional networks for biomedical image segmentation. In Proceedings of the Medical Image Computing and Computer-Assisted Intervention (MICCAI), Munich, Germany, 5–9 October 2015; pp. 234–241. [Google Scholar]
  30. Zhou, Y.; Chen, K.; Li, X. Dual-Branch Neural Network for Sea Fog Detection in Geostationary Ocean Color Imager. IEEE Trans. Geosci. Remote Sens. 2022, 60, 4208617. [Google Scholar] [CrossRef]
  31. Huang, Y.; Wu, M.; Guo, J.; Zhang, C.; Xu, M. A Correlation Context-Driven Method for Sea Fog Detection in Meteorological Satellite Imagery. IEEE Geosci. Remote Sens. Lett. 2022, 19, 1003105. [Google Scholar] [CrossRef]
  32. Goodfellow, I.; Pouget-Abadie, J.; Mirza, M.; Xu, B.; Warde-Farley, D.; Ozair, S.; Courville, A.; Bengio, Y. Generative adversarial networks. Commun. ACM 2020, 63, 139–144. [Google Scholar] [CrossRef]
  33. Yu, Q.; Zheng, N.; Huang, J.; Zhao, F. CNSNet: A Cleanness-Navigated-Shadow Network for Shadow Removal. arXiv 2022, arXiv:2209.02174. [Google Scholar]
  34. Han, W.; Zhang, Z.; Zhang, Y.; Yu, J.; Chiu, C.-C.; Qin, J.; Gulati, A.; Pang, R.; Wu, Y. ContextNet: Improving convolutional neural networks for automatic speech recognition with global context. In Proceedings of the Annual Conference of the International Speech Communication Association (Interspeech), Shanghai, China, 25–29 October 2020; pp. 3610–3614. [Google Scholar]
  35. Dosovitskiy, A.; Beyer, L.; Kolesnikov, A.; Weissenborn, D.; Zhai, X.; Unterthiner, T.; Dehghani, M.; Minderer, M.; Heigold, G.; Gelly, S.; et al. An image is worth 16 × 16 words: Transformers for image recognition at scale. arXiv 2020, arXiv:2010.11929. [Google Scholar]
  36. Song, R.; Feng, Y.; Cheng, W.; Mu, Z.; Wang, X. BS2T: Bottleneck Spatial–Spectral Transformer for Hyperspectral Image Classification. IEEE Trans. Geosci. Remote Sens. 2022, 60, 5532117. [Google Scholar] [CrossRef]
  37. He, X.; Zhou, Y.; Zhao, J.; Zhang, D.; Yao, R.; Xue, Y. Swin Transformer Embedding UNet for Remote Sensing Image Semantic Segmentation. IEEE Trans. Geosci. Remote Sens. 2022, 60, 4408715. [Google Scholar] [CrossRef]
  38. Zou, J.; He, W.; Zhang, H. LESSFormer: Local-Enhanced Spectral-Spatial Transformer for Hyperspectral Image Classification. IEEE Trans. Geosci. Remote Sens. 2022, 60, 5535416. [Google Scholar] [CrossRef]
  39. Yang, X.; Cao, W.; Lu, Y.; Zhou, Y. Hyperspectral Image Transformer Classification Networks. IEEE Trans. Geosci. Remote Sens. 2022, 60, 5528715. [Google Scholar] [CrossRef]
  40. Chen, J.; Lu, Y.; Yu, Q.; Luo, X.; Adeli, E.; Wang, Y.; Lu, L.; Yuille, A.L.; Zhou, Y. Transunet: Transformers make strong encoders for medical image segmentation. arXiv 2021, arXiv:2102.04306. [Google Scholar]
  41. Wu, D.; Lu, B.; Zhang, T.; Yan, F. A Method of Detecting Sea Fogs Using CALIOP Data and Its Application to Improve MODIS-Based Sea Fog Detection. J. Quant. Spectrosc. Radiat. Transf. 2015, 153, 88–94. [Google Scholar] [CrossRef]
  42. Kim, D.; Park, M.-S.; Park, Y.-J.; Kim, W. Geostationary Ocean Color Imager (GOCI) Marine Fog Detection in Combination with Himawari-8 Based on the Decision Tree. Remote Sens. 2020, 12, 149. [Google Scholar] [CrossRef] [Green Version]
  43. Shin, D.; Kim, J.-H. A New Application of Unsupervised Learning to Nighttime Sea Fog Detection. ASIA Pac. J. Atmos. Sci. 2018, 54, 527–544. [Google Scholar] [CrossRef] [Green Version]
  44. Wan, J.; Su, J.; Sheng, H.; Liu, S.; Li, J.J. Spatial and Temporal Characteristics of Sea Fog in Yellow Sea and Bohai Sea Based on Active and Passive Remote Sensing. In Proceedings of the IGARSS 2020—2020 IEEE International Geoscience and Remote Sensing Symposium, Waikoloa, HI, USA, 26 September–2 October 2020. [Google Scholar]
  45. Zhang, S.-P.; Xie, S.-P.; Liu, Q.-Y.; Yang, Y.-Q.; Wang, X.-G.; Ren, Z.-P. Seasonal Variations of Yellow Sea Fog: Observations and Mechanisms. J. Clim. 2009, 22, 6758–6772. [Google Scholar] [CrossRef]
  46. Holz, R.E.; Ackerman, S.A.; Nagle, F.W.; Frey, R.; Dutcher, S.; Kuehn, R.E.; Vaughan, M.A.; Baum, B. Global Moderate Resolution Imaging Spectroradiometer (MODIS) Cloud Detection and Height Evaluation Using CALIOP. J. Geophys. Res. Atmos. 2008, 113, D00A19. [Google Scholar] [CrossRef] [Green Version]
  47. Vaswani, A.; Shazeer, N.; Parmar, N.; Uszkoreit, J.; Jones, L.; Gomez, A.N.; Kaiser, Ł.; Polosukhin, I. Attention is all you need. In Advances in Neural Information Processing Systems; MIT Press: Cambridge, MA, USA, 2017; pp. 5998–6008. [Google Scholar]
  48. Hu, J.; Shen, L.; Albanie, S.; Sun, G.; Wu, E. Squeeze-and-Excitation Networks. IEEE Trans. Pattern Anal. Mach. Intell. 2020, 42, 2011–2023. [Google Scholar]
  49. Wang, Q.; Wu, B.; Zhu, P.; Li, P.; Zuo, W.; Hu, Q. ECA-Net: Efficient Channel Attention for Deep Convolutional Neural Networks. arXiv 2019, arXiv:1910.03151. [Google Scholar]
  50. Powers, D.M.W. Evaluation: From Precision, Recall and F-Measure to ROC, Informedness, Markedness and Correlation. arXiv 2020, arXiv:2010.16061. [Google Scholar]
  51. Chen, L.; Niu, S.; Zhong, L. Detection and Analysis of Fog Based on MODIS Data. J. Nanjing Inst. Meteorol. 2006, 29, 448–454. [Google Scholar]
  52. Shorten, C.; Khoshgoftaar, T.M. A Survey on Image Data Augmentation for Deep Learning. J. Big Data 2019, 6, 60. [Google Scholar] [CrossRef] [Green Version]
  53. Lin, T.; Goyal, P.; Girshick, R.; He, K.; Dollár, P. Focal Loss for Dense Object Detection. IEEE Trans. Pattern Anal. Mach. Intell. 2020, 42, 318–327. [Google Scholar] [PubMed] [Green Version]
  54. Chen, L.C.; Zhu, Y.; Papandreou, G.; Schroff, F.; Adam, H. Encoder-decoder with atrous separable convolution for semantic image segmentation. In Proceedings of the European Conference on Computer Vision (ECCV), Munich, Germany, 8–14 September 2018; pp. 801–818. [Google Scholar]
  55. Long, J.; Shelhamer, E.; Darrell, T. Fully convolutional networks for semantic segmentation. In Proceedings of the IEEE Conference on Computer Vision and Pattern Recognition, Boston, MA, USA, 7–12 June 2015; pp. 3431–3440. [Google Scholar]
  56. Cermak, J.; Bendix, J. A novel approach to fog/low stratus detection using Meteosat 8 data. Atmos. Res. 2008, 87, 279–292. [Google Scholar] [CrossRef]
  57. Gao, S.H.; Wu, W.; Zhu, L.; Fu, G. Detection of nighttime sea fog/stratus over the Huang-hai Sea using MTSAT-1R IR data. Acta Oceanol. Sin. 2009, 28, 23–35. [Google Scholar]
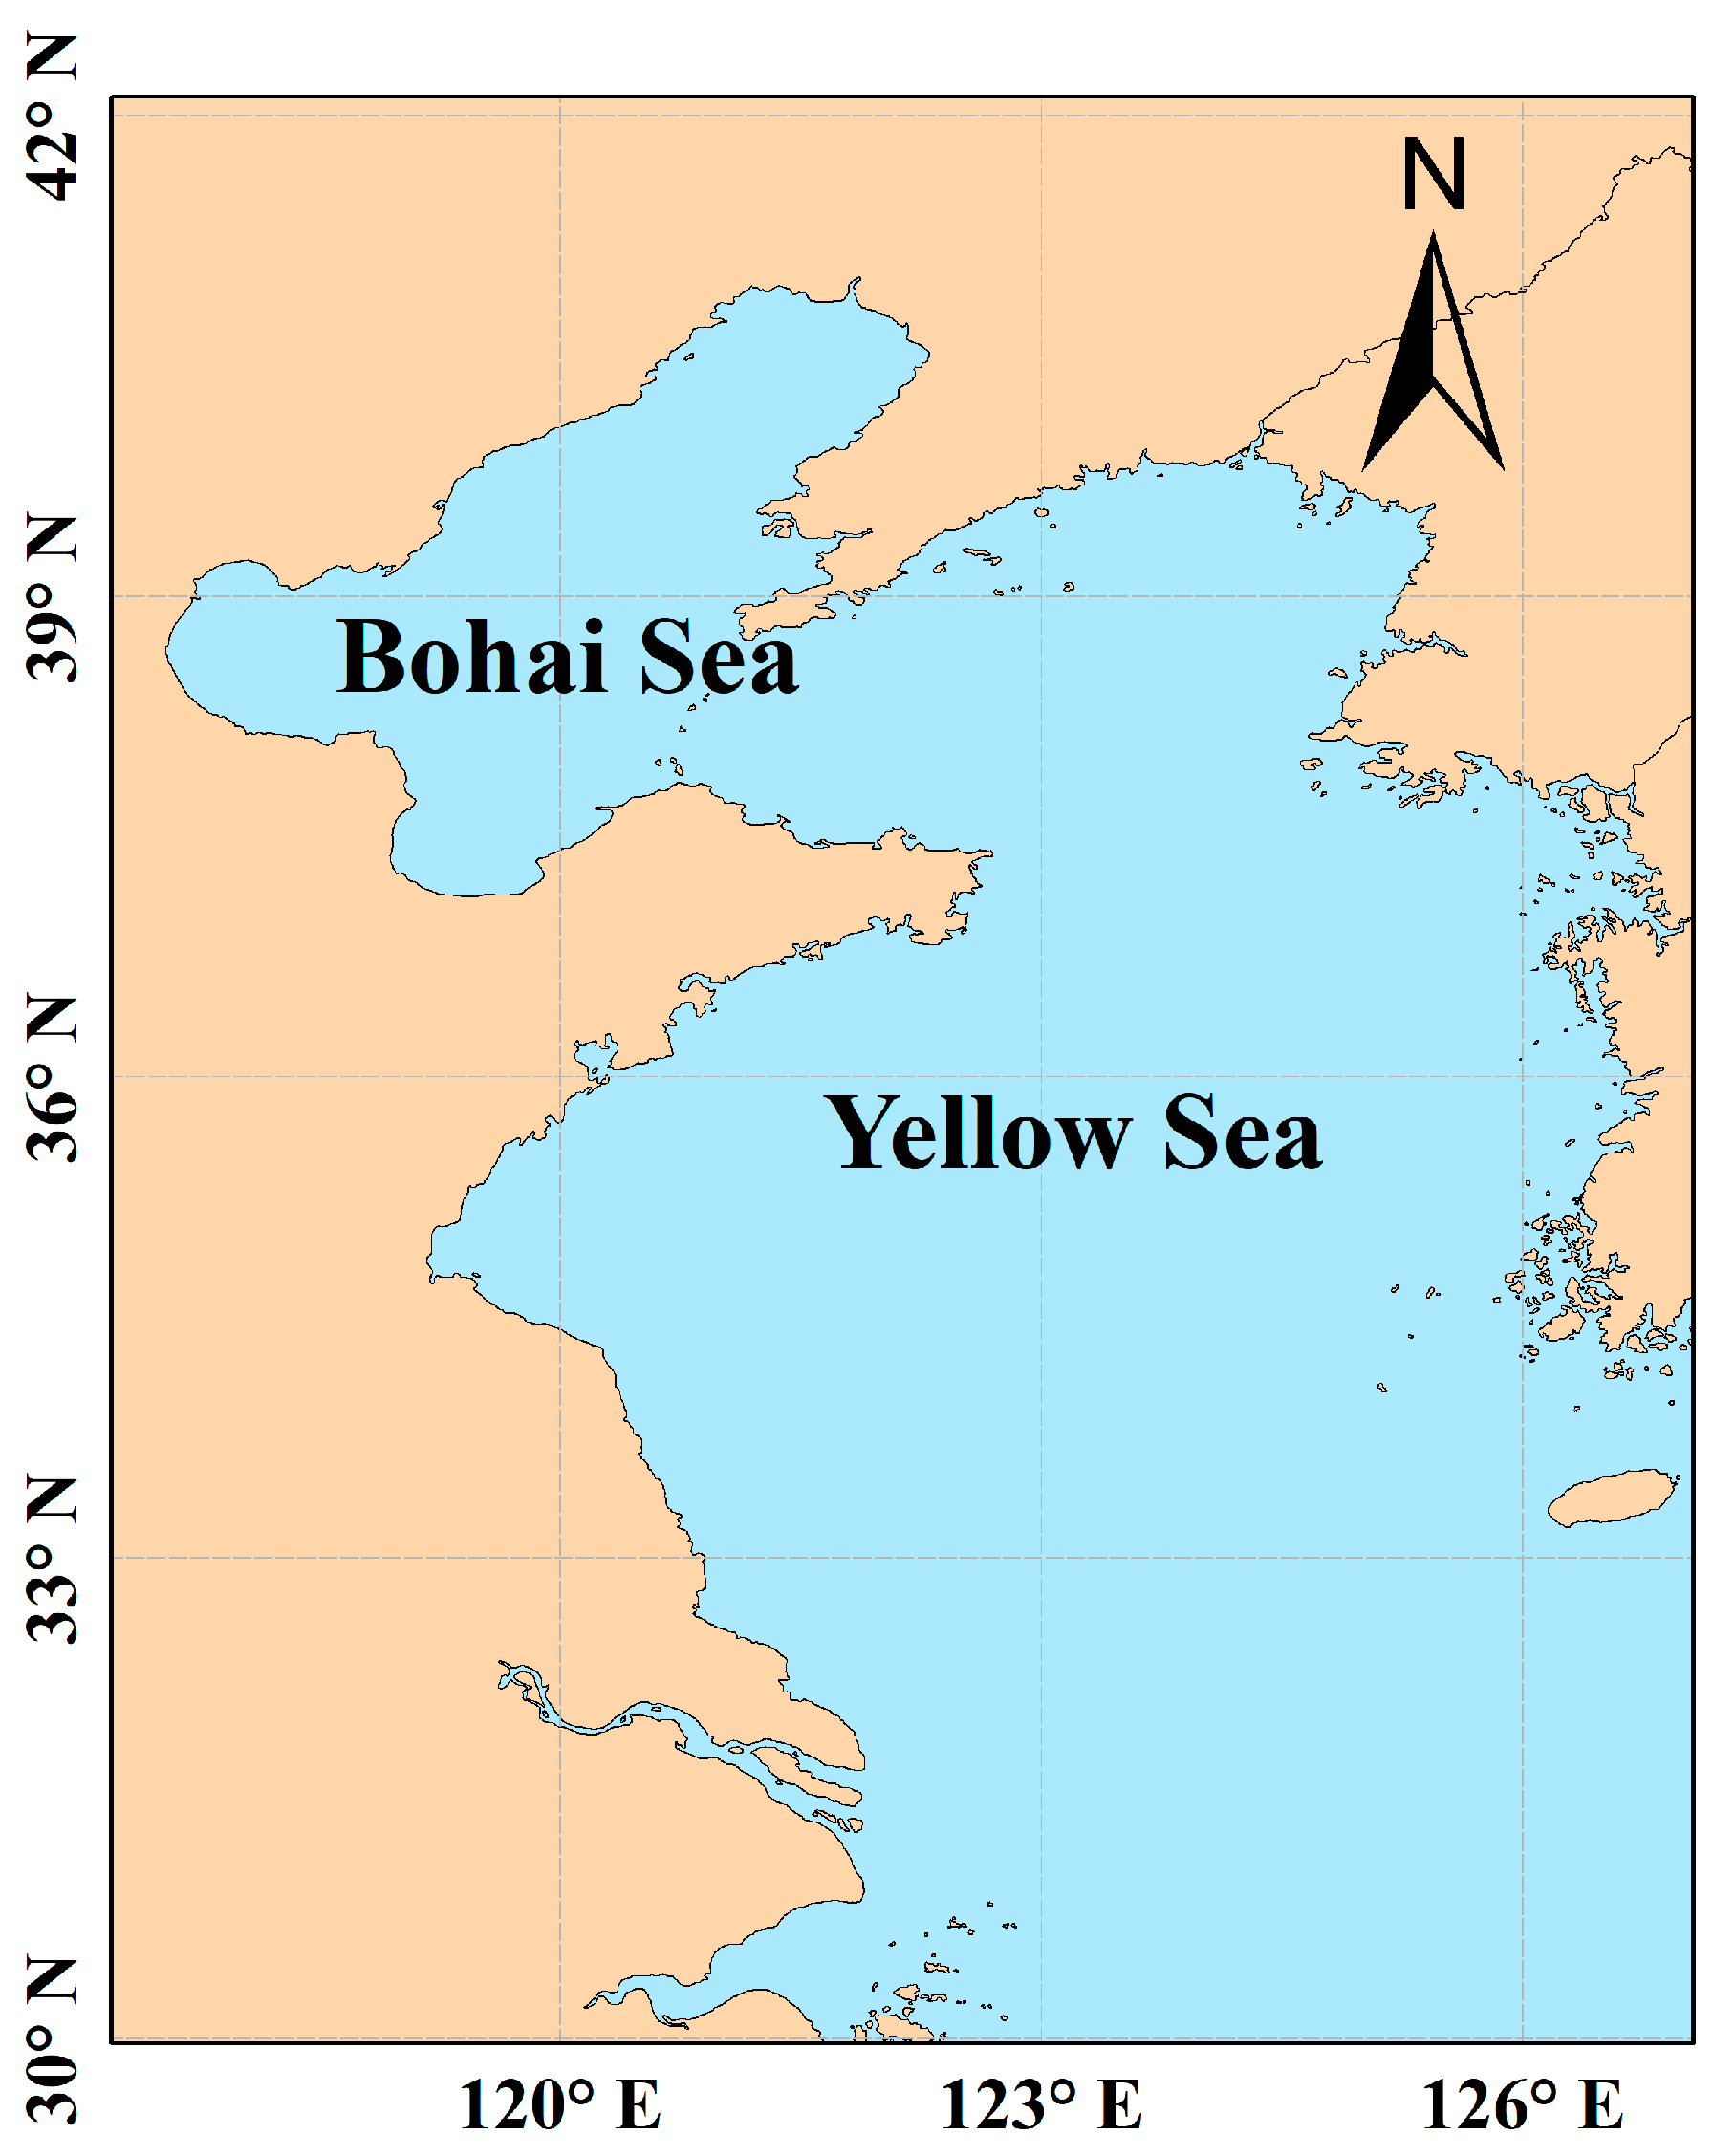
Figure 1. Study area.
Remotesensing 15 03949 g001
Figure 2. General workflow of this study.
Remotesensing 15 03949 g002
Figure 3. ECA-TransUnet model network structure.
Remotesensing 15 03949 g003
Figure 4. (a) Transformer module of the ECA-TransUnet network model and improved FFN structure. (b) Standard FFN module structure.
Remotesensing 15 03949 g004
Figure 5. Structure of the efficient channel attention module; k is proportional to the number of channels.
Remotesensing 15 03949 g005
Figure 6. True color red–green–blue (RGB) MODIS image from 29 March 2018 at 05:00 UTC; the yellow line represents the trajectory line of CALIPSO. Segment AB is a sea fog area and segment CD is a mixture of sea fog and clouds.
Remotesensing 15 03949 g006
Figure 7. Vertical profile of CALIPSO. Segment AB is a sea fog area, segment CD is a mixture of sea fog and clouds.
Remotesensing 15 03949 g007
Figure 8. Comparison of the model results for different sea fog date events. From left to right, the RGB images of MODIS sea fog, sea fog labels, and the results of each model are shown. (a) 3 June 2013 at 05:00 UTC, (b) 12 July 2013 at 05:00 UTC, and (c) 26 March 2018 at 05:00 UTC.
Remotesensing 15 03949 g008aRemotesensing 15 03949 g008b
Figure 9. The different model sea fog recognition results are shown overlaid with real tags: red is the recognition result of the model and green is the sea fog range of the real tags. (a) The RGB images of MODIS sea fog, (b) DeeplabV3+, (c) FCN8s, (d) UNet, (e) TransUnet, and (f) ECA-TransUnet.
Remotesensing 15 03949 g009
Figure 10. Marking the sea fog area for enlarged display: (a) 3 June 2013 at 05:00 UTC, (b) 12 July 2013 at 05:00 UTC, and (c) 26 March 2018 at 05:00 UTC.
Remotesensing 15 03949 g010
Figure 11. Analysis of the sea fog event on 25 July 2016. (a) RGB image from MODIS at 05:00 UTC on 25 July 2016. (b) Results of the ECA-TransUnet model for identifying sea fog under this sea fog event, with the red area as the sea fog region. (c) Superimposed display of mean sea level pressure and 10 m wind vectors. (d) The difference between SAT and SST is shown.
Remotesensing 15 03949 g011
Figure 12. Analysis of the 26 March 2018 sea fog event. (a) RGB image of MODIS at 05:00 UTC on 26 March 2018. (b) Results of the ECA-TransUnet model for identifying sea fog under this sea fog event, with the red area as the sea fog region. (c) Superimposed display of mean sea level pressure and 10 m wind vectors. (d) The difference between SAT and SST is shown.
Remotesensing 15 03949 g012
Table 1. MODIS L1B band information.
BandCentral Wavelength (nm)Spectral Range (nm)Main ApplicationsResolution (m)
1645620–670Land/Cloud Border250
17905890–920Atmospheric water vapor1000
3212.0211.77–12.27Cloud Temperature1000
Table 2. Comparison of the evaluation indexes of different models.
AccRecallIoUF1
DeeplabV3+0.91510.73530.72760.7946
FCN8s0.92440.7450.730.802
Unet0.92790.7830.75330.8152
TransUnet0.93020.80190.77620.8374
ECA-TransUnet0.94510.82310.81570.8587
Table 3. Model ablation results.
RecallIoUF1
TransUnet0.80190.76620.8374
TransUnet-block10.80290.78600.8302
TransUnet-block20.81460.80590.8425
ECA-TransUnet0.82310.81570.8587
Disclaimer/Publisher’s Note: The statements, opinions and data contained in all publications are solely those of the individual author(s) and contributor(s) and not of MDPI and/or the editor(s). MDPI and/or the editor(s) disclaim responsibility for any injury to people or property resulting from any ideas, methods, instructions or products referred to in the content.