
Sustainable Development Goal 6 Assessment and Attribution Analysis of Underdeveloped Small Regions Using Integrated Multisource Data


Abstract
:1. Introduction
2. Materials and Methods
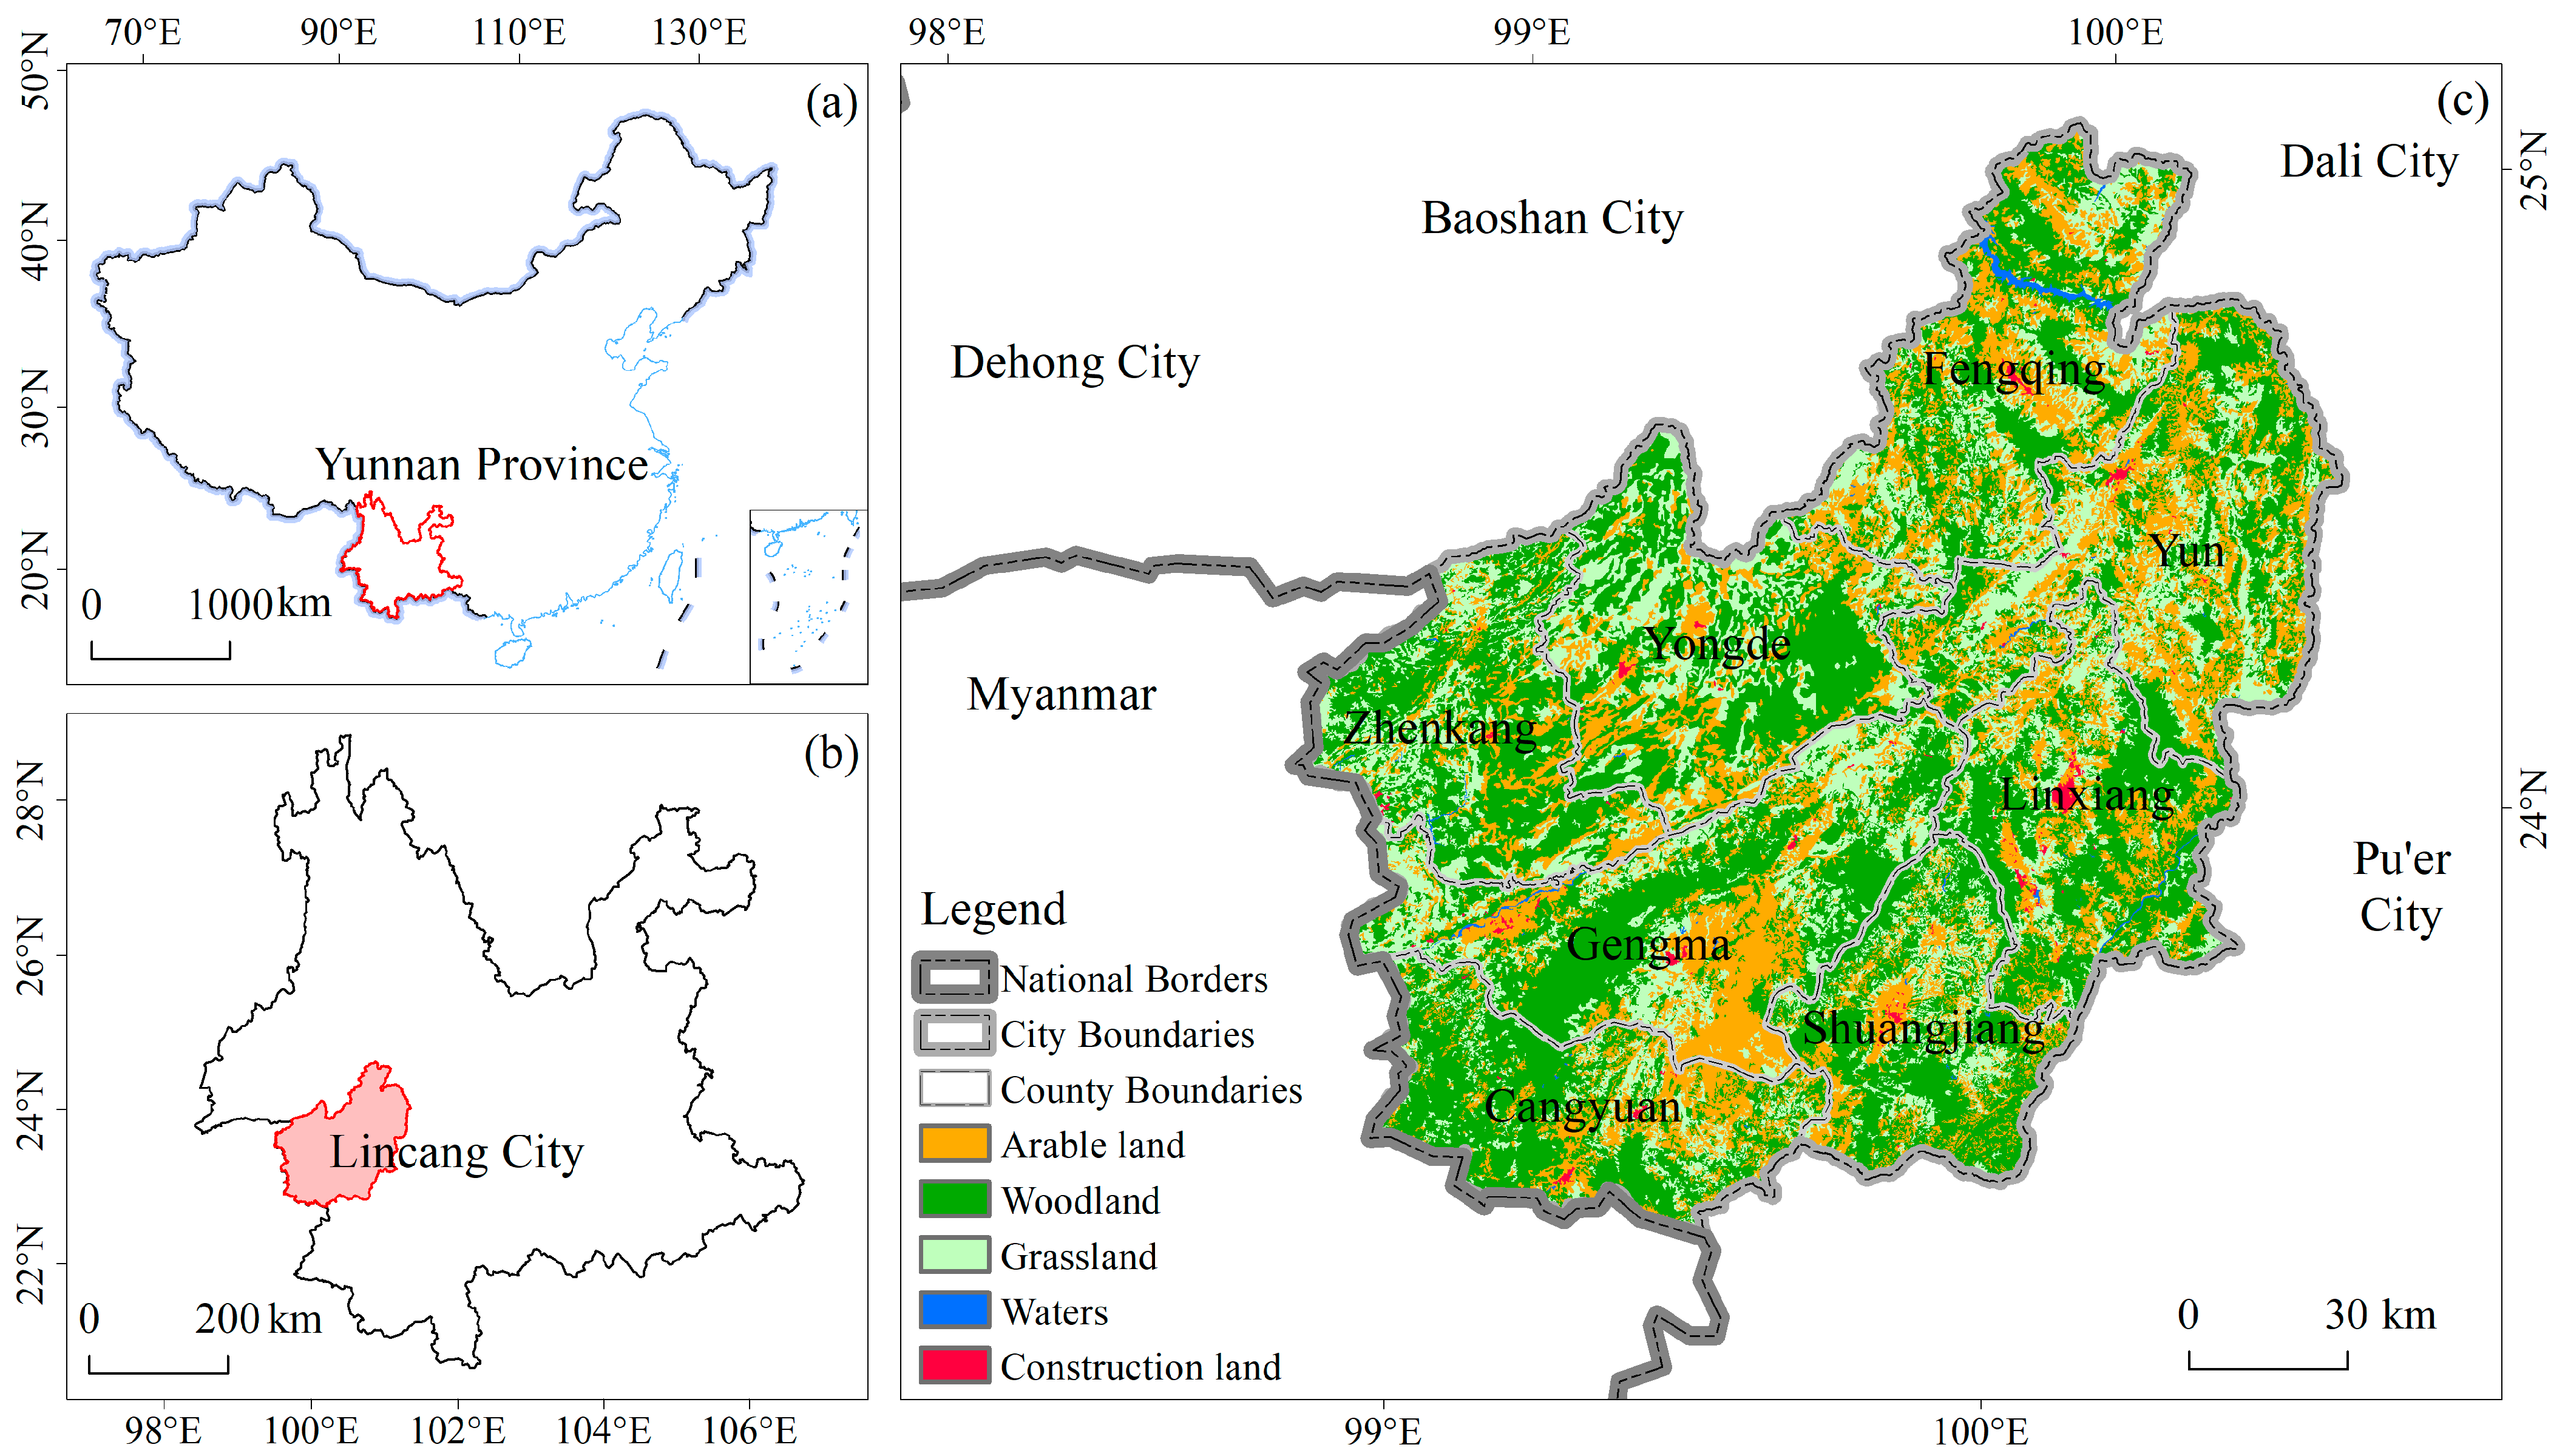
2.1. Study Area
2.2. Data Sources
2.3. Methods
2.3.1. Calculation of the Sustainable Development Index
2.3.2. Calculation of the Sustainable Development Index
2.3.3. Influencing Factor Identification of the SDG 6 Composite Index
3. Results
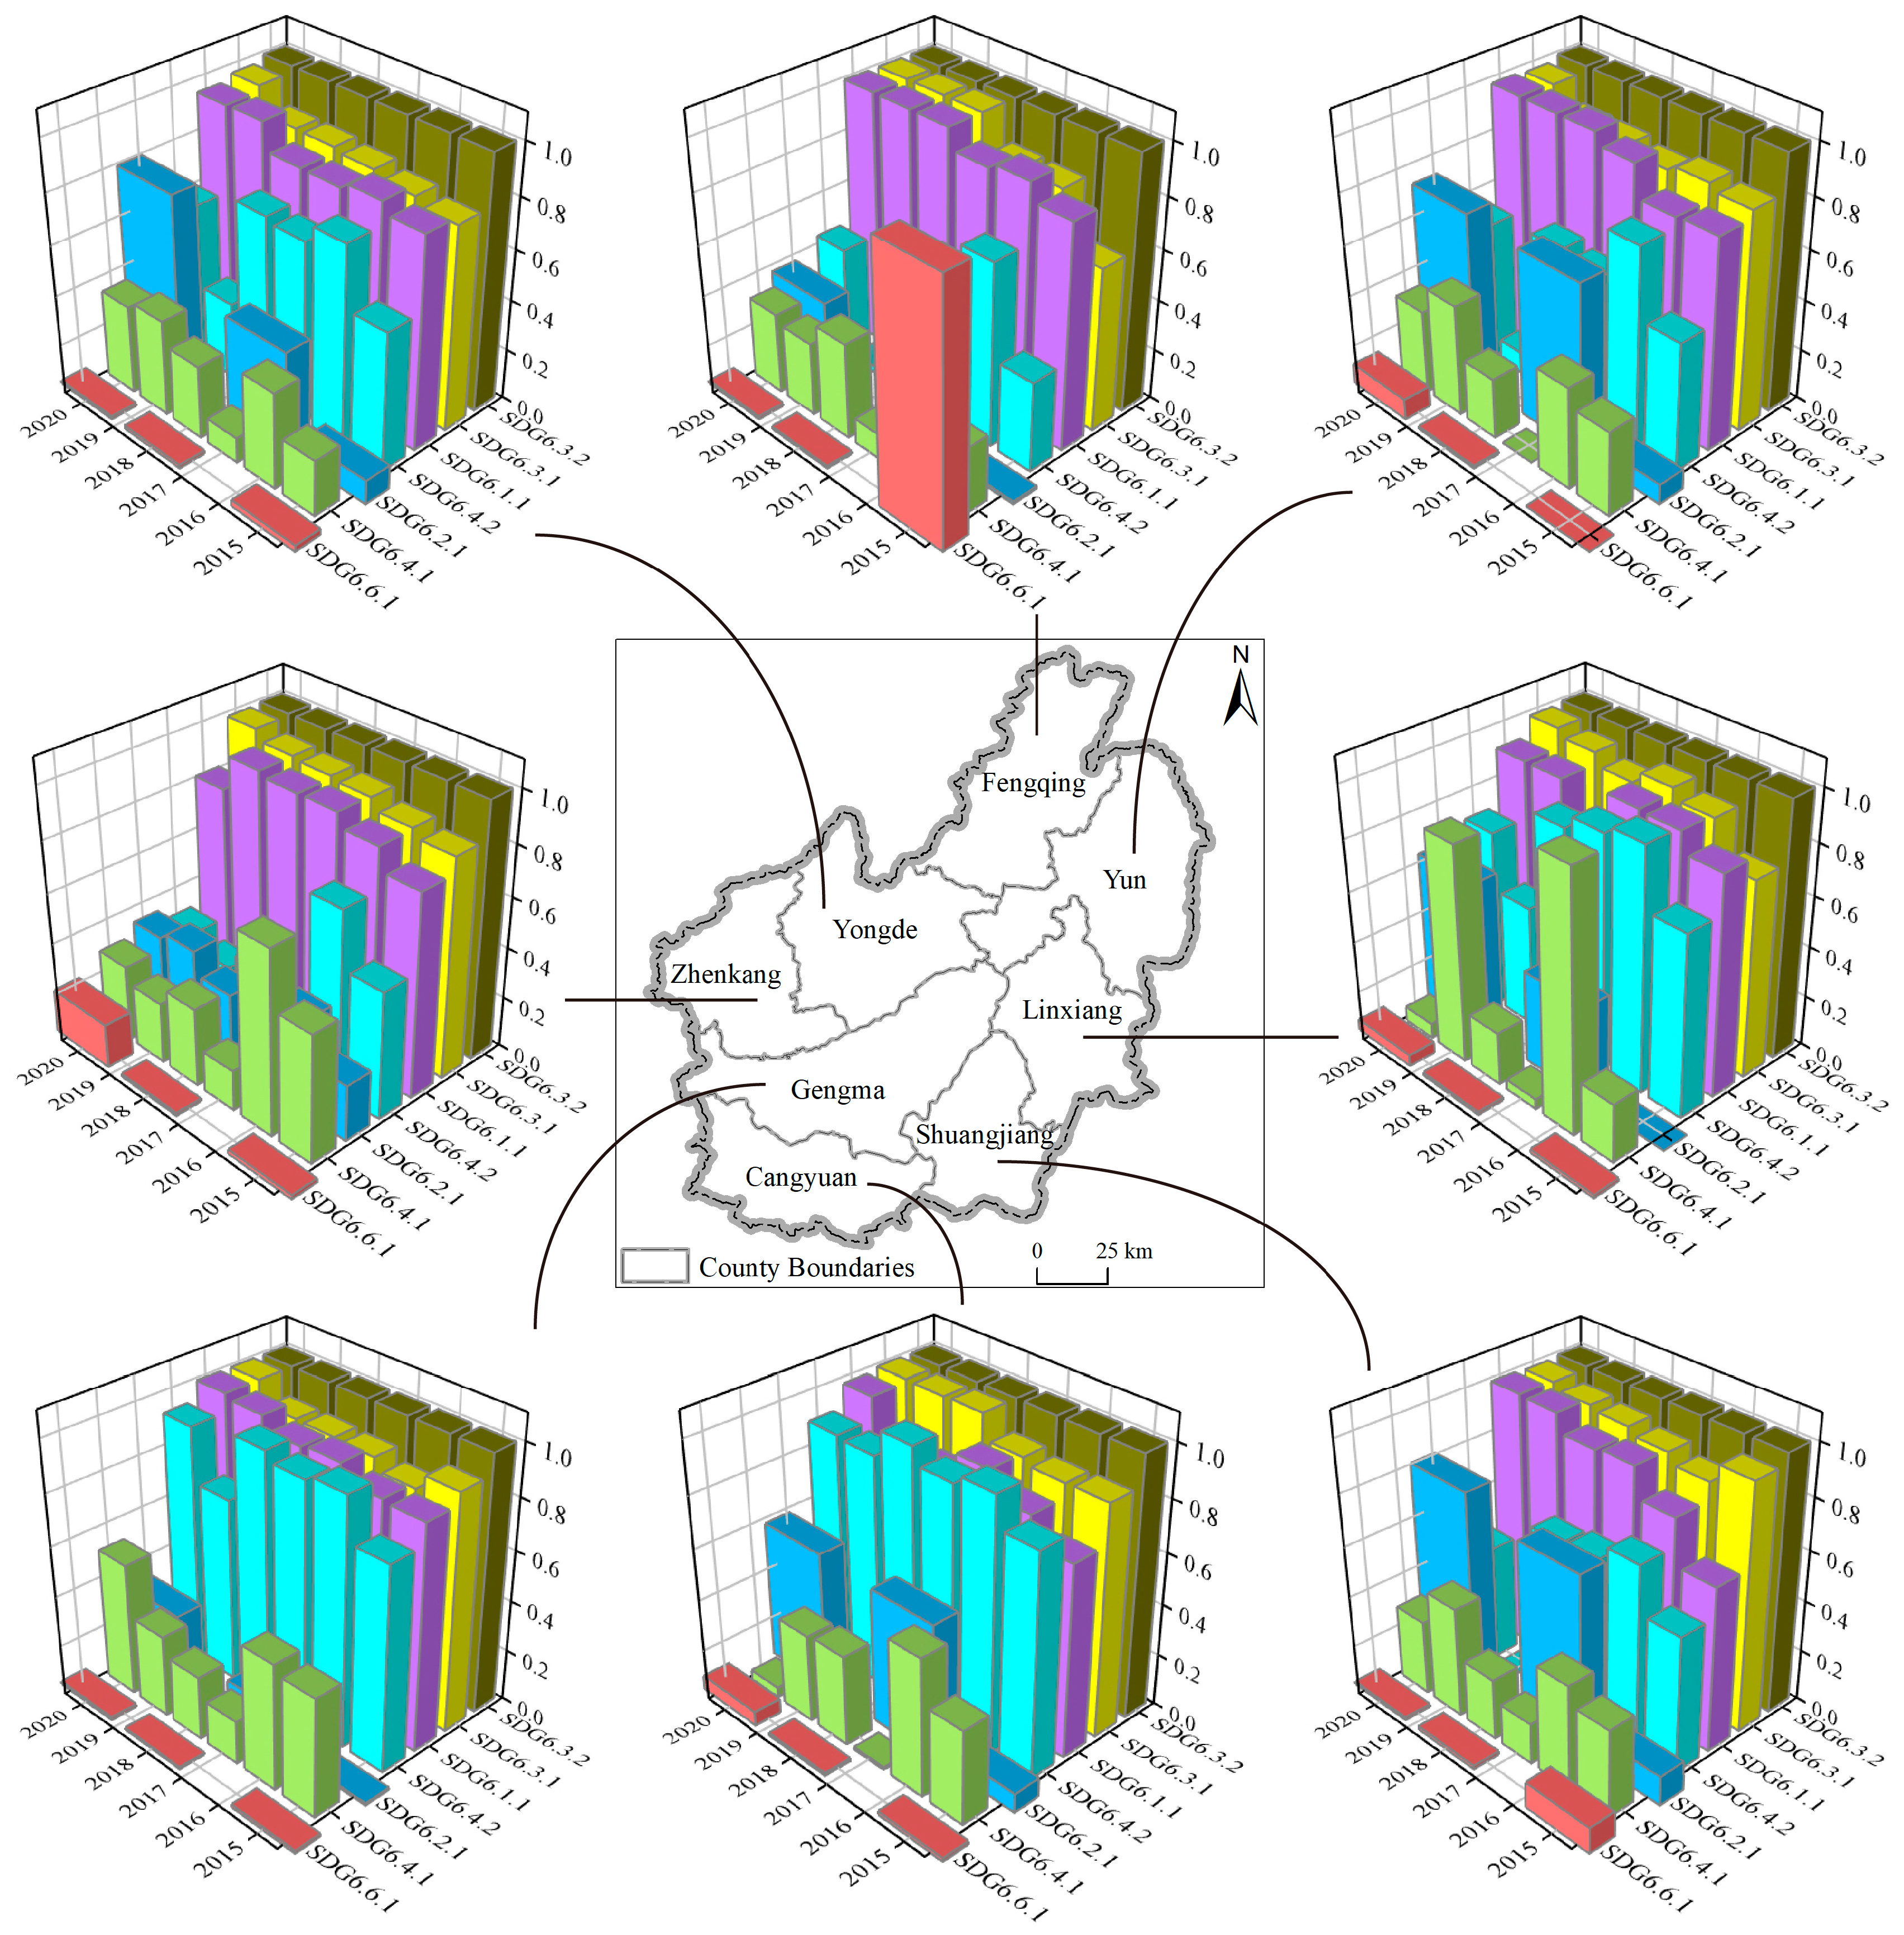
3.1. Temporal and Spatial Variation Characteristics of SDG 6 Indicators
3.1.1. SDG 6.1.1 (Proportion of Population Using Safely Managed Drinking Water Services)
3.1.2. SDG 6.2.1 (Density of Public Toilets in Urban Areas)
3.1.3. SDG 6.3.1 (Proportion of Domestic and Industrial Wastewater Flows Safely Treated)
3.1.4. SDG 6.3.2 (Proportion of Bodies of Water with Good Ambient Water Quality)
3.1.5. SDG 6.4.1 (Change in Water-Use Efficiency over Time)
3.1.6. SDG 6.4.2 (Level of Water Stress)
3.1.7. SDG 6.6.1 (Change in the Extent of Water-Related Ecosystems over Time)
3.2. The Assessment of the SDG 6 Composite Index and Three Dimensions
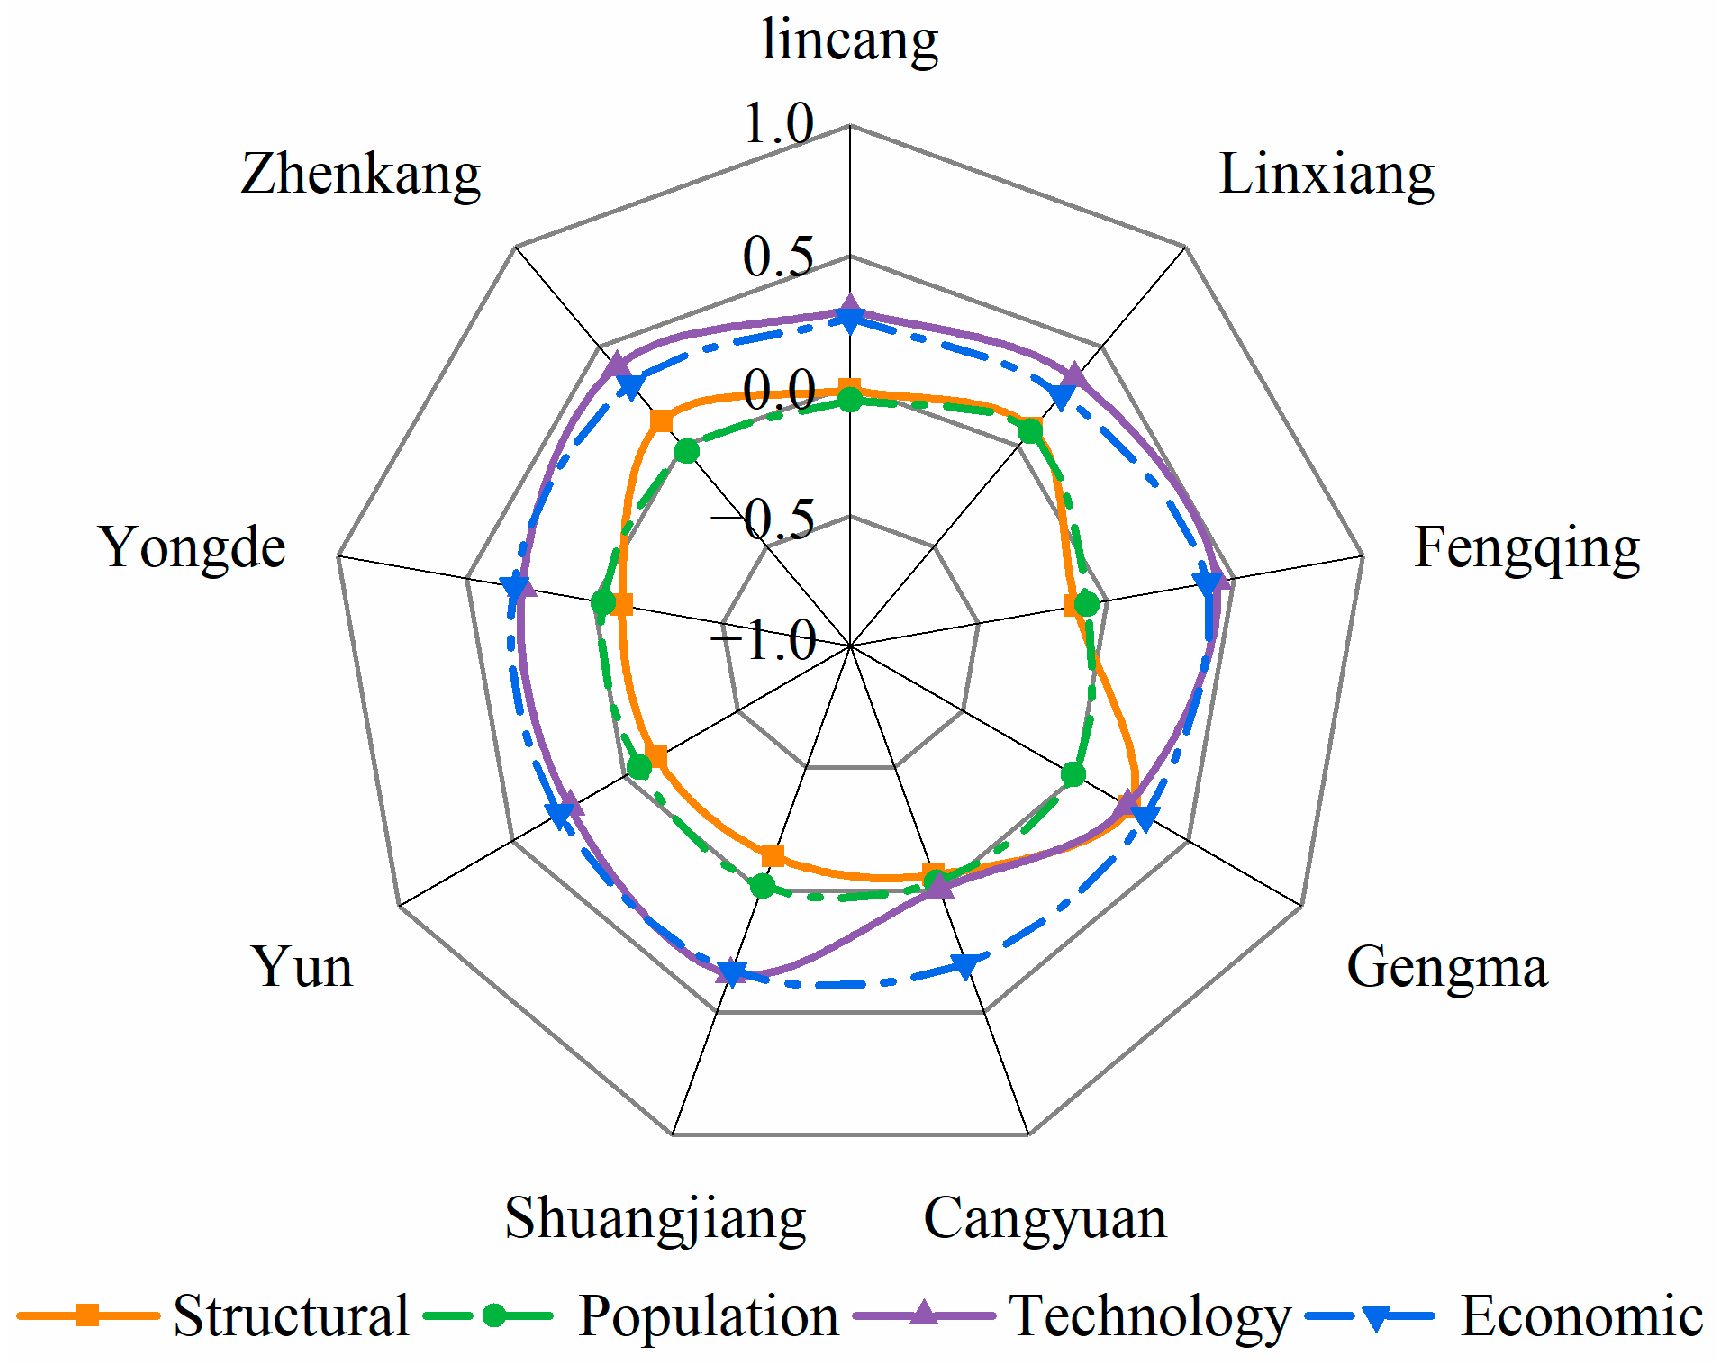
3.3. Influencing Factor Identification of the SDG 6 Composite Index
4. Discussion and Recommendations
4.1. Multisource Data and Data Shortages in Small Areas
4.2. Influencing Factor of the SDG 6 Composite Index in Less Developed Mountainous Areas and Corresponding Measures
4.3. Inputs and Benefits of Policies
4.4. Deficiencies of This Study
5. Conclusions
Supplementary Materials
Author Contributions
Funding
Data Availability Statement
Conflicts of Interest
References
- Bhaduri, A.; Bogardi, J.; Siddiqi, A.; Voigt, H.; Vörösmarty, C.; Pahl-Wostl, C.; Bunn, S.E.; Shrivastava, P.; Lawford, R.; Foster, S.; et al. Achieving Sustainable Development Goals from a Water Perspective. Front. Environ. Sci. 2016, 4, 64. [Google Scholar] [CrossRef] [Green Version]
- Fader, M.; Cranmer, C.; Lawford, R.; Engel-Cox, J. Toward an Understanding of Synergies and Trade-Offs Between Water, Energy, and Food SDG Targets. Front. Environ. Sci. 2018, 6, 112. [Google Scholar] [CrossRef]
- Fu, B.; Wang, S.; Zhang, J.; Hou, Z.; Li, J. Unravelling the Complexity in Achieving the 17 Sustainable-Development Goals. Natl. Sci. Rev. 2019, 6, 386–388. [Google Scholar] [CrossRef] [PubMed]
- Requejo-Castro, D.; Giné-Garriga, R.; Pérez-Foguet, A. Data-Driven Bayesian Network Modelling to Explore the Relationships between SDG 6 and the 2030 Agenda. Sci. Total Environ. 2020, 710, 136014. [Google Scholar] [CrossRef] [PubMed]
- Yang, S.; Zhao, W.; Liu, Y.; Cherubini, F.; Fu, B.; Pereira, P. Prioritizing Sustainable Development Goals and Linking Them to Ecosystem Services: A Global Expert’s Knowledge Evaluation. Geogr. Sustain. 2020, 1, 321–330. [Google Scholar] [CrossRef]
- Taka, M.; Ahopelto, L.; Fallon, A.; Heino, M.; Kallio, M.; Kinnunen, P.; Niva, V.; Varis, O. The Potential of Water Security in Leveraging Agenda 2030. One Earth 2021, 4, 258–268. [Google Scholar] [CrossRef]
- Mugagga, F.; Nabaasa, B.B. The Centrality of Water Resources to the Realization of Sustainable Development Goals (SDG). A Review of Potentials and Constraints on the African Continent. ISWCR 2016, 4, 215–223. [Google Scholar] [CrossRef] [Green Version]
- Ament, J.M.; Freeman, R.; Carbone, C.; Vassall, A.; Watts, C. An Empirical Analysis of Synergies and Tradeoffs between Sustainable Development Goals. Sustainability 2020, 12, 8424. [Google Scholar] [CrossRef]
- Sarkodie, S.A.; Ackom, E.; Bekun, F.V.; Owusu, P.A. Energy–Climate–Economy–Population Nexus: An Empirical Analysis in Kenya, Senegal, and Eswatini. Sustainability 2020, 12, 6202. [Google Scholar] [CrossRef]
- Chatterley, C.; Slaymaker, T.; Badloe, C.; Nouvellon, A.; Bain, R.; Johnston, R. Institutional WASH in the SDGs: Data Gaps and Opportunities for National Monitoring. J. Water Sanit. Hyg. Dev. 2018, 8, 595–606. [Google Scholar] [CrossRef] [Green Version]
- Lieberman, A. UN Forum Reveals Continued Disconnect between SDGs and Local Work; Devex Report: New York, NY, USA, 2019. [Google Scholar]
- Alcamo, J.; Thompson, J.; Alexander, A.; Antoniades, A.; Delabre, I.; Dolley, J.; Marshall, F.; Menton, M.; Middleton, J.; Scharlemann, J.P.W. Analysing Interactions among the Sustainable Development Goals: Findings and Emerging Issues from Local and Global Studies. Sustain. Sci. 2020, 15, 1561–1572. [Google Scholar] [CrossRef] [PubMed]
- Lu, S.L.; Jia, L.; Jiang, Y.Z.; Wang, Z.M.; Duan, H.T.; Shen, M.; Tian, Y.; Lu, J. Progress and Prospect on Monitoring and Evaluation of United Nations SDG 6 (Clean Water and Sanitation) Target. Bull. Chin. Acad. Sci. 2021, 36, 904–913. [Google Scholar]
- McConville, J.R.; Kvarnström, E.; Maiteki, J.M.; Niwagaba, C.B. Infrastructure Investments and Operating Costs for Fecal Sludge and Sewage Treatment Systems in Kampala, Uganda. Urban Water J. 2019, 16, 584–593. [Google Scholar] [CrossRef] [Green Version]
- Van Den Homberg, M.; Crince, A.; Wilbrink, J.; Kersbergen, D.; Gumbi, G.; Tembo, S.; Lemmens, R. Combining UAV Imagery, Volunteered Geographic Information, and Field Survey Data to Improve Characterization of Rural Water Points in Malawi. ISPRS Int. J. Geoinf. 2020, 9, 592. [Google Scholar] [CrossRef]
- Fuente, D.; Allaire, M.; Jeuland, M.; Whittington, D. Forecasts of Mortality and Economic Losses from Poor Water and Sanitation in Sub-Saharan Africa. PLoS ONE 2020, 15, e0227611. [Google Scholar] [CrossRef] [PubMed] [Green Version]
- Nkiaka, E.; Bryant, R.G.; Okumah, M.; Gomo, F.F. Water Security in SUB-SAHARAN Africa: Understanding the Status of Sustainable Development Goal 6. WIREs Water 2021, 8, e1552. [Google Scholar] [CrossRef]
- Quinlivan, L.; Chapman, D.V.; Sullivan, T. Validating Citizen Science Monitoring of Ambient Water Quality for the United Nations Sustainable Development Goals. Sci. Total Environ. 2020, 699, 134255. [Google Scholar] [CrossRef]
- Hofmann, P. Meeting WASH SDG6: Insights from Everyday Practices in Dar Es Salaam. Environ. Urban 2021, 33, 173–192. [Google Scholar] [CrossRef]
- Liu, S. Interactions between Industrial Development and Environmental Protection Dimensions of Sustainable Development Goals (SDGs): Evidence from 40 Countries with Different Income Levels. Environ. Socio-Econ. Stud. 2020, 8, 60–67. [Google Scholar] [CrossRef]
- Zhang, Y.; Yang, D.; Tang, H.; Liu, Y. Analyses of the Changing Process and Influencing Factors of Water Resource Utilization in Megalopolis of Arid Area. Water Resour. 2015, 42, 712–720. [Google Scholar] [CrossRef]
- Lyu, W.; Chen, Y.; Yu, Z.; Yao, W.; Liu, H. Decomposing Drivers of Changes in Productive and Domestic Water Use Based on the Logarithmic Mean Divisia Index Method: A Regional Comparison in Northern China. Water Policy 2021, 23, 310–326. [Google Scholar] [CrossRef]
- Lei, H.J.; Li, C.J.; Xia, X.F.; Xi, B.D. Decomposing the Influencing Factors of China’s Industrial Wastewater Discharges Using LMDI I Method. AMR 2012, 518–523, 2089–2098. [Google Scholar] [CrossRef]
- Ma, B.; Tian, G.; Kong, L. Spatial-Temporal Characteristics of China’s Industrial Wastewater Discharge at Different Scales. Environ. Sci. Pollut. Res. 2020, 27, 8103–8118. [Google Scholar] [CrossRef] [PubMed]
- Chen, J.; Gao, Y.; Qian, H.; Jia, H.; Zhang, Q. Insights into Water Sustainability from a Grey Water Footprint Perspective in an Irrigated Region of the Yellow River Basin. J. Clean. Prod. 2021, 316, 128329. [Google Scholar] [CrossRef]
- Liu, S.; Liu, X.; Ma, B.; Ding, Z.; Chen, K. Analysis on the Pattern and Driving Factors of Industrial Wastewater Discharge in the Wuhan Metropolitan Area. J. Water Clim. Chang. 2022, 13, 2490–2503. [Google Scholar] [CrossRef]
- Fu, T.; Xu, C.; Yang, L.; Hou, S.; Xia, Q. Measurement and Driving Factors of Grey Water Footprint Efficiency in Yangtze River Basin. Sci. Total Environ. 2022, 802, 149587. [Google Scholar] [CrossRef]
- He, Y.X.; Zhang, Y.H.; Li, C.L. Supply efficiency of water ecological products and its influencing factors in Zhoushan City based on RSBM-DEA model. Water Resour. Prot. 2022, 38, 195–203. [Google Scholar]
- Han, Z.Z.; Yang, L.T. The Study of Measurement Relationship between Range, Average Deviation and Standard Deviation. Stat. Inf. Forum 2008, 4, 5–8. [Google Scholar]
- Ang, B.W. LMDI Decomposition Approach: A Guide for Implementation. Energy Policy 2015, 86, 233–238. [Google Scholar] [CrossRef]
- Li, A.; Zhou, D.; Chen, G.; Liu, Y.; Long, Y. Multi-Region Comparisons of Energy-Related CO2 Emissions and Production Water Use during Energy Development in Northwestern China. Renew. Energy 2020, 153, 940–961. [Google Scholar] [CrossRef]
- Miao, J.X.; Song, X.Y.; Feng, R.H.; Quan, X.F.; Gao, F.; Huang, C.L.; Zhao, X.Y.; Zhong, F.L.; Cheng, Q.P.; Wei, Y.Q. Study on the interaction between sustainable development goals in underdeveloped mountainous areas: A case study of Lincang, Yunnan Province. Adv. Earth Sci. 2022, 37, 949–962. [Google Scholar]
- Fang, K.; Heijungs, R.; De Snoo, G.R. Understanding the Complementary Linkages between Environmental Footprints and Planetary Boundaries in a Footprint–Boundary Environmental Sustainability Assessment Framework. Ecol. Econ. 2015, 114, 218–226. [Google Scholar] [CrossRef]
- Hegarty, S.; Hayes, A.; Regan, F.; Bishop, I.; Clinton, R. Using Citizen Science to Understand River Water Quality While Filling Data Gaps to Meet United Nations Sustainable Development Goal 6 Objectives. Sci. Total Environ. 2021, 783, 146953. [Google Scholar] [CrossRef]
- Yang, Y.; Cheng, Y. Evaluating the Ability of Transformed Urban Agglomerations to Achieve Sustainable Development Goal 6 from the Perspective of the Water Planetary Boundary: Evidence from Guanzhong in China. J. Clean. Prod. 2021, 314, 128038. [Google Scholar] [CrossRef]
- Li, X.; Feng, M.; Ran, Y.; Su, Y.; Liu, F.; Huang, C.; Shen, H.; Xiao, Q.; Su, J.; Yuan, S.; et al. Big Data in Earth System Science and Progress towards a Digital Twin. Nat. Rev. Earth Environ. 2023, 4, 319–332. [Google Scholar] [CrossRef]
- Ali, I.M.; Ayub, N.; Husin, N.M.; Alrazi, B. Water Disclosure And Financial Performance: The Case Of Cdp Water A-List Companies. EpSBS 2020, 100, 259–267. [Google Scholar]
- Mariathasan, V.; Bezuidenhoudt, E.; Olympio, K.R. Evaluation of Earth Observation Solutions for Namibia’s SDG Monitoring System. Remote Sens. 2019, 11, 1612. [Google Scholar] [CrossRef] [Green Version]
- Hakimdavar, R.; Hubbard, A.; Policelli, F.; Pickens, A.; Hansen, M.; Fatoyinbo, T.; Lagomasino, D.; Pahlevan, N.; Unninayar, S.; Kavvada, A.; et al. Monitoring Water-Related Ecosystems with Earth Observation Data in Support of Sustainable Development Goal (SDG) 6 Reporting. Remote Sens. 2020, 12, 1634. [Google Scholar] [CrossRef]
- Song, J.; Yin, Y.; Xu, H.; Wang, Y.; Wu, P.; Sun, S. Drivers of Domestic Grain Virtual Water Flow: A Study for China. Agric. Water Manag. 2020, 239, 106175. [Google Scholar] [CrossRef]
- Li, Y.; Lu, L.; Tan, Y.; Wang, L.; Shen, M. Decoupling Water Consumption and Environmental Impact on Textile Industry by Using Water Footprint Method: A Case Study in China. Water 2017, 9, 124. [Google Scholar] [CrossRef]
- Jia, S.; Yang, H.; Zhang, S.; Wang, L.; Xia, J. Industrial Water Use Kuznets Curve: Evidence from Industrialized Countries and Implications for Developing Countries. J. Water Resour. Plan. Manag. 2006, 132, 183–191. [Google Scholar] [CrossRef] [Green Version]
- Kajenthira, A.; Siddiqi, A.; Anadon, L.D. A New Case for Promoting Wastewater Reuse in Saudi Arabia: Bringing Energy into the Water Equation. J. Environ. Manag. 2012, 102, 184–192. [Google Scholar] [CrossRef] [PubMed]
- Yi, L.; Jiao, W.; Chen, X.; Chen, W. An Overview of Reclaimed Water Reuse in China. J. Environ. Sci. 2011, 23, 1585–1593. [Google Scholar] [CrossRef]
- Wang, Z.; Deng, X.; Li, X.; Zhou, Q.; Yan, H. Impact Analysis of Government Investment on Water Projects in the Arid Gansu Province of China. Phys. Chem. Earth Parts A/B/C 2015, 79, 54–66. [Google Scholar] [CrossRef]
- Liang, D.; Lu, H.; Feng, L.; Qiu, L.; He, L. Assessment of the Sustainable Utilization Level of Water Resources in the Wuhan Metropolitan Area Based on a Three-Dimensional Water Ecological Footprint Model. Water 2021, 13, 3505. [Google Scholar] [CrossRef]
- Reynaud, A. An Econometric Estimation of Industrial Water Demand in France. Environ. Resour. Econ. 2003, 25, 213–232. [Google Scholar] [CrossRef]
- Fujii, H.; Managi, S.; Kaneko, S. A Water Resource Efficiency Analysis of the Chinese Industrial Sector. Environ. Econ. 2012, 3, 82–92. Available online: https://www.researchgate.net/publication/309201493 (accessed on 19 October 2016).
- Shang, Y.; Lu, S.; Shang, L.; Li, X.; Wei, Y.; Lei, X.; Wang, C.; Wang, H. Decomposition Methods for Analyzing Changes of Industrial Water Use. J. Hydrol. 2016, 543, 808–817. [Google Scholar] [CrossRef] [Green Version]
- Rieniets, T. Shrinking Cities: Causes and Effects of Urban Population Losses in the Twentieth Century. Nat. Cult. 2009, 4, 231–254. [Google Scholar] [CrossRef]
- Daly, H.E.; Farley, J. Ecological Economics: Principles and Applications; Island Press: Washington, DC, USA, 2004; pp. 373–424. [Google Scholar]
- Swaney, J.A. Valuing the Earth: Economics, Ecology, Ethics. J. Econ. Issues 1994, 28, 271–274. [Google Scholar] [CrossRef]
- Agana, B.A.; Reeve, D.; Orbell, J.D. An Approach to Industrial Water Conservation—A Case Study Involving Two Large Manufacturing Companies Based in Australia. J. Environ. Manag. 2013, 114, 445–460. [Google Scholar] [CrossRef] [PubMed] [Green Version]
- Ibrahim, I.A. Water as a Human Right, Water as a Commodity: Can SDG 6 Be a Compromise? J. Hum. Rights 2022, 26, 469–493. [Google Scholar] [CrossRef]


| Goal | Targets | Indicators | Indicator Meaning | Indicator Source | Indicator Direction |
|---|---|---|---|---|---|
| SDG 6 Ensure availability and sustainable management of water and sanitation for all | SDG 6.1 | SDG 6.1.1 | Proportion of population using safely managed drinking water services | A | Positive |
| SDG 6.2 | SDG 6.2.1 | Density of public toilets in urban areas | L | Positive | |
| SDG 6.3 | SDG 6.3.1 | Proportion of domestic and industrial wastewater flows safely treated | A | Positive | |
| SDG 6.3.2 | Proportion of bodies of water with good ambient water quality | A | Positive | ||
| SDG 6.4 | SDG 6.4.1 | Change in water-use efficiency over time | A | Positive | |
| SDG 6.4.2 | Level of water stress | A | Negative | ||
| SDG 6.6 | SDG 6.6.1 | Change in the extent of water-related ecosystems over time | A | Positive |
| Region | SDG 6.1.1 | SDG 6.2.1 | SDG 6.3.1 | SDG 6.3.2 | SDG 6.4.1 | SDG 6.4.2 | SDG 6.6.1 | SDG 6 | |
|---|---|---|---|---|---|---|---|---|---|
| City | Lincang | I | I | I | I | Ⅱ | I | Ⅳ | I |
| County | Linxiang | Ⅱ | I | I | I | Ⅱ | I | Ⅳ | Ⅱ |
| Fengqing | I | Ⅱ | I | I | Ⅱ | I | Ⅳ | Ⅱ | |
| Gengma | I | I | I | I | Ⅱ | I | Ⅳ | I | |
| Cangyuan | I | I | I | I | Ⅲ | I | Ⅳ | Ⅱ | |
| Shuangjiang | I | I | I | I | Ⅱ | I | Ⅳ | I | |
| Yun | I | Ⅱ | I | I | Ⅱ | I | Ⅳ | Ⅱ | |
| Yongde | I | I | I | I | Ⅱ | I | Ⅳ | I | |
| Zhenkang | Ⅲ | I | I | I | Ⅱ | I | Ⅳ | Ⅱ | |
Disclaimer/Publisher’s Note: The statements, opinions and data contained in all publications are solely those of the individual author(s) and contributor(s) and not of MDPI and/or the editor(s). MDPI and/or the editor(s) disclaim responsibility for any injury to people or property resulting from any ideas, methods, instructions or products referred to in the content. |
© 2023 by the authors. Licensee MDPI, Basel, Switzerland. This article is an open access article distributed under the terms and conditions of the Creative Commons Attribution (CC BY) license (https://creativecommons.org/licenses/by/4.0/).
Share and Cite
Miao, J.; Song, X.; Zhong, F.; Huang, C. Sustainable Development Goal 6 Assessment and Attribution Analysis of Underdeveloped Small Regions Using Integrated Multisource Data. Remote Sens. 2023, 15, 3885. https://doi.org/10.3390/rs15153885
Miao J, Song X, Zhong F, Huang C. Sustainable Development Goal 6 Assessment and Attribution Analysis of Underdeveloped Small Regions Using Integrated Multisource Data. Remote Sensing. 2023; 15(15):3885. https://doi.org/10.3390/rs15153885
Chicago/Turabian StyleMiao, Junxia, Xiaoyu Song, Fanglei Zhong, and Chunlin Huang. 2023. "Sustainable Development Goal 6 Assessment and Attribution Analysis of Underdeveloped Small Regions Using Integrated Multisource Data" Remote Sensing 15, no. 15: 3885. https://doi.org/10.3390/rs15153885
APA StyleMiao, J., Song, X., Zhong, F., & Huang, C. (2023). Sustainable Development Goal 6 Assessment and Attribution Analysis of Underdeveloped Small Regions Using Integrated Multisource Data. Remote Sensing, 15(15), 3885. https://doi.org/10.3390/rs15153885