
Assessment of Land Desertification and Its Drivers in Semi-Arid Alpine Mountains: A Case Study of the Qilian Mountains Region, Northwest China

Abstract
:1. Introduction
2. Materials and Methods
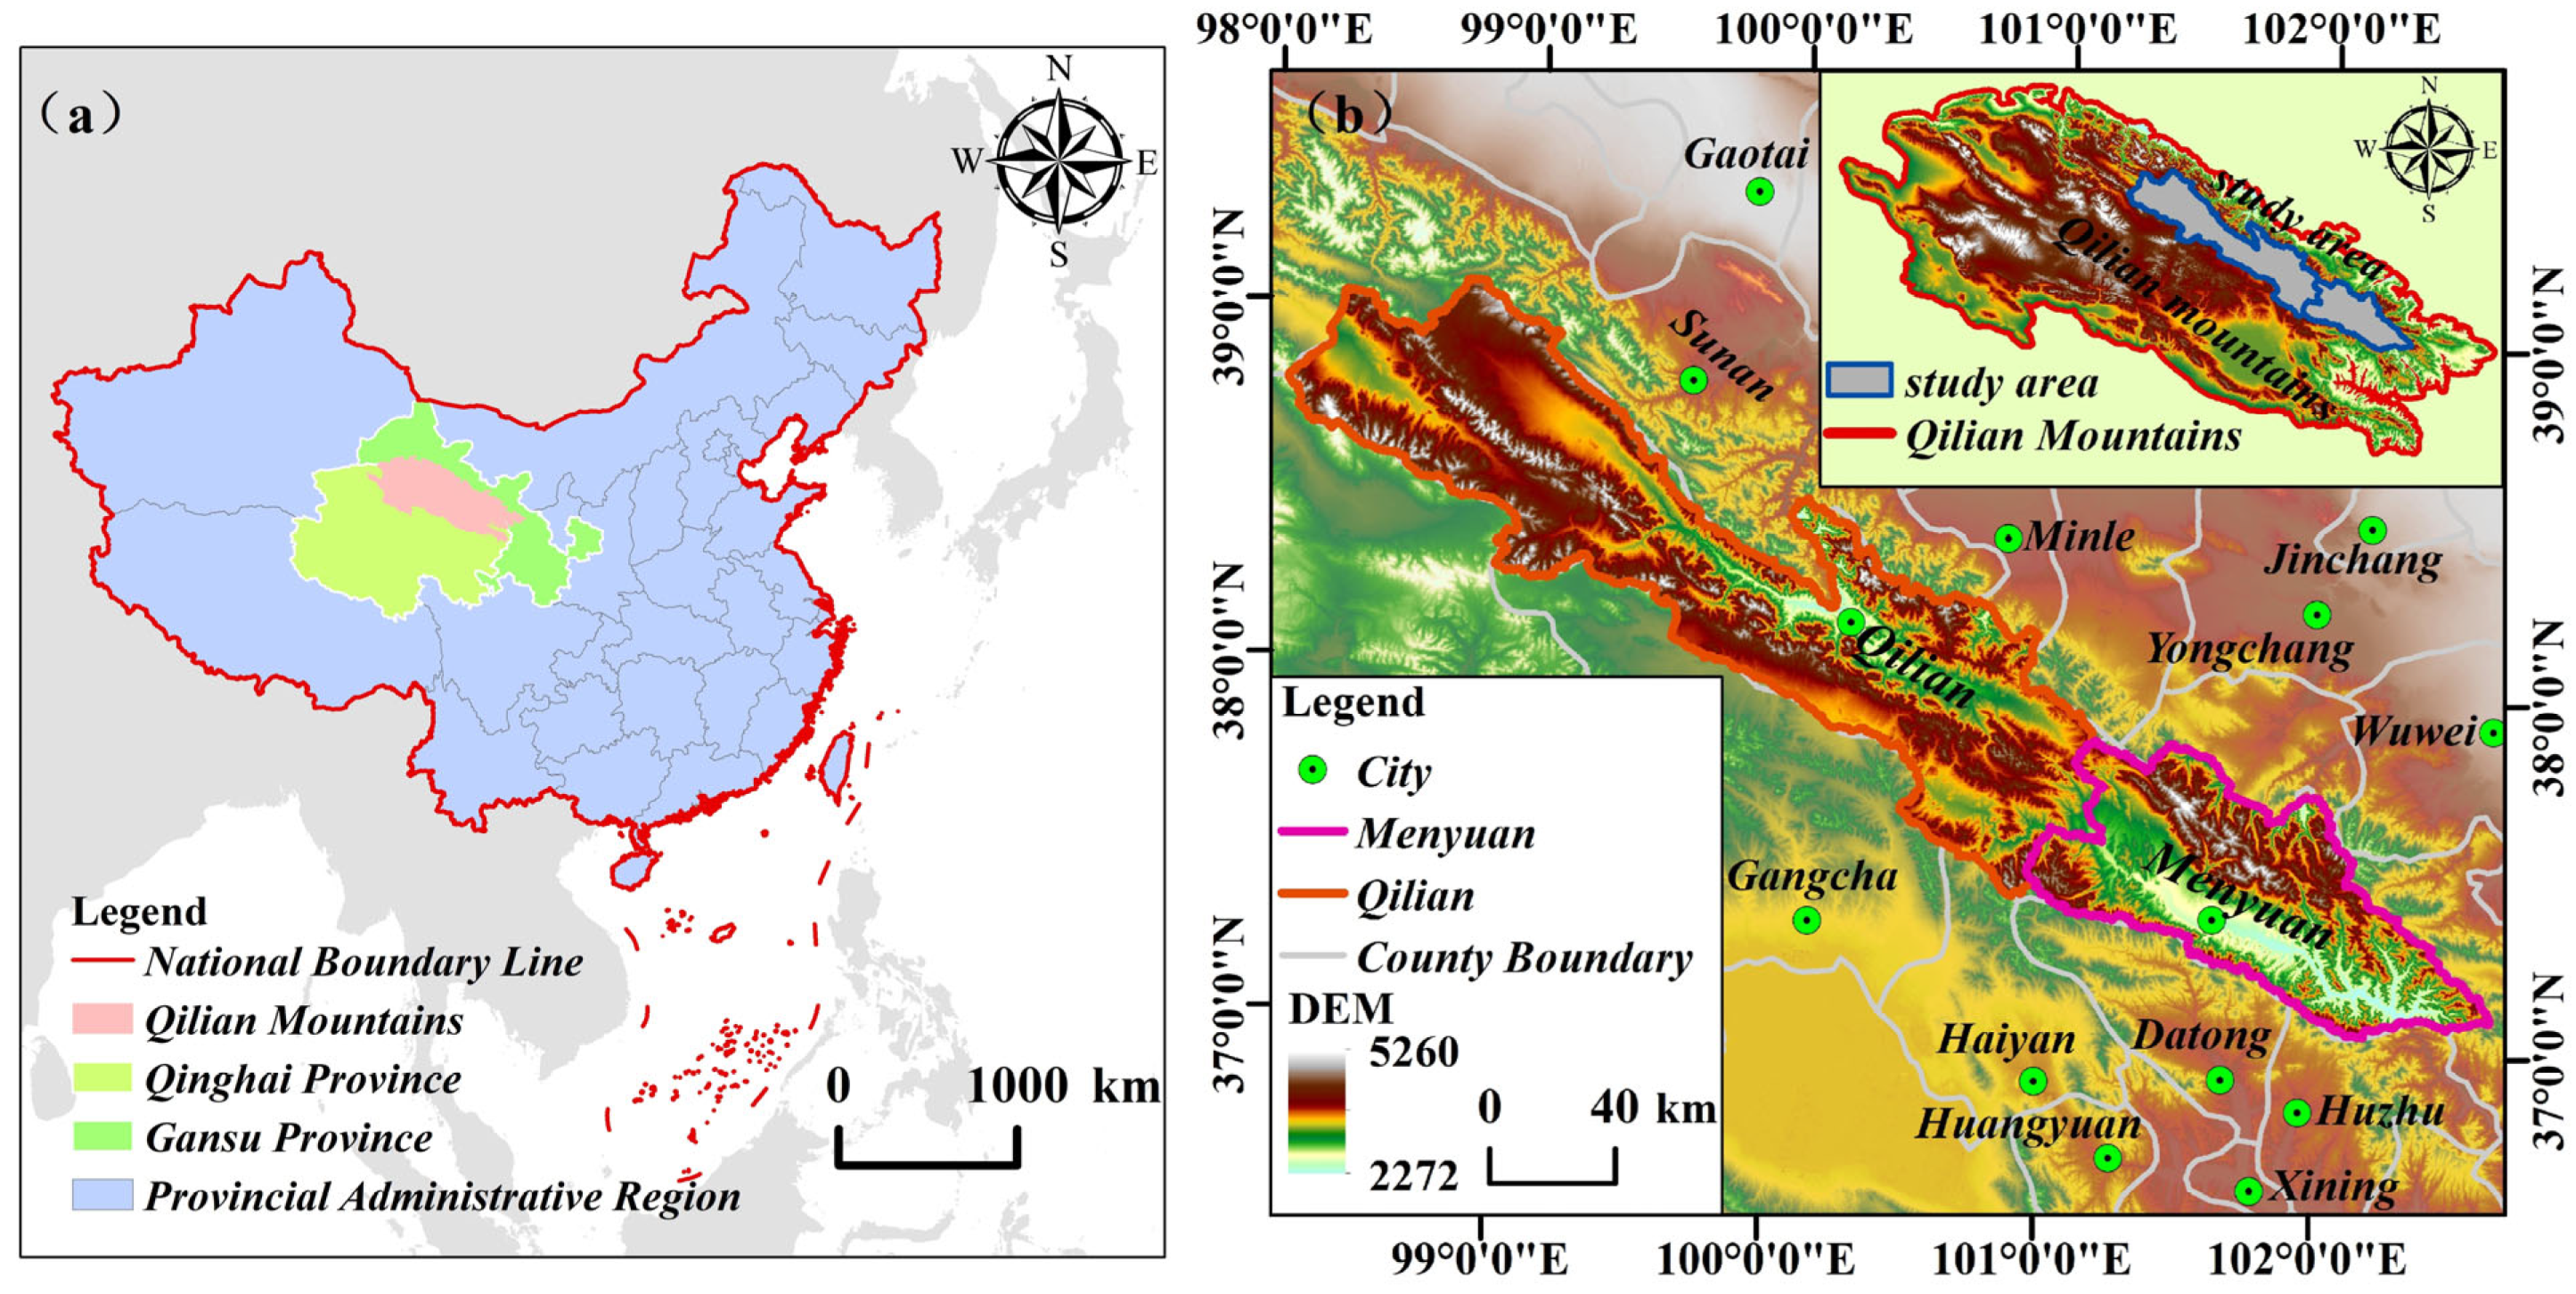
2.1. Study Area
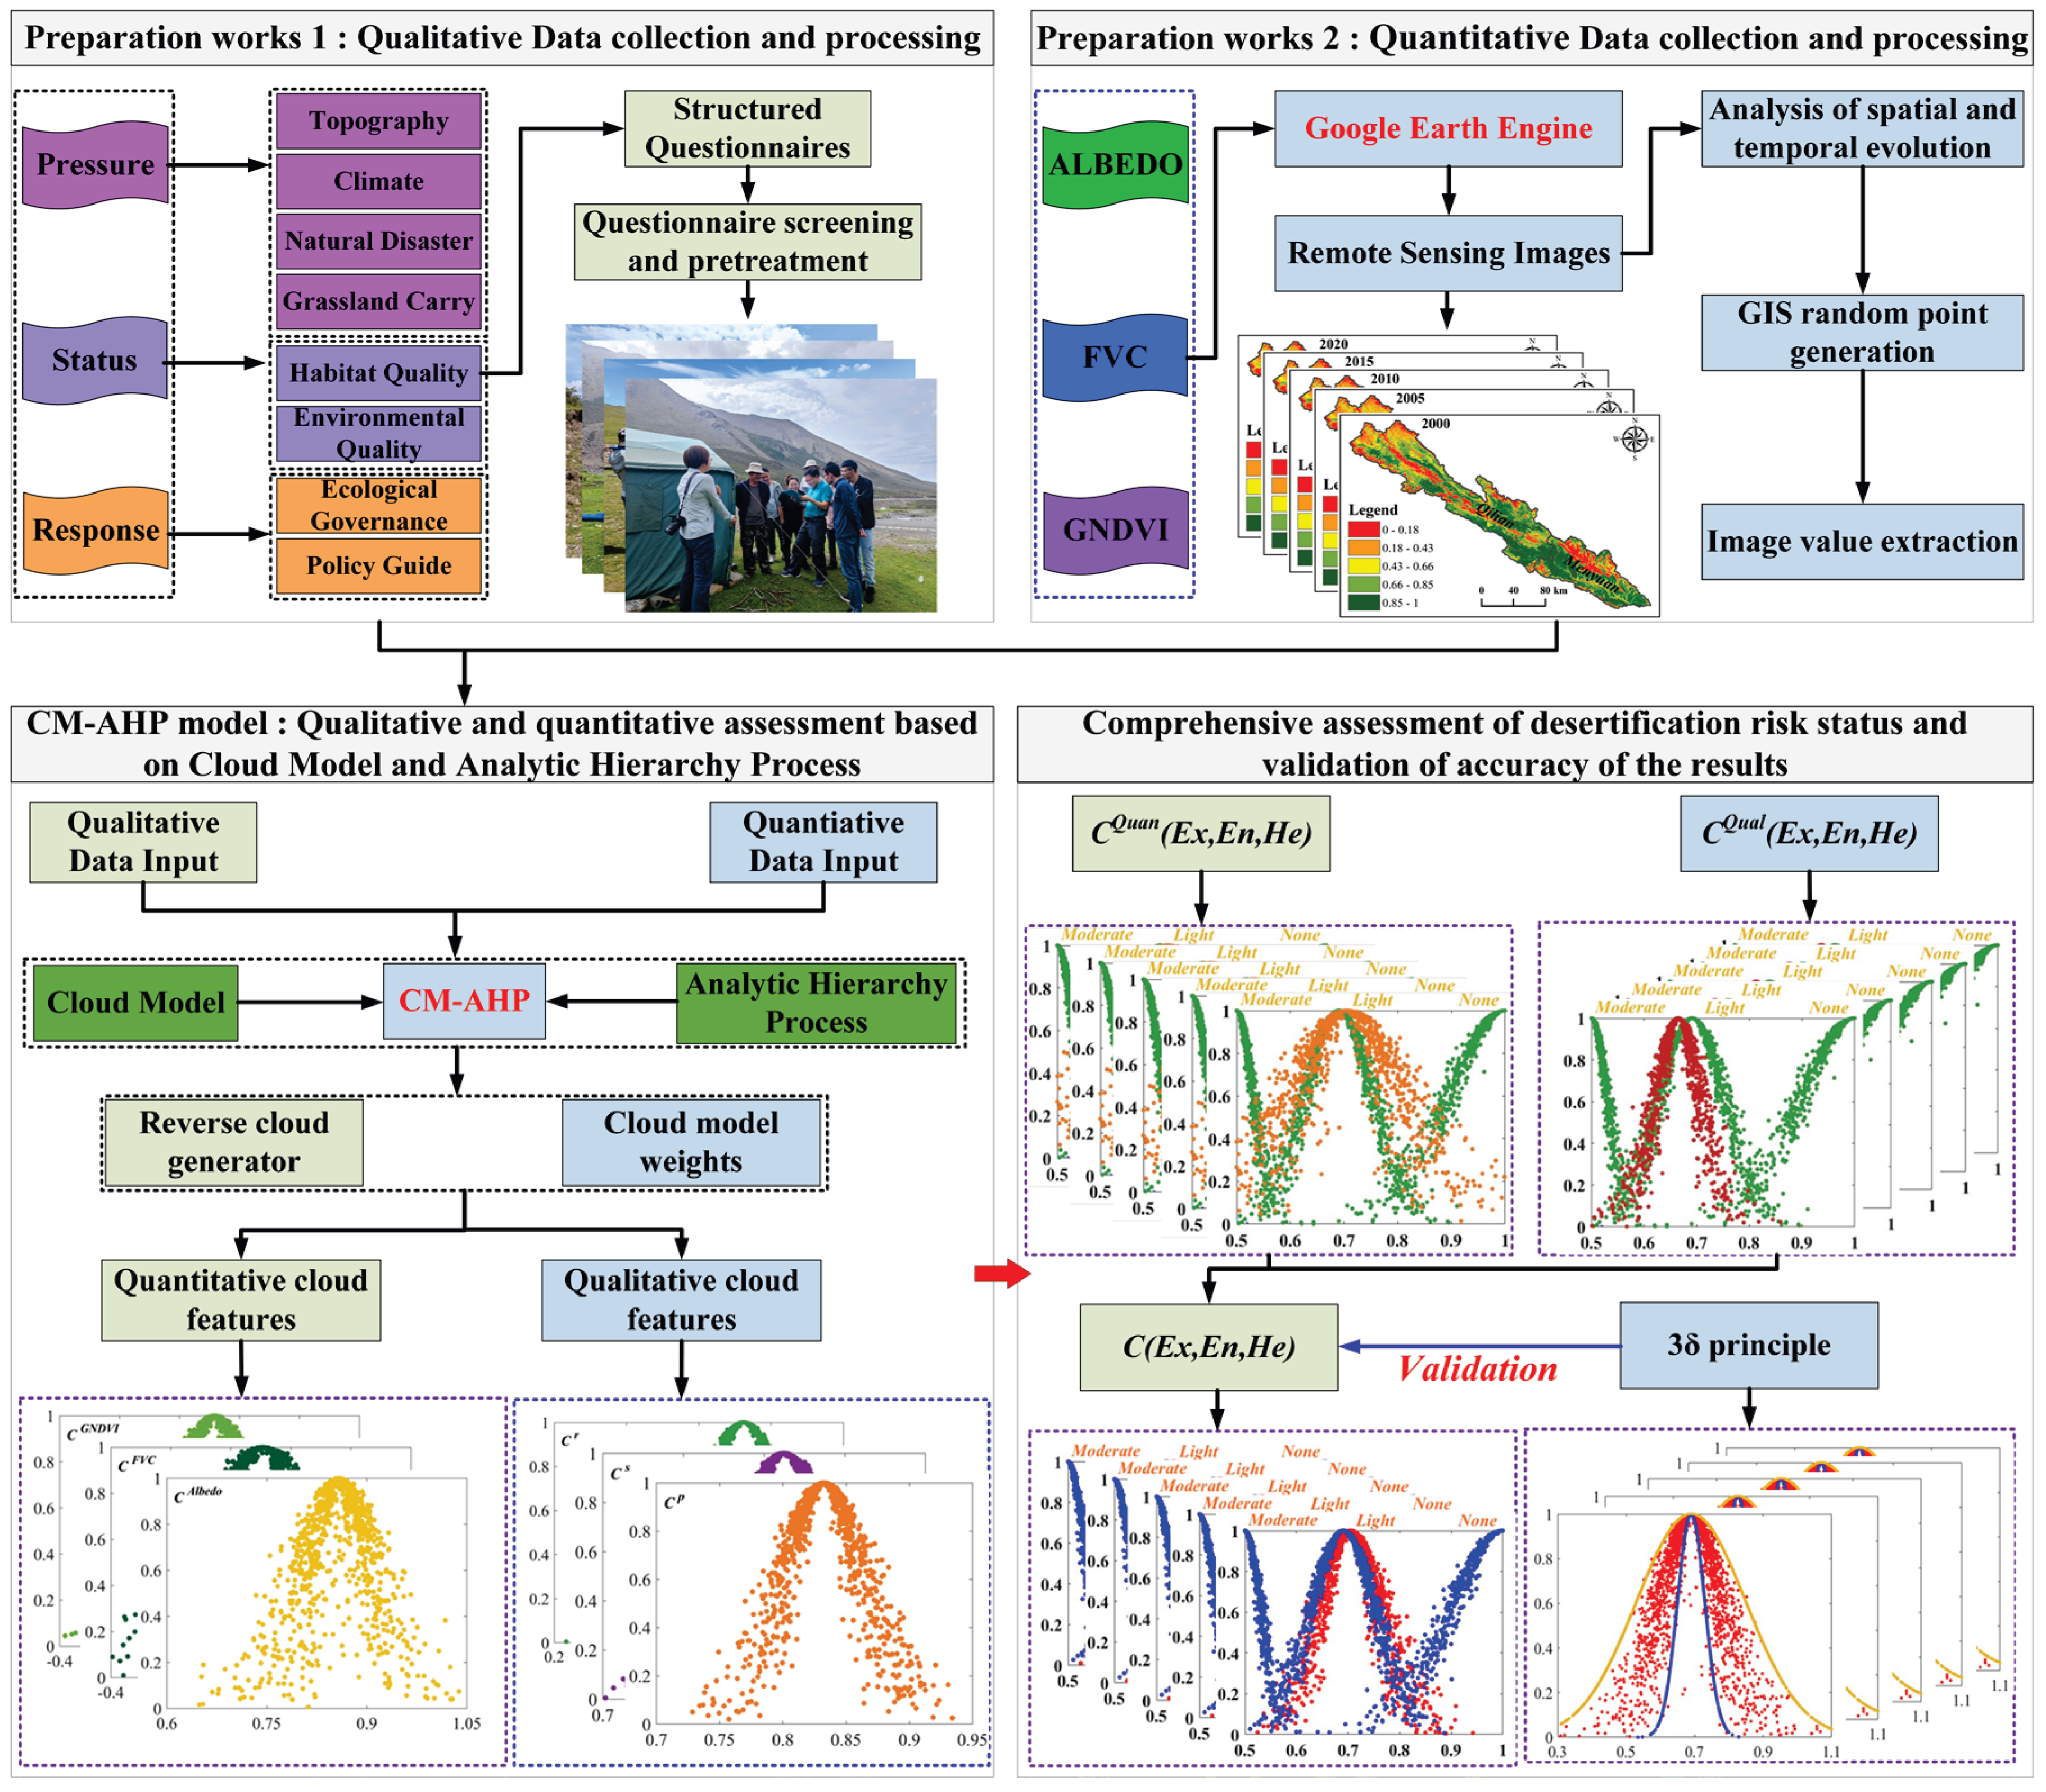
2.2. Methodology
2.2.1. Quantitative Raster Data Extraction
2.2.2. Cloud Model
- (1)
- Calculation of sample means for survey indicators and quantitative spatial indicator data:
- (2)
- Entropy is obtained from the central moments of the sample:
- (3)
- Calculation of superentropy:
2.2.3. Scale Judgment Matrix of Cloud Mode
2.2.4. Analytic Hierarchy Process Based on the Cloud Model Scale Judgment Matrix
2.3. Remote Sensing Data
2.4. Questionnaire
3. Results
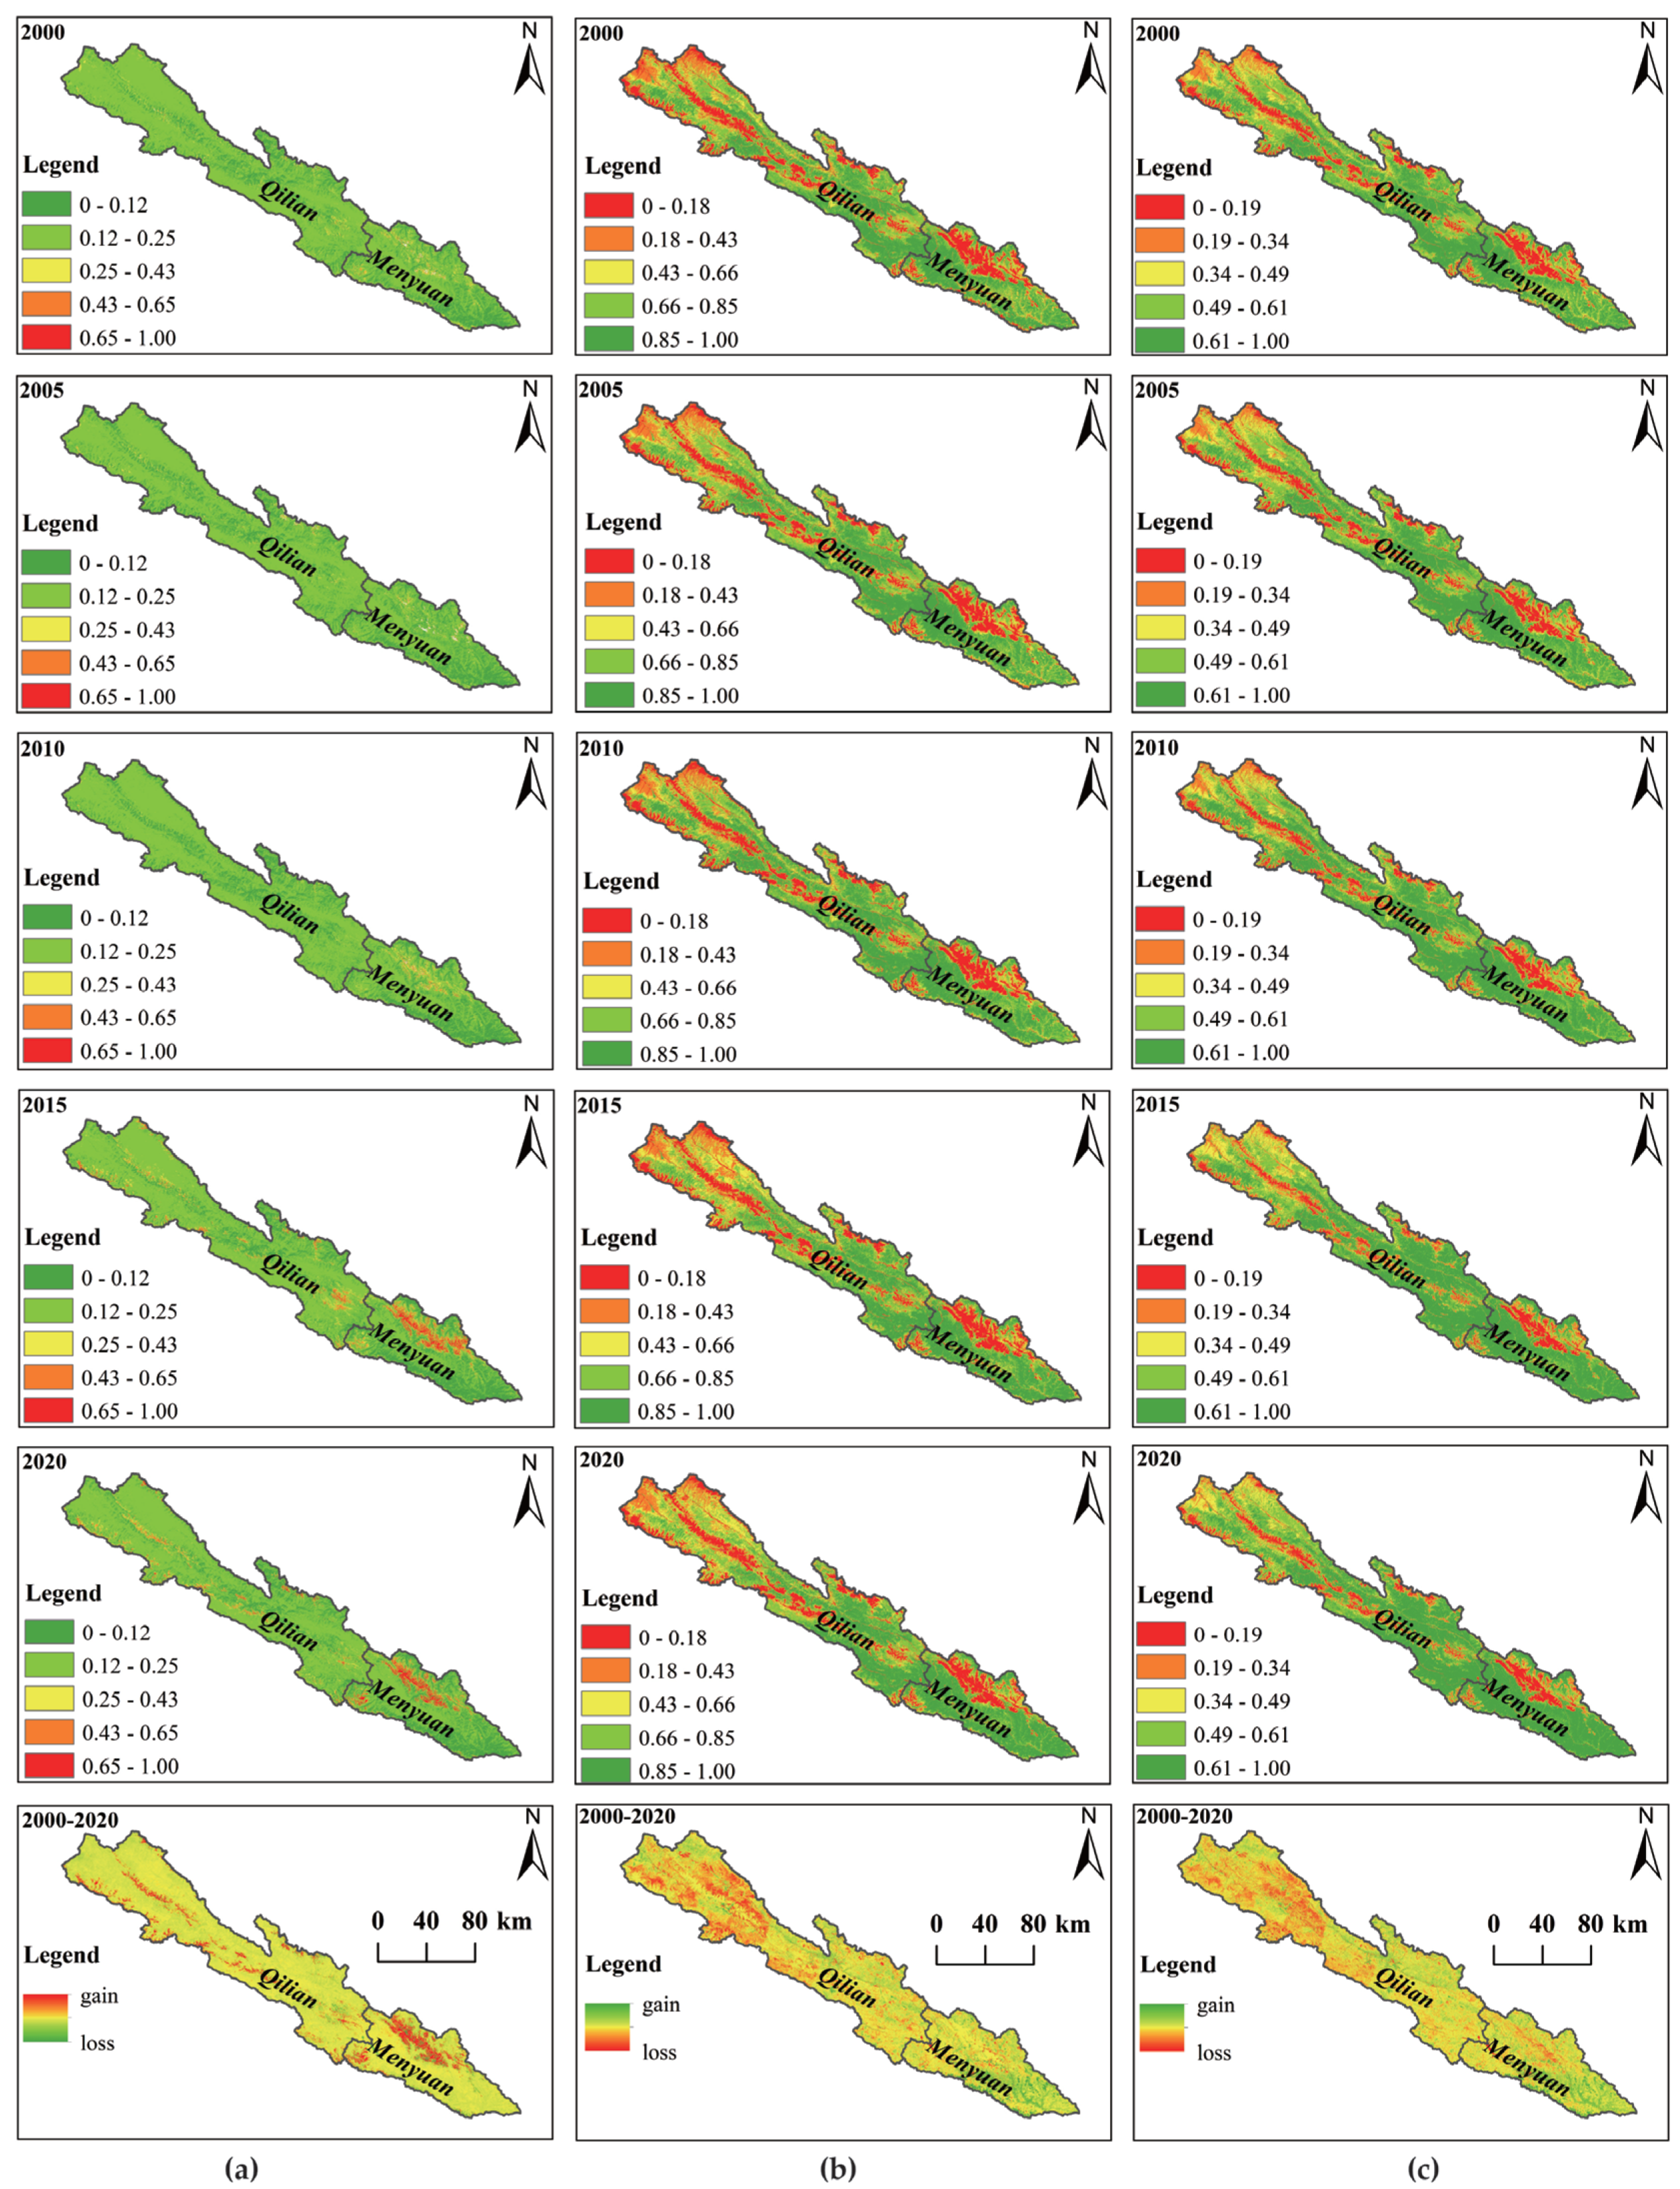
3.1. Quantitative Indicator Characteristics of Remote Sensing
3.1.1. Spatial and Temporal Variation of Quantitative Indicators
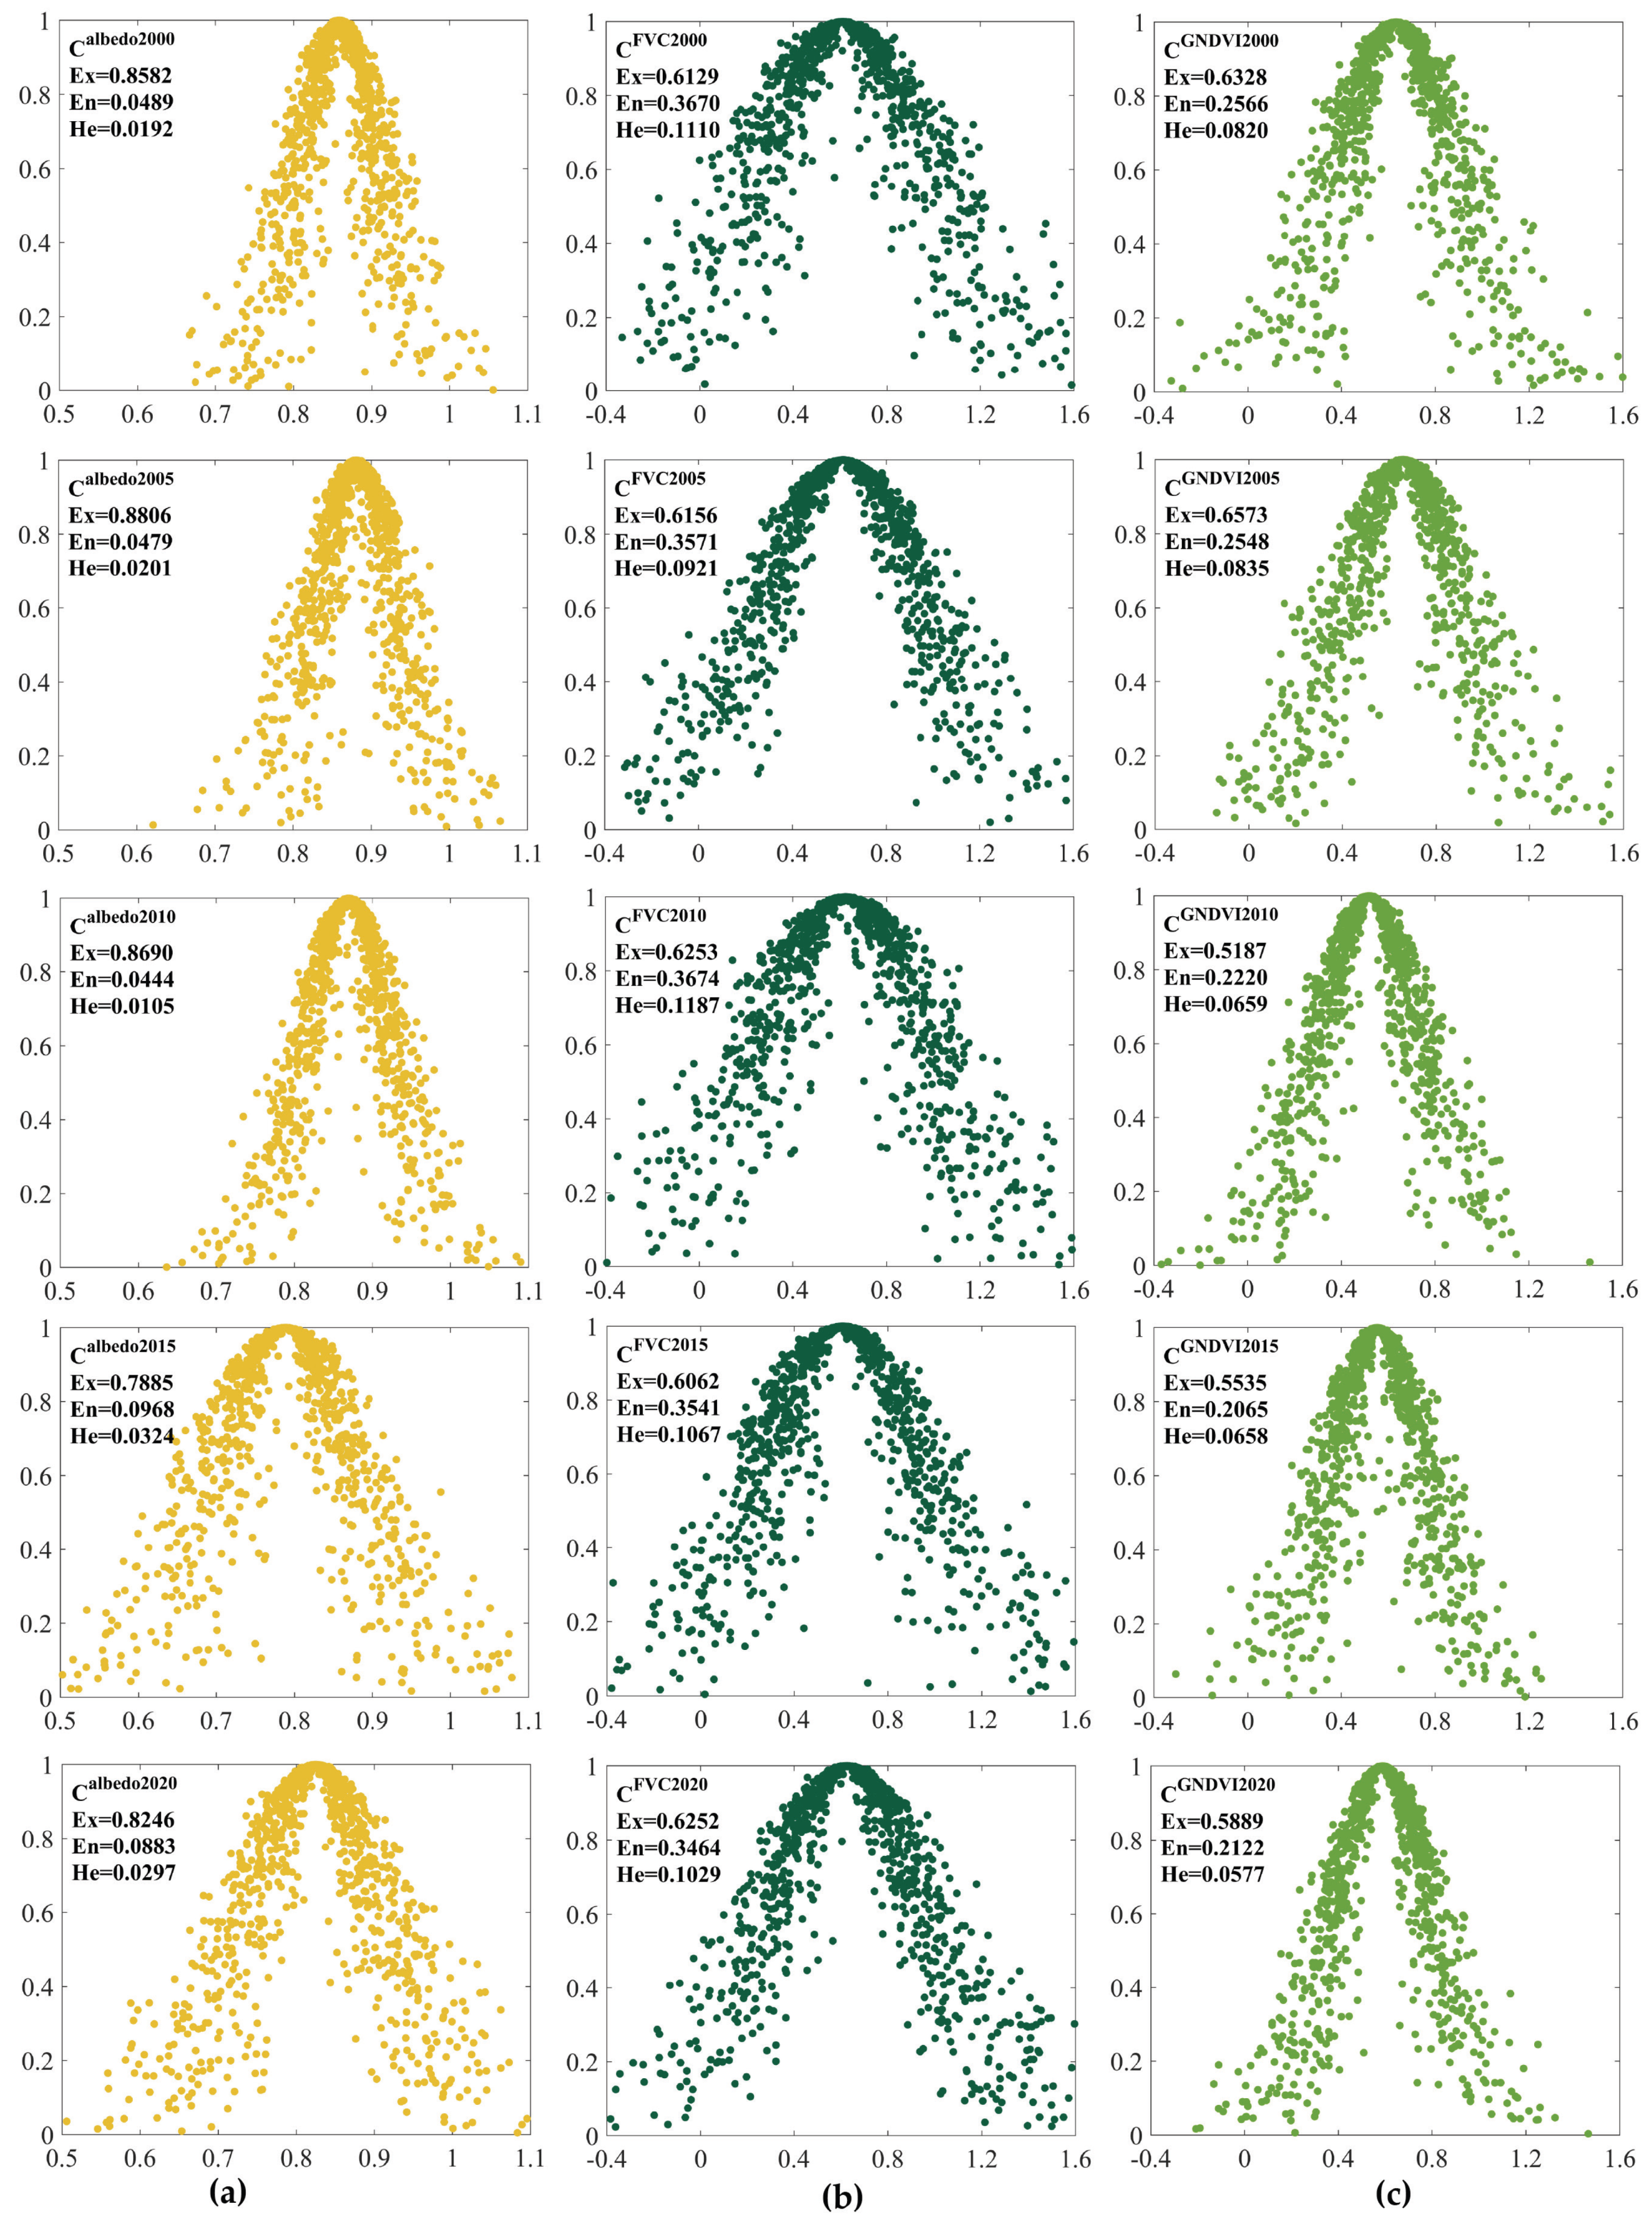
3.1.2. Variation in Quantitative Indicator Factor Cloud Model Characteristics
3.2. Qualitative Indicators of Factor Cloud Characteristics
3.3. Comprehensive Assessment of Desertification Risk State Cloud Model Features
4. Discussion
4.1. Spatial and Temporal Changes in the Risk Profile of Desertification
4.2. Factors Influencing the Evolution of Desertification Risk
4.3. Advantages and Stability of the Cloud Model Assessment
5. Conclusions
Author Contributions
Funding
Data Availability Statement
Conflicts of Interest
References
- UNCCD. United Nations Convention to Combat Desertification, Intergovernmental Negotiating Committee for a Convention to Combat Desertification, Elaboration of an International Convention to Combat Desertification in Countries Experiencing Serious Drought and/or Desertification, Particularly in Africa; U.N. Doc. A/AC.241/27, 33 I.L.M. 1328; UNCCD: New York, NY, USA, 1994. [Google Scholar]
- UNEP. World Atlas of Desertification, 2nd ed.; Middleton, N., Thomas, D.S.G., Eds.; Edward Arnold: London, UK, 1997. [Google Scholar]
- Mirzabaev, A.; Wu, J.; Evans, J.; GarcíaOliva, F.; Hussein, I.; Iqbal, M.; Kimutai, J.; Knowles, T.; Meza, F.; Nedjraoui, D.; et al. (Eds.) Climate Change and Land: An IPCC Special Report on Climate Change, Desertification, Land Degradation, Sustainable Land Management, Food Security, and Greenhouse Gas Fluxes in Terrestrial Ecosystems; IPCC: Geneva, Switzerland, 2019; in press. [Google Scholar]
- Borrelli, P.; Robinson, D.; Panagos, P.; Lugato, E.; Yang, J.; Alewell, C.; Wuepper, D.; Montanarella, L.; Ballabio, C. Land use and climate change impacts on global soil erosion by water (2015–2070). Proc. Natl. Acad. Sci. USA 2020, 117, 21994–22001. [Google Scholar] [CrossRef] [PubMed]
- Guo, B.; Jiang, L. Evaluation of soil freezethaw erosion intensity on the Qinghai Tibet Plateau Based on multisource ground air coupling data. Bull. Soil Water Conserv. 2017, 37, 12–18. [Google Scholar]
- Burrell, A.; Evans, J.; De Kauwe, M. Anthropogenic climate change has driven over 5 million km2 of drylands towards desertification. Nat. Commun. 2020, 11, 1. [Google Scholar] [CrossRef] [PubMed]
- Fenta, A.; Tsunekawa, A.; Haregeweyn, N.; Poesen, J.; Tsubo, M.; Borrelli, P.; Panagos, P.; Vanmaercke, M.; Broeckx, J.; Yasuda, H.; et al. Land susceptibility to water and wind erosion risks in the East Africa region. Sci. Total Environ. 2020, 703, 135016. [Google Scholar] [CrossRef]
- Montanarella, L.; Pennock, D.; Mckenzie, N.; Badraou, M.; Chude, V.; Baptista, I.; Mamo, T.; Yemefack, M.; Aulakh, M.S.; Yagi, K. World’s soils are under threat. SOIL Discuss. 2016, 2, 1263–1272. [Google Scholar] [CrossRef] [Green Version]
- Pravalie, R.; Patriche, C.; Borrelli, P.; Panagos, P.; Rosca, B.; Dumitrascu, M.; Nita, I.; Savulescu, I.; Birsan, M.; Bandoc, G. Arable lands under the pressure of multiple land degradation processes. A global perspective. Environ. Res. 2021, 194, 110697. [Google Scholar]
- Yue, Y.; Geng, L.; Li, M. The impact of climate change on aeolian desertification: A case of the agro-pastoral ecotone in northern China. Sci. Total Environ. 2023, 859, 160126. [Google Scholar] [CrossRef] [PubMed]
- Liu, X.; Li, L.; Qin, F.; Li, Y.; Chen, J.; Fang, X. Ecological policies enhanced ecosystem services in the Hunshandak sandy land of China. Ecol. Indic. 2022, 144, 109450. [Google Scholar] [CrossRef]
- Nyamsuren, B.; Nasahara, K.; Kubota, T.; Masaki, T. Vegetation Mapping by Using GPM/DPR over the Mongolian Land. Remote Sens. 2019, 11, 2386. [Google Scholar] [CrossRef] [Green Version]
- Kimura, R.; Moriyama, M. Use of A MODIS Satellite-Based Aridity Index to Monitor Drought Conditions in Mongolia from 2001 to 2013. Remote Sens. 2021, 13, 2561. [Google Scholar] [CrossRef]
- Bashir, B.; Cao, C.; Naeem, S.; Joharestani, M.; Bo, X.; Afzal, H.; Jamal, K.; Mumtaz, F. Spatio-Temporal Vegetation Dynamic and Persistence under Climatic and Anthropogenic Factors. Remote Sens. 2020, 12, 2612. [Google Scholar] [CrossRef]
- Li, H.; Wang, C.; Zhang, F.; He, Y.; Shi, P.; Guo, X.; Wang, J.; Zhang, L.; Li, Y.; Cao, G.; et al. Atmospheric water vapor and soil moisture jointly determine the spatiotemporal variations of CO2 fluxes and evapotranspiration across the Qinghai-Tibetan Plateau grasslands. Sci. Total Environ. 2021, 791, 148379. [Google Scholar] [CrossRef]
- Zhang, Z.; Ju, W.; Zhou, Y.; Li, X. Revisiting the cumulative effects of drought on global gross primary productivity based on new longterm series data (1982–2018). Glob. Chang. Biol. 2022, 28, 3620–3635. [Google Scholar] [CrossRef]
- Gui, J.; Li, Z.; Feng, Q.; Zhang, B.; Xue, J.; Gao, W.; Li, Y.; Liang, P.; Nan, F. Water resources significance of moisture recycling in the transition zone between Tibetan Plateau and arid region by stable isotope tracing. J. Hydrol. 2022, 605, 127350. [Google Scholar]
- Luo, D.; Liu, L.; Jin, H.; Wang, X.; Chen, F. Characteristics of ground surface temperature at Chalaping in the Source Area of the Yellow River, northeastern Tibetan Plateau. Agric. For. Meteorol. 2020, 281, 107819. [Google Scholar] [CrossRef]
- Zhang, B.; Li, Z.; Feng, Q.; Zhang, B.; Gui, J. A review of isotope ecohydrology in the cold regions of Western China. Sci. Total Environ. 2023, 857, 159438. [Google Scholar]
- Somers, L.; McKenzie, J. A review of groundwater in high mountain environments. Wiley Interdiscip. Rev.-Water 2020, 7, e1475. [Google Scholar] [CrossRef]
- Beddrich, J.; Gupta, S.; Wohlmuth, B.; Chiogna, G. The importance of topographic gradients in alpine permafrost modeling. Adv. Water Resour. 2022, 170, 104321. [Google Scholar] [CrossRef]
- Peng, J.; Bai, X.; Chen, X. Climate-driven soil erosion processes in alpine environments over the last century: Evidence from the Taibai Mountain (central China). Catena 2021, 206, 105569. [Google Scholar] [CrossRef]
- Guo, B.; Wei, C.; Yu, Y.; Liu, Y.; Li, J.; Meng, C.; Cai, Y. The dominant influencing factors of desertification changes in the source region of Yellow River: Climate change or human activity? Sci. Total Environ. 2022, 813, 152512. [Google Scholar] [CrossRef]
- Li, J.; Yao, Q.; Zhou, N.; Li, F. Modern aeolian desertification on the Tibetan Plateau under climate change. Land Degrad. Dev. 2021, 32, 1908–1916. [Google Scholar] [CrossRef]
- Feng, J.; Hu, H.; Chen, F. An eolian deposit-buried soil sequence in an alpine soil on the northern Tibetan Plateau: Implications for climate change and carbon sequestration. Geoderma 2016, 266, 14–24. [Google Scholar] [CrossRef]
- Jin, H.; He, R.; Cheng, G.; Wu, Q.; Wang, S.; Lv, L.; Chang, X. Changes in frozen ground in the Source Area of the Yellow River on the Qinghai-Tibet Plateau, China, and their eco-environmental impacts. Environ. Res. Lett. 2009, 4, 045206. [Google Scholar] [CrossRef]
- Teng, M.; Zeng, L.; Hu, W.; Wang, P.; Yan, Z.; He, W.; Zhang, Y.; Huang, Z.; Xiao, W. The impacts of climate changes and human activities on net primary productivity vary across an ecotone zone in Northwest China. Sci. Total Environ. 2020, 714, 136691. [Google Scholar] [CrossRef]
- Jiao, H.; Wu, C.; Rodriguez-Lopez, J.; Sun, X.; Yi, H. Late Cretaceous plateau deserts in the South China Block, and Quaternary analogues; sedimentology, dune reconstruction and wind-water interactions. Mar. Pet. Geol. 2020, 120, 104504. [Google Scholar] [CrossRef]
- Zhang, A.; Li, X.; Zeng, F.; Jiang, Y.; Wang, R. Variation characteristics of different plant functional groups in alpine desert steppe of the Altun Mountains, northern Qinghai-Tibet Plateau. Front. Plant Sci. 2022, 13, 961692. [Google Scholar] [CrossRef] [PubMed]
- Wang, Y.; Guo, E.; Kang, Y.; Ma, H. Assessment of Land Desertification and Its Drivers on the Mongolian Plateau Using Intensity Analysis and the Geographical Detector Technique. Remote Sens. 2022, 14, 6365. [Google Scholar] [CrossRef]
- Zhou, Y.; Hu, Z.; Geng, Q.; Ma, J.; Liu, J.; Wang, M.; Wang, Y. Monitoring and analysis of desertification surrounding Qinghai Lake (China) using remote sensing big data. Environ. Sci. Pollut. Res. 2023, 30, 17420–17436. [Google Scholar] [CrossRef] [PubMed]
- Catalao, J.; Navarro, A.; Calvao, J. Mapping Cork Oak Mortality Using Multitemporal High-Resolution Satellite Imagery. Remote Sens. 2022, 14, 2750. [Google Scholar] [CrossRef]
- Huang, J.; Zhang, G.; Zhang, Y.; Guan, X.; Wei, Y.; Guo, R. Global desertification vulnerability to climate change and human activities. Land Degrad. Dev. 2020, 31, 1380–1391. [Google Scholar] [CrossRef]
- Li, X.; Zhang, X.; Xu, X. Precipitation and Anthropogenic Activities Jointly Green the China-Mongolia-Russia Economic Corridor. Remote Sens. 2022, 14, 187. [Google Scholar] [CrossRef]
- Vendruscolo, J.; Marin, A.; Felix, E.; Ferreira, K.; Cavalheiro, W.; Fernandes, I. Monitoring desertification in semi-arid Brazil: Using the Desertification Degree Index (DDI). Land Degrad. Dev. 2020, 32, 684–698. [Google Scholar] [CrossRef]
- Yang, Z.; Gao, X.; Lei, J.; Meng, X.; Zhou, N. Analysis of spatiotemporal changes and driving factors of desertification in the Africa Sahel. Catena 2022, 213, 106213. [Google Scholar] [CrossRef]
- Sanzheev, E.; Mikheeva, A.; Osodoev, P.; Batomunkuev, V.; Tulokhonov, A. Theoretical Approaches and Practical Assessment of Socio-Economic Effects of Desertification in Mongolia. Int. J. Environ. Res. Public Health 2020, 17, 4068. [Google Scholar] [CrossRef]
- Lee, H.; Zhang, D. Perceiving desertification from the lay perspective in northern China. Land Degrad. Dev. 2004, 15, 529–542. [Google Scholar] [CrossRef]
- Ferrara, A.; Salvati, L.; Sateriano, A.; Nole, A. Performance evaluation and cost assessment of a key indicator system to monitor desertification vulnerability. Ecol. Indic. 2012, 23, 123–129. [Google Scholar] [CrossRef]
- Kosmas, C.; Kirkby, M.; Geeson, N. The MEDALUS Project: Mediterranean Desertification and Land Use: Manual on Key Indicators of Desertification and Mapping Environmentally Sensitive Areas to Desertification; Directorate-General Science, Research and Development: Brussels, Belgium, 1999. [Google Scholar]
- He, G.; Zhao, X.; Yu, M. Exploring the multiple disturbances of karst landscape in Guilin World Heritage Site, China. Catena 2021, 203, 105349. [Google Scholar] [CrossRef]
- Peng, T.; Deng, H.; Lin, Y.; Jin, Z. Assessment on water resources carrying capacity in karst areas by using an innovative DPESBRM concept model and cloud mode. Sci. Total Environ. 2021, 767, 144353. [Google Scholar] [CrossRef]
- Luo, X.; Liu, Q.; Song, X. China’s strategies for promoting differentiated urban resilience measurement from the social ecosystem perspective. Syst. Res. Behav. Sci. 2023, 40, 235–249. [Google Scholar] [CrossRef]
- Hou, X.; Lv, T.; Xu, J.; Deng, X.; Liu, F.; Pi, D. Energy sustainability evaluation of 30 provinces in China using the improved entropy weight-cloud model. Ecol. Indic. 2021, 126, 107657. [Google Scholar] [CrossRef]
- Lu, X.; Zhang, Y.; Zou, Y. Evaluation the effect of cultivated land protection policies based on the cloud model: A case study of Xingning, China. Ecol. Indic. 2021, 131, 108247. [Google Scholar] [CrossRef]
- Li, D.; Liu, C.; Gan, W. A New Cognitive Model: Cloud Model. Int. J. Intell. Syst. 2009, 24, 357–375. [Google Scholar] [CrossRef]
- Wang, G.; Xu, C.; Li, D. Generic normal cloud model. Inf. Sci. 2014, 280, 1–15. [Google Scholar] [CrossRef]
- Li, Z.; Feng, Q.; Li, Z.; Wang, X.; Gui, J.; Zhang, B.; Li, Y.; Deng, X.; Xue, J.; Gao, W.; et al. Reversing conflict between humans and the environment—The experience in the Qilian Mountains. Renew. Sustain. Energy Rev. 2021, 148, 111333. [Google Scholar]
- Yang, L.; Feng, Q.; Adamowski, J.; Deo, R.; Yin, Z.; Wen, X.; Tang, X.; Wu, M. Causality of climate, food production and conflict over the last two millennia in the Hexi Corridor, China. Sci. Total Environ. 2020, 713, 136587. [Google Scholar] [CrossRef]
- Yang, L.; Feng, Q.; Yin, Z.; Deo, R.; Wen, X.; Si, J.; Liu, W. Regional hydrology heterogeneity and the response to climate and land surface changes in arid alpine basin, northwest China. Catena 2020, 187, 104345. [Google Scholar] [CrossRef]
- Guo, B.; Zang, W.; Yang, X.; Huang, X.; Zhang, R.; Wu, H.; Yang, L.; Wang, Z.; Sun, G.; Zhang, Y. Improved evaluation method of the soil wind erosion intensity based on the cloud-AHP model under the stress of global climate change. Sci. Total Environ. 2020, 746, 141271. [Google Scholar] [CrossRef]
- Tian, L.; Zhu, H.; Chen, B.; Zhu, F. Evaluation of water ecological civilization construction based on comprehensive cloud model. Water Resour. Plan. Design 2014, 1, 93–97. [Google Scholar]
- Jia, X.; Xu, J. Cloud model-based seismic risk assessment of road in earthquake region. Tongji Daxue Xuebao/J. Tongji Univ. 2014, 42, 1352–1358+1458. [Google Scholar]
- Lyu, H.; Zhou, W.; Shen, S.; Zhou, A. Inundation risk assessment of metro system using AHP and TFN-AHP in Shenzhen. Sustain. Cities Soc. 2020, 56, 102103. [Google Scholar] [CrossRef]
- Li, X.; Guo, X.; Fu, J. Evaluation approach of passenger satisfaction for urban rail transit based on cloud model. Tongji Univ. 2019, 47, 378–385. [Google Scholar]
- Rahman, M.; Robson, A. Integrating Landsat-8 and Sentinel-2 Time Series Data for Yield Prediction of Sugarcane Crops at the Block Level. Remote Sens. 2020, 12, 1313. [Google Scholar] [CrossRef] [Green Version]
- Wu, H.; Huang, B.; Zheng, Z.; Ma, Z.; Zeng, Y. Spatial Heterogeneity and Temporal Variation in Urban Surface Albedo Detected by High-Resolution Satellite Data. Remote Sens. 2022, 14, 6166. [Google Scholar] [CrossRef]
- Gorelick, N.; Hancher, M.; Dixon, M.; Ilyushchenko, S.; Thau, D.; Moore, R. Google Earth Engine: Planetary-scale geospatial analysis for everyone. Remote Sens. Environ. 2017, 202, 18–27. [Google Scholar] [CrossRef]
- Wang, Y.; Tan, L.; Wang, G.; Sun, X.; Xu, Y. Study on the Impact of Spatial Resolution on Fractional Vegetation Cover Extraction with Single-Scene and Time-Series Remote Sensing Dat. Remote Sens. 2022, 14, 4165. [Google Scholar] [CrossRef]
- Yang, J.; Huang, X. The 30 m annual land cover dataset and its dynamics in China from 1990 to 2019. Earth Syst. Sci. Data 2021, 13, 3907–3925. [Google Scholar] [CrossRef]
- Hao, X.; Qiu, Y.; Jia, G.; Menenti, M.; Ma, J.; Jiang, Z. Evaluation of Global Land Use-Land Cover Data Products in Guangxi, China. Remote Sens. 2023, 15, 1291. [Google Scholar] [CrossRef]
- Cheng, H.; Zhu, L.; Meng, J. Fuzzy evaluation of the ecological security of land resources in mainland China based on the Pressure-State-Response framework. Sci. Total Environ. 2022, 804, 150053. [Google Scholar] [CrossRef]
- Lv, C.; Wu, Z.; Liu, Z.; Shi, L. The multi-level comprehensive safety evaluation for chemical production instalment based on the method that combines grey-clustering and EAHP. Int. J. Disaster Risk Reduct. 2017, 21, 243–250. [Google Scholar] [CrossRef]
- Weber, K.; Tiwari, I. Research and Survey Format Design: An Introduction; Asian Institute of Technology: Bangkok, Thailand, 1992. [Google Scholar]
- Santos, J.R. Cronbach’s alpha: A tool for assessing the reliability of scales. J. Ext. 1999, 37, 1–5. [Google Scholar]
- Biasutti, M.; Frate, S. A validity and reliability study of the Attitudes toward Sustainable Development scale. Environ. Educ. Res. 2017, 23, 214–230. [Google Scholar] [CrossRef]
- Grimbuhler, S.; Viel, J. Development and psychometric evaluation of a safety climate scale for vineyards. Environ. Res. 2019, 172, 522–528. [Google Scholar] [CrossRef] [PubMed]
- Eren, E.; Alpak, E.; Duzenli, T. Color associations in landscape design and subscription levels to these associations. Environ. Sci. Pollut. Res. 2022, 29, 70842–70861. [Google Scholar] [CrossRef]
- Hou, Y.; Chen, Y.; Ding, J.; Li, Z.; Li, Y.; Sun, F. Ecological Impacts of Land Use Change in the Arid Tarim River Basin of China. Remote Sens. 2022, 14, 1894. [Google Scholar] [CrossRef]
- Li, T.; Kamran, M.; Chang, S.H.; Peng, Z.; Wang, Z.; Ran, L.; Jiang, W.; Jin, Y.; Zhang, X.; You, Y.; et al. Climate-soil interactions improve the stability of grassland ecosystem by driving alpine plant diversity. Ecol. Indic. 2022, 141, 109002. [Google Scholar] [CrossRef]
- Liang, L.; Wang, Q.; Guan, Q.; Du, Q.; Sun, Y.; Ni, F.; Lv, S.; Shan, Y. Assessing vegetation restoration prospects under different environmental elements in cold and arid mountainous region of China. Catena 2023, 226, 107055. [Google Scholar] [CrossRef]
- Chen, T.; Xu, H.; Qi, X.; Shan, S.; Chen, S.; Deng, Y. Temporal dynamics of satellite-derived vegetation pattern and growth in an arid inland river basin, Tibetan Plateau. Glob. Ecol. Conserv. 2022, 38, e02262. [Google Scholar] [CrossRef]
- Yang, A.; Zhang, H.; Yang, X.; Zhang, X. Quantitative analysis of the impact of climate change and human activities on vegetation NPP in the Qilian Mountain. Hum. Ecol. Risk Assess. 2023, 29, 202–221. [Google Scholar] [CrossRef]
- Du, Q.; Sun, Y.; Guan, Q.; Pan, N.; Wang, Q.; Ma, Y.; Li, H.; Liang, L. Vulnerability of grassland ecosystems to climate change in the Qilian Mountains, northwest China. J. Hydrol. 2022, 612, 128305. [Google Scholar] [CrossRef]
- Yang, Z.; Zhang, Y.; Su, H.; Wang, J. Dual adaptation for biodiversity and people: Nexus in ecological protection using a case study of the Qilian Mountains in China. Ecol. Indic. 2022, 144, 109522. [Google Scholar] [CrossRef]
- Li, Y.; Liu, W.; Feng, Q.; Zhu, M.; Yang, L.; Zhang, J. Effects of land use and land cover change on soil organic carbon storage in the Hexi regions, Northwest China. J. Environ. Manag. 2022, 312, 114911. [Google Scholar] [CrossRef]
- Mu, H.; Li, X.; Ma, H.; Du, X.; Huang, J.; Su, W.; Yu, Z.; Xu, C.; Liu, H.; Yin, D.; et al. Evaluation of the policy-driven ecological network in the Three-North Shelterbelt region of China. Landsc. Urban Plan. 2022, 218, 104305. [Google Scholar] [CrossRef]
- Xue, J.; Li, Z.; Feng, Q.; Li, Z.; Gui, J.; Li, Y. Ecological conservation pattern based on ecosystem services in the Qilian Mountains, northwest China. Environ. Dev. 2023, 46, 100834. [Google Scholar] [CrossRef]
- Di, J.; Dong, Z.; Parteli, E.; Wei, T.; Marcelli, A.; Ren, J.; Qin, X.; Chen, S. Insight into atmospheric deposition and spatial distribution of bioavailable iron in the glaciers of northeastern Tibetan Plateau. Sci. Total Environ. 2022, 825, 153946. [Google Scholar] [CrossRef] [PubMed]
- Zhu, M.; Yao, T.; Thompson, L.; Wang, S.; Yang, W.; Zhao, H. What induces the spatiotemporal variability of glacier mass balance across the Qilian Mountains. Clim. Dyn. 2022, 59, 3555–3577. [Google Scholar] [CrossRef]
- Yang, H.; Gou, X.; Xue, B.; Ma, W.; Kuang, W.; Tu, Z.; Gao, L.; Yin, D.; Zhang, J. Research on the change of alpine ecosystem service value and its sustainable development path. Ecol. Indic. 2023, 146, 108893. [Google Scholar] [CrossRef]
- Zhang, S.; Zhang, J.; Liang, S.; Liu, S.; Zhou, Y. A perception of the nexus “resistance, recovery, resilience” of vegetations responded to extreme precipitation pulses in arid and semi-arid regions: A case study of the Qilian Mountains Nature Reserve, China. Sci. Total Environ. 2022, 843, 157105. [Google Scholar] [CrossRef]
- Peng, Q.; Wang, R.; Jiang, Y.; Li, C. Contributions of climate change and human activities to vegetation dynamics in Qilian Mountain National Park, northwest China. Glob. Ecol. Conserv. 2021, 32, e01947. [Google Scholar] [CrossRef]
- Duan, Q.; Luo, L.; Zhao, W.; Zhuang, Y.; Liu, F. Mapping and Evaluating Human Pressure Changes in the Qilian Mountains. Remote Sens. 2021, 13, 2400. [Google Scholar] [CrossRef]
- Yang, J.; Wang, S.; Su, W.; Yu, Q.; Wang, X.; Han, Q.; Zheng, Y.; Qu, J.; Li, X.; Li, H. Animal Activities of the Key Herbivore Plateau Pika (Ochotona curzoniae) on the Qinghai-Tibetan Plateau Affect Grassland Microbial Networks and Ecosystem Functions. Front. Microbiol. 2022, 13, 950811. [Google Scholar] [CrossRef] [PubMed]
- Peng, Q.; Wang, R.; Jiang, Y.; Zhang, W.; Liu, C.; Zhou, L. Soil erosion in Qilian Mountain National Park: Dynamics and driving mechanisms. J. Hydrol.-Reg. Stud. 2022, 42, 101144. [Google Scholar] [CrossRef]
- Wang, X.; Chen, R.; Li, H.; Li, K.; Liu, J.; Liu, G. Detection and attribution of trends in flood frequency under climate change in the Qilian Mountains, Northwest China. J. Hydrol.-Reg. Stud. 2022, 42, 101153. [Google Scholar] [CrossRef]
- Yan, Y.; Hu, S.; Zhou, K.; Jin, W.; Ma, N.; Zeng, C. Hazard characteristics and causes of the “7.22” 2021 debris flow in Shenshuicao gully, Qilian Mountains, NW China. Landslides 2023, 20, 111–125. [Google Scholar] [CrossRef]
- Dai, L.; Guo, X.; Ke, X.; Du, Y.; Zhang, F.; Cao, G. The variation in soil water retention of alpine shrub meadow under different degrees of degradation on northeastern Qinghai-Tibetan plateau. Plant Soil 2021, 458, 231–244. [Google Scholar] [CrossRef]
- Wang, X.; He, X.; Price, M.; He, Q.; Zhang, P.; Ran, J.; Wu, Y. Epigeicarthropod community changes in response to livestock-caused alpine grassland degradation on the eastern Qinghai-Tibetan Plateau. Glob. Ecol. Conserv. 2022, 35, e02062. [Google Scholar]
- Zhang, R.; Wu, J.; Yang, Y.; Peng, X.; Li, C.; Zhao, Q. A method to determine optimum ecological groundwater table depth in semi-arid areas. Ecol. Indic. 2022, 139, 108915. [Google Scholar] [CrossRef]
- He, L.; Li, C.; He, Z.; Liu, X.; Qu, R. Evaluation and Validation of the Net Primary Productivity of the Zoige Wetland Based on Grazing Coupled Remote Sensing Process Model. IEEE J. Sel. Top. Appl. Earth Obs. Remote Sens. 2022, 15, 440–447. [Google Scholar] [CrossRef]
- Rao, P.; Wang, Y.; Wang, F.; Liu, Y.; Wang, X.; Wang, Z. Daily soil moisture mapping at 1 km resolution based on SIVIAP data for desertification areas in northern China. Earth Syst. Sci. Data 2022, 14, 3053–3073. [Google Scholar] [CrossRef]
- Wang, B.; Yan, H.; Zhang, Q. Reciprocity of grassland conservation and pastoralist livelihoods: Evidence from comparison between developed and developing regions. Ecol. Indic. 2022, 144, 109517. [Google Scholar] [CrossRef]
- Easdale, M.; Aguiar, M. From traditional knowledge to novel adaptations of transhumant pastoralists the in face of new challenges in North Patagonia. J. Rural Stud. 2018, 63, 65–73. [Google Scholar] [CrossRef]
- Li, Y.; Liu, W.; Feng, Q.; Zhu, M.; Yang, L.; Zhang, J.; Yin, X. The role of land use change in affecting ecosystem services and the ecological security pattern of the Hexi Regions, Northwest China. Sci. Total Environ. 2022, 855, 158940. [Google Scholar] [CrossRef] [PubMed]


| County | Area | Average Elevation | Average Annual Temperature | Average Annual Precipitation | No. of Surveyed Villages 1 | Major Ecosystem Type 2 |
|---|---|---|---|---|---|---|
| Menyuan Hui Autonomous County | 6902.26 km2 | 2866 m | 0.8 °C | 520 mm | 4 (7) | ① Desert steppe ② Montane shrub–steppe ③ Montane forest–steppe ④ Subalpine shrub–steppe ⑤ Alpine meadow/steppe ⑥ Alpine desert ⑦ Permanent snow/glaciers |
| Qilian County | 13,886 km2 | 3196 m | 1 °C | 420 mm | 7 (12) |
| Relative Importance between Indicators | Cloud Model |
|---|---|
| Xi is slightly more important than Yj | C1(Ex1, En1, He1) |
| Xi is significantly more important than Yj | C2(Ex2, En2, He2) |
| Xi is strongly more important than Yj | C3(Ex3, En3, He3) |
| Xi is definitely more important than Yj | C4(Ex4, En4, He4) |
| Xi is slightly less important than Yj | C5(Ex5, En5, He5) |
| Xi is obviously less important than Yj | C6(Ex6, En6, He6) |
| Xi is strongly less important than Yj | C7(Ex7, En7, He7) |
| Xi is definitely less important than Yj | C8(Ex8, En8, He8) |
| Xi and Yj are equally important | C0(Ex0, En0, He0) |
| Comparison between Indicators | Level of Importance | Cloud Model |
|---|---|---|
| Xi is more important than Yj | Absolutely | C4(9, 0.33, 0.01) |
| Strongly | C3(7, 0.33, 0.01) | |
| Obviously | C2(5, 0.33, 0.01) | |
| Slightly | C1(3, 0.33, 0.01) | |
| Xi and Yj are equally important | C0(1, 0, 0) | |
| Xi is less important than Yj | Slightly | C5(1/3, 0.33/9, 0.01/9) |
| Obviously | C6(1/5, 0.33/25, 0.01/25) | |
| Strongly | C7(1/7, 0.33/49, 0.01/49) | |
| Absolutely | C8(1/9, 0.33/81, 0.01/81) |
| Index | Index Characteristic Area | 2000 | 2005 | 2010 | 2015 | 2020 | Change (2000–2020) |
|---|---|---|---|---|---|---|---|
| albedo | Low-value area | 3510.14 | 4074.51 | 4074.51 | 2972.09 | 4709.45 | 1199.31 |
| Sub-low-value area | 9047.52 | 8939.77 | 8939.77 | 8552.35 | 13,568.38 | 4520.86 | |
| Medium-value area | 7347.27 | 7121.01 | 7121.01 | 8580.24 | 1211.53 | −6135.74 | |
| Sub-high-value area | 708.25 | 556.44 | 556.44 | 546.41 | 868.47 | 160.22 | |
| High-value area | 175.09 | 96.54 | 96.54 | 137.17 | 430.43 | 255.35 | |
| FVC | Low-value area | 3673.87 | 3609.20 | 3616.48 | 3530.59 | 3440.58 | −233.29 |
| Sub-low-value area | 2321.58 | 2353.00 | 2233.65 | 2468.57 | 2410.37 | 88.79 | |
| Medium-value area | 2946.44 | 2907.46 | 2803.84 | 3239.42 | 3187.22 | 240.78 | |
| Sub-high-value area | 5240.73 | 5382.02 | 5096.53 | 5051.34 | 4852.04 | −388.69 | |
| High-value area | 6605.64 | 6536.58 | 7037.75 | 6498.34 | 6898.06 | 292.42 | |
| GNDVI | Low-value area | 2614.91 | 2720.94 | 2808.82 | 2370.66 | 1471.06 | −1143.85 |
| Sub-low-value area | 2437.63 | 2296.33 | 2334.93 | 2669.16 | 2655.66 | 218.03 | |
| Medium-value area | 2961.21 | 3002.78 | 2800.12 | 3316.57 | 3125.30 | 164.09 | |
| Sub-high-value area | 5766.77 | 6132.67 | 5618.69 | 5821.94 | 5741.61 | −25.16 | |
| High-value area | 7007.74 | 6635.54 | 7225.70 | 6609.93 | 7794.63 | 786.89 |
| Year | Albedo | FVC | GNDVI |
|---|---|---|---|
| 2000 | (0.8582, 0.0489, 0.0192) | (0.6129, 0.3670, 0.1110) | (0.6328, 0.2566, 0.0820) |
| 2005 | (0.8806, 0.0479, 0.0201) | (0.6156, 0.3571, 0.0921) | (0.6573, 0.2548, 0.0835) |
| 2010 | (0.8690, 0.0444, 0.0105) | (0.6253, 0.3674, 0.1187) | (0.5187, 0.2220, 0.0659) |
| 2015 | (0.7885, 0.0968, 0.0324) | (0.6062, 0.3541, 0.1067) | (0.5535, 0.2065, 0.0658) |
| 2020 | (0.8246, 0.0883, 0.0297) | (0.6252, 0.3464, 0.1029) | (0.5889, 0.2122, 0.0577) |
| Year | Pressure | State | Response |
|---|---|---|---|
| 2000 | (0.8323, 0.0323, 0.0085) | (0.8123, 0.0297, 0.0068) | (0.3308, 0.0301, 0.0051) |
| 2005 | (0.8029, 0.0288, 0.0058) | (0.7734, 0.0255, 0.0092) | (0.4021, 0.0214, 0.0051) |
| 2010 | (0.7719, 0.0255, 0.0064) | (0.7767, 0.0221, 0.0049) | (0.4611, 0.0343, 0.0077) |
| 2015 | (0.7323, 0.0282, 0.0056) | (0.7419, 0.0250, 0.0059) | (0.5757, 0.0413, 0.0082) |
| 2020 | (0.6757, 0.0395, 0.0115) | (0.7205, 0.0356, 0.0094) | (0.7557, 0.0337, 0.0081) |
| Year | CQual | CQuan | CCom |
|---|---|---|---|
| 2000 | (0.6151, 0.0310, 0.0068) | (0.7641, 0.1468, 0.0480) | (0.6896, 0.0889, 0.0274) |
| 2005 | (0.6275, 0.0252, 0.0061) | (0.7830, 0.1441, 0.0453) | (0.7052, 0.0846, 0.0257) |
| 2010 | (0.6400, 0.0287, 0.0067) | (0.7502, 0.1376, 0.0441) | (0.6951, 0.0832, 0.0254) |
| 2015 | (0.6649, 0.0332, 0.0067) | (0.7050, 0.1572, 0.0525) | (0.6872, 0.0992, 0.0296) |
| 2020 | (0.7171, 0.0365, 0.0098) | (0.7376, 0.1595, 0.0486) | (0.7273, 0.0980, 0.0292) |
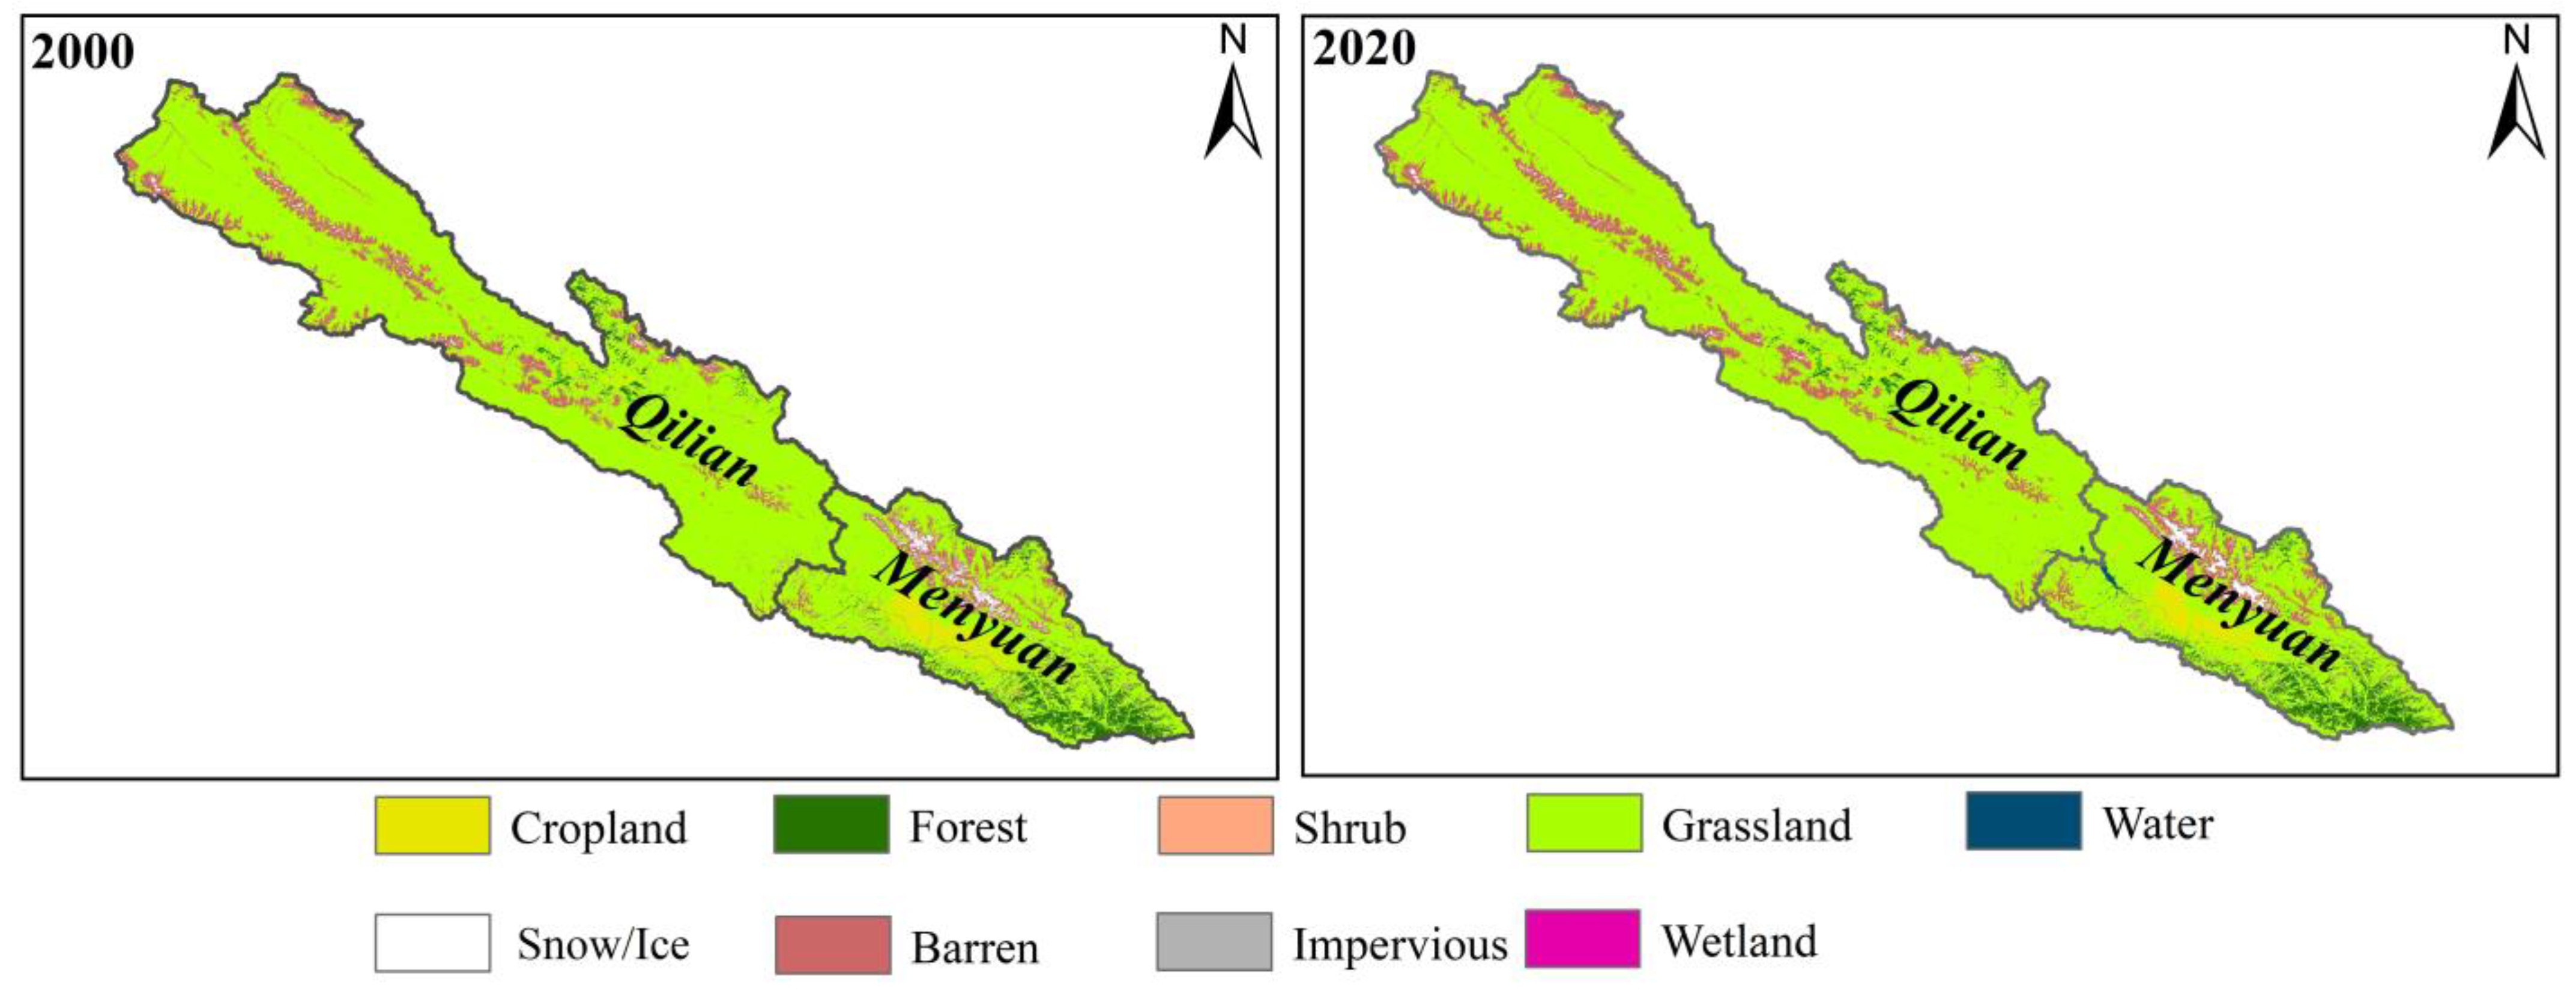
| Land Use/Cover Type | Cropland | Forest | Shrub | Grassland | Water | Snow/Ice | Barren |
|---|---|---|---|---|---|---|---|
| 2000 | 551.24 | 887.12 | 320.38 | 16,449.23 | 23.99 | 264.86 | 2291.09 |
| 2005 | 568.61 | 873.92 | 269.84 | 16,466.57 | 53.63 | 471.74 | 2083.62 |
| 2010 | 549.54 | 931.50 | 184.34 | 16,631.19 | 44.83 | 489.23 | 1957.37 |
| 2015 | 507.61 | 940.39 | 166.08 | 16,434.14 | 40.45 | 391.91 | 2307.30 |
| 2020 | 487.07 | 922.58 | 226.09 | 16,281.70 | 57.68 | 274.51 | 2538.03 |
| Change (2000–2020) | −64.18 | 35.46 | −94.29 | −167.53 | 33.69 | 9.66 | 246.94 |
| Index | E | F | G | H | Wi (Exi, Eni, Hei) | Grade | ||||||||
| Ex | En | He | Ex | En | He | Ex | En | He | Ex | En | He | |||
| X | 0.0411 | 0.0409 | 0.0409 | 0.1065 | 0.1091 | 0.1091 | 0.2097 | 0.2003 | 0.2003 | 0.0712 | 0.0708 | 0.0708 | ||
| E1 | 0.0895 | 0.0927 | 0.0927 | (0.0037, 0.0038, 0.0038) | 32 | |||||||||
| E2 | 0.3533 | 0.3480 | 0.3480 | (0.0145, 0.0142, 0.0142) | 23 | |||||||||
| E3 | 0.2040 | 0.2113 | 0.2113 | (0.0084, 0.0086, 0.0086) | 30 | |||||||||
| E4 | 0.3533 | 0.3480 | 0.3480 | (0.0145, 0.0142, 0.0142) | 24 | |||||||||
| F1 | 0.3505 | 0.3446 | 0.3446 | (0.0373, 0.0376, 0.0376) | 9 | |||||||||
| F2 | 0.2663 | 0.2618 | 0.2618 | (0.0284, 0.0286, 0.0286) | 12 | |||||||||
| F3 | 0.2663 | 0.2618 | 0.2618 | (0.0284, 0.0286, 0.0286) | 13 | |||||||||
| F4 | 0.1168 | 0.1318 | 0.1318 | (0.0124, 0.0144, 0.0144) | 26 | |||||||||
| G1 | 0.2908 | 0.2854 | 0.2854 | (0.0610, 0.0572, 0.0572) | 5 | |||||||||
| G2 | 0.2908 | 0.2854 | 0.2854 | (0.0610, 0.0572, 0.0572) | 6 | |||||||||
| G3 | 0.1276 | 0.1437 | 0.1437 | (0.0267, 0.0288, 0.0288) | 16 | |||||||||
| G4 | 0.2908 | 0.2854 | 0.2854 | (0.0610, 0.0572, 0.0572) | 7 | |||||||||
| H1 | 0.3436 | 0.3381 | 0.3381 | (0.0245, 0.0239, 0.0239) | 17 | |||||||||
| H2 | 0.1984 | 0.2053 | 0.2053 | (0.0141, 0.0145, 0.0145) | 25 | |||||||||
| H3 | 0.1145 | 0.1185 | 0.1185 | (0.0082, 0.0084, 0.0084) | 31 | |||||||||
| H4 | 0.3436 | 0.3381 | 0.3381 | (0.0245, 0.0239, 0.0239) | 18 | |||||||||
| Index | I | J | K | L | Wi (Exi, Eni, Hei) | |||||||||
| Ex | En | He | Ex | En | He | Ex | En | He | Ex | En | He | |||
| X | 0.0714 | 0.0788 | 0.0788 | 0.0714 | 0.0788 | 0.0788 | 0.2143 | 0.2106 | 0.1053 | 0.2143 | 0.2106 | 0.1053 | ||
| I1 | 0.4121 | 0.4121 | 0.4121 | (0.0294, 0.0325, 0.0325) | 11 | |||||||||
| I2 | 0.3131 | 0.3131 | 0.3131 | (0.0224, 0.0247, 0.0247) | 19 | |||||||||
| I3 | 0.1374 | 0.1374 | 0.1374 | (0.0098, 0.0108, 0.0108) | 27 | |||||||||
| I4 | 0.1374 | 0.1374 | 0.1374 | (0.0098, 0.0108, 0.0108) | 28 | |||||||||
| J1 | 0.2908 | 0.2854 | 0.2854 | (0.0208, 0.0225, 0.0225) | 20 | |||||||||
| J2 | 0.2908 | 0.2854 | 0.2854 | (0.0208, 0.0225, 0.0225) | 21 | |||||||||
| J3 | 0.1276 | 0.1437 | 0.1437 | (0.0091, 0.0113, 0.0113) | 29 | |||||||||
| J4 | 0.2908 | 0.2854 | 0.2854 | (0.0208, 0.0225, 0.0225) | 22 | |||||||||
| K1 | 0.2908 | 0.2854 | 0.2854 | (0.0623, 0.0601, 0.0301) | 2 | |||||||||
| K2 | 0.1276 | 0.1437 | 0.1437 | (0.0273, 0.0303, 0.0151) | 14 | |||||||||
| K3 | 0.2908 | 0.2854 | 0.2854 | (0.0623, 0.0601, 0.0301) | 3 | |||||||||
| K4 | 0.2908 | 0.2854 | 0.2854 | (0.0623, 0.0601, 0.0301) | 4 | |||||||||
| L1 | 0.1424 | 0.1427 | 0.1427 | (0.0305, 0.0301, 0.0150) | 10 | |||||||||
| L2 | 0.2467 | 0.2601 | 0.2601 | (0.0529, 0.0548, 0.0274) | 8 | |||||||||
| L3 | 0.4855 | 0.4775 | 0.4775 | (0.1040, 0.1006, 0.0503) | 1 | |||||||||
| L4 | 0.1254 | 0.1197 | 0.1197 | (0.0269, 0.0252, 0.0126) | 15 | |||||||||
Disclaimer/Publisher’s Note: The statements, opinions and data contained in all publications are solely those of the individual author(s) and contributor(s) and not of MDPI and/or the editor(s). MDPI and/or the editor(s) disclaim responsibility for any injury to people or property resulting from any ideas, methods, instructions or products referred to in the content. |
© 2023 by the authors. Licensee MDPI, Basel, Switzerland. This article is an open access article distributed under the terms and conditions of the Creative Commons Attribution (CC BY) license (https://creativecommons.org/licenses/by/4.0/).
Share and Cite
Liu, Z.; Si, J.; Deng, Y.; Jia, B.; Li, X.; He, X.; Zhou, D.; Wang, C.; Zhu, X.; Qin, J.; et al. Assessment of Land Desertification and Its Drivers in Semi-Arid Alpine Mountains: A Case Study of the Qilian Mountains Region, Northwest China. Remote Sens. 2023, 15, 3836. https://doi.org/10.3390/rs15153836
Liu Z, Si J, Deng Y, Jia B, Li X, He X, Zhou D, Wang C, Zhu X, Qin J, et al. Assessment of Land Desertification and Its Drivers in Semi-Arid Alpine Mountains: A Case Study of the Qilian Mountains Region, Northwest China. Remote Sensing. 2023; 15(15):3836. https://doi.org/10.3390/rs15153836
Chicago/Turabian StyleLiu, Zijin, Jianhua Si, Yanfang Deng, Bing Jia, Xinrong Li, Xiaohui He, Dongmeng Zhou, Chunlin Wang, Xinglin Zhu, Jie Qin, and et al. 2023. "Assessment of Land Desertification and Its Drivers in Semi-Arid Alpine Mountains: A Case Study of the Qilian Mountains Region, Northwest China" Remote Sensing 15, no. 15: 3836. https://doi.org/10.3390/rs15153836