Article

Neural-Network-Based Equalization and Detection for Underwater Acoustic Orthogonal Frequency Division Multiplexing Communications: A Low-Complexity Approach

1
School of Informatics, Xiamen University, Xiamen 361005, China
2
Key Laboratory of Southeast Coast Marine Information Intelligent Perception and Application, Ministry of Natural Resources, Zhangzhou 363000, China
3
School of Integrated Circuit Science and Engineering, Tianjin University of Technology, Tianjin 300384, China
4
Key Laboratory of Broadband Wireless Communication and Sensor Network Technology, Nanjing University of Posts and Telecommunications, Nanjing 210023, China
5
School of Electornic Science and Engineering (National Model Microelectronics College), Xiamen University, Xiamen 361005, China
*
Author to whom correspondence should be addressed.
Remote Sens. 2023, 15(15), 3796; https://doi.org/10.3390/rs15153796
Submission received: 27 June 2023 / Revised: 25 July 2023 / Accepted: 27 July 2023 / Published: 30 July 2023
(This article belongs to the Special Issue Advanced Array Signal Processing for Target Imaging and Detection)

Abstract

:
The performance of the underwater acoustic (UWA) orthogonal frequency division multiplexing (OFDM) system is often restrained by time-varying channels with large delays. The existing frequency domain equalizers do not work well because of the high complexity and difficulty of finding the real-time signal-to-noise ratio. To solve these problems, we propose a low-complexity neural network (NN)-based scheme for joint equalization and detection. A simple NN structure is built to yield the detected symbols with the joint input of the segmented channel response and received symbol. The coherence bandwidth is investigated to find the optimal hyperparameters. By being completely trained offline with real channels, the proposed detector is applied independently in both simulations and sea trials. The results show that the proposed detector outperforms the ZF and MMSE equalizers and extreme learning machine (ELM)-based detectors in both the strongly reflected channels of the pool and time-variant channels of the shallow sea. The complexity of the proposed network is lower than the MMSE and ELM-based receiver.

1. Introduction

With the increasing requirements for an Internet of Things in the oceans, efficient data processing and transmission become critical for ensuring the instantaneity for the underwater environment monitoring [1,2] and emergency rescue [3]. Orthogonal frequency division multiplexing (OFDM) has been a viable method in bandwidth-constrained underwater acoustic communications [4,5], as a result of its high spectral efficiency and ability to resist frequency selective fading. Nonetheless, the selective channels decided by variant parameters, such as distribution of sound speed [6], bottom reflection coefficient and surface waves [7], limit the performance improvement of the underwater acoustic (UWA) OFDM system [8,9].
To better detect the OFDM signals from UWA channels, variable equalizers have been applied, e.g., linear equalizers including zero-forcing (ZF) and minimum mean square error (MMSE) equalizers [10], and decision feedback equalizer (DFE) such as the Turbo equalizer [11,12]. The linear equalizers with simple structures are widely used in terrestrial communication links [13,14], whose performances rely on accurate channel estimations. Altough the DFEs show satisfactory performance without a channel estimator, it is at the expense of the requirement for higher computational complexity and extra channel coding [15,16]. In practice, real-time underwater acoustic communications (UAC) do not allow for a large number of online iterations [17,18,19], which still require linear equalizers. However, the noise amplification problem occurs when applying the ZF equalizer. Although MMSE equalizer overcomes this problem by considering the signal-to-noise ratio (SNR), it is hard to estimate the statistical values of the noise in real underwater environments including non-Gaussian and colored noise [20,21]. To further optimize the equalizer, deep learning (DL) and neural network (NN) have been developed [22,23,24,25,26]. With enough samples, a DL-based receiver can statistically learn to detect the symbols from the channel and other interference.
H. Ye et al. proposed a DL-based OFDM receiver [22], which used three fully connected layers to deal with a 64-subcarrier OFDM symbol with a block-type pilot. The bit error rate (BER) of the NN-based receiver was lower than the least square (LS) and MMSE estimation and detector in the simulation. To further obtain higher detecting accuracy, researchers have tried to substitute the whole communication system for the end-to-end networks [22,24,25,27]. The traditional digital modulation and subcarrier mapping has been replaced by the autoencoder (AE) [24]. A blind receiver without the pilot has been built with a convolutional neural network (CNN), which showed better performance compared with the traditional baselines. Similarly, an AE has been designed [25] to provide a modulation scheme for the multicarrier system. This work fed the decoder with both the channel state information (CSI) and received symbol, constructing a data-driven model for symbol detection. The simulations showed significant BER performance in additive white Gaussian noise (AWGN) channels. In B. Lin’s work [28], a super-resolution channel reconstruction network was combined with AE for the marine communication system, proving its effectiveness in slow fading channels. H. Zhao et al. [29], J. Liu et al. [30], and Y. Zhang et al. [31] proposed different network structures for the UWA OFDM receiver, and trained them with the WATERMARK dataset. These studies focused on designing specific network structures to improve the performance of the OFDM receiever. Nevertheless, the theoretical explanation of the networks remains limited. There is no quantitative analysis for the hyperparameters.
Although the above NN-based communication systems show good performances in simulations, it is difficult to practically implement them, particularly in underwater acoustic channels because of the heavy computations and complex structures. For instance, Refs. [29,30,31] did not conduct sea trials. Another option is to build simple networks for the module optimization. M. Turhan et al. proposed an NN-based generalized frequency division multiplex with index modulation (GFDM-IM) detector to detect the symbols after a coarse detector [32]. With perfect CSI in the receiver, the simulation results showed lower BERs of this network than the ZF detector. T. Wang et al. have built a CNN for index modulated OFDM (IM-OFDM) detection, whose performance approximates the maximum likelihood (ML) detector [33]. A further option for NN is the extreme learning machine (ELM)-based receiver. This kind of receiver integrates the channel estimator and equalizer with a single layer NN, which is trained online for each time [34,35]. In L. Yang’s work, with enough block pilots for training, a long frame with a large quantity of OFDM symbols was simulated [35], showing better performance than MMSE equalizer and NN-based detector proposed by H. Ye et al. [22]. Since the UWA channels were time-variant, the ELM detector was unable to show good performance, because the transmitted frames had to be kept short to reduce the influence of the time-variant channel. H. Zhao et al. [36] proposed a transfer strategy for the DNN-based OFDM receiver and tested it with the WATERMARK dataset and real experimental data. This study focused on the network retraining, and did not discuss the design of the applied NN structure. Y. Zhang et al. [37] focused on solving the channel sample augmentation problem for the NN-based channel estimator. Both [36,37] proposed an innovative strategy to solve the application problem of DNN-based receievers.
Despite the good simulation results produced by the above structures, problems still exist when the system is implemented in UWA channels.
  • Firstly, the real dataset is difficult to obtain because the UAC links are usually one-way with no feedback. Hence, the uncertain time-variant channel states do not allow the system to obtain the samples in a short period.
  • Secondly, it is not realistic for the NNs to be retrained in a high rate link because the computation loading is still heavy for real-time applications. Consequently, the data-driven works mentioned above barely discuss the performance of the system with real experiments.
In this paper, an attempt at the design and derivation of an NN-based receiver is made for the UWA OFDM system. A simple NN is proposed to integrate the equalization and symbol detection, containing only one fully-connected layer. Firstly, taking both channel frequency response and received symbol as input, the network learns a robust structure to output the symbol directly. To minimize the complexity of the network, the channel and received symbol are divided into blocks of the same size, matched with small-size networks. For attribution to the simple structure, the hyperparameters (mainly the hidden layer size and input dimension) are inferred according to the delay and coherence bandwidth of the channel. Thus, the channel-driven networks are constructed. After being trained with mixed channels and noise samples, the networks show robustness in both simulations and sea trials, performing better than the ZF and MMSE equalizers as well as the ELM-based detector in [35]. The contributions of this paper are listed as follows.
  • We propose a low-complexity NN-based symbol detector for the UWA OFDM system. The network takes the segmented channel response and symbol block as input and integrates the equalization and detection processes. The small input dimension also reduces the requirement for the hidden neurons. The proposed detector shows lower computational complexity than the MMSE and ELM-based detectors.
  • The NN-based detector is trained offline with a channel dataset containing simulated and real channels. Then the detector can be applied completely independently online with fixed hyperparameters, improving the efficiency of the online receiver. Under the same LS channel estimator, the trained network outperforms the ZF and MMSE equalizers, and the whole receiver is more reliable than the online ELM-based detector in both frequency selective channels in the pool and time-variant shallow sea channels.
  • To obtain the optimal network structure, the block size of an OFDM symbol is associated with the coherence bandwidth. By testing each network with the input sizes in the range of less than the coherence bandwidth, the optimal hyperparameters can be found. The simulations verify the above configurations.
The remainder of this paper is organized as follows. Section 2 describes the UWA OFDM system. Section 3 discusses the UWA channels and the traditional detectors for symbols suffering from them. The network structure and training strategy are described in Section 4, while the result discussions of simulations and sea trials are included in Section 5 and Section 6. Section 7 concludes our work.

2. Preliminary

An UWA OFDM system with frequency domain equalization is shown in Figure 1. The bit stream b to be transmitted is modulated to symbols with digital modulation. After the inverse fast Fourier transform (IFFT) is performed, the signal is up-converted to the carrier frequency. Then it is transmitted through the channel and suffers from noise. In the receiver, the signal is represented as
r ( t ) = h ( t , τ ) s ( t ) + z ( t ) ,
where s ( t ) , h ( t , τ ) and z ( t ) are the transmitted signal, channel impulsive response and additive noise. τ is the channel delay. ⊗ denotes convolution. After being down-converted to the baseband and performing the fast Fourier transform (FFT), the received symbol in the frequency domain can be written as
R = H S + Z ,
where S , H , and Z are the transmitted symbol, channel transfer function, and additive noise in frequency domain. Usually, the UWA channels and noise are different from those in terrestrial communications. With more powerful recognizable paths and impulsive noise, the OFDM system does not show good performance in shallow water. To reduce the influence of channels on symbols, before detection, the channel should be estimated and used to equalize the symbol with specific algorithms such as ZF and MMSE.

3. UWA Receiver Structure

3.1. Signals Suffering from UWA Channel with Large Delays

The UWA channel differs from the terrestrial electromagnetic channel [38]. The ray theory reveals that the delay of an underwater channel is decided by the path length and sound speed [7], and in addition, according to [39], the motion of the transmitter/receiver pair, the scattering of the moving sea surface and the refraction due to sound speed variations. For a received symbol, the time-varying UWA channel impulse response (CIR) can be written as
h ( t , τ ) = i = 0 N p 1 c i ( t ) δ ( τ τ i ( t ) ) ,
where N p is the number of paths, and  τ i ( t ) τ i a i t is the time-varying delay of the i-th path, and  a i is the Doppler factor. c i ( t ) is the channel coefficient of each path varying with time. In the receiver, after resampling, FFT, and low-pass filtering [4], the channel function in frequency domain is written as
H ( t , f ) = i = 0 N p 1 c i ( t ) e j 2 π f τ i ( t ) .
As a result of the slow sound speed and low reflection loss, τ i ( t ) is large in long distances. These recognizable paths result in a small coherence bandwidth for the OFDM symbol. Figure 2 shows a CIR and corresponding transfer function caught in the water tank of Xiamen University. It can be seen from Figure 2b that the frequency selectivity is severe because of the long delay of the recognizable paths in Figure 2a.

3.2. Signal Detection in UWA Environments

For the received signal described in Equation (1), using the minimum squared Euclidian distance is considered to detect the above symbol, the optimization problem can be expressed as
S ^ ( n ) = arg min S m ( n ) , m [ 1 , M ] R ( n ) H ( n ) S m ( n ) 2 ,
where · represents 2-norm. H ( n ) is the channel frequency response in any one OFDM symbol. M is the modulation order, and  S m ( n ) is the m-th referred symbol. Further, the squared Euclidian distance can be written as
E S k 2 = ( H ( n ) 1 ) S m ( n ) + Z ( n ) 2 k = m H ( n ) S k ( n ) S m ( n ) + Z ( n ) 2 k m .
Considering a system utilizing frequency domain equalization (FDE) for better performance, for the signal in Equation (6), a multiplier G ( n ) is included in the detector, yielding
E S k 2 = ( H ( n ) G ( n ) 1 ) S m ( n ) + Z ( n ) G ( n ) 2 k = m H ( n ) G ( n ) S k ( n ) S m ( n ) + Z ( n ) G ( n ) 2 k m .
Considering G ( n ) as the entry of multiplier matrix G , for ZF equalizer,
G = H ^ H H ^ 1 H ^ H ,
where H ^ is the estimated channel matrix. Multiplying R in Equation (2) with G , and expending the equation, the equalized symbol can be expressed as
s ^ 1 s ^ 2 s ^ N = 1 0 0 0 1 0 0 0 1 s 1 s 2 s N + g 11 g 12 g 1 N g 21 g 22 g 2 N g N 1 g N 2 g N N z 1 z 2 z N ,
where g n n is the element of G . It can be seen in Equation (10) that the equalized symbol includes amplified noise which will influence the detection. In the noiseless channel, the second term is zero.
For the MMSE equalizer, there is
G = H ^ H H ^ H ^ H + σ 2 P I 1 ,
where σ 2 and P are powers of noise and signal, respectively, and  I is the identity matrix. With Equation (11), the MMSE-equalized symbol can be expressed as
s ^ 1 s ^ 2 s ^ N = 1 H 11 + σ n 2 σ s 2 0 0 0 1 H 22 + σ n 2 σ s 2 0 0 0 1 H N N + σ n 2 σ s 2 s 1 s 2 s N + g 11 g 12 g 1 N g 21 g 22 g 2 N g N 1 g N 2 g N N n 1 n 2 n N .
The first term of Equation (11) includes a factor matrix that only contains positive coefficients. As Figure 3 shows, for a single received point in the decision regions, the elements of this factor matrix linearly scale the received point to draw it closer to the reference point, which does not change its quadrant. Consequently, for the low-level constellations that can decide the symbols according to the quadrants they lie, such as BPSK and QPSK, the MMSE does not perform better than the ZF equalizer. In addition, the MMSE equalizer requires a priori SNR, which is difficult to obtain in time-varying UWA channels.
When the frequency selectivity becomes strong, with imperfectly estimated channels, both ZF and MMSE equalizers cannot recover the symbols effectively [40]. However, it is still necessary to develop a more effective frequency domain equalizer in underwater acoustic channels because of the attractive low complexity. Variable NN structures provide new solutions to such interference elimination problems. The NN now has been proved to learn one or more nonlinear processes well with a proper structure [33]. With an intelligent interference simulating model [41], it is possible to train an equalization network offline, which can be applied independently online without extra a priori environment information.

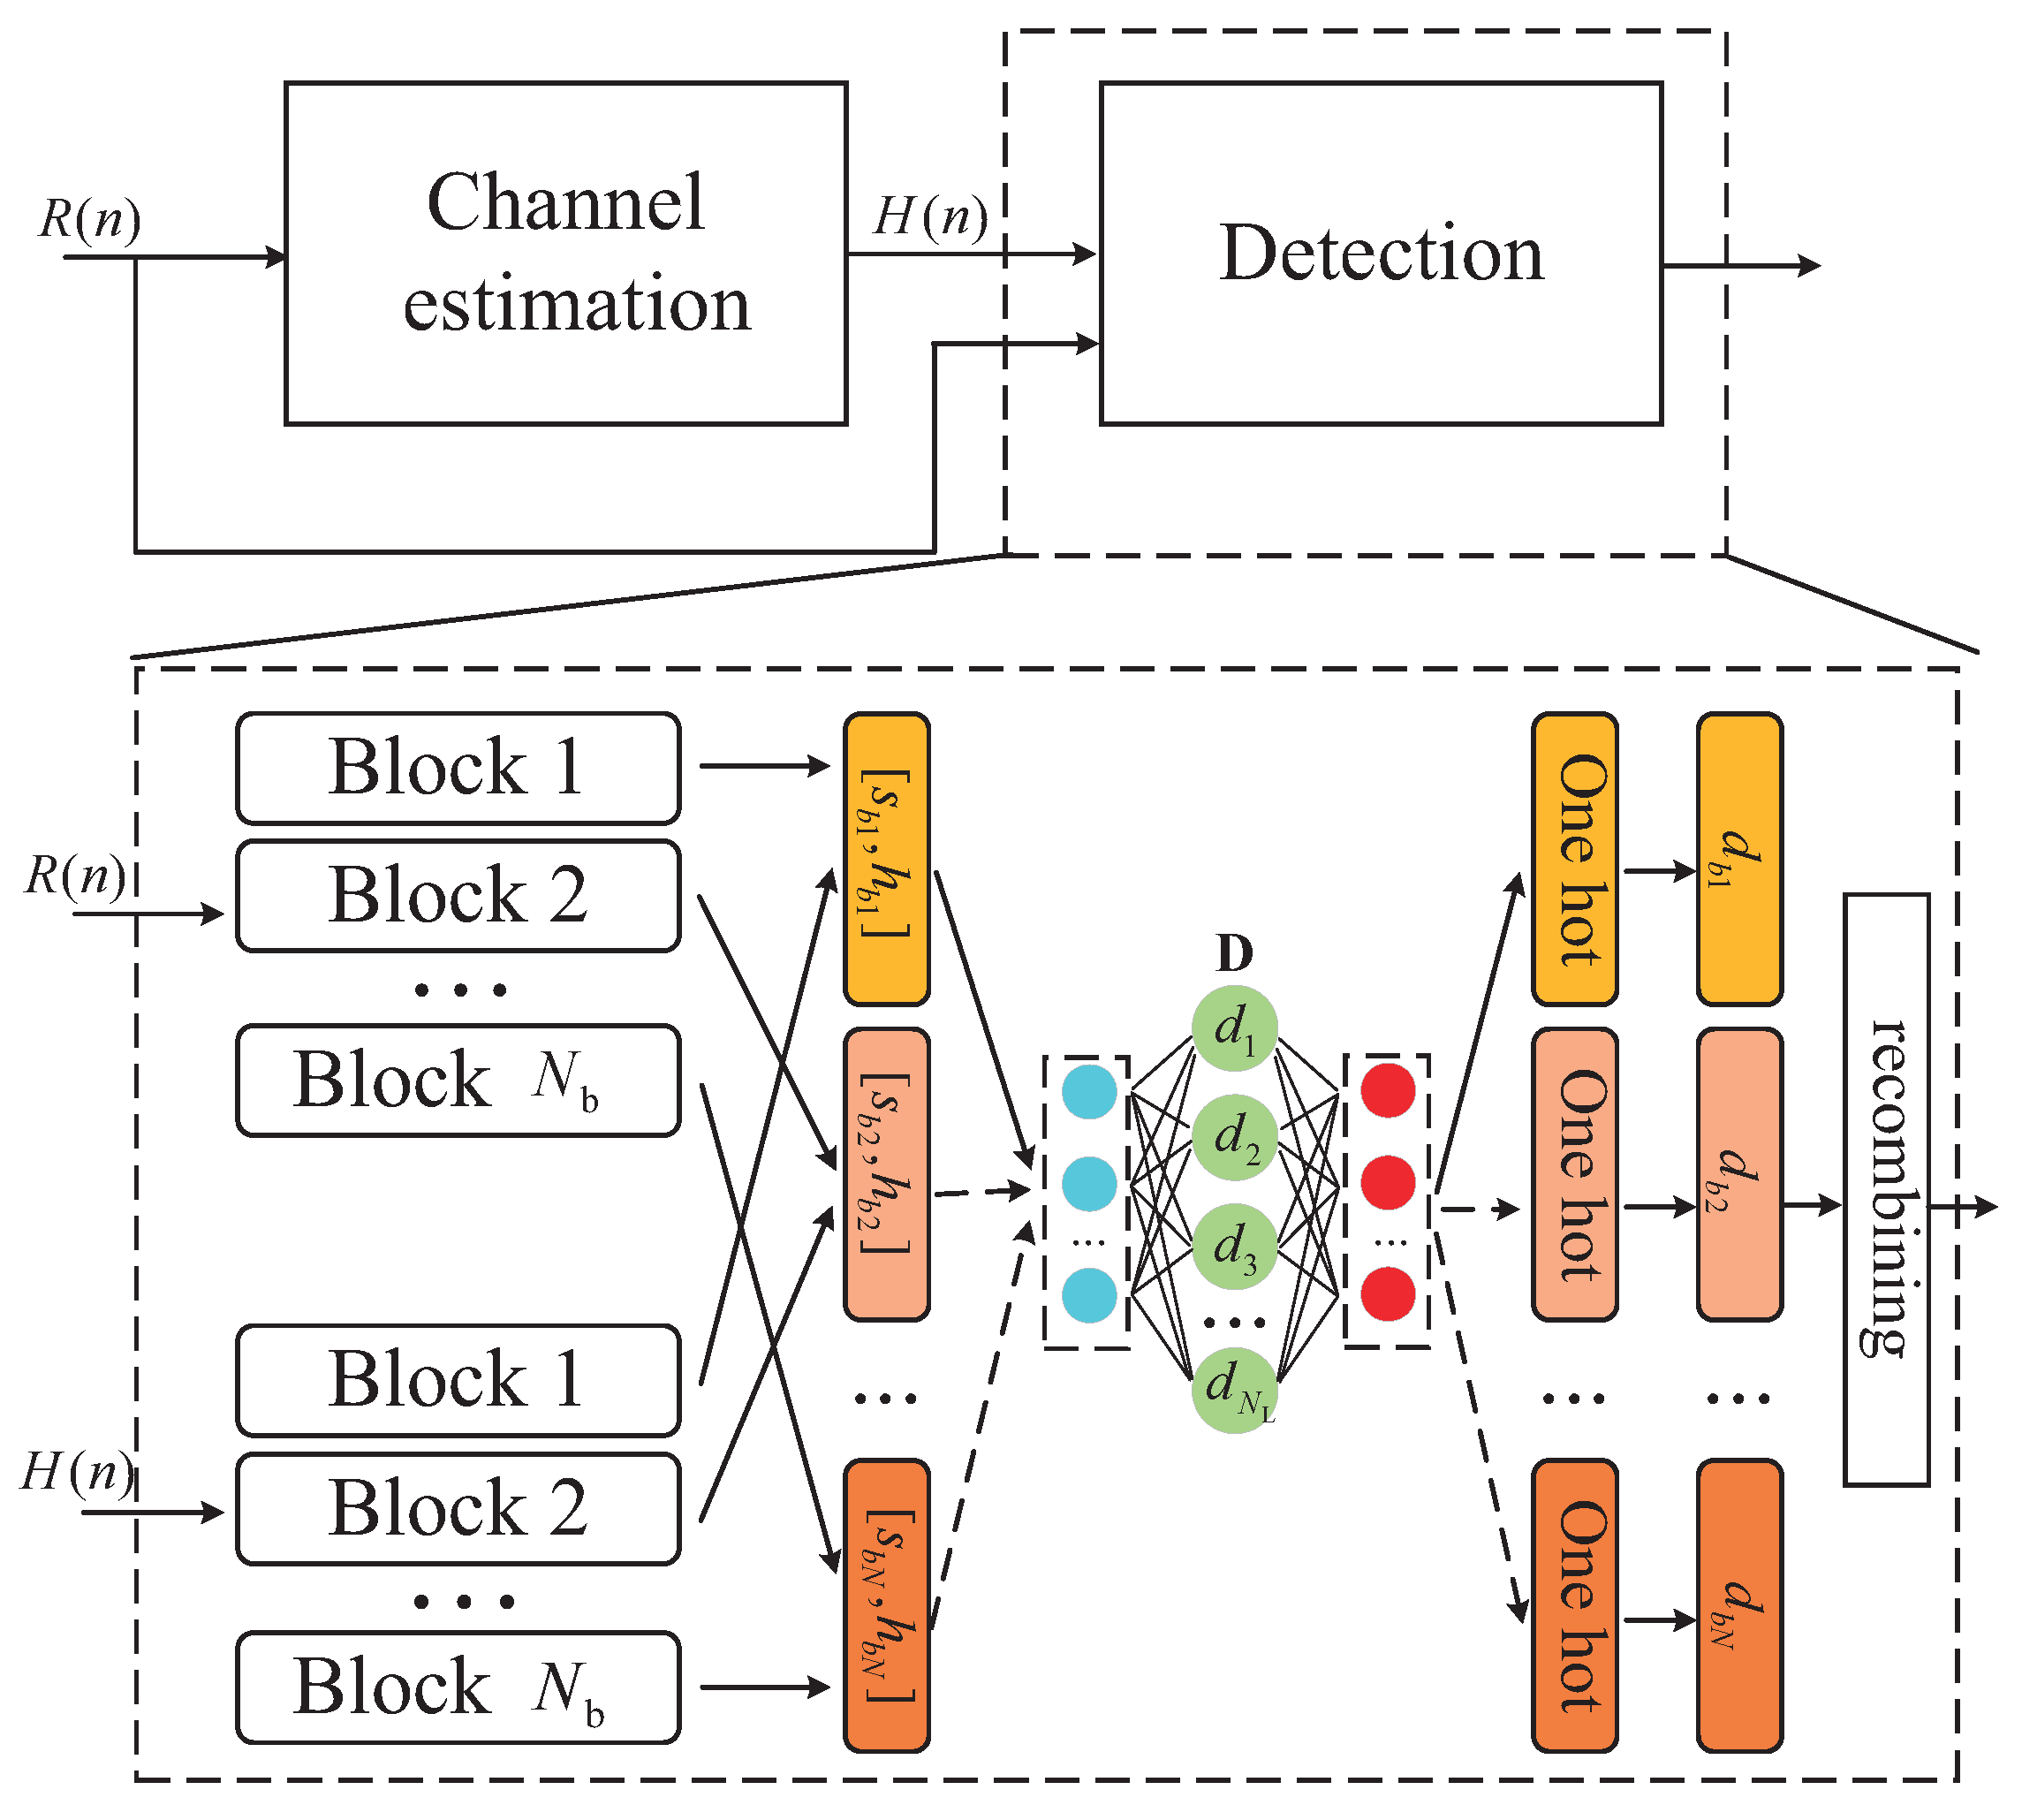
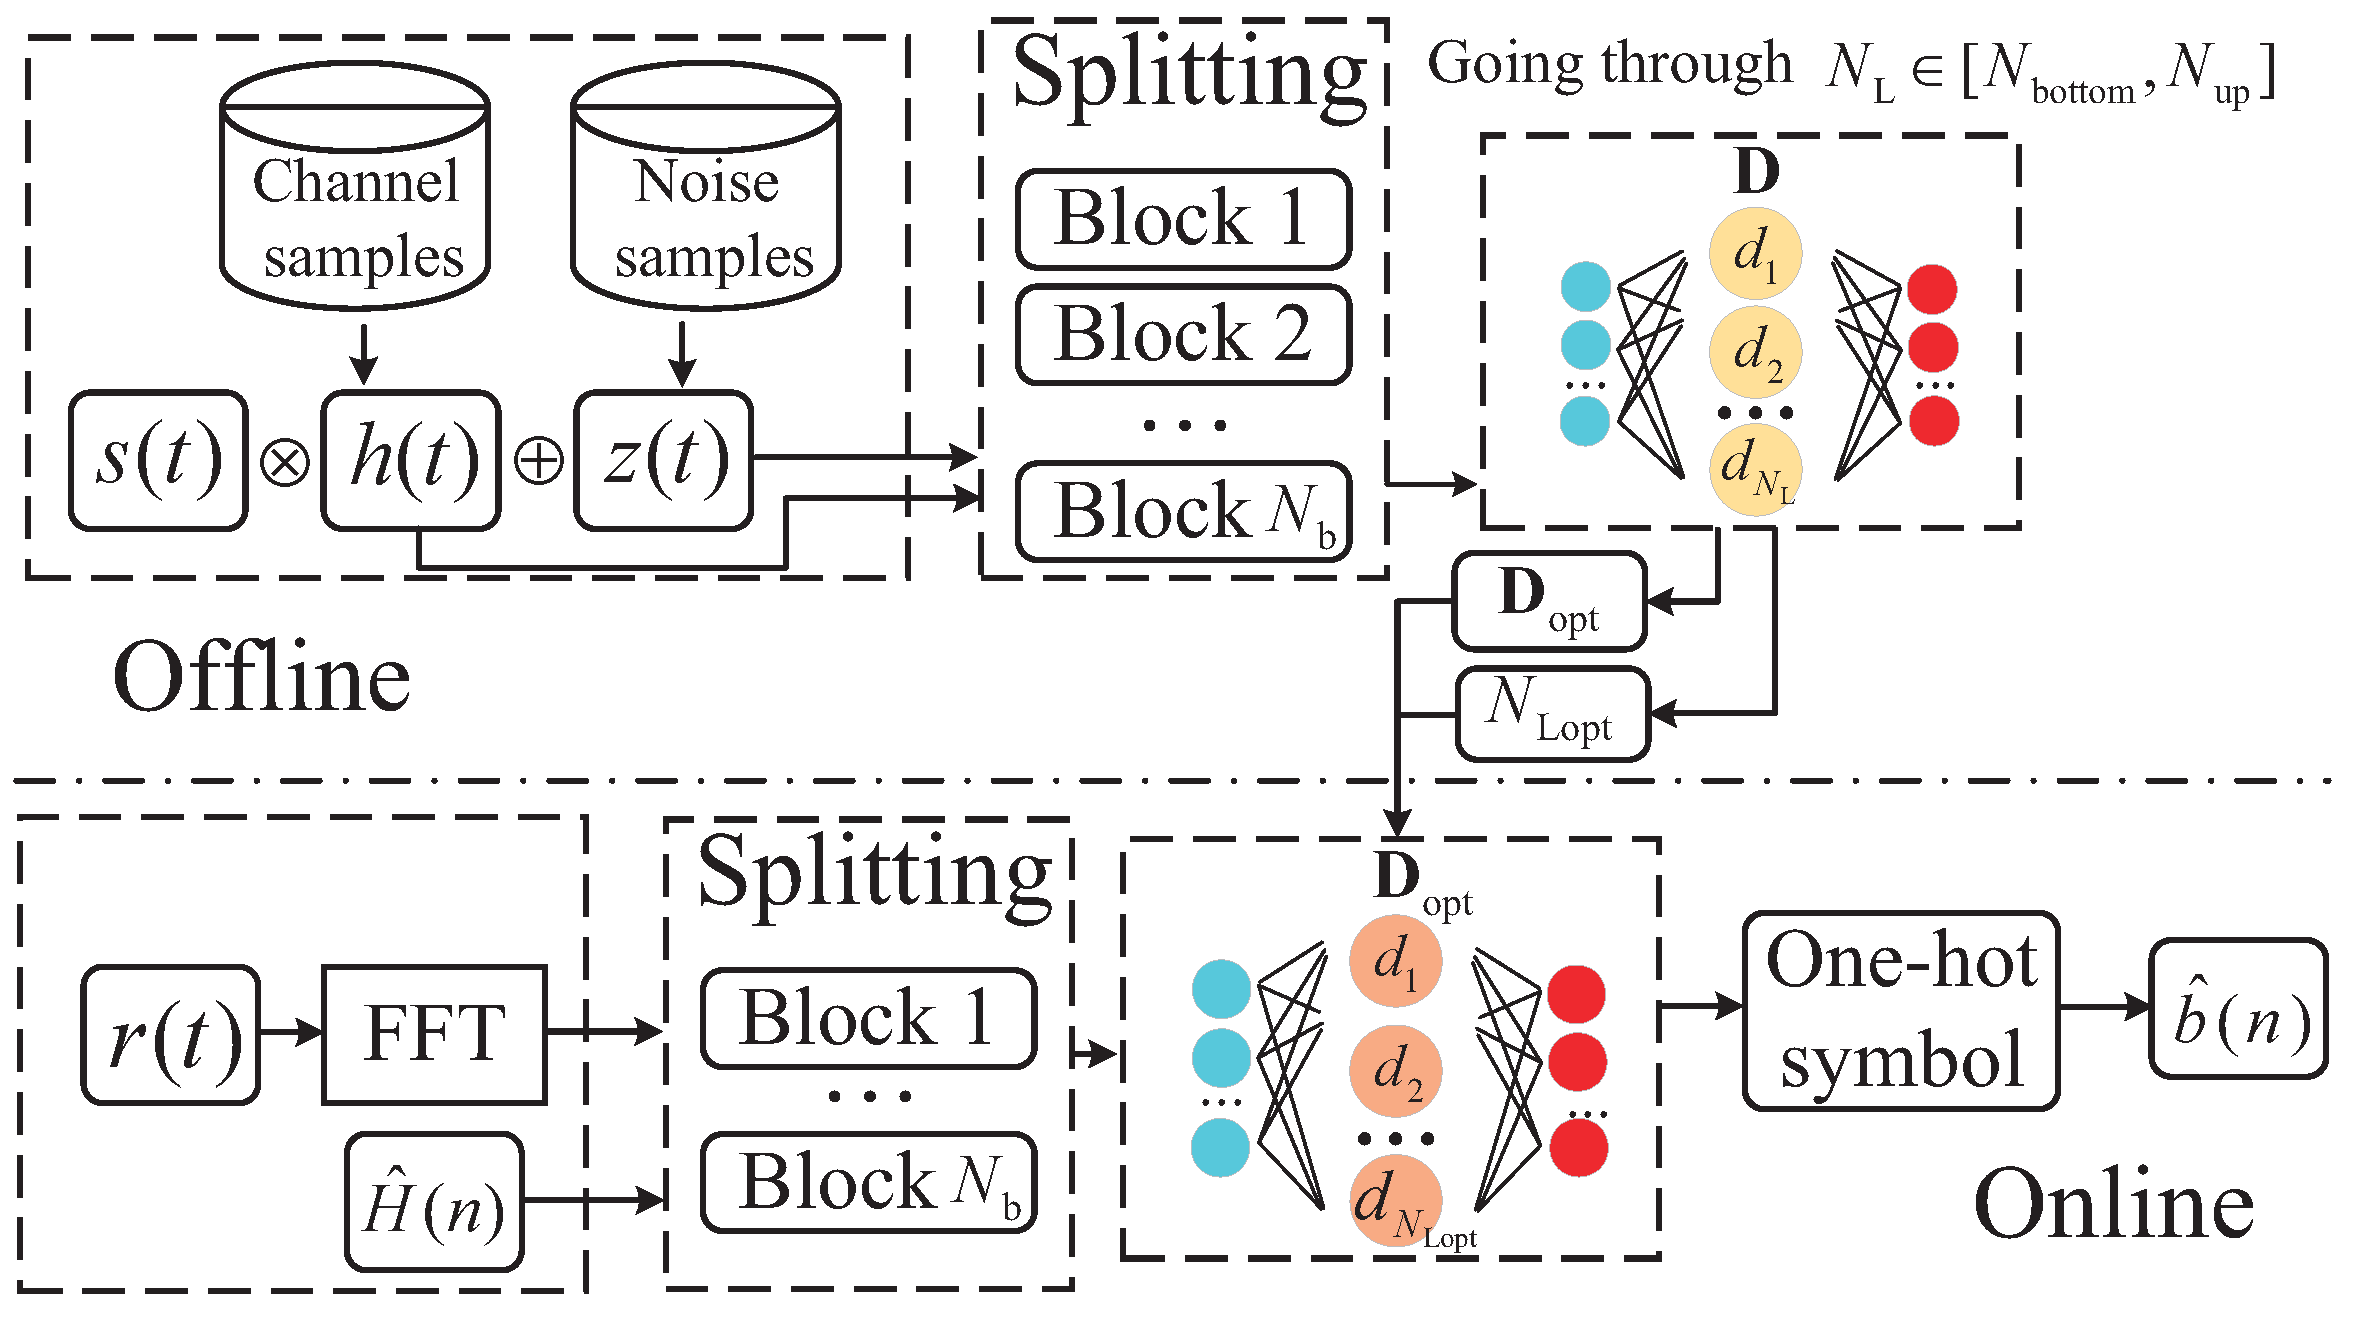
4. NN-Based Joint Equalization and Detection

Unlike the frequency domain equalizers mentioned above, this paper combines equalization and symbol detection and implements a joint detector with the NN. The detected symbol can be written as
S d ( n ) = arg min D H ^ ( n ) , R ( n ) L D H ^ ( n ) , R ( n ) , S ( n ) ,
where L · is the loss function and D [ · ] represents the process of the proposed network.
It has been proved that a simple network structure is enough to well solve the receiver problems [33,42]. Inspired by this, the proposed joint detector utilizes a single-layered network. As shown in Figure 4, after channel estimation, R ( n ) and H ( n ) are sent to the network for detection. Moreover, a block-input strategy is proposed to further decrease the complexity of the network. N b is the number of blocks and N L denotes the number of neurons. The structure configurations of the network are described as follows.
Input: Before input to the network, the received OFDM symbol R ( n ) with N subcarriers is firstly divided into N b blocks. Each block contains N c subcarriers. The same process is conducted with the corresponding estimated channel function H ^ ( n ) . Thus, a small reusable network can be designed for each combination of the data and channel block. To further determine the optimal hyperparameters, a proper N c should be defined to balance the computation and accuracy of the network, i.e., two rules are proposed:
(1)
N c should optimize the performance of the joint detector with estimated channel.
(2)
The required number of neurons is positively correlated to the input dimension, and N c should be as small as possible to minimize the computation of the network.
Based on the analysis above, the narrow coherence bandwidth W c of the channel is considered, which always limits the performance of the underwater OFDM system. Because the subcarriers in each coherence frequency band suffer from relatively flat fading, an opportunity is found to find the optimal N c [43]. By setting N c in the range of coherence bandwidth, the joint detection network is able to deal with the symbol blocks separately in a flat fading channel. 
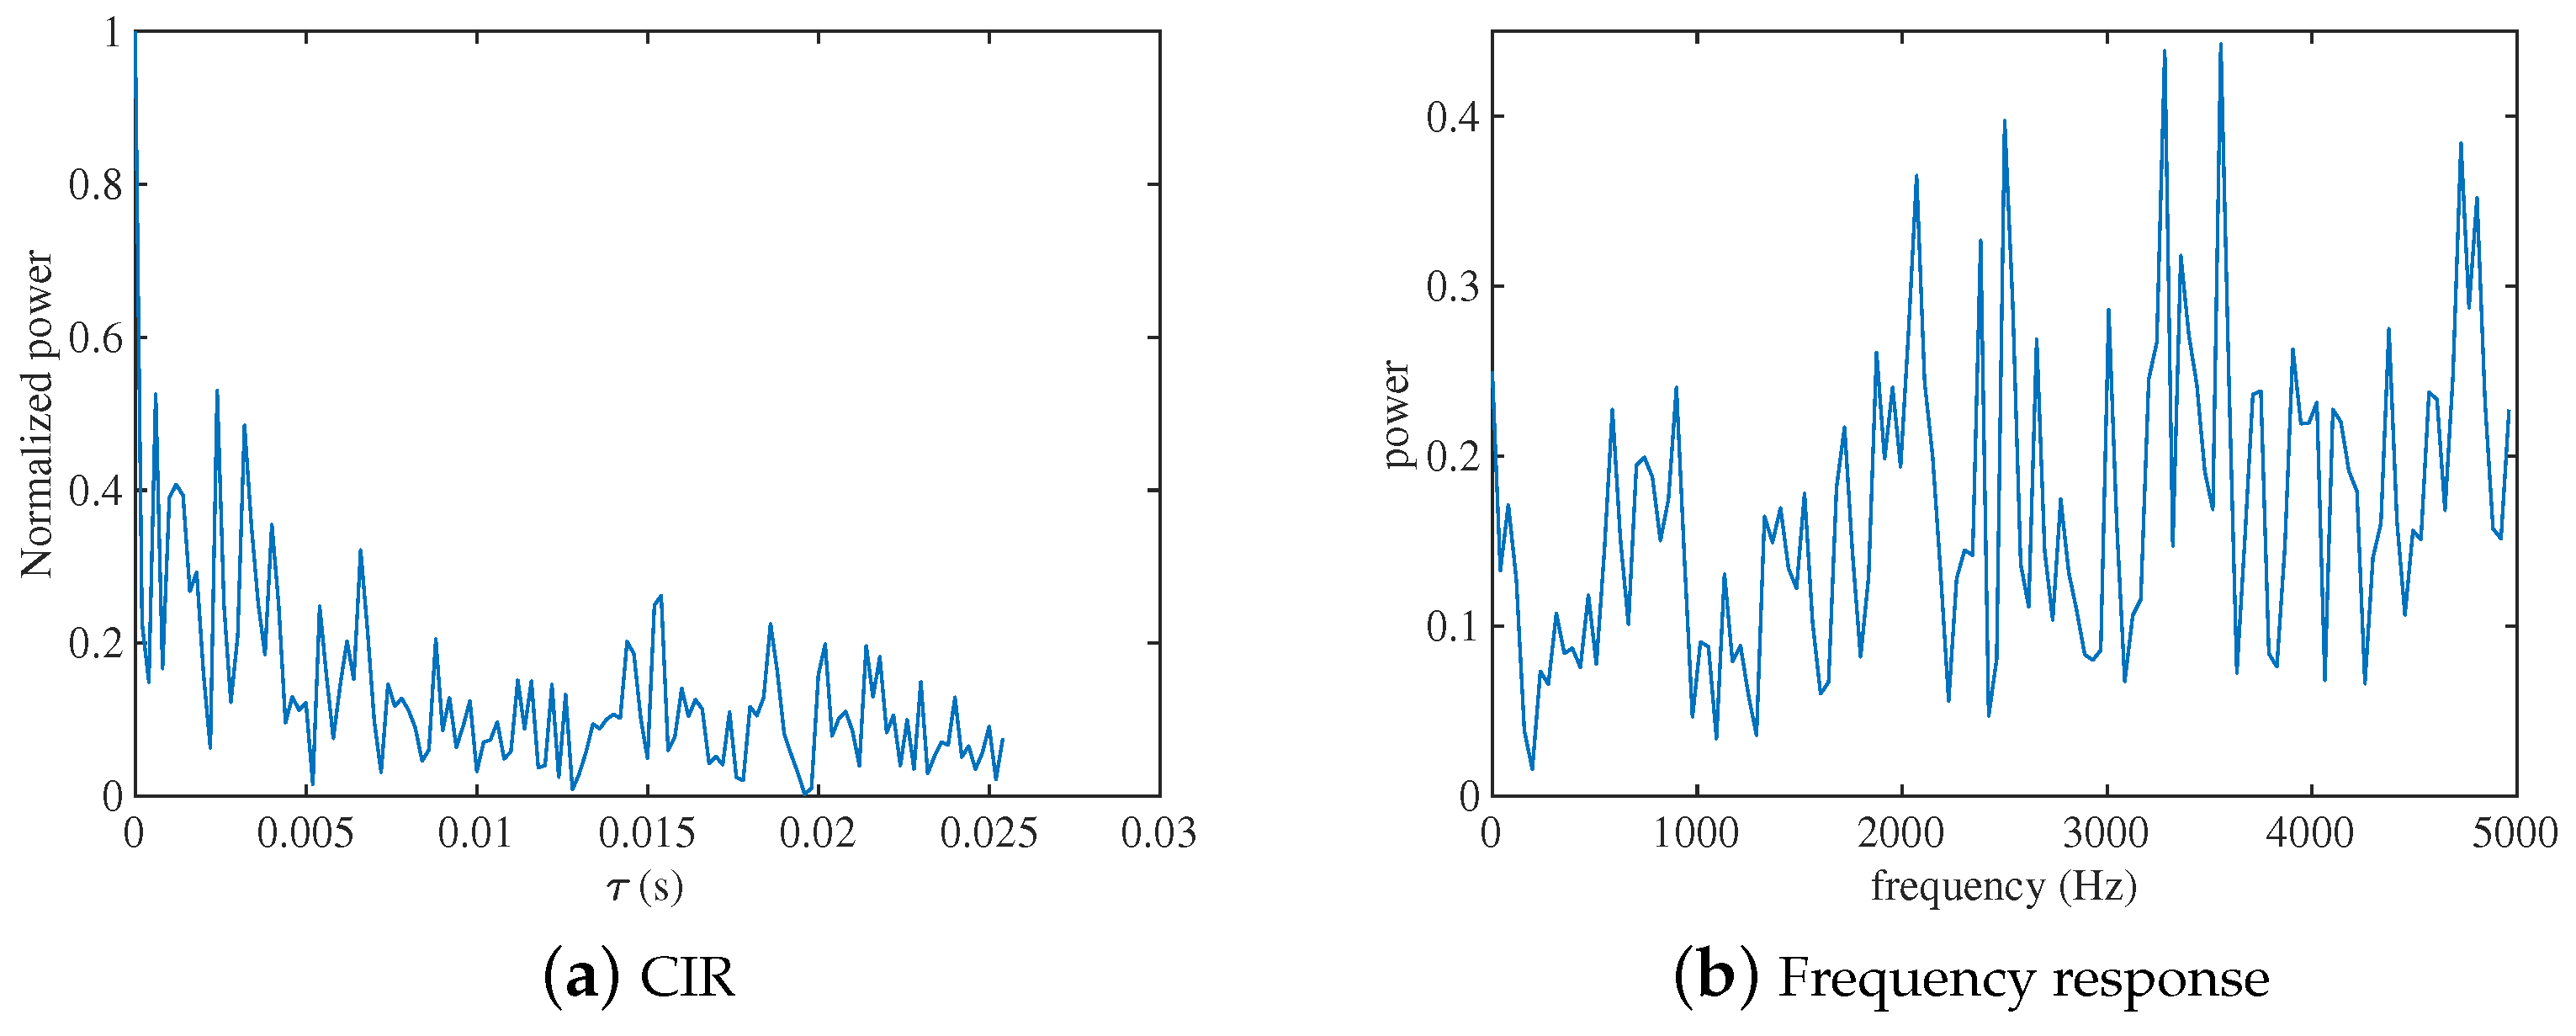
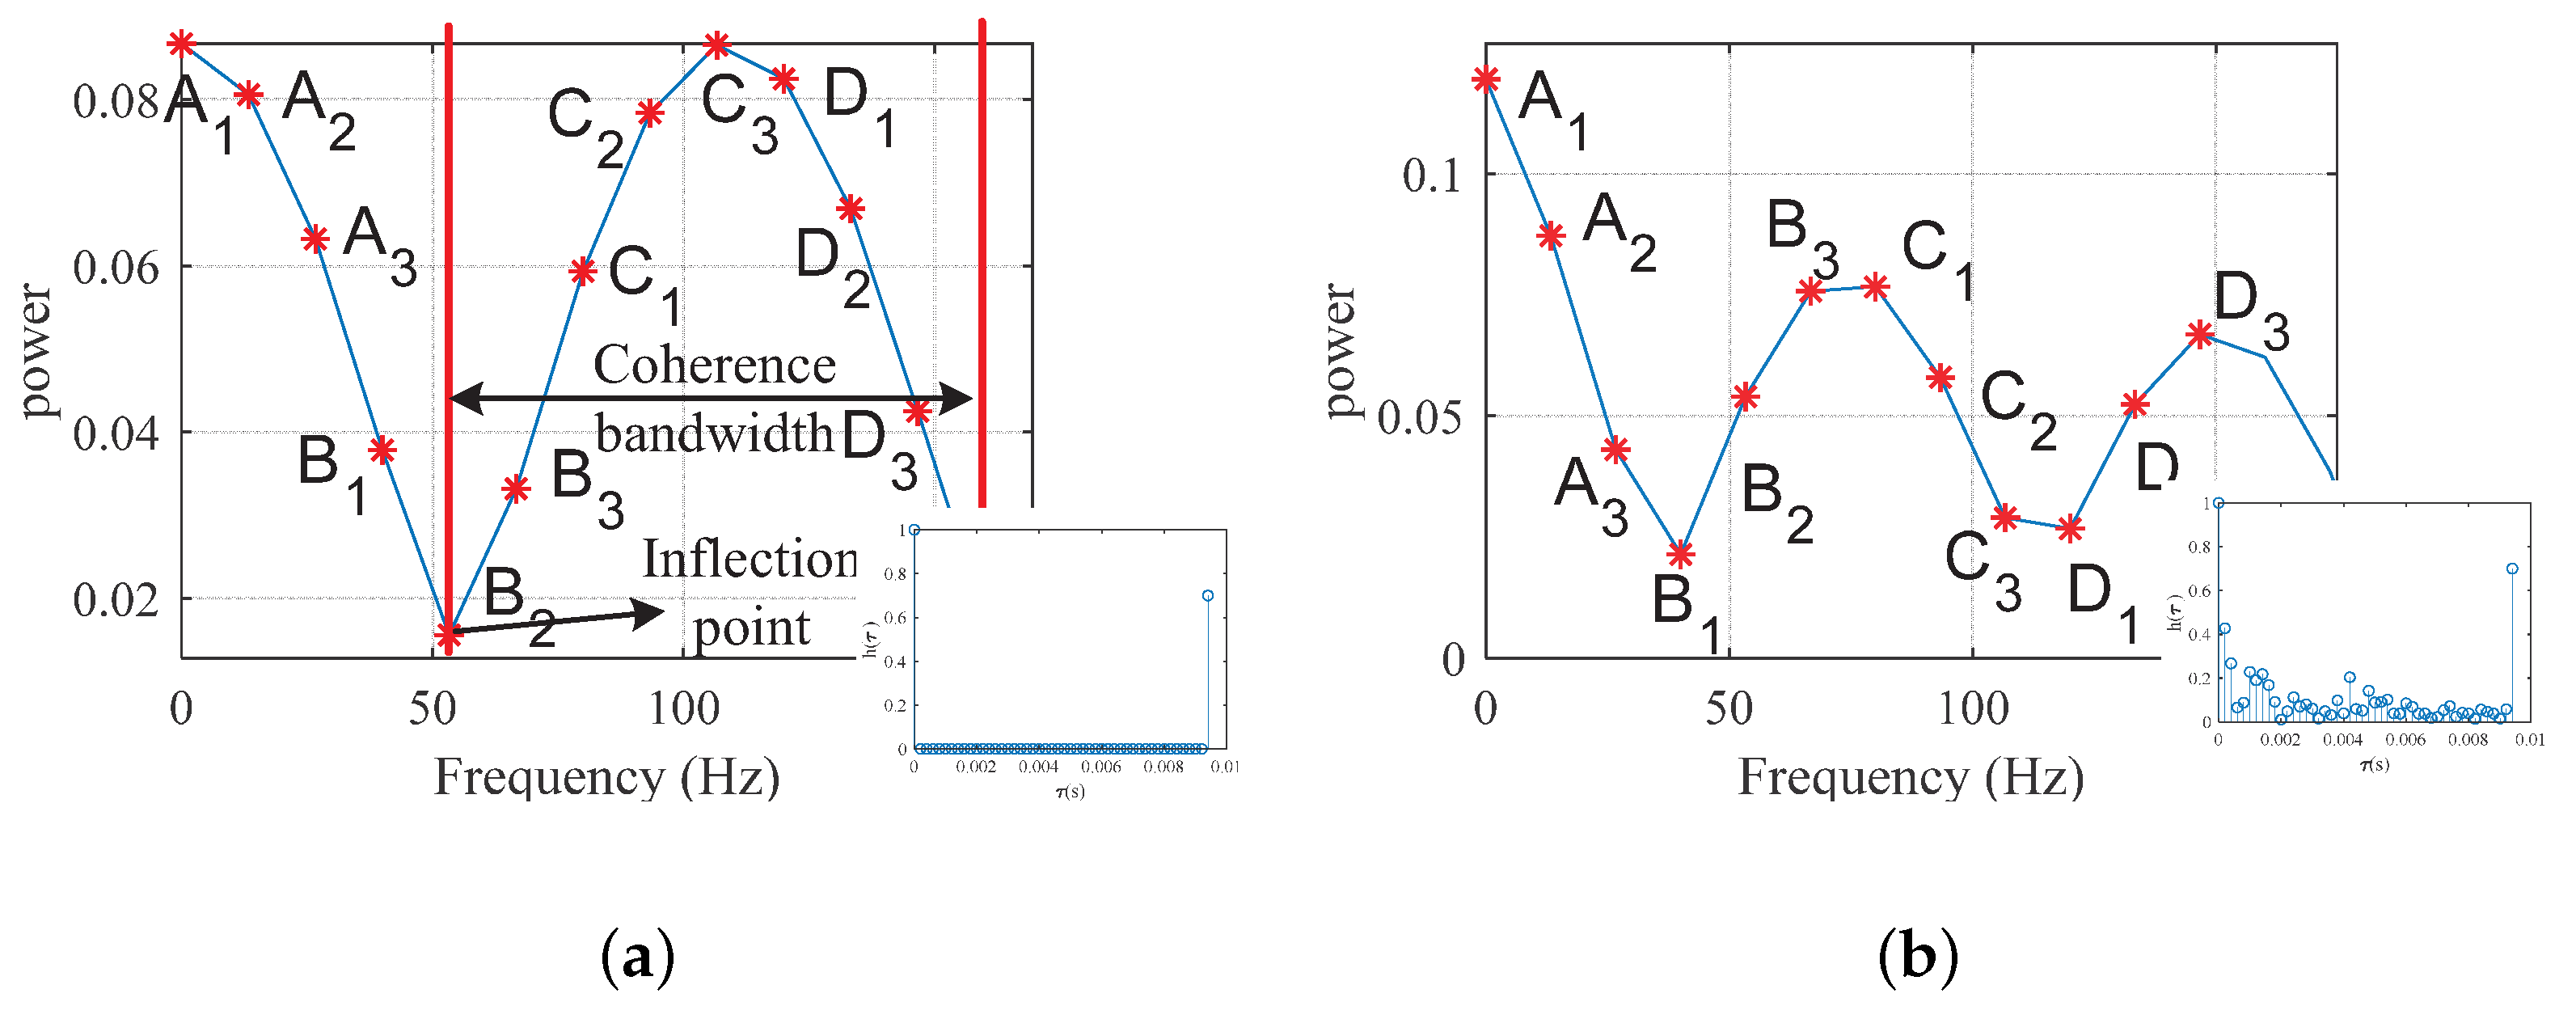
Figure 5a shows the frequency response of a simple channel with one path. A 1 to D 3 are values of the frequency points. According to [43], for a channel that follows the homogeneous assumption, the coherence bandwidth is inversely proportional to the maximum channel delay T d , which can be approximately represented as
W c 1 T d .
For the channel in Figure 5a, W c is easily observed as the frequency range between B 2 and D 3 , written as
W c = f D 3 f B 2 .
In practice, the UWA channel contains more paths as shown in Figure 5b, whose frequency response is the sum of more than one paths with time-varying coefficients distributions [39]. With the same estimated W c as Figure 5a, different situations are listed in Table 1 by taking different sections as blocks. It should be noted that the starting point of the first block should always be A 1 , which is also the first subcarrier of an OFDM symbol. When the width of the block W b = W c , block [ A 1 , C 2 ] suffers from selective fading because the section includes inflection points of the frequency response. The same result occurs when W b = W c / 2 because [ B 1 , B 3 ] includes an inflection point. When W b = W c / 3 , no sections include an inflection point or experience flat fading. This consistency of flat fading is more conducive to the symbol detection [44].
According to the discussion above, there is a W b in the range ( 0 , W c ] , which decides the optimal N c , yielding
W b = N c Δ f ,
where Δ f is the frequency interval of two contiguous subcarriers. The NN with input length N c deals with blocks that all suffer from flat fading. Therefore, although the accurate W c is difficult to find, its estimate can be an upper bound for finding the optimal input dimension for the network.
Consequently, the input block size N c can be quickly found by going through the coherence bandwidth of the estimated channel. Algorithm 1 shows the steps to find N c . N w c represents the number of subcarriers contained in the range of the empirical coherence bandwidth. The threshold C T h is used to filter the paths with low power which does not affect the performance of the system. I Th contains the indexes of the recognizable paths. BER ( · ) represents the process to calculate the BER. Because there is only one optimal N c for each W c that varies slowly in a short duration in fixed locations, steps 7 to 13 can be conducted independently with offline training.
Algorithm 1 Finding the optimal input block length according to the estimated channel
  • Require: The estimated channel response H ( n ) ;
  • Ensure: Power threshold C T h , Bandwidth of an OFDM symbol W, Training symbol matrix { S t , Channel matrix H t , b t } , N, P b = 0.5 ;
    1:
    h ( n ) = IFFT H ( n ) ;
    2:
    h Th , I Th = find ( h ( n ) > C Th ) ;
    3:
    T d = max ( I Th ) ;
    4:
    W c = 1 / T d ;
    5:
    N w c = N W c / W ;
    6:
    N c = N w c ;
    7:
    While N c 1
    8:
    b tn = D S t with N c as block length;
    9:
    P bn = BER ( b tn , b n ) ;
    10:
    if P bn < P b
    11:
    P b = P bn ;
    12:
    end if
    13:
    N c = N c 1 ;
    14:
    return  N c ;
After N c is decided, the input matrix is the combination of the symbol block and channel block. To input these complex symbols and channels to the real-value NN, the real and imaginary parts of the symbol and channel blocks are extracted and rearranged, which can be written as
X = Re { R b 1 ( 1 ) } Im { R b 1 ( 1 ) } . . . Re { R b B ( 1 ) } Im { R b B ( 1 ) } . . . Re { R b 1 ( N c ) } Im { R b 1 ( N c ) } Re { R b B ( N c ) } Im { R b B ( N c ) } Re { H b 1 ( 1 ) } Im { H b 1 ( 1 ) } . . . Re { H b B ( 1 ) } Im { H b B ( 1 ) } . . . Re { H b 1 ( N c ) } Im { H b 1 ( N c ) } Re { H b B ( N c ) } Im { H b B ( N c ) } = R b ri ( i ) H ^ b ri ( i ) ,
where R b k ( n ) and H b k ( n ) are the n-th received symbol block and estimated channel block of k-th training batch. B is the batch size. Since H ( n ) is input directly, the network does not need to learn the changing channel characteristics [25]. Instead, a generative analytical process can be learned to be adaptive to any kind of channel.
Network configurations: As Figure 4 shows, the single-layered network proposed in this paper contains a fully connected layer with N L neurons. To detect a symbol block, the input firstly multiples a weight vector W L , then adds bias vectors B L , yielding
Y m = g ( X H W L + B L ) ,
where g ( · ) is the activation function. To transform Y m to the output with required length, another linear map is built:
Y = Y m H W out + B out ,
where W out and B out are weights and bias of the output layer. Y contains N c symbols, which are further input with the one-hot format reference symbols to calculate the cross entropy as the loss function, yielding
L D = i B j M S i j o n e h o t ( n ) log softmax Y i j s ( n ) ,
where S i j o n e h o t ( n ) and Y i j s ( n ) are the one-hot reference symbol and the corresponding output data. M is the modulation order; softmax · is a function to map Y i j s ( n ) to the range ( 0 , 1 ) [28]. The use of cross entropy can make the network converge quickly.
Training strategy: For each N c , there are two tasks for the network. One is to find the optimal N L and another is to train the parameter matrix D . Both tasks can be finished offline with one training. Figure 6 shows the training strategy of the network. The samples are constructed with three parts: random data symbols, different types of channels and noise. The channel samples contains Rayleigh distributed ones and underwater acoustic channels collected in the pool, artificial lake, and Wuyuanwan Bay, Xiamen, while the noise includes Gaussian distributed noise and impulsive noise generated by the GAN in [41].
The network for the given input dimension is trained with the range [ N bottom , N up ] processed with a step to find the optimal number of neurons N Lopt . N bottom and N up are lower and upper bound of the possible N Lopt , respectively. Meanwhile, the optimal weight matrix D opt trained with N Lopt is memorized. Then both D opt and N L are delivered to the online network to detect the real received symbols.
Online applications: Unlike the NN-based detector, which takes the only the received symbol as the input, the estimated channel is included in the input in the proposed detector. This configuration offers more information for the network to detect symbols, determining a low-complexity semi-analytical detection network, which is generalized to different channels. Therefore, the final goal of this study was to train the networks which could be independently applied online without retraining. The simulations and experiments are described and discussed below to demonstrate the performance of the proposed structure.

5. Complexity Analysis

To analyze the time-complexity of the proposed NN-based detector, it should be firstly noted that in the following simulations and sea trials, the networks were all trained once in advance and were not retrained online. All parameters of the networks was fixed when conducting simulations and experiments. Thus the large batch size of the dataset was not included in the computation. Hence, only N L and N were considered. The computations of both the LS estimator and minimum distance detector were included for the calculation of complexity of other equalizers. Consider the following LS channel estimator
h ^ ( t ) = r ( t ) s ( t ) .
The number of multiply-accumulate operations (MACC) of the above process is the number of subcarriers N. For the minimum distance detector, each symbol experiences M times of complex operations, which contains 3 M N + 5 N MACC.
As a similar implementation of the NN-based equalizer, the ELM-based detector in [34] was considered for performance comparisons. According to [34], the number of MACC of the ELM-based detector was derived and listed in Table 2. Ignoring the addition with constant terms, the time complexities of different detectors are compared in Table 2. It can be seen that the computation of the proposed NN-based detectors is less than that of MMSE for 1 order of magnitude. The complexity of the ELM-based detector is the highest, which is 2 orders of magnitude larger than the proposed NN-based detector. Although the ZF equalizer shows the lowest complexity, it has been proved to be a suboptimal algorithm in noisy channels, which could be substituted by more advanced methods.

6. Numerical Simulations

The configurations of the simulated system are listed in Table 3. An OFDM system with the bandwidth 5000 Hz was built. BPSK and QPSK were chosen as the digital modulations. The number of subcarriers, which was 384, should be divisible by N c , whereas several possible N c s were chosen to build the networks.
Before comparing the performance, the network was firstly trained with mixed samples. As mentioned in Section 4, besides Rayleigh channels generated with MATLAB, the real channels collected in the pool, artificial lake, and Wuyuanwan Bay, Xiamen, were taken as samples. All channel samples were mixed randomly in the proportion 1:1:1:1. For Rayleigh channel samples, the maximum CFO was set to 100 Hz. Moreover, 
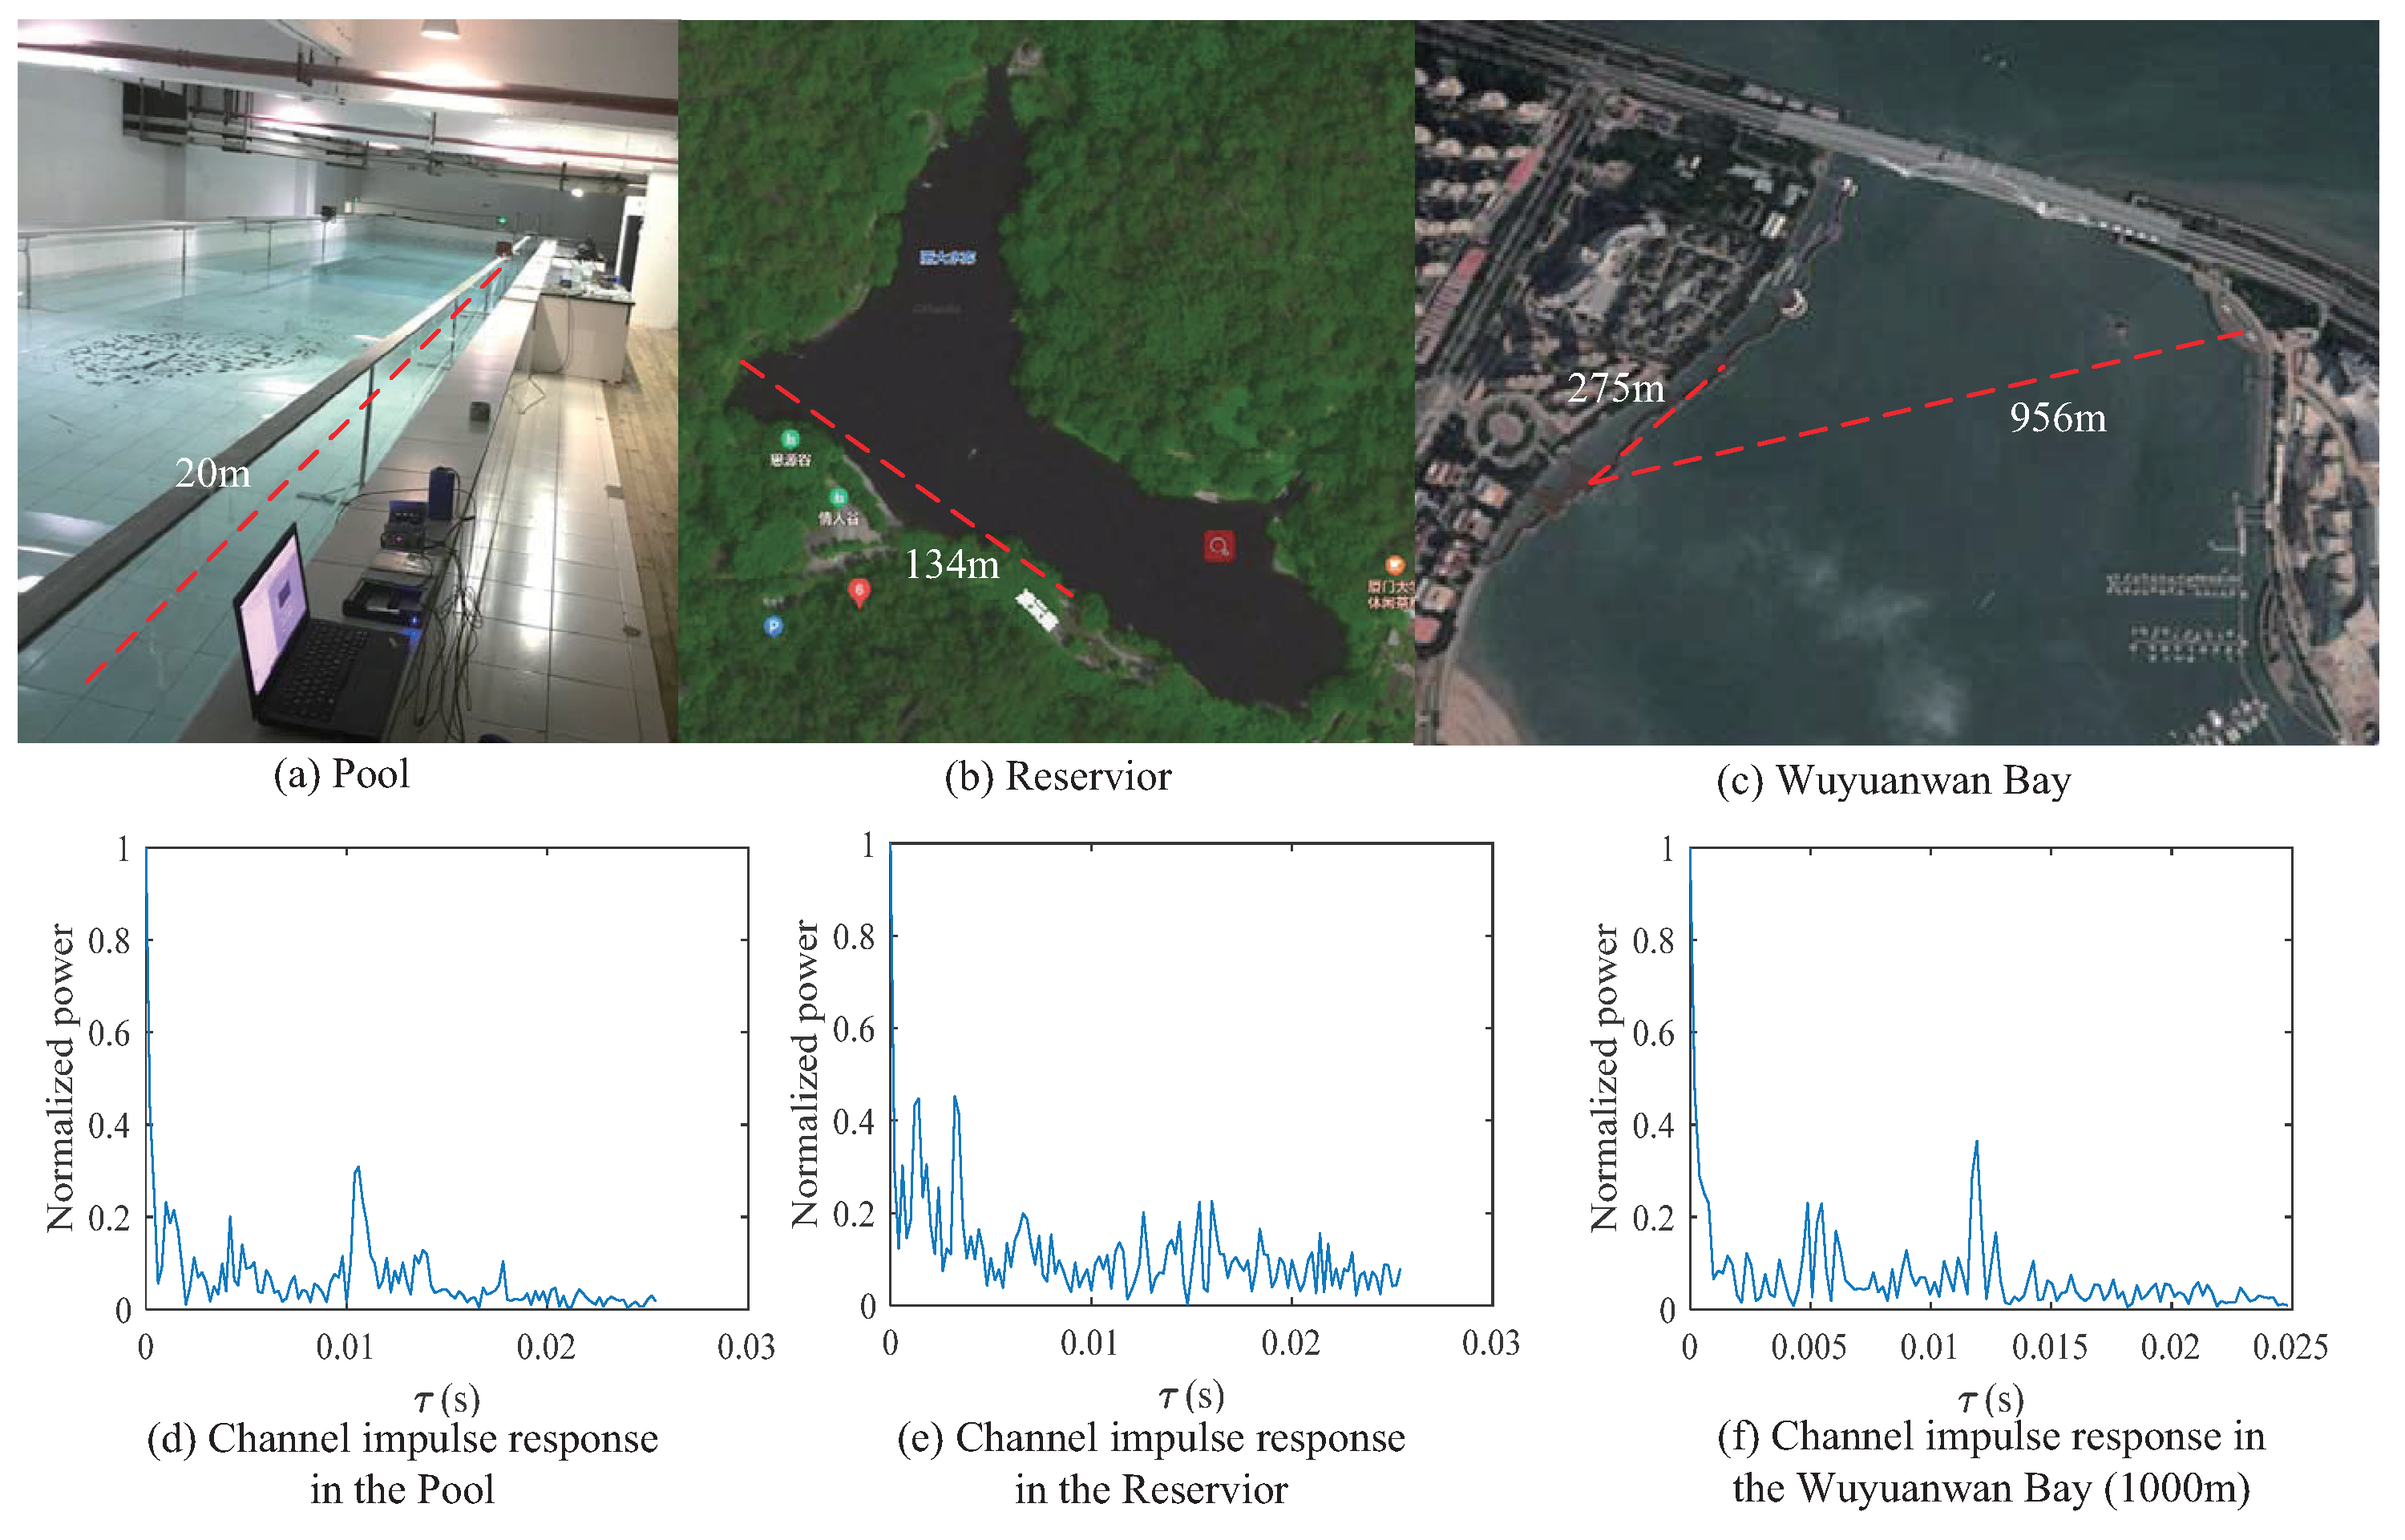
Figure 7a–c shows the real scenarios to collect channels. The average depths of the pool, artificial lake, and testing sea area were 1 m, 5 m, and 8 m, while the depths of the transmitter and the receiver in the three areas were 0.5 m, 0.8 m, and 1.5 m. The only factor which affected the pool channel was the hard wall and bottom made of tiles. In addition, the average wind power in the artificial lake and testing sea area was <level 3. The outdoor tests were all performed in sunny days.
Different distances were covered to obtain different maximum delays shown in Figure 7d–f. Furthermore, the power threshold C Th was set to 0.01 to filter the paths with low power.
Taking mixture of the AWGN and impulsive noise generated with the GAN in [41] as noise samples, the dataset was finally constructed. Table 4 shows the training parameters for the network. The networks were trained with dynamic SNR and mean square errors (MSE) of the estimated channels. To accelerate convergence, ReLU was taken as the activation function, along with the Adam optimizer. The whole training process was conducted in Python with TensorFlow.
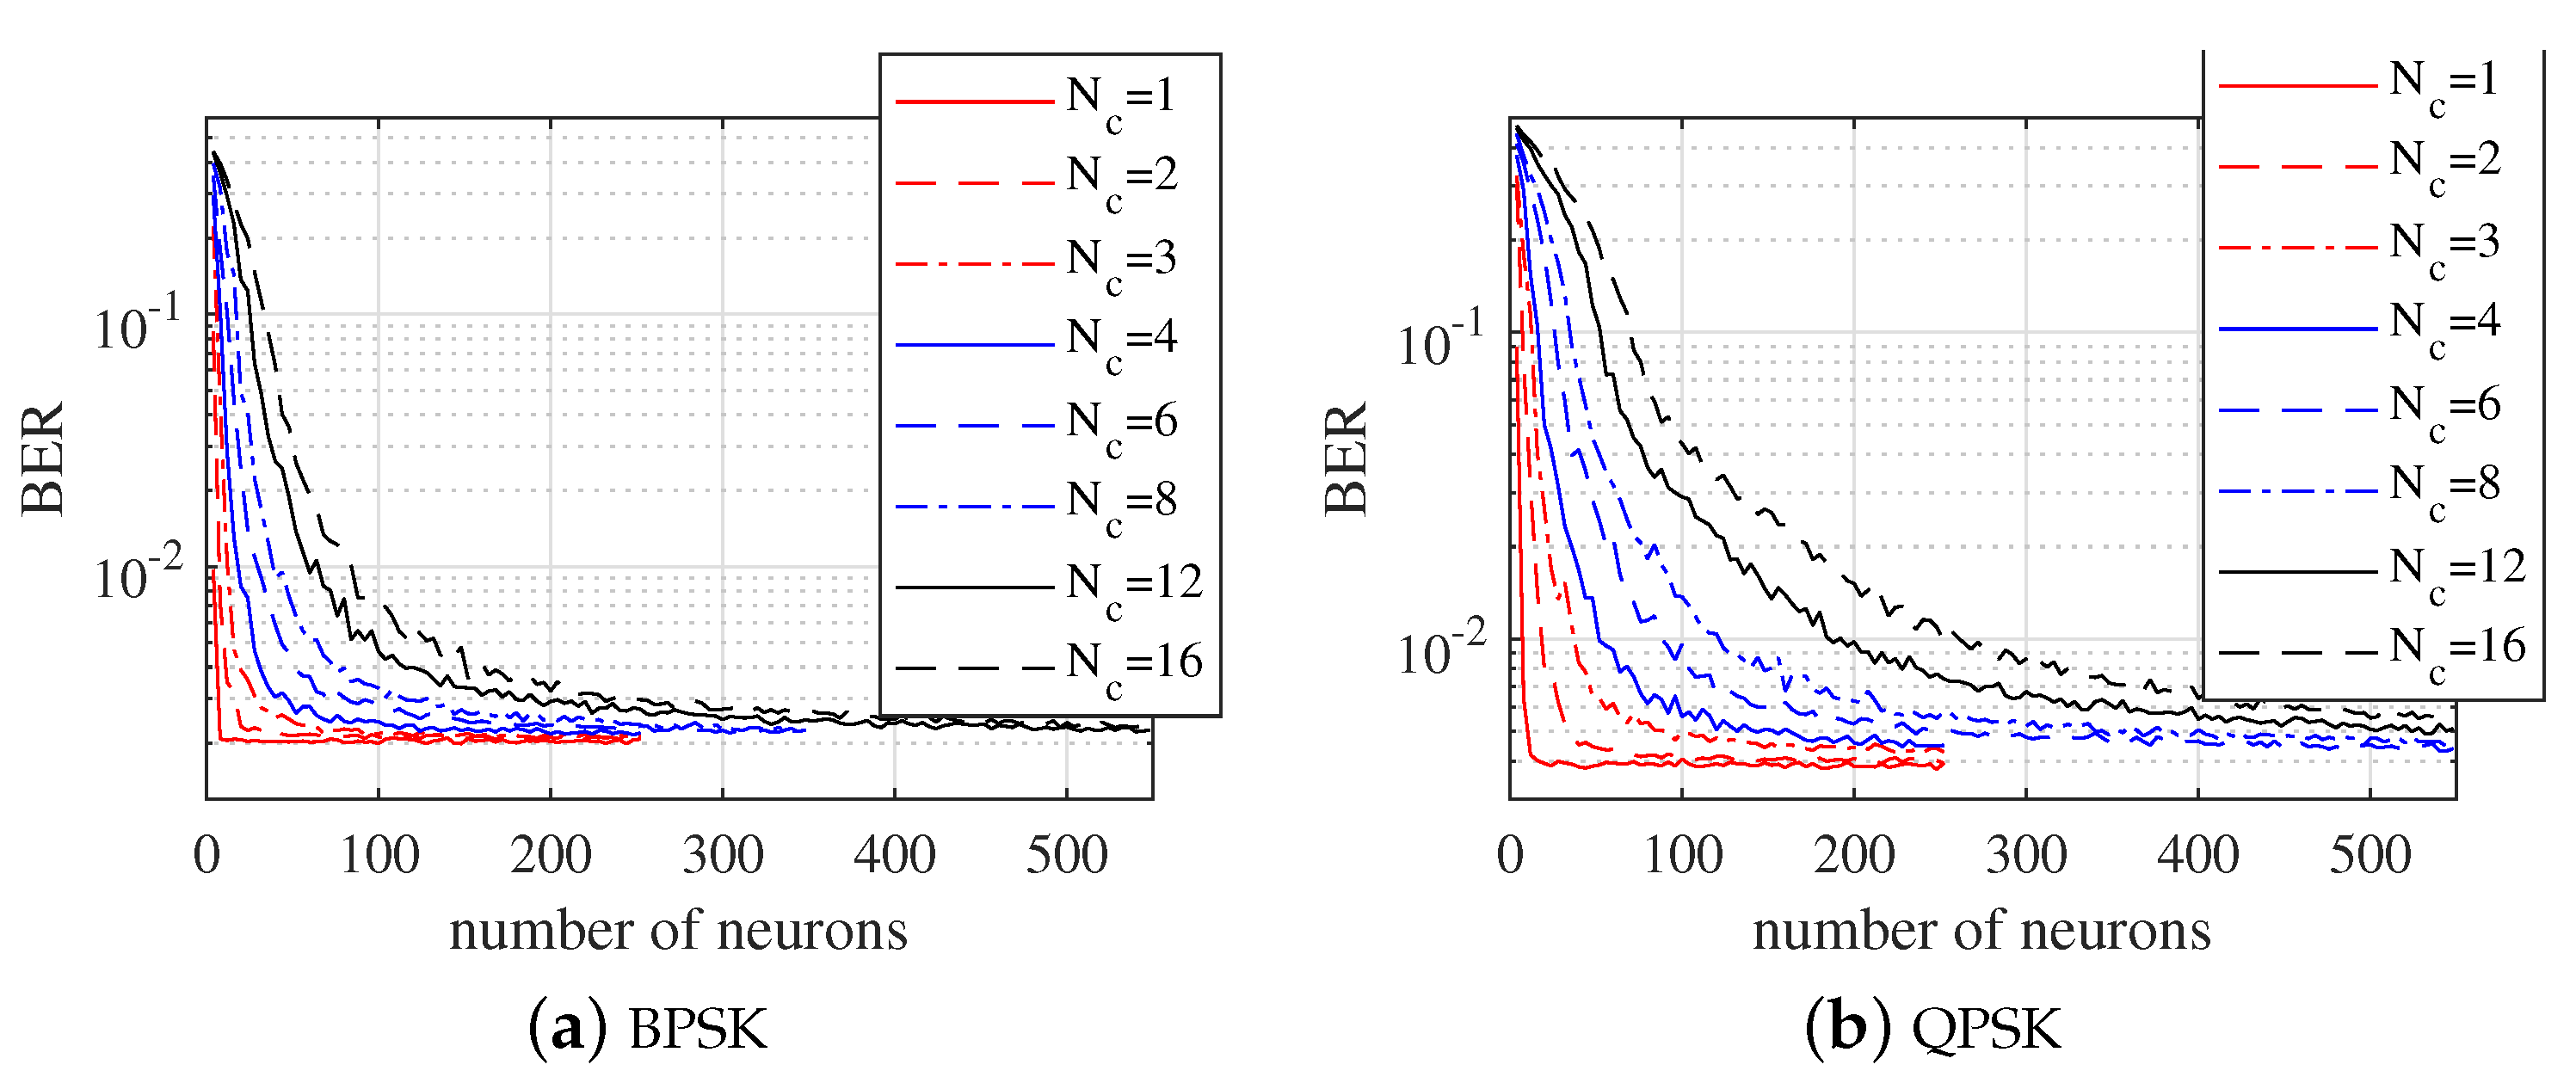
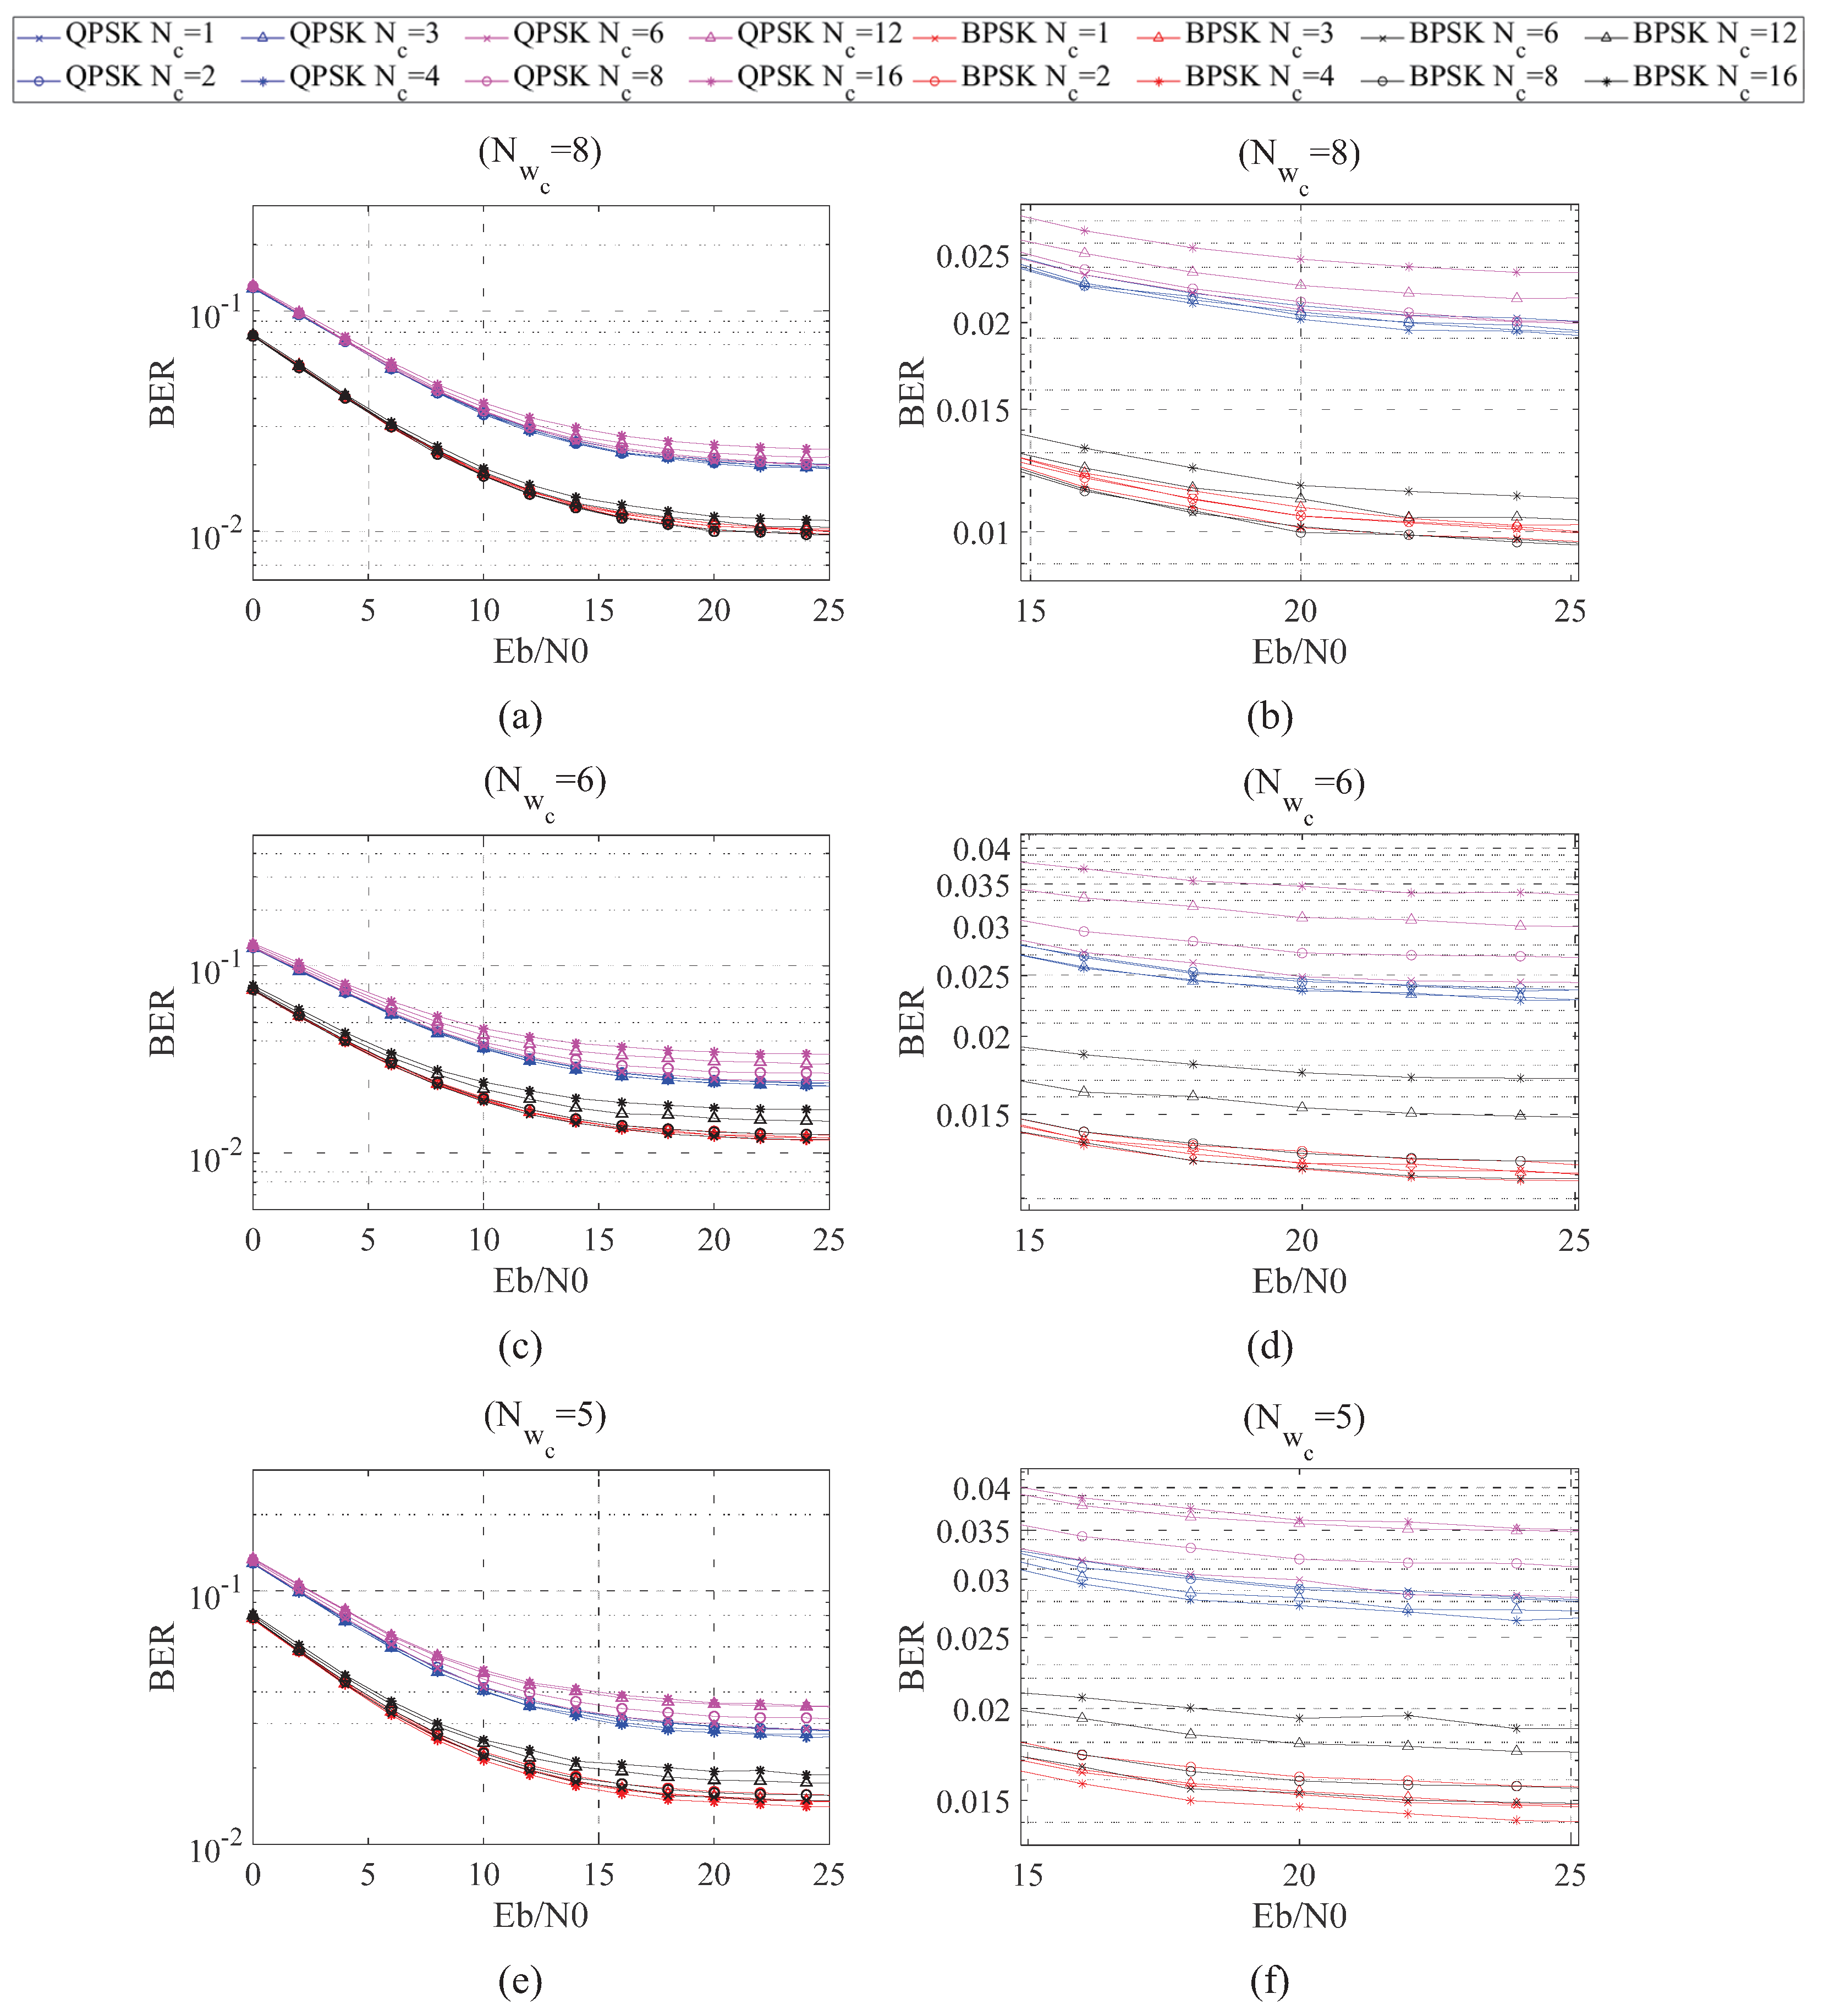
Figure 8 shows the BERs of the given N c changing with N L . The SNR was 25 dB and the assumed MSE of the channel estimated was 0.004. The step size for N L was 4. It can be seen that large input dimensions, such as N c = 12 and N c = 16 , required more neurons to reach the best performance. In addition, N c for QPSK was larger than that of BPSK. To be clear, the estimated N Lopt s from Figure 8 are listed in Table 5. For each N c , QPSK needed at least 20 more neurons than BPSK.
It should be noted that the optimal N c of both modulations in Figure 8 is 1. This is because the training set contained multiple CIRs, including Rayleigh channels, with different delays. In this situation, the coherence bandwidth of the channel samples was limited to a small value. To further demonstrate the influence of the coherence bandwidth, the trained networks were further used to detect the symbol from the channels with specific maximum delays. The pool channels in Figure 7a were cut off with lengths of 48, 64, and 77 points, the corresponding N w c s of which were 8, 6, and 5. Figure 9a–f show the BERs with different N c in BPSK-OFDM and QPSK-OFDM systems. The BER curves of S N R = [ 15 , 25 ] dB are enlarged in Figure 9b,d,f. The MSE of the channels estimated was set to 0.01. It can be seen from the figures that the optimal N c varies with modulation and N w c . According to Algorithm 1, the optimal N c s are listed in Table 6. It can be found that in all situations, the networks with N c > N w c showed poor performance. These results prove the analysis in Section 4, and further demonstrate the feasibility of Algorithm 1.
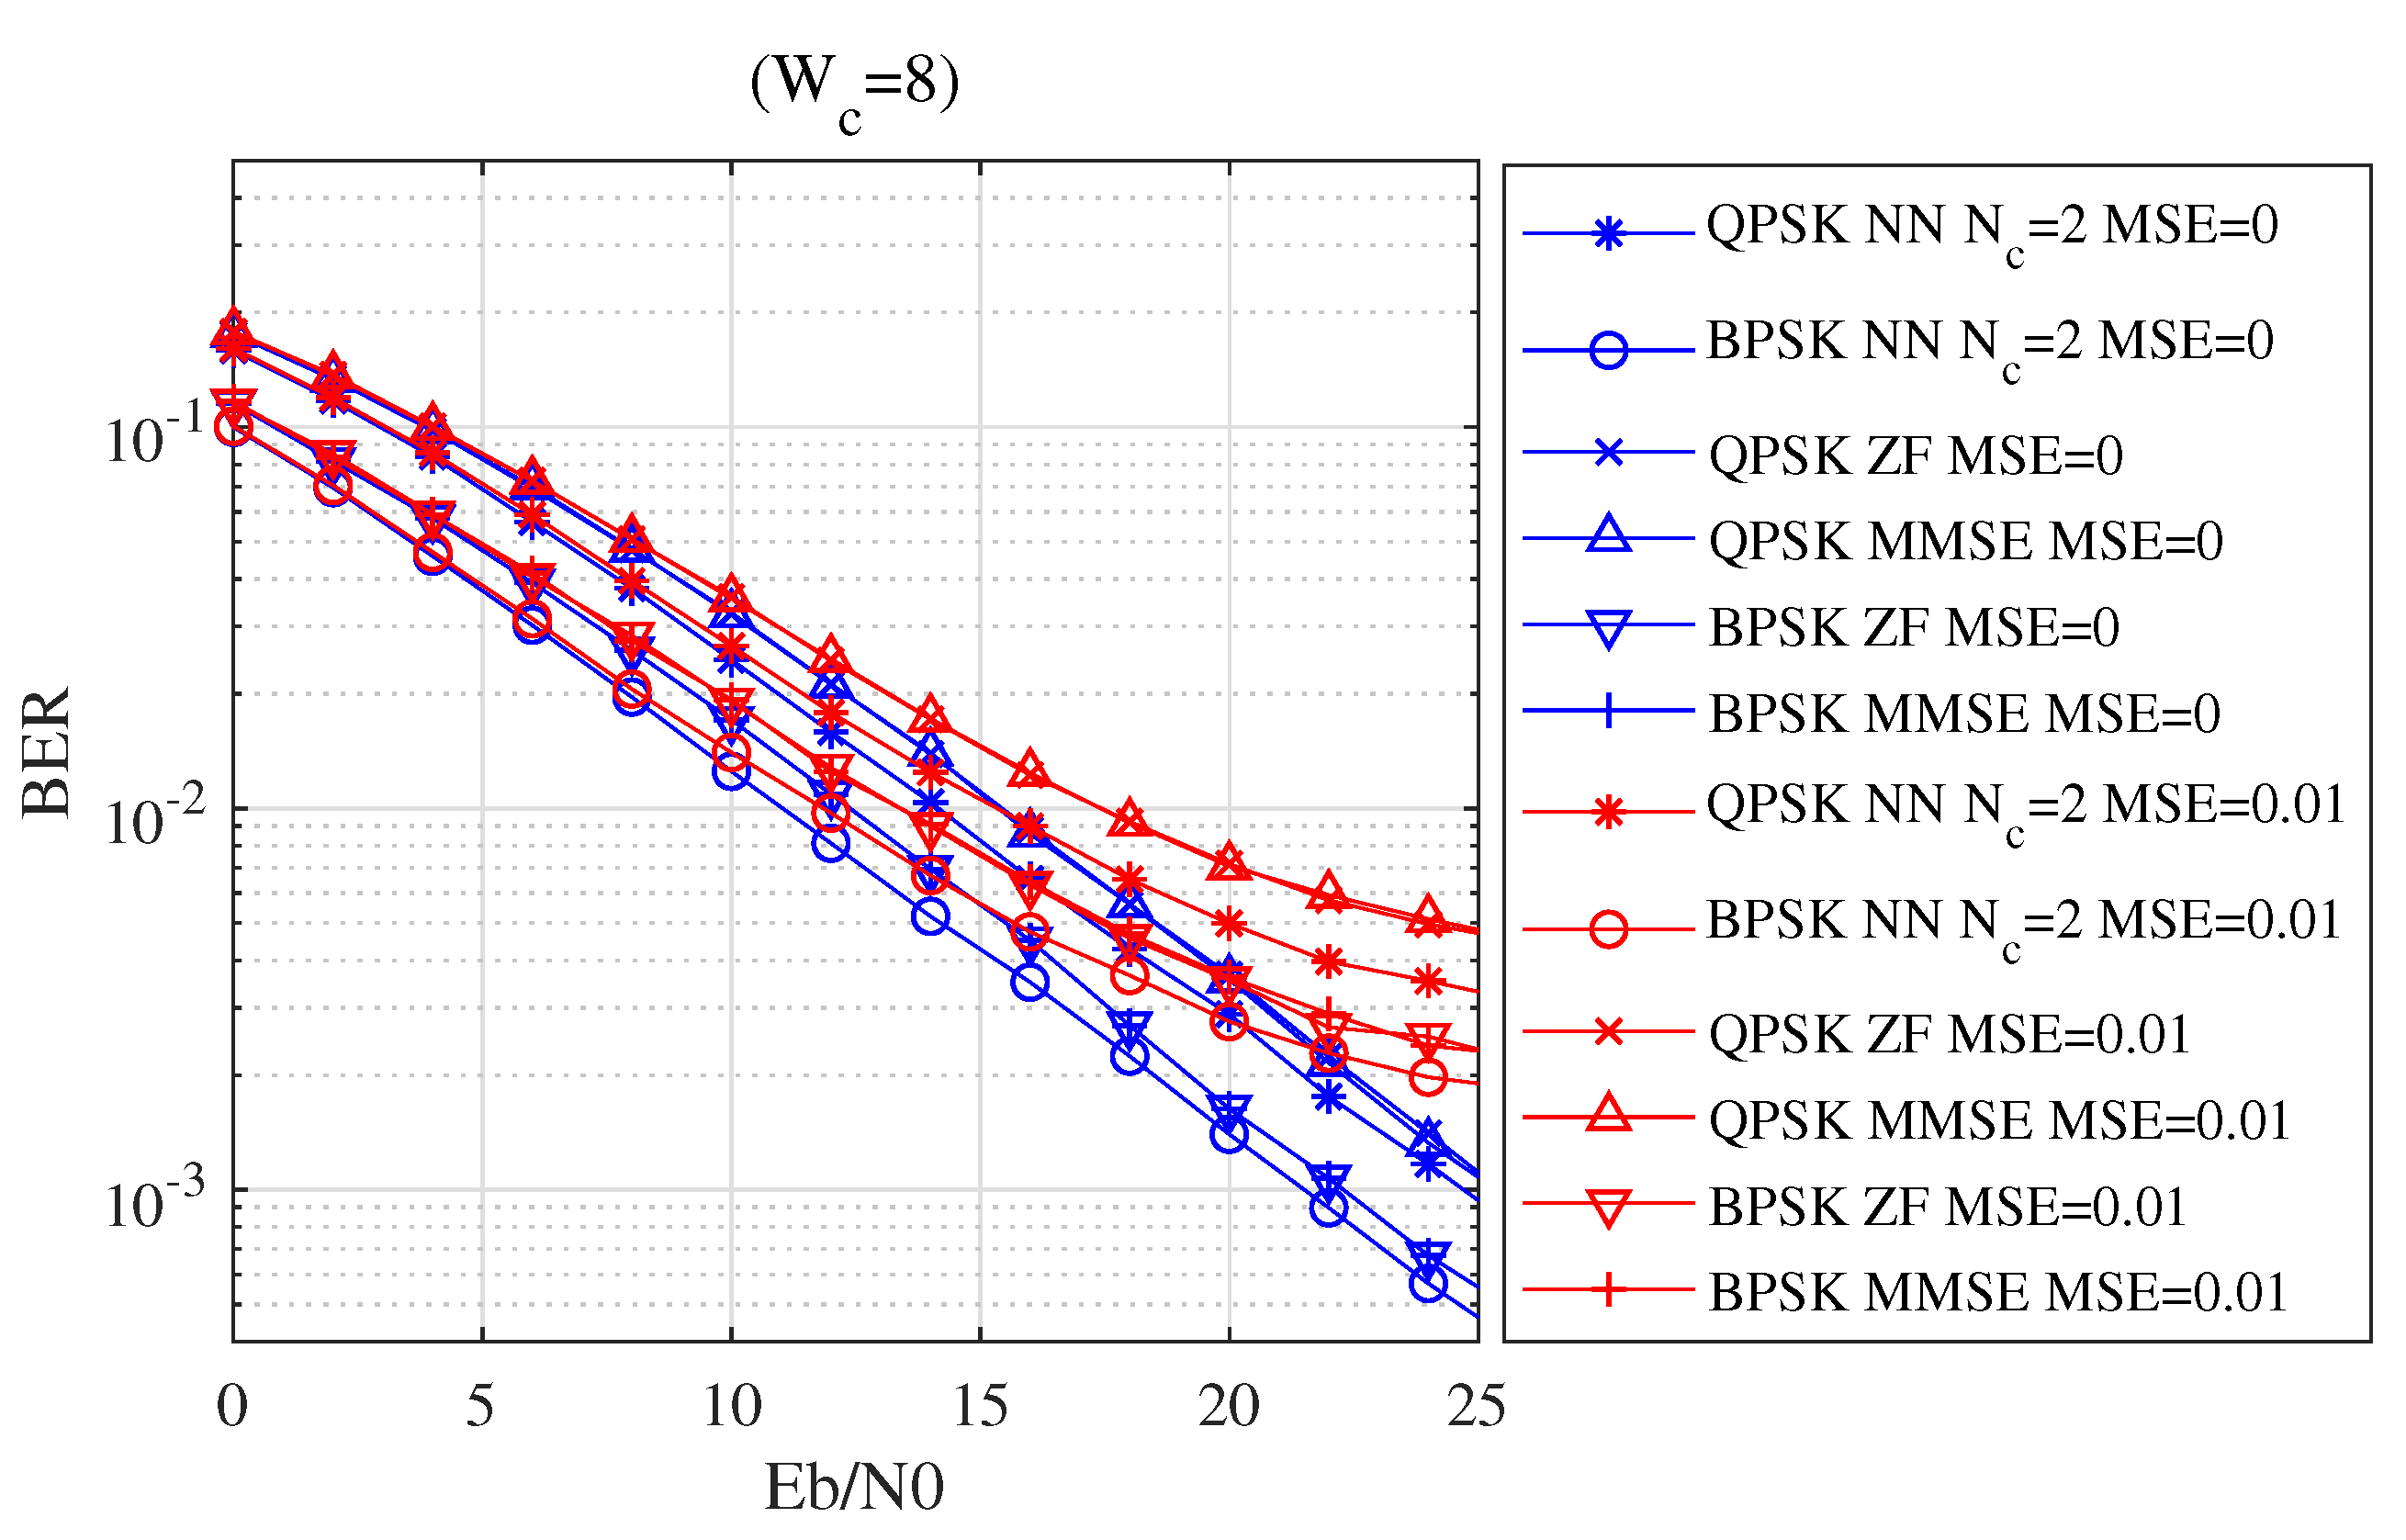
In addition, the networks with optimal N c s were compared with the ZF and MMSE equalizers. The pool channel with N w c = 8 was used. Figure 10 shows the BERs of different equalizers. The proposed network showed lower BERs than the ZF and MMSE equalizers both under perfect channel estimation (MSE = 0) and MSE = 0.01 of the estimated channel. In particular, when SNR = 20 dB and MSE = 0, the BER of QPSK detection network was 18.66 % lower than that of the ZF and MMSE equalizers, while the BER of BPSK detection network was 14.23 % lower than that of the ZF and MMSE equalizers. When SNR = 20 dB and MSE = 0.01, the BER of QPSK detection network was 29.26 % lower than that of the ZF and MMSE equalizers and the BER of BPSK detection network was 22.16 % lower than that of the ZF and MMSE equalizers. In addition, it can be seen from Figure 10 that the BER curve of MMSE equalizer for each estimation error is almost the same as the ZF equalizer, which confirms the discussion in Section 2.
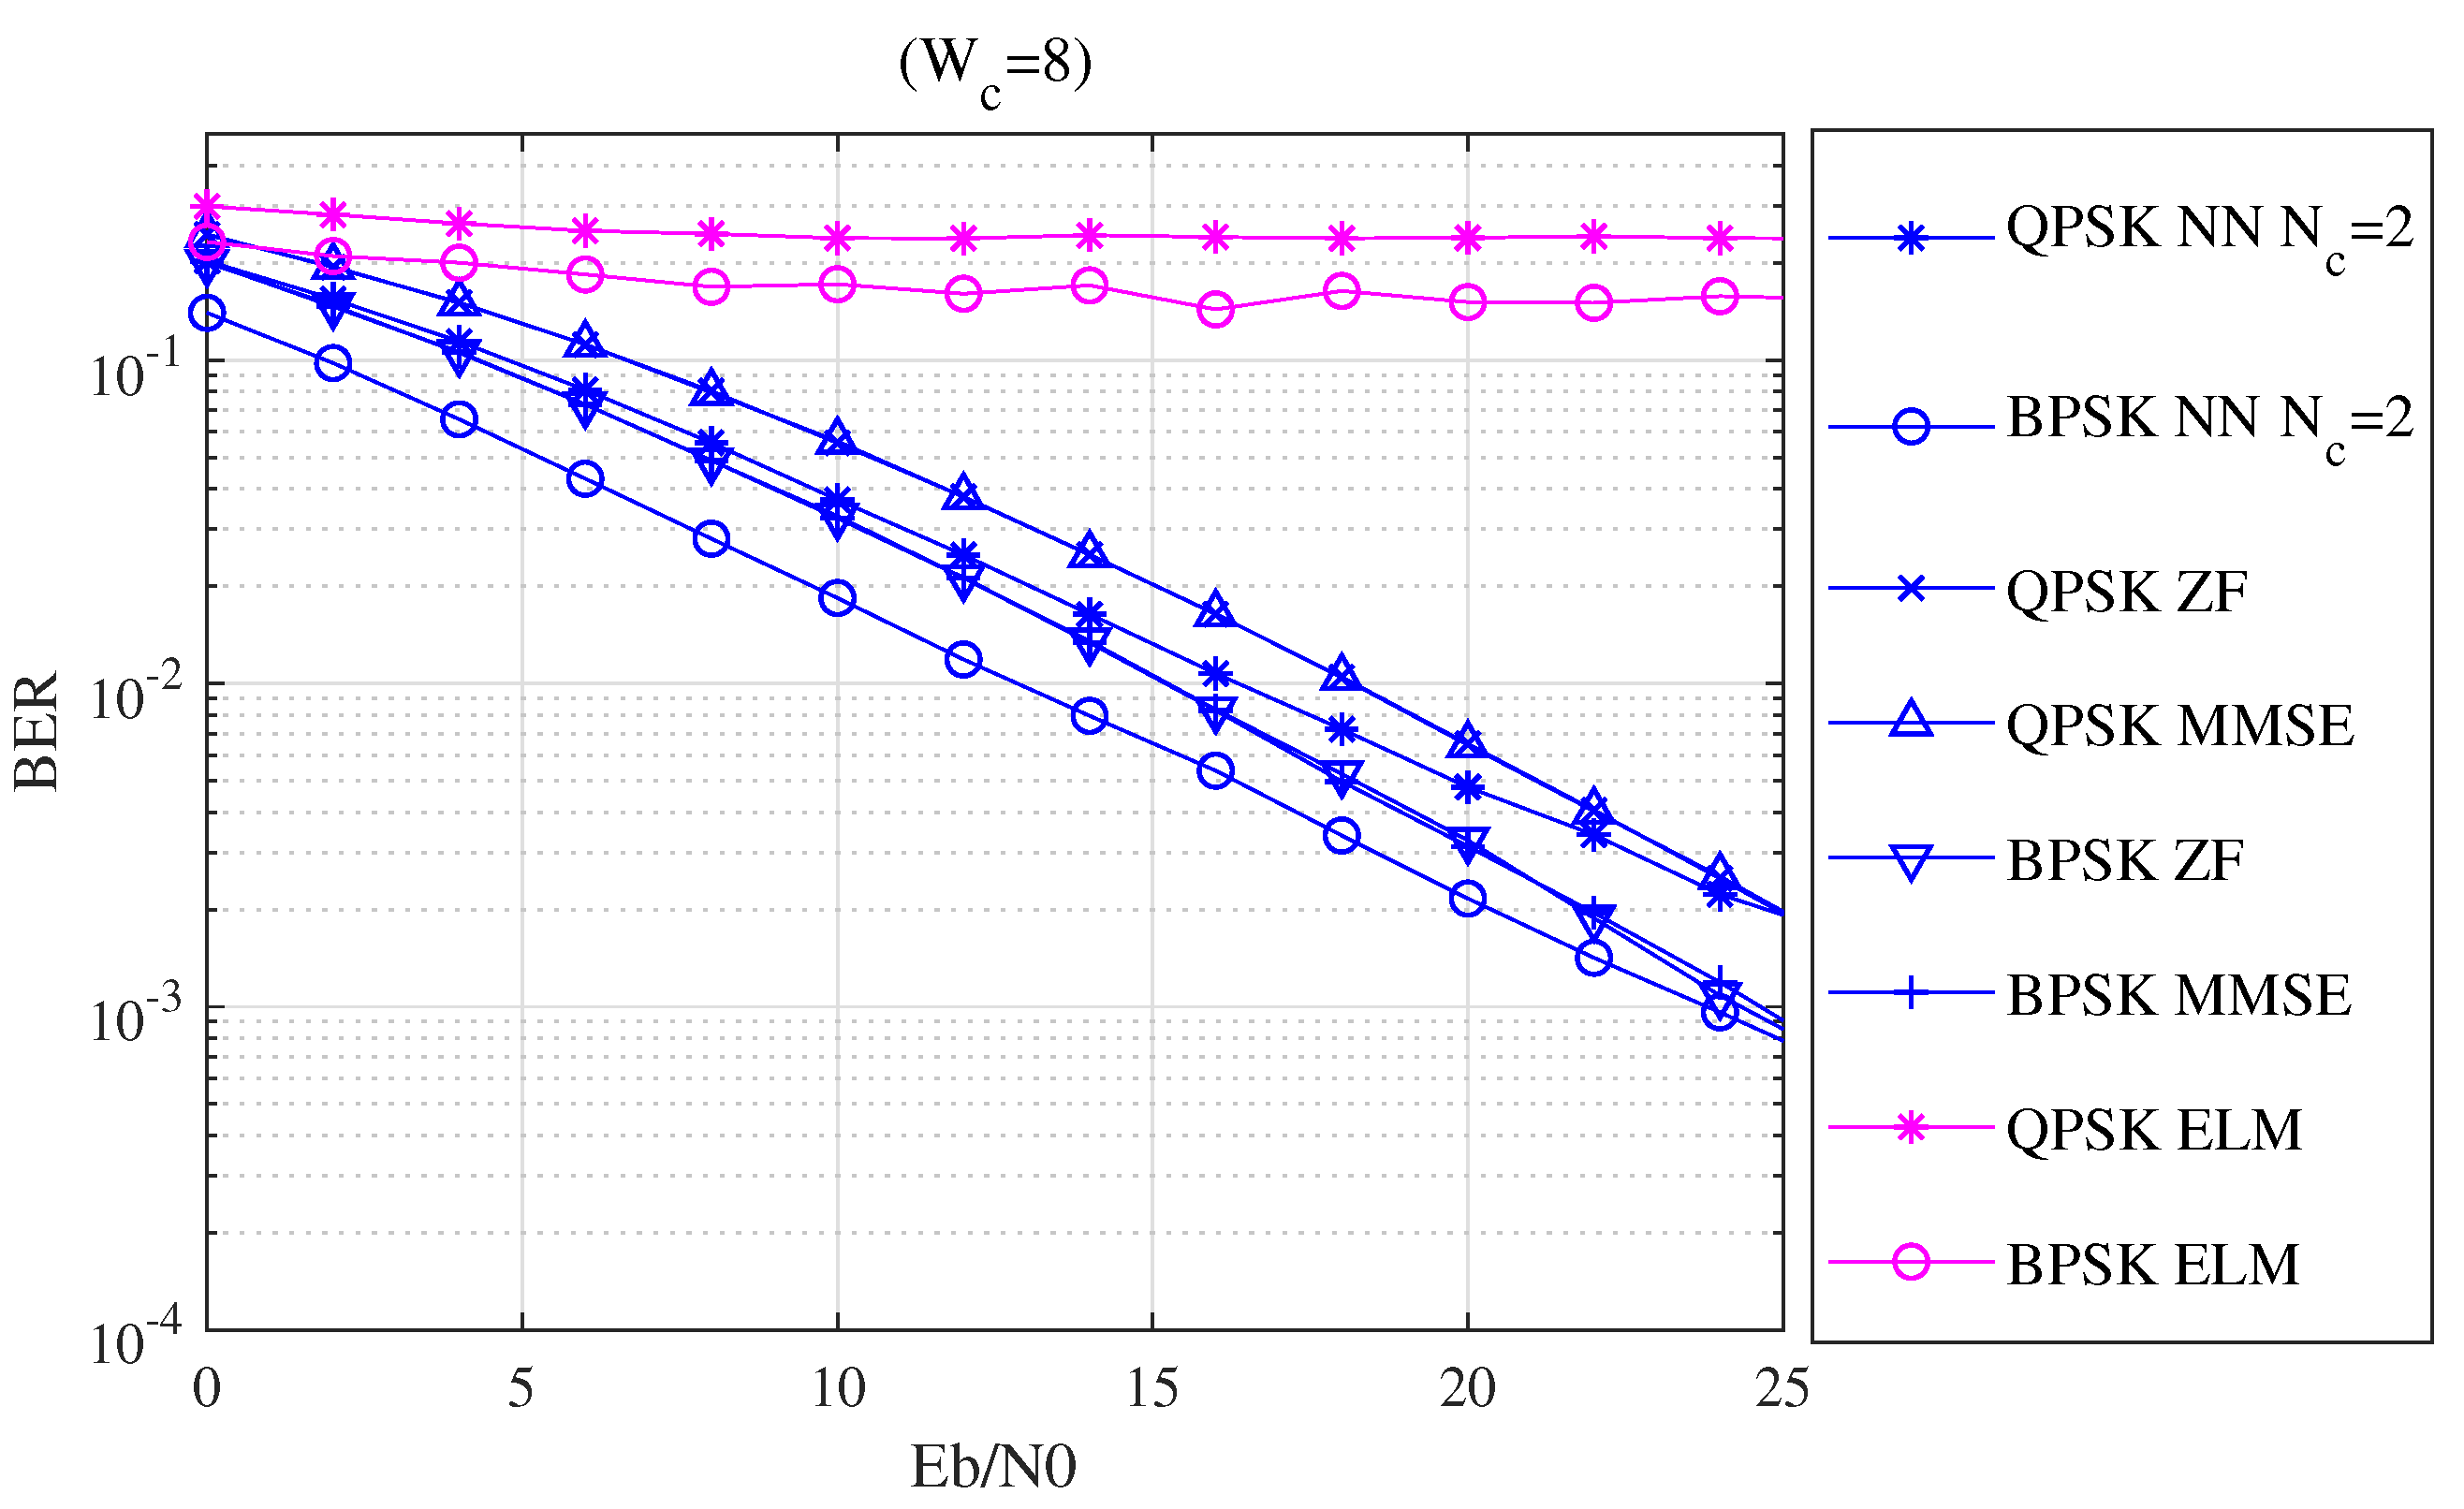
Further, the above equalizers were tested with the LS estimation. The ELM-based detector in [35] was also compared. All receivers apply the minimum Euclidean distance method to detect symbols. Figure 11 shows the BER for these detectors. It can be seen that the ELM-based detector showed the worst performance in pool channels. The NN-based receiver still showed low BERs. When SNR = 20 dB, the BERs of NN were lower than ZF and MMSE equalizers for 25.92 % and 30.99 % under BPSK and QPSK modulations.
The above results have proved the efficiency of the proposed NN-based detector. Furthermore, the underwater trials introduced in Section 6 show the practicability of the proposed detector.

7. Underwater Trials

The above systems were first tested in the pool in Figure 7. The signals were transmitted with the carrier frequency F c = 12 kHz and the sampling frequency F s was 100 kHz . The parameters shown in Table 3 were taken to generate baseband signals. The block-type pilots were used for estimation of the time-invariant channels, and the length of cyclic prefixes was 1/3 of the symbol length. Table 7 lists the BERs of different receivers. It should be noted that not all the NN-based detectors were retrained, which was the same as the trained networks in the last section. The optimal N c s for the NN was found to be 2. This was because the hard wall of the pool caused strong reflections that resulted in a small coherence bandwidth. By adjusting the transmitting power, two groups of signals were tested with SNR = 30 dB and 5 dB. The ELM-based receiver still showed the worst performance. It could also be found that the proposed NN showed low BERs in all conditions, while the ZF and MMSE equalizers showed relatively high BERs. Compared with the simulations, the gap of the performance between the proposed NN and other equalizers became smaller. This was because the delays of the real channels were much longer than the simulated ones, which caused intersymbol interference (ISI) besides intra-symbol interference. Because the NN and traditional equalizers are only designed to eliminate the interference in each symbol, the influence of ISI could not be well equalized.
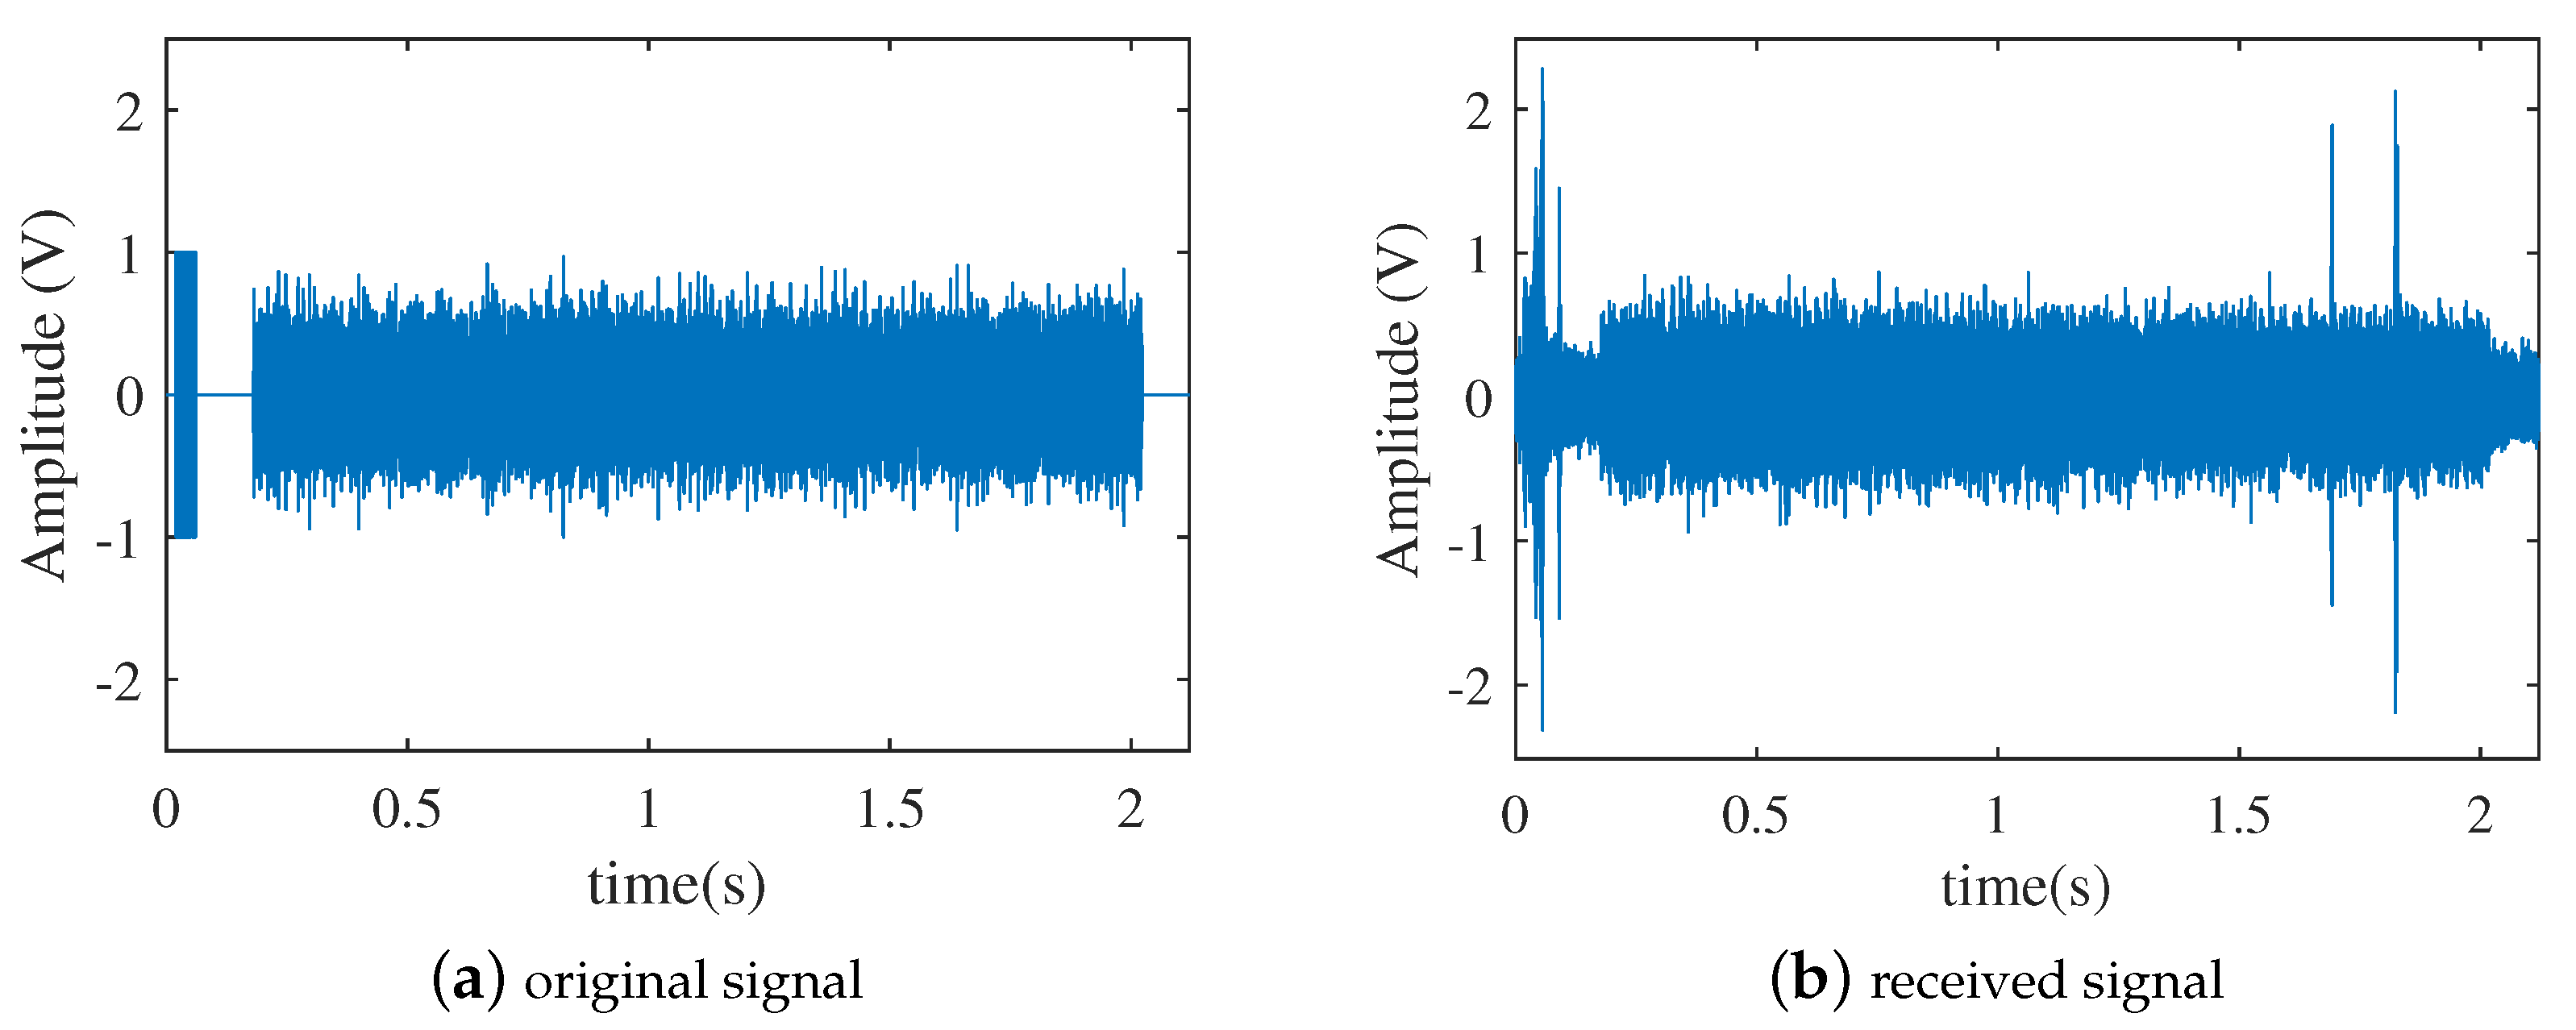
Further, the receivers were tested in real sea. The spot chosen was Xiamen Bay near the location in Figure 7c and the communication distance was 1 km. In addition to the block-type pilots, the comb-type pilots were applied to make more accurate estimations, for the channels were time-variant in the shallow sea. In addition, the LS estimator was used for both pilot types. The SNR was controlled intentionally to 4.5 dB for comparison of the performances in hostile environments, leading to the received signals in Figure 12b. The impulse interference can be observed, which severely affects the performance of the receiver.
Table 8 lists the BERs for block-type pilots, N c = 16 , and for comb-type pilots, N c = 4 . It can be seen that the received symbols with block-type pilots can hardly be detected with all detectors, although the proposed NN performs best. With comb-type pilots, the results are better. Since the ELM-based detector can only use the block-type pilots, the BERs with comb-type ones are ignored. Nevertheless, the BERs of the NN-based detector are the lowest among all equalizers. These results show the generation of the proposed NN-based detector in different UWA environments.
It can be seen from Table 8 that compared with the ZF and MMSE equalizers, the proposed NN-based detector shows less difference than Figure 11. This is because the signals transmitted in sea trials experience more complex interferences caused by the time-variant sound speed field and noise distributions. In this situation, the signals suffer from more distortions than simulations, such as inter-carrier interference (ICI), which should be reduced by other algorithms.
To show the generation of the NN-based detector, the networks were tested with the data transmitted in Xiamen Bay in June 2018. The signals were transmitted at 500 m with level 3 sea conditions. A pair of NI-6341 data acquisition cards were connected with 30 kHz transducers as the transmitter and the receiver, shown in Figure 12b. The data were modulated by QPSK and the numbers of subcarriers were set as 128 and 512. A comb-type pilot was applied for the LS channel estimation. The NN-based detector was applied to replace the original MMSE equalizer and Euclidean distance detector. The SNR at the receiver was estimated as 32 dB. Table 9 shows the BERs of different detectors. Both detectors could detect the symbols well and the NN-based detector outperformed the original detector with both 128 and 512 subcarriers.

8. Conclusions

In this paper, a low-complexity NN-based detector has been proposed to be implemented in an OFDM system. The segmented channel responses and received symbols are input to the single-layered network, which directly outputs the detected symbols. By associating the network with the assist of coherence bandwidth of the estimated channel, an algorithm is built to find optimal hyperparameters. The networks are all trained offline, which are applied for both simulations and sea trials with fixed parameters. The quantitative simulations have compared the ZF, MMSE equalizers, and the ELM-based detector with the proposed NN-based detector, and the results show that the proposed detector reaches the lowest BER in the tested UWA channels. The same results can be found in the sea trials. With the best performance among the tested equalizers and detectors, the proposed detector has lower computational complexity than MMSE and ELM-based detectors. The proposed NN-based detector needs accurate estimated channels for better performance, which leads future research to focus on the construction of the optimization of the channel estimator.

Author Contributions

Conceptualization, M.Z. and J.W.; methodology, M.Z. and H.S.; software, M.Z.; validation, M.Z., X.F. and R.L.; formal analysis, M.Z.; investigation, M.Z.; resources, M.Z.; data curation, H.S.; writing—original draft preparation, M.Z.; writing—review and editing, J.W. and J.Q.; visualization, M.Z.; supervision, H.S.; project administration, H.S.; funding acquisition, H.S. All authors have read and agreed to the published version of the manuscript.

Funding

This research was funded by the Key Program of Marine Economy Development Special Foundation of Department of Natural Resources of Guangdong Province (GDNRC [2023]24), the Key Laboratory of Southeast Coast Marine Information Intelligent Perception and Application, MNR, NO. 220202, National Natural Science Foundation of China (NSFC) 62271426 and the Natural Resources Science and Technology Innovation Project of Fujian KY-080000-04-2022-025.

Data Availability Statement

Not applicable.

Conflicts of Interest

The authors declare no conflict of interest.

References

  1. Zhang, X.; Yang, P.; Zhou, M. Multireceiver SAS Imagery with Generalized PCA. IEEE Geosci. Remote Sens. Lett. 2023, 20, 1502205. [Google Scholar] [CrossRef]
  2. Zhang, X.; Wu, H.; Sun, H.; Ying, W. Multireceiver SAS Imagery Based on Monostatic Conversion. IEEE J. Sel. Top. Appl. Earth Obs. Remote Sens. 2021, 14, 10835–10853. [Google Scholar] [CrossRef]
  3. He, Y.; Han, G.; Tang, Z.; Martínez-García, M.; Peng, Y. State Prediction-Based Data Collection Algorithm in Underwater Acoustic Sensor Networks. IEEE Trans. Wirel. Commun. 2022, 21, 2830–2842. [Google Scholar] [CrossRef]
  4. Zhou, S.; Wang, Z. OFDM for Underwater Acoustic Communications; John Wiley & Sons.: Hoboken, NJ, USA, 2014. [Google Scholar]
  5. Li, J.; Bai, Y.; Zhang, Y.; Qu, F.; Wei, Y.; Wang, J. Cross power spectral density based beamforming for underwater acoustic communications. Ocean. Eng. 2020, 216, 107786. [Google Scholar] [CrossRef]
  6. Gul, S.; Zaidi, S.S.H.; Khan, R.; Wala, A.B. Underwater acoustic channel modeling using BELLHOP ray tracing method. In Proceedings of the 2017 14th International Bhurban Conference on Applied Sciences and Technology (IBCAST), Islamabad, Pakistan, 10–14 January 2017; pp. 665–670. [Google Scholar]
  7. Shehwar, D.E.; Gul, S.; Zafar, M.U.; Shaukat, U.; Syed, A.H.; Zaidi, S.S.H. Acoustic Wave Analysis In Deep Sea And Shallow Water Using BELLHOP Tool. In Proceedings of the 2021 OES China Ocean Acoustics (COA), Harbin, China, 14 July 2021; pp. 331–334. [Google Scholar]
  8. Stojanovic, M. OFDM for underwater acoustic communications: Adaptive synchronization and sparse channel estimation. In Proceedings of the 2008 IEEE International Conference on Acoustics, Speech and Signal Processing, Las Vegas, NV, USA, 31 March–4 April 2008; pp. 5288–5291. [Google Scholar]
  9. Ur Rehman Junejo, N.; Esmaiel, H.; Zhou, M.; Sun, H.; Qi, J.; Wang, J. Sparse Channel Estimation of Underwater TDS-OFDM System Using Look-Ahead Backtracking Orthogonal Matching Pursuit. IEEE Access 2018, 6, 74389–74399. [Google Scholar] [CrossRef]
  10. Ma, X.; Zhao, C.; Qiao, G. The Underwater Acoustic OFDM Channel Equalizer Basing On Least Mean Square Adaptive Algorithm. In Proceedings of the 2008 IEEE International Symposium on Knowledge Acquisition and Modeling Workshop, Wuhan, China, 21–22 December 2008; pp. 1052–1055. [Google Scholar]
  11. Zhao, S.; Yan, S.; Xi, J. Adaptive Turbo Equalization for Differential OFDM Systems in Underwater Acoustic Communications. IEEE Trans. Veh. Technol. 2020, 69, 13937–13941. [Google Scholar] [CrossRef]
  12. Yang, G.; Wang, L.; Qiao, P.; Liang, J.; Chen, T. Joint Multiple Turbo Equalization for Harsh Time-Varying Underwater Acoustic Channels. IEEE Access 2021, 9, 82364–82372. [Google Scholar] [CrossRef]
  13. Song, J.; Huang, S.; Wang, J.; Zhang, C.; Wang, J. The Noise Transfer Analysis in Frequency Domain Zero-Forcing Equalization. IEEE Trans. Commun. 2013, 61, 1–12. [Google Scholar] [CrossRef]
  14. Kang, S.W.; Imn, S.B.; Choi, H.J. Frequency Domain MMSE Equalization with Moving FFT for MBOK DS-UWB System. In Proceedings of the 2006 International Conference on Software in Telecommunications and Computer Networks, Split, Croatia, 29 September–1 October 2006; pp. 286–290. [Google Scholar]
  15. Nelson, J.; Singer, A.; Koetter, R. Linear turbo equalization for parallel ISI channels. IEEE Trans. Commun. 2003, 51, 860–864. [Google Scholar] [CrossRef]
  16. Nakamura, Y.; Ueda, J.; Okamoto, Y.; Osawa, H.; Muraoka, H. Nonbinary LDPC Coding System With Symbol-By-Symbol Turbo Equalizer for Shingled Magnetic Recording. IEEE Trans. Magn. 2013, 49, 3791–3794. [Google Scholar] [CrossRef]
  17. Zhang, Y.; Xie, L.; Chen, H.; Cui, J.H. On the use of sliding LT code in underwater acoustic real-time data transfer with high propagation latency. In Proceedings of the 2014 Oceans-St. John’s, St. John’s, NL, Canada, 14–19 September 2014; pp. 1–5. [Google Scholar]
  18. Demirors, E.; Sklivanitis, G.; Santagati, G.E.; Melodia, T.; Batalama, S.N. A High-Rate Software-Defined Underwater Acoustic Modem With Real-Time Adaptation Capabilities. IEEE Access 2018, 6, 18602–18615. [Google Scholar] [CrossRef]
  19. Albarakati, H.; Ammar, R.; Elfouly, R.; Rajasekaran, S. Real-Time Decision Making for Underwater Big Data Applications Using the Apriori Algorithm. In Proceedings of the 2019 IEEE Symposium on Computers and Communications (ISCC), Barcelona, Spain, 29 June–3 July 2019; pp. 1–7. [Google Scholar]
  20. Abraham, D.A. Underwater Acoustic Signal and Noise Modeling. In Underwater Acoustic Signal Processing: Modeling, Detection, and Estimation; Springer International Publishing: Cham, Switzerland, 2019; pp. 349–456. [Google Scholar]
  21. Xie, Z.; Xu, Z.; Han, S.; Zhu, J.; Huang, X. Modulus Constrained Minimax Radar Code Design Against Target Interpulse Fluctuation. IEEE Trans. Veh. Technol. 2023, 1–6. [Google Scholar] [CrossRef]
  22. Ye, H.; Li, G.Y.; Juang, B.H. Power of deep learning for channel estimation and signal detection in OFDM systems. IEEE Wirel. Commun. Lett. 2017, 7, 114–117. [Google Scholar] [CrossRef]
  23. Zhao, H.; Yang, C.; Xu, Y.; Ji, F.; Wen, M.; Chen, Y. Model-Driven Based Deep Unfolding Equalizer for Underwater Acoustic OFDM Communications. IEEE Trans. Veh. Technol. 2023, 72, 6056–6067. [Google Scholar] [CrossRef]
  24. Ye, H.; Li, G.Y.; Juang, B.H.F. Deep learning based End-to-End wireless communication systems without pilots. IEEE Trans. Cogn. Commun. Netw. 2021, 7, 702–714. [Google Scholar] [CrossRef]
  25. Van Luong, T.; Ko, Y.; Matthaiou, M.; Vien, N.A.; Le, M.T.; Ngo, V.D. Deep learning-aided multicarrier systems. IEEE Trans. Wirel. Commun. 2020, 20, 2109–2119. [Google Scholar] [CrossRef]
  26. Wang, Z.; Xu, Z.; He, J.; Delingette, H.; Fan, J. Long Short-Term Memory Neural Equalizer. IEEE Trans. Signal Power Integr. 2023, 2, 13–22. [Google Scholar] [CrossRef]
  27. Gao, X.; Jin, S.; Wen, C.K.; Li, G.Y. ComNet: Combination of Deep Learning and Expert Knowledge in OFDM Receivers. IEEE Commun. Lett. 2018, 22, 2627–2630. [Google Scholar] [CrossRef] [Green Version]
  28. Lin, B.; Wang, X.; Yuan, W.; Wu, N. A novel OFDM autoencoder featuring CNN-based channel estimation for internet of vessels. IEEE Internet Things J. 2020, 7, 7601–7611. [Google Scholar] [CrossRef]
  29. Zhao, H.; Ji, F.; Wen, M.; Yu, H.; Guan, Q. Multi-task learning based underwater acoustic OFDM communications. In Proceedings of the 2021 IEEE International Conference on Signal Processing, Communications and Computing (ICSPCC), Xi’an, China, 17–19 August 2021; IEEE: Piscataway, NJ, USA, 2021; pp. 1–5. [Google Scholar]
  30. Liu, J.; Ji, F.; Zhao, H.; Li, J.; Wen, M. CNN-based underwater acoustic OFDM communications over doubly-selective channels. In Proceedings of the 2021 IEEE 94th Vehicular Technology Conference (VTC2021-Fall), Virtual, 27 September–28 October 2021; IEEE: Piscataway, NJ, USA, 2021; pp. 1–6. [Google Scholar]
  31. Zhang, Y.; Chang, J.; Liu, Y.; Xing, L.; Shen, X. Deep learning and expert knowledge based underwater acoustic OFDM receiver. Phys. Commun. 2023, 58, 102041. [Google Scholar] [CrossRef]
  32. Turhan, M.; Öztürk, E.; Çırpan, H.A. Deep convolutional learning-aided detector for generalized frequency division multiplexing with index modulation. In Proceedings of the 2019 IEEE 30th Annual International Symposium on Personal, Indoor and Mobile Radio Communications (PIMRC), Istanbul, Turkey, 8–11 September 2012; IEEE: Piscataway, NJ, USA, 2019; pp. 1–6. [Google Scholar]
  33. Wang, T.; Yang, F.; Song, J.; Han, Z. Deep convolutional neural network-based detector for index modulation. IEEE Wirel. Commun. Lett. 2020, 9, 1705–1709. [Google Scholar] [CrossRef]
  34. Liu, J.; Mei, K.; Zhang, X.; Ma, D.; Wei, J. Online extreme learning machine-based channel estimation and equalization for OFDM systems. IEEE Commun. Lett. 2019, 23, 1276–1279. [Google Scholar] [CrossRef]
  35. Yang, L.; Zhao, Q.; Jing, Y. Channel equalization and detection with ELM-based regressors for OFDM systems. IEEE Commun. Lett. 2019, 24, 86–89. [Google Scholar] [CrossRef]
  36. Zhang, Y.; Wang, H.; Li, C.; Chen, D.; Meriaudeau, F. Meta-learning-aided orthogonal frequency division multiplexing for underwater acoustic communications. J. Acoust. Soc. Am. 2021, 149, 4596–4606. [Google Scholar] [CrossRef]
  37. Zhang, Y.; Wang, H.; Li, C.; Meriaudeau, F. Data augmentation aided complex-valued network for channel estimation in underwater acoustic orthogonal frequency division multiplexing system. J. Acoust. Soc. Am. 2022, 151, 4150–4164. [Google Scholar] [CrossRef]
  38. Han, J.; Zhang, L.; Leus, G. Partial FFT Demodulation for MIMO-OFDM over Time-Varying Underwater Acoustic Channels. IEEE Signal Process. Lett. 2016, 23, 282–286. [Google Scholar] [CrossRef]
  39. Li, B.; Zhou, S.; Stojanovic, M.; Freitag, L.; Willett, P. Multicarrier Communication Over Underwater Acoustic Channels With Nonuniform Doppler Shifts. IEEE J. Ocean. Eng. J. Devoted Appl. Electr. Electron. Eng. Ocean. Environ. 2008, 33, 198–209. [Google Scholar]
  40. Kuchi, K. Limiting Behavior of ZF/MMSE Linear Equalizers in Wideband Channels with Frequency Selective Fading. IEEE Commun. Lett. 2012, 16, 929–932. [Google Scholar] [CrossRef]
  41. Zhou, M.; Wang, J.; Feng, X.; Sun, H.; Li, J.; Kuai, X. On Generative-Adversarial-Network-Based Underwater Acoustic Noise Modeling. IEEE Trans. Veh. Technol. 2021, 70, 9555–9559. [Google Scholar] [CrossRef]
  42. Zou, J.; Qu, J.; Guo, Y.; Liu, G.; Shu, F. Index Modulation Based on Four-dimensional Spherical Code and its DNN-based Receiver Design. IEEE Trans. Veh. Technol. 2021, 70, 13401–13405. [Google Scholar] [CrossRef]
  43. Zhao, J.; Ran, R.; Oh, C.H.; Seo, J. Analysis of the Effect of Coherence Bandwidth on Leakage Suppression Methods for OFDM Channel Estimation. J. Inf. Commun. Converg. Eng. 2014, 12, 221–227. [Google Scholar]
  44. Kochanska, I.; Schmidt, J.H. Estimation of Coherence Bandwidth for Underwater Acoustic Communication Channel. In Proceedings of the 2018 Joint Conference-Acoustics, Ustka, Poland, 11–14 September 2018; pp. 1–5. [Google Scholar]
Figure 1. A classic UWA OFDM system. The performance of the channel estimator and equalizer are challenged by the UWA channels with large delays and impulsive noise.
Remotesensing 15 03796 g001
Figure 2. Time and frequency response of a typical UWA channel: (a) is the CIR of the channel, which contains many strongly reflected paths with large delays. Its frequency response in (b) shows non-negligible frequency selectivity.
Remotesensing 15 03796 g002
Figure 3. A decision region of the QPSK constellation.
Remotesensing 15 03796 g003
Figure 4. Block diagram of the proposed scheme on joint equalization and detection based on the NN. The detection process integrates the equalization and symbol demapping, which is completed by a low-complexity network, taking the segmented subcarriers as input.
Remotesensing 15 03796 g004
Figure 5. Time and frequency response of a simple and a complex channel: (a) is the response of the channel, which contains the main path and one reflected path. (b) is the response of a complex channel, which includes many other paths besides the paths in (a).
Remotesensing 15 03796 g005
Figure 6. Block diagram of training strategy. All networks are only trained once offline and tested with fixed hyperparameters online in the simulations and sea trials.
Remotesensing 15 03796 g006
Figure 7. Scenes and their channel impulsive response: (a,b) are the scenes of pool and artificial lake in Xiamen University, while (c) is the testing area in Wuyuanwan Bay. (df) are three of the CIRs caught in these spots, which show large delays.
Remotesensing 15 03796 g007
Figure 8. BER of different N c varying with N L .
Remotesensing 15 03796 g008
Figure 9. BER of different N c in channels with specific maximum delays. (a,c,e) are complete BER curves of different N w c s. The BER in the range of [15, 20] dB are enlarged in (b,d,f), respectively.
Remotesensing 15 03796 g009
Figure 10. BER of different detectors with given MSE of channel estimations.
Remotesensing 15 03796 g010
Figure 11. BERs of different detectors with the LS channel estimator. The BER curves of the ZF equalizer are almost overlapped by that of the MMSE equalizers, while the NN shows the lowest BER both with BPSK and QPSK. The ELM-based equalizer shows highest BER.
Remotesensing 15 03796 g011
Figure 12. The original and received signals in time domain. Compared with (a), the signal in (b) suffers from impulses as well as fading.
Remotesensing 15 03796 g012
Table 1. Fading situations of different sections.
BlockType of FadingWidth of a Block
[ A 1 , C 2 ] Selective fading W c
[ A 1 , B 1 ] , [ B 2 , C 2 ] , [ C 3 , D 3 ] Flat fading 2 W c / 3
[ A 1 , A 3 ] , [ C 1 , C 3 ] , [ D 1 , D 3 ] Flat fading W c / 2
[ B 1 , B 3 ] Selective fading W c / 2
[ A 1 , A 2 ] , [ A 3 , B 1 ] Flat fading W c / 3
[ B 2 , B 3 ] , [ C 1 , C 2 ] Flat fading W c / 3
[ C 3 , D 1 ] , [ D 2 , D 3 ] Flat fading W c / 3
Table 2. Time complexity of different detectors.
DetectorNumber of MACCTime Complexity
ELM N ( N L 3 3 + 2 N L 2 + N L 2 2 + 8 N L + 5 N L 6 + 6 + 3 M ) O ( N 4 )
ZF 7 N + 3 M N O ( N )
MMSE 3 ( N 3 + 3 N 2 + 2 N + M N ) O ( N 3 )
Proposed NN ( 2 + M ) N N L + 3 N O ( N 3 ) O ( N N L )
Table 3. Parameters of the simulated OFDM system.
ItemValue
BandwidthB5000 Hz
ModulationQPSK/BPSK
Number of subcarriersN384
Block size N c 1 / 2 / 3 / 4 / 6 / 8 / 12 / 16
Proportion of training/testing set 3 / 1
Table 4. Parameters for network training.
ItemValue
Input size2 N c
Number of neurons N L
output size M N c
Activation functionReLU
OptimizerAdam
SNR for training (dB)[20, 30]
Predetermined channel estimation MSE[0, 0.03]
Epoch300
learning rate0.001
PlatformPython with TensorFlow
Table 5. N Lopt for different N c s.
N c 1234681216
N Lopt for BPSK2864120181220280400488
N Lopt for QPSK5280148200240300420516
Table 6. The optimal N c for different systems.
BPSKQPSK
N w c = 8 22
N w c = 6 13
N w c = 5 43
Table 7. BER of systems tested in the pool.
SNR = 30 dBSNR = 5 dB
BPSKQPSKBPSKQPSK
Proposed NN0.002060.00730.01930.0276
ZF0.002090.00740.02050.0295
MMSE0.002080.00740.02060.0293
ELM0.13850.40230.14310.4051
Table 8. BER of systems tested in the shallow sea.
Block-Type PilotComb-Type Pilot
BPSKQPSKBPSKQPSK
Proposed NN0.16020.29020.09700.1196
ZF0.18670.30090.09880.1250
MMSE0.18650.30100.09880.1249
ELM0.44650.4905--
Table 9. BERs of different detectors with data in June 2018.
Number of SubcarriersProposed NNMMSE
1280.0061850.006673
5120.0075680.007894
Disclaimer/Publisher’s Note: The statements, opinions and data contained in all publications are solely those of the individual author(s) and contributor(s) and not of MDPI and/or the editor(s). MDPI and/or the editor(s) disclaim responsibility for any injury to people or property resulting from any ideas, methods, instructions or products referred to in the content.

