Article

Retrieval of Sea Surface Skin Temperature from the High Resolution Picture Transmission Data of the National Oceanic and Atmospheric Administration Series Satellites

1
College of Marine Technology, Faculty of Information Science and Engineering, Ocean University of China, Qingdao 266100, China
2
Laboratory for Regional Oceanography and Numerical Modeling, Qingdao National Laboratory for Marine Science and Technology, Qingdao 266237, China
3
Network and Information Center, Ocean University of China, Qingdao 266100, China
4
Sanya Oceanographic Institution, Ocean University of China, Sanya 572024, China
*
Author to whom correspondence should be addressed.
Remote Sens. 2023, 15(15), 3723; https://doi.org/10.3390/rs15153723
Submission received: 13 June 2023 / Revised: 19 July 2023 / Accepted: 21 July 2023 / Published: 26 July 2023
(This article belongs to the Section Ocean Remote Sensing)

Abstract

:
The High Resolution Picture Transmission (HRPT) data of the National Oceanic and Atmospheric Administration (NOAA) series meteorological satellites had been received by the SeaSpace ground station located at the Ocean University of China (OUC). Based on the atmospheric radiative transfer model, we obtained the NOAA-15/16/17/18/19 Advanced Very High Resolution Radiometer (AVHRR) sea surface skin temperature (SSTskin) data using the Bayesian cloud detection method and the optimal estimation (OE) sea surface temperature (SST) retrieval algorithm. Compared with the NOAA/AVHRR multi-channel SST data, the AVHRR SSTskin data have higher data accuracy. We also compared the AVHRR SSTskin with the buoy SST with spatial and temporal windows of 0.01° and 30 min. The daytime biases ranged from −0.32 °C (NOAA-16) to 0.08 °C (NOAA-17) with standard deviations (SDs) ranging from 0.36 °C (NOAA-18/ NOAA-19) to 0.60 °C (NOAA-16), and the nighttime biases ranged from −0.26 °C (NOAA-16) to −0.02 °C (NOAA-17) with SDs ranging from 0.33 °C (NOAA-19) to 0.60 °C (NOAA-16). The accuracy of all five satellite data during daytime and nighttime was significantly improved. These results show that the AVHRR SSTskin of NOAA series satellites is good and consistent in different periods, and the SSTskin data products with high spatial resolution and accuracy can be used for mesoscale and submesoscale marine applications.

Graphical Abstract

1. Introduction

Sea surface temperature (SST) is an important oceanic parameter in ocean-atmosphere systems [1]. Long-term time series of high spatial resolution SST data products have important applications in marine climate change monitoring, dynamic mechanism research, phenomenon observation, numerical prediction, and other fields [1]. The high spatial resolution SST can be retrieved from the thermal infrared satellite sensors. The operational thermal infrared SST observation has a history of over 40 years [2]. The Advanced Very High Resolution Radiometer (AVHRR) is onboard the National Oceanic and Atmospheric Administration (NOAA) Polar Orbiting Environment Satellites (POES) [2,3]. The AVHRR sensor was first mounted on the TIROS-N satellite, which was launched in 1978 [2]. The first generation AVHRR sensor which was mounted on the TIROS-N and NOAA-6 satellites had only four spectral channels. The second generation AVHRR (AVHRR/2) sensor was redesigned to have five spectral channels, using channel 4 (10.30–11.30 µm) and channel 5 (11.50–12.50 µm) for SST retrieval [3]. The third generation AVHRR(AVHRR/3) sensor has six spectral channels: channel 3 (3.55–3.93 µm) is divided into channel 3A and channel 3B. Channel 3B, 4 and 5 are used for SST retrieval. Due to the influence of sunlight scattering and reflection, channel 3B can only be used for nighttime SST retrieval. The NOAA/AVHRR operational SST data, including daily, monthly, and yearly global 4-km spatial resolution data, are processed and distributed by the NOAA National Environment Satellite Data and Information Service (NESDIS). The retrieval algorithm of the NOAA/AVHRR global 4 km is the nonlinear SST (NLSST) [4]. A comparison of NOAA/AVHRR SST and buoy SST from 1989 to 1997 showed that biases during daytime and nighttime were within ±0.5 °C [5].
European and US communities have been committed to providing the long-term time series global AVHRR SST data products integrating multiple NOAA satellites, such as the US reprocessing AVHRR Pathfinder SST data products and the European reprocessing AVHRR Climate Change Initiative (CCI) SST dataset. Since 1990, the NOAA Pathfinder project has been dedicated to reprocessing AVHRR data and generating long-term time series AVHRR SST data products with high accuracy. The AVHRR Pathfinder SST has experienced five generations of data [6]. The latest data product is the Level 3 Collated (L3C) global 4 km SST data, which is obtained by reprocessing the data from NOAA-7 to NOAA-19, and the SST data have been available from 1981 to date [7]. The validation between the AVHRR Pathfinder SST and the buoy SST from 1985 to 1998 showed that the bias was 0.02 °C, and the standard deviation (SD) was 0.5 °C [4]. Comparing the AVHRR Pathfinder SST between 2004 and 2005 with the drifting buoy SST revealed a bias of −0.43 °C with an SD of 0.76 °C during daytime and a bias of −0.33 °C with an SD of 0.79 °C during nighttime [8]. The European Space Agency (ESA) CCI project also aims to reprocess the AVHRR and ATSR data to produce SST data products with high accuracy. The SST retrieval algorithm for the CCI project is the optimal estimation (OE) SST algorithm, and four types of AVHRR SST data products are currently available, including Level 2 Pre-processed (L2P) 4-km SST data, Level 3 Uncollated (L3U) global 0.05° grid SST data, Level 3 Collated (L3C) global 0.05° grid SST data, and Level 4 (L4) integrated global daily analysis SST data [9]. Reprocessing the NOAA series satellite AVHRR brightness temperature (BT) data from 1981 to 2016, the Bayesian cloud detection algorithm and OE algorithm were used to obtain AVHRR SST data products, and compared with the buoy SST, the result showed that the medians ranged from −0.2 K to 0.2 K, and the robust standard deviations (RSDs) were around 0.5 K [10].
Research on regional and global AVHRR data reprocessing is ongoing, aiming to improve its data accuracy. The AVHRR SST around Taiwan between 1998 and 2002 retrieved by multi-channel SST (MCSST) and NLSST algorithms has been compared with the in situ SST. It was found that the bias between MCSST and in situ SST was 0.009 °C, and that the bias between NLSST and in situ SST was 0.256 °C [11]. The NOAA series satellite SST around Korea in 2009 retrieved by MCSST and NLSST algorithms has been compared with the buoy SST. It showed that in most cases, the root mean square (rms) errors were less than 1 °C; the biases between MCSST and the buoy SST ranged from −0.3913 °C to 0.2427 °C during daytime and from −0.0543 °C to 0.4819 °C during nighttime; and the biases between NLSST and the buoy SST ranged from −0.4866 °C to 0.1234 °C during daytime and from −0.0916 °C to 0.9787 °C during nighttime [12]. The NOAA series satellite SSTs in the East/Japan Sea from 2005 to 2010 retrieved by MCSST and NLSST algorithms have also been compared with the buoy SST. It showed that the biases between MCSST and the buoy SST ranged from −0.08 °C to 0.54 °C during daytime and from −0.43 °C to 0.14 °C during nighttime; those between NLSST and the buoy SST ranged from −0.25 °C to 0.38 °C during daytime and from −0.68 °C to 0.23 °C during nighttime; and the rms errors were also less than 1 °C all the time [13]. The data of NOAA and MetOp series satellites from 2002 to 2015 have been reprocessed to generate AVHRR Global Area Coverage (GAC) 4 km SST, and the biases between the satellite and in situ SST ranged from −0.1 K to 0.1 K; the data accuracy of each satellite was highly consistent [14]. The AVHRR GAC data from 1979 to 2016 have been reprocessed using Bayesian cloud detection, and the Bayesian mask could reduce the RSD of the AVHRR GAC SST by 5–10% during daytime [15].
NOAA/AVHRR MCSSTs are retrieved with the coefficients fitted by the buoy SSTs and satellite observation BTs [4]. Thus, the SSTs are closer to the buoy SSTs, which represent the bulk temperature. However, the infrared sensors obtain the sea surface skin temperature (SSTskin) at 10 μm below the sea surface [16]. In this study, we reprocessed the NOAA High Resolution Picture Transmission (HRPT) data received by the SeaSpace ground station located at the Ocean University of China (OUC) and obtained SSTskin data with 1.1 km nadir resolution. The rest of the study is structured as follows: Section 2 introduces the data and methods used in this study; the methods include the atmospheric radiative transfer model, Bayesian cloud detection, and OE SST retrieval algorithm. Section 3 presents the results. Section 4 discusses the results. Section 5 presents the conclusions.

2. Materials and Methods

2.1. Data

2.1.1. NOAA/AVHRR Data

AVHRR has six spectral channels ranging from 0.58 to 12.5 µm. Its swath width is 2900 km, and the nadir resolution is 1.1 km. The NOAA/AVHRR HRPT data were received by the satellite ground station located at OUC and separated from the HRPT data flow by the TeraScan system which version was 4.0.2. The HRPT data information mainly includes the longitude, latitude, six spectral channel data, solar zenith angle, satellite zenith angle, satellite scan angle, land mask, scan time, etc. AVHRR visible data include the reflectivity data, and the infrared channel data are the BT data. Herein, the longitude, latitude, AVHRR thermal infrared spectral channel (11 and 12 μm) BTs, solar zenith angle, and satellite zenith angle are used.

2.1.2. In Situ Data

In situ SST Quality Monitor (iQuam) data provide in situ ship and buoy SST data with quality level flags [17]. The iQuam data files include various parameters, such as year, month, day, hour, minute, longitude, latitude, platform_type, cloud_coverage, wind_direction, wind_speed, iquam_flags, quality_level, SST, etc. [17]. The SST data quality levels are identified as 0 to 5, where 5 represents the best quality level [17]. The buoy platform has higher observation accuracy than ship SST; the accuracy of the drifting buoy data is 0.04 °C; that of the tropical moored buoy data is 0.06 °C; and that of the coastal moored buoy data is −0.01 °C [17,18]. In this study, we have selected the buoy data with the highest quality level which platform_tpye equals 2/3/4/6/8 for validation, where 2/3/4/6/8 represents drifting buoy, tropical moored buoy, coastal moored buoy, high resolution drifter, and coral reef buoy (CRW), respectively. The iQuam data version 2.10 was used in this study.

2.1.3. ERA5 Data

ERA5 is the latest climate reanalysis data produced by the European Centre for Medium-Range Weather Forecasts (ECMWF). It provides hourly atmospheric and surface data. ERA5 data are available in the Climate Data Store on regular latitude–longitude grids at a 0.25° × 0.25° resolution with atmospheric parameters on 37 pressure levels. Atmospheric parameters include the fraction of cloud cover, ozone mass mixing ratio, specific humidity, temperature, etc. Surface parameters include SST, SSTskin, 2 m temperature, 2 m dewpoint temperature, surface pressure, total cloud cover (TCC), total column water vapor (TCWV), 10 m u-component of wind, 10 m v-component of wind, etc. [19]. Time, longitude, and latitude information are also included in these two datasets. The ERA5 data can be accessed from https://climate.copernicus.eu/climate-reanalysis (accessed on 31 December 2020).

2.2. Methods

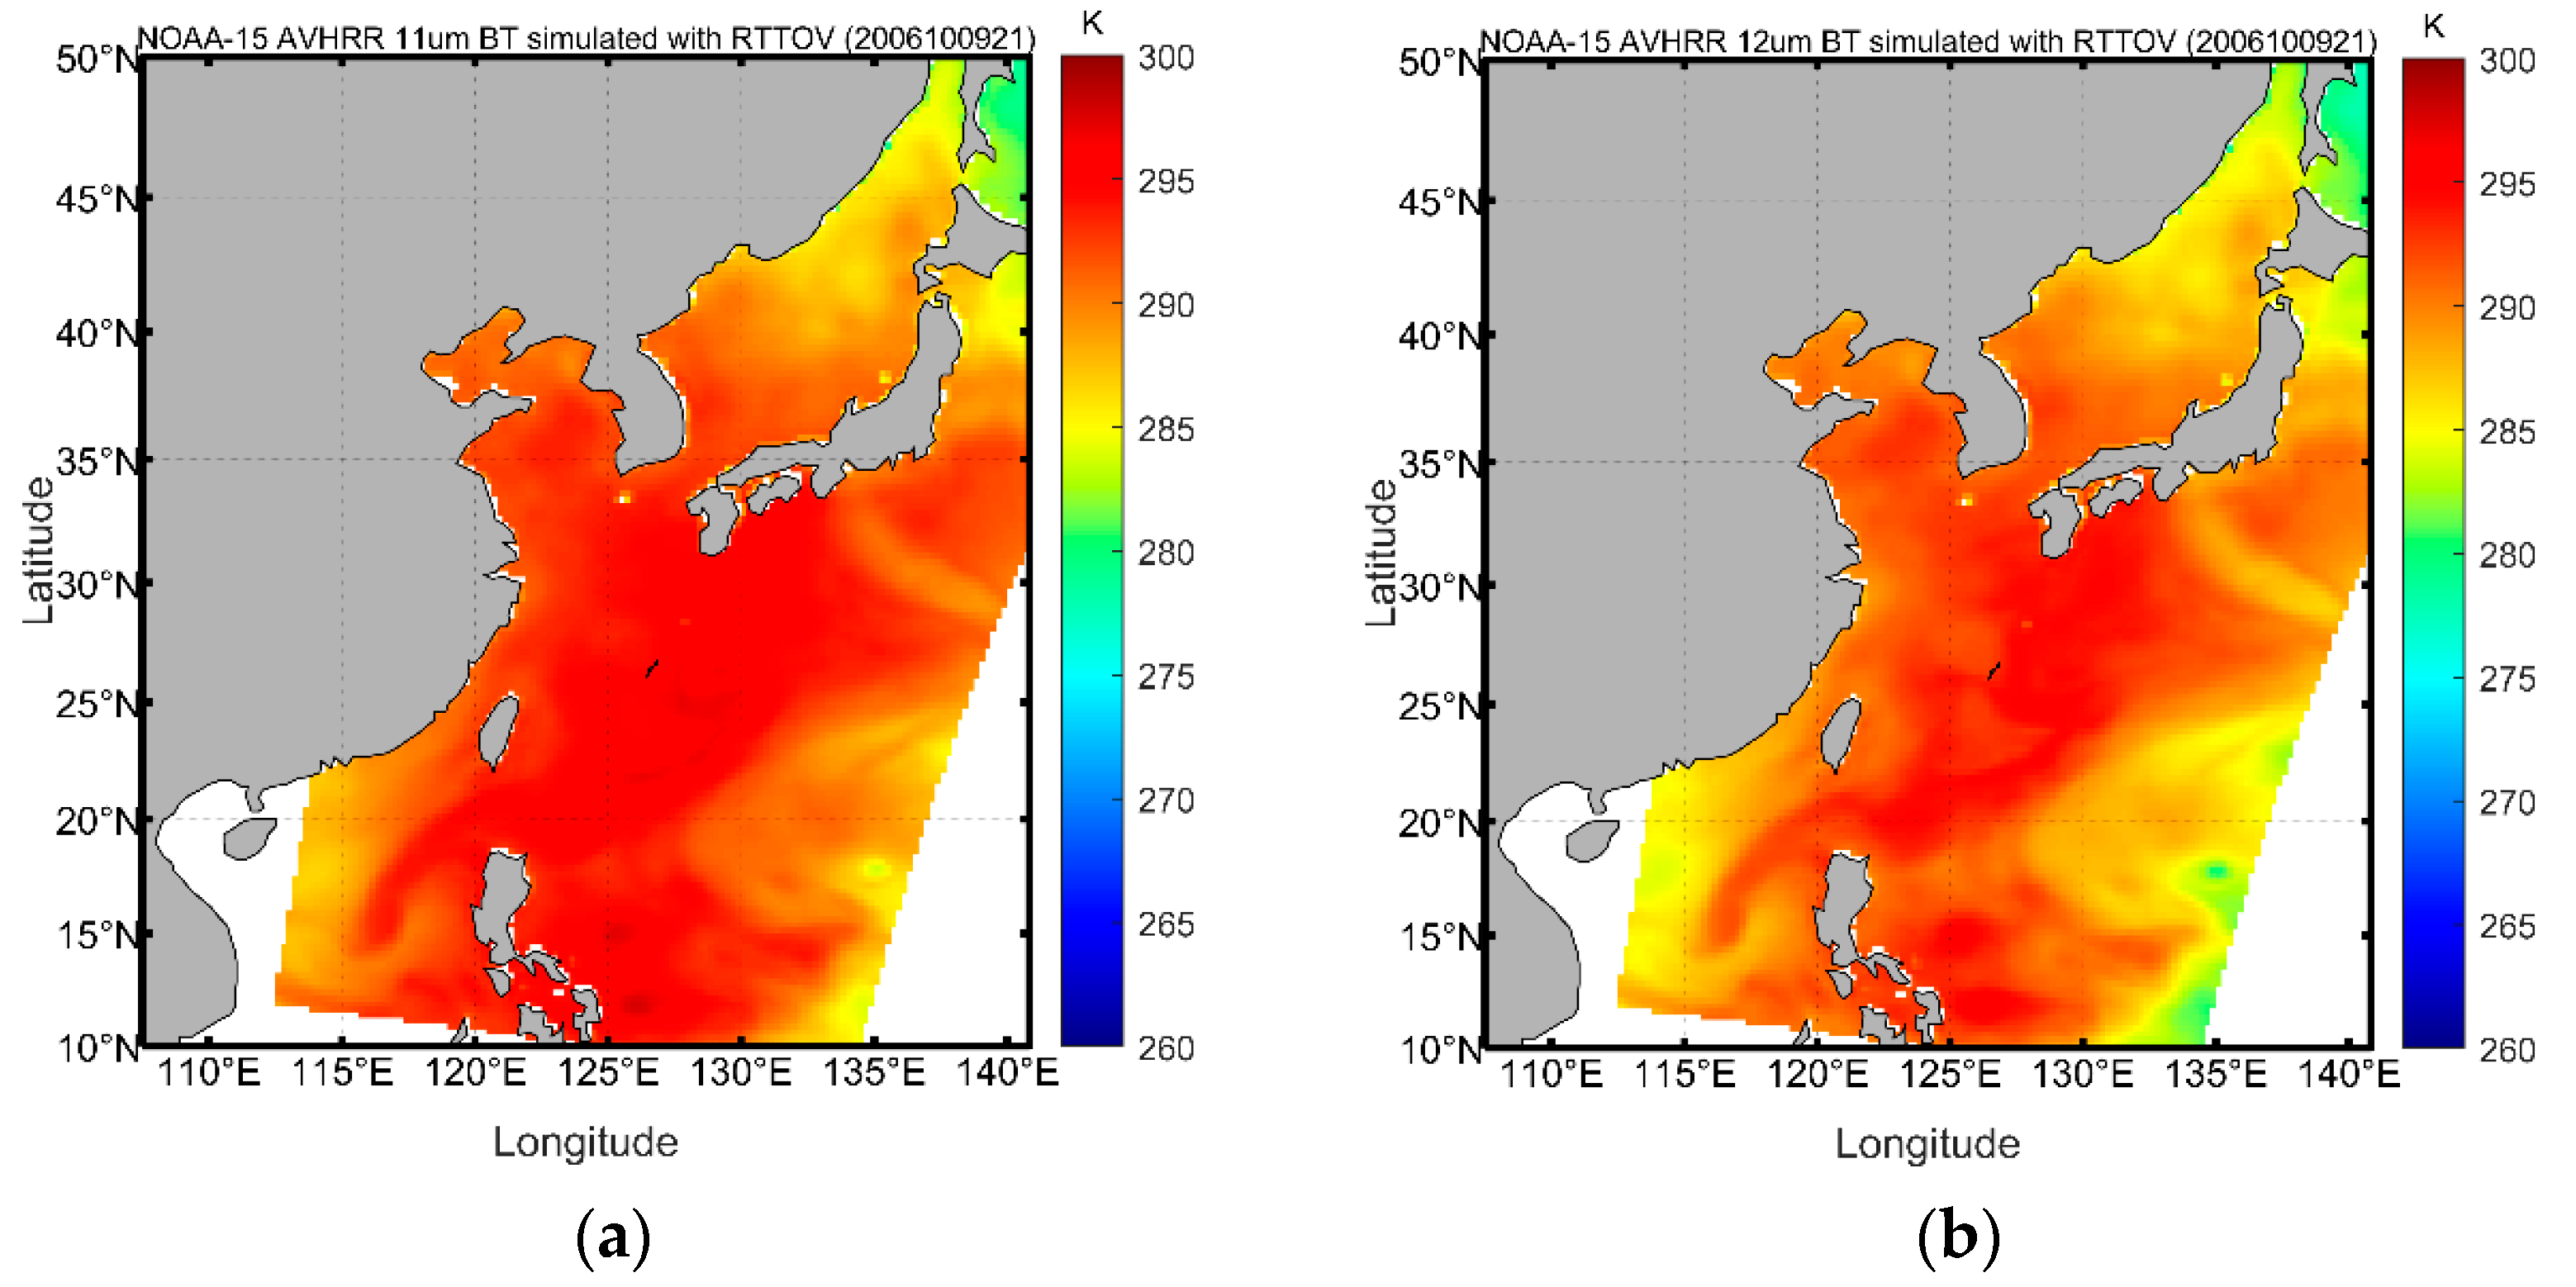
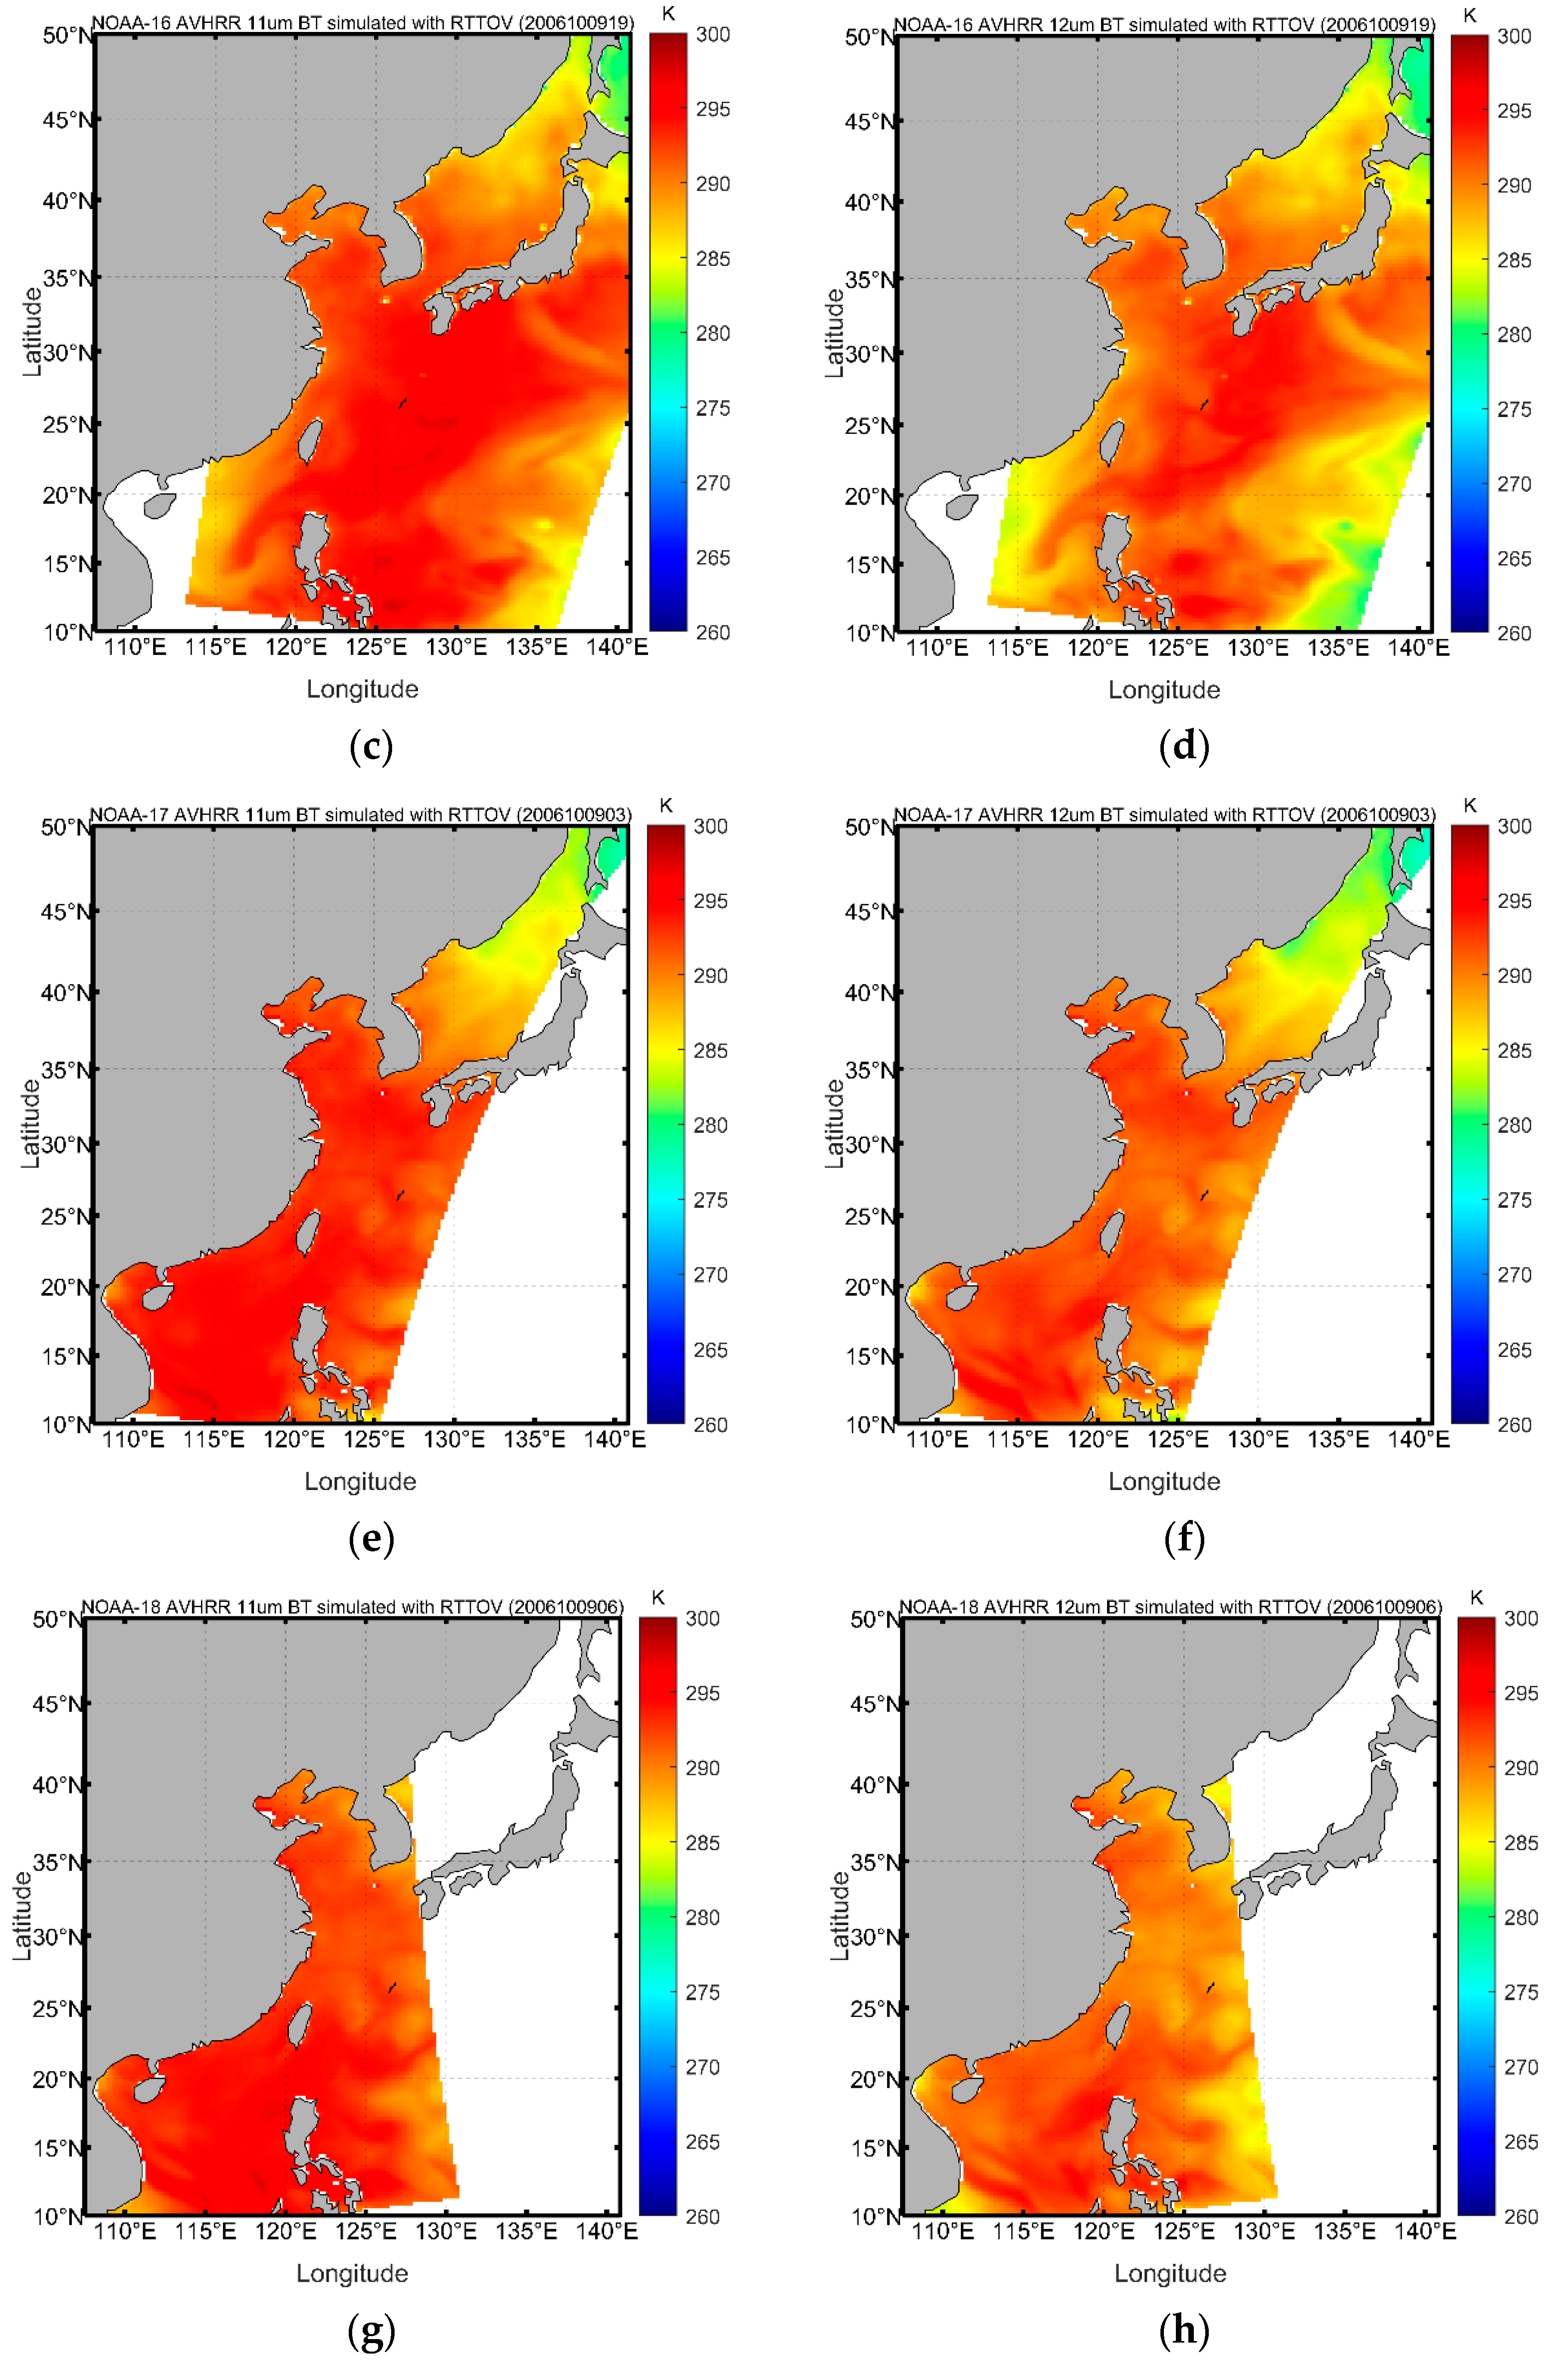
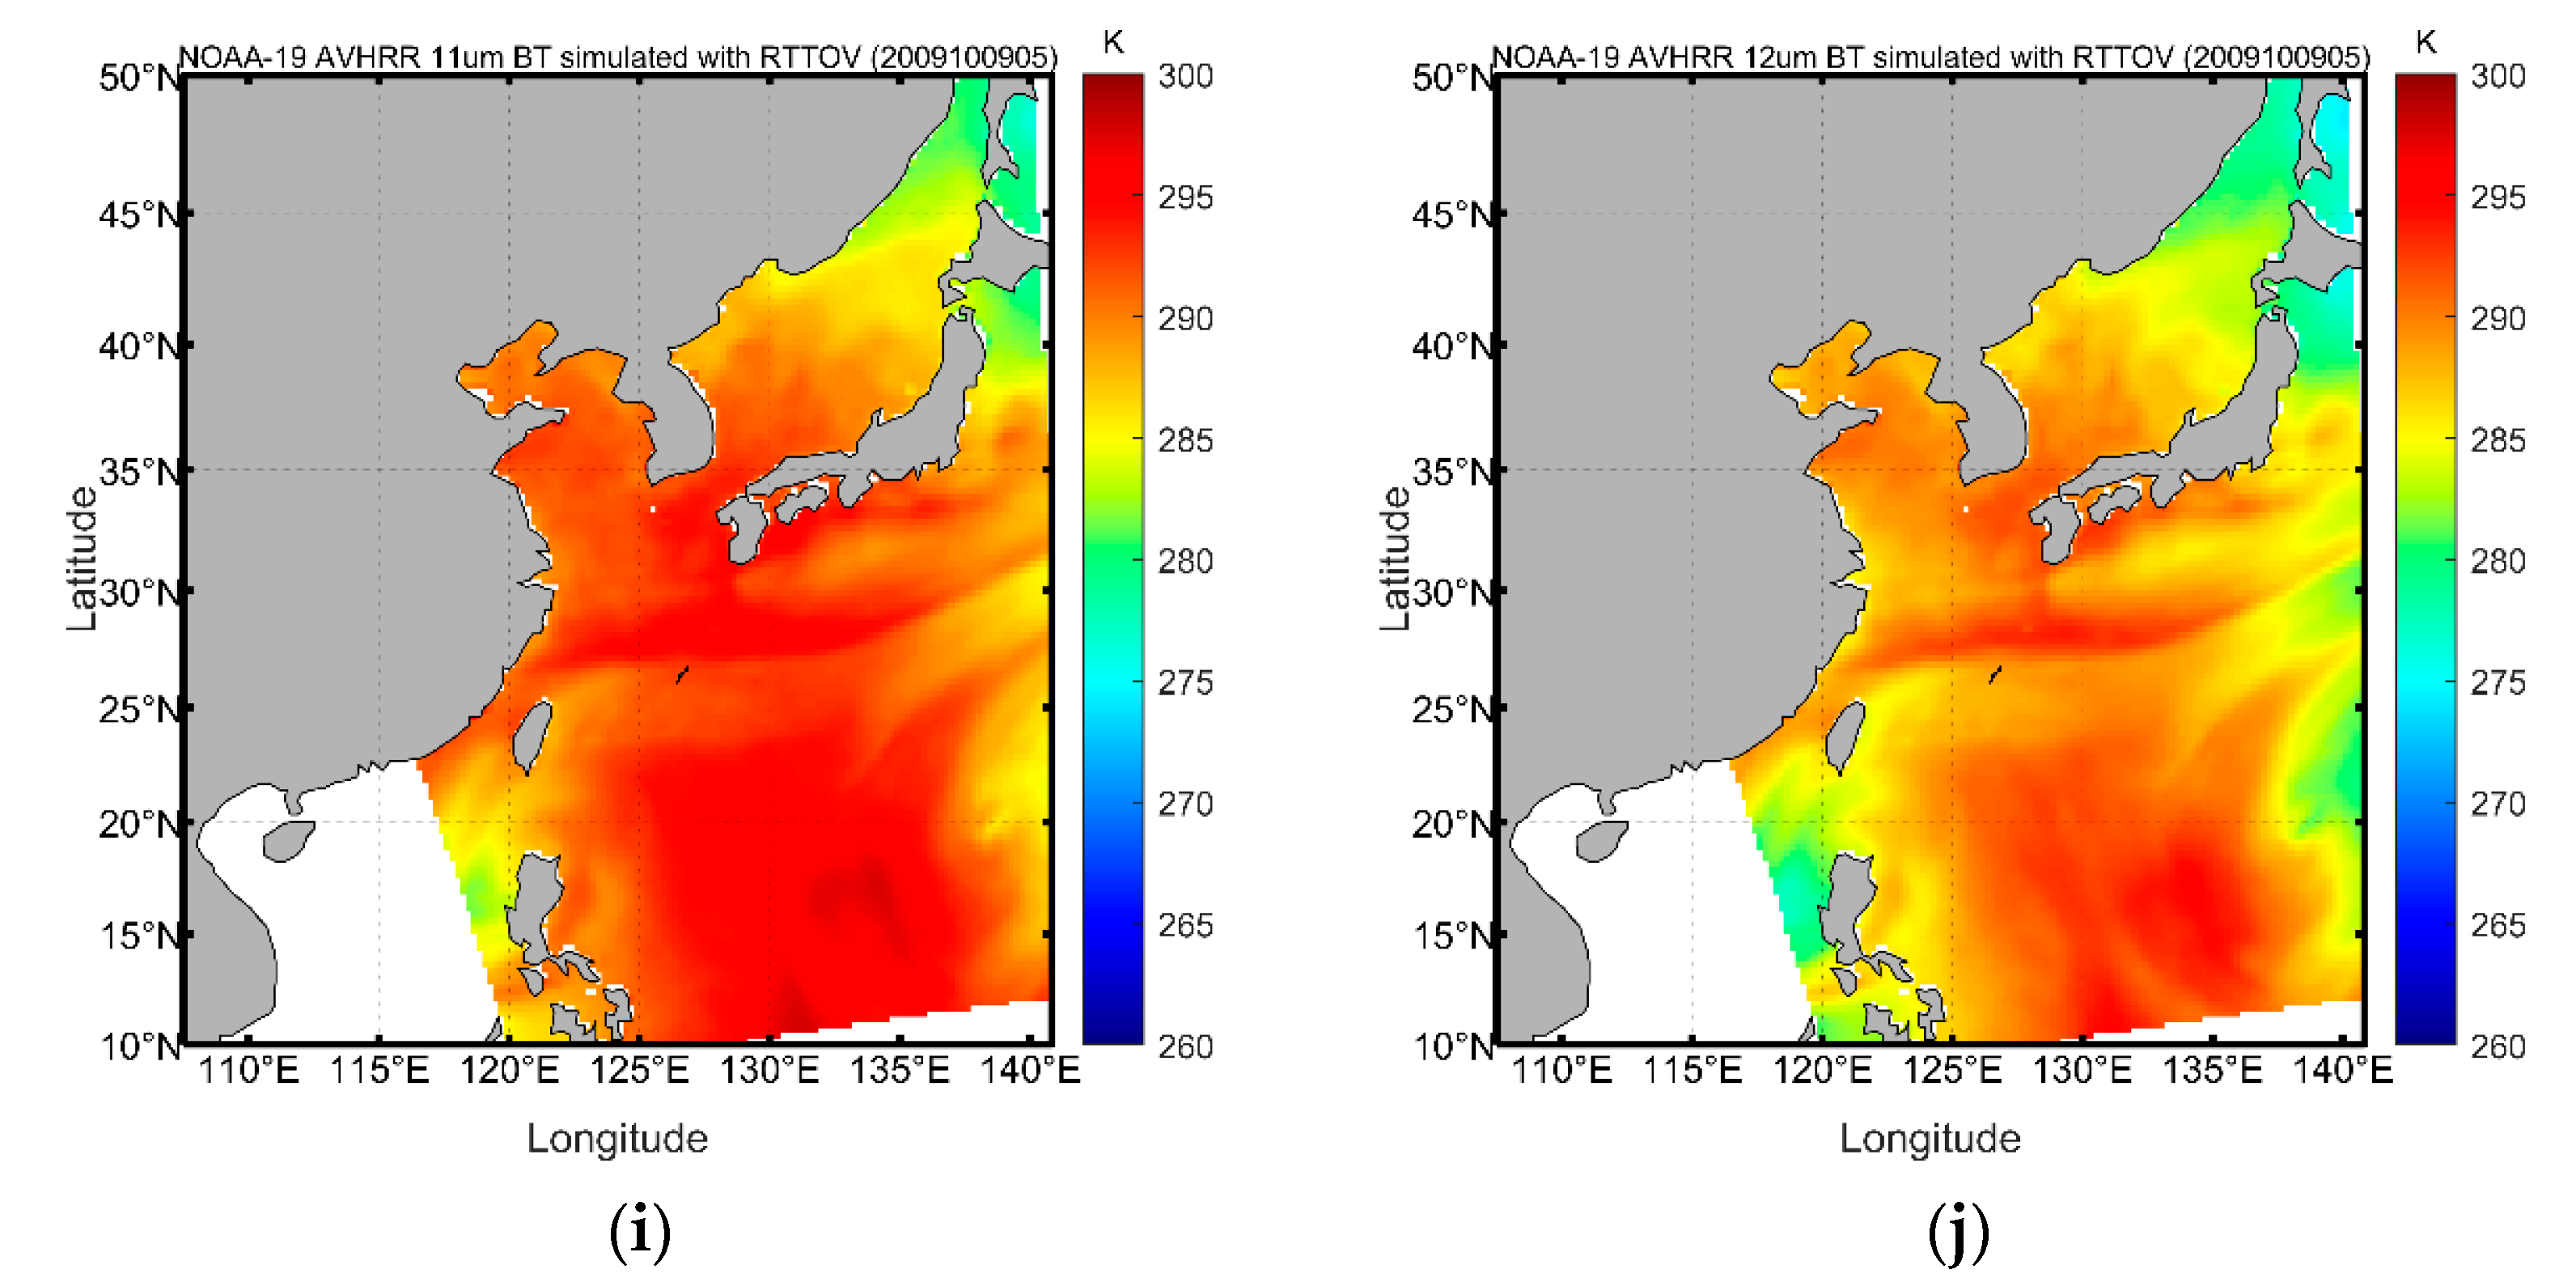
2.2.1. Simulation Using the Atmospheric Radiative Transfer Model

The radiative transfer for TOVS (RTTOV) is a fast radiative transfer model. It can simulate the radiances for visible, infrared, and microwave radiometers given an atmospheric profile as the state vector [20]. Since RTTOV had high efficiency and accuracy [20], in this study, we used the RTTOV model to simulate the NOAA-15/16/17/18/19 AVHRR thermal infrared spectral channel (11 and 12 μm) BTs. The RTTOV 12.3 model was used, and the ERA5 surface and atmospheric data, satellite zenith angles, and solar zenith angles were used as the input data of the RTTOV model. The ERA5 surface data included SSTskin, 2 m temperature, 2 m dewpoint temperature, surface pressure, 10 m u-component of wind, and 10 m v-component of wind. The ERA5 atmospheric data included atmospheric pressure, ozone mass mixing ratio, specific humidity. and atmospheric temperature. And the 54-layer atmospheric profiles were used to calculate the interlayer transmittance. To maximize the stable operational time and the in-orbit time of each satellite, for each satellite, we considered a period from 2005 to 2009 for simulations [10]. Table 1 lists the specific periods for each satellite.
Figure 1 shows the spatial distribution of the simulated BTs of the 11 and 12 μm channels for NOAA-15/16/17/18 on 9 October 2006 and NOAA-19 on 9 October 2009, respectively. The gray areas indicate land, and the white areas indicate areas out of satellite coverage. All the simulated BTs will be used for the Bayesian cloud detection and the OE SST algorithm in the following study.

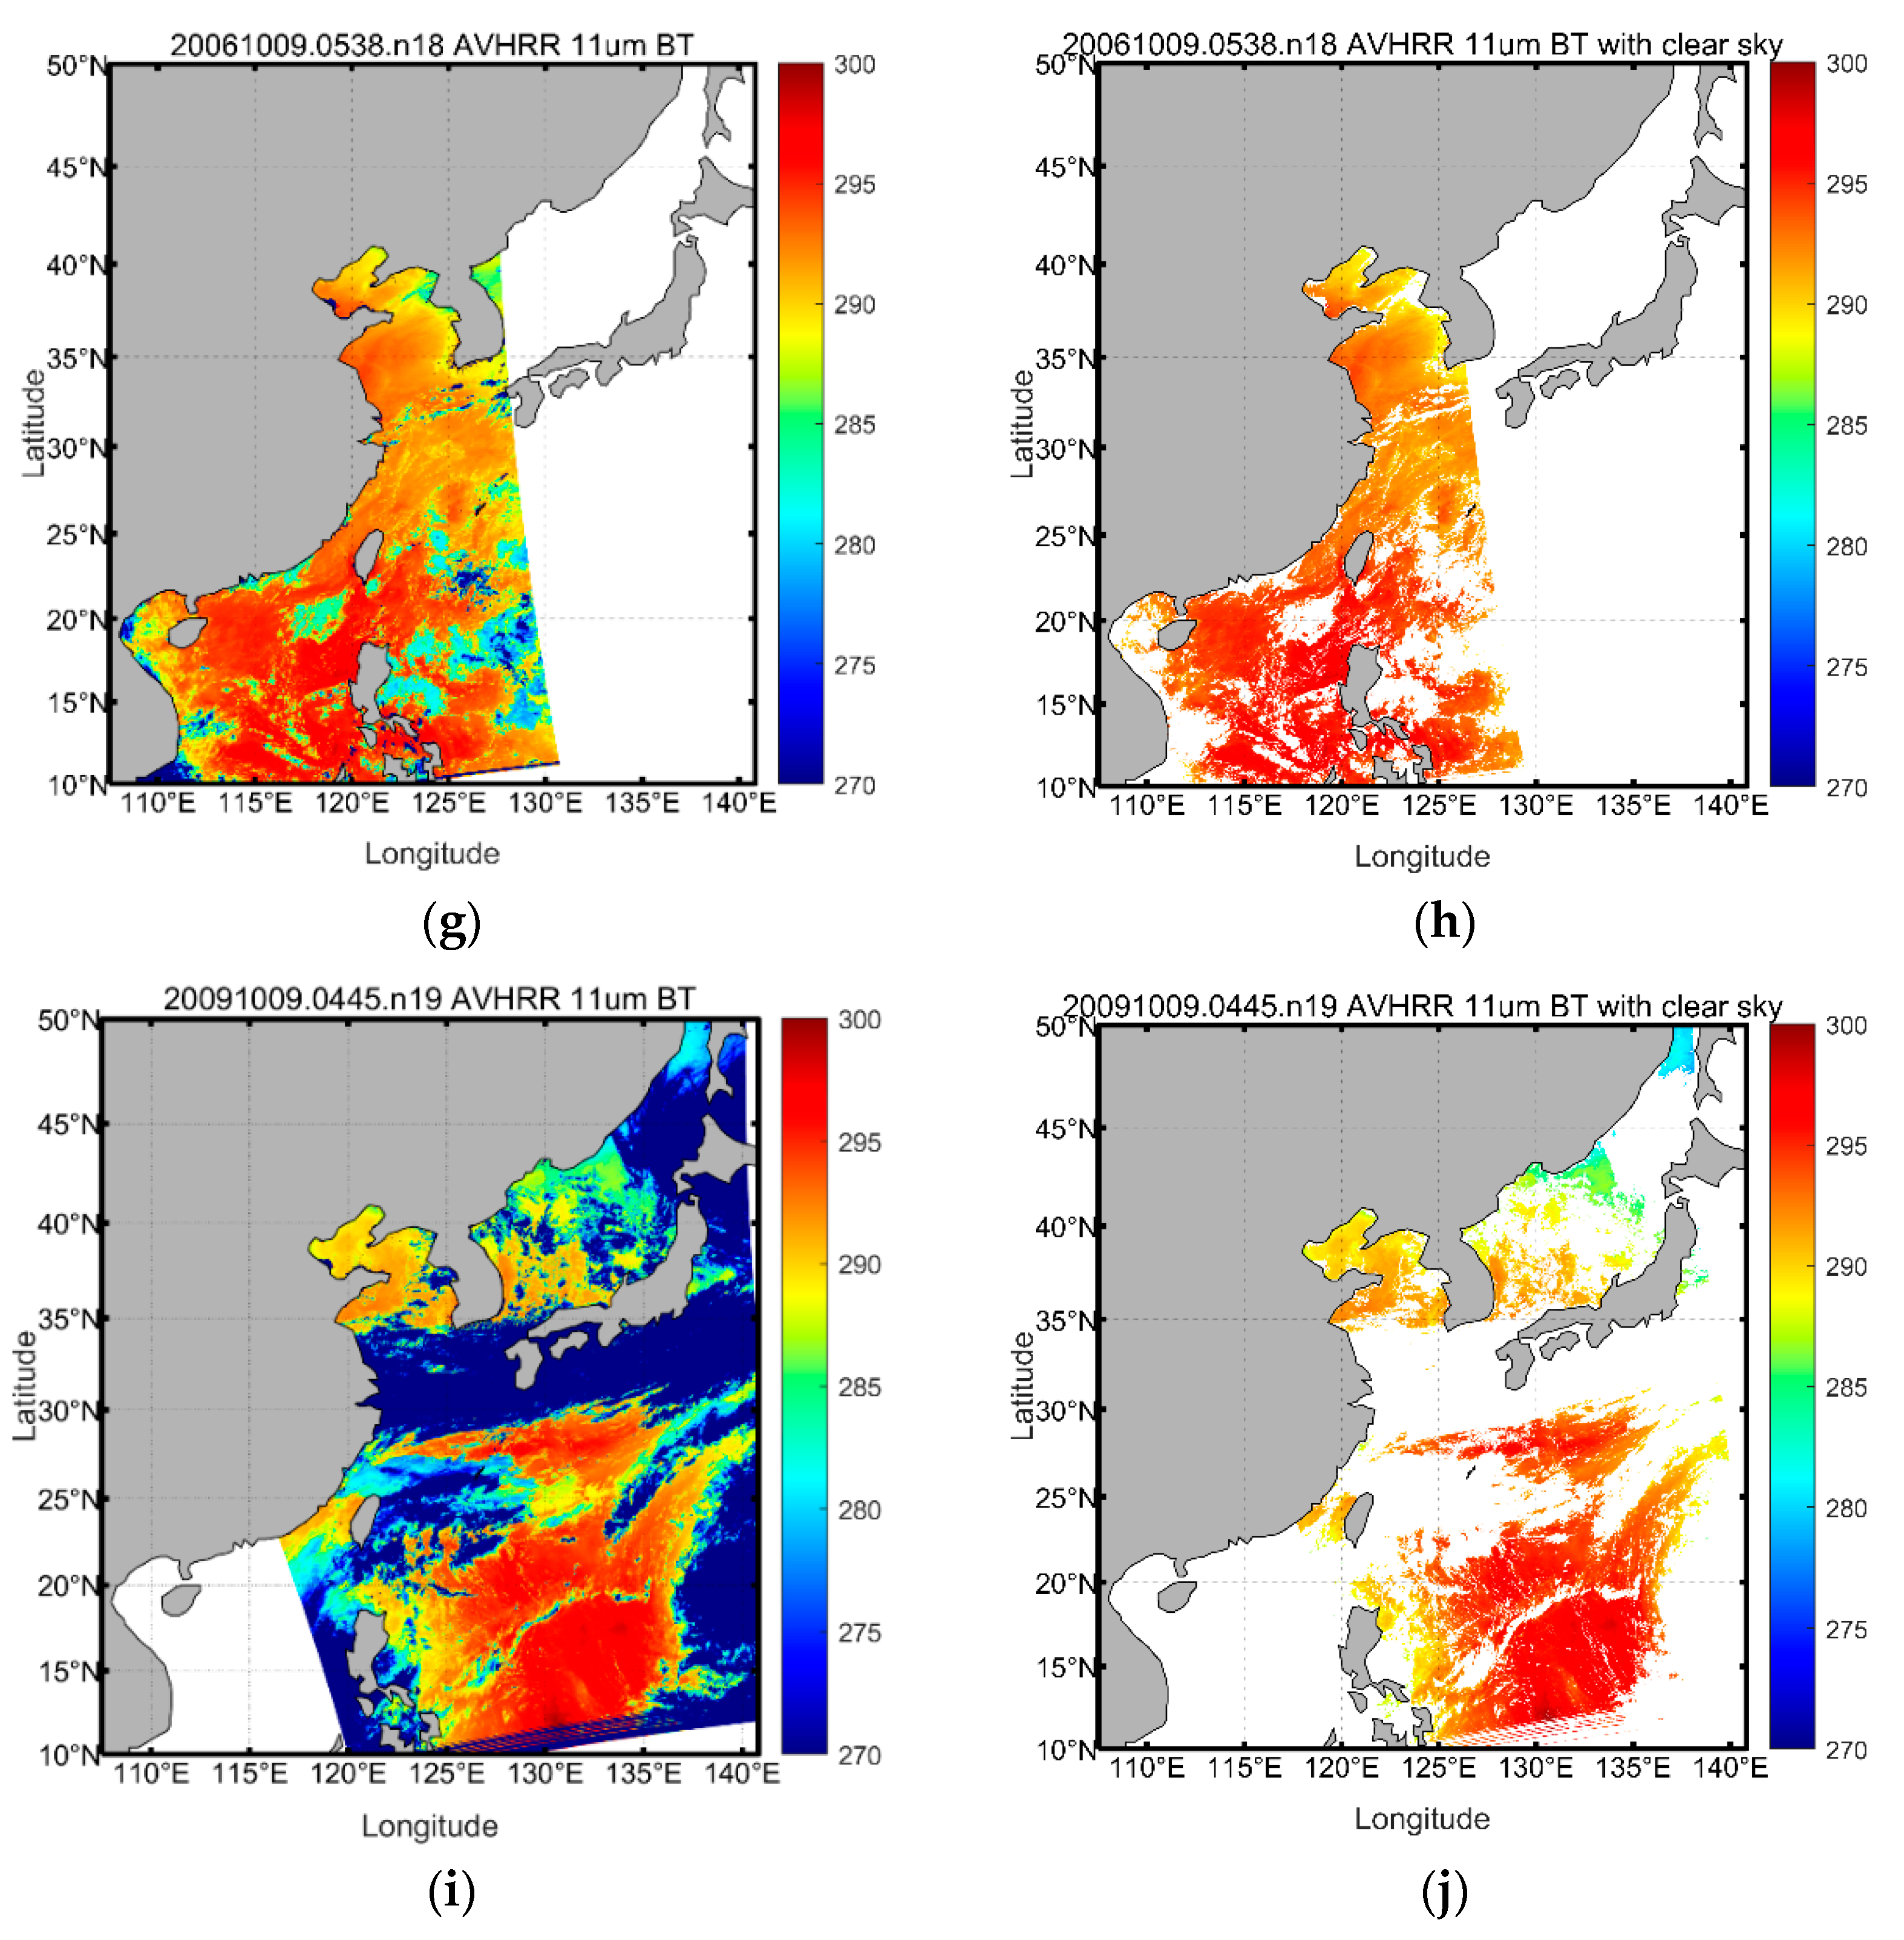
2.2.2. Cloud Detection

The Bayesian cloud detection method gives the probability of a clear sky of each pixel, and it can flexibly pick up the cloudy pixels by setting the probability of a clear sky. Thus, in this study, we employed the Bayesian cloud detection method for cloud detection [21,22]. This method was first proposed by Merchant, and the probability of a clear sky is expressed as follows [21,22]:
P c y o , x b = P y o x b , c P x b c P ( c ) P y o x b P ( x b )
where P is the probability or probability density function, c is the state of the prior clear sky, y o is the observation vector, and x b is the background vector [21,22]. The background state is independent of the probability of a clear sky. Thus, P x b c = P ( x b ) , and the probability density function consists of the clear and cloudy sky conditions, simplifying Equation (1) to Equation (2), where c ¯ represents the state of the prior cloudy sky [21,22].
P c y o , x b = 1 + P c ¯ P y o x b , c ¯ P c P y o x b , c 1
The observation vector y o comprises the spectral and texture parts, y s o and y t o , respectively. Thus, P y o x b , c ¯ and P y o x b , c can also be expressed as Equations (3) and (4), respectively [21,22].
P y o x b , c = P y s o x b , c × P y t o x b , c
P y o x b , c ¯ = P y s o x b , c ¯ × P y t o x b , c ¯
P y s o x b , c can be calculated based on the observation and background vectors [21,22]. P y t o x b , c , P y s o x b , c ¯ , and P y t o x b , c ¯ can be obtained through the AVHRR Probability Density Functions (PDFs) lookup tables, which are provided by the ESA CCI SST project [23]. Finally, based on these probabilities, P c y o , x b can be calculated pixel-to-pixel.
To screen out cloudy pixels at the utmost, the pixels whose probabilities are greater than 0.9 are deemed to be clear-sky pixels. The 11 μm channel BTs before and after the Bayesian cloud detection for NOAA-15/16/17/18 on 9 October 2006 and NOAA-19 on 9 October 2009 are shown in Figure 2. The gray areas indicate land, and the white areas indicate cloudy areas or areas out of satellite coverage.

2.2.3. SST Retrieval

The OE SST algorithm was used in this study. Unlike retrieval algorithms based on coefficient fitting with buoy SST, the OE SST algorithm is based on the atmospheric radiative transfer model, and AVHRR SSTskin can be obtained using the OE SST algorithm. The OE SST algorithm is expressed in Equation (5) [24,25,26].
z ^ = z x a + K T S ε 1 K + S a 1 1 K T S ε 1 y 0 F x a
where z ^ is the matrix consisting of the retrieved SSTskin and TCWV, z x a is the matrix consisting of the background SSTskin and TCWV, K is the partial derivatives of the simulated BT for the background SSTskin and TCWV, S ε is the covariance matrix of the simulated and satellite observed BTs, S a is the covariance matrix of the background SSTskin and TCWV, y 0 is the satellite observed BTs, and F x a is the BTs simulated using RTTOV [24,25,26]. Figure 3 shows the AVHRR SSTskin retrieved by the OE SST algorithm for NOAA-15/16/17/18 on 9 October 2006 and NOAA-19 on 9 October 2009. The gray areas indicate land, and the white areas indicate cloudy areas or areas out of satellite coverage.

3. Results

Due to the lack of in situ SSTskin, the NOAA-15/16/17/18/19 AVHRR SSTskin from 2005 to 2009 was matched with the iQuam buoy SST to validate the accuracy of the AVHRR SSTskin. To ensure the statistical independence of the matchups, the original spatial resolution AVHRR SSTskin was projected into a 0.01° × 0.01° grid within the regional area of 105°E–145°E and 10°N–50°N. The temporal window of the matchups was 30 min, and the spatial window was within 0.01°. A total of 39,670 matchups, including 19,412 and 20,258 matchups during daytime and nighttime, respectively, were finally obtained. Table 2 summarizes the numbers and statistics of the matchups for each satellite. The daytime biases of the five satellites range from −0.32 °C (NOAA-16) to 0.08 °C (NOAA-17) with SDs ranging from 0.36 °C (NOAA-18/NOAA-19) to 0.60 °C (NOAA-16). The nighttime biases of the five satellites range from −0.26 °C (NOAA-16) to −0.02 °C (NOAA-17) with SDs ranging from 0.33 °C (NOAA-19) to 0.60 °C (NOAA-16).
Figure 4 shows a histogram distribution of the biases of the matchups between NOAA/AVHRR SSTskin and buoy SST. Most biases of the matchups for each satellite are near 0 °C during daytime and nighttime and decrease from 0 °C on both sides. The proportions of the matchup biases within ±0.5 °C for NOAA-15/16/17/18/19 are 74.45%, 60.07%, 77.99%, 80.03%, and 80.27% during daytime and 77.48%, 61.59%, 78.04%, 81.73%, and 84.23% during nighttime. The matchup biases for each satellite show a weak cold-tail distribution, indicating that the NOAA/AVHRR SSTskin is slightly lower than the buoy SST. This is mainly attributed to the difference between the SSTskin and the bulk sea water temperature. The buoy measures the bulk sea water temperature, whereas the infrared radiometer measures the SSTskin, which has a 0.17 °C negative bias for the bulk sea water temperature [27]. The biases and SDs for NOAA-16 are slightly greater than those of other satellites in Figure 4. This is attributed to the quality degradation of the data images [14], and the unstable correction of NOAA-16 AVHRR can also reduce the data quality [28].
Figure 5 shows scatterplots of the biases of the matchups between the NOAA/AVHRR SSTskin and buoy SST. NOAA/AVHRR SSTskin agrees well with the buoy SSTs for most satellites, but NOAA-16 AVHRR SSTskin is slightly lower than buoy SST within a temperature range from 0 °C to 20 °C, owing to the data quality degradation.

4. Discussion

The operational MCSSTs of NOAA series satellites processed by the TeraScan system from 2001 to 2016 have been evaluated. The MCSSTs for each satellite have obvious pixels in cloud conditions at night, especially for NOAA-16 and NOAA-18, and the accuracy of the MCSSTs for each satellite are poor and inconsistent in different periods [29]. The statistics of the matchups between the MCSSTs of each satellite and iQuam buoy SSTs from 2005 and 2009 are summarized in Table 3, and the specific time periods of each satellite are the same in Table 1. Compared with the MCSSTs in the same period, the SSTskin reprocessed using the Bayesian cloud detection method and the OE SST algorithm have higher accuracy, and there are no obvious cloud missing pixels during both daytime and nighttime. The data quality of each satellite is greatly improved, especially for NOAA-18: the daytime bias increases from −0.25 °C to −0.15 °C, and the nighttime bias increases from −0.52 °C to −0.08 °C; both the SDs are within 0.37 °C. Moreover, the data qualities of all five satellites are similar and consistent during both daytime and nighttime. The biases range from −0.32 °C to 0.08 °C, the SDs are within 0.60 °C, and the accuracy the AVHRR data of NOAA series satellites is significantly improved.
The dependency of NOAA/AVHRR SSTskin minus buoy SSTs on satellite zenith angle and TCWV has been checked, seen in Figure 6 and Figure 7, respectively. Figure 6 shows that the biases between NOAA/AVHRR SSTskin and the buoy SSTs do not depend on the satellite zenith angles for each satellite. However, we can see that the biases between NOAA/AVHRR SSTskin and the buoy SSTs have a weak dependency on TCWV in Figure 7. With increasing TCWV, the biases gradually change from negative to positive, and most of the biases are within ±0.5 °C. This may be caused by the sensitivity of the OESST retrieval algorithm on the prior background field. Further research is needed on this sensitivity.

5. Conclusions

In this study, we reprocessed the NOAA HRPT data received by the OUC satellite ground station. Based on the atmospheric radiative transfer model, the background field state value, simulated BTs, and observed BTs of NOAA/AVHRR thermal infrared channels were used for Bayesian cloud detection. The OE SST retrieval algorithm was then employed to obtain the NOAA-15/16/17/18/19 AVHRR SSTskin data on the clear-sky AVHRR pixels. Comparing the NOAA/AVHRR SSTskin with the buoy SST, the daytime biases range from −0.32 °C (NOAA-16) to 0.08 °C (NOAA-17) with SDs ranging from 0.36 °C (NOAA-18/ NOAA-19) to 0.60 °C (NOAA-16), and the nighttime biases range from −0.26 °C (NOAA-16) to −0.02 °C (NOAA-17) with SDs ranging from 0.33 °C (NOAA-19) to 0.60 °C (NOAA-16). The accuracy of all five satellite data during daytime and nighttime was significantly improved. In our future studies, we will do further research on the sensitivity of the OESST algorithm which is caused by the temporal and spatial variation of the prior background field to improve the data accuracy. Furthermore, only data from 2005 to 2009 were considered for reprocessing, and we will continue to reprocess the NOAA HRPT data and generate NOAA/AVHRR SSTskin data products with high spatial resolution to aid the study of marine phenomena in the Northwest Pacific Ocean.

Author Contributions

Conceptualization, Y.C. and L.G.; methodology, Y.C., Z.L. and L.G.; software, Y.C. and Z.L.; formal analysis, Y.C., Z.L., L.G. and L.Q.; data curation, Y.C. and L.Q.; writing—original draft preparation, Y.C.; writing—review and editing, Y.C., Z.L., L.G. and L.Q.; funding acquisition, L.G. All authors have read and agreed to the published version of the manuscript.

Funding

This research was supported by the 2022 Research Program of Sanya Yazhou Bay Science and Technology City, grant number SKJC-2022-01-001, and by the National Key R & D Program of China, grant number 2019YFA0607001.

Data Availability Statement

The datasets analyzed in this paper are publicly available at https://climate.copernicus.eu/climate-reanalysis (accessed on 31 December 2020) and https://www.star.nesdis.noaa.gov/socd/sst/iquam/data.html (accessed on 31 August 2021).

Acknowledgments

The authors thank the OUC ground station for providing the NOAA/AVHRR HRPT data. ERA5 data were provided by ECMWF, and iQuam data were provided by NOAA NESDIS STAR.

Conflicts of Interest

The authors declare no conflict of interest.

References

  1. Martin, S. An Introduction to Ocean Remote Sensing; Cambridge University Press: Cambridge, UK, 2014. [Google Scholar]
  2. Cracknell, A.P. The Advanced Very High Resolution Radiometer; CRC Press: London, UK, 1997; ISBN 9780748402090. [Google Scholar]
  3. Bhatt, R.; Doelling, D.R.; Scarino, B.R.; Gopalan, A.; Haney, C.O.; Minnis, P.; Bedka, K.M. A Consistent AVHRR Visible Calibration Record Based on Multiple Methods Applicable for the NOAA Degrading Orbits. Part I: Methodology. J. Atmos. Ocean. Technol. 2016, 33, 2499–2515. [Google Scholar] [CrossRef]
  4. Kilpatrick, K.A.; Podestá, G.P.; Evans, R. Overview of the NOAA/NASA Advanced Very High Resolution Radiometer Pathfinder Algorithm for Sea Surface Temperature and Associated Matchup Database. J. Geophys. Res. 2001, 106, 9179–9197. [Google Scholar] [CrossRef]
  5. Walton, C.C.; Pichel, W.G.; Sapper, J.F.; May, D.A. The Development and Operational Application of Nonlinear Algorithms for the Measurement of Sea Surface Temperatures with the NOAA Polar-Orbiting Environmental Satellites. J. Geophys. Res. Ocean. 1998, 103, 27999–28012. [Google Scholar] [CrossRef]
  6. Casey, K.S.; Brandon, T.B.; Cornillon, P.; Evans, R. The Past, Present and Future of the AVHRR Pathfinder SST Program. In Oceanography from Space; Springer: Dordrecht, The Netherlands, 2010; pp. 273–287. [Google Scholar]
  7. Saha, K.; Zhao, X.; Zhang, H.M.; Casey, K.S.; Zhang, D.; Baker-Yeboah, S.; Kilpatrick, K.A.; Evans, R.H.; Ryan, T.; Relph, J.M. AVHRR Pathfinder Version 5.3 Level 3 Collated (L3C) Global 4 km Sea Surface Temperature for 1981-Present; NOAA National Centers for Environmental Information: Asheville, NC, USA, 2018.
  8. Qiu, C.H.; Wang, D.X.; Kawamura, H.; Guan, L.; Qin, H.L. Validation of AVHRR and TMI-Derived Sea Surface Temperature in the Northern South China Sea. Cont. Shelf Res. 2009, 29, 2358–2366. [Google Scholar] [CrossRef]
  9. Rayner, N.; Good, S.; Block, T.; Evadzi, P.; Embury, O. SST CCI Phase-II SST CCI Product User Guide; SST_CCI-PUG-UKMO-201. 2019. Available online: https://climate.esa.int/media/documents/SST_cci_PUG_v2.pdf (accessed on 8 April 2019).
  10. Merchant, C.J.; Embury, O.; Bulgin, C.E.; Block, T.; Corlett, G.K.; Fiedler, E.; Good, S.A.; Mittaz, J.; Rayner, N.A.; Berry, D.; et al. Satellite-Based Time-Series of Sea-Surface Temperature Since 1981 for Climate Applications. Sci. Data 2019, 6, 223. [Google Scholar] [CrossRef] [PubMed] [Green Version]
  11. Lee, M.A.; Chang, Y.; Sakaida, F.; Kawamura, H.; Cheng, C.H.; Chan, J.W.; Huang, I. Validation of Satellite-Derived Sea Surface Temperatures for Waters around Taiwan. Terr. Atmos. Ocean. Sci. 2005, 16, 1189–1204. [Google Scholar] [CrossRef] [Green Version]
  12. Park, K.A.; Lee, E.Y.; Chung, S.R.; Sohn, E.H. Accuracy Assessment of Sea Surface Temperature from NOAA/AVHRR Data in the Seas around Korea and Error Characteristics. Korean J. Remote Sens. 2011, 27, 663–675. [Google Scholar] [CrossRef]
  13. Park, K.A.; Lee, E.Y.; Li, X.F.; Chung, S.R.; Sohn, E.H.; Hong, S. NOAA/AVHRR sea surface temperature accuracy in the East/Japan Sea. Int. J. Digit. Earth 2015, 8, 784–804. [Google Scholar] [CrossRef]
  14. Ignatov, A.; Zhou, X.J.; Petrenko, B.; Liang, X.M.; Kihai, Y.; Dash, P.; Stroup, J.; Sapper, J.; DiGiacomo, P. AVHRR GAC SST Reanalysis Version 1 (RAN1). Remote Sens. 2016, 8, 315. [Google Scholar] [CrossRef] [Green Version]
  15. Bulgin, C.E.; Mittaz, J.P.D.; Embury, O.; Eastwood, S.; Merchant, C.J. Bayesian Cloud Detection for 37 Years of Advanced Very High Resolution Radiometer (AVHRR) Global Area Coverage (GAC) Data. Remote Sens. 2018, 10, 97. [Google Scholar] [CrossRef] [Green Version]
  16. Minnett, P.J.; Kaiser-Weiss, A.K. Group for High Resolution Sea-Surface Temperature Discussion Document: Near-Surface Oceanic Temperature Gradients. 2012. Available online: https://www.ghrsst.org/wp-content/uploads/2021/04/SSTDefinitionsDiscussion.pdf (accessed on 6 September 2020).
  17. Xu, F.; Ignatov, A. In Situ SST Quality Monitor (iQuam). J. Atmos. Ocean. Technol. 2014, 31, 164–180. [Google Scholar] [CrossRef]
  18. Xu, F.; Ignatov, A. Evaluation of In Situ Sea Surface Temperatures for Use in the Calibration and Validation of Satellite Retrievals. J. Geophys. Res. 2010, 115, C09022. [Google Scholar] [CrossRef]
  19. Hersbach, H.; Bell, B.; Berrisford, P.; Hirahara, S.; Horányi, A.; Muñoz-Sabater, J.; Nicolas, J.; Peubey, C.; Radu, R.; Schepers, D.; et al. The ERA5 Global Reanalysis. Q. J. R. Meteorol. Soc. 2020, 146, 1999–2049. [Google Scholar] [CrossRef]
  20. Saunders, R.; Hocking, J.; Turner, E.; Rayer, P.; Rundle, D.; Brunel, P.; Vidot, J.; Roquet, P.; Matricardi, M.; Geer, A.; et al. An Update on the RTTOV Fast Radiative Transfer Model (Currently at Version 12). Geosci. Model Dev. 2018, 11, 2717–2737. [Google Scholar] [CrossRef] [Green Version]
  21. Merchant, C.J.; Old, C.; Embury, O.; MacCallum, S. Generalized Bayesian Cloud Screening; Algorithm Theoretical Basis Version 2.1; School of Geosciences: Edinburgh, UK, 2008. [Google Scholar]
  22. Pearson, K.; Embury, O.; Bulgin, C. Bayesian Cloud Detection Algorithm Theoretical Basis Document. 2014. Available online: https://www-cdn.eumetsat.int/files/2020-04/pdf_bay_clo_atbd.pdf (accessed on 20 November 2014).
  23. SST CCI Auxiliary Datasets. Available online: https://zenodo.org/record/2586714#.YGWWWa8zaUk (accessed on 7 April 2021).
  24. Merchant, C.J.; Le Borgne, P.; Marsouin, A.; Roquet, H. Optimal Estimation of Sea Surface Temperature from Split-Window Observations. Remote Sens. Environ. 2008, 112, 2469–2484. [Google Scholar] [CrossRef]
  25. Merchant, C.J.; Le Borgne, P.; Roquet, H.; Marsouin, A. Sea Surface Temperature from a Geostationary Satellite by Optimal Estimation. Remote Sens. Environ. 2009, 113, 445–457. [Google Scholar] [CrossRef]
  26. Merchant, C.J.; Le Borgne, P.; Roquet, H.; Legendre, G. Extended Optimal Estimation Techniques for Sea Surface Temperature from the Spinning Enhanced Visible and Infra-Red Imager (SEVIRI). Remote Sens. Environ. 2013, 131, 287–297. [Google Scholar] [CrossRef]
  27. Donlon, C.J.; Minnett, P.J.; Gentemann, C.; Nightingale, T.J.; Barton, I.J.; Ward, B.; Murray, M.J. Toward Improved Validation of Satellite Sea Surface Skin Temperature Measurements for Climate Research. J. Clim. 2002, 14, 353–369. [Google Scholar] [CrossRef]
  28. Dash, P.; Ignatov, A.; Kihai, Y.; Sapper, J. The SST Quality Monitor (SQUAM). J. Atmos. Ocean. Technol. 2010, 27, 1899–1917. [Google Scholar] [CrossRef]
  29. Chen, Y.; Qu, L.Q.; Guan, L. Evaluation of NOAA/AVHRR Sea Surface Temperature at Full HRPT Resolution in the Northwest Pacific Ocean. J. Ocean Univ. China 2021, 20, 1431–1439. [Google Scholar] [CrossRef]
Figure 1. RTTOV simulated BTs of the 11 and 12 μm channels for NOAA/AVHRR: (a) NOAA-15 11 μm channel; (b) NOAA-15 12 μm channel; (c) NOAA-16 11μm channel; (d) NOAA-16 12 μm channel; (e) NOAA-17 11μm channel; (f) NOAA-17 12μm channel; (g) NOAA-18 11 μm channel; (h) NOAA-18 12 μm channel; (i) NOAA-19 11 μm channel; (j) NOAA-19 12 μm channel. (The gray areas indicate land, and the white areas indicate areas out of the satellite coverage.)
Remotesensing 15 03723 g001aRemotesensing 15 03723 g001bRemotesensing 15 03723 g001c
Figure 2. NOAA/AVHRR 11 μm channel BTs before and after Bayesian cloud detection: (a) NOAA-15 before cloud detection; (b) NOAA-15 after cloud detection; (c) NOAA-16 before cloud detection; (d) NOAA-16 after cloud detection; (e) NOAA-17 before cloud detection; (f) NOAA-17 after cloud detection; (g) NOAA-18 before cloud detection; (h) NOAA-18 after cloud detection; (i) NOAA-19 before cloud detection; (j) NOAA-19 after cloud detection. (The gray areas indicate land, and the white areas indicate cloudy areas or areas out of satellite coverage.)
Remotesensing 15 03723 g002aRemotesensing 15 03723 g002b
Figure 3. NOAA/AVHRR SSTskin retrieved by the OE SST algorithm: (a) NOAA-15 on 9 October 2006, at 21:09; (b) NOAA-16 on 9 October 2006, at 19:00; (c) NOAA-17 on 9 October 2006, at 02:36; (d) NOAA-18 on 9 October 2006, at 05:38; (e) NOAA-19 on 9 October 2009, at 04:45. (The gray areas indicate land, and the white areas indicate cloudy areas or areas out of the satellite coverage).
Remotesensing 15 03723 g003
Figure 4. Histogram of biases between NOAA/AVHRR SSTskin and buoy SST: (a) NOAA-15, daytime; (b) NOAA-15, nighttime; (c) NOAA-16, daytime; (d) NOAA-16, nighttime; (e) NOAA-17, daytime; (f) NOAA-17, nighttime; (g) NOAA-18, daytime; (h) NOAA-18, nighttime; (i) NOAA-19, daytime; (j) NOAA-19, nighttime.
Remotesensing 15 03723 g004aRemotesensing 15 03723 g004b
Figure 5. Scatterplots of biases between NOAA/AVHRR SSTskin and buoy SSTs: (a) NOAA-15, daytime; (b) NOAA-15, nighttime; (c) NOAA-16, daytime; (d) NOAA-16, nighttime; (e) NOAA-17, daytime; (f) NOAA-17, nighttime; (g) NOAA-18, daytime; (h) NOAA-18, nighttime; (i) NOAA-19, daytime; (j) NOAA-19, nighttime.
Remotesensing 15 03723 g005aRemotesensing 15 03723 g005b
Figure 6. Dependency of NOAA/AVHRR SSTskin minus buoy SSTs on satellite zenith angle: (a) NOAA-15, daytime; (b) NOAA-15, nighttime; (c) NOAA-16, daytime; (d) NOAA-16, nighttime; (e) NOAA-17, daytime; (f) NOAA-17, nighttime; (g) NOAA-18, daytime; (h) NOAA-18, nighttime; (i) NOAA-19, daytime; (j) NOAA-19, nighttime.
Remotesensing 15 03723 g006aRemotesensing 15 03723 g006b
Figure 7. Dependency of NOAA/AVHRR SSTskin minus buoy SSTs on TCWV: (a) NOAA-15, daytime; (b) NOAA-15, nighttime; (c) NOAA-16, daytime; (d) NOAA-16, nighttime; (e) NOAA-17, daytime; (f) NOAA-17, nighttime; (g) NOAA-18, daytime; (h) NOAA-18, nighttime; (i) NOAA-19, daytime; (j) NOAA-19, nighttime.
Remotesensing 15 03723 g007aRemotesensing 15 03723 g007b
Table 1. Periods of NOAA/AVHRR for RTTOV simulation.
SatelliteOrbitTime
(Month/Day/Year)
NOAA-15AM1 January 2005 to 31 December 2009
NOAA-16PM1 January 2005 to 31 December 2006
NOAA-17AM1 January 2005 to 31 December 2009
NOAA-18PM3 September 2005 to 31 December 2009
NOAA-19PM23 July 2009 to 31 December 2009
Table 2. Statistics of the AVHRR SSTskin and iQuam buoy SST matchup datasets during daytime and nighttime.
SatelliteTimeNumbersMin (°C)Max (°C)Bias (°C)SD (°C)Median (°C)RSD (°C)
NOAA-15Day4786−1.351.03−0.160.42−0.150.39
Night4582−1.281.12−0.080.41−0.080.39
NOAA-16Day1803−1.961.39−0.320.60−0.280.56
Night1981−1.861.53−0.260.60−0.140.56
NOAA-17Day6574−1.131.300.080.410.090.40
Night7264−1.241.20−0.020.42−0.010.40
NOAA-18Day4992−1.200.92−0.150.36−0.140.35
Night5442−1.181.04−0.080.37−0.070.36
NOAA-19Day1257−1.220.97−0.130.36−0.120.37
Night989−1.000.84−0.100.33−0.080.30
Table 3. Statistics of the AVHRR MCSSTs and iQuam buoy SSTs matchup datasets during daytime and nighttime.
SatelliteTimeNumbersMin (°C)Max (°C)Bias (°C)SD (°C)Median (°C)RSD (°C)
NOAA-15Day6099−2.302.10−0.150.76−0.050.67
Night8011−2.702.10−0.330.82−0.250.74
NOAA-16Day1810−2.551.80−0.380.75−0.350.67
Night5014−3.001.80−0.640.84−0.550.82
NOAA-17Day6543−1.851.65−0.100.64−0.100.59
Night15534−2.501.90−0.370.76−0.300.74
NOAA-18Day4970−2.251.75−0.250.69−0.200.67
Night11279−2.651.75−0.520.78−0.450.74
NOAA-19Day1197−1.551.55−0.020.550.000.52
Night2078−2.151.85−0.230.67−0.150.67
Disclaimer/Publisher’s Note: The statements, opinions and data contained in all publications are solely those of the individual author(s) and contributor(s) and not of MDPI and/or the editor(s). MDPI and/or the editor(s) disclaim responsibility for any injury to people or property resulting from any ideas, methods, instructions or products referred to in the content.

