Technical Note

Evaluation of Five Global Top-of-Atmosphere Outgoing Longwave Radiation Products

1
School of Resources and Environmental Engineering, Wuhan University of Science and Technology, Wuhan 430081, China
2
CCCC Second Highway Consultants Co., Ltd., Wuhan 430056, China
3
School of Architecture, Tsinghua University, Beijing 100084, China
4
State Key Laboratory of Resources and Environment Information System, Institute of Geographic Sciences and Natural Resources Research, Chinese Academy of Sciences, Beijing 100101, China
*
Author to whom correspondence should be addressed.
Remote Sens. 2023, 15(15), 3722; https://doi.org/10.3390/rs15153722
Submission received: 28 June 2023 / Revised: 11 July 2023 / Accepted: 17 July 2023 / Published: 26 July 2023

Abstract

:
Five global monthly top-of-atmosphere (TOA) outgoing longwave radiation (OLR) products are evaluated in this study, including the products derived from the High-Resolution Infrared Radiation Sounder (HIRS), Clouds and the Earth’s Radiant Energy System (CERES), Advanced Very High Resolution Radiometer (AVHRR), the CM SAF cLoud, Albedo and surface RAdiation dataset from AVHRR data (CLARA), and the Global Energy and Water Cycle EXchanges (GEWEX) project. Results show that overall there is good consistency among these five products. Larger differences are found between GEWEX and CERES (HIRS) after (before) 2000 (RMSE ~ 5 W/m2), particularly in the tropical regions. In terms of global mean values, GEWEX shows large differences with the other products from the year 1992 to 2002, and CLARA shows large differences from the year 1979 to 1981, which are more obvious in the global ocean values. Large discrepancies among these products exist at low latitudinal bands, particularly before the year 2000. Australia and Asia (mid–low latitude part) are two typical regions in which larger differences are found.

1. Introduction

Top-of-atmosphere (TOA) outgoing longwave radiation (OLR), defined as the radiation emitted from the Earth’s surface and atmosphere to space, plays a crucial role in the Earth’s energy budget [1]. It has been widely used in climate research due to its ability to indicate the complicated atmospheric conditions and evaluate climate drivers and feedbacks [2]. Additionally, as a key component of the Earth’s energy budget at the top-of-atmosphere (TOA), accurate estimation of OLR is essential to the study of the Earth’s energy imbalance [3]. Remote sensing provides the only way to obtain global and regional OLR. Typically, OLR products are derived from radiative transfer simulations using the traditional two-step method (i.e., converting radiance to flux and then flux to OLR), and direct retrieval methods have also been used to obtain the TOA OLR. Using these methods, numerous satellite TOA OLR products have been derived since the 1980s [4,5,6,7,8,9,10,11].
Currently, these TOA OLR products are being widely used in various aspects. For instance, Rao et al. [12] used the TOA OLR product derived from Advanced Very High Resolution Radiometer (AVHRR) data to build a machine learning model for the estimation of daily average surface air temperature over the Tibetan Plateau. Compared to the AVHRR OLR, another globally gridded climate data record (CDR) for OLR using the High-Resolution Infrared Radiation Sounder (HIRS) sensor has the advantage of resolving the large diurnal cycle of OLR and thus has been used for identifying tropical subseasonal variabilities [13]. Spectrally resolved OLR products are also available from the Atmospheric Infrared Sounder (AIRS) and the Infrared Atmospheric Sounding Interferometer (IASI) sounders [14,15], and fourteen years of spectral fluxes derived from collocated AIRS and Clouds and the Earth’s Radiant Energy System (CERES) observations have been used to examine the trends of zonal mean spectral OLR and greenhouse efficiency in the Arctic [16].
To ensure that these products can be more effectively used, it is necessary to evaluate them. Since there are no in situ measurements at the TOA level, the evaluation of the TOA radiation products can only be performed via intercomparisons. For example, Zhan et al. (2018) intercompared CERES and the Multi-angle Imaging SpectroRadiometer (MISR) collocated instantaneous TOA albedos for overcast ocean and snow/ice scenes based on three years of summertime observations and found significant agreement between the CERES and MISR within the Arctic [17]. Zhan et al. (2019) intercompared five satellite TOA albedo products over land and found that the differences among these products in the high-latitude regions were relatively larger, which is different from the results of Zhan et al. (2018). Larger differences were also found during the years before 2000 [18]. Susskind et al. (2012) examined spatial anomaly time series of OLR as determined using observations from CERES and AIRS and found excellent agreement of the two OLR datasets in almost every detail [19]. Wang et al. (2021) presented the results of detailed validation tests with NOAA-20 Cross Track Infrared Sounder (CrIS) OLR at a global scale compared with CERES and Suomi National Polar-orbiting Partnership (SNPP) CrIS OLR products. Results show that the NOAA-20 CrIS OLR products agreed very well with the other two OLR products at all timescales [20]. Taylor et al. (2022) compared CERES TOA radiative fluxes with Arctic Radiation-IceBridge Sea and Ice Experiment (ARISE) airborne measurements, and results indicated excellent agreement in the longwave flux and good agreement in the shortwave flux [21]. From these studies, one can see that the existing intercomparisons are limited to no more than three TOA radiation products, although some studies exploited the OLR datasets from different instruments to evaluate the change in the OLR over time [20]. The different use of input cloud products also contributes to the biases among different products [22], which have their own advantages and disadvantages (e.g., the accuracy of CERES data is high, but their spatial resolutions are very coarse), and no study has systematically compared five TOA OLR products at the same time. In this study, five TOA OLR products are comprehensively evaluated to show their differences.
The organization of the remainder of this paper is as follows. Section 2 introduces the data and method used in this study. Section 3 shows the results and the corresponding analyses. Conclusions are drawn in the final section.

2. Data and Method

Table 1 shows the details of the five all-sky TOA OLR products evaluated in this study. As the temporal resolution of these products is different, we focused on the intercomparisons at monthly scales. Each dataset is briefly described in the following section.

2.1. CERES OLR

CERES is a broadband instrument measuring shortwave reflected radiation (0.3–5 μm), longwave thermal radiation (8–12 μm), and broadband radiation from 0.3 to 200 μm. The sensor has been onboard Terra, Aqua, and Suomi National Polar-orbiting Partnership (Suomi NPP). The Level-2 Single Scanner Footprint (SSF) provides the 20 km (at nadir) instantaneous TOA OLR, whereas the Level-3 Synoptic products (i.e., the SYN1deg data) incorporating the geostationary satellite data have much coarser resolutions (1 degree) [7]. The CERES TOA radiation products have been widely recognized as the most accurate TOA broadband flux retrievals. Additionally, CERES Energy Balanced and Filled (EBAF) TOA flux products, which conduct adjustments to TOA radiation to ensure that global mean net TOA flux is consistent with the in situ values. In this paper, monthly CERES EBAF OLR data are used as the reference dataset.

2.2. HIRS OLR

The National Oceanic and Atmospheric Administration (NOAA) Climate Data Record (CDR) program provides a long-term record of global OLR derived from the HIRS instruments. The HIRS OLR was estimated by multispectral regression models proposed by [25]. This new technique holds the promise of eliminating large systematic errors, and thus the Root Mean Square Error (RMSE) is much smaller than the estimated fluxes from AVHRR data. NOAA has been generating HIRS OLR operationally since 1998, and a new radiance calibration procedure was applied to achieve better accuracy. Global monthly diurnal models were constructed that are consistent with the HIRS OLR retrievals to reduce errors. Therefore, the HIRS OLR presents a comparable stability as that in the Earth Radiation Budget Satellite (ERBS) nonscanner OLR measurements [8].

2.3. GEWEX OLR

The Global Energy and Water Cycle EXchanges (GEWEX) project began more than thirty years ago within the framework of the World Climate Research Programme (WCRP). This project can help us gain a better understanding of the Earth’s energy and water cycles. One of the focuses of the project is the quantification of Earth’s energy imbalance (EEI), which is defined as the imbalance between incoming and outgoing radiation at the TOA [26]. Various datasets are obtained from satellites and in situ observation networks around the globe, and the surface radiation budget (SRB) is the one containing surface and TOA shortwave (SW) and longwave (LW) radiative fluxes. The dataset is produced on a 1° × 1° global grid using satellite-derived cloud parameters and ozone fields, reanalysis meteorology, and a few other ancillary datasets.

2.4. AVHRR OLR

Due to their long time span and relatively high spatial resolution, AVHRR data have been widely used to generate radiation products [27,28]. Recently, Zhou et al. (submitted) developed a new method to generate the OLR-AVHRR with a spatial resolution of 0.05°. Specifically, a look-up table (LUT) of regression coefficients that quantitatively links the AVHRR TOA radiance to the instantaneous broadband OLR was built by a radiative transfer model (MODTRAN 5). Based on the instantaneous retrieval, the daily mean OLR was calculated as the quantitative relationship between the daily mean and the instantaneous OLR was obtained using CERES 3-hourly and daily OLR data.

2.5. CLARA OLR

CLARA-A3 is also an AVHRR-based climate data record on clouds, radiation, and surface albedo, and here we use CLARA OLR to differentiate it from AVHRR OLR in Section 2.4. The retrieval of CLARA OLR consists of two procedures. Firstly, the instantaneous OLR is derived from the AVHRR observations in channels 4 and 5 using a large database of collocated AVHRR-CERES observations. Secondly, daily and monthly OLR are obtained from the instantaneous AVHRR observations using the OLR from ERA5 reanalysis data or simple linear regressions. As they remap the GAC orbit grid to a nested 0.25° lat–lon grid, the spatial resolution of the final product is also 0.25° [24].

2.6. Data Processing
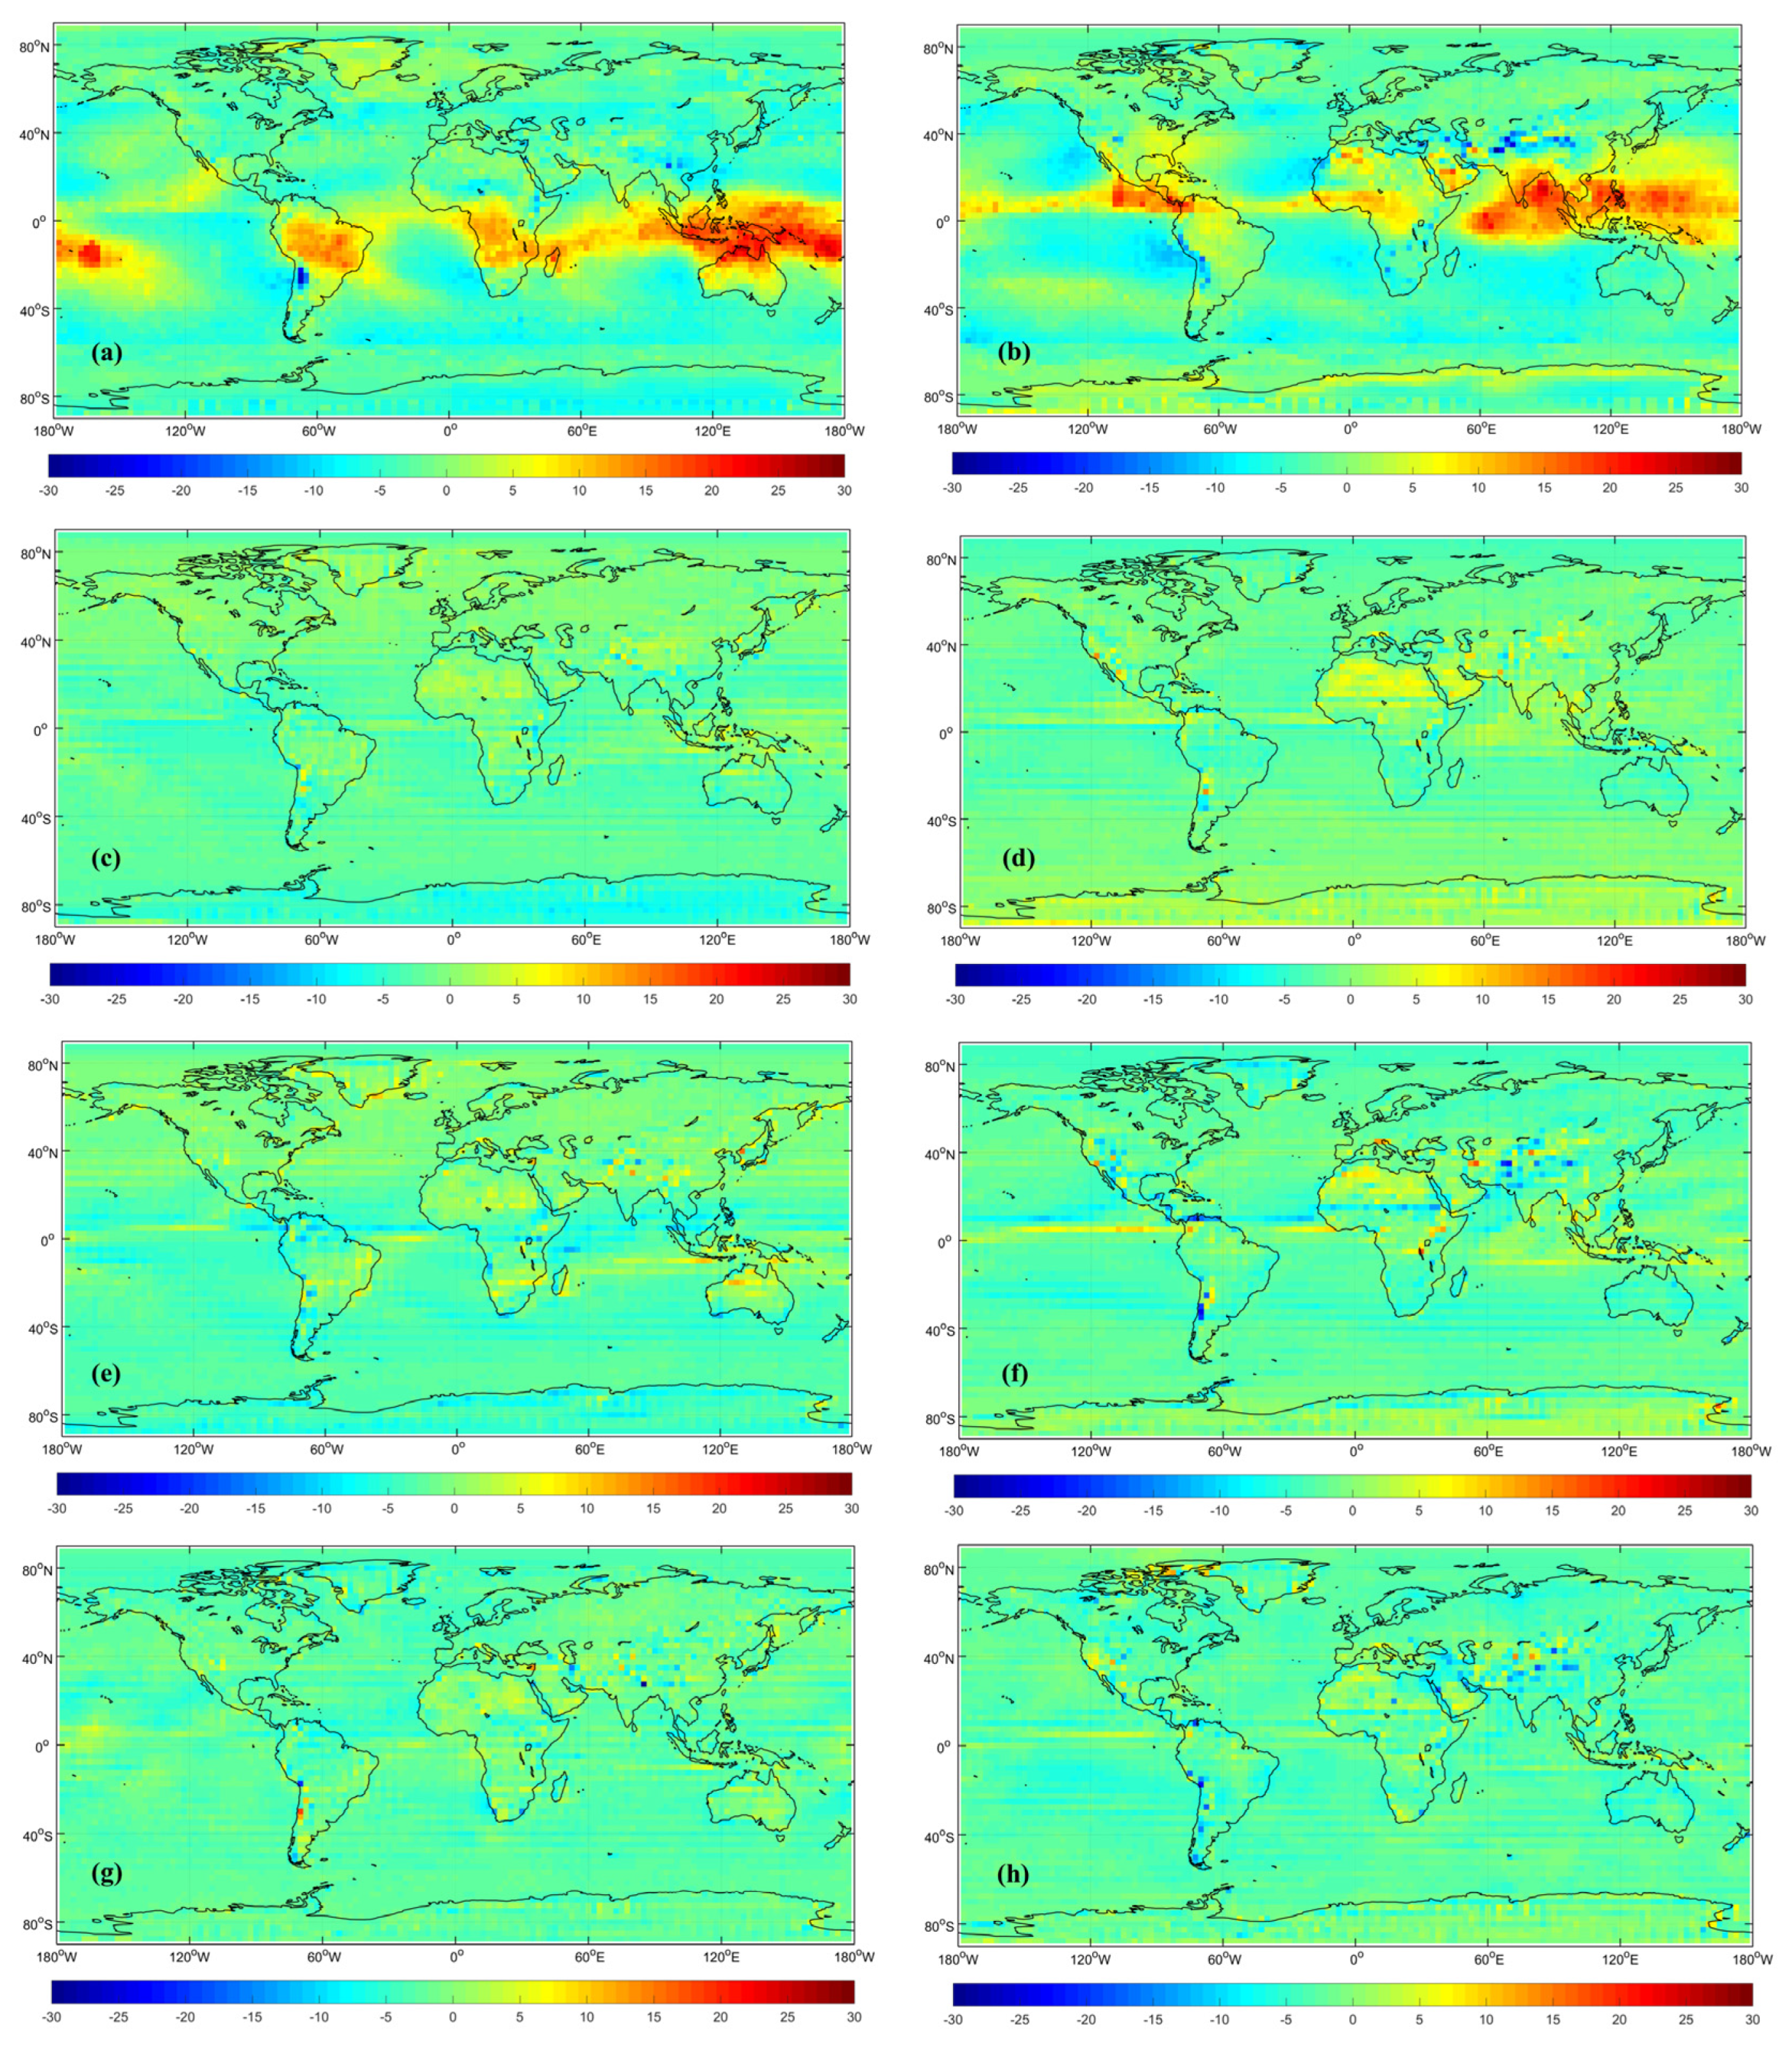
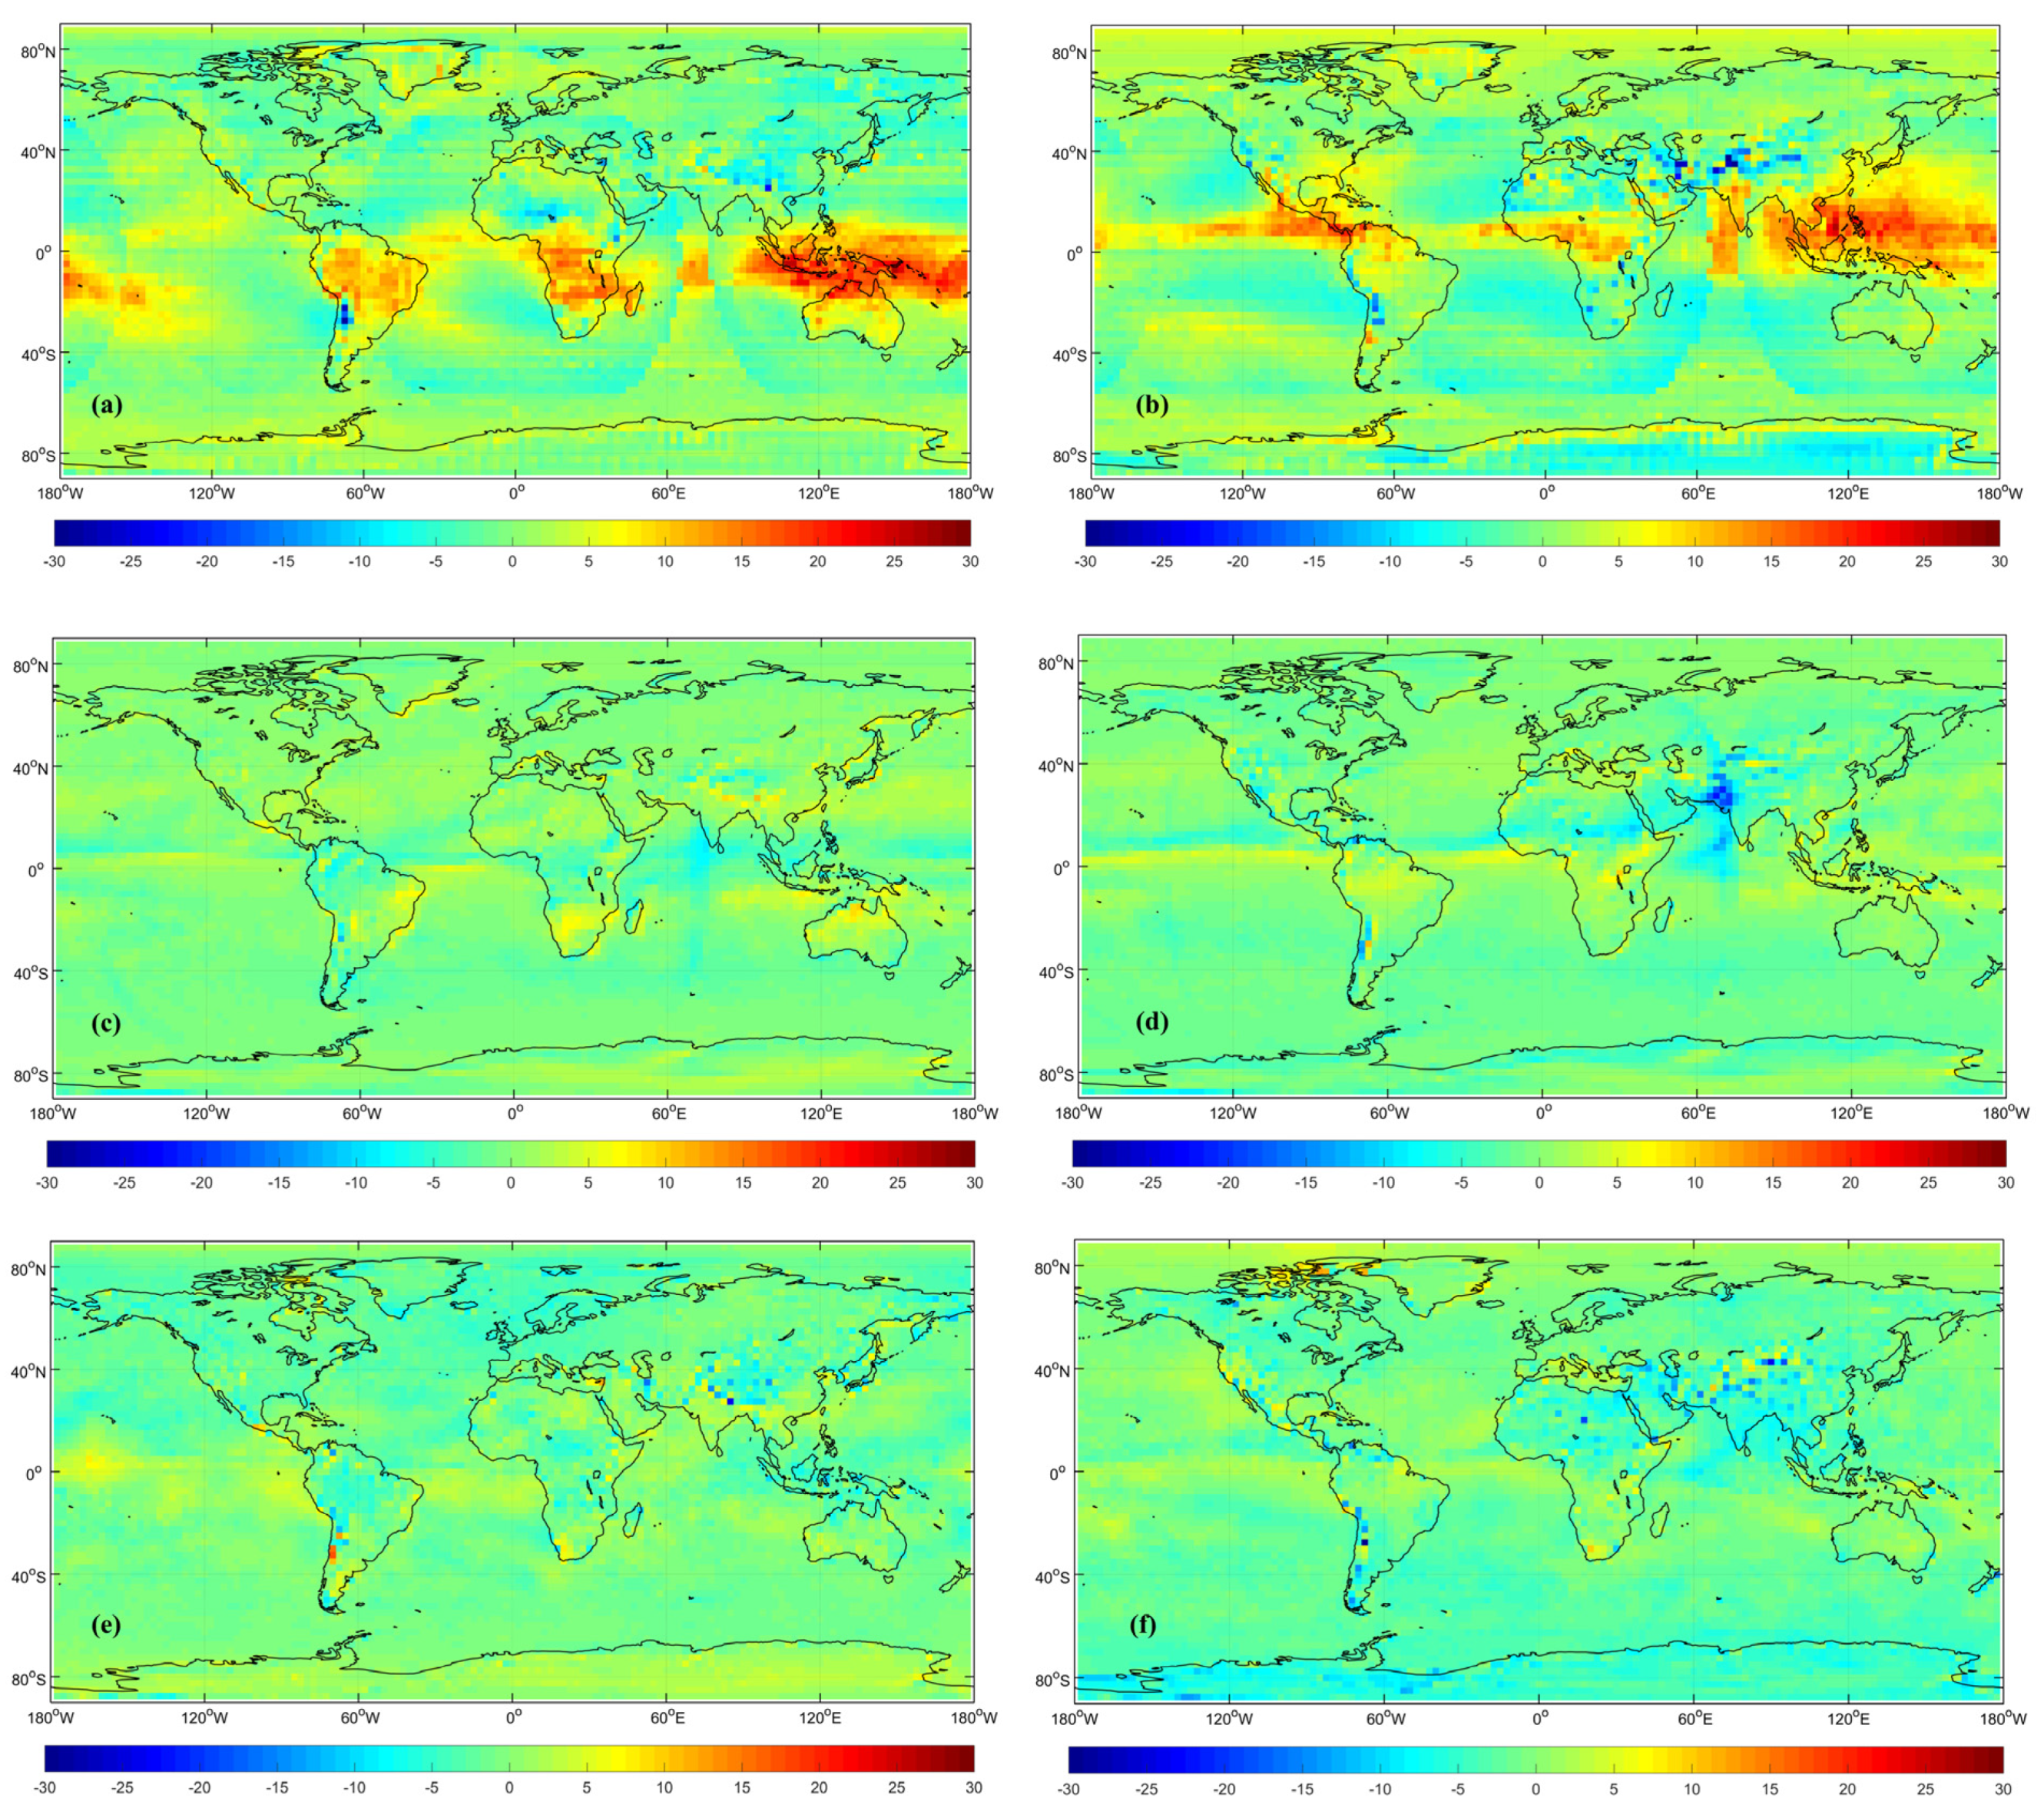
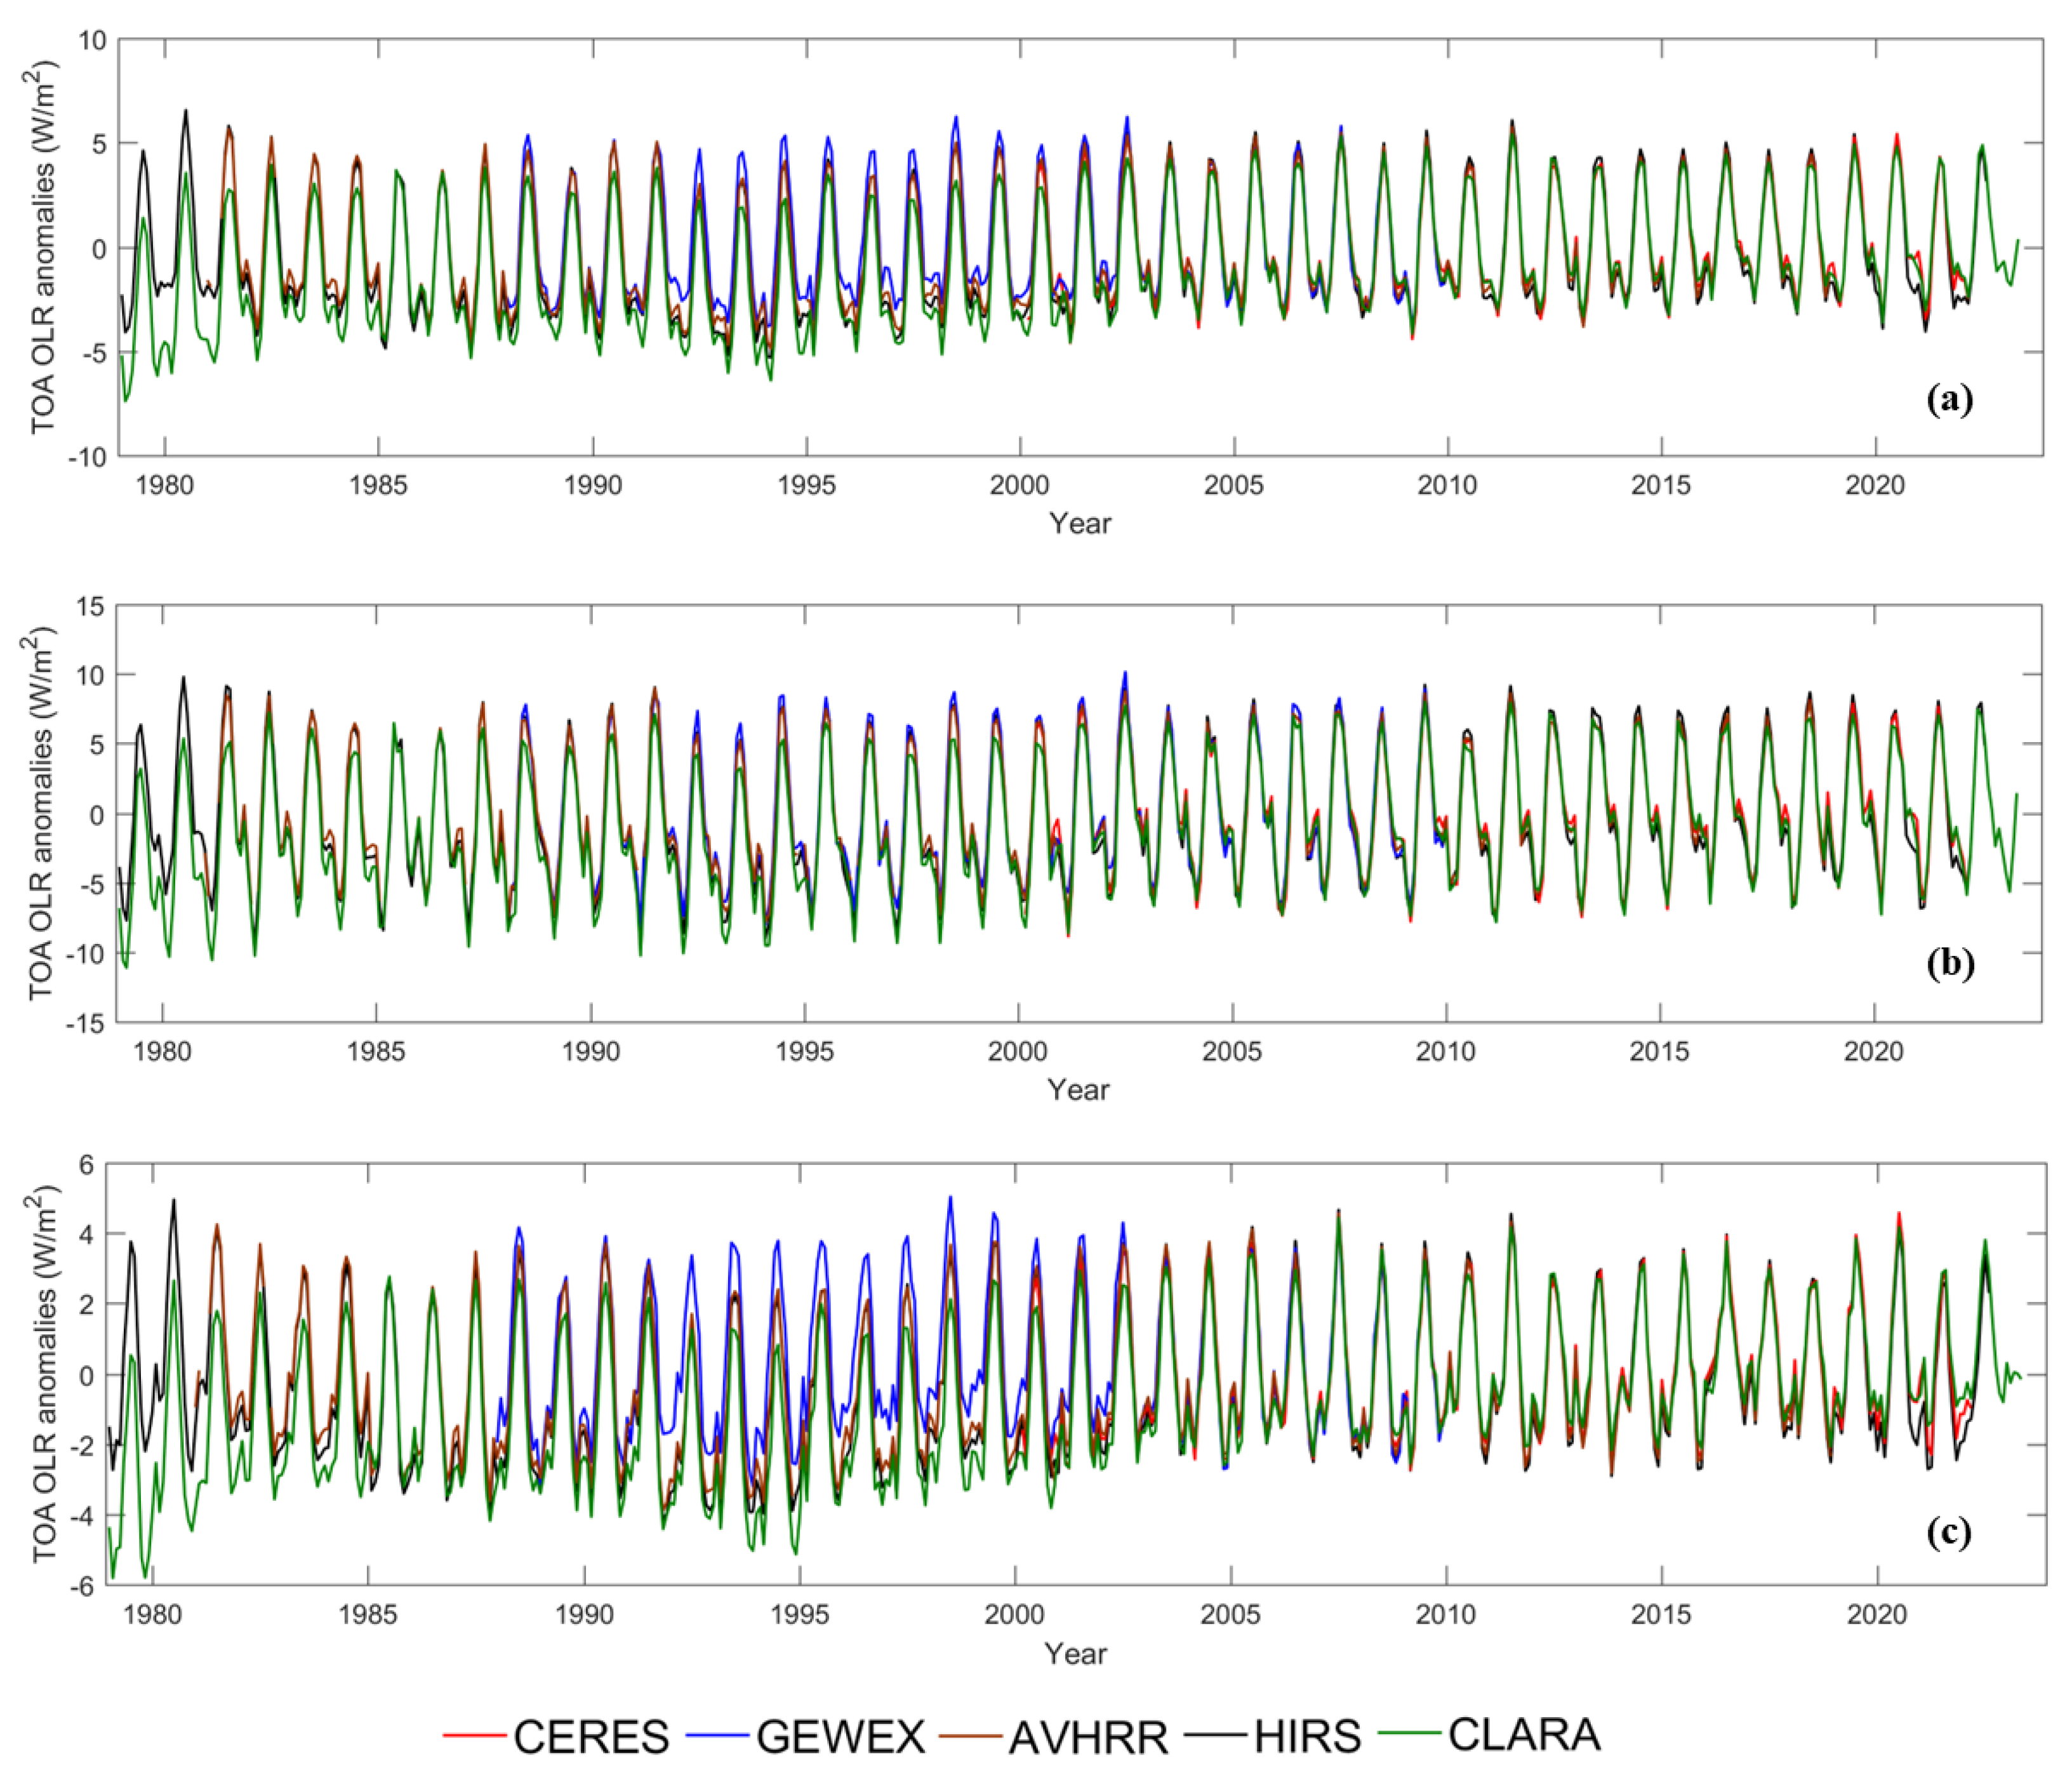
As the five TOA OLR products are of different spatial resolutions, we aggregated them to 2.5° for better intercomparisons. The evaluation was conducted at different spatial extents, including global, latitudinal, and regional scales. The latitudinal average was obtained for every 30° latitudinal band and the regional average was obtained based on different regions. Climatology (the monthly average values over 10–20 years) was used to report the systematic issues of different products, following ideas from [29]. Time-series anomalies of the products with a common base period of 2006–2009 were obtained by subtracting the corresponding average values from the absolute values.

3. Results Analysis

Figure 1 shows the average TOA OLR differences between CERES and the other four products in January and July from 2001 to 2009 (overlapping time among the products), and Table 2 presents the corresponding RMSE (the RMSE was calculated from all the pixels) and bias values. The largest differences (the RMSEs were 5.31 W/m2 and 5.04 W/m2 in January and July, respectively) were found between GEWEX and CERES, as Figure 1a,b show. Obvious positive biases were found in the tropical regions in both January and July, and notable negative biases can be seen to the east of Atlantic Ocean in July. The positive bias in the tropics was attributed to the effect of clouds added to the atmosphere [30]. As for the differences between HIRS and CERES, in January, there were negative biases in the South Pole, and small positive biases were found in other parts. In July, there were more obvious positive biases, particularly in the north of Africa. As for the differences between AVHRR and CERES, as Figure 1e,f show, overall they were small, although notable biases can also be found (e.g., positive biases in the Tibetan Plateau in January). Figure 1g,h present the differences between CLARA and CERES. From the two sub-figures, one can see that the differences were slightly smaller (the RMSEs were 3.04 W/m2 and 3.28 W/m2 in January and July, respectively) than in Figure 1e,f, and similar patterns can be seen, as both of them were derived from AVHRR data. Additionally, from Table 2 one can see that overall all four TOA OLR products showed negative biases when compared to the CERES data.
Figure 2 presents similar results using the average values from 1988 to 1999, which is also the overlapping time among the products. However, as the time span of CERES did not cover the years before 2000, only four products were intercompared in this part (i.e., HIRS, GEWEX, AVHRR, and CLARA), and HIRS data were taken as reference data. Table 3 presents the corresponding RMSE and bias values. The larger differences (the RMSEs were 4.49 W/m2 and 4.76 W/m2 in January and July, respectively) were found between GEWEX and HIRS, as Figure 2a,b show. Obvious positive biases were also found in the tropical regions in both January and July. As for the differences between AVHRR and HIRS, they were much smaller (the RMSEs were 1.75 W/m2 and 2.25 W/m2 in January and July, respectively). However, notable negative biases were found near 70°E in July. As for the differences between CLARA and HIRS, they were also much smaller but relatively larger than the differences between AVHRR and HIRS, with RMSEs of 2.35 W/m2 and 3.22 W/m2 in January and July, respectively.
These TOA OLR products are widely used in analyzing the long-term changes of the Earth’s energy budget. Thus, it is necessary to evaluate them in time series, and Figure 3 shows the time series of the average TOA OLR anomalies of the five products at global scale. Figure 3a shows the global mean TOA OLR anomalies of these products, and overall there was good consistency among these five products. GEWEX showed overestimations from the year 1992 to 2002, and CLARA showed obvious underestimations from the year 1979 to 1981 compared to HIRS and AVHRR, which may be attributed to the periods with degraded temporal coverage [23]. As the properties of land are quite different from those of the ocean, the separate results are presented in Figure 3b and Figure 3c, respectively. From Figure 3b, one can see that these five TOA OLR products matched quite well with each other, although some small differences can be seen in certain years. In Figure 3c, however, much larger discrepancies are shown. For instance, GEWEX OLR exhibited obvious overestimations compared to the other products. Additionally, CLARA also showed underestimations before 2000 compared to HIRS and AVHRR.
Figure 4 shows HIRS, CERES, GEWEX, AVHRR, and CLARA monthly mean TOA OLR anomalies of different latitudinal bands. Overall, the five TOA OLR products matched each other very well at 60–90°N, 30–60°N, and 60–90°S. However, there were large discrepancies among these products at the other latitudinal bands. For example, at 0–30°S (Figure 4d), the range of GEWEX OLR values was much smaller than that of the other products, indicating the relatively low accuracy at this latitudinal band; this is also obvious in Figure 4c. In Figure 4e, overestimations can be found in GEWEX and slight underestimations can be seen in CLARA before the year 2000 at this latitudinal band (30–60°S).
To fully understand the performance of the five TOA OLR products in different regions, we divided the world area into 12 parts (2 additional ANT and GRL parts added to [18]). Then, similar to Figure 4, we also calculated the HIRS, CERES, GEWEX, AVHRR, and CLARA monthly mean TOA OLR anomalies in each region, as shown in Figure 5. From the 12 sub-figures, one can see that the five TOA OLR products matched each other very well in EUR, NA2, AS2, MCT, ANT, and GRL, as shown in Figure 5b,d,h,i,k,l. However, there were also large discrepancies among these products in other regions. For instance, the differences between GEWEX OLR and the other products were much larger in AS1 and AUS, as shown in Figure 5g,j.

4. Conclusions

We examine the differences in five TOA OLR datasets (i.e., HIRS, CERES, GEWEX, AVHRR, and CLARA) in this study. By comparing CERES and the other four products in 2001–2009, larger differences between GEWEX and CERES are found in the tropical regions, with an RMSE of ~5 W/m2, whereas the differences of the other three products are much smaller, with an RMSE of ~3 W/m2. By comparing HIRS and the other three products (AVHRR, GEWEX, and CLARA) in 1988–1999, larger differences between GEWEX and HIRS are also found in the tropical regions, with an RMSE of ~5 W/m2, whereas the differences between HIRS and AVHRR or CLARA are much smaller, with an RMSE of ~2 W/m2.
Time-series evaluation results show that overall there is good consistency among these five products. The five TOA OLR products match each other very well at 60–90°N, 30–60°N, and 60–90°S, whereas there are large discrepancies among these products at the other latitudinal bands. To demonstrate how these five products perform regionally, we divide the world area into twelve parts. Results show that there are larger discrepancies among the five products in Australia and Asia (mid–low latitude part). Overall, the consistency among the five TOA OLR products is relatively lower in the mid–low latitude regions, where TOA albedo products show good consistency. As for the high-latitude regions, however, there is much better consistency among the five TOA OLR products.

Author Contributions

Conceptualization, C.Z. and Y.L.; methodology, C.Z. and J.Y.; validation, Y.C. and Z.M.; investigation, X.Z. and J.L.; writing—original draft preparation, C.Z.; writing—review and editing, Y.L., Y.C., Z.M., X.Z. and J.L. All authors have read and agreed to the published version of the manuscript.

Funding

This study was partially funded by the National Natural Science Foundation of China (No. 42001301) and the Key Research and Development Program of Hubei Province of China (2021BAA185).

Data Availability Statement

The CERES datasets were downloaded from https://ceres-tool.larc.nasa.gov/ord-tool/jsp/SYN1degEd4Selection.jsp (accessed on 1 June 2023). HIRS OLR data were obtained from https://climatedataguide.ucar.edu/climate-data/outgoing-longwave-radiation-olr-hirs (accessed on 1 June 2023). GEWEX datasets were downloaded from https://asdc.larc.nasa.gov/project/SRB (accessed on 1 June 2023). CLARA OLR data can be obtained from https://doi.org/10.5676/EUM_SAF_CM/CLARA_AVHRR/V003 (accessed on 1 June 2023). AVHRR OLR are available upon request from the authors.

Acknowledgments

We would like to thank the anonymous reviewers for their constructive comments and suggestions.

Conflicts of Interest

The authors declare no conflict of interest.

References

  1. Liang, S.; Wang, D.; He, T.; Yu, Y. Remote sensing of earth’s energy budget: Synthesis and review. Int. J. Digit. Earth 2019, 12, 737–780. [Google Scholar] [CrossRef] [Green Version]
  2. Schmetz, J.; Liu, Q. Outgoing longwave radiation and its diurnal variation at regional scales derived from Meteosat. J. Geophys. Res. Atmos. 1988, 93, 11192–11204. [Google Scholar] [CrossRef]
  3. Schmidt, G.; Andrews, T.; Bauer, S.E.; Durack, P.J.; Loeb, N.; Ramaswamy, V.; Arnold, N.P.; Bosilovich, M.G.; Cole, J.; Horowitz, L.W. CERESMIP: A climate modeling protocol to investigate recent trends in the Earth’s Energy Imbalance. Front. Clim. 2023, 5, 1202161. [Google Scholar] [CrossRef]
  4. Barkstrom, B.R. The earth radiation budget experiment (ERBE). Bull. Am. Meteorol. Soc. 1984, 65, 1170–1185. [Google Scholar] [CrossRef]
  5. Kandel, R.; Viollier, M.; Raberanto, P.; Duvel, J.P.; Pakhomov, L.; Golovko, V.A.; Trishchenko, A.P.; Mueller, J.; Raschke, E.; Stuhlmann, R.; et al. The ScaRaB earth radiation budget dataset. Bull. Am. Meteorol. Soc. 1998, 79, 765–784. [Google Scholar] [CrossRef]
  6. Harries, J.E.; Russell, J.; Hanafin, J.; Brindley, H.; Futyan, J.; Rufus, J.; Kellock, S.; Matthews, G.; Wrigley, R.; Last, A.; et al. The geostationary earth radiation budget project. Bull. Am. Meteorol. Soc. 2005, 86, 945–960. [Google Scholar] [CrossRef] [Green Version]
  7. Loeb, N.G.; Doelling, D.R.; Wang, H.; Su, W.; Nguyen, C.; Corbett, J.G.; Liang, L.; Mitrescu, C.; Rose, F.G.; Kato, S. Clouds and the earth’s radiant energy system (CERES) energy balanced and filled (EBAF) top-of-atmosphere (TOA) edition-4.0 data product. J. Clim. 2018, 31, 895–918. [Google Scholar] [CrossRef]
  8. Lee, H.-T.; Gruber, A.; Ellingson, R.G.; Laszlo, I. Development of the HIRS outgoing longwave radiation climate dataset. J. Atmos. Ocean. Technol. 2007, 24, 2029–2047. [Google Scholar] [CrossRef] [Green Version]
  9. Ba, M.B.; Ellingson, R.G.; Gruber, A. Validation of a technique for estimating OLR with the GOES sounder. J. Atmos. Ocean. Technol. 2003, 20, 79–89. [Google Scholar] [CrossRef]
  10. Lee, T.F.; Hawkins, J.; Kuciauskas, A.; Miller, S. Applications and Training for Next-Generation Imagers. Am. Meteorol. Soc. 2010, 91, 727–740. [Google Scholar] [CrossRef] [Green Version]
  11. Park, M.-S.; Ho, C.-H.; Cho, H.; Choi, Y.-S. Retrieval of outgoing longwave radiation from COMS narrowband infrared imagery. Adv. Atmos. Sci. 2015, 32, 375–388. [Google Scholar] [CrossRef]
  12. Rao, Y.; Liang, S.; Wang, D.; Yu, Y.; Song, Z.; Zhou, Y.; Shen, M.; Xu, B. Estimating daily average surface air temperature using satellite land surface temperature and top-of-atmosphere radiation products over the Tibetan Plateau. Remote Sens. Environ. 2019, 234, 111462. [Google Scholar] [CrossRef]
  13. Schreck, C.; Lee, H.T.; Knapp, K. HIRS Outgoing Longwave Radiation—Daily Climate Data Record: Application toward Identifying Tropical Subseasonal Variability. Remote Sens. 2018, 10, 1325. [Google Scholar] [CrossRef] [Green Version]
  14. Huang, X.; Yang, W.; Loeb, N.G.; Ramaswamy, V. Spectrally resolved fluxes derived from collocated AIRS and CERES measurements and their application in model evaluation: Clear sky over the tropical oceans. J. Geophys. Res. Atmos. 2008, 113, D09110. [Google Scholar] [CrossRef] [Green Version]
  15. Whitburn, S.; Clarisse, L.; Bauduin, S.; George, M.; Hurtmans, D.; Safieddine, S.; Coheur, P.F.; Clerbaux, C. Spectrally resolved fluxes from IASI data: Retrieval algorithm for clear-sky measurements. J. Clim. 2020, 33, 6971–6988. [Google Scholar] [CrossRef] [Green Version]
  16. Peterson, C.A.; Chen, X.; Yue, Q.; Huang, X. The spectral dimension of Arctic outgoing longwave radiation and greenhouse efficiency trends from 2003 to 2016. J. Geophys. Res. Atmos. 2019, 124, 8467–8480. [Google Scholar] [CrossRef]
  17. Zhan, Y.; Di Girolamo, L.; Davies, R.; Moroney, C. Instantaneous Top-of-Atmosphere Albedo Comparison between CERES and MISR over the Arctic. Remote Sens. 2018, 10, 1882. [Google Scholar] [CrossRef] [Green Version]
  18. Zhan, C.; Allan, R.P.; Liang, S.; Wang, D.; Song, Z. Evaluation of five satellite top-of-atmosphere albedo products over land. Remote Sens. 2019, 11, 2919. [Google Scholar] [CrossRef] [Green Version]
  19. Susskind, J.; Molnar, G.; Iredell, L.; Loeb, N.G. Interannual variability of outgoing longwave radiation as observed by AIRS and CERES. J. Geophys. Res. Atmos. 2012, 117, D23107. [Google Scholar] [CrossRef]
  20. Wang, T.; Zhou, L.; Tan, C.; Divakarla, M.; Pryor, K.; Warner, J.; Wei, Z.; Goldberg, M.; Nalli, N.R. Validation of Near-Real-Time NOAA-20 CrIS Outgoing Longwave Radiation with Multi-Satellite Datasets on Broad Timescales. Remote Sens. 2021, 13, 3912. [Google Scholar] [CrossRef]
  21. Taylor, P.C.; Itterly, K.F.; Corbett, J.; Bucholtz, A.; Sejas, S.; Su, W.; Doelling, D.; Kato, S. A Comparison of Top-of-Atmosphere Radiative Fluxes from CERES and ARISE. J. Geophys. Res. Atmos. 2022, 127, e2022JD037573. [Google Scholar] [CrossRef]
  22. Costa, S.; Shine, K. An estimate of the global impact of multiple scattering by clouds on outgoing long-wave radiation. Q. J. R. Meteorol. Soc. J. Atmos. Sci. Appl. Meteorol. Phys. Oceanogr. 2006, 132, 885–895. [Google Scholar] [CrossRef]
  23. Cox, S.J.; Stackhouse Jr, P.; Gupta, S.; Mikovitz, J.; Zhang, T.; Hinkelman, L.; Wild, M.; Ohmura, A. The NASA/GEWEX surface radiation budget project: Overview and analysis. In Extended Abstracts, Proceedings of the 12th Conference on Atmospheric Radiation, Madison, WI, USA, 10–14 July 2006; American Meteorological Society: Boston, MA, USA, 2006. [Google Scholar]
  24. Karlsson, K.-G.; Stengel, M.; Meirink, J.F.; Riihelä, A.; Trentmann, J.; Akkermans, T.; Stein, D.; Devasthale, A.; Eliasson, S.; Johansson, E. CLARA-A3: The third edition of the AVHRR-based CM SAF climate data record on clouds, radiation and surface albedo covering the period 1979 to 2023. Earth Syst. Sci. Data Discuss. 2023, 2023, 1–42. [Google Scholar]
  25. Ellingson, R.G.; Yanuk, D.J.; Lee, H.-T.; Gruber, A. A technique for estimating outgoing longwave radiation from HIRS radiance observations. J. Atmos. Ocean. Technol. 1989, 6, 706–711. [Google Scholar] [CrossRef]
  26. Stephens, G.; Polcher, J.; Zeng, X.; Van Oevelen, P.; Poveda, G.; Bosilovich, M.; Ahn, M.-H.; Balsamo, G.; Duan, Q.; Hegerl, G. The First 30 years of GEWEX. Bull. Am. Meteorol. Soc. 2022, 104, E126–E157. [Google Scholar] [CrossRef]
  27. Zhan, C.; Liang, S. Improved estimation of the global top-of-atmosphere albedo from AVHRR data. Remote Sens. Environ. 2022, 269, 112836. [Google Scholar] [CrossRef]
  28. Xu, J.; Liang, S.; Ma, H.; He, T. Generating 5 km resolution 1981–2018 daily global land surface longwave radiation products from AVHRR shortwave and longwave observations using densely connected convolutional neural networks. Remote Sens. Environ. 2022, 280, 113223. [Google Scholar] [CrossRef]
  29. Jia, A.; Wang, D.; Liang, S.; Peng, J.; Yu, Y. Global Daily Actual and Snow-Free Blue-Sky Land Surface Albedo Climatology From 20-Year MODIS Products. J. Geophys. Res. Atmos. 2022, 127, e2021JD035987. [Google Scholar] [CrossRef]
  30. Stackhouse, P.W.; Cox, S.J.; Mikovitz, J.C.; Zhang, T. GEWEX (Global Energy and Water Exchanges Project): Surface Radiation Budget (SRB) Release 4 Integrated Product (IP4)-Algorithm Theoretical Basis Document and Evaluation. 2021. Available online: https://asdc.larc.nasa.gov/documents/srb/SRB_Rel4-IP_ATBD.pdf (accessed on 1 June 2023).
Figure 1. The average TOA OLR differences between (a) GEWEX, (c) HIRS, (e) AVHRR, (g) CLARA, and CERES in January from 2001 to 2009; (b,d,f,h) are the same but for July.
Remotesensing 15 03722 g001
Figure 2. The average TOA OLR differences between (a) GEWEX, (c) AVHRR, (e) CLARA, and CERES in January from 1988 to 1999; (b,d,f) are the same but for July.
Remotesensing 15 03722 g002
Figure 3. Time series of the average TOA OLR anomalies (a) globe, (b) global land, and (c) global ocean.
Remotesensing 15 03722 g003
Figure 4. HIRS, CERES, GEWEX, AVHRR, and CLARA monthly mean TOA OLR anomalies of different latitudinal bands (a) 60–90°N, (b) 30–60°N, (c) 0–30°N, (d) 0–30°S, (e) 30–60°S, and (f) 60–90°S.
Remotesensing 15 03722 g004
Figure 5. HIRS, CERES, GEWEX, AVHRR, and CLARA monthly mean TOA OLR anomalies of 12 parts of global land (a) AFR, (b) EUR, (c) NA1, (d) NA2, (e) SA1, (f) SA2, (g) AS1, (h) AS2, (i) MCT, (j) AUS, (k) ANT, and (l) GRL (NA1 (North America1): 15°–50°N, 165°–50°W; NA2 (North America2): 50°–85°N, 165°–50°W; SA1 (South America1): 23.5°S–15°N, 90°–30°W; SA2 (South America2): 60°S–23.5°S, 80°–40°W; EUR (Europe): 35°–70°N, 15°W–60°E; AFR (Africa): 35°S–30°N, 20°W–50°E; AS1 (Asia1): 5°–50°N, 60°–150°E; AS2 (Asia2): 50°–80°N, 60°–180°E; MCT (Maritime Continent): 10°S–5°N, 90°–165°E; AUS (Australia): 50°–10°S, 110°–155°E; ANT (Antarctic): 90°–70°S, 0°–360°E; GRL (Greenland): 70°–90°N, 70°–10°W).
Remotesensing 15 03722 g005
Table 1. Details of the five TOA OLR products used in this study.
Data SourceTime SpanSpatial ResolutionTemporal ResolutionReference
CERES2000–2021Hourly/daily/monthly[7]
HIRS1979–20202.5°Daily/monthly[8]
GEWEX1988–20093-hourly/daily/monthly[23]
AVHRR1981–20180.05°Daily/monthly[1]
CLARA1979–20230.25°Daily/monthly[24]
Table 2. The RMSE and bias between the four TOA OLR products and CERES in January and July from 2001 to 2009 (unit: W/m2).
GEWEXHIRSAVHRRCLARA
RMSEBiasRMSEBiasRMSEBiasRMSEBias
January5.31−1.582.87−2.083.41−2.403.04−2.44
July5.04−1.292.43−1.163.31−2.193.28−2.57
Table 3. The RMSE and bias between the two TOA OLR products and HIRS in January and July from 1988 to 1999 (unit: W/m2).
GEWEXAVHRRCLARA
RMSEBiasRMSEBiasRMSEBias
January4.491.061.75−0.242.35−0.95
July4.760.782.25−0.863.22−1.89
Disclaimer/Publisher’s Note: The statements, opinions and data contained in all publications are solely those of the individual author(s) and contributor(s) and not of MDPI and/or the editor(s). MDPI and/or the editor(s) disclaim responsibility for any injury to people or property resulting from any ideas, methods, instructions or products referred to in the content.

