Article

Adaptive Speckle Filter for Multi-Temporal PolSAR Image with Multi-Dimensional Information Fusion

College of Electronic Science and Technology, National University of Defense Technology, Changsha 410073, China
*
Author to whom correspondence should be addressed.
Remote Sens. 2023, 15(14), 3679; https://doi.org/10.3390/rs15143679
Submission received: 22 May 2023 / Revised: 17 July 2023 / Accepted: 21 July 2023 / Published: 23 July 2023
(This article belongs to the Special Issue Advance in SAR Image Despeckling)

Abstract

:
Polarimetric synthetic aperture radar (PolSAR) is an important sensor for earth observation. Multi-temporal PolSAR images obtained by successive observations of the region of interest contain rich polarimetric–temporal–spatial information of the land covers, which has wide applications. Speckle filtering becomes a necessary pre-processing for many subsequent applications. Currently, it is common to filter multi-temporal PolSAR data by directly using a speckle filter developed for single SAR or PolSAR data. The cross-correlation between different time series contains rich information in multi-temporal PolSAR images. How to utilize complete polarimetric–temporal–spatial information becomes a large challenge to achieve more satisfied performances of speckle reduction and details preservation simultaneously. This work dedicates to this issue and develops a novel speckle filtering approach for multi-temporal PolSAR data by multi-dimensional information fusion. The core idea is to establish an adaptive and efficient strategy of similar pixel selection based on the similarity test of multi-temporal polarimetric covariance matrices. This similar pixel selection scheme fuses the complete information of multi-temporal PolSAR data. The sensitivity of the proposed scheme is demonstrated with several typical and challenging texture patterns. Then, an adaptive speckle filter is established specifically for multi-temporal PolSAR data. Intensive comparison studies are carried out with airborne UAVSAR datasets and spaceborne ALOS/PALSAR datasets. Quantitative investigations in terms of the equivalent number of looks (ENL) and the figure of merit (FOM) indexes demonstrate and validate the superiority of the proposed method.

1. Introduction

Polarimetric synthetic aperture radar (PolSAR) which can obtain complete polarimetric information becomes important in earth observation [1,2]. With the rapid development of PolSAR technology, a large number of PolSAR images of the same scene at different times have been accumulated so far. Plenty of successful applications have been achieved with multi-temporal PolSAR data, including land cover classification [3,4], change detection [5,6], urban damage level mapping [7,8,9], and so on.
However, as a coherent imaging system, PolSAR images are seriously affected by the speckle phenomenon due to the random summation of backscattered signals within resolution cells [1]. The existence of the speckle effect makes multi-temporal PolSAR image interpretation and utilization more difficult. Speckle filtering is a necessary pre-processing step for almost all practical applications using multi-temporal PolSAR images. The purpose of speckle reduction is to greatly smooth the speckle effect while well preserving the image details and scattering mechanisms. In principle, there are two key stages for speckle filtering: adaptive selection of a sufficient number of similar pixels and generation of an unbiased estimator [10]. Several unbiased estimators have been already available [1]. The challenge lies in how to adaptively locate similar pixels according to various imaging scenes.
A large number of speckle filtering approaches have been proposed for multi-temporal SAR images [11,12,13,14,15,16]. Multi-temporal PolSAR image speckle filtering is seldom studied independently. Instead, it is common to filter multi-temporal PolSAR data by directly using a speckle filter developed for single SAR or PolSAR data. Boxcar filter is a commonly used method by averaging pixels within a moving window without any pixel selection scheme. Refined Lee filter is an improvement of the boxcar filter by incorporating eight edge-aligned windows to locate similar pixels [17,18]. IDAN filter is an intensity-driven method by introducing a region-growing technique for similar pixel collection [19]. Sigma filter and its extended versions select similar pixels by examining the intensity variance of local pixels [20,21]. Only pixel candidates within a given sigma range are determined and this method gains better performance on speckle reduction and details preservation. The nonlocal filtering concept was also adopted for PolSAR image speckle filtering [22,23]. It can consider similar pixel selection over a large search area and can collect more pixels for sample averaging. Other representative speckle filters can be found in [24,25,26].
The majority of the above approaches generally rely on only intensity information of each polarization channel of single PolSAR data for similar pixel selection. It is known that the polarimetric phase and cross-correlation between two channels contain rich information for similar pixel characterization [27,28,29,30,31]. The neglect of these valuable sources may lead to inaccurate selection of similar pixel candidates and may degrade final speckle filtering performance. Model-based decomposition [32,33], which is a powerful tool for PolSAR scattering mechanism interpretation, was utilized for similar pixel selection, and a speckle filter was developed thereafter [34]. Recently, the H/A/Alpha-Wishart PolSAR classifier also was utilized for similar pixel selection [35]. However, since the decomposition results are not unique in terms of different scattering models and model inversion schemes, similar pixel selection will also be affected. In addition, a similarity test of PolSAR covariance matrices developed in [36] shows good sensitivity to various land covers. This similarity test utilizing the full acquisition information was introduced for similar pixel selection and speckle filtering [10]. Promising speckle filtering performance was achieved. In order to further optimize the process of similar pixel selection, the adaptive clustering method and similarity test were combined to solve the problem of excessive smoothing caused by the excessive selection of similar pixels [37]. Additionally, a multi-temporal multidimensional (MTMD) filter [38] based on temporal statistics to reduce the speckle by using all elements of the polarimetric matrices is developed for multi-temporal PolSAR images. However, the MTMD filter has the problem of insufficient utilization of information.
The cross-correlation between different time series contains rich information in multi-temporal PolSAR images. This work is dedicated to developing a novel speckle filtering approach for multi-temporal PolSAR data by multi-dimensional information fusion. This approach will utilize the polarimetric–temporal–spatial information acquired by multi-temporal PolSAR in terms of multi-temporal polarimetric covariance matrices for similar pixel characterization and selection.
The remainder of this paper is organized as follows. Section 2 introduces multi-temporal polarimetric covariance matrix formulation and the corresponding statistical distribution. Section 3 describes the proposed speckle filter. Experimental and comparison studies are carried out in Section 4 using airborne UAVSAR and spaceborne ALOS/PALSAR datasets, respectively. Conclusions are given in Section 5.

2. Multi-Temporal Polarimetric Covariance Matrix Formulation and Its Distribution

2.1. Multi-Temporal Polarimetric Covariance Matrix

For polarimetric imaging radar, under the reciprocity condition, the fully polarimetric data on a horizontal and vertical polarization basis can be represented as a three-dimensional polarimetric scattering vector:
k = [ S HH 2 S HV S VV ] T
where S HV is the backscattered coefficient from vertical polarization transmission and horizontal polarization reception. Other terms are similarly defined. The superscript T is the transpose.
The polarimetric covariance matrix can be expressed as:
C 3 = k k H = [ C 11 C 12 C 13 C 21 C 22 C 23 C 31 C 32 C 33 ]
where k H is the conjugate transpose of k , indicates sample average.
Compared with the single PolSAR image, multi-temporal PolSAR image can offer rich scattering information, including polarimetric information, and temporal and spatial information, shown in Figure 1. Rich scattering information can improve performance for speckle filtering.
In order to utilize the scattering information of multi-temporal PolSAR data, by splicing three-dimensional polarimetric scattering vectors of different time series, the multi-temporal polarimetric scattering vectors are constructed as
v = [ k 1 k 2 ... k i ] T
where k i is the polarimetric scattering vector of the i th time series.
Inspired by the idea of polarimetric interferometry SAR (PolInSAR) matrix construction [39], a multi-temporal polarimetric covariance matrix (MTPCM) is defined as
M MTPCM = v v H
Take three PolSAR image time series for example, the multi-temporal polarimetric covariance matrix with the size of 9 × 9 can be obtained
M MTPCM = [ k 1 k 2 k 3 ] [ k 1 H k 2 H k 3 H ] = [ C 11 Ω 12 Ω 13 Ω 21 C 22 Ω 23 Ω 31 Ω 32 C 33 ]
where C 11 , C 22 , and C 33 are the standard Hermitian polarimetric covariance matrices of three polarimetric SAR data time series, respectively. Ω i j is a 3 × 3 complex polarimetric-interferometric phase correlation matrix. M MTPCM is a Hermitian matrix.
The multi-temporal polarimetric covariance matrix contains not only the polarimetric information of the single PolSAR image, but also the interferometric phase relationship between different polarization channels in the two PolSAR image time series. Using MTPCM to carry out similar pixel selection can balance polarimetric information and interferometric information. It is expected to distinguish the difference of terrain phase in pixels with similar polarization characteristics and can reduce the dependence on additional data such as the digital elevation model (DEM).

2.2. Statistical Distribution

Generally, complex Gaussian distribution is used to describe the statistical characteristics of PolSAR data, which is normally valid from coarse-resolution to fine-resolution data over homogeneous areas [1,2]. Similarly, it can be considered that the constructed multi-temporal polarimetric scattering vector v follow the multivariate complex Gaussian distribution with mean zero and covariance matrix C , denoted as v N C ( 0 , C ) , and the distribution function [1] is
f ( v ) = 1 π 3 | C | exp ( v H C 1 v )
where the covariance matrix is C = E [ v v H ] , C 1 is the inverse of C , and | | denotes the determinant.
Then, let X = n C , the matrix X follows a complex Wishart distribution X W C ( p , n , C ) , and the distribution function of X is
f ( X ) = | X | n p exp [ Tr ( C 1 X ) ] K ( n , p ) | X | n
where Tr ( ) denotes the trace of the matrix, p is the dimension of the vector v , n is the number of looks, and
K ( n , p ) = π p ( p 1 ) / 2 j = 1 p Γ ( n j + 1 )
Γ ( ) is the gamma function.

3. Adaptive Speckle Filter Development

3.1. Multi-Temporal Polarimetric Covariance Matrices Similarity Test

Usually, a binary hypothesis statistic test can be adopted for the similarity test of two covariance matrices following the Wishart distribution according to [36]. For complex Wishart distributed multi-temporal polarimetric covariance matrices X MTPCM and Y MTPCM , as
X MTPCM W C ( p , n X , C X ) , Y MTPCM W C ( p , n Y , C Y ) .
Under the assumption that C X = C Y , the likelihood ratio Q MTPCM for two multi-temporal polarimetric covariance matrices [36] becomes:
Q MTPCM = ( n X + n Y ) p ( n X + n Y ) n X p n X n Y p n Y | X MTPCM | n X | Y MTPCM | n Y | X MTPCM + Y MTPCM | n X + n Y .
Then, let n X = n Y = N . A similarity test indicator ln Q MTPCM can be derived as
ln Q MTPCM = N ( 2 p ln 2 + ln | X MTPCM | + ln | Y MTPCM | 2 ln | X MTPCM + Y MTPCM | ) .
It can be proved that ln Q MTPCM = 0 when X MTPCM = Y MTPCM , whereas in other cases ln Q MTPCM < 0 . The larger the difference between X MTPCM and Y MTPCM , the smaller the value of ln Q MTPCM . In this vein, the similarity between the different matrices can be tested by the similarity test indicator ln Q MTPCM . Note that the similarity test of multi-temporal polarimetric covariance matrices is usually carried out within a L × L moving window for the full-scene data ( L = 15 in this work).

3.2. Similar Pixel Selection

The requirement for filtering PolSAR images is to select a sufficient number of similar pixels for averaging while preserving image details. However, selecting appropriate similar pixels is a significant challenge for PolSAR image speckle filtering. With a L × L moving window and similarity test indicator ln Q MTPCM , the similar samples around the selected pixels can be determined by a predefined threshold, as
{ ln Q MTPCM t h MTPCM   similar   pixel   ln Q MTPCM < t h MTPCM   different   pixel .
According to [36], the threshold for multi-temporal PolSAR data can be determined as
t h MTPCM = E p / n
where E is an adjusting parameter which balances the speckle reduction and detail preservation. p is the dimension of the multi-temporal polarimetric scattering vector, and n is the number of looks. For a given number of looks n and p , with a larger value of E , more pixels will be selected as similar pixels.

3.3. Sensitivity Analysis and Demonstration

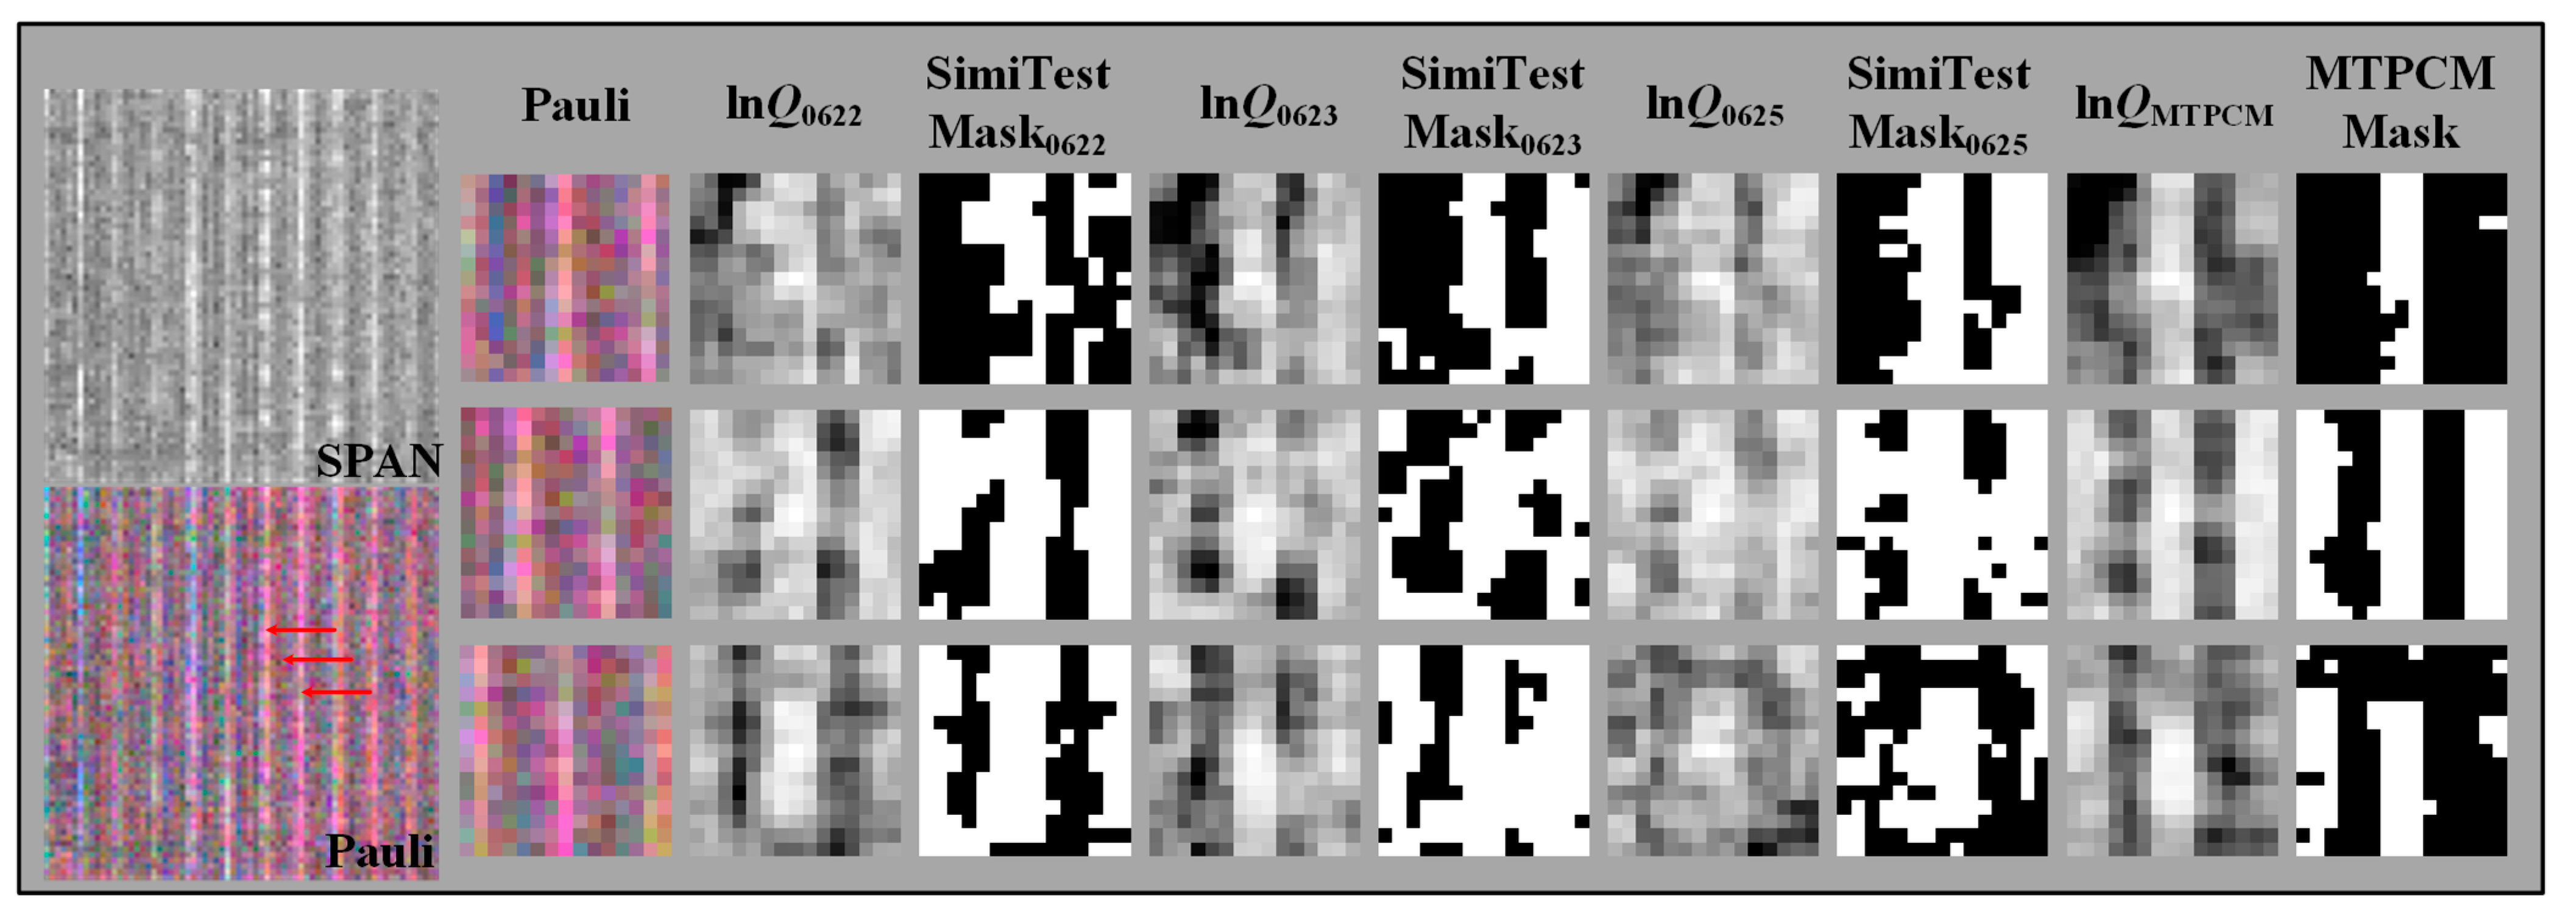
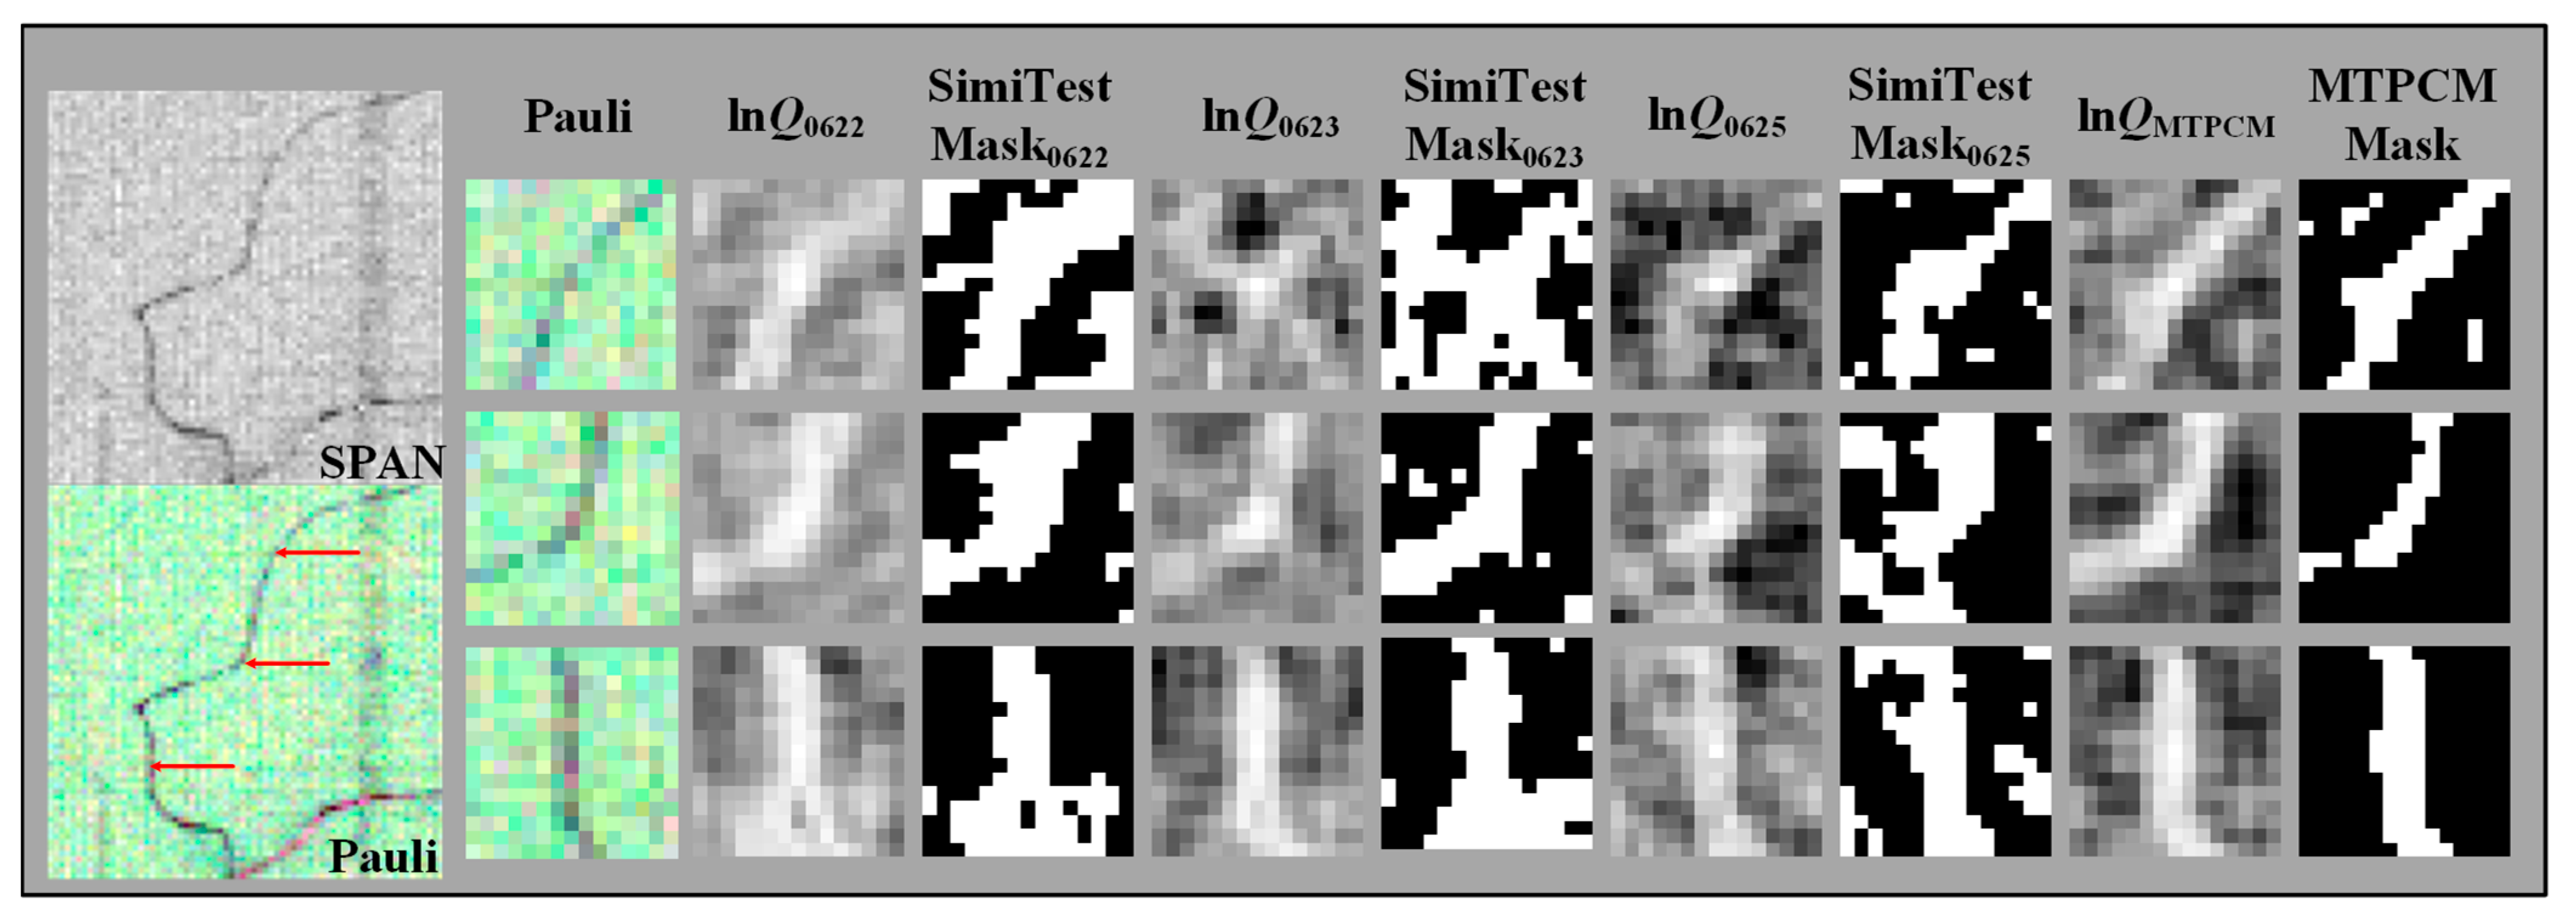
To evaluate the effectiveness of the similarity test indicator ln Q MTPCM for similar pixel selection, three typical areas which are, respectively, mixture-feature, crop-line, and weak-feature area are selected from airborne UAVSAR datasets, as shown in Figure 2, Figure 3 and Figure 4. The sizes of the selected areas are all 70 × 70 pixels and three random samples are chosen from them. The SPAN and Pauli images are shown on the far left of Figure 2, with red arrows indicating the selected samples. The selected samples are all located at the edges of different scattering signatures. A similarity test of multi-temporal polarimetric covariance matrices is applied within a 15 × 15 moving window with each considered pixel at the center. The Pauli images within a 15 × 15 window are shown in Figure 2. For comparison, the similarity test indicator ln Q [10] and ln Q MTPCM between the considered pixel and surrounded pixels are also calculated. Note that ln Q MTPCM is calculated from three PolSAR image time series, while ln Q is calculated from a single PolSAR image. With a predefined threshold, similar pixel samples can be determined. The threshold of ln Q is set as −0.3 according to [10], and the threshold of ln Q MTPCM is chosen as −0.95 for this demonstration in this study. The similarity test indicator ln Q , the proposed ln Q MTPCM , and the corresponding mask images are shown in Figure 2. The mask images show the determined similar pixel samples (in white color).
It can be observed that the similarity test indicators ln Q and ln Q MTPCM are sensitive to various land covers and can effectively characterize their texture characteristics. It is clear that ln Q can well capture the local texture for each considered pixel. However, for weak scattering areas, ln Q can produce a large number of false alarm pixels, which can lead to over-filtering. Correspondingly, the proposed ln Q MTPCM can effectively suppress local false alarms. Since the similarity test indicator is sensitive to local texture signatures, similar pixels can be collected in a larger moving window, which is also associated with the nonlocal filtering concept.
In detail, Figure 2 shows a mixture-feature area. The area contains two homogeneous regions, located in the upper left and lower right corners, respectively. In addition, the two homogeneous regions are separated by three oblique lines. Three samples are selected from the first oblique line, the second oblique line, and the homogeneous region in the lower right corner. For the pixel on the first oblique line, most of the other pixels in its neighborhood are selected as similar samples. Furthermore, because the third oblique line has the same scattering characteristics as the first oblique line, some pixels from the third oblique line are also selected as similar samples. For the pixel on the second oblique line, all similar pixels are selected as similar samples, which form an oblique line distribution. For the pixel in the homogeneous region in the lower right corner, most of the pixels in its neighborhood, which are also in the homogeneous region, are selected as similar samples.
Figure 3 shows a crop-line area. The crops are evenly distributed in straight lines in this area. Three pixels are selected, two of which are located on the boundary lines between the two types of land covers, and one is located in the middle of the two boundary lines. For the pixels on the boundary lines, most of the pixels in their neighborhoods are selected as similar samples. For the pixel in the middle of the two boundary lines, most of the pixels in its neighborhood and outside the neighborhood, which are also crops, are selected as similar samples, and the similar samples are distributed in a straight line.
Figure 4 shows a weak-feature area. The area contains a weak edge. All three pixels selected for this area are located on the weak edge. It can be seen that most of the pixels in the neighborhood, which are also weak edges, are selected as similar samples, with only a few other pixels being mistakenly selected.
Above all, the proposed ln Q MTPCM is sensitive to various land covers and can effectively characterize their texture characteristics. Most similar pixels can be effectively selected by threshold processing. Compared with ln Q , the similarity measure of multi-temporal polarimetric covariance matrices can effectively improve the selection accuracy of similar pixels.

3.4. Proposed MTPCM Speckle Filter

Note that the determinant of the multi-temporal polarimetric covariance matrix needs to be calculated when calculating the similarity test indicator. In order to avoid the determinant of the multi-temporal polarimetric covariance matrix being zero, it is necessary to conduct a rough estimation of the multi-temporal polarimetric covariance matrix. The boxcar method with a 3 × 3 window is selected in this work. Otherwise, after obtaining similar pixels through a similarity test, an unbiased estimator needs to be constructed to obtain the final filtering result. Sample average is exploited as an unbiased estimator, as
C ^ 3 = 1 M i = 1 M C 3 i
where C 3 i is the original PolSAR context covariance matrix of selected similar pixels. M is the number of selected similar pixels. It should be noted that any other unbiased estimators can be exploited for speckle reduction.
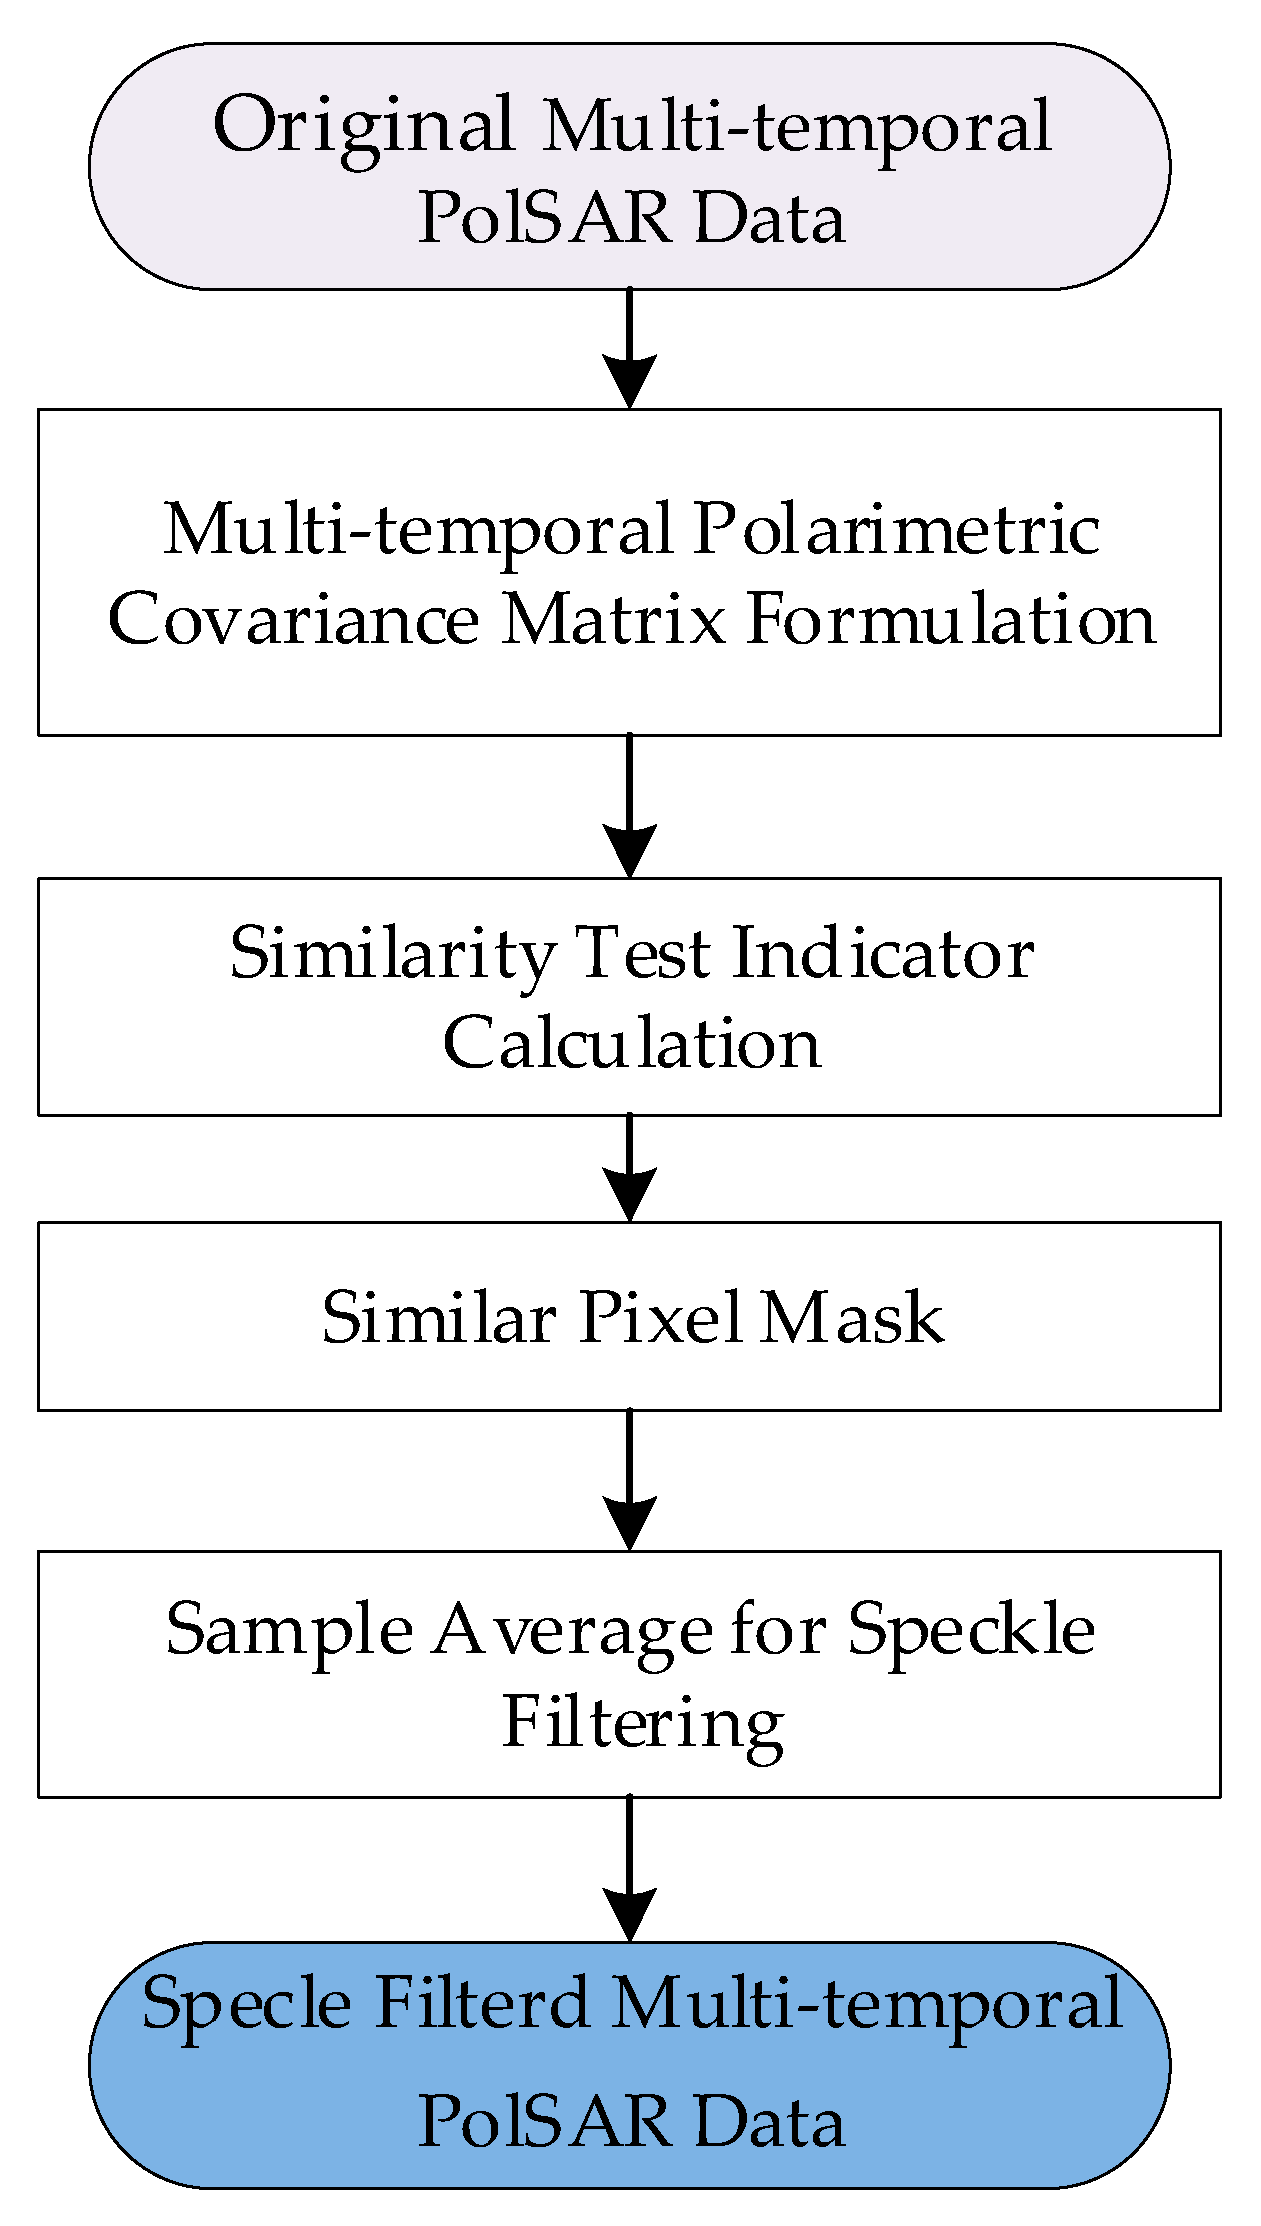
Based on the multi-temporal polarimetric covariance matrix and similarity test, a novel adaptive speck filtering scheme is established for multi-temporal PolSAR images, and this scheme is named MTPCM for short. The flowchart of the proposed MTPCM speckle filter scheme is shown in Figure 5. Firstly, the multi-temporal polarimetric covariance matrix is constructed based on original multi-temporal PolSAR data. Secondly, the similarity test is carried out to select similar pixel masks within a moving window. Lastly, the speckle filtered data are available by sample average of all the similar pixels.

4. Experimental Studies

The airborne multi-temporal PolSAR datasets from UAVSAR and the spaceborne multi-temporal PolSAR datasets from ALOS/PALSAR are used to verify the performance of the proposed method. The boxcar method, refined Lee method [17], improved Sigma method [40], IDAN method [19], and SimiTest method [10] are selected for comparison. The moving window size is 9 × 9 for the boxcar method, refined Lee method, and improved Sigma method, while the maximum sample size is 50 for the IDAN method. Preliminary analysis shows that the filtering performance is better when the Sigma value is 0.9. Therefore, a Sigma value of 0.9 is adopted in this study. The threshold of the SimiTest method is set as −0.3 according to [10], while the threshold of the proposed method is −0.95. A 15 × 15 moving window is selected to carry out filtering experiments for the SimiTest method and the proposed MTPCM method. The refined Lee method, improved Sigma method, and IDAN method are implemented through the PolSARpro software.
The quantitative evaluations are carried out with the equivalent number of look (ENL) index and edge detection for speckle filtering performance. The ENL is usually exploited to analyze the filtering effect of homogeneous regions [1,41] and is defined as
ENL = mean ( | p | ) 2 var ( | p | )
where | p | represents the amplitude of pixels in the homogeneous region. mean ( ) is to calculate the mean, while and var ( ) is to calculate the variance.
Edge detection can be exploited to investigate the image details maintenance performance for different speckle filtering methods. In this work, the ratio of average (ROA) edge detector [42] with a 5 × 5 moving window is used to detect the image. The figure of merit (FOM) is exploited for quantitative evaluation of the edge detection effect [41] and is defined as
FOM = 1 max ( N ground - truth , N detection ) n = 1 N detection 1 1 + α d n 2
where N ground - truth and N detection , respectively, represent the number of edge pixels in the ground-truth and the number of edge pixels in the detection result. d n 2 represents the nearest Euclidean distance between the pixel point in the detection result and the pixel point in the true value, and α is an adjustable parameter ( α = 1 in this work). If the edge detection result is exactly the same as the ground-truth, FOM is 1. Otherwise, FOM is lower than 1. The larger the FOM, the better the performance on image details maintenance.

4.1. Comparison with UAVSAR DATA

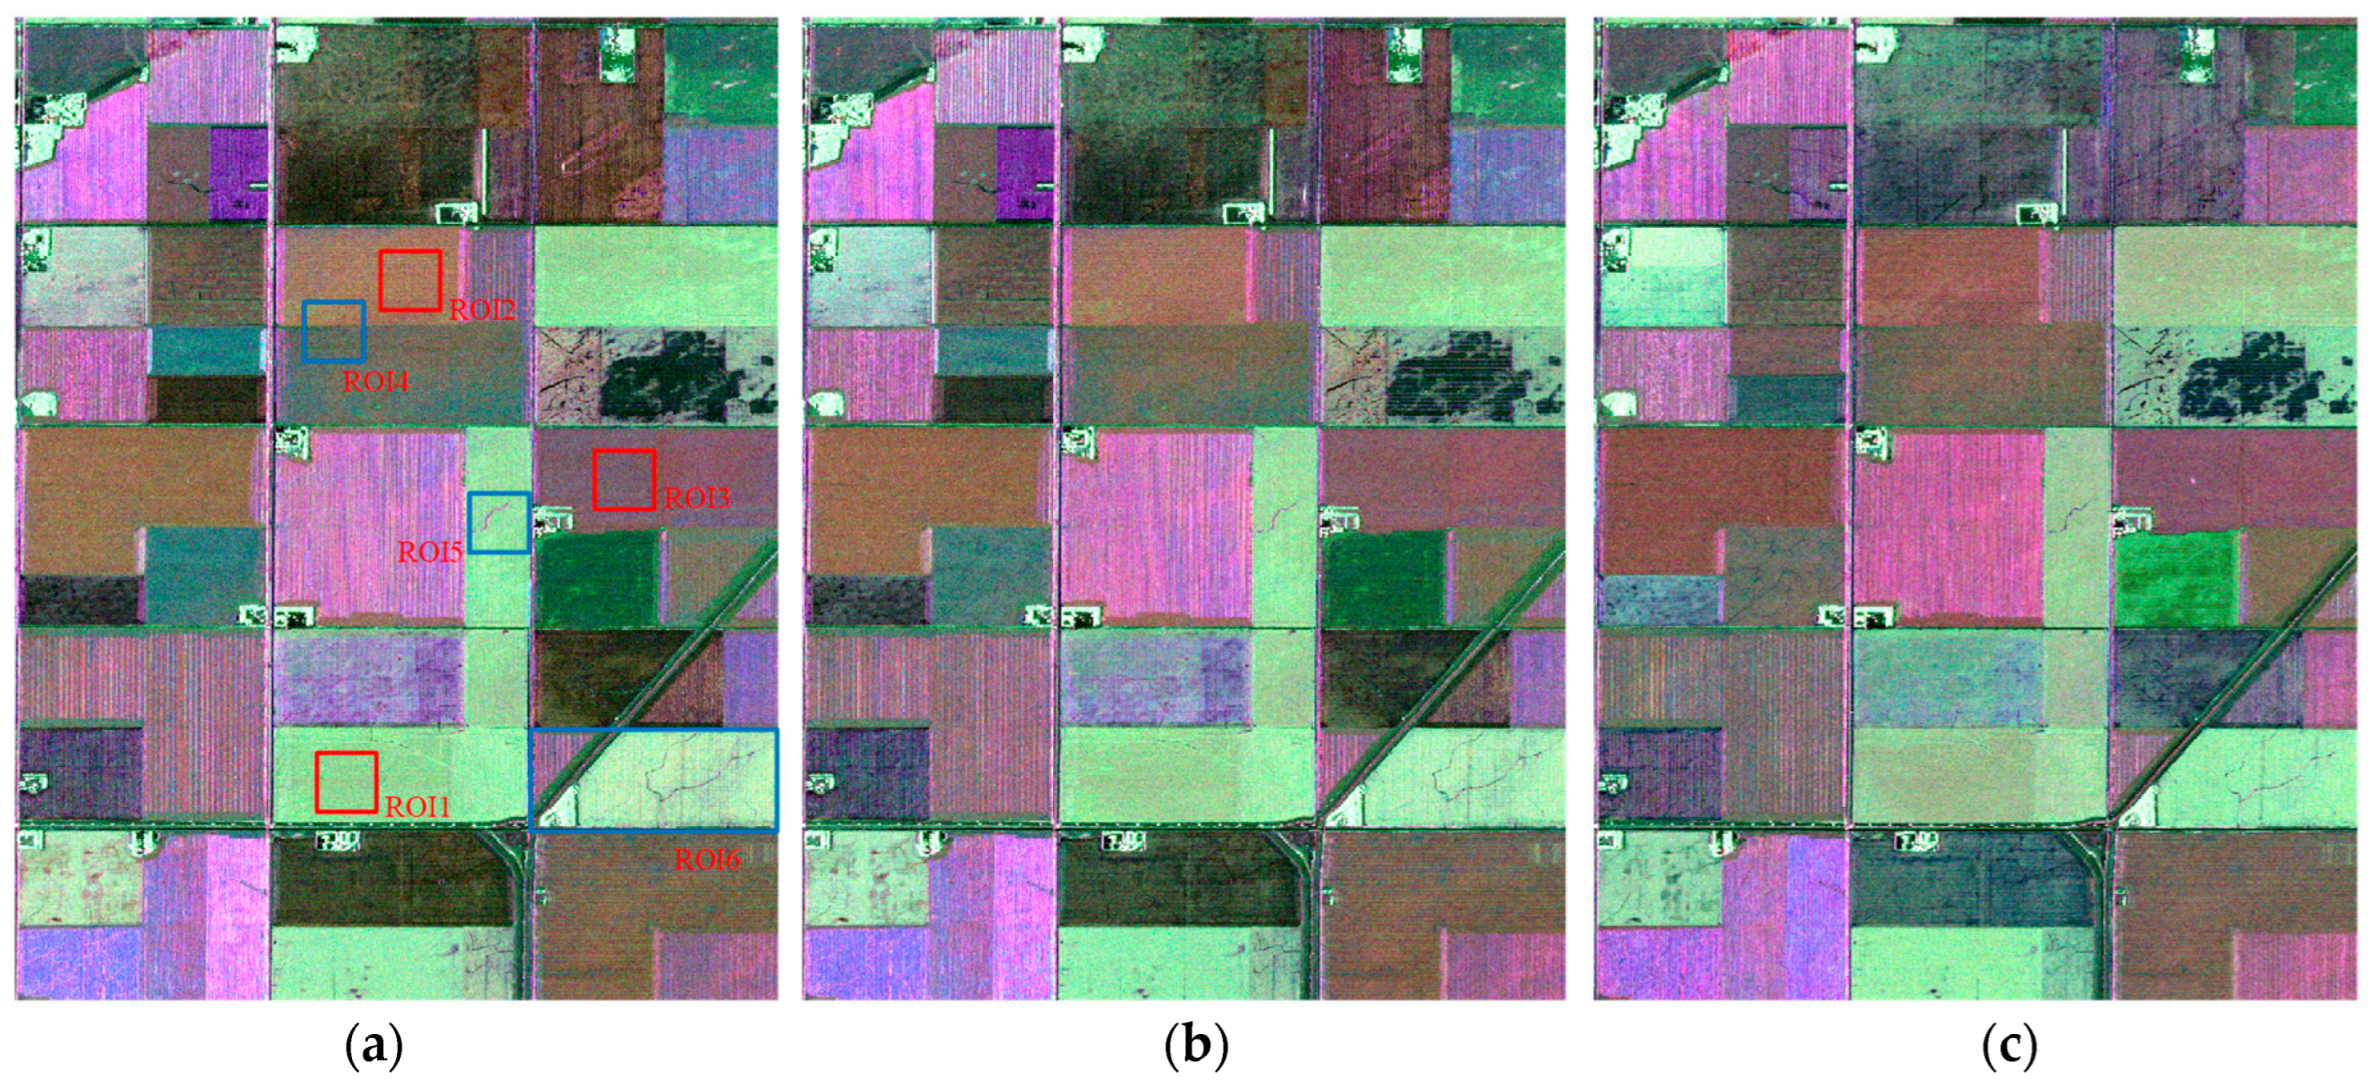
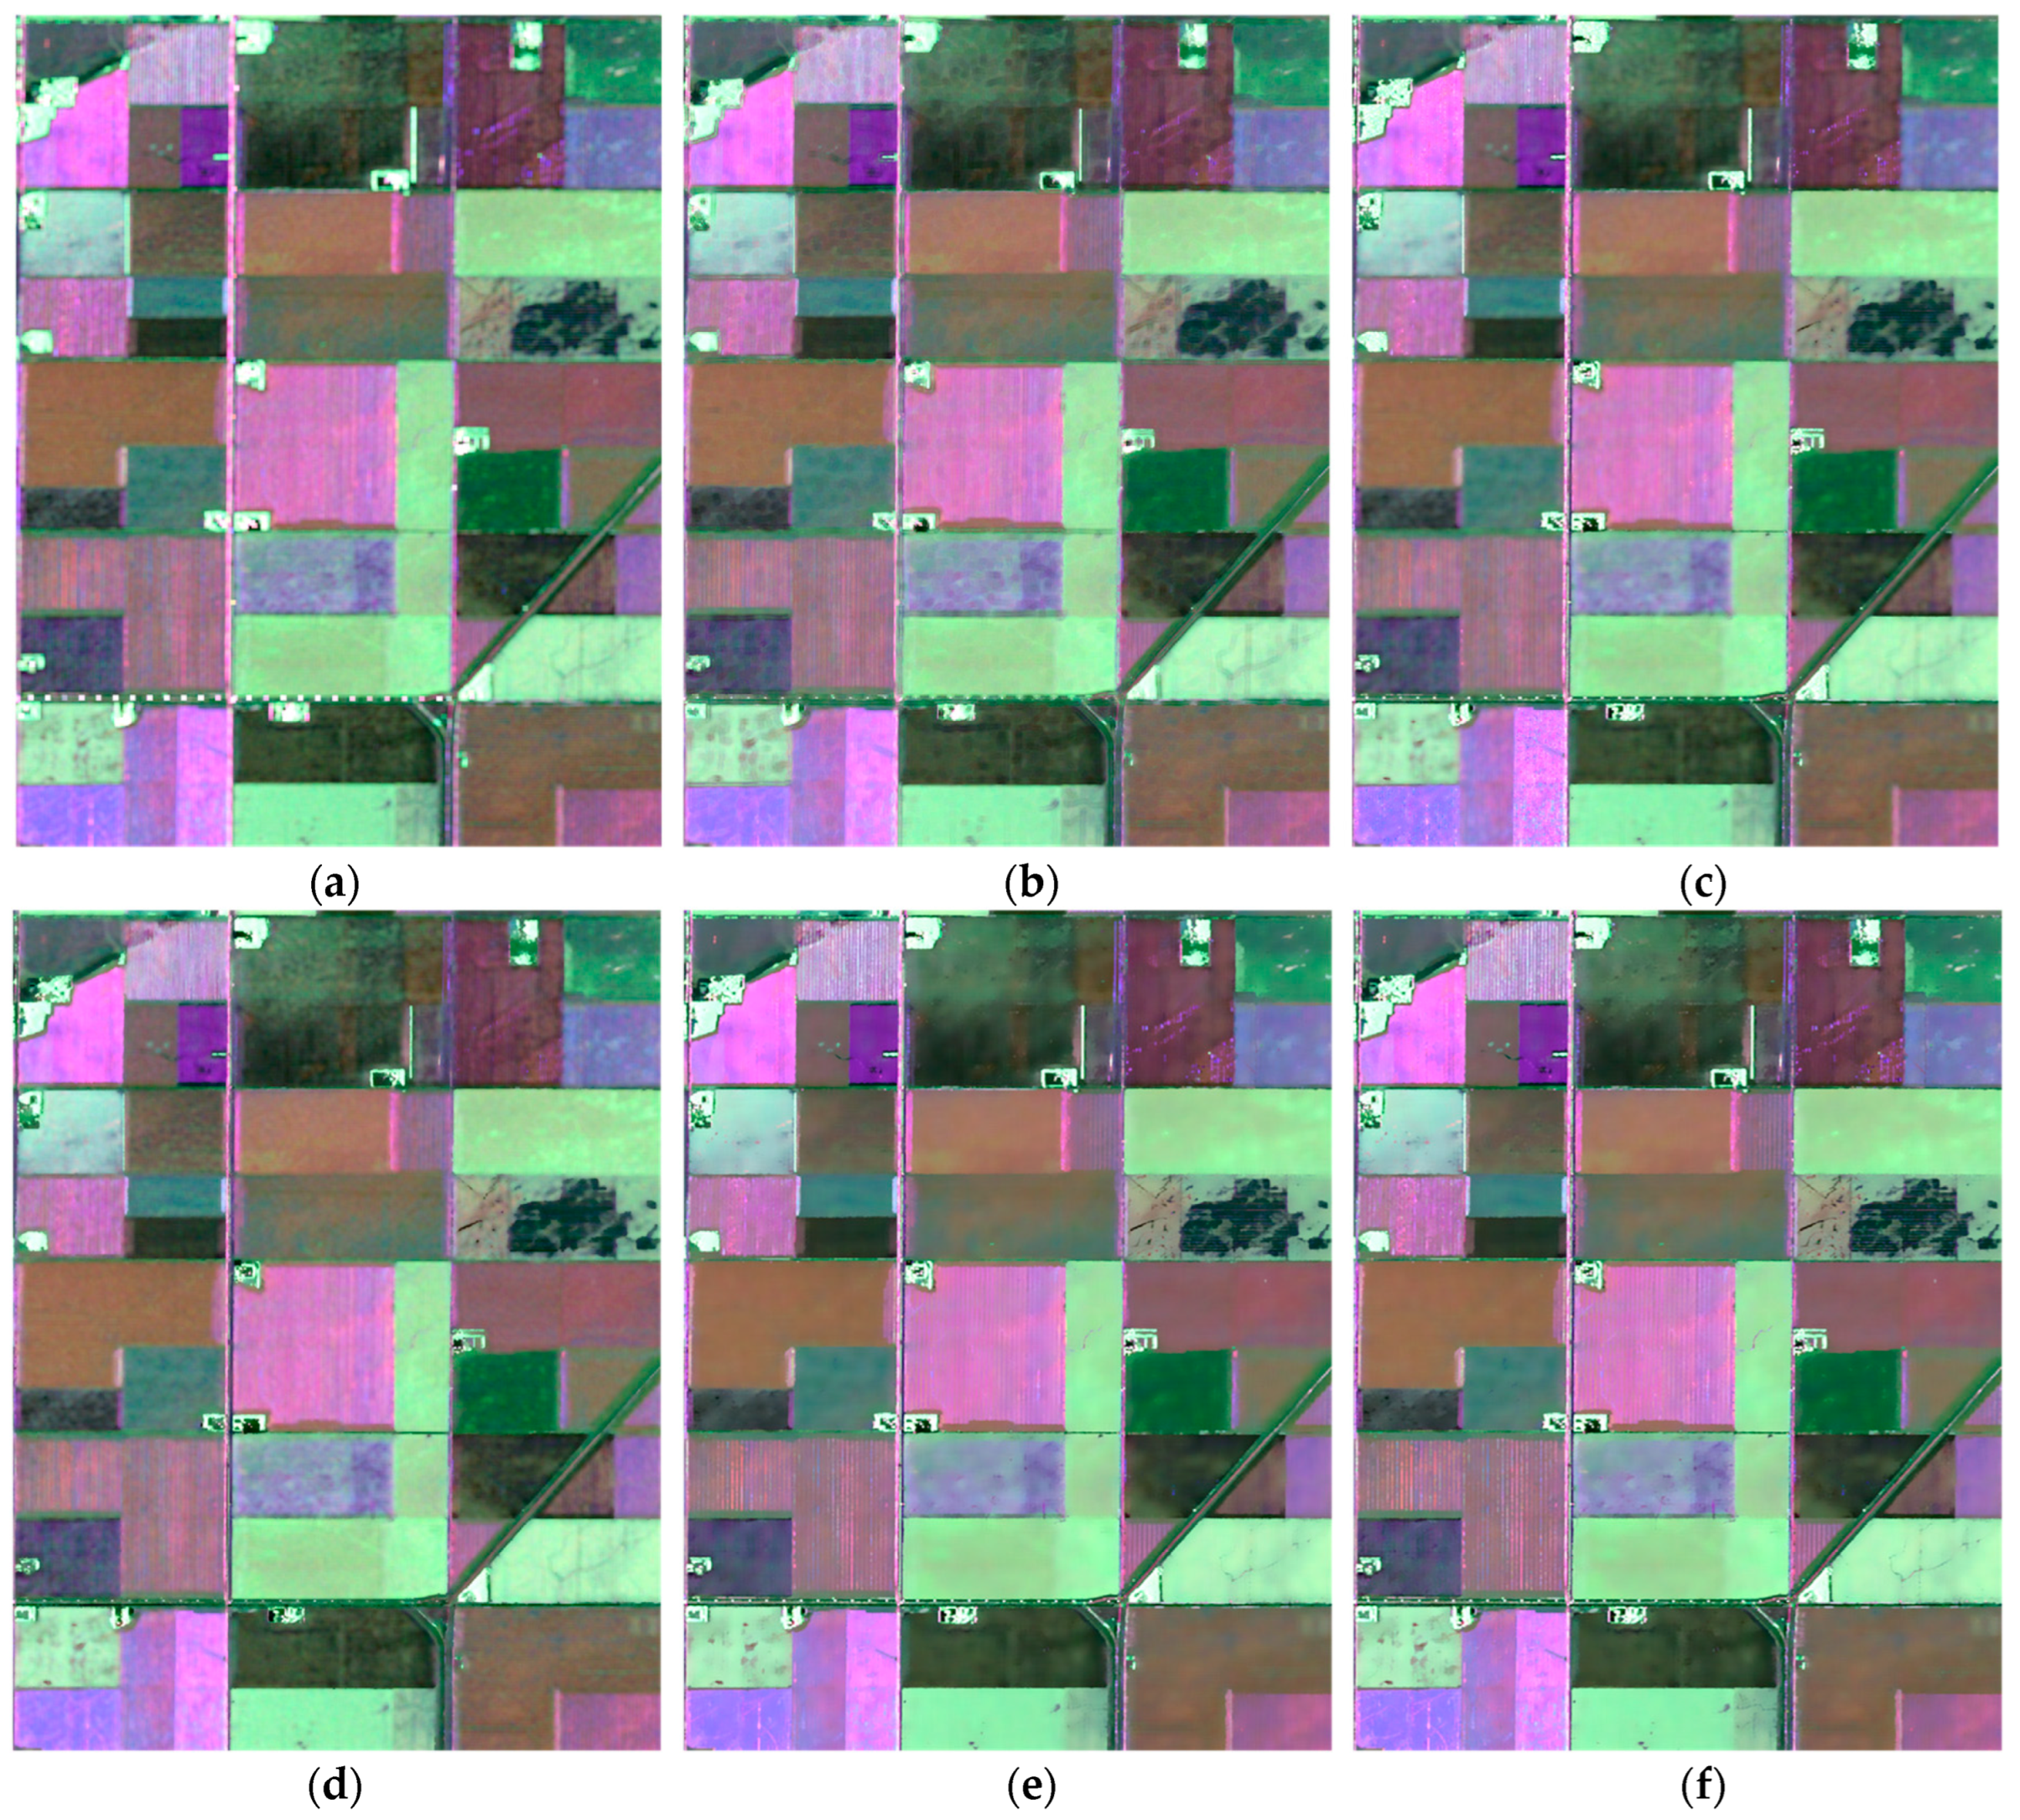
The UAVSAR L-band multi-temporal PolSAR data over Manitoba, Canada obtained on 22, 23, and 25 June 2012 are utilized for comparison, shown in Figure 6. The provided data have already been 3-look processed in the range and 12-look processed in the azimuth with range and azimuth resolutions of, respectively, 5 and 7 m [43]. The study area with a size of 1130 × 880 pixels mainly contains mixed crops represented by cereals and vegetables.
The speckle filtering results for UAVSAR data (22 June 2012) are shown in Figure 7. In this comparison, six regions of interest (ROIs) are randomly selected from the study area for further evaluation of the speckle filtering effect, shown in Figure 6a. The selected six ROIs including three homogeneous areas with different land covers (marked with red rectangles, denoted as ROI1, ROI2, and ROI3) and the three weak-feature areas with edge (marked with blue rectangles, denoted as ROI4, ROI5, and ROI6).
The speckle filtering comparisons for six ROIs are shown in Figure 8, Figure 9, Figure 10 and Figure 11. For three homogeneous areas (ROIs 1–3), the original data and speckle filtered data from different methods are shown in Figure 8. Visually, the six speckle filtering methods can well smooth the speckle. The boxcar, refined Lee, and IDAN filtered data have some speckle effect, while the improved Sigma method, SimiTest method, and the proposed method can well smooth the speckle effect.
On the basis of visual analysis, the ENL is selected to carry out quantitative analysis for the speckle filtered data. The quantitative results comparison on 22 June are summarized in Table 1. The ENL values from the original data for ROIs 1–3 are 20.62, 16.23, and 20.54, respectively. After speckle filtering, the ENL values are improved for ROIs 1–3. Similar to visual analysis, the boxcar method exhibits relatively limited speckle smooth performance with the lowest ENL values of 440.42, 385.80, and 430.27 for ROIs 1–3. The ENL values of the improved Sigma method are better than the boxcar method, refined Lee method, and IDAN method, but lower than the SimiTest method and the proposed MTPCM method. For ROI1 and ROI2, the proposed MTPCM method achieves the highest ENL values of 966.15 and 854.95, which is better than the other five comparison methods. For ROI3, the SimiTest method has the highest ENL of 906.04, while the ENL value of the proposed MTPCM method is very close to that of the SimiTest method. Therefore, the proposed MTPCM method exhibits better performance on speckle reduction.
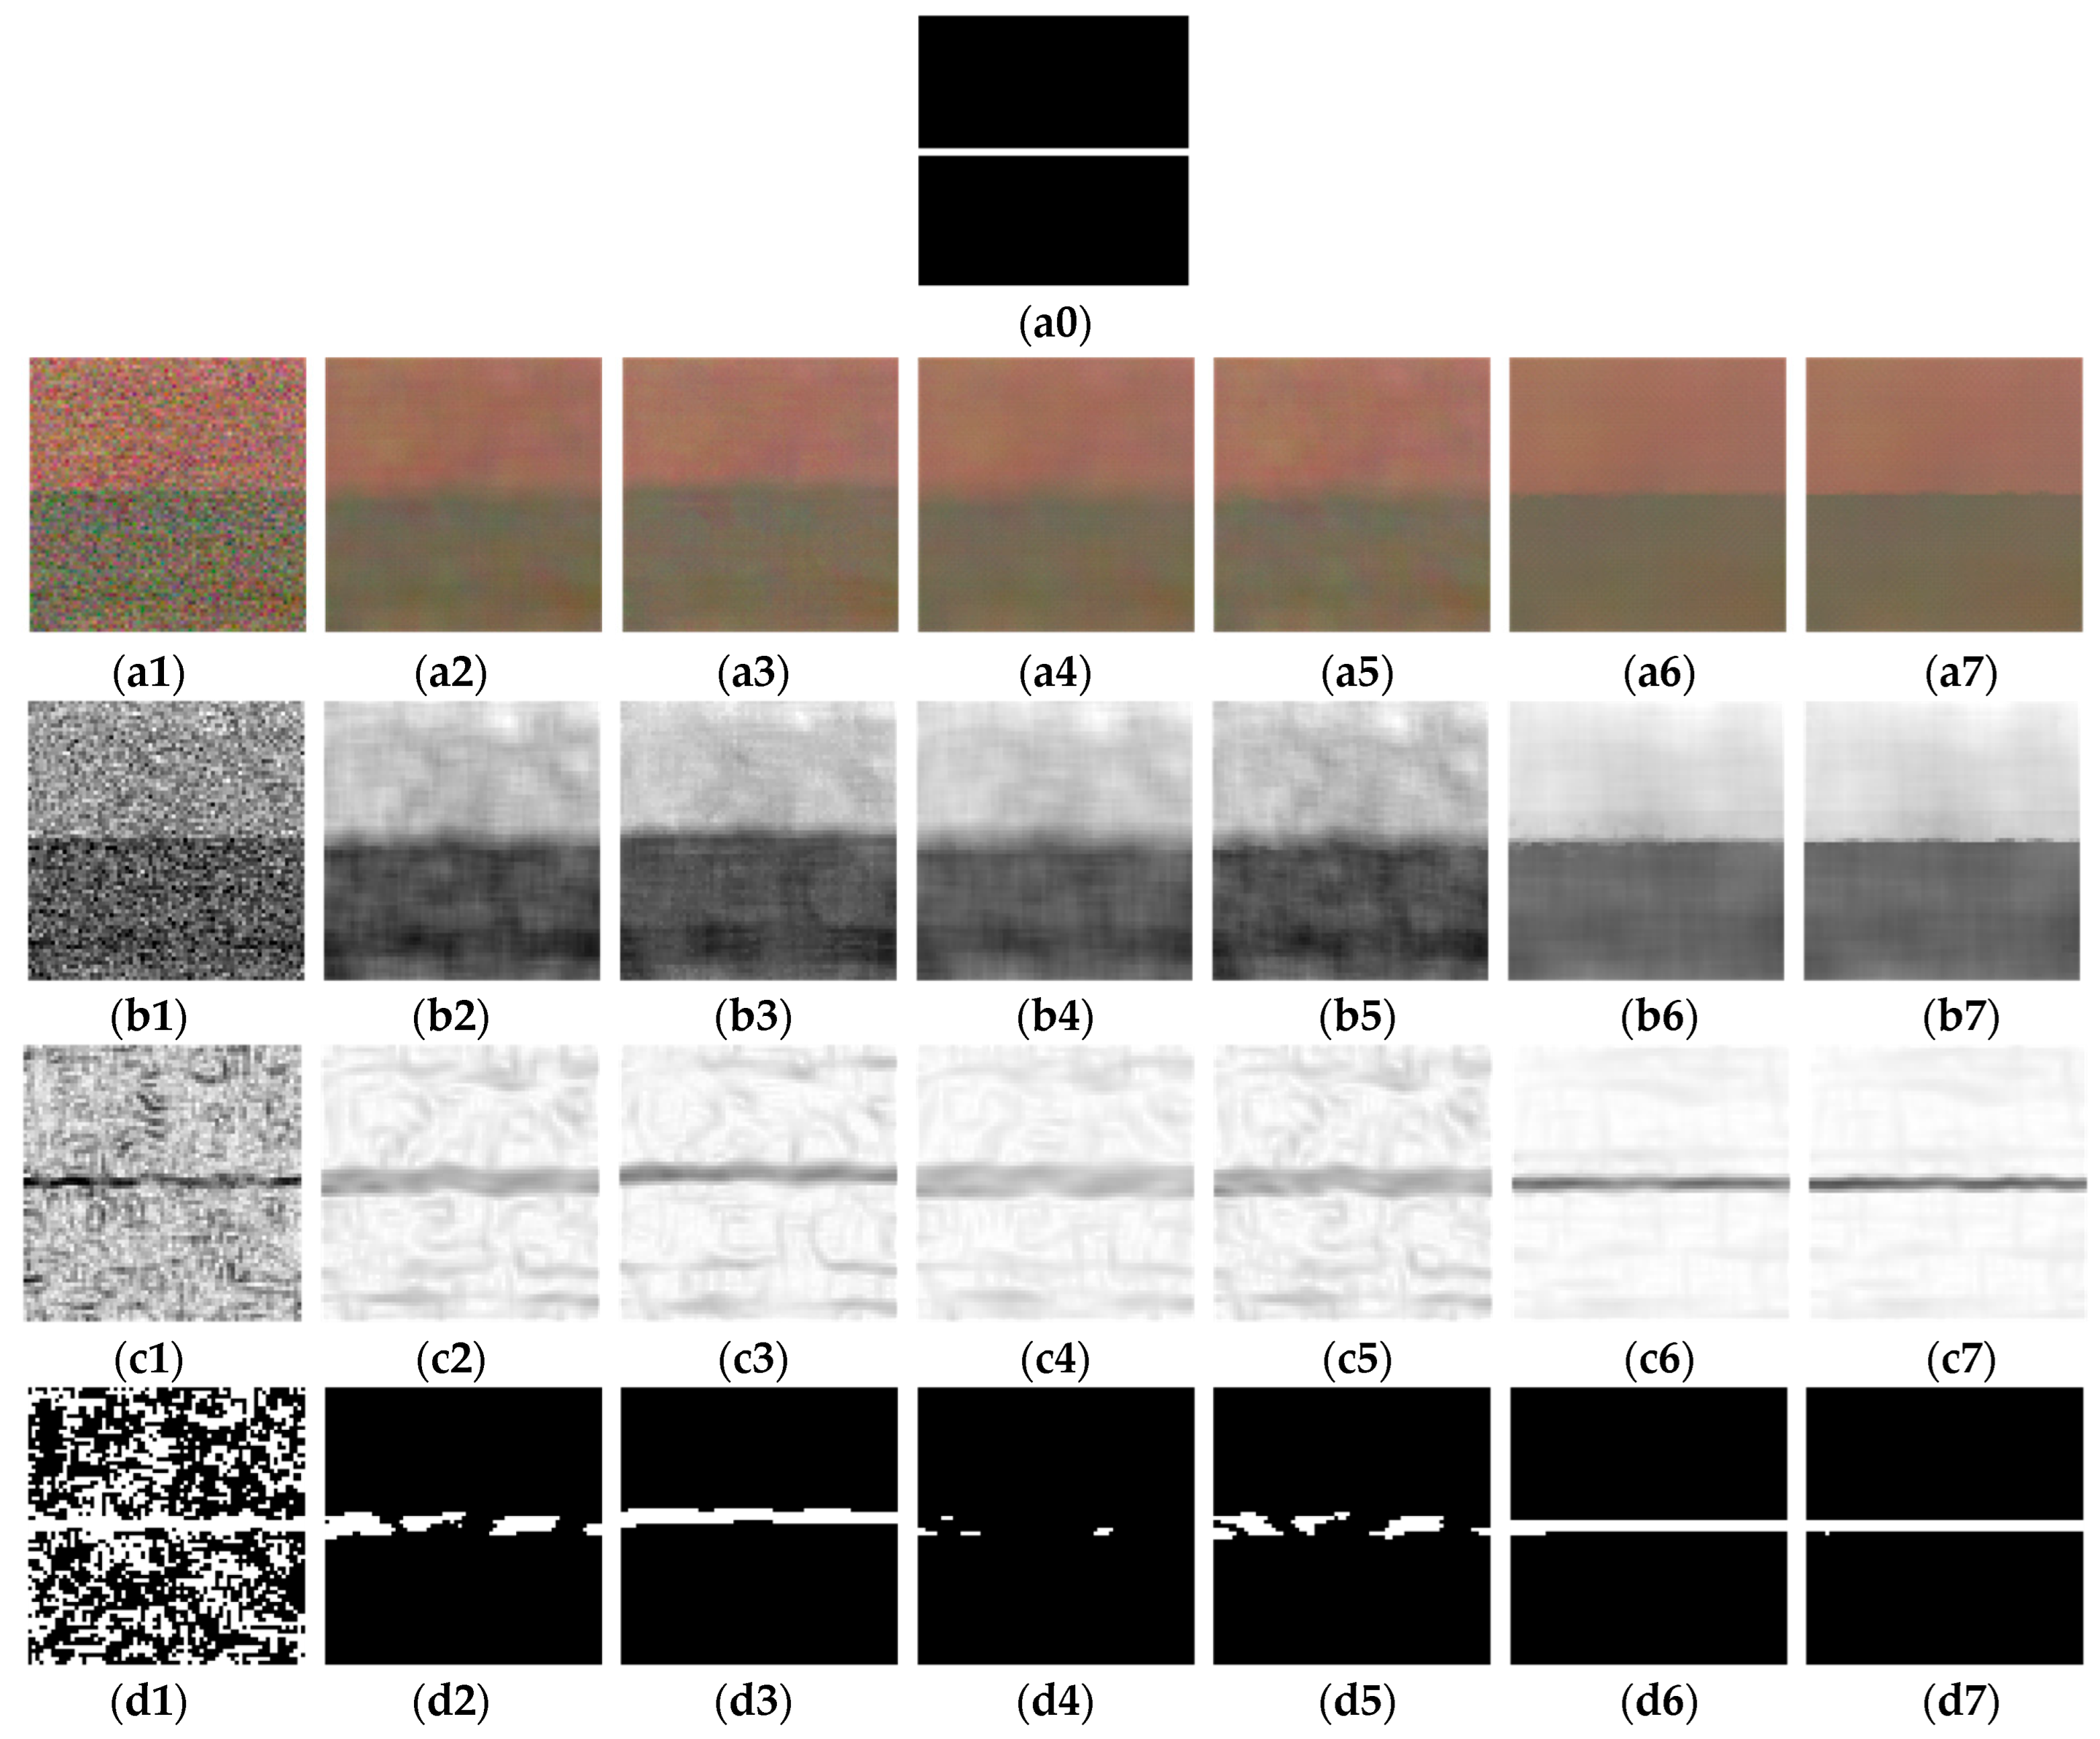
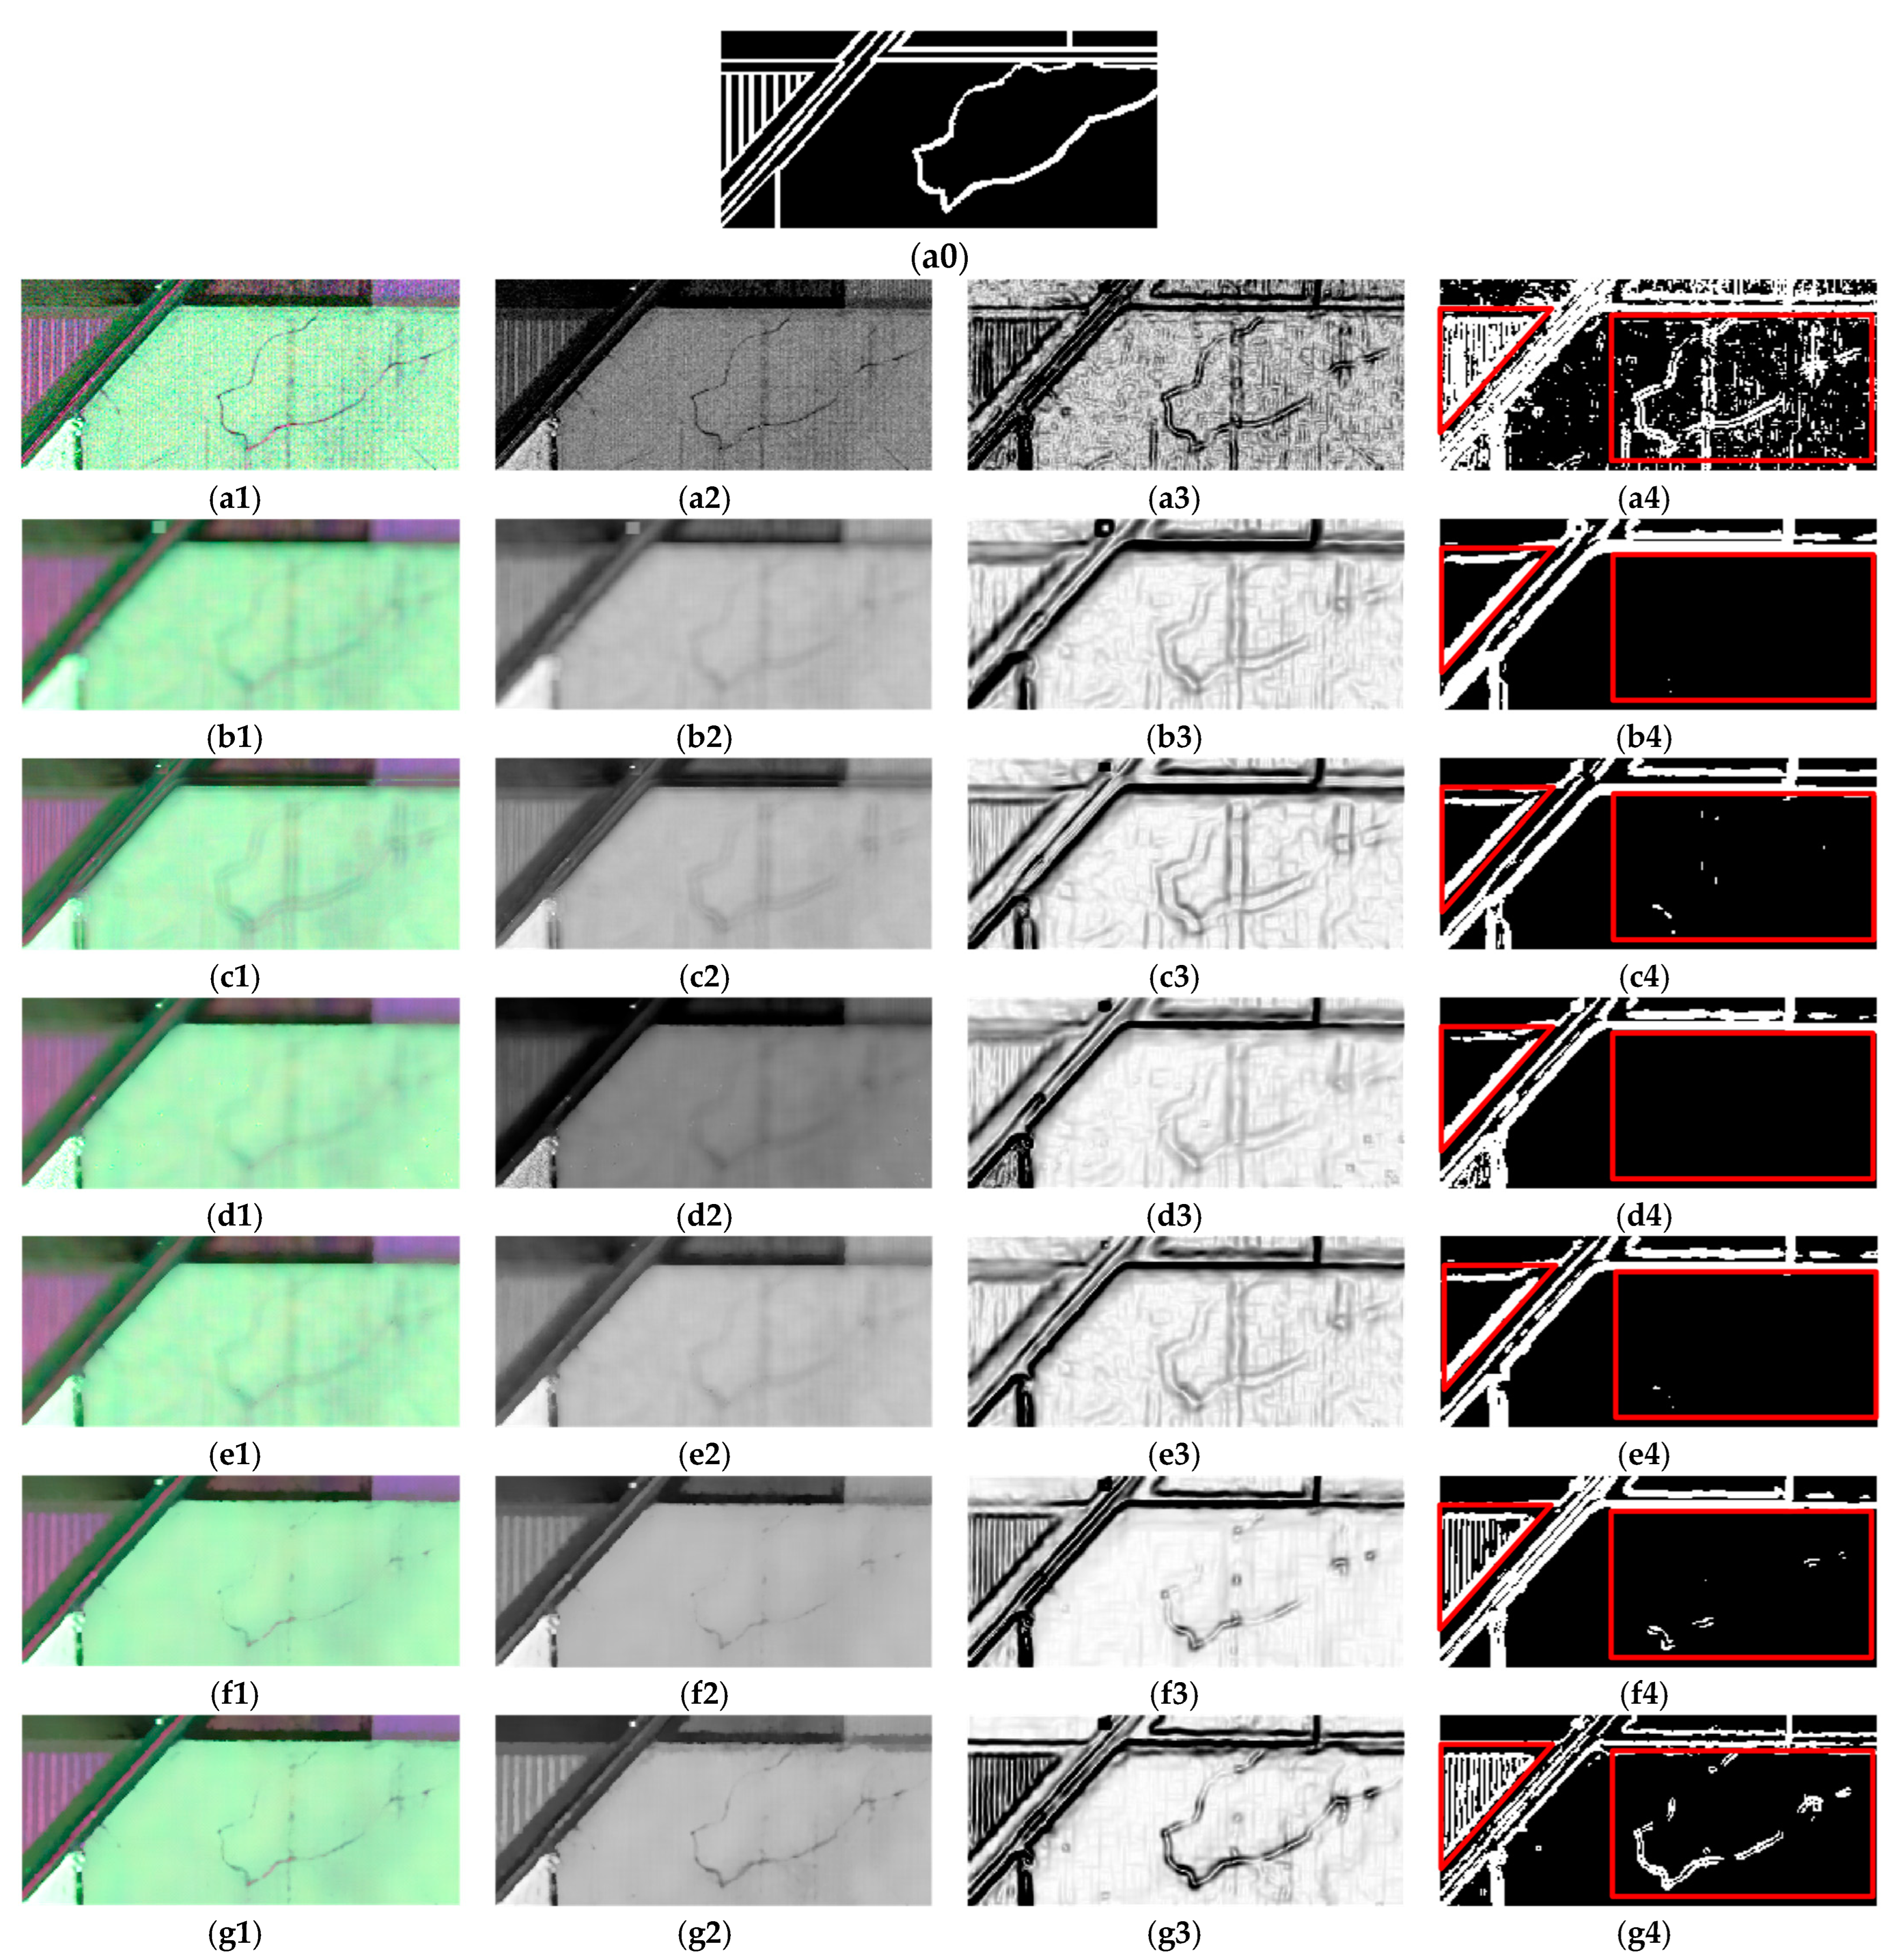
To further evaluate the speckle filtering performance for different methods, edge detection is carried out for three weak-feature areas (ROIs 4–6). The Pauli images, SPAN images, edge detection results, and binary edge detection results with a threshold of 0.5 are shown in Figure 9, Figure 10 and Figure 11. Meanwhile, the edge ground-truth images are shown in Figure 9(a0), Figure 10(a0) and Figure 11(a0).
The edge detection comparison for ROI4 is shown in Figure 9. The ROI4 contains two types of homogeneous regions separated by a straight line. From a visual perspective, the speckle effect is still apparent in the filtered images from the boxcar method, refined Lee method, and IDAN method. The improved Sigma method, SimiTest method, and the proposed MTPCM method can effectively smooth the speckle effect. The edge detection result from original data produces a large number of false alarms, while the edge detection results from filtered data produce no alarms. There is some edge missing phenomenon in the boxcar filtered, improved Sigma filtered, and IDAN filtered data, while the refined Lee method, SimiTest method, and the proposed MTPCM method not only smooth the speckle effect but also maintain image edges well, shown in Figure 9(b6,b7). The edge detection results from both the SimiTest method and the proposed MTPCM method are a straight line that closely matches the ground-truth. The edge detection comparison for ROI5 is shown in Figure 10. The ROI5 contains a curved edge. It can be seen that compared with the traditional methods, the SimiTest method and the proposed MTPCM method exhibit better performance on edge detection, with the proposed MTPCM method outperforming the SimiTest method. The edge detection comparison for ROI6 is shown in Figure 11. The ROI6 contains multiple types of land covers, crop-line edges, and weak-feature edges. It can be observed that, from the traditional filtered data, the salient linear edges can be detected, while the crop-line edges marked with red triangular box and weak-feature edges marked with red rectangular box are difficult to detect, as shown in Figure 11(b4–e4). However, the result of edge detection from the proposed MTPCM method is superior both for crop-line edges and weak-feature edges, as shown in Figure 11(g4).
The quantitative results in terms of the edge detection on 22 June are summarized in Table 1. The proposed MTPCM method achieves the highest FOM values of 0.83, 0.81, and 0.70, which is better than the other five comparison methods. Moreover, compared with the SimiTest methods, the FOM is improved by 0.01, 0.27, and 0.10, respectively from the proposed MTPCM method.
In order to further verify the performance of the proposed MTPCM method, the same comparison experiment is carried out for UAVSAR data on 23 June and 25 June. The quantitative results comparison is shown in Table 2 and Table 3, respectively.
In this comparison for UAVSAR data on 23 June, for ROI1 and ROI2, the ENL values of the proposed MTPCM method are the highest among all methods, reaching 640.08 and 626.56, respectively. For ROI3, the ENL values of the proposed MTPCM method are slightly lower than that of the SimiTest method. In terms of edge detection, the FOM values of the proposed method are 0.82, 0.81, and 0.72 for the ROI4-ROI6, respectively. For ROI4, the FOM value of the proposed MTPCM method and the SimiTest method is the highest, reaching 0.82. For ROI5 and ROI6, the FOM values of the proposed MTPCM method are the highest.
In this comparison for UAVSAR data on 25 June, the ENL values of the proposed MTPCM method are the highest among all methods, reaching 851.84, 438.95, and 903.51, respectively. In terms of edge detection, the FOM value of the proposed MTPCM method is also the highest, reaching 0.84, 0.53, and 0.68, respectively. Therefore, the proposed MTPCM method can effectively improve ENL while maintaining high FOM and has superior speckle filtering performance.
The number and interval of time series data can affect the performance of the proposed filtering method. In order to analyze the influence of the number and interval of time series data, the UAVSAR PolSAR data obtained on 22 June, 23 June, 25 June, 29 June, 3 July, 5 July, and 8 July 2012 are utilized for experiments.
The quantitative results for UAVSAR data at the different number of time series on 22 June are summarized in Table 4. It can be seen that when the number of time series is 3, the ENL values of ROI1 and ROI2 achieve the highest, and the FOM values of ROI4, ROI5, and ROI6 are the highest. As the number of time series increases, both the ENL and FOM values increase first and then decrease. When the number of time series is greater than 5, the filtering effect of the proposed method deteriorates significantly. In addition, note that with the increase in the number of time series data, the dimension of the multi-temporal polarimetric covariance matrix will increase, which will cause the proposed method to be time-consuming. Therefore, the number of time series data is usually chosen to be 2 or 3 in this work.
The quantitative results for UAVSAR data at different intervals of time series on 22 June are summarized in Table 5. It can be seen that when the combination of time series is 22 June and 29 June, the ENL values are the highest among all intervals of time series, reaching 965.94, 854.56, and 905.79, respectively, and the FOM values are also the highest among all intervals of time series, reaching 0.83, 0.81, and 0.70, respectively. As the interval of time series increases, the filtering effect of the proposed method decreases. As time goes by, the crops in the scene keep growing and changing, resulting in fewer and fewer selected similar pixels, and the filtering effect is reduced. Therefore, the choice of time interval is different for different scenarios and needs to be analyzed specifically according to the actual data.

4.2. Comparison with ALOS/PALSAR Data

In order to further examine the speckle filtering performance for the proposed MTPCM method, the ALOS/PALSAR L-band multi-temporal PolSAR data over the coast of Northeast Japan obtained on 21 November 2010 and 8 April 2011 are utilized for comparison, shown in Figure 12. The resolution of this data is 4.45 m × 23.14 m (azimuth × range). Next, 8-look multi-looking processing is performed on this dataset in the azimuth direction to make pixel sizes consistent for azimuth and range direction. The multiple images have been registered. The study area with a size of 550 × 600 pixels mainly contains sea, land, forest, etc.
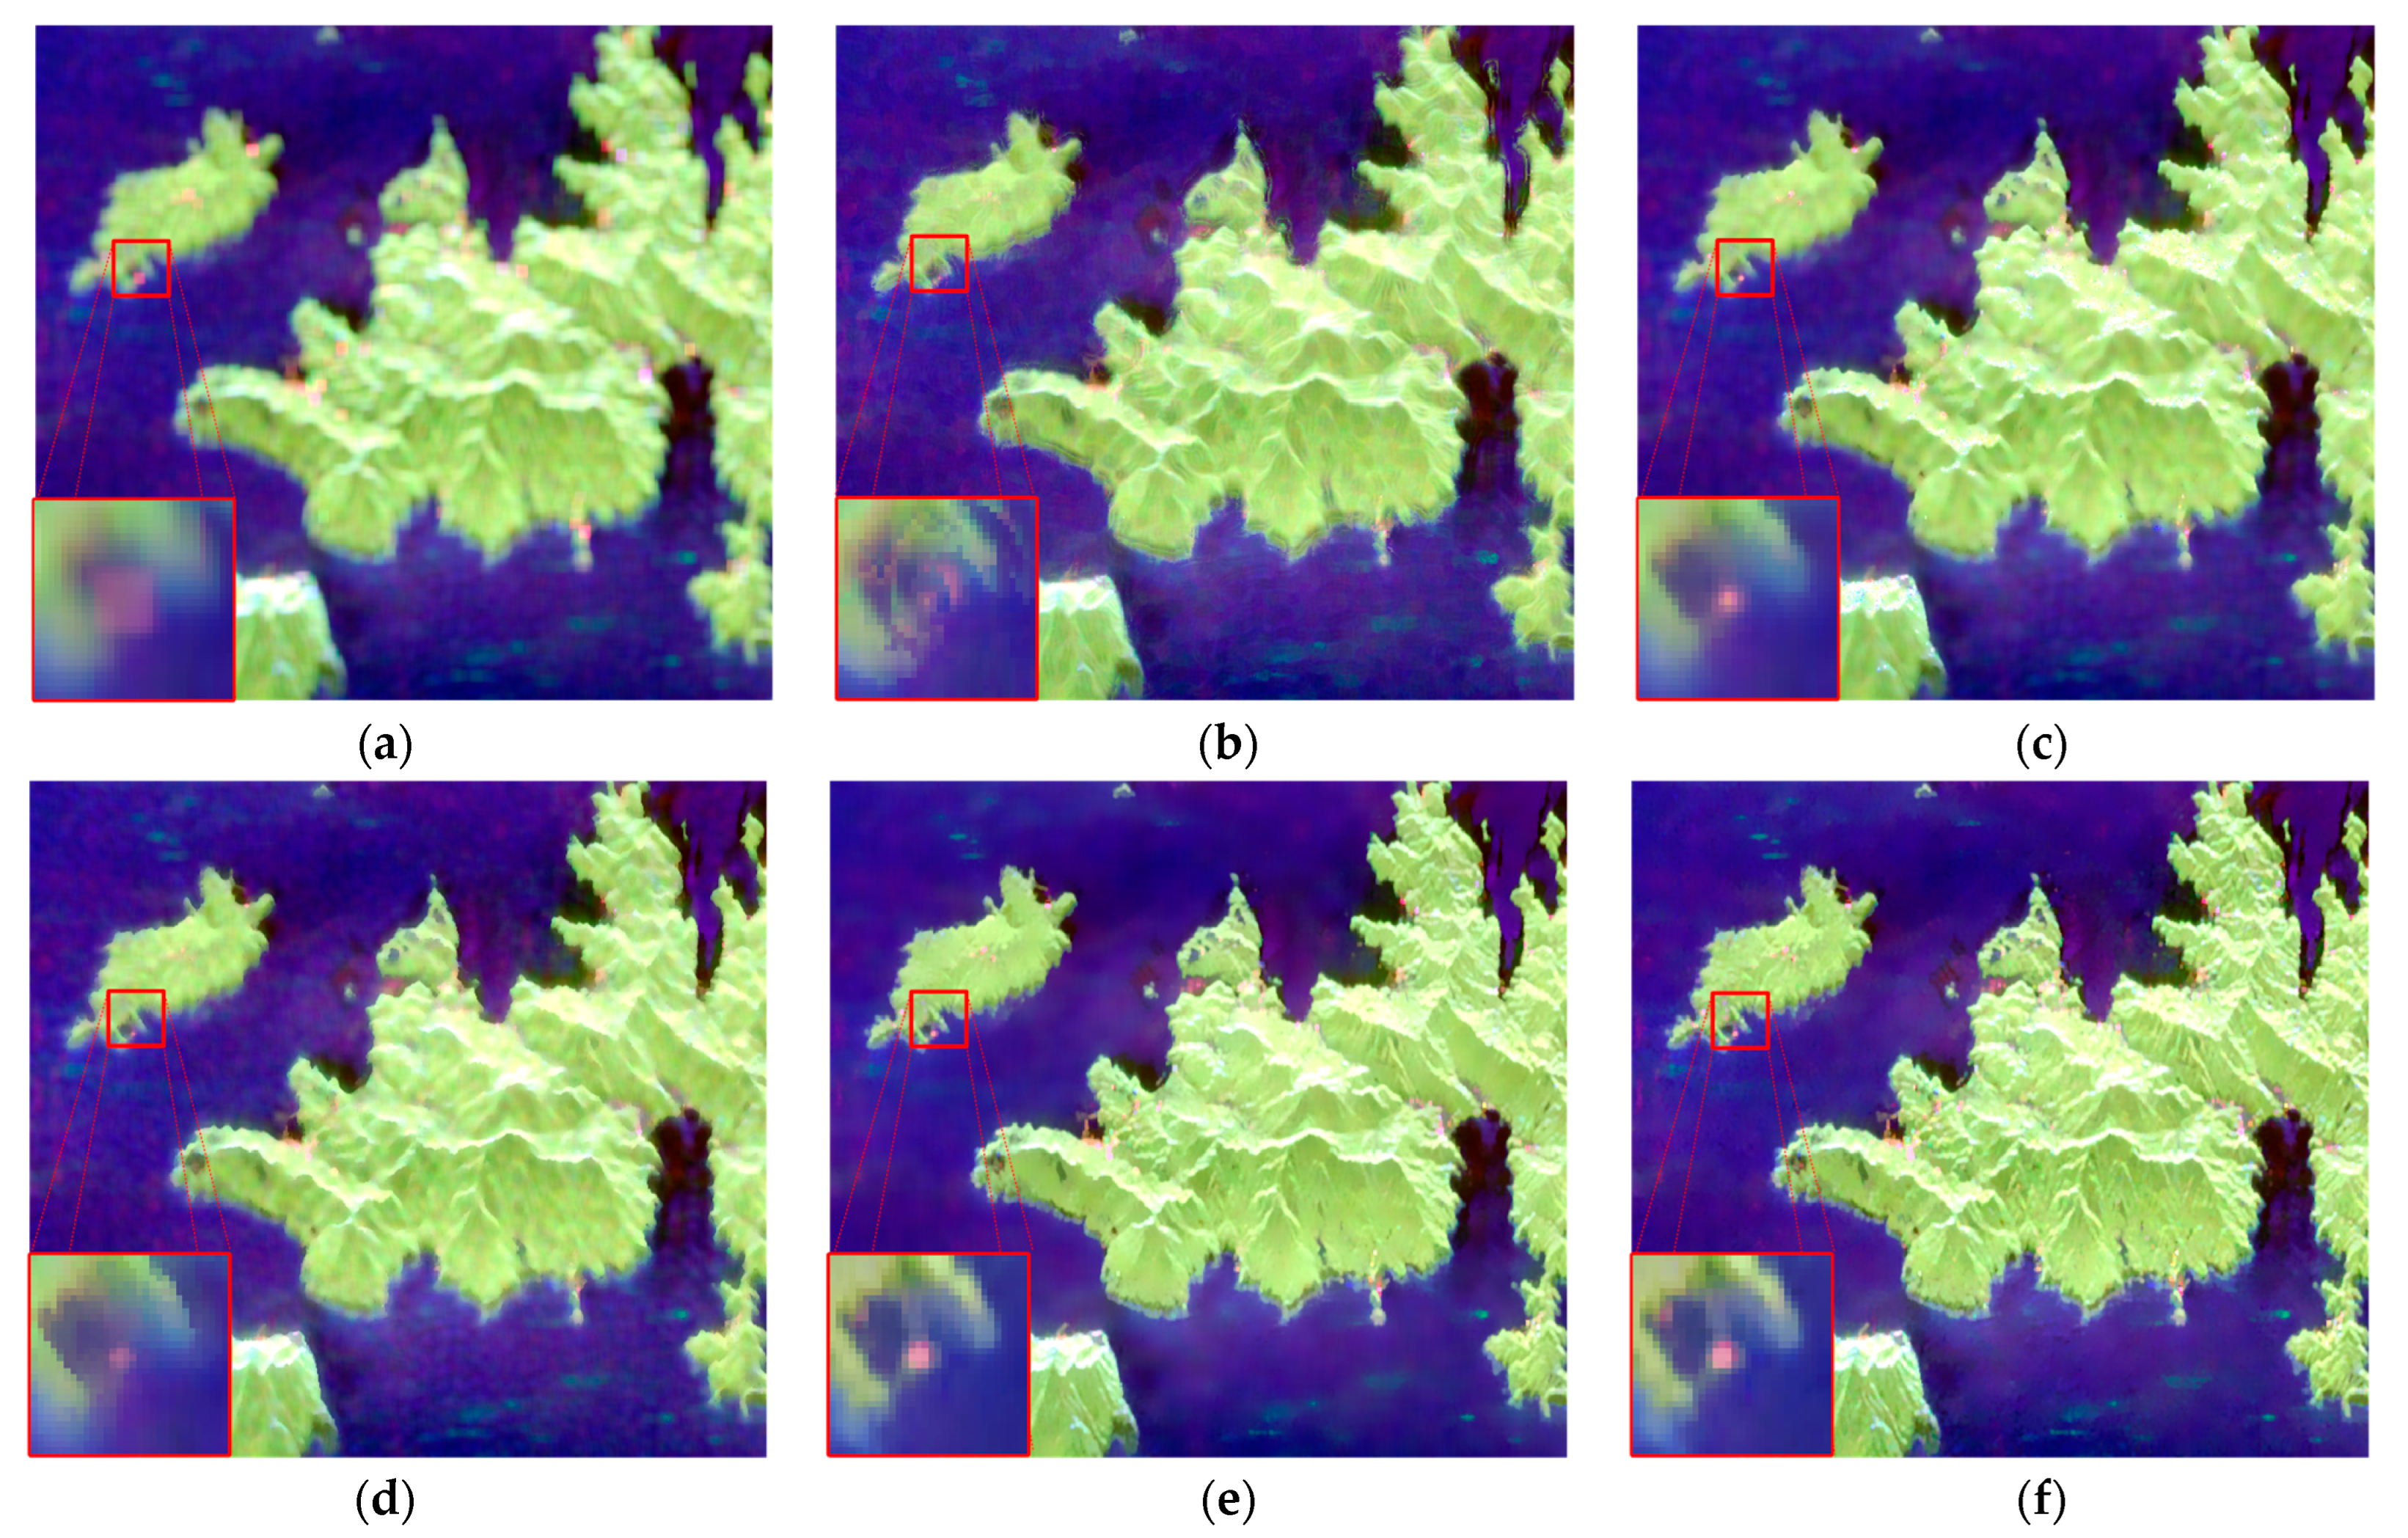
The speckle filtering results for ALOS/PALSAR data on 22 June 2012 and on 8 April 2011 are shown in Figure 13 and Figure 14, respectively. A point target is marked with red rectangles in the images. It is clear that the boxcar method, refined Lee method, and IDAN method can significantly smooth the speckle, but the image resolution is reduced by these methods. In particular, the point target is gone in boxcar filtered and refined Lee filtered images. The improved Sigma method, SimiTest method, and the proposed MTPCM method preserve the spatial resolution well, which exhibits better performance on both speckle reduction and details preservation.
In order to obtain quantitative performance comparisons of the different methods, six ROIs are randomly selected from the study area, shown in Figure 12a. The selected six ROIs include three sea regions (marked with red rectangles, denoted as ROI1, ROI2, and ROI3) and three land regions (marked with blue rectangles, denoted as ROI4, ROI5, and ROI6). The sizes of ROIs are all 70 × 70 pixels. The quantitative results comparison in terms of ENL values for ROIs 1–6 are summarized in Table 6 and Table 7. For ALOS/PALSAR data obtained on 21 November 2010, the ENL values of original data for ROIs 1–3 are 5.38, 4.83, and 5.66, respectively. The ENL values of the filtered data are clearly improved. The boxcar method, refined Lee method, improved Sigma method, and SimiTest method obtain higher ENL values than the IDAN method, but lower than the proposed MTPCM method. The ENL values of the proposed MTPCM method for ROIs 1–3 reach 134.84, 138.27, and 148.68, respectively. For the land regions, the ENL values of the proposed method are the largest, reaching 104.36, 69.09, and 21.68, respectively. Due to the more complex land regions, their ENL values are generally lower than those of sea regions.
For ALOS/PALSAR data obtained on 8 April 2011, the proposed MTPCM method also achieves the highest ENL values of 279.87, 372.45, 168.75, 71.64, 96.94, and 46.05. Therefore, the speckle filtering results for ALOS/PALSAR data further verify the performance advantages of the proposed MTPCM method.

5. Conclusions

An adaptive speckle filter is developed specifically for multi-temporal PolSAR data. The novelty lies in the scheme for similar pixel selection by similarity test of multi-temporal polarimetric covariance matrices. This scheme fuses the complete information of multi-temporal PolSAR data and achieves more satisfied characterization and determination of similar pixels. Sensitivity evaluations in terms of several typical and challenging texture patterns validate the efficiency of this selection scheme. Further comparison studies with airborne and spaceborne PolSAR data over various imaging scenes clearly demonstrate the speckle filtering performance of the proposed method. The superiority of the established method is also confirmed compared with conventional methods. The proposed method can provide almost speckle-free and details preservation which will greatly assist the following practical applications.
In this paper, the problem of the similarity test of multi-temporal polarimetric covariance matrices has been discussed. With the shortening of the spaceborne full-pol SAR revisit period, it is expected to obtain a large number of multi-temporal full-pol SAR data. The applicability of the proposed method will be better verified. In addition, there are abundant multi-temporal dual-pol SAR data at the present stage. Since the dual-pol SAR covariance matrix also satisfies the complex Wishart distribution, the proposed method is suitable for multi-temporal dual-pol SAR.

Author Contributions

H.L. and S.C. provided ideas; H.L. and X.C. validated the idea and established the algorithm; H.L., H.L. and M.L. designed the experiment; H.L. and J.D. analyzed the results of the experiment; H.L., S.C. and X.C. wrote the paper. All authors have read and agreed to the published version of the manuscript.

Funding

This research was funded in part by the National Natural Science Foundation of China (62122091 and 61771480).

Data Availability Statement

Not applicable.

Acknowledgments

The authors would like to thank the Jet Propulsion Laboratory (JPL), USA, for providing the UAVSAR datasets, and the Aerospace Exploration Agency (JAXA), Japan, for providing the ALOS/PALSAR datasets.

Conflicts of Interest

The authors declare no conflict of interest.

References

  1. Lee, J.S.; Pottier, E. Polarimetric Radar Imaging: From Basics to Applications; CRC Press: Boca Raton, FL, USA, 2009. [Google Scholar]
  2. Chen, S.W.; Wang, X.S.; Xiao, S.P.; Sato, M. Target Scattering Mechanism in Polarimetric Synthetic Aperture Radar: Interpretation and Application; Springer: Singapore, 2018. [Google Scholar]
  3. Skriver, H. Crop Classification by Multitemporal C- and L-Band Single- and Dual-Polarization and Fully Polarimetric SAR. IEEE Trans. Geosci. Remote Sens. 2012, 50, 2138–2149. [Google Scholar] [CrossRef]
  4. Guo, J.; Wei, P.L.; Liu, J.; Jin, B.; Su, B.F.; Zhou, Z.S. Crop Classification Based on Differential Characteristics of H/α Scattering Parameters for Multitemporal Quad- and Dual-Polarization SAR Images. IEEE Trans. Geosci. Remote Sens. 2018, 56, 6111–6123. [Google Scholar] [CrossRef]
  5. Pirrone, D.; De, S.; Bhattacharya, A.; Bruzzone, L.; Bovolo, F. An Unsupervised Approach to Change Detection in Built-Up Areas by Multitemporal PolSAR Images. IEEE Geosci. Remote Sens. Lett. 2020, 17, 1914–1918. [Google Scholar] [CrossRef]
  6. Yu, X.; Yue, X. Similarity Matrix Entropy for Multitemporal Polarimetric SAR Change Detection. IEEE Geosci. Remote Sens. Lett. 2022, 19, 1–5. [Google Scholar] [CrossRef]
  7. Chen, S.W.; Sato, M. Tsunami Damage Investigation of Built-Up Areas Using Multitemporal Spaceborne Full Polarimetric SAR Images. IEEE Trans. Geosci. Remote Sens. 2013, 51, 1985–1997. [Google Scholar] [CrossRef]
  8. Chen, S.W.; Wang, X.S.; Sato, M. Urban Damage Level Mapping Based on Scattering Mechanism Investigation Using Fully Polarimetric SAR Data for the 3.11 East Japan Earthquake. IEEE Trans. Geosci. Remote Sens. 2016, 54, 6919–6929. [Google Scholar] [CrossRef]
  9. Pirrone, D.; Bovolo, F.; Bruzzone, L. An Approach to Unsupervised Detection of Fully and Partially Destroyed Buildings in Multitemporal VHR SAR Images. IEEE J. Sel. Top. Appl. Earth Obs. Remote Sens. 2020, 13, 5938–5953. [Google Scholar] [CrossRef]
  10. Chen, S.W.; Wang, X.S.; Sato, M. PolInSAR Complex Coherence Estimation Based on Covariance Matrix Similarity Test. IEEE Trans. Geosci. Remote Sens. 2012, 50, 4699–4710. [Google Scholar] [CrossRef]
  11. Lê, T.T.; Atto, A.M.; Trouvé, E.; Nicolas, J.M. Adaptive Multitemporal SAR Image Filtering Based on the Change Detection Matrix. IEEE Geosci. Remote Sens. Lett. 2014, 11, 1826–1830. [Google Scholar] [CrossRef] [Green Version]
  12. Chierchia, G.; Gheche, M.E.; Scarpa, G.; Verdoliva, L. Multitemporal SAR Image Despeckling Based on Block-Matching and Collaborative Filtering. IEEE Trans. Geosci. Remote Sens. 2017, 55, 5467–5480. [Google Scholar] [CrossRef]
  13. Dong, J.; Liao, M.; Zhang, L.; Gong, J. A Unified Approach of Multitemporal SAR Data Filtering Through Adaptive Estimation of Complex Covariance Matrix. IEEE Trans. Geosci. Remote Sens. 2018, 56, 5320–5333. [Google Scholar] [CrossRef]
  14. Zhao, W.; Deledalle, C.A.; Denis, L.; Maître, H.; Nicolas, J.M.; Tupin, F. Ratio-Based Multitemporal SAR Images Denoising: RABASAR. IEEE Trans. Geosci. Remote Sens. 2019, 57, 3552–3565. [Google Scholar] [CrossRef] [Green Version]
  15. Ma, X.; Wang, C.; Yin, Z.; Wu, P. SAR Image Despeckling by Noisy Reference-Based Deep Learning Method. IEEE Trans. Geosci. Remote Sens. 2020, 58, 8807–8818. [Google Scholar] [CrossRef]
  16. Meraoumia, I.; Dalsasso, E.; Denis, L.; Abergel, R.; Tupin, F. Multitemporal Speckle Reduction With Self-Supervised Deep Neural Networks. IEEE Trans. Geosci. Remote Sens. 2023, 61, 1–14. [Google Scholar] [CrossRef]
  17. Lee, J.S. Refined Filtering of Image Noise Using Local Statistics. Comput. Graph. Image Process. 1981, 15, 380–389. [Google Scholar] [CrossRef]
  18. Lee, J.S.; Grunes, M.R.; Grandi, G.D. Polarimetric SAR Speckle Filtering and Its Implication for Classification. IEEE Trans. Geosci. Remote Sens. 1999, 37, 2363–2373. [Google Scholar] [CrossRef]
  19. Vasile, G.; Trouve, E.; Jong-Sen, L.; Buzuloiu, V. Intensity-Driven Adaptive-Neighborhood Technique for Polarimetric and Interferometric SAR Parameters Estimation. IEEE Trans. Geosci. Remote Sens. 2006, 44, 1609–1621. [Google Scholar] [CrossRef] [Green Version]
  20. Lee, J.S. Digital Image Enhancement and Noise Filtering by Use of Local Statistics. IEEE Trans. Pattern Anal. Mach. Intell. 1980, PAMI-2, 165–168. [Google Scholar] [CrossRef] [PubMed] [Green Version]
  21. Lee, J.S.; Ainsworth, T.L.; Wang, Y.; Chen, K.S. Polarimetric SAR Speckle Filtering and the Extended Sigma Filter. IEEE Trans. Geosci. Remote Sens. 2015, 53, 1150–1160. [Google Scholar] [CrossRef]
  22. Nie, X.; Qiao, H.; Zhang, B.; Huang, X. A Nonlocal TV-Based Variational Method for PolSAR Data Speckle Reduction. IEEE Trans. Image Process. 2016, 25, 2620–2634. [Google Scholar] [CrossRef]
  23. Chen, J.; Chen, Y.; An, W.; Cui, Y.; Yang, J. Nonlocal Filtering for Polarimetric SAR Data: A Pretest Approach. IEEE Trans. Geosci. Remote Sens. 2011, 49, 1744–1754. [Google Scholar] [CrossRef]
  24. Lopez-Martinez, C.; Fabregas, X. Model-based polarimetric SAR speckle filter. IEEE Trans Geosci Remote Sens 2008, 46, 3894–3907. [Google Scholar] [CrossRef]
  25. Foucher, S.; López-Martínez, C. Analysis, Evaluation, and Comparison of Polarimetric SAR Speckle Filtering Techniques. IEEE Trans. Image Process. 2014, 23, 1751–1764. [Google Scholar] [CrossRef] [PubMed]
  26. Touzi, R. A Review of Speckle Filtering in the Context of Estimation Theory. IEEE Trans. Geosci. Remote Sens. 2002, 40, 2392–2404. [Google Scholar] [CrossRef]
  27. Velotto, D.; Nunziata, F.; Migliaccio, M.; Lehner, S. Dual-Polarimetric TerraSAR-X SAR Data for Target at Sea Observation. IEEE Geosci. Remote Sens. Lett. 2013, 10, 1114–1118. [Google Scholar] [CrossRef]
  28. Chen, S.W.; Wang, X.S.; Sato, M. Uniform Polarimetric Matrix Rotation Theory and Its Applications. IEEE Trans. Geosci. Remote Sens. 2014, 52, 4756–4770. [Google Scholar] [CrossRef]
  29. Li, H.L.; Li, M.D.; Cui, X.C.; Chen, S.W. Man-Made Target Structure Recognition with Polarimetric Correlation Pattern and Roll-Invariant Feature Coding. IEEE Geosci. Remote Sens. Lett. 2022, 19, 1–5. [Google Scholar] [CrossRef]
  30. Li, H.L.; Cui, X.C.; Chen, S.W. PolSAR Ship Detection with Optimal Polarimetric Rotation Domain Features and SVM. Remote Sens. 2021, 13, 3932. [Google Scholar] [CrossRef]
  31. Yang, Z.; Fang, L.; Shen, B.; Liu, T. PolSAR Ship Detection Based on Azimuth Sublook Polarimetric Covariance Matrix. IEEE J. Sel. Top. Appl. Earth Obs. Remote Sens. 2022, 15, 8506–8518. [Google Scholar] [CrossRef]
  32. Chen, S.W.; Li, Y.Z.; Wang, X.S.; Xiao, S.P.; Sato, M. Modeling and Interpretation of Scattering Mechanisms in Polarimetric Synthetic Aperture Radar: Advances and perspectives. IEEE Signal Process. Mag. 2014, 31, 79–89. [Google Scholar] [CrossRef]
  33. Wu, G.Q.; Li, Y.Z.; Chen, S.W. Polarimetric Model-Based Decomposition with Refined Double-Bounce Orientation Angle and Scattering Model. Remote Sens. 2021, 13, 3070. [Google Scholar] [CrossRef]
  34. Lee, J.S.; Grunes, M.R.; Schuler, D.L.; Pottier, E.; Ferro-Famil, L. Scattering-Model-Based Speckle Filtering of Polarimetric SAR Data. IEEE Trans. Geosci. Remote Sens. 2006, 44, 176–187. [Google Scholar] [CrossRef]
  35. Zhao, F.; Mallorqui, J.J. SMF-POLOPT: An Adaptive Multitemporal Pol(DIn)SAR Filtering and Phase Optimization Algorithm for PSI Applications. IEEE Trans. Geosci. Remote Sens. 2019, 57, 7135–7147. [Google Scholar] [CrossRef]
  36. Conradsen, K.; Nielsen, A.A.; Schou, J.; Skriver, H. A Test Statistic in the Complex Wishart Distribution and Its Application to Change Detection in Polarimetric SAR Data. IEEE Trans. Geosci. Remote Sens. 2003, 41, 4–19. [Google Scholar] [CrossRef] [Green Version]
  37. Chen, S.W.; Wang, X.S.; Xiao, S.P. Polarimetric SAR Speckle Filtering Based on Similarity Test and Adaptive Clustering. IEEE Geosci. Remote Sens. Lett. 2021, 18, 702–706. [Google Scholar] [CrossRef]
  38. Salehi, M.; Mohammadzadeh, A.; Maghsoudi, Y. Adaptive Speckle Filtering for Time Series of Polarimetric SAR Images. IEEE J. Sel. Top. Appl. Earth Obs. Remote Sens. 2017, 10, 2841–2848. [Google Scholar] [CrossRef]
  39. Kumar, A.; Giusti, E.; Mancuso, F.; Ghio, S.; Lupidi, A.; Martorella, M. Three-Dimensional Polarimetric InISAR Imaging of Non-Cooperative Targets. IEEE Trans. Comput. Imaging 2023, 9, 210–223. [Google Scholar] [CrossRef]
  40. Lee, J.S.; Jen-Hung, W.; Ainsworth, T.L.; Kun-Shan, C.; Chen, A.J. Improved Sigma Filter for Speckle Filtering of SAR Imagery. IEEE Trans. Geosci. Remote Sens. 2009, 47, 202–213. [Google Scholar] [CrossRef]
  41. Argenti, F.; Lapini, A.; Bianchi, T.; Alparone, L. A Tutorial on Speckle Reduction in Synthetic Aperture Radar Images. IEEE Geosci. Remote Sens. Mag. 2013, 1, 6–35. [Google Scholar] [CrossRef] [Green Version]
  42. Touzi, R.; Lopes, A.; Bousquet, P. A Statistical and Geometrical Edge Detector for SAR Images. IEEE Trans. Geosci. Remote Sens. 1988, 26, 764–773. [Google Scholar] [CrossRef]
  43. McNairn, H.; Jackson, T.J.; Wiseman, G.; Belair, S.; Berg, A.; Bullock, P.; Colliander, A.; Cosh, M.H.; Kim, S.-B.; Magagi, R.; et al. The Soil Moisture Active Passive Validation Experiment 2012 (SMAPVEX12): Prelaunch Calibration and Validation of the SMAP Soil Moisture Algorithms. IEEE Trans. Geosci. Remote Sens. 2015, 53, 2784–2801. [Google Scholar] [CrossRef]
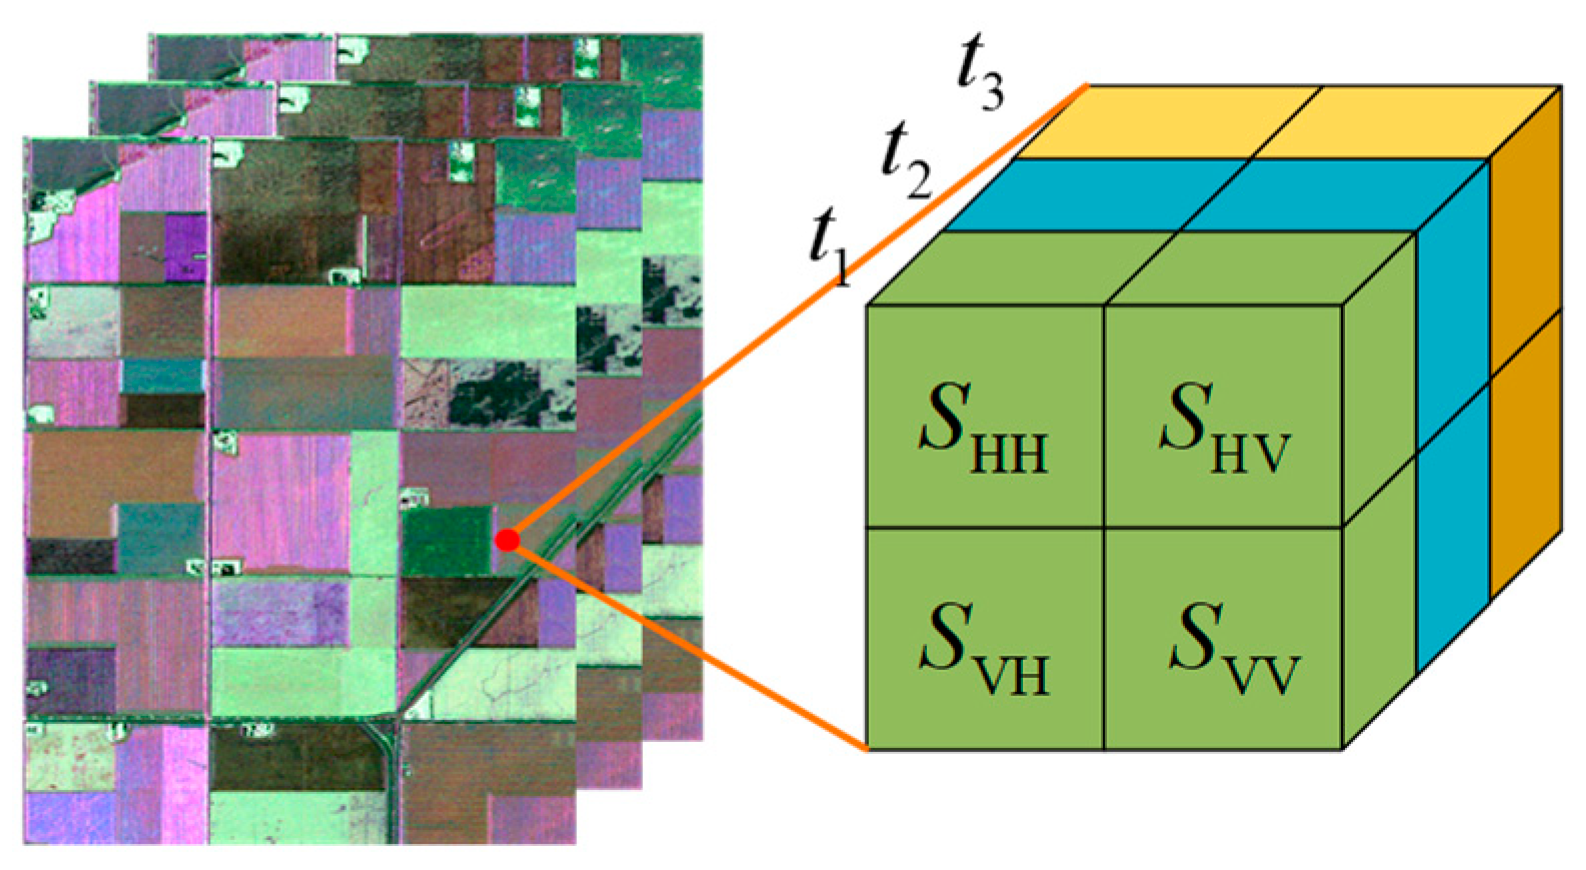
Figure 1. The 3D scattering information of multi-temporal PolSAR.
Remotesensing 15 03679 g001
Figure 2. Similar pixel selection for mixture-feature area.
Remotesensing 15 03679 g002
Figure 3. Similar pixel selection for crop-line area.
Remotesensing 15 03679 g003
Figure 4. Similar pixel selection for weak-feature area.
Remotesensing 15 03679 g004
Figure 5. Flowchart of the proposed MTPCM speckle filter.
Remotesensing 15 03679 g005
Figure 6. UAVSAR data. (a) 22 June 2012. (b) 23 June 2012. (c) 25 June 2012.
Remotesensing 15 03679 g006
Figure 7. Speckle filtering results for UAVSAR data (22 June 2012). (a) Boxcar. (b) Refined Lee. (c) Improved sigma. (d) IDAN. (e) SimiTest. (f) MTPCM.
Remotesensing 15 03679 g007
Figure 8. Speckle filtering comparison for homogeneous areas of UAVSAR data. (a1a7) ROI1. (b1b7) ROI2. (c1c7) ROI3. The numbers 1–7 indicate original, boxcar filtered, refined Lee filtered, improved Sigma filtered, IDAN filtered, SimiTest filtered, and MTPCM filtered data, respectively.
Remotesensing 15 03679 g008
Figure 9. Edge detection comparison for ROI4 of UAVSAR data. (a0) Edge ground-truth. (a1a7) Pauli image. (b1b7) SPAN image. (c1c7) Edge detection results. (d1d7) Binary edge detection results. The numbers 1–7 indicate original, boxcar filtered, refined Lee filtered, improved Sigma filtered, IDAN filtered, SimiTest filtered, and MTPCM filtered data, respectively.
Remotesensing 15 03679 g009
Figure 10. Edge detection comparison for ROI5 of UAVSAR data. (a0) Edge ground-truth. (a1a7) Pauli image. (b1b7) SPAN image. (c1c7) Edge detection results. (d1d7) Binary edge detection results. The numbers 1–7 indicate original, boxcar filtered, refined Lee filtered, improved Sigma filtered, IDAN filtered, SimiTest filtered, and MTPCM filtered data, respectively.
Remotesensing 15 03679 g010
Figure 11. Edge detection comparison for ROI6 of UAVSAR data. (a0) Edge ground-truth. (a1g1) Pauli images from original, boxcar filtered, refined Lee filtered, improved Sigma filtered, IDAN filtered, SimiTest filtered, and MTPCM filtered data, respectively. (a2g2) The corresponding SPAN images. (a3g3) The corresponding edge detection results. (a4g4) The corresponding binary edge detection results.
Remotesensing 15 03679 g011
Figure 12. ALOS/PALSAR data. (a) 21 November 2010. (b) 8 April 2011.
Remotesensing 15 03679 g012
Figure 13. Speckle filtering results for ALOS/PALSAR data (8 April 2011). (a) Boxcar. (b) Refined Lee. (c) Improved Sigma. (d) IDAN. (e) SimiTest. (f) MTPCM.
Remotesensing 15 03679 g013
Figure 14. Speckle filtering results for ALOS/PALSAR data (21 November 2010). (a) Boxcar. (b) Refined Lee. (c) Improved Sigma. (d) IDAN. (e) SimiTest. (f) MTPCM.
Remotesensing 15 03679 g014
Table 1. Quantitative results comparison for UAVSAR data (22 June 2012).
MethodENLFOM
ROI1ROI2ROI3ROI4ROI5ROI6
Original data20.6216.2320.540.100.120.34
Boxcar440.42385.80430.270.620.030.45
Refined Lee488.65437.93504.020.230.160.51
Improved Sigma600.09558.12569.790.100.100.38
IDAN455.03398.33445.500.590.160.39
SimiTest963.75841.82906.040.820.540.60
MTPCM966.15854.95905.820.830.810.70
Table 2. Quantitative results comparison for UAVSAR data (23 June 2012).
MethodENLFOM
ROI1ROI2ROI3ROI4ROI5ROI6
Original data20.4315.6819.270.090.120.34
Boxcar428.15438.56384.600.180.000.33
Refined Lee368.65345.58351.250.210.160.52
Improved Sigma428.13438.56384.610.270.110.38
IDAN349.05326.34314.490.550.200.39
SimiTest637.84618.20582.130.820.670.62
MTPCM640.08626.56581.330.820.810.72
Table 3. Quantitative results comparison for UAVSAR data (25 June 2012).
MethodENLFOM
ROI1ROI2ROI3ROI4ROI5ROI6
Original data18.1316.4519.250.060.120.37
Boxcar544.05324.30529.980.090.000.30
Refined Lee462.74303.13461.510.210.010.54
Improved Sigma544.14324.35529.980.200.010.40
IDAN408.89270.30413.730.560.200.38
SimiTest838.76423.43898.690.830.390.61
MTPCM851.84438.95903.510.840.530.68
Table 4. Quantitative results for UAVSAR data at different number of time series (22 June 2012).
Number of Time SeriesENLFOM
ROI1ROI2ROI3ROI1ROI2ROI3
1963.75841.82906.040.820.540.60
2965.62854.23905.590.830.760.67
3966.15854.95905.820.830.810.70
4962.81851.05898.710.810.800.69
5950.80848.12891.080.780.730.61
7916.81795.54806.640.670.410.45
Table 5. Quantitative results for UAVSAR data at different intervals time series (22 June 2012).
Combination of
Time Series
ENLFOM
ROI1ROI2ROI3ROI1ROI2ROI3
0622–0623965.62854.23905.590.830.760.67
0622–0625965.65854.43905.650.830.770.69
0622–0629965.94854.56905.790.830.810.70
0622–0703965.36854.22905.500.830.760.66
0622–0705964.90853.75905.260.820.730.64
0622–0708964.46853.2904.960.820.730.64
Table 6. Quantitative results comparison for ALOS/PALSAR data (21 November 2010).
MethodROI1ROI2ROI3ROI4ROI5ROI6
Original data5.384.835.663.613.391.93
Boxcar97.4585.24107.3474.5641.6112.86
Refined Lee86.5074.4586.9391.2236.2215.44
Improved Sigma97.4585.60107.9493.6239.9611.07
IDAN74.8161.1880.2274.5835.4713.58
SimiTest104.9398.17118.3498.1564.3221.51
MTPCM134.84138.27148.68104.3669.0921.68
Table 7. Quantitative results comparison for ALOS/PALSAR data (8 April 2011).
MethodROI1ROI2ROI3ROI4ROI5ROI6
Original data6.285.906.092.454.802.26
Boxcar150.42174.12125.0241.1059.625.36
Refined Lee110.02137.55114.7865.7858.8330.16
Improved Sigma150.03174.00125.9963.1761.937.51
IDAN109.59118.5492.7044.6749.0116.16
SimiTest249.34295.51149.2465.1680.8745.36
MTPCM279.87372.45168.7571.6496.9446.05
Disclaimer/Publisher’s Note: The statements, opinions and data contained in all publications are solely those of the individual author(s) and contributor(s) and not of MDPI and/or the editor(s). MDPI and/or the editor(s) disclaim responsibility for any injury to people or property resulting from any ideas, methods, instructions or products referred to in the content.