1. Introduction
This project was motivated by the need for low-cost calibrated multispectral imaging sensors for light pollution studies. Such cameras can help measure the light field for studying natural ecosystems at night [
1], for astronomical night sky quality monitoring [
2], but also to perform surveys of lighting devices, as detected from above from aerial or space-borne platforms [
3,
4]. Calibrated colour cameras allow for direct colour measurements of the light field, as well as its spatial and angular distribution.
Proper calibration of these cameras is necessary to accomplish this. The usual calibration methods can require expensive equipment such as integration spheres, calibrated light sources, or monochromators [
5]. Having access to such equipment is outside the scope of the present study, since having access to low-cost imaging sensors also requires low-cost calibration methods. Moreover, the other calibration methods available do not properly account for factors such as the spatial distribution of the dark current [
2] or cannot be performed in laboratory conditions [
6].
In order to meet these low-cost requirements, we designed a new set of methods based on the use of standard digital colour cameras, along with very simple calibration tools such as photo tents with an integrated LED source, motorized camera mounts, and access to a natural starry sky.
In this work, we will present the proposed methods, the results of the calibration of a SONY 7s digital single-lens mirrorless (DSLM) camera, and an example application of these cameras, which will also serve to summarily confirm the validity of the calibration procedures.
2. Proposed Methods
The calibration of images produced by digital cameras requires multiple steps to independently evaluate different aspects of the sensor and optical systems’ behaviour [
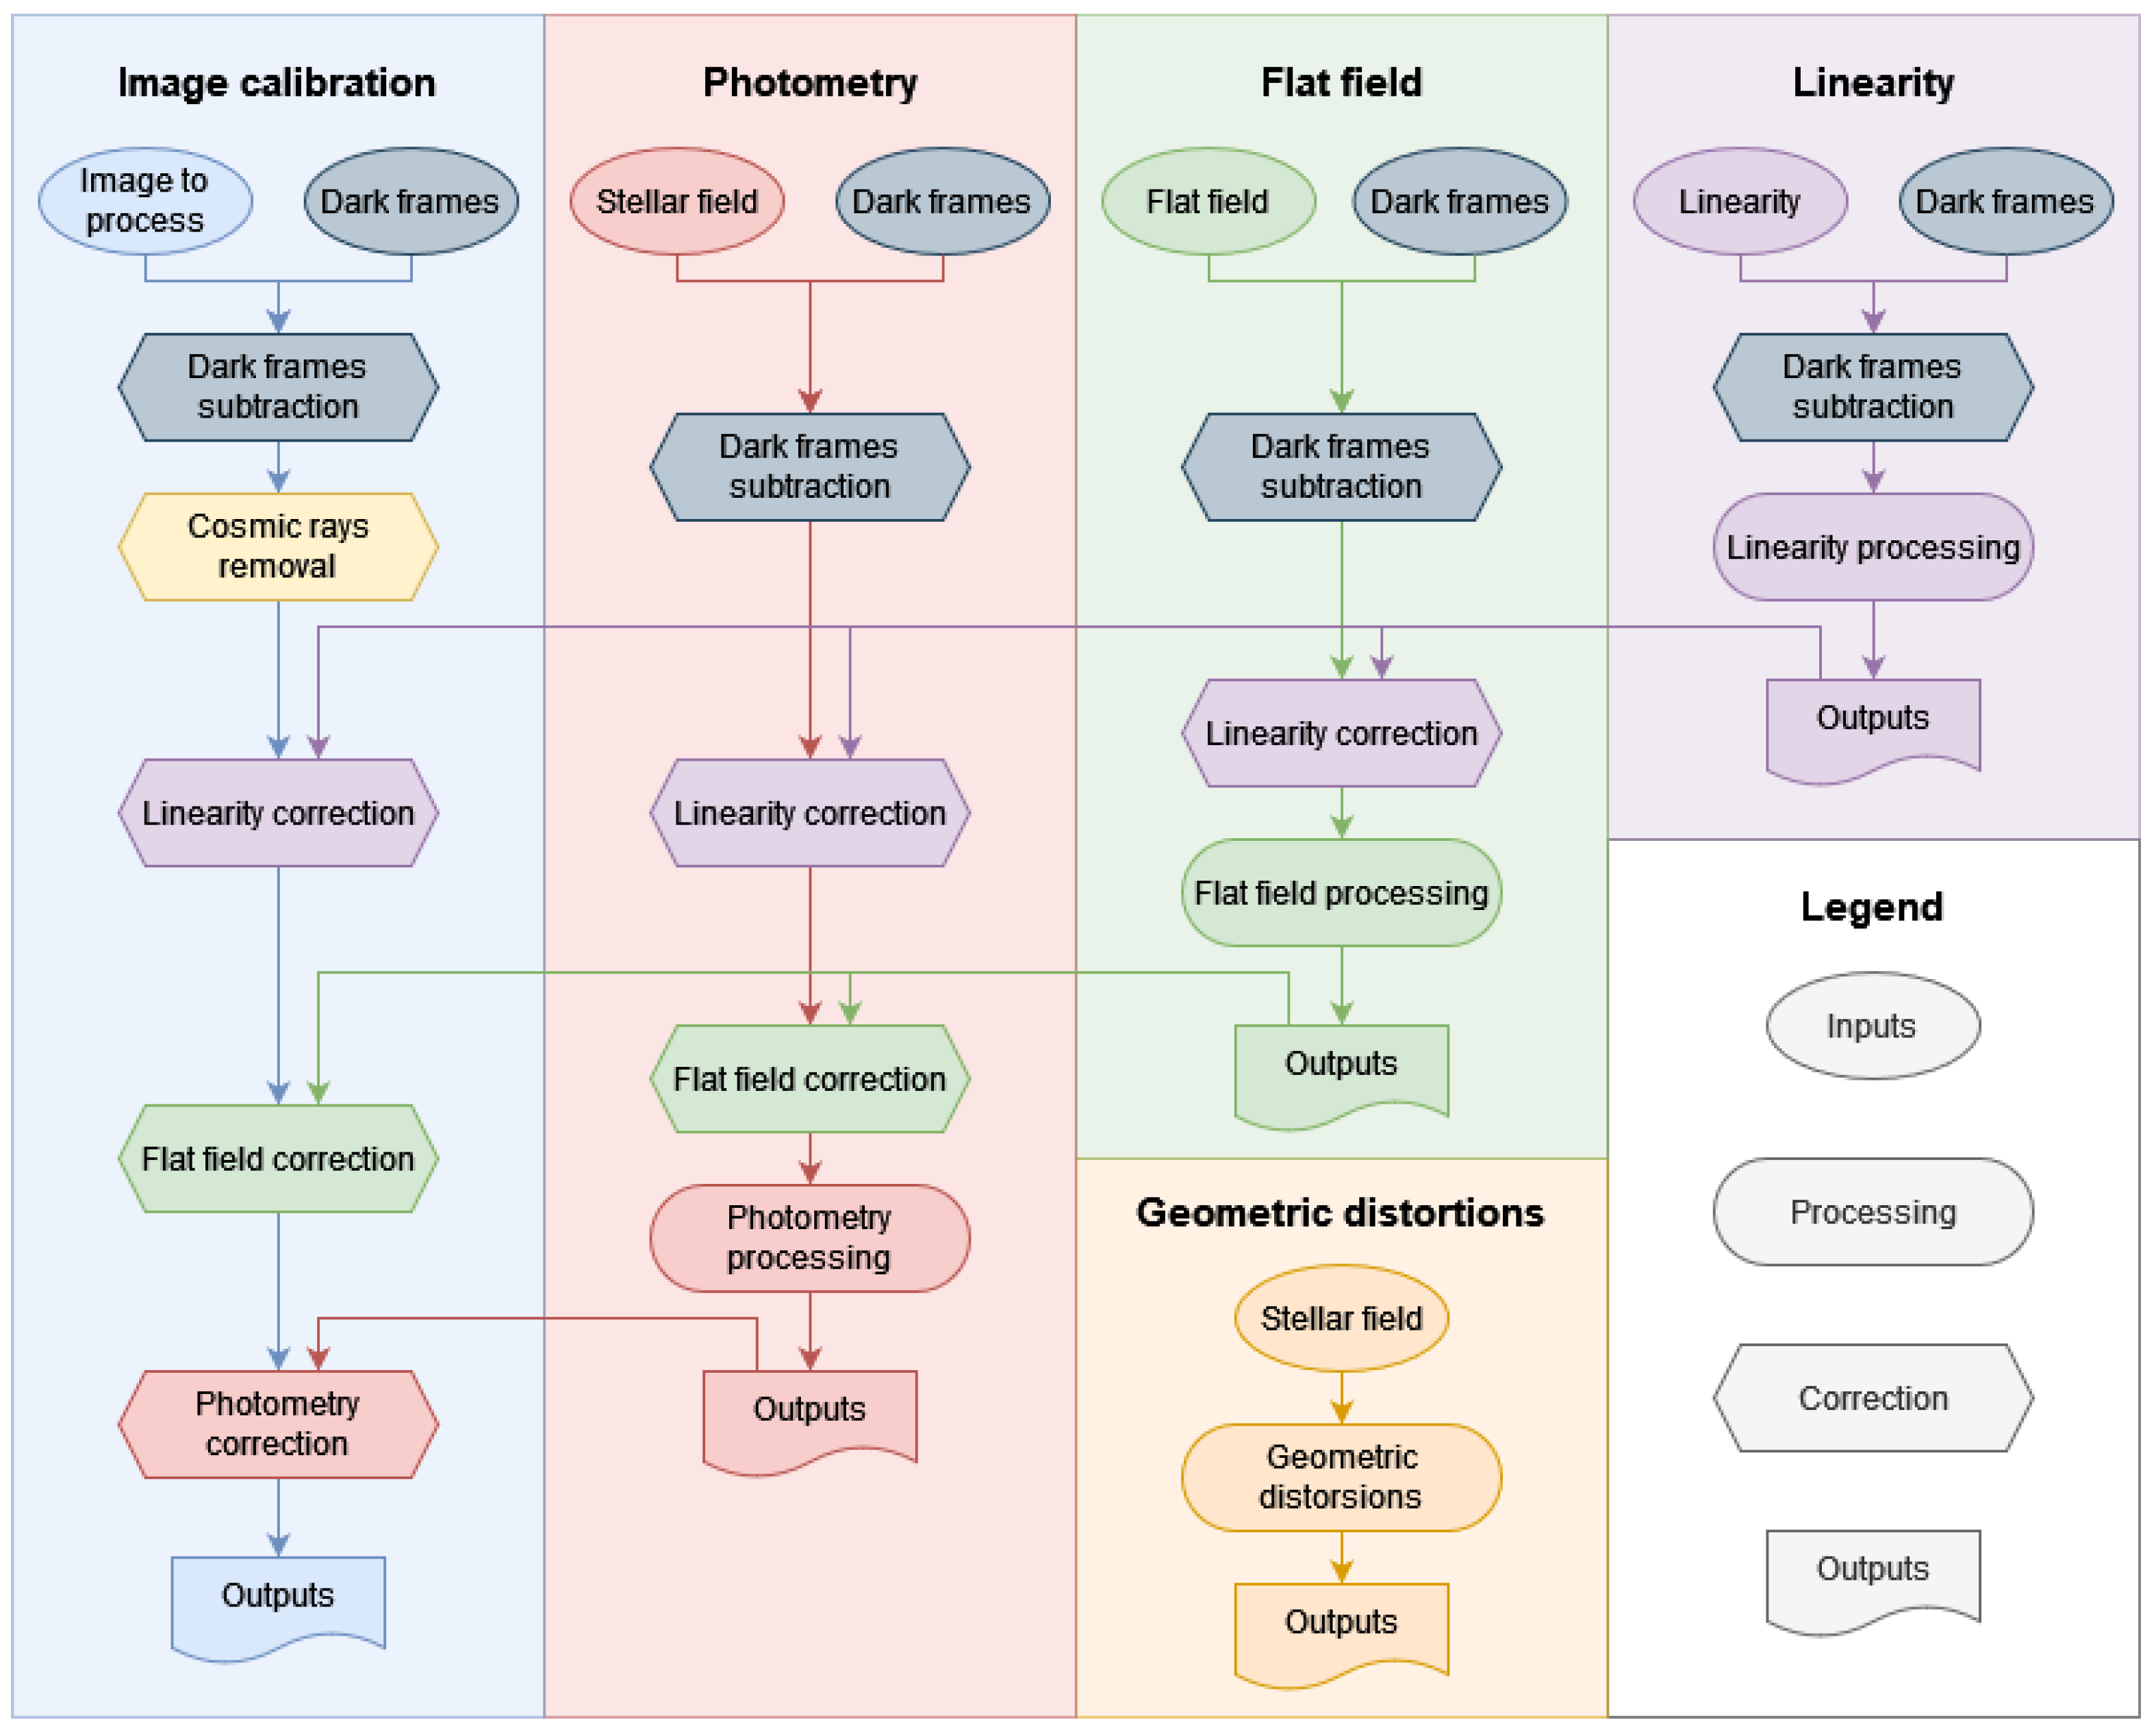
7]. Our proposed calibration procedures are performed using images acquired in laboratory conditions, as well as star field images from selected ground sites. Raw images are corrected, to account for sensor bias and thermal effects. Transient events are identified and removed. Corrections are also made, to compensate for the sensor’s non-linear response and the reduced sensitivity in the periphery of the image. The absolute sensitivity of the camera in the three colour bands, i.e., red, green, and blue (RGB), is calibrated and, finally, the images are corrected, to account for angular distortions caused by the optical system of the camera. The entire calibration pipeline for a single image is presented in
Figure 1. All steps are detailed below. In this work, this method was used on a SONY
7s DSLM camera equipped with a SAMYANG T1.5 50 mm lens VDSLR AS UMC—model SYDS50M-NEX, but the procedure is designed to be applicable to any digital camera. Further works will be conducted to demonstrate its portability to other cameras.
2.1. Sigma-Clipped Average
When averaging multiple images together to obtain a stable signal intensity, the average value and standard deviation (SD) are computed independently for every pixel of the resulting image. Pixel values that are further from the average than three times the SD are excluded, and these filtered frames are averaged again to produce the final result. This allows the filtering of transient events, such as cosmic ray events. This process is repeated for all correction steps, apart from geometric distortions, for which only the position of the stars is relevant. For stellar photometry, filtering is performed after the star radiance is extracted, because the Earth’s rotation introduces drift into the apparent star positions.
2.2. Raw Data Manipulation
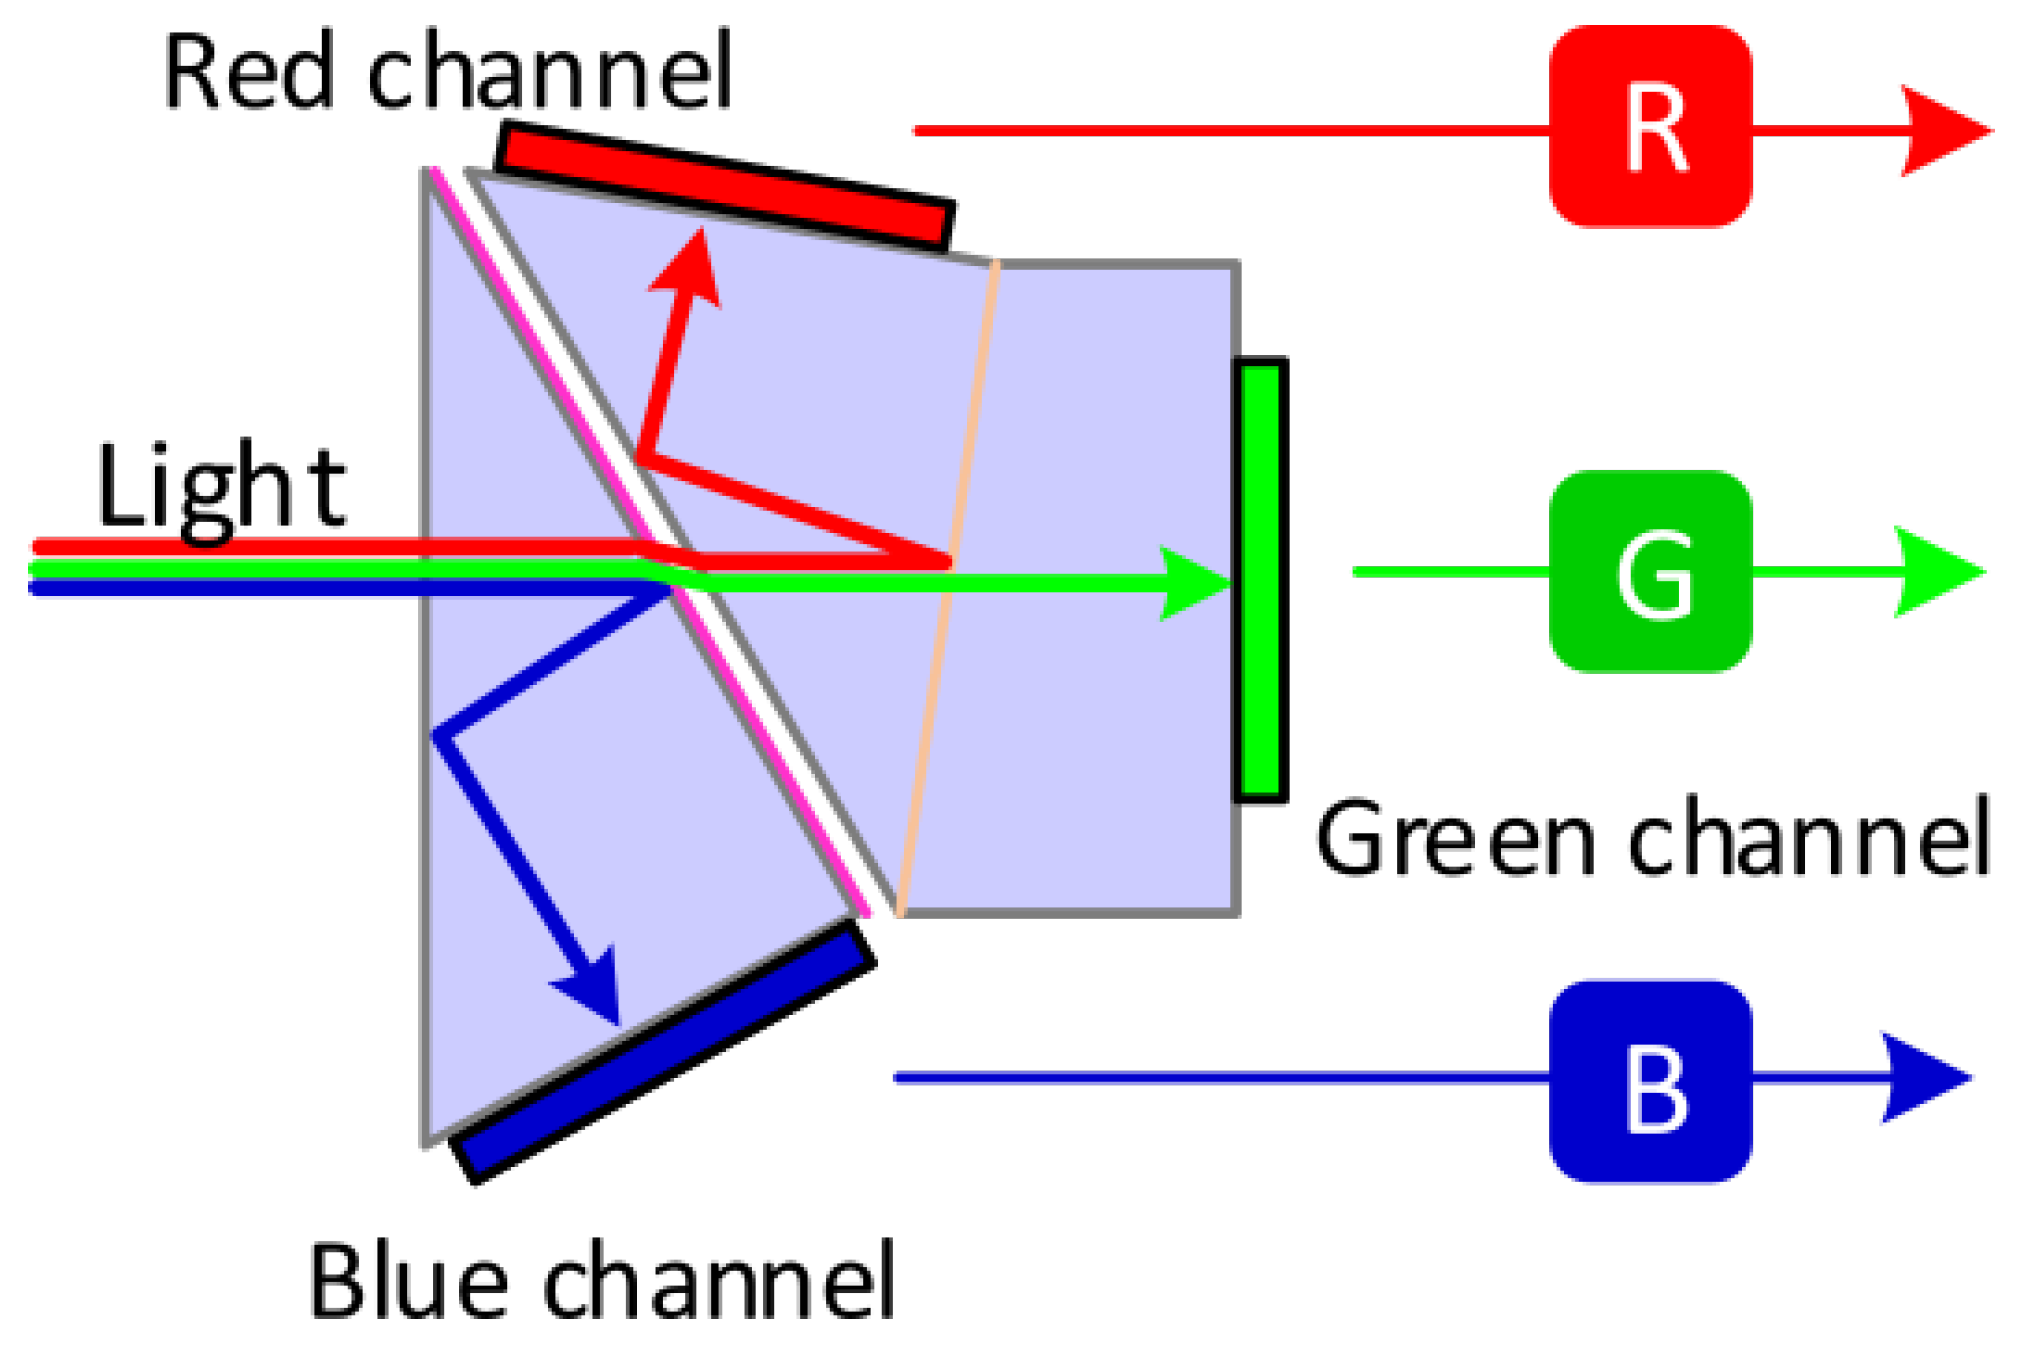
Most digital cameras can produce images in a proprietary unmodified (raw) format. This format lists the measurement obtained by the sensor, without any of the common treatments applied to produce an image matching human perception in other image formats (e.g., JPEG), such as colour balance (relative scaling of colour bands), and gamma correction (non-linear scaling of values). However, the data produced by customer-grade digital cameras not specifically designed for scientific purposes present a significant limitation when compared with a multispectral imaging sensor designed for scientific purposes. These sensors often make use of dichroic prisms to separate the colour information onto three distinct sensors [
8], as shown in
Figure 2, whereas consumer-grade digital cameras acquire a single image that contains the information for all three colour bands (RGB) of the sensor. This is achieved using coloured filters such as the Bayer filter [
9] shown in
Figure 3. This has the benefits of only requiring a single sensor, which lowers the size and cost of the device, and eliminates alignment problems. However, every coloured layer is slightly offset from the others; therefore, obtaining multiple types od colour information simultaneously for a specific viewing direction is impossible. To remedy this, many interpolation techniques have been developed over the years [
10], some of which can be very complex and use the information of all three bands to estimate the missing signal and produce aesthetically pleasing images. Nevertheless, for scientific purposes, these methods are not easily inverted to obtain the original digital values of each pixel. The simplest ones, such as linear interpolation, are only applicable when the spatial variations in radiances are at a much larger scale than the pixels. Consequently, the chosen method, therefore, consists in reducing the resolution of the images by a factor of two, so that every spectral band is directly measured by the effective pixel, at the cost of resolution.
2.3. Camera Controls
A camera must allow direct control of exposure time and digital gain (ISO) for the images produced to be used for scientific purposes. These controls are necessary for this calibration procedure.
2.4. Cosmic Ray Event Removal
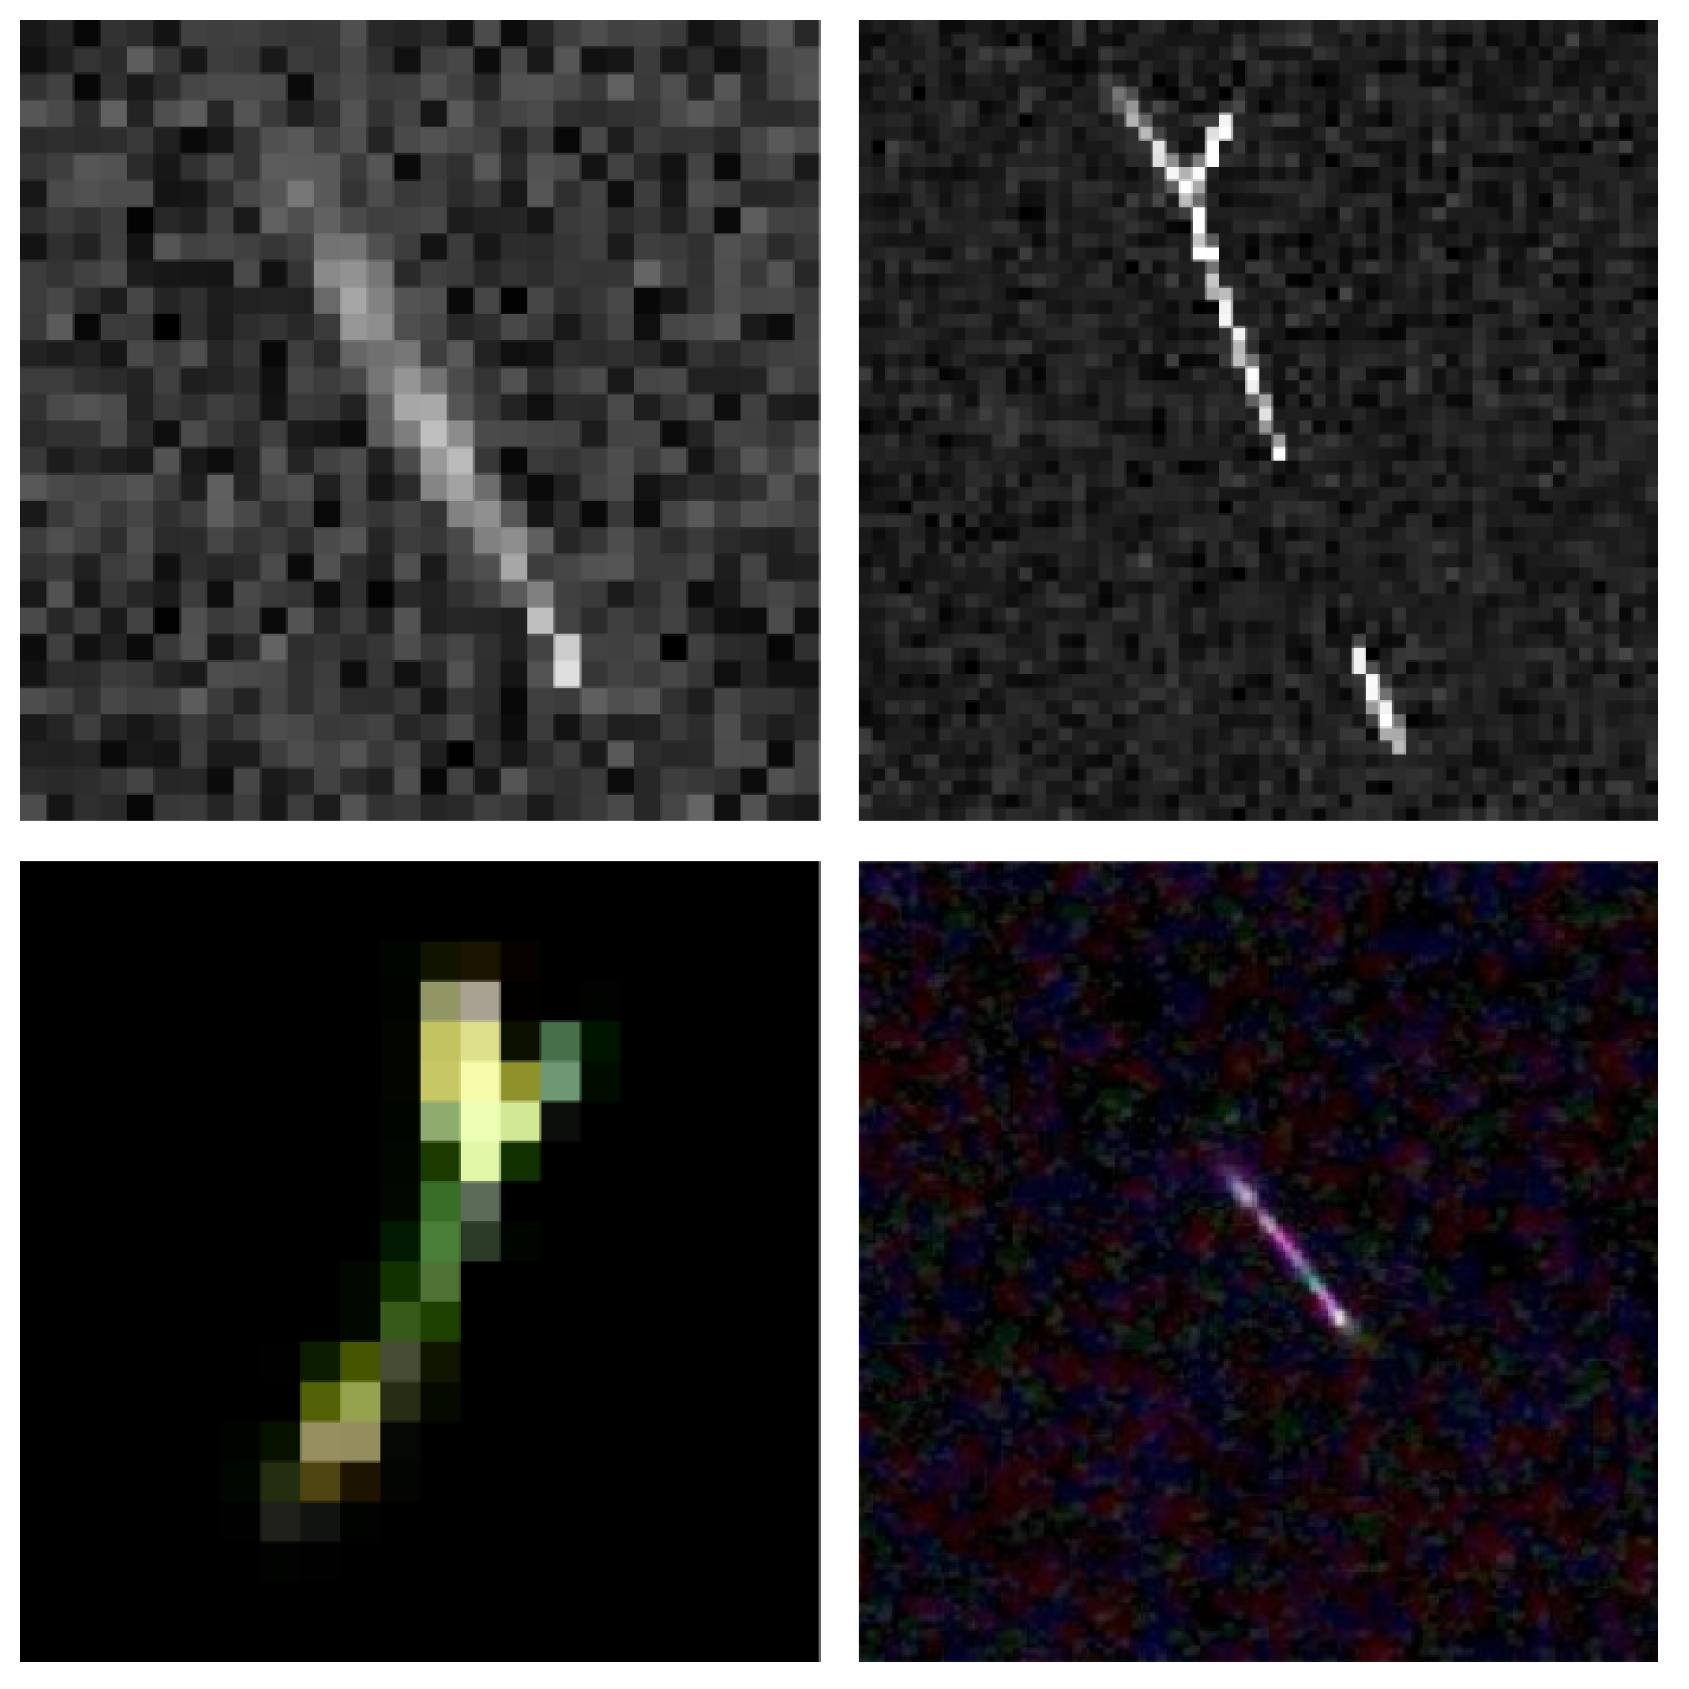
High-energy particles coming from outer space and local radioactive disintegration can interact with the imaging sensor and appear as very bright spots or lines on the image (see
Figure 4 for examples). These events are more frequent for long exposure images, due to the increased duration of possible detection, and at high altitude, due to the thinning of the protective atmosphere. As such, it is an important effect to consider, especially when dealing with airborne nighttime images. The existing algorithms can automatically detect and remove those occurrences in single-band images. For example, L.A.Cosmic [
12] uses Laplacian edge detection to identify these events. The optimized Python implementation of this algorithm (Astro-SCRAPPY [
13]) is used successively on each colour band of an image.
2.5. Dark Current Removal
One of the most common calibration procedures for any sensor is zeroing. Zeroing involves taking the values of a measurement conducted in the absence of a signal and removing it from the obtained data [
7]. This ensures that the measurements are mainly caused by what the sensor is designed to detect, rather than other interferences or occurrences. In imaging systems, the temperature of the sensor can create visible patterns in dark images, called dark currents [
15]. This is caused by thermal energy being mistaken for photons hitting the sensor. Moreover, most sensors are biased, such that they measure a non-zero value, even in the absence of incoming signals. These effects are measured by taking images with the lens covered, in order to prevent any incoming light originating from outside the apparatus from reaching the sensor. These images must be taken in the same conditions (primarily ambient temperature) and with the same settings (exposure time and ISO) as the ones we want to calibrate. As these effects are random in nature, the exact value of the dark frame will fluctuate slightly over time. Multiple images are averaged, to reduce the effect of this stochastic noise. Pixel values that are more than a set number of SDs from the mean for that specific pixel are excluded, to remove outliers such as cosmic ray events.
2.6. Non-Linear Photometric Response Correction
The output signal of all sensors is subject to non-linearity relative to the luminous input signal.This non-linear response needs to be measured and corrected. In order to do so, a series of images of a uniformly lit surface of constant illuminance are taken at varying exposure times. The variation in exposure time is directly proportional to the total energy that reaches the sensor and can therefore be used, as long as the precise period of time the shutter is open is known. As this process is ISO-dependent, it must be performed for every ISO value used.
2.7. Flat Field Correction
Many effects can cause local darkening in captured images. One of the common ones in photography is vignetting, a decrease in sensitivity in the periphery of an image. This is inherent to the optics of cameras, since the light hitting the periphery of the sensor does so at a greater angle [
16]. The presence of dust or debris on the lens and the sensor apparatus can also cause local reductions in sensitivity. To evaluate these effects, images of a uniformly lit surface, called a flat field, are taken. These images must be taken with the same aperture and focus as for the images that we want to calibrate. Those can then be divided by this flat field, to compensate for the reduced sensitivity. Another reason to perform a flat field calibration is to calibrate the pixel-to-pixel variation in sensitivity of the device that can be inherent to the sensor. This is carried out on linearity-corrected images.
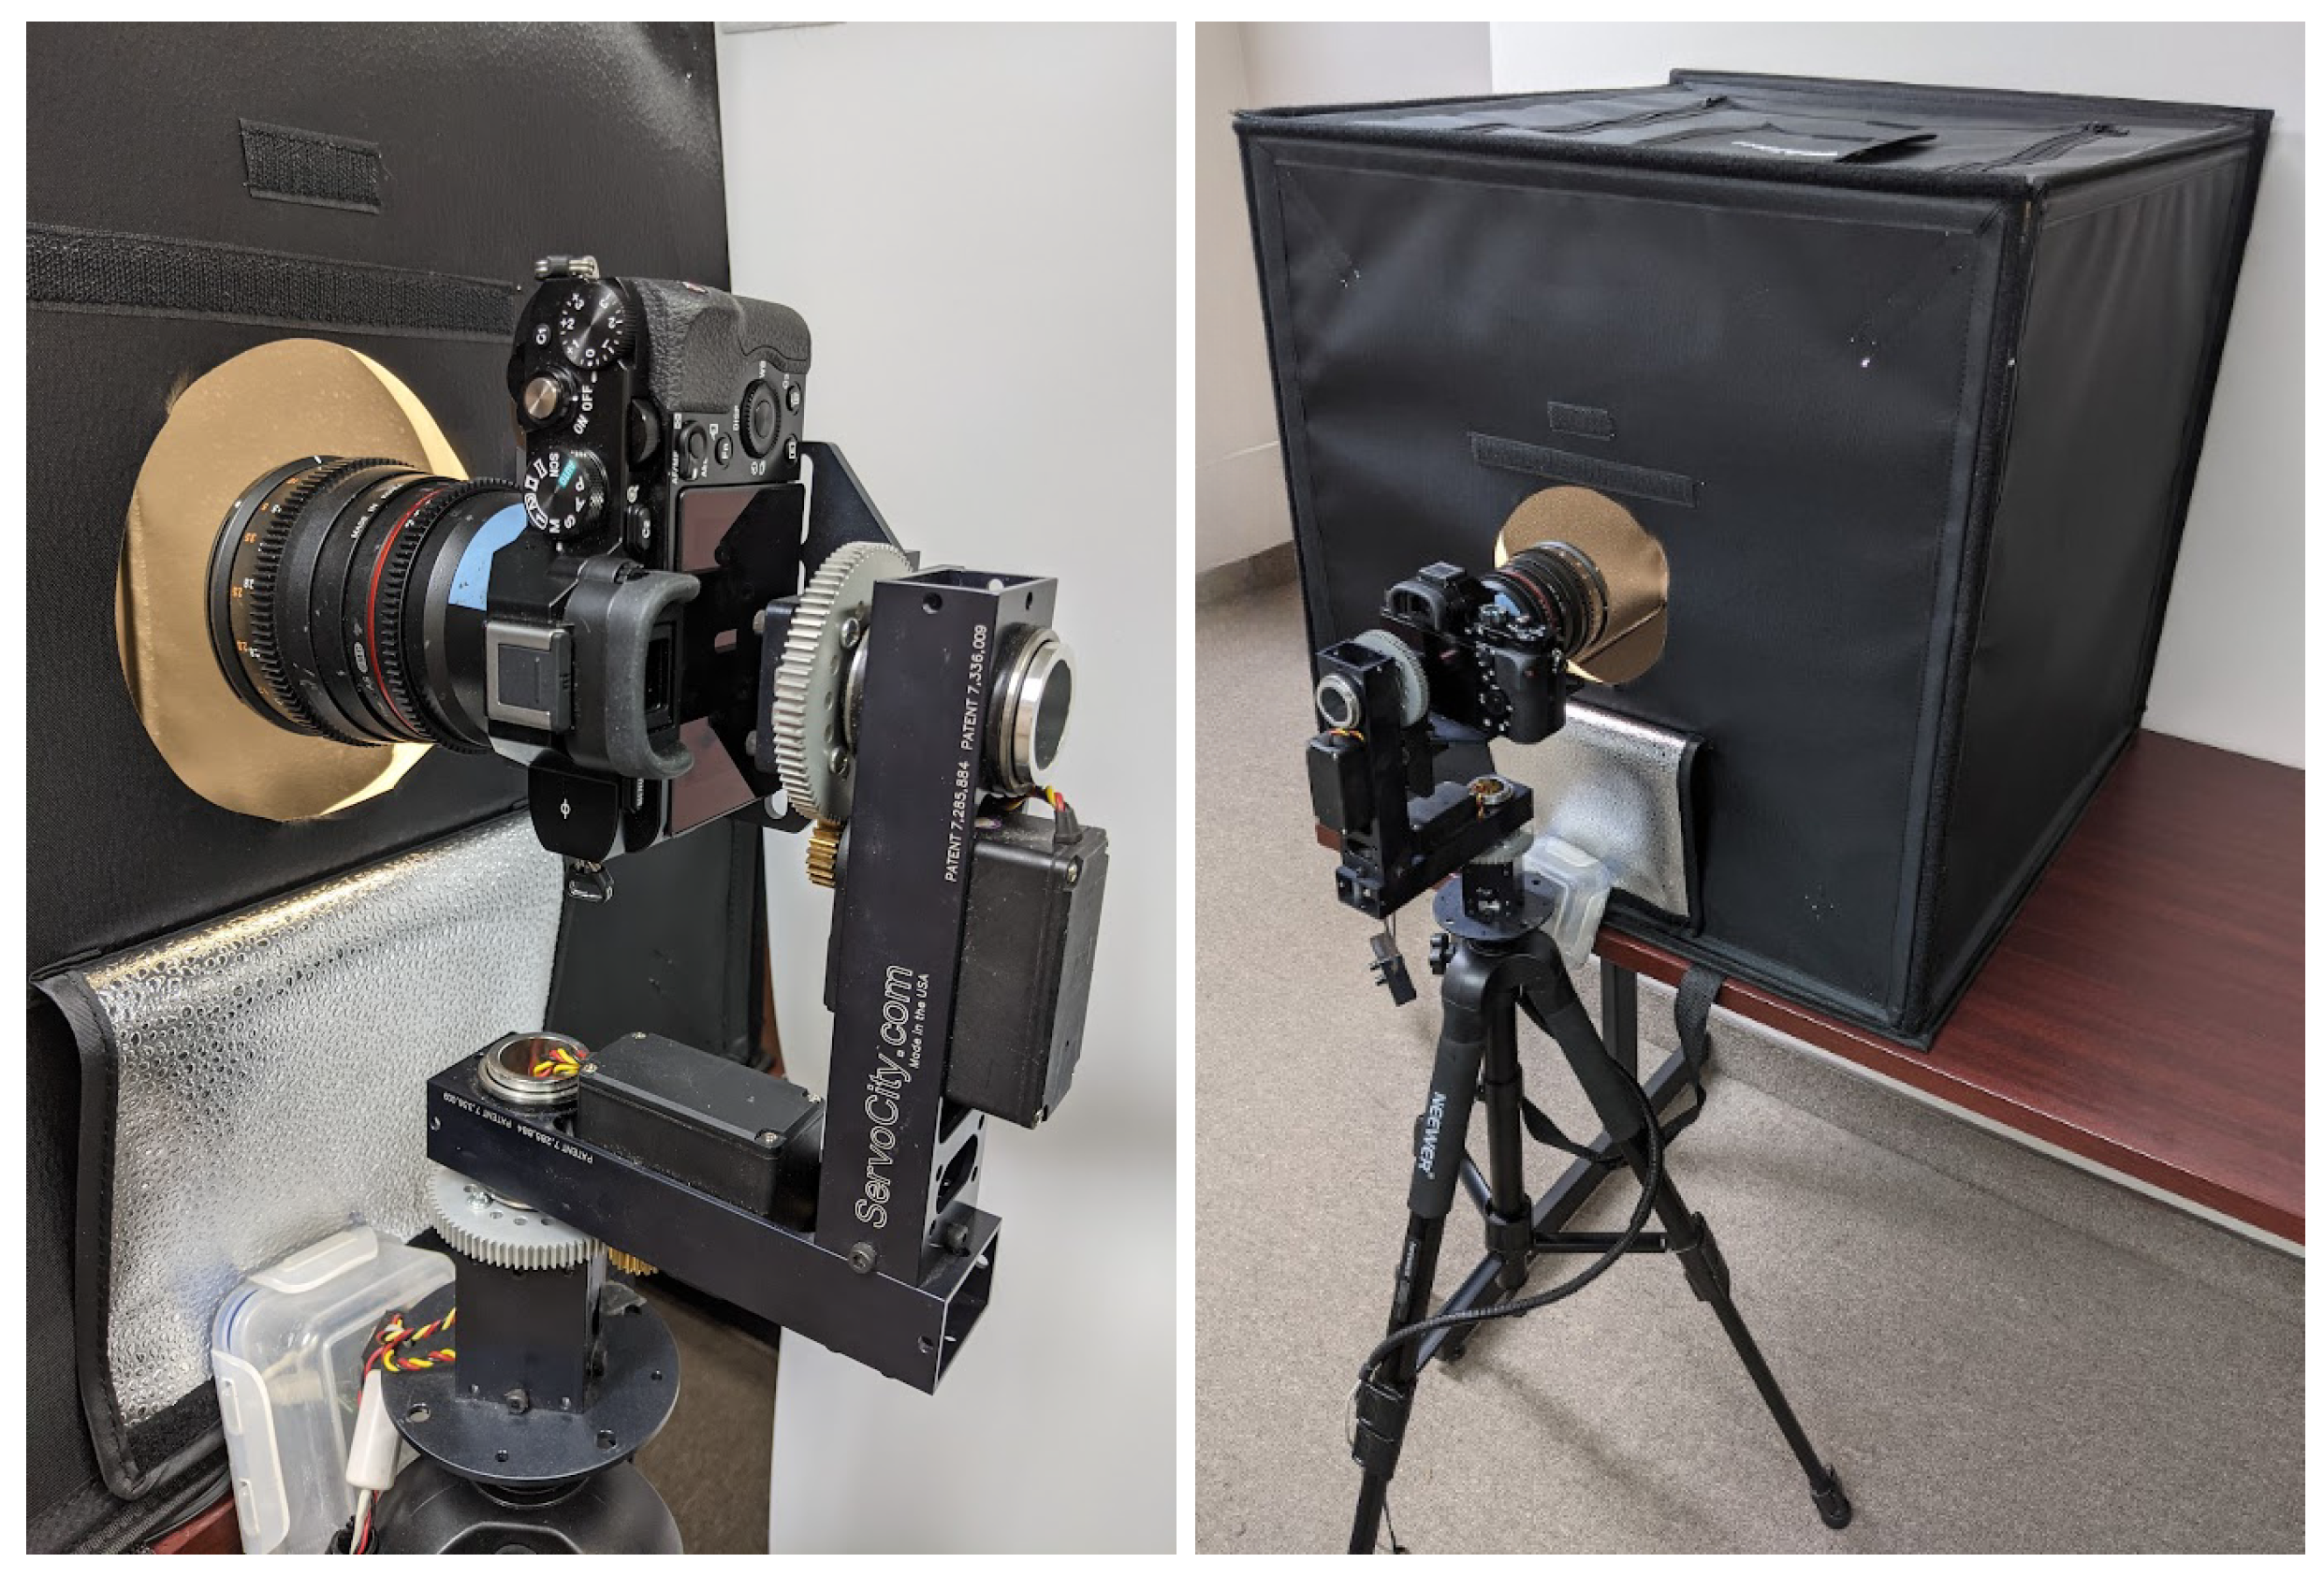
However, the uniformity of the lit surface will directly affect the quality of the calibration. Moreover, such a surface needs to potentially cover a wide field of view, in the case of fish-eye lens systems. Large integrating spheres can be used for this purpose, but the availability of such devices large enough for digital cameras is limited. We, therefore, propose a way to improve the quality of a flat surface and widen its coverage by using a computer controlled motorized mount and taking multiple images of the surface with different camera orientations (See
Figure 5). Orientations are selected to be equidistant on a sphere [
17], in order to uniformly sample the field of view of the sensor. A dark is subtracted from every frame, as described in
Section 2.5, which are then corrected for linearity. The centre of the surface can then be extracted from every frame and averaged together to simulate a flat field that is as uniform and as wide as needed.
2.8. Photometric Calibration in the Three Colour Bands
To link the values measured by the sensor to real-world irradiances, images of a source of known irradiance were taken. Moreover, the spectral irradiance of the chosen reference source had to be known, to account for the spectral sensitivity of the sensor. Stars can be used as a reference, as long as one can correct for atmospheric effects.
To select a star appropriate for calibration purposes, one must select one from the list of stars whose spectral emission is well known, such as the ones from Cardiel et al., 2021 [
18]. Moreover, one must select a bright star that does not have a variable luminosity (unlike Polaris [
19]). It should also be near the zenith, to limit the effects of a non-homogeneous atmosphere and be somewhat isolated from other bright stars.
When taking star field images, the camera focus needs to be adjusted so that the stars appear artificially enlarged. This may seem counter-intuitive, but it is necessary, to ensure accurate stellar irradiance readings. Due to the Bayer filter presented previously, a well-focused star on the focal plane is mostly detected in a single pixel, and as such its radiance is only measured in a single colour band (see
Figure 6). Increasing the apparent size of the star creates an optical blur large enough to reduce the radial variation to a scale much larger than that of a pixel. This satisfies the relative uniformity condition described in
Section 2.2, in order to encompass all three types of RGB pixel in an approximately equal photometric fashion.
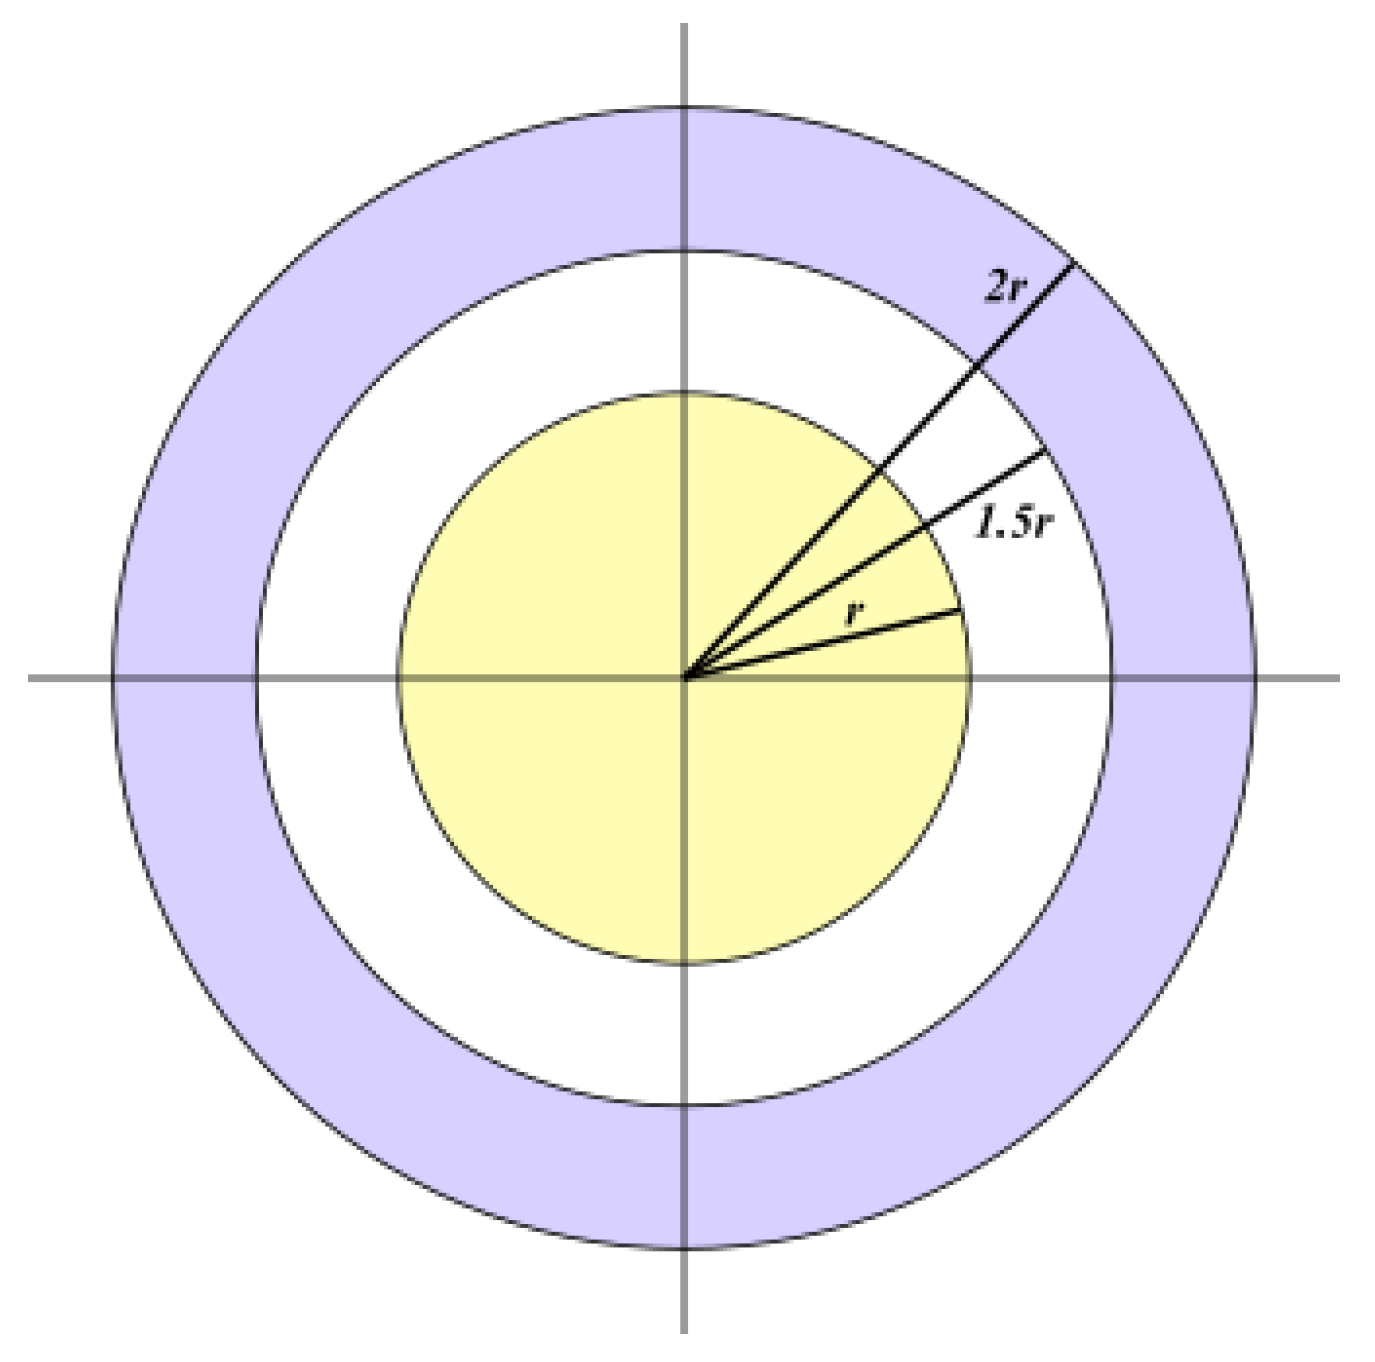
The radiance of the star is extracted from the images by integrating over a circular disc. To remove the natural (moon, celestial bodies, airglow, etc.) and artificial (light pollution) sky background from the measurements, the integral of an annulus around the star is subtracted from the integrated stellar radiance, weighted using the relative surface area of the two surfaces (count ratio of the considered pixels) [
20] (See
Figure 7).
The effect of atmosphere extinction needs to be accounted for in the measurements. There are two components to the atmosphere’s transmittance: aerosols and molecules. According to [
21], the vertical molecular transmittance
can be estimated with a relatively small error as
where
p is the atmospheric pressure in kPa and
the light’s wavelength in μm. The vertical aerosol transmittance
can be approximated using a first order expression [
22] as
where
is the vertical aerosol optical depth and
the Ångstrom coefficient. Both values are continuously measured all over the world by the Aerosol Robotic Network (AERONET) [
23].
However, pressure and aerosol measurements are not necessarily taken at the same altitude as the star field images, and air pressure measurements are given corrected at sea-level. Moreover, stars are rarely exactly at their zenith. As such, it is important to correct these differences in optical path. According to Equation (
3) of [
24], the transmittance of the atmosphere from an altitude
z above sea level through the total atmosphere is given by
where
is the vertical transmittance of the total atmosphere from sea level,
is the zenith angle of the optical path, and
H is the scale height (with typical values of
km for molecules and
km for aerosols). It is important to note that this equation is limited to horizontally homogeneous conditions [
25]. As such, the vertical aerosol transmittance from sea level through the total atmosphere
is obtained as
with
being the altitude of the closest AERONET station. As air pressure measurements are given at sea-level, the total vertical molecular transmittance is simply
. Molecular and aerosol transmittance for starlight
is then obtained with
with
being the altitude of the stellar radiance measurement. The signal that passes through the atmosphere is then multiplied by both
and
, to correct for the extinction.
2.9. Geometric Distortion Removal
In imaging systems, the lens projects light that comes into it onto a flat sensor surface. This projection is typically one of two kinds; equirectangular, the most common, where straight lines appear straight; and equiangular, also known as fisheye, where the angular distances between objects are preserved. However, actual lens systems cannot perfectly reproduce these projections, and as such the geometric distortions of the lens system must be characterized. To do so, an image of objects of known positions must be taken. Here again, the stars provide a suitable subject, as their true positions in the sky have been catalogued since Hipparchus, over two thousand years ago [
26]. Any star field can be used, as long as the stars can be identified. This identification can be done manually or using of astrometry software [
27].
Before comparing the apparent and real positions of the objects, one must convert the image coordinates into a set of estimated angular coordinates. One way of performing this conversion is to assume an ideal thin lens. While this conversion will not be accurate, it can later be improved by finding a transformation function based on the real and apparent position of the stars in the angular coordinate system.
For an ideal thin lens, it can be shown that
where
d is the physical distance of the image of the star on the sensor from its centre,
x and
y are the coordinates of the star measured from the centre of the image,
is the angle of the object from the principal axis of the lens,
is the physical size of a pixel on the sensor, and
f is the focal length of the lens.
Afterwards, the stellar coordinates can be transformed by rotating the stellar sphere to align the field with the axis and orientation of the camera using Rodrigues’ rotation formula [
28], where the vector
is obtained by rotation of a vector
around an axis
by an angle
, such that
The rotation angle and axis are found using the numeric solvers of the SciPy Python library [
29]. Then, a fourth-order polynomial equation is fitted, to find the correspondence between the two coordinate systems.
3. Calibration Results
We present the results of the different steps of the calibration procedure for the specific case of an 7s DSLM camera equipped with a SAMYANG T1.5 50 mm lens. We also compare the calibration with a StellarNet BLACK-Comet UV-VIS spectrometer.
3.1. Dark Current Removal
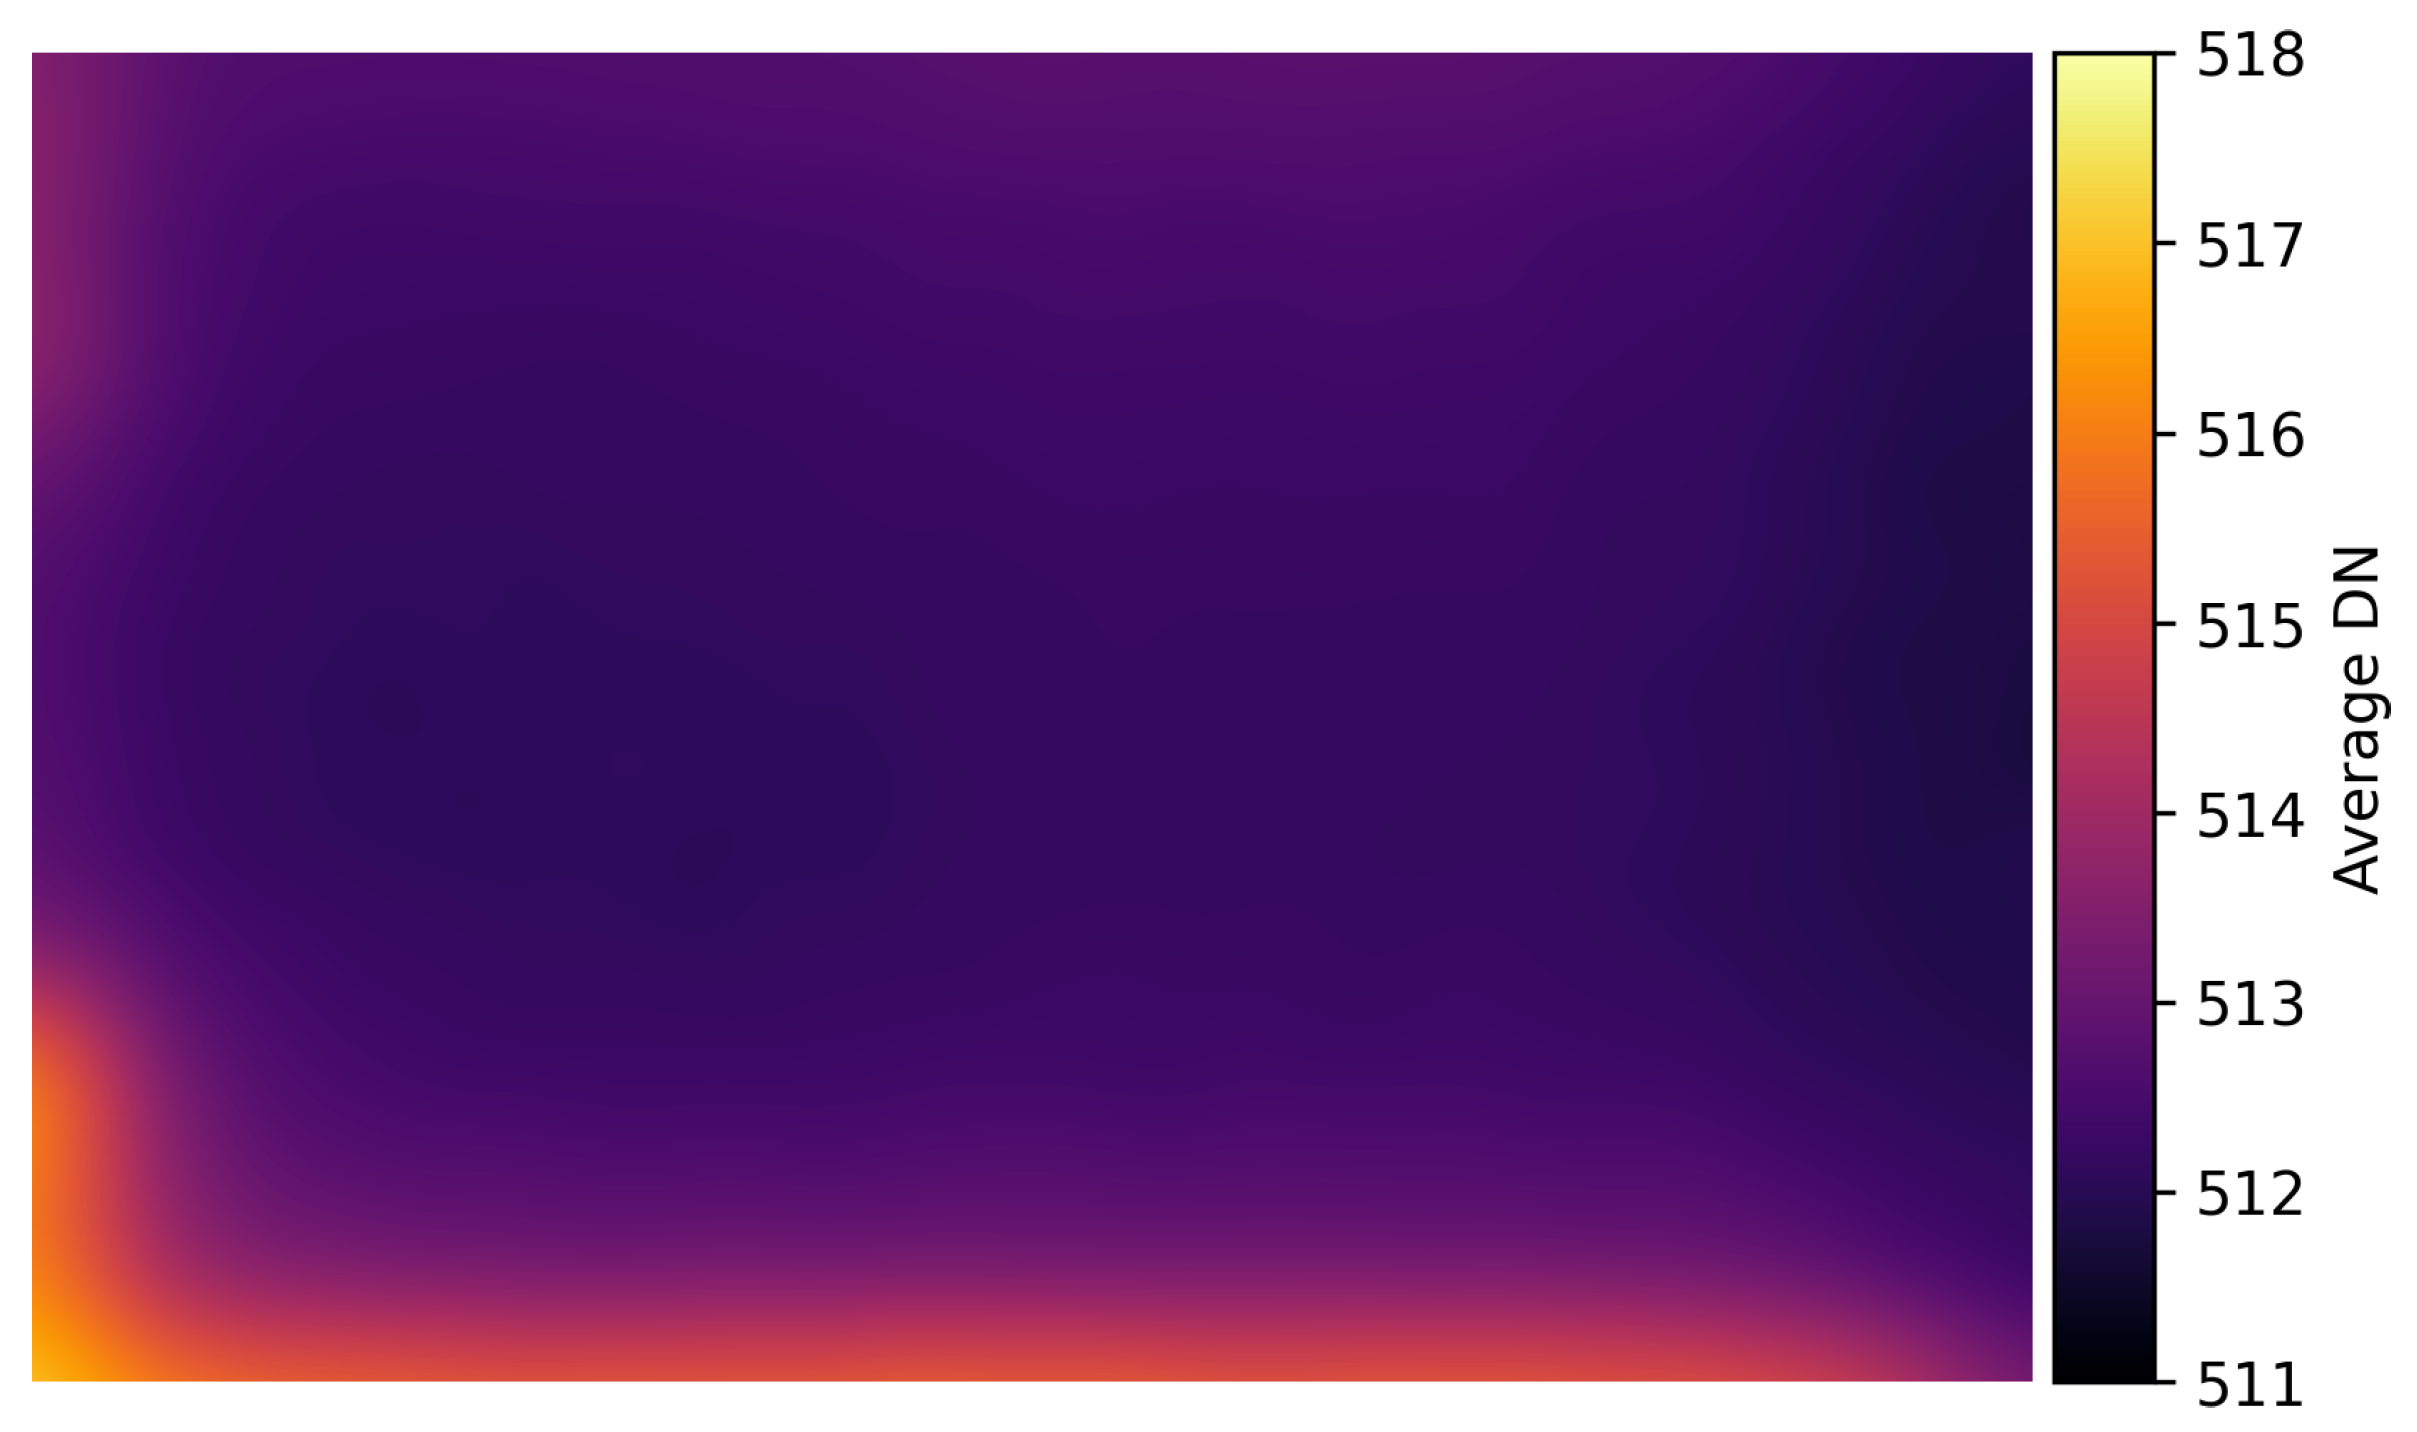
As can be seen in
Figure 8, some background signal is present everywhere in the image. This is due to the internal bias of the sensor, which produces values at about 1/32 of the saturation value. Moreover, we can see a significant effect in the lower and left parts of the image. This signal was probably caused by thermal effects.
3.2. Non-Linear Photometric Response Correction
A series of images were taken at ISO 6400, for exposure times ranging from 1/8000 s to 1/5 s. At each exposure, the clipped average (refer to
Section 2.1) of 10 frames was corrected using a dark frame of corresponding exposure time. Transient events such as cosmic rays were removed using the clipped average, and as such it was not necessary to correct for them explicitly. The average intensity for the centre (
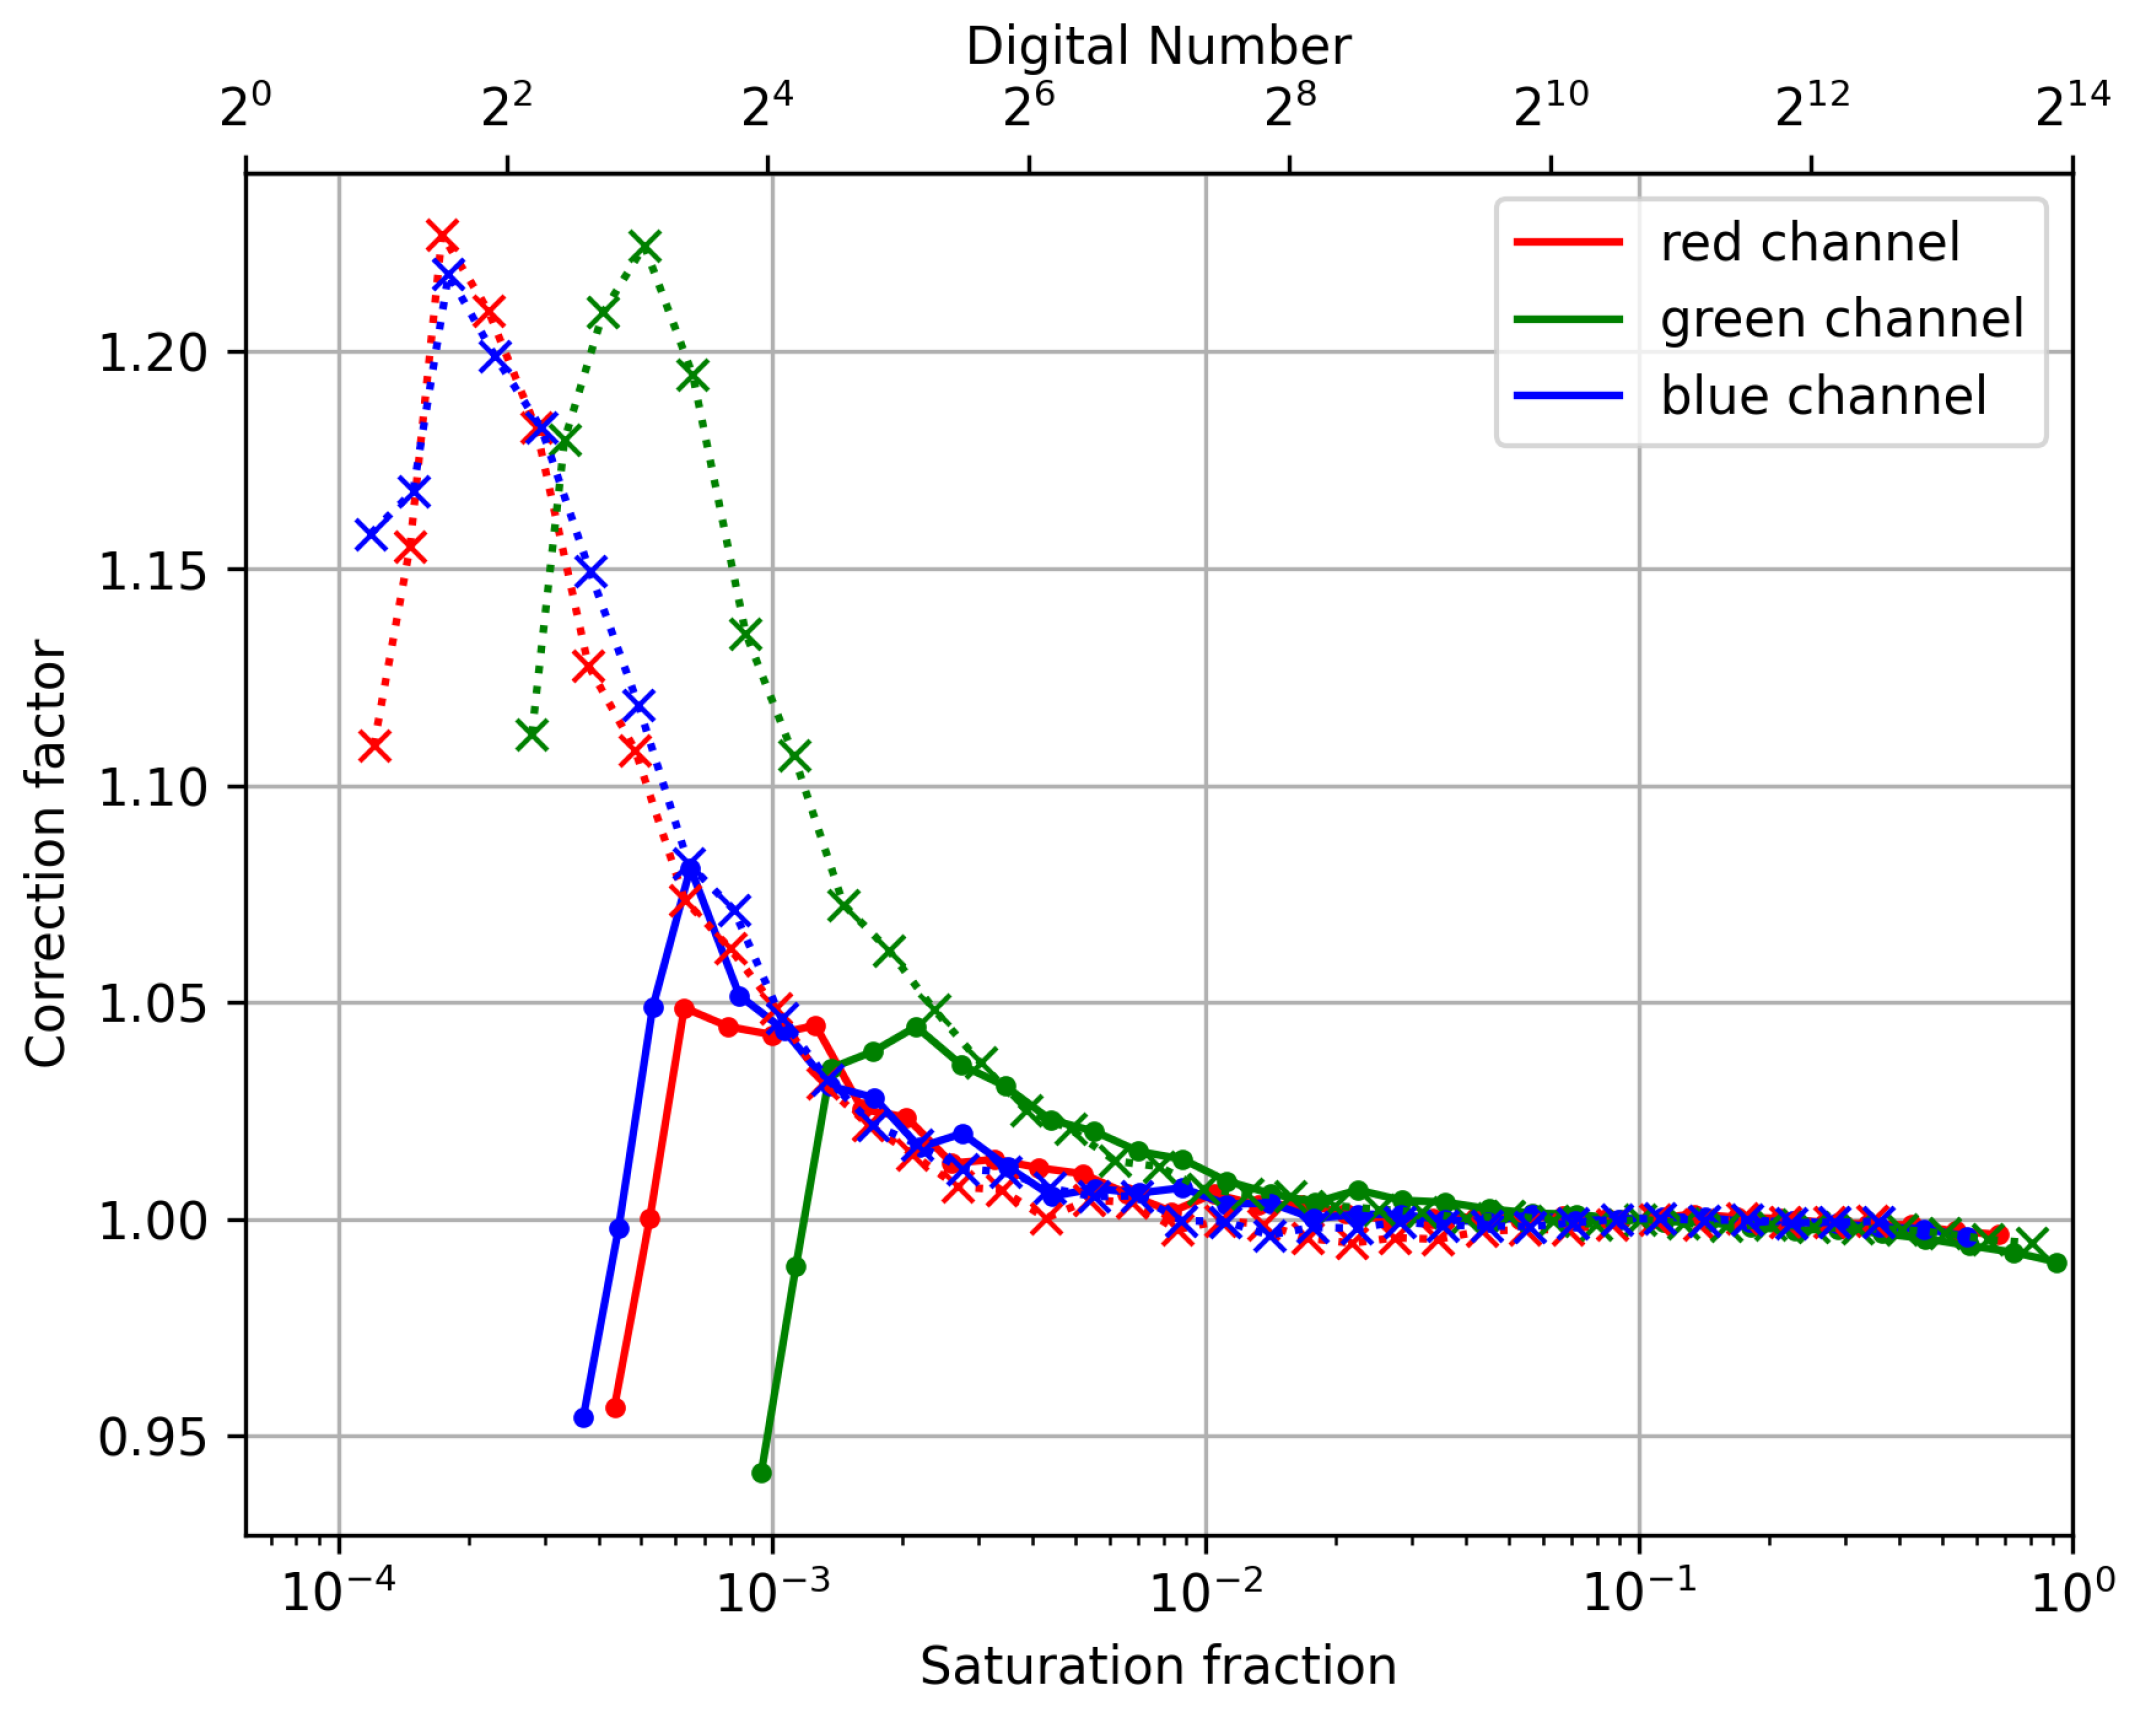
pixels) of the frame was then extracted from each band. The corrected factor was computed by dividing a linear response normalized at 1/20 s by the measured values. The resulting corrections are shown in
Figure 9. The linearity response was dependent on the intensity of the measured signal, but for this camera, a systematic effect was seen for the shortest exposure times (<250 µs). Using these very short exposures was, therefore, not recommendable, and they were excluded from the analysis.This might be have been caused by a systematic error in the computation of the exposure time by the camera. The response of other sensing apparatus should be compared with these results, to determine if this effect is widespread.
3.3. Flat Field Correction
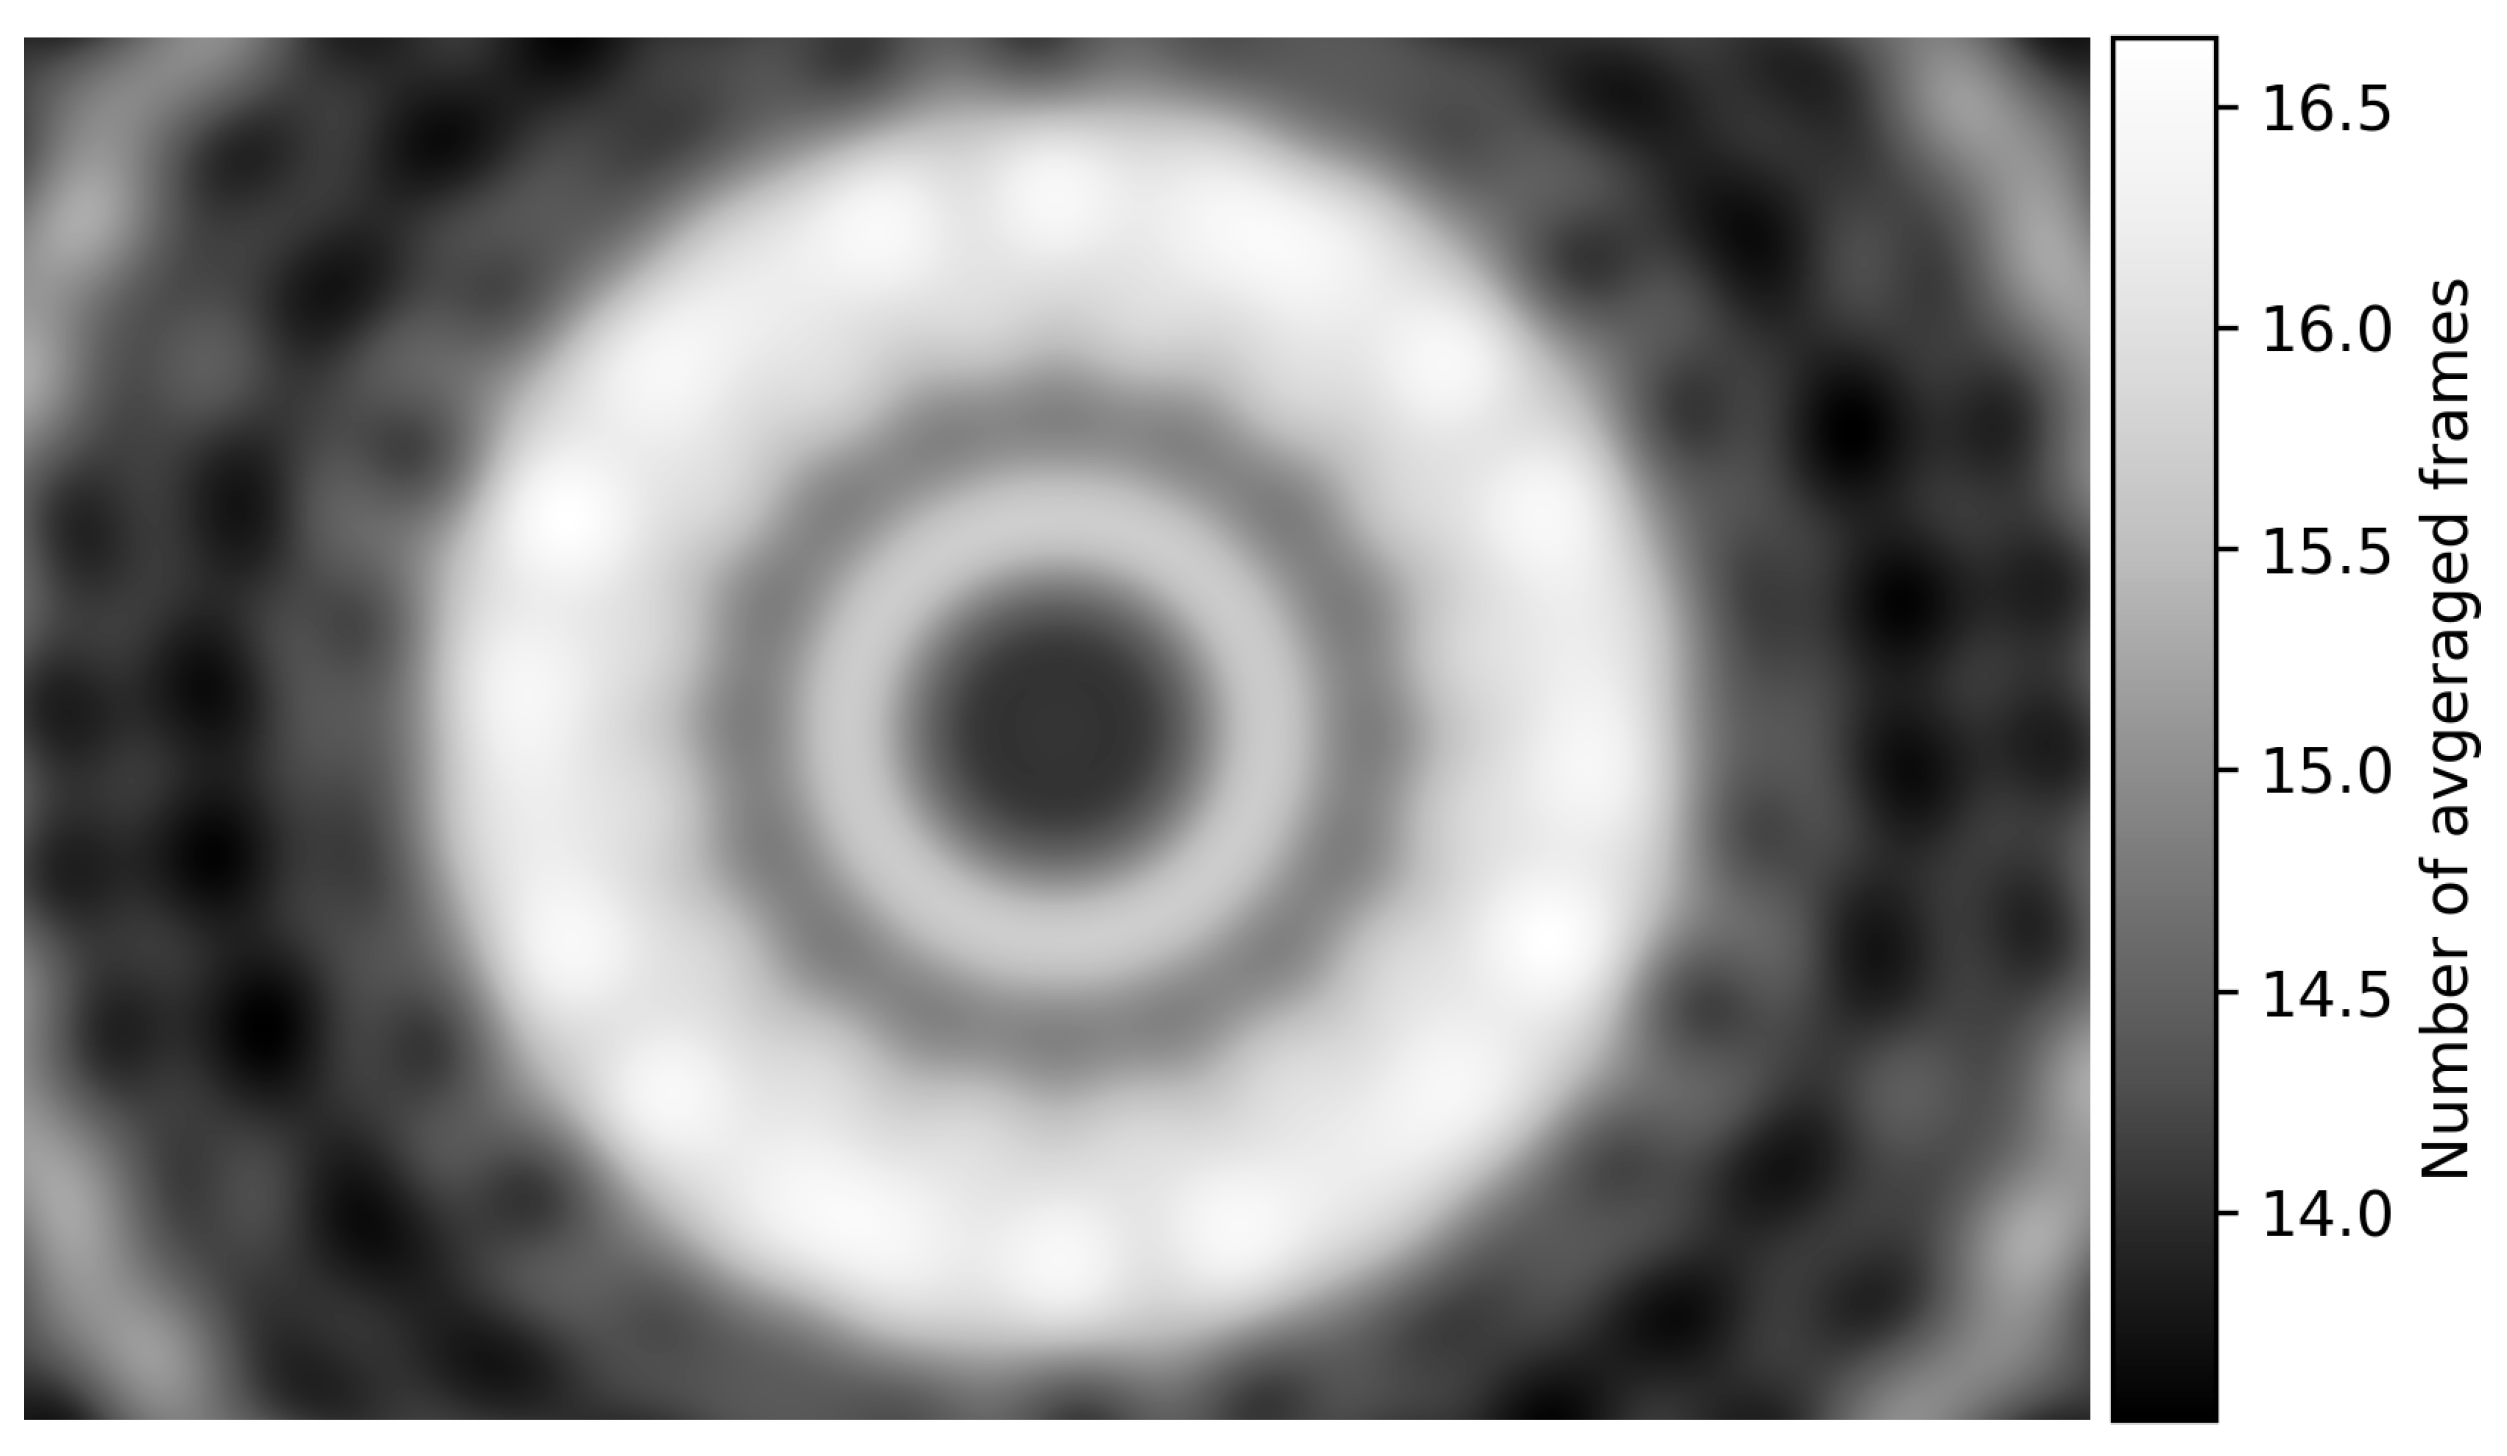
A total of 505 images were taken to produce the flat field for our camera. These frames were averaged together using a weighted average that assigned a weight of 1 in the centre of the tent and decreased gradually to 0. The total weight of each pixel (which can be interpreted as the number of averaged frames) is shown in
Figure 10, with the resulting flat field shown in
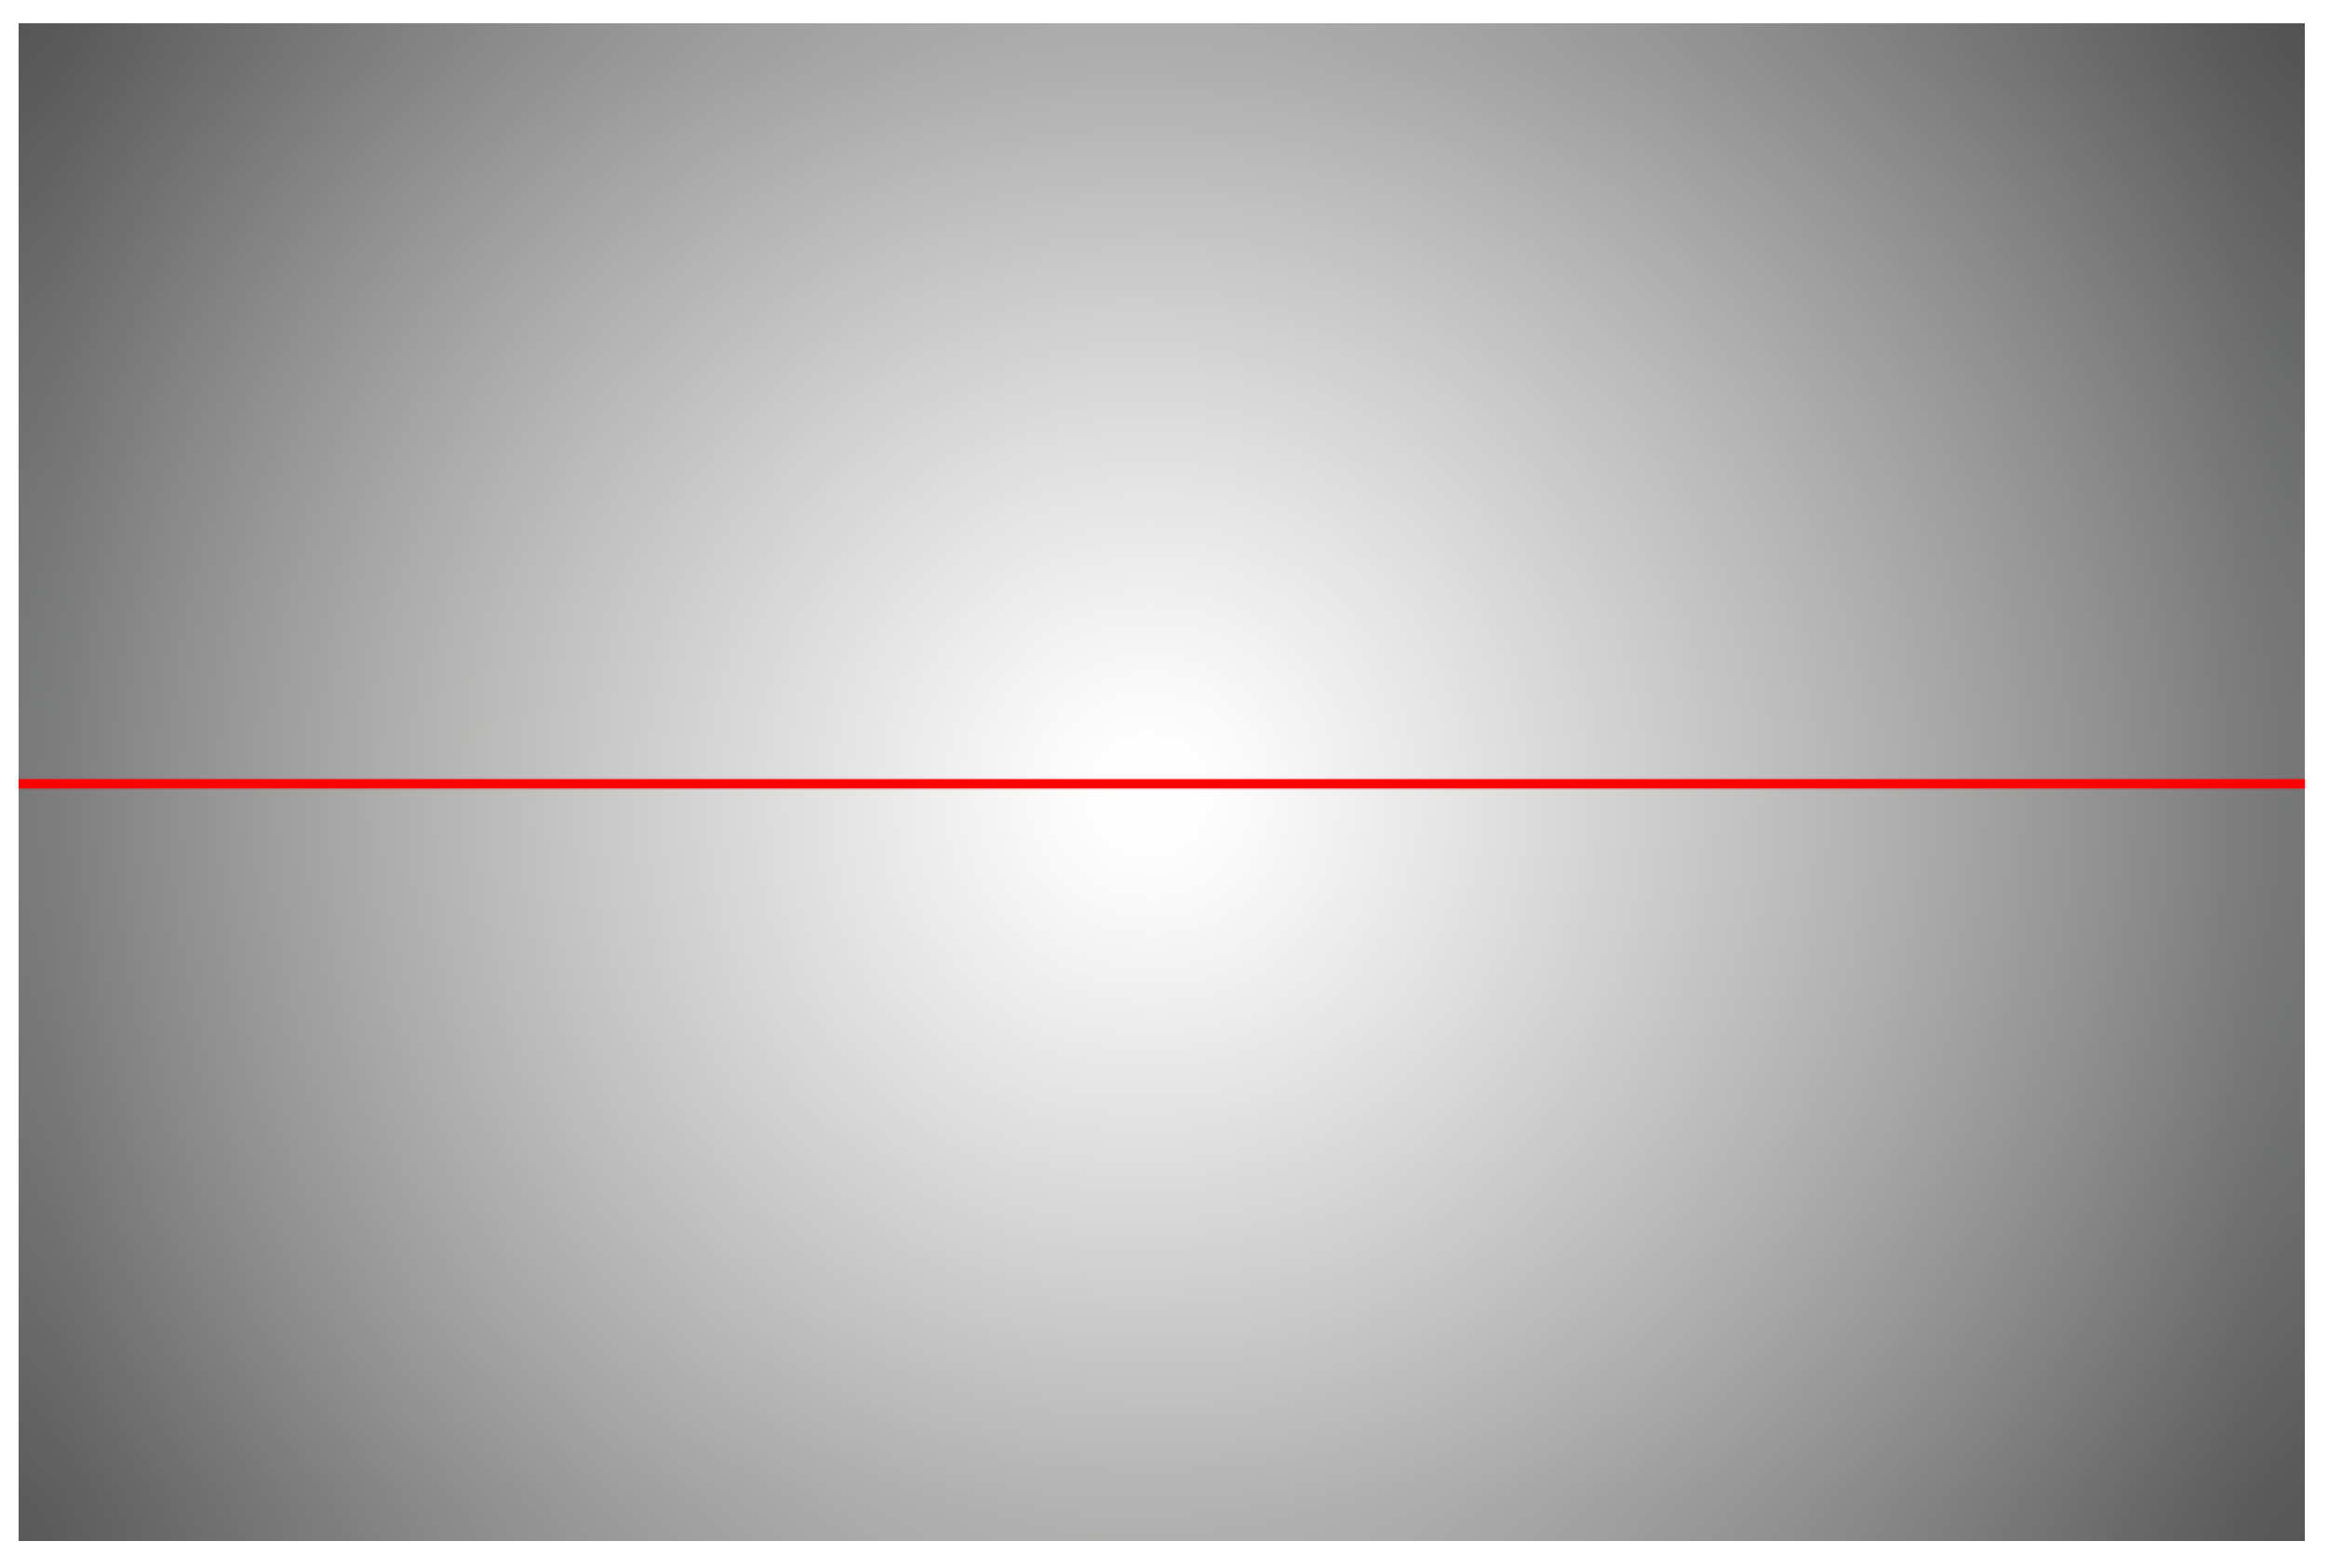
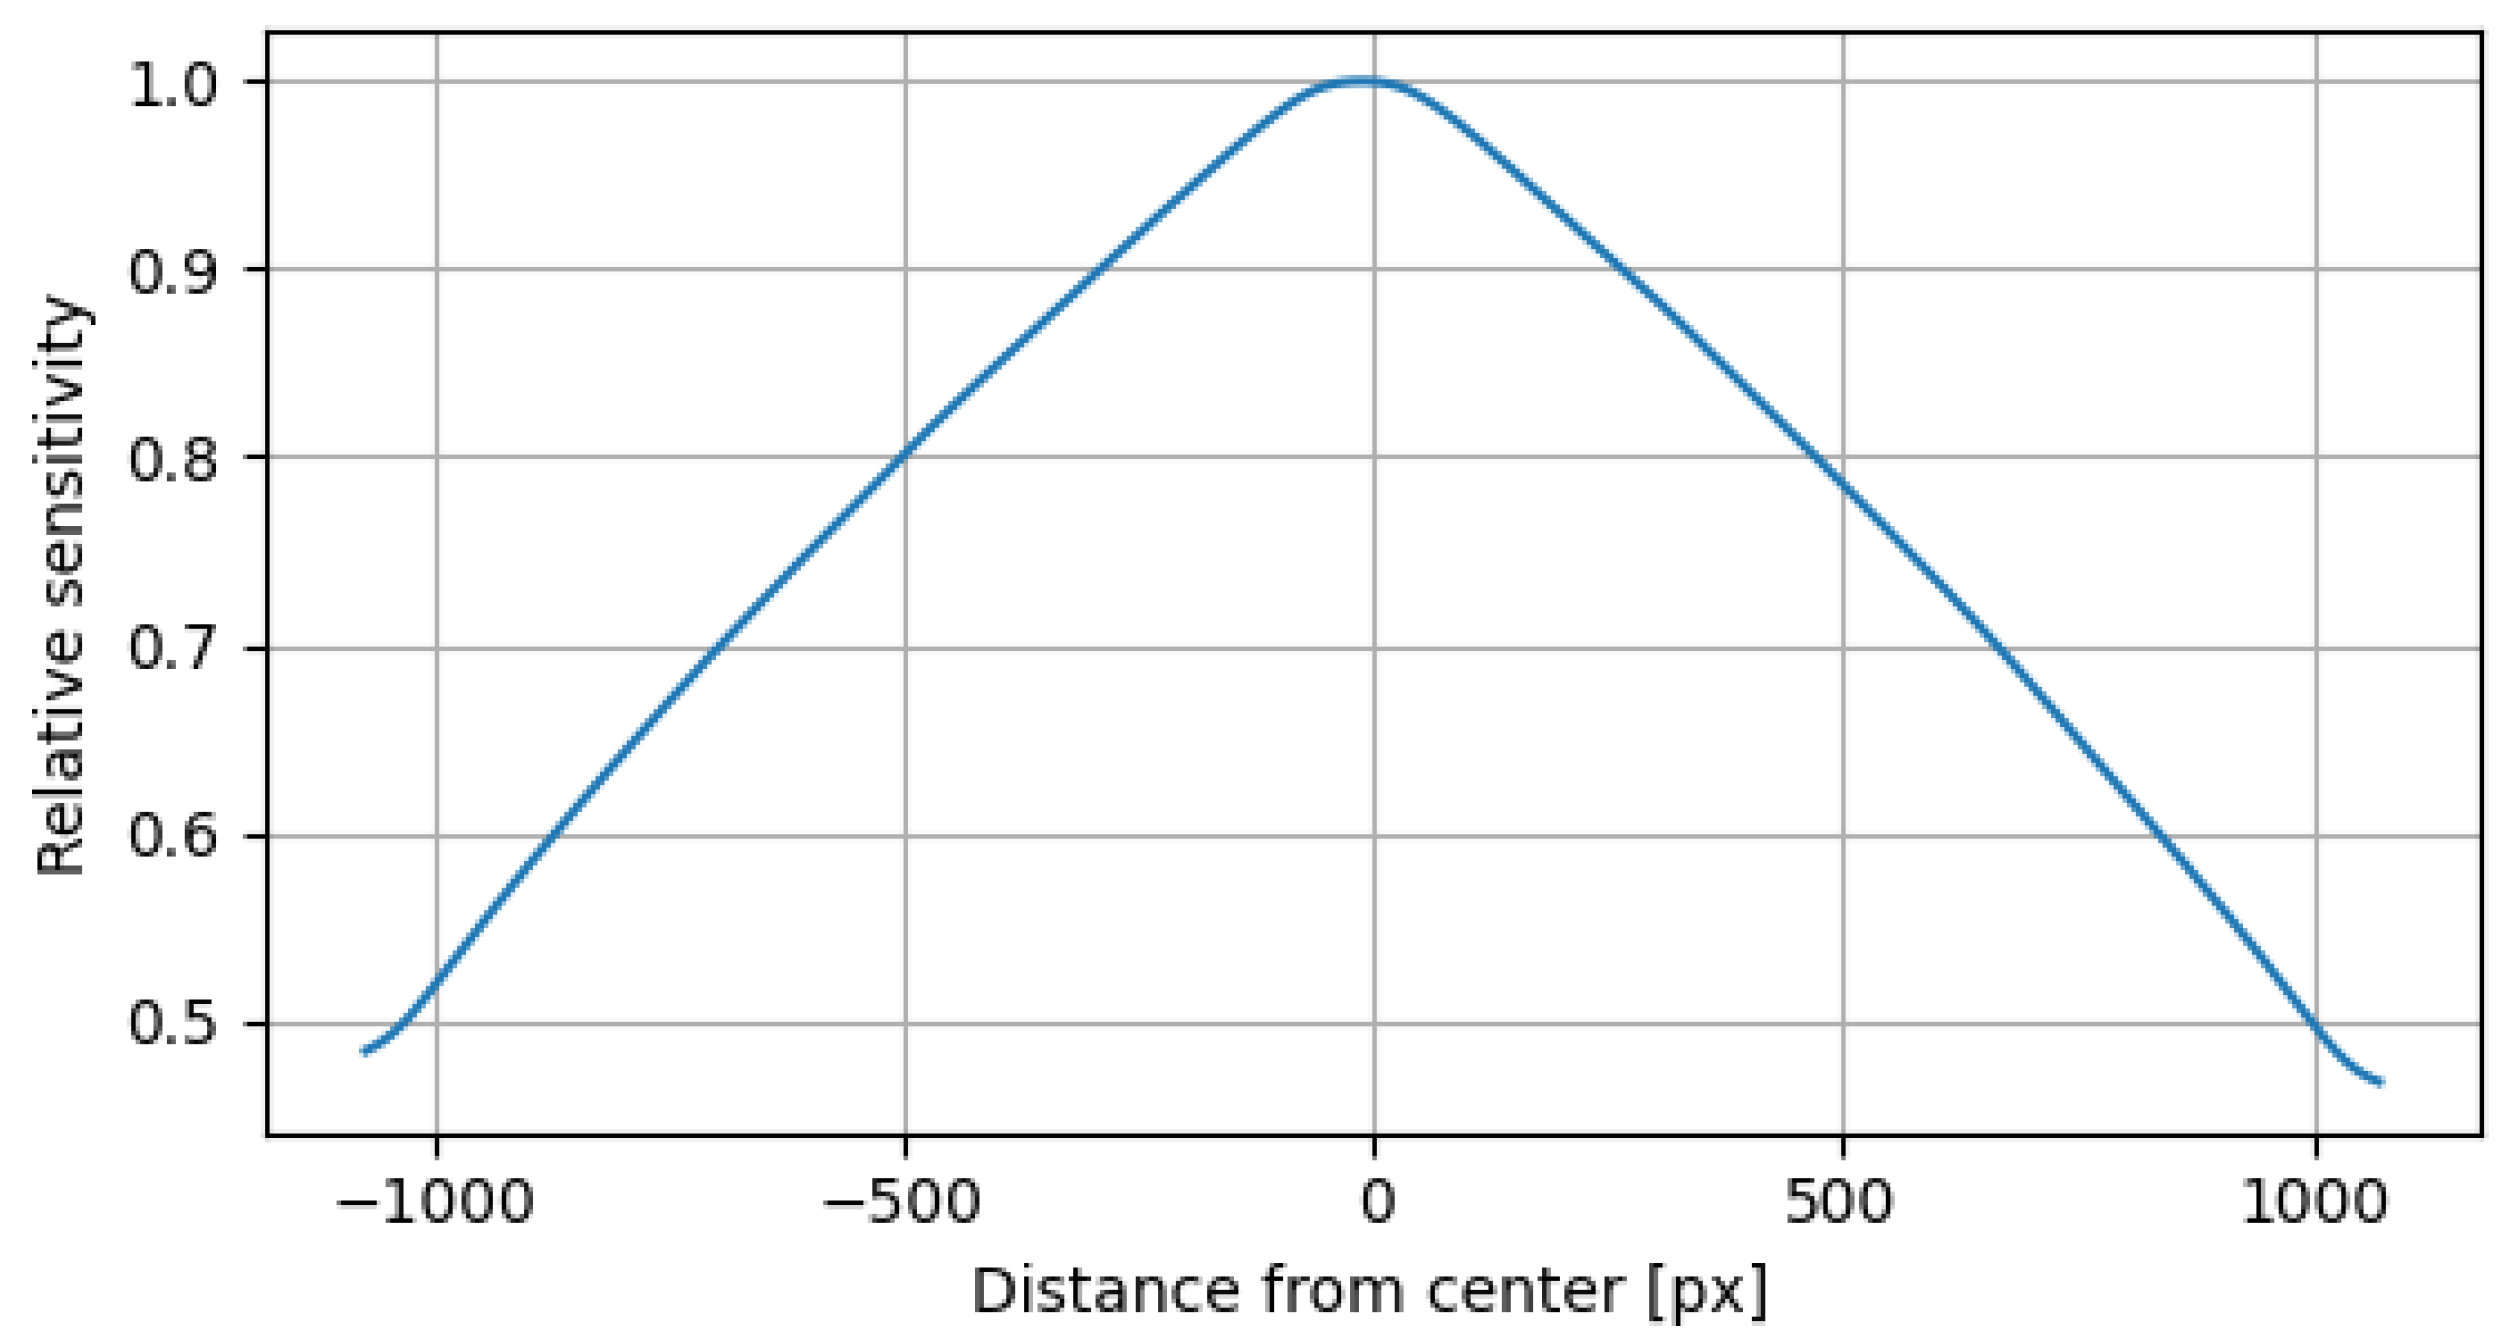
Figure 11, normalized by the maximal value in each band. The grey tones in the image indicate that the effect was not colour-dependent, which was expected. The horizontal transect shown in
Figure 12 emphasized the radial dependency of this effect and shows that more than half the incoming light is lost at the edges of the image.
3.4. Photometric Calibration in the Three Colour Bands
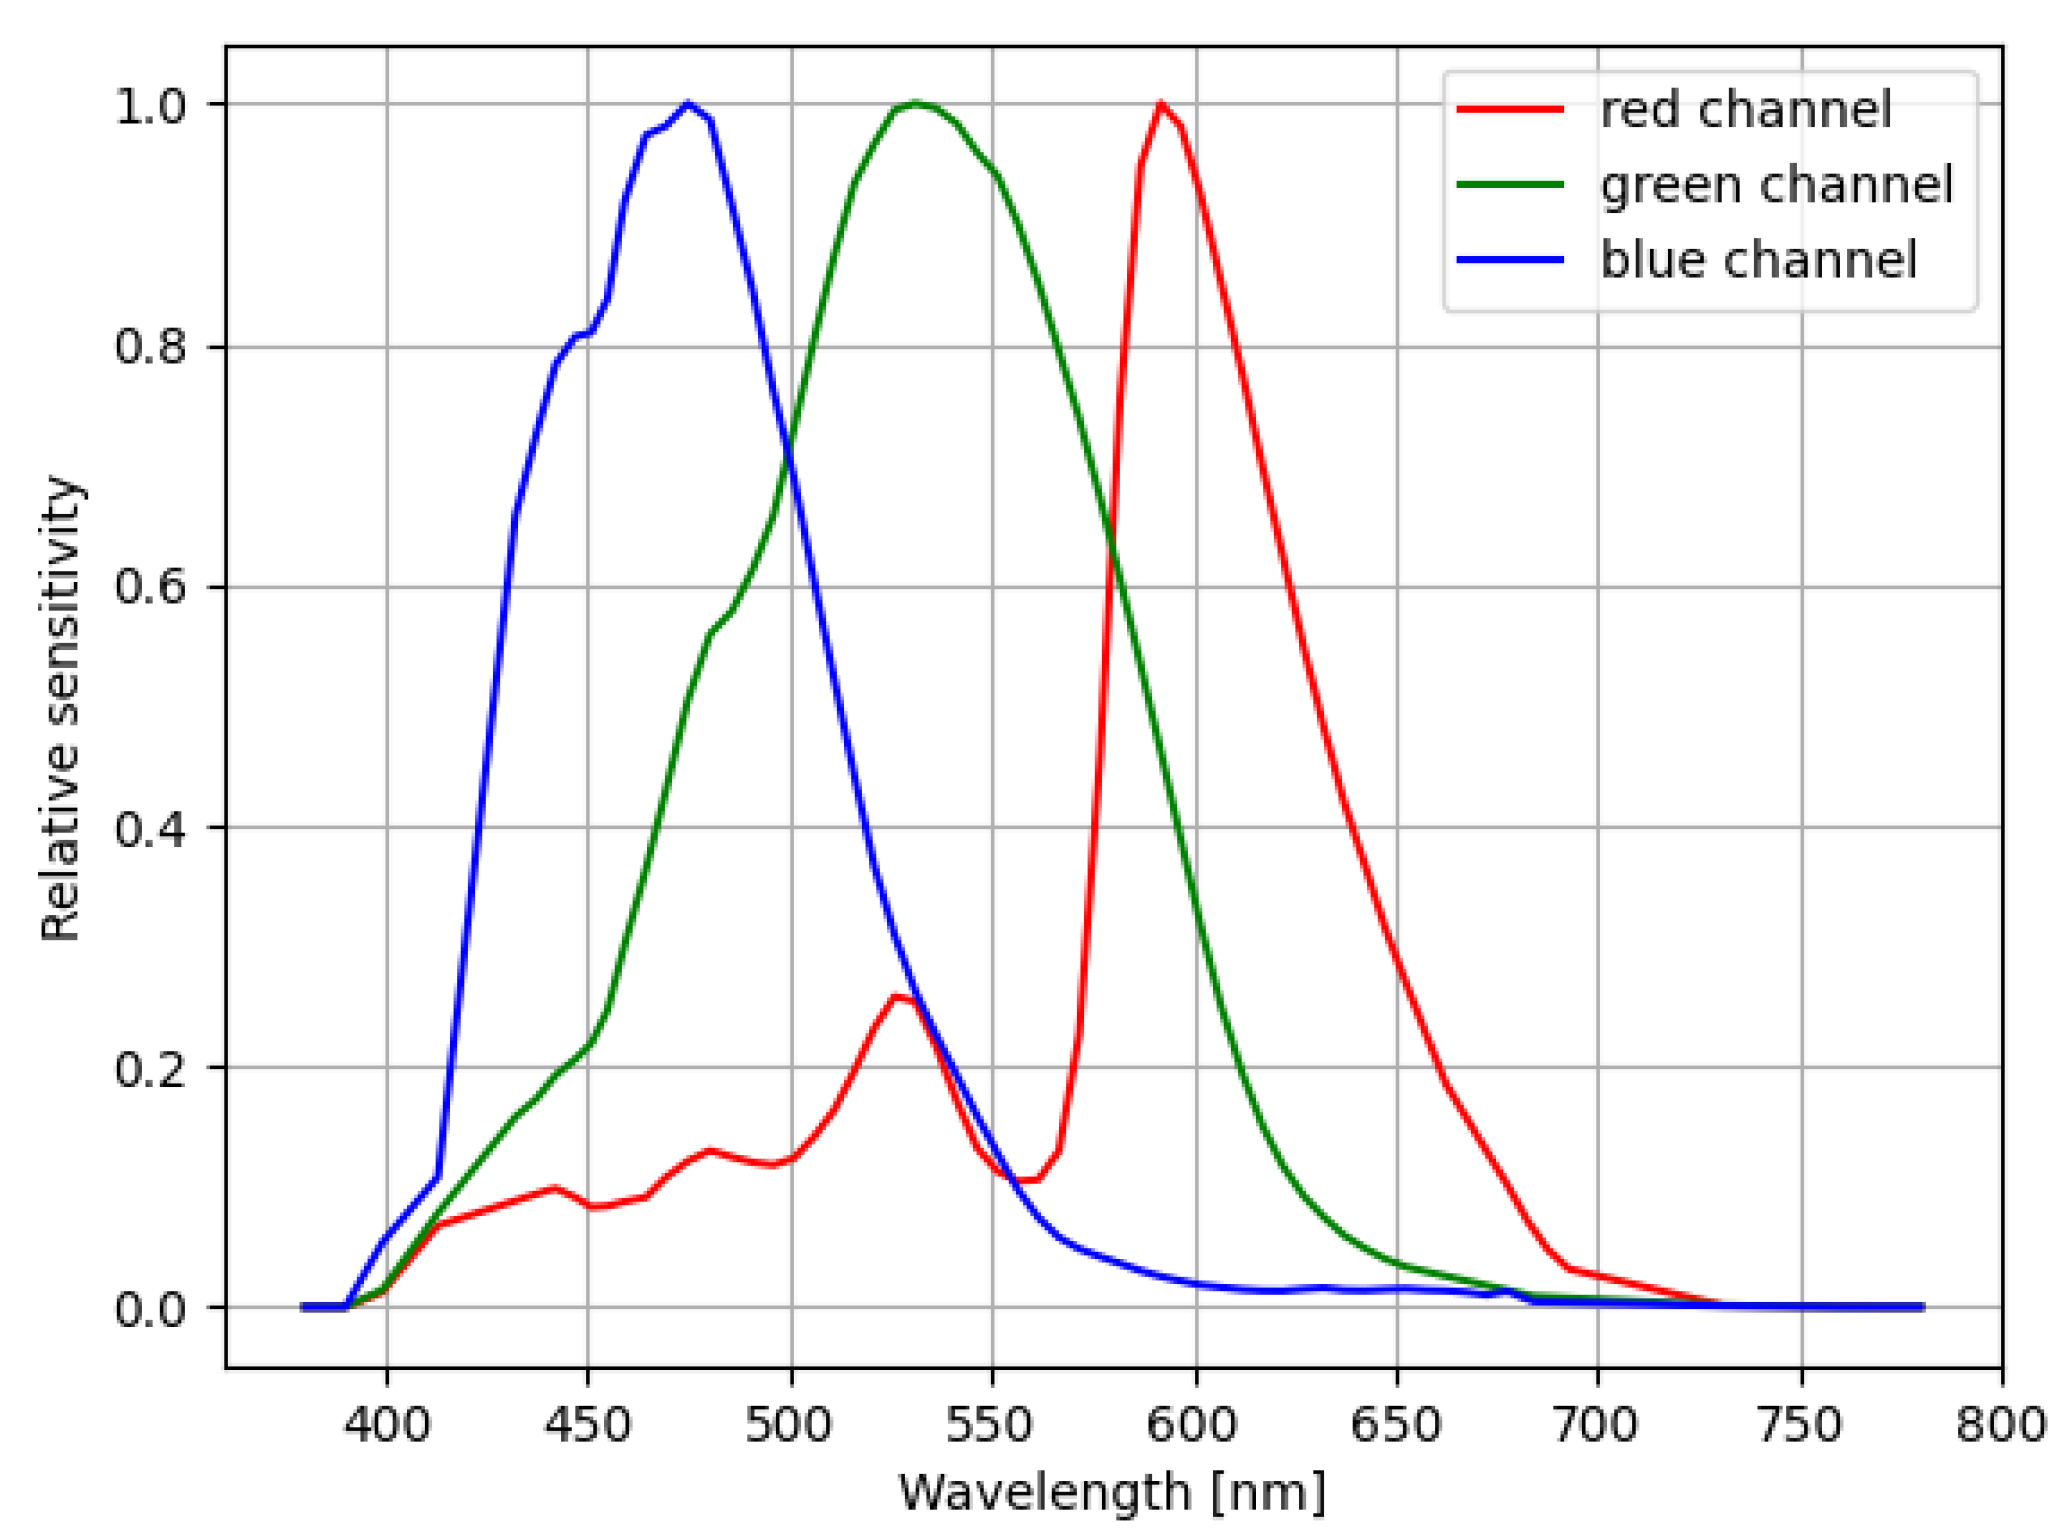
Spectral sensitivity data for our camera were obtained from Pr. Zoltán Kolláth [
30]. The sensitivity curves are shown in
Figure 13.
The photometric calibration procedure was conducted using an image series of the Cygnus constellation taken during the nights of 28 October and 29 October 2012 in the Parc du Mont Bellevue, Sherbrooke, Canada (45.3781°N, 71.9134°W, alt. 319 m). This site was chosen because of its clear view of the sky, the absence of local light sources, and its proximity to an AERONET station. The Cygnus constellation was an interesting target, because it was located close to the zenith when the measurements where taken and there were three candidate stars in the field of view of the camera used,
Cyg (2.64 mag),
Cyg (2.34 mag), and
Cyg (2.86 mag). Moreover, these three stars were of similar apparent visual magnitude, were relatively isolated, and were not variable. This means that the same exposure settings could be used on the camera. As such, a single image sequence was needed to obtain photometric data for all three stars. The AOD and Ångstrom coefficient were obtained from the CARTEL AERONET station (45.3798°N, 71.9313°W, alt. 251 m), located 900 m away from the measurement site. Since AERONET does not test for lunar photometry, ref. [
31] solar photometry data of the evening prior to the observations were used. The pressure measurements were taken from Environement Canada’s data for the Lennoxville station (45.3689°N, 71.8236°W, alt. 181 m) located 7.1 km from the measurement site. The atmospheric parameters for both nights are shown in
Table 1.
Integrated stellar irradiances were obtained from the images using circular apertures (
Figure 7) with a radius
pix. The correction factor used was the 4-sigma-clipped mean factor of those calculated for each of the 2850 images. The distribution of these correction factors relative to the mean is presented in
Figure 14.
The calibration procedure produced pixel values of irradiances in W/m2, but these could be easily converted to other radiometric units using the sensor’s pixel size and/or their covered solid angle.
3.5. Geometric Distortion Removal
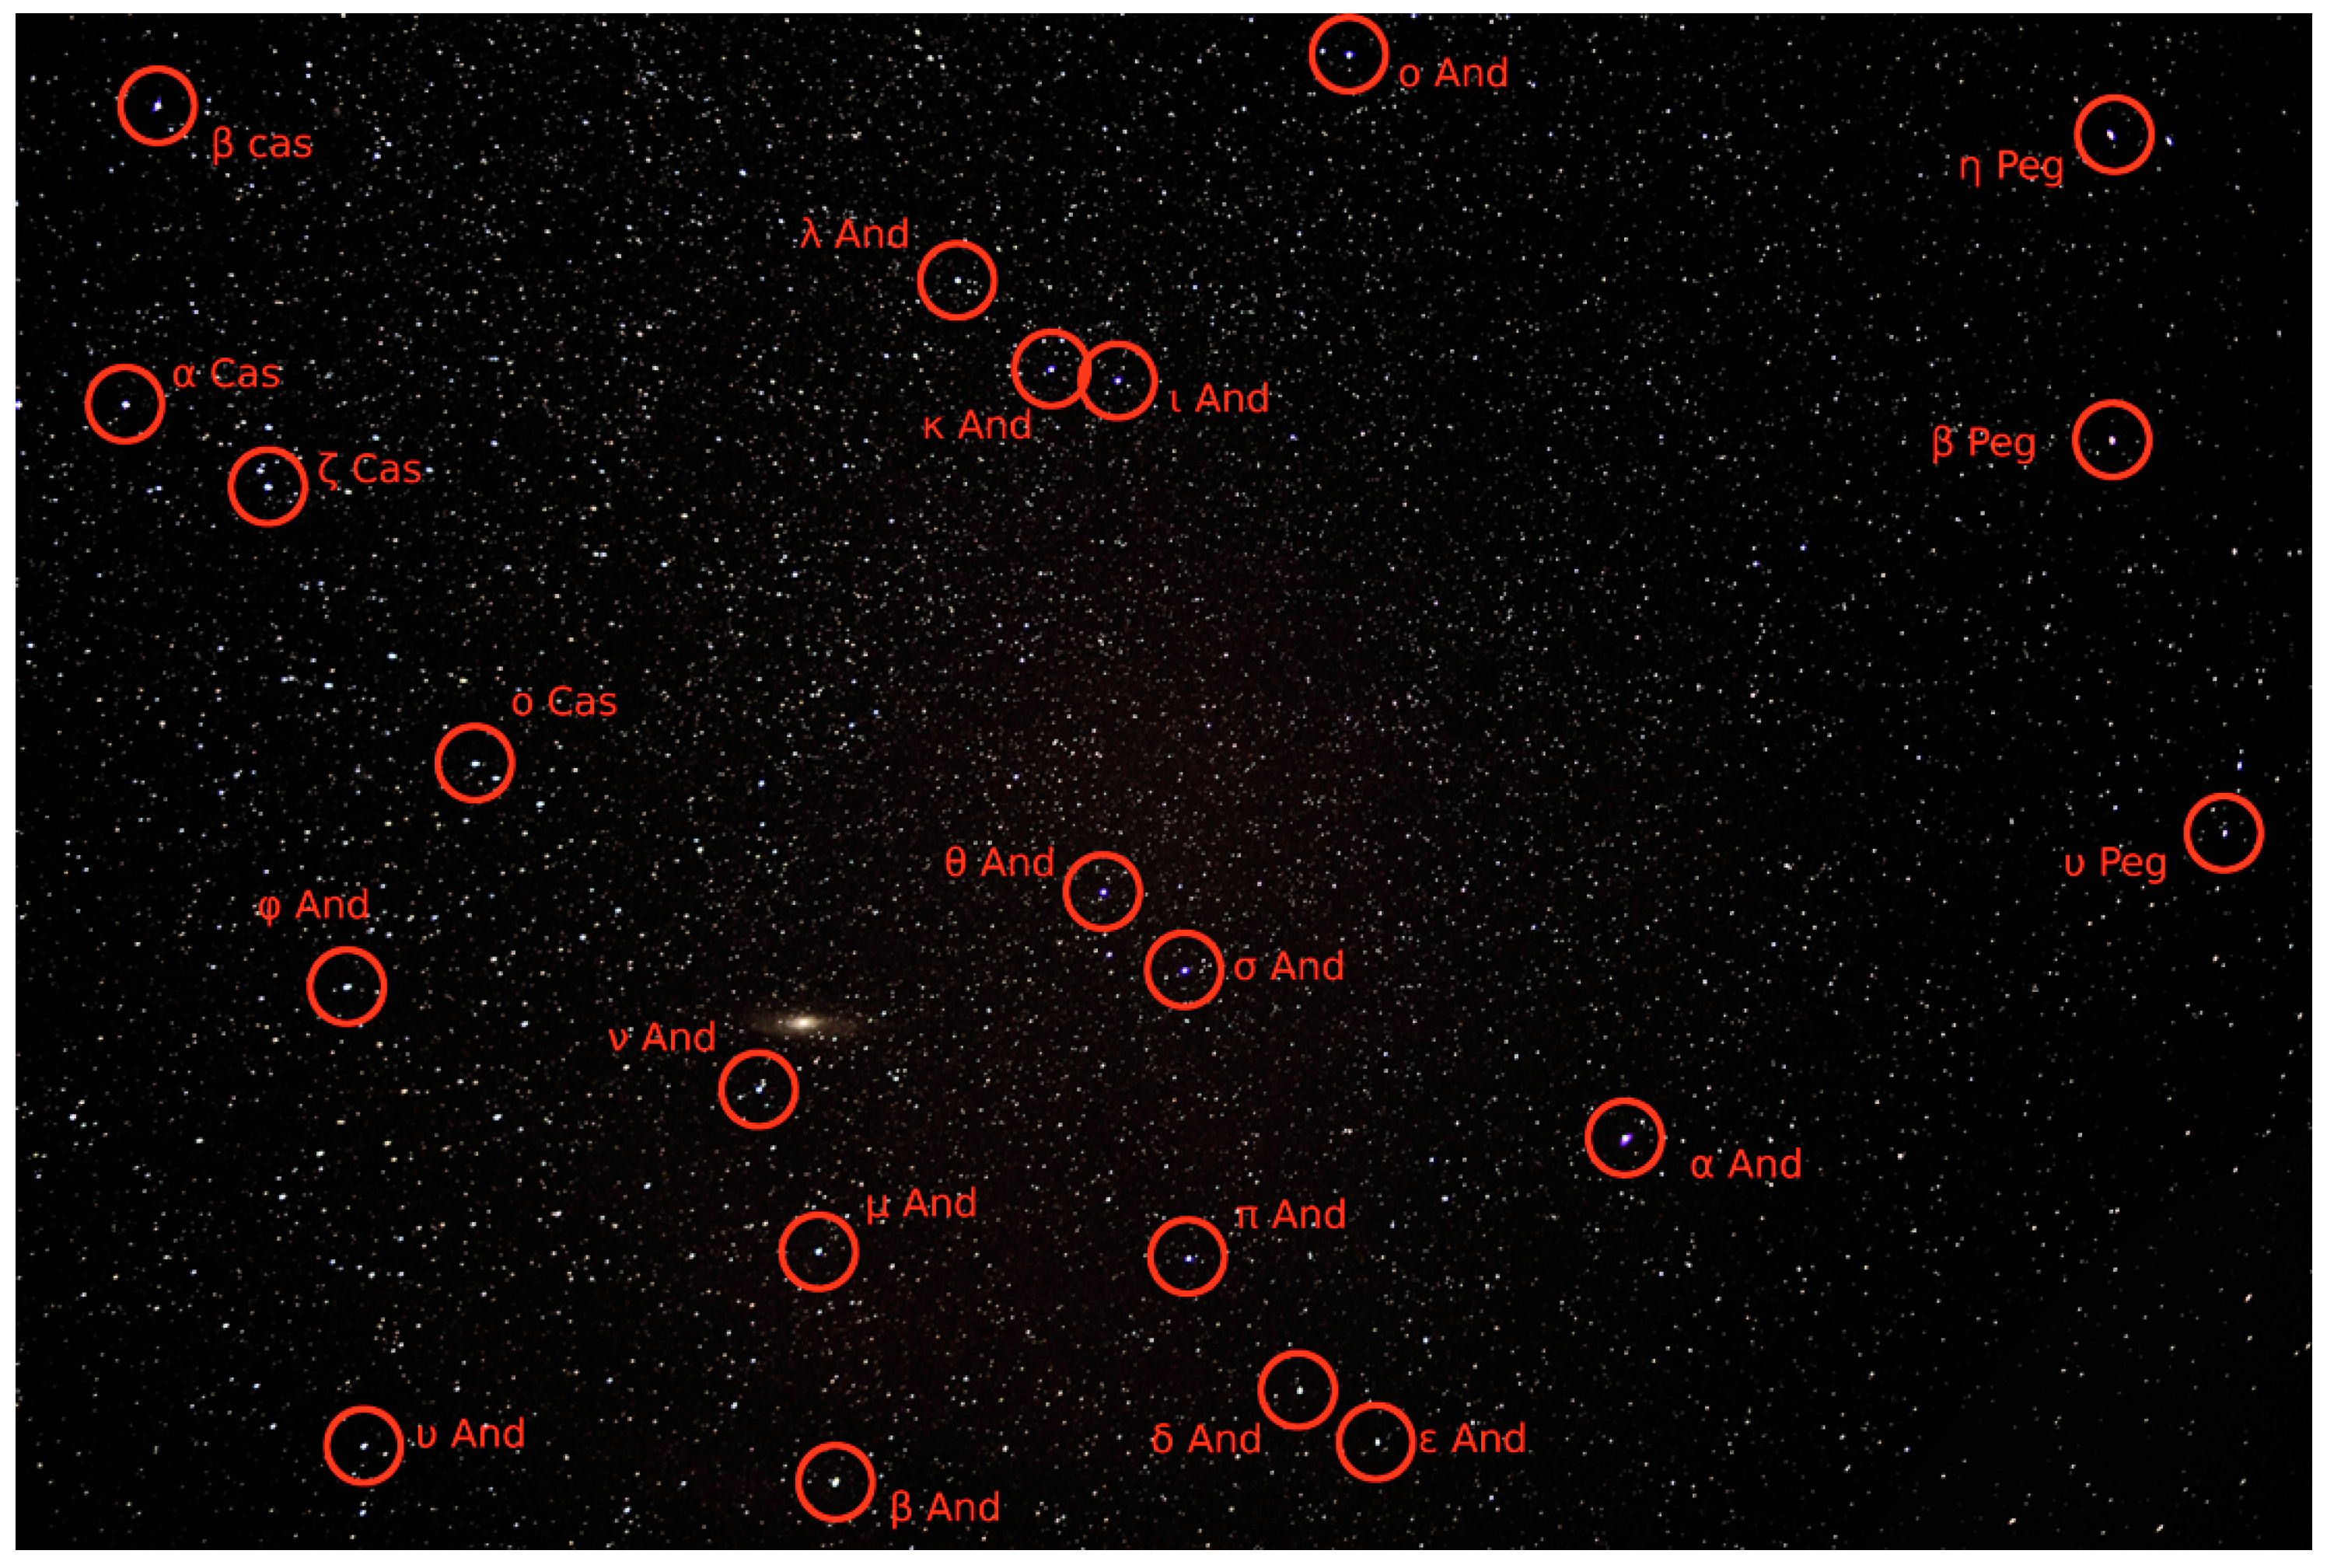
For the purposes of this work, a star field was taken of the Andromeda constellation on 18 June 2020 (See
Figure 15). Stellar coordinates were extracted from the image using the Astrometry.net plate solver [
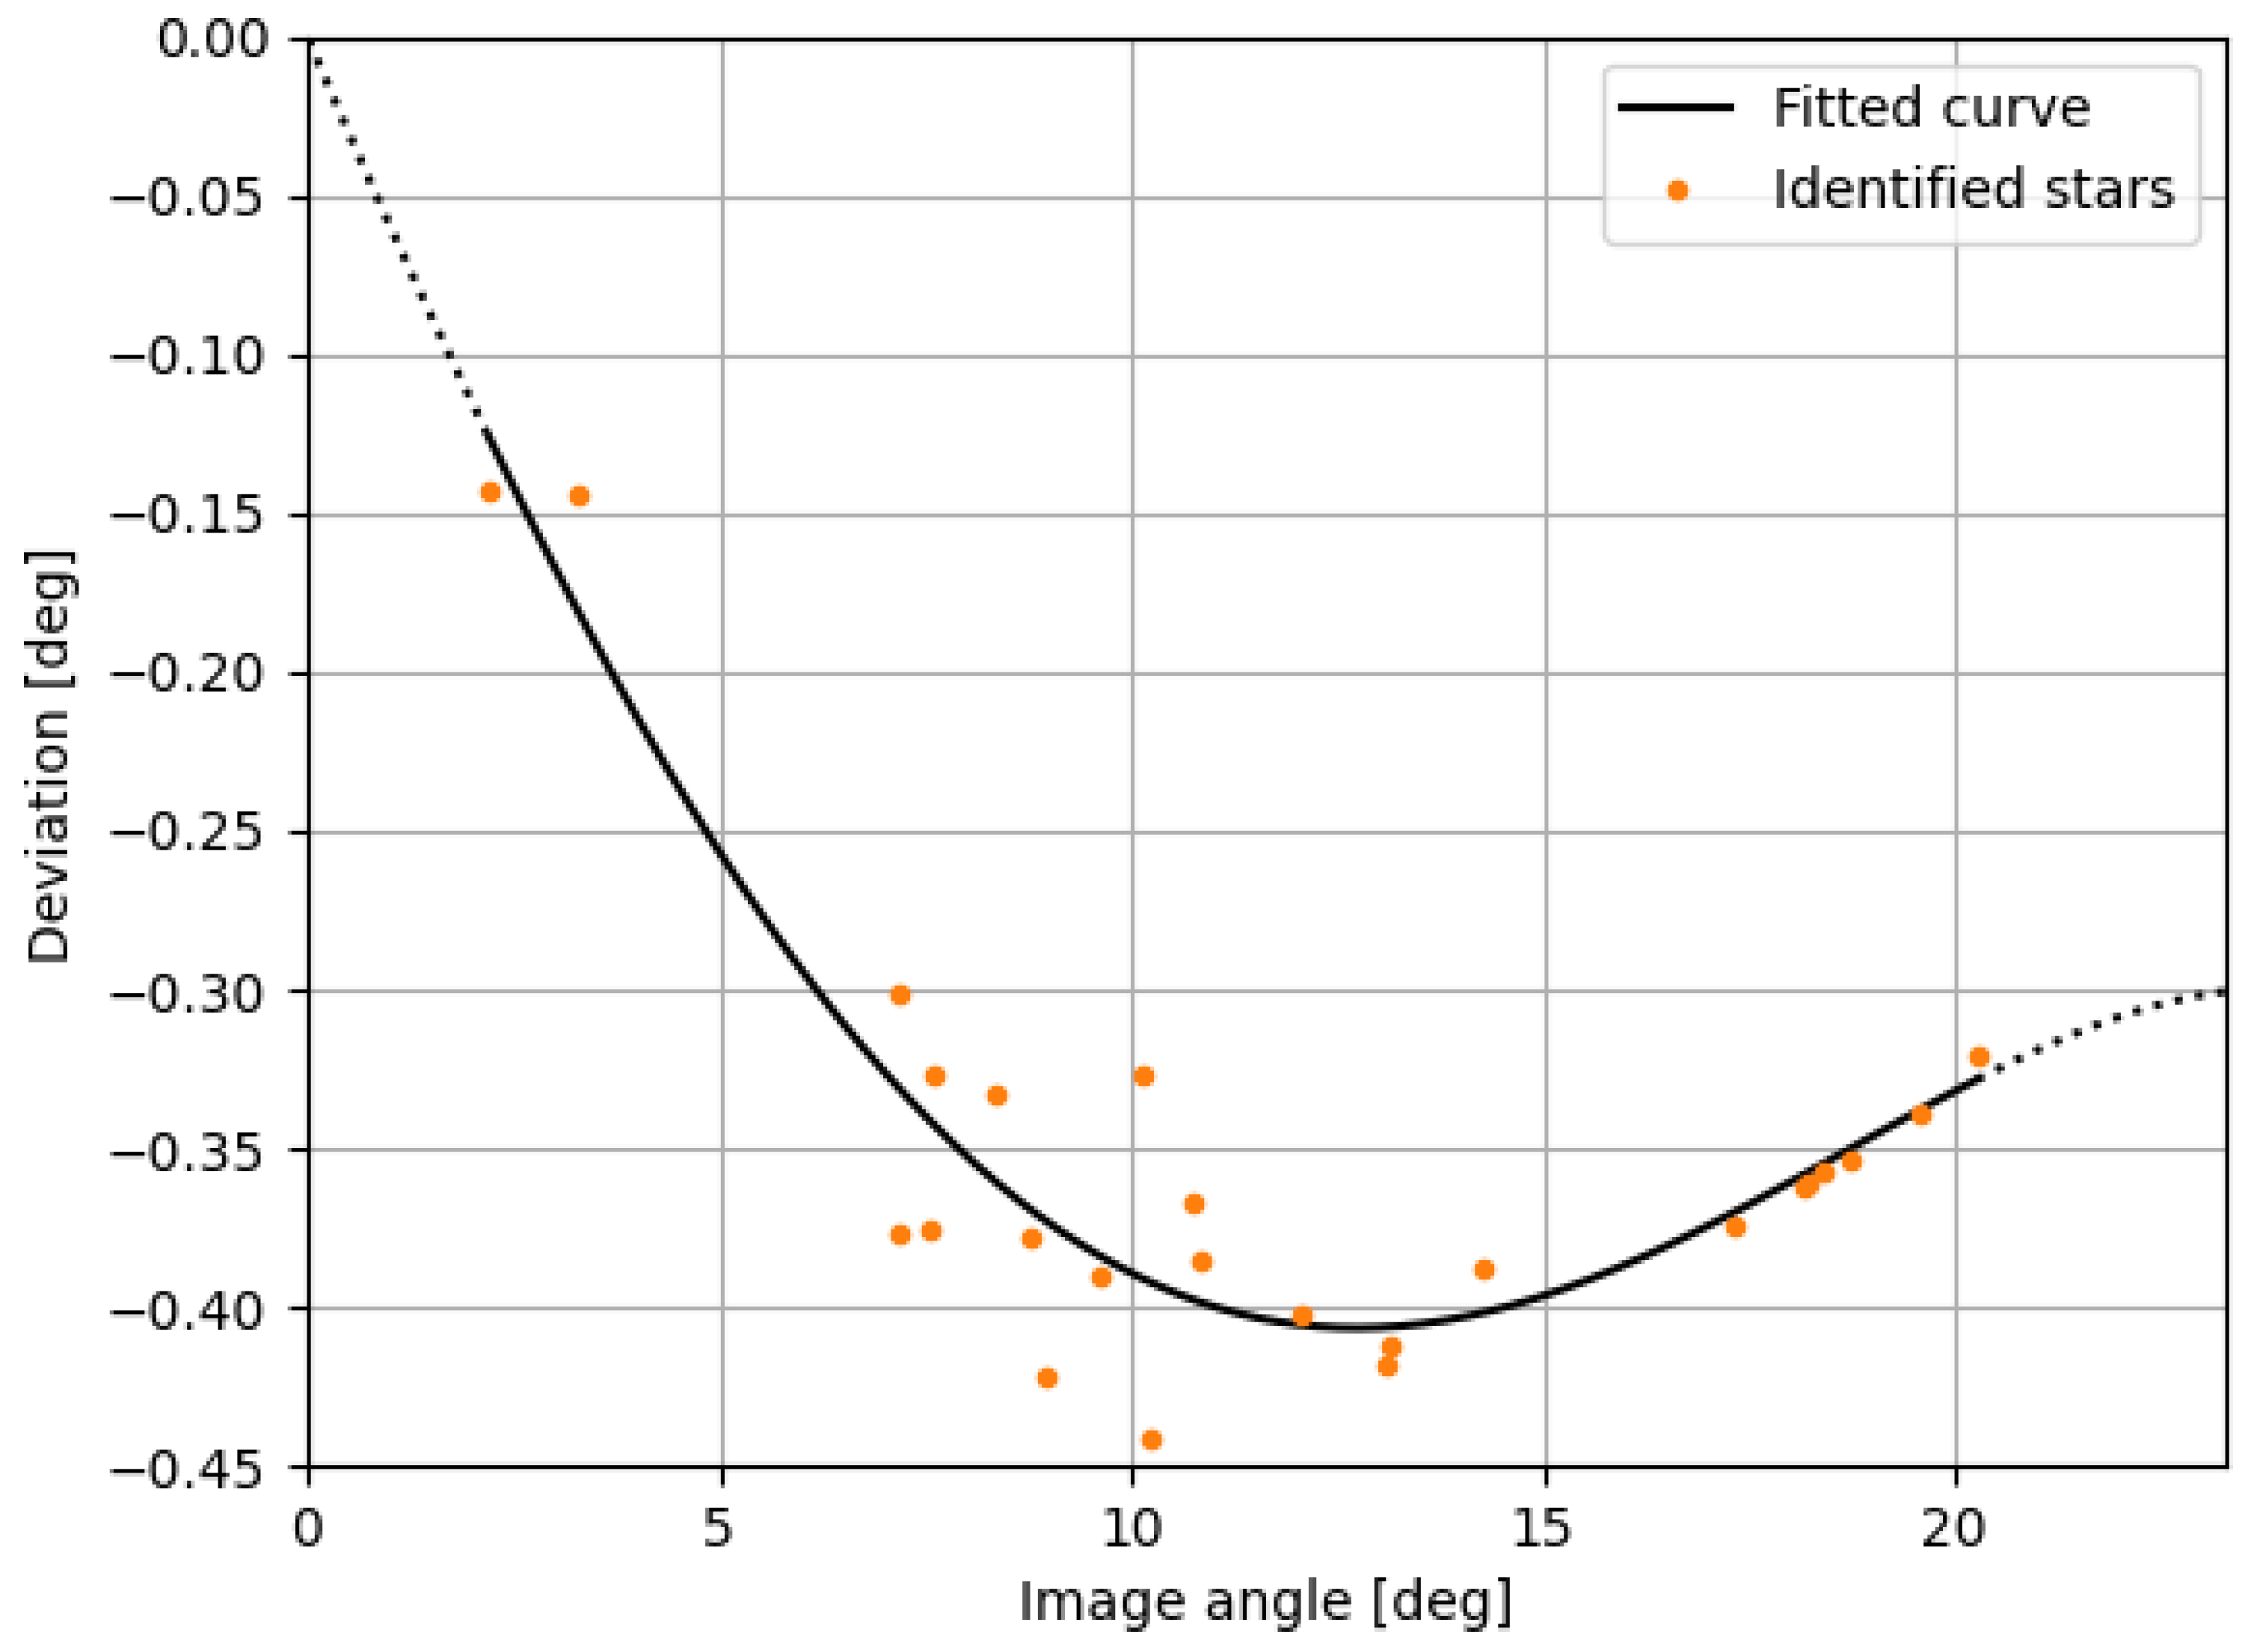
27]. The obtained fourth-order polynomial fit, presented in
Figure 16, was
As we can see, the fourth-order coefficient was still significant, which validated the need for such a high order polynomial fit. The deformation of the lens was minimal when compared to an ideal thin lens, being, at most, 0.4 degrees offset from such a lens. The fit residual was, at most, 0.05°, which was minimal when compared to the roughly 50° field of view and sufficient for our purposes.
3.6. Comparison with a Calibrated Spectrometer
To validate the calibration, we compared an image of a flat surface calibrated with the proposed method and compared it with a measurement taken with a StellarNet BLACK-Comet UV-VIS spectrometer equipped with a CR2 Cosine Receptor (180 Degree FOV Diffusers). This has a measurement range of 280 to 900 nm, with a sub 1 nm spectral resolution. The spectrometer calibration was performed using the National Institute of Standards Technology (NIST) StellarNet traceable ultra-stable light source. According to StellarNet, the calibration absolute accuracy was within 10%.
To perform the measurement, the inside of the photography tent was illuminated using the included white LED lights. The dark spectrum taken by blocking direct light to the sensor was removed from the obtained spectra. The inside of the tent was visible through a 15 cm wide circular opening in the middle of the lighting array. The spectrometer’s sensor was positioned 22.2 cm away from the opening. The spectrometer was set with an integration time of 10 s, averaging 3 measurements, while the camera had an exposure time of 1/4000 of a second at ISO 6400, with the aperture fully open.
The spectral measurement obtained by the spectrometer was integrated using the spectral sensitivity curves presented in
Figure 13. Both devices provided irradiance measurements in W/m
2, but we needed to convert these measurements into radiances (W/m
2/sr) to compare them. The solid angle covered by a single pixel of the camera was derived from the geometric distortion map from
Section 3.5 and found to be
sr. The pixels values corresponding to the opening were then averaged together. As the field of view of the spectrometer was much larger than the apparent size of the opening in the photography tent, the solid angle of interest was the apparent angle of that opening. Given the radius of the opening
r and its distance to the sensor
d, the apparent angle
was
In our case, we found that sr.
The resulting radiances for each band are presented in
Table 2. As can be seen, the camera’s calibration method fell within a few percent of the spectrometer. This offset could have been caused by uncertainties in the solid angle estimation of the tent opening when viewed from the spectrometer, by the spectrometer absolute calibration uncertainty (<10%), or by uncertainties in the atmospheric correction of the photometry calibration and other experimental uncertainties. Nonetheless, this accuracy is more than sufficient for the proposed applications, as the uncertainties of artificial light inventories are much larger than this.
4. Application Example
In order to demonstrate a potential use case for such a calibrated camera, we presented an image of a city taken from an airborne platform. A simple analysis was then performed to validate that the calibration method proposed in the current work produced results within the proper order of magnitude.
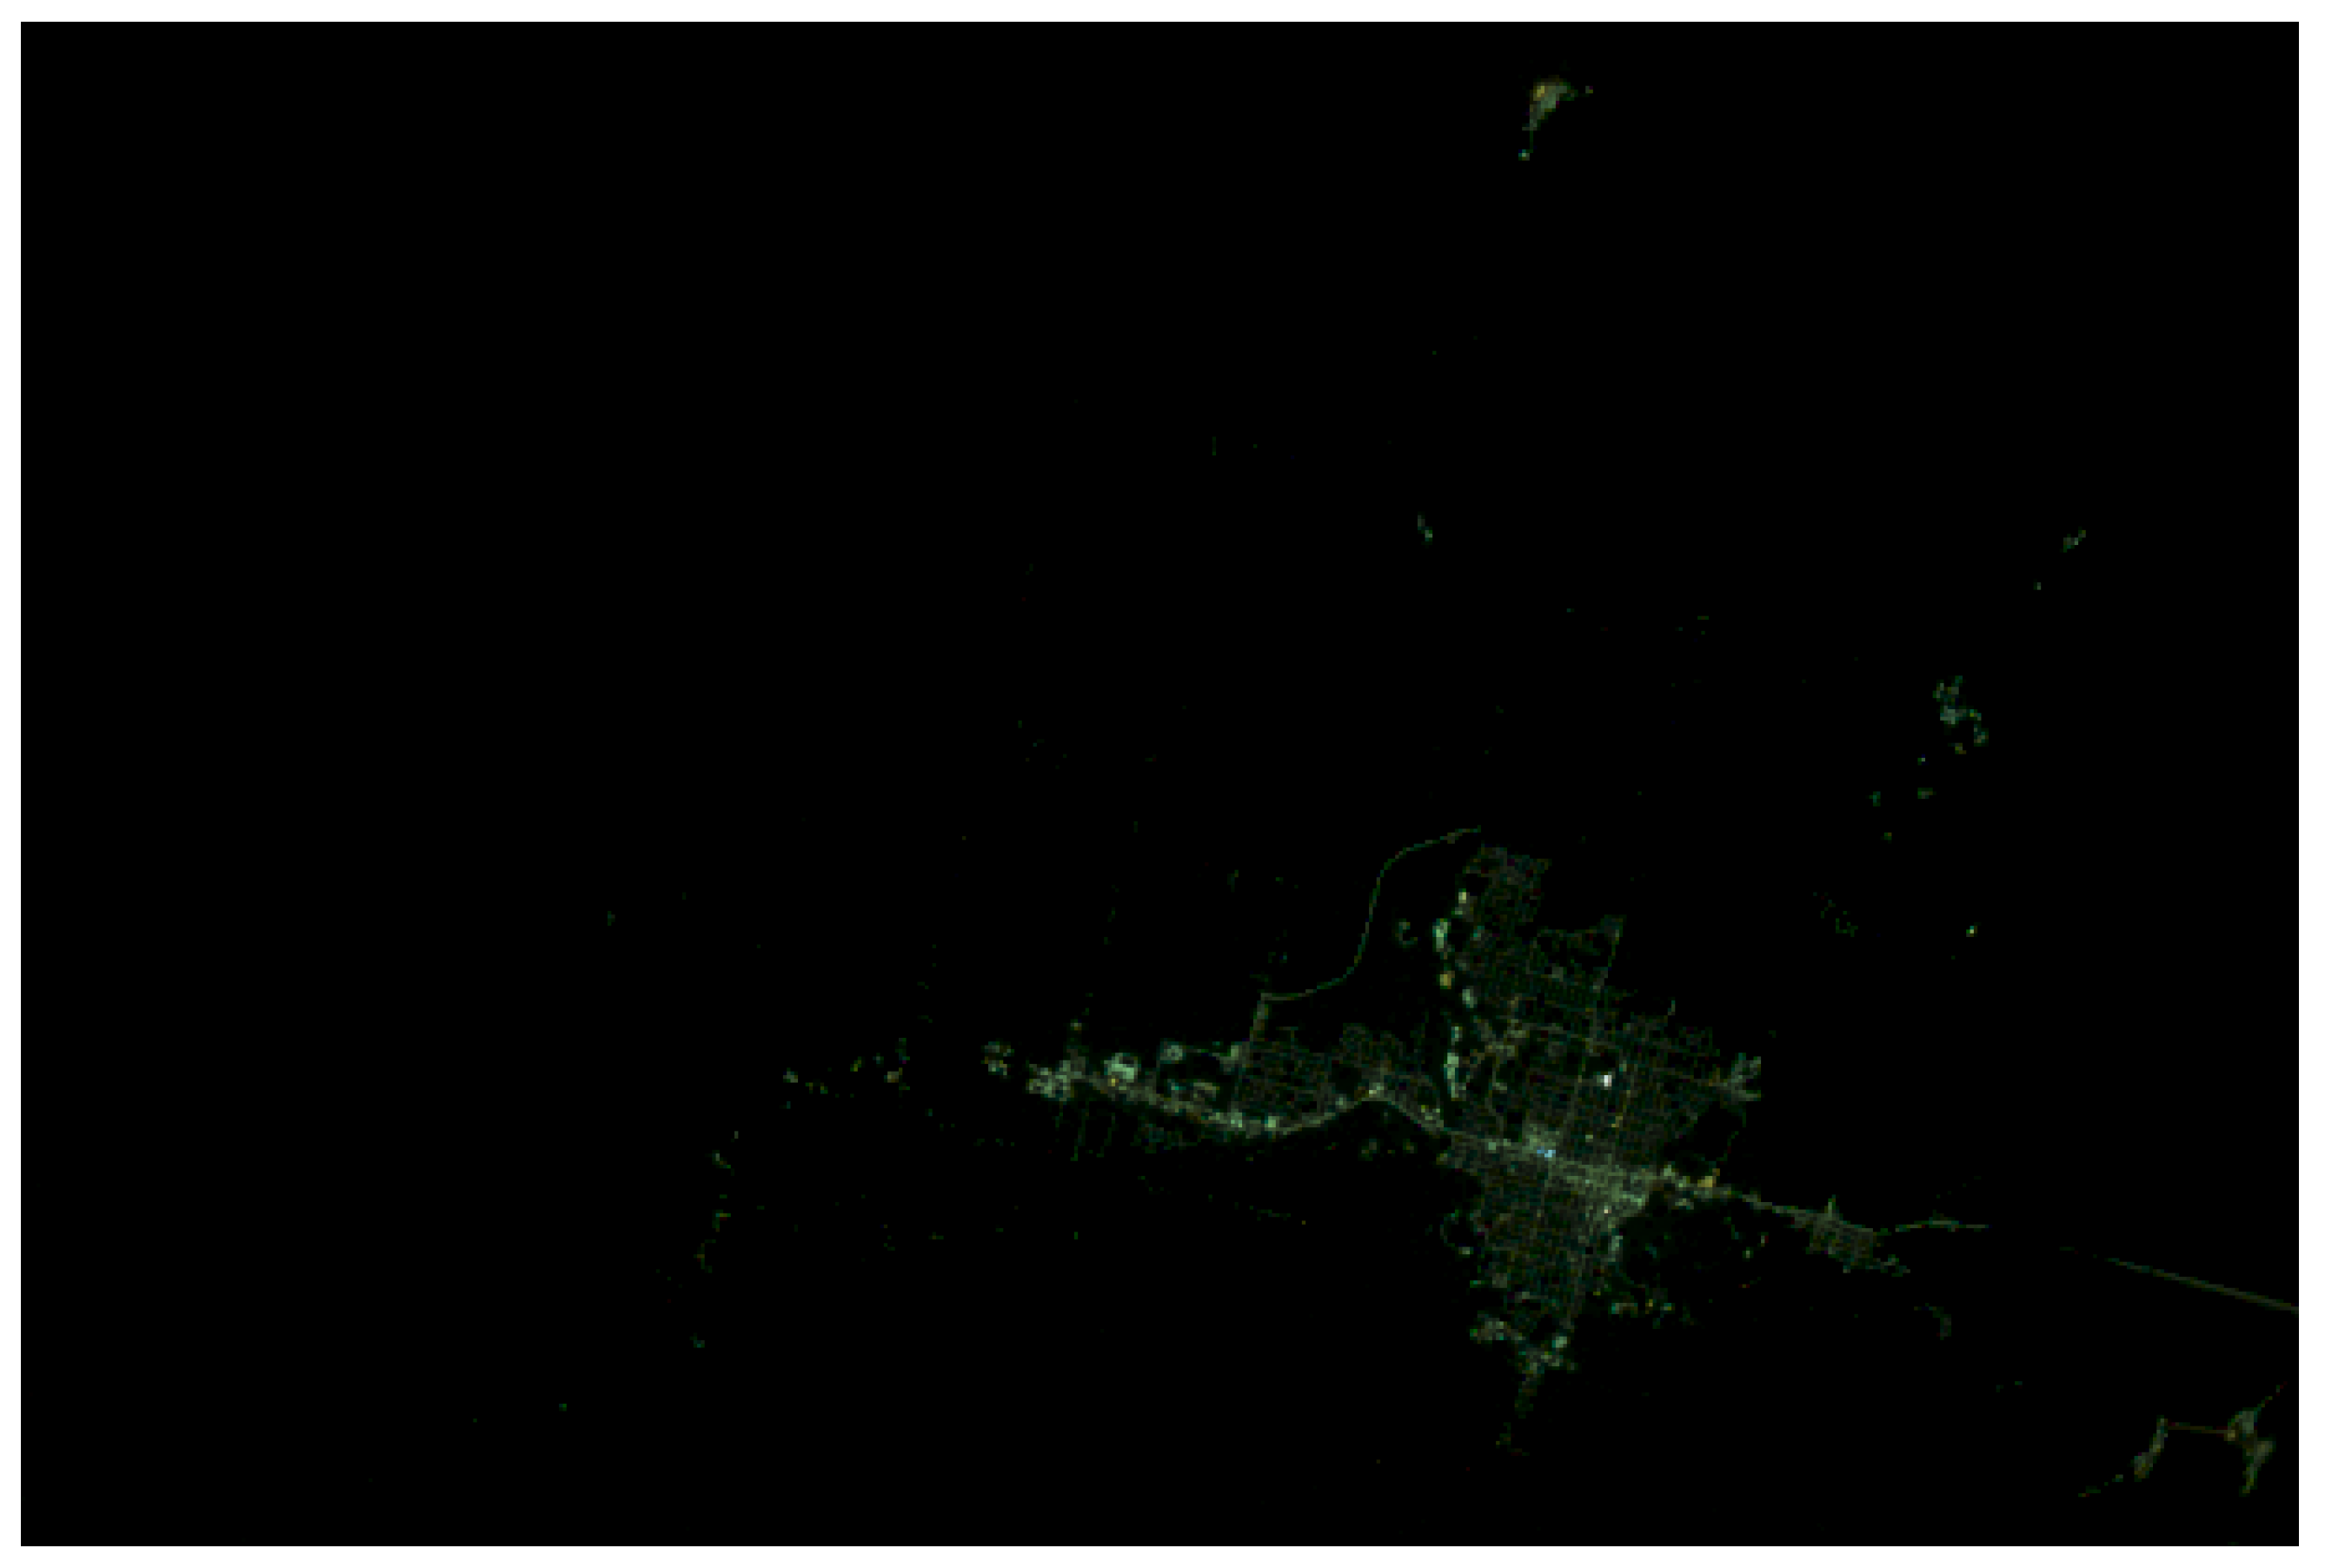
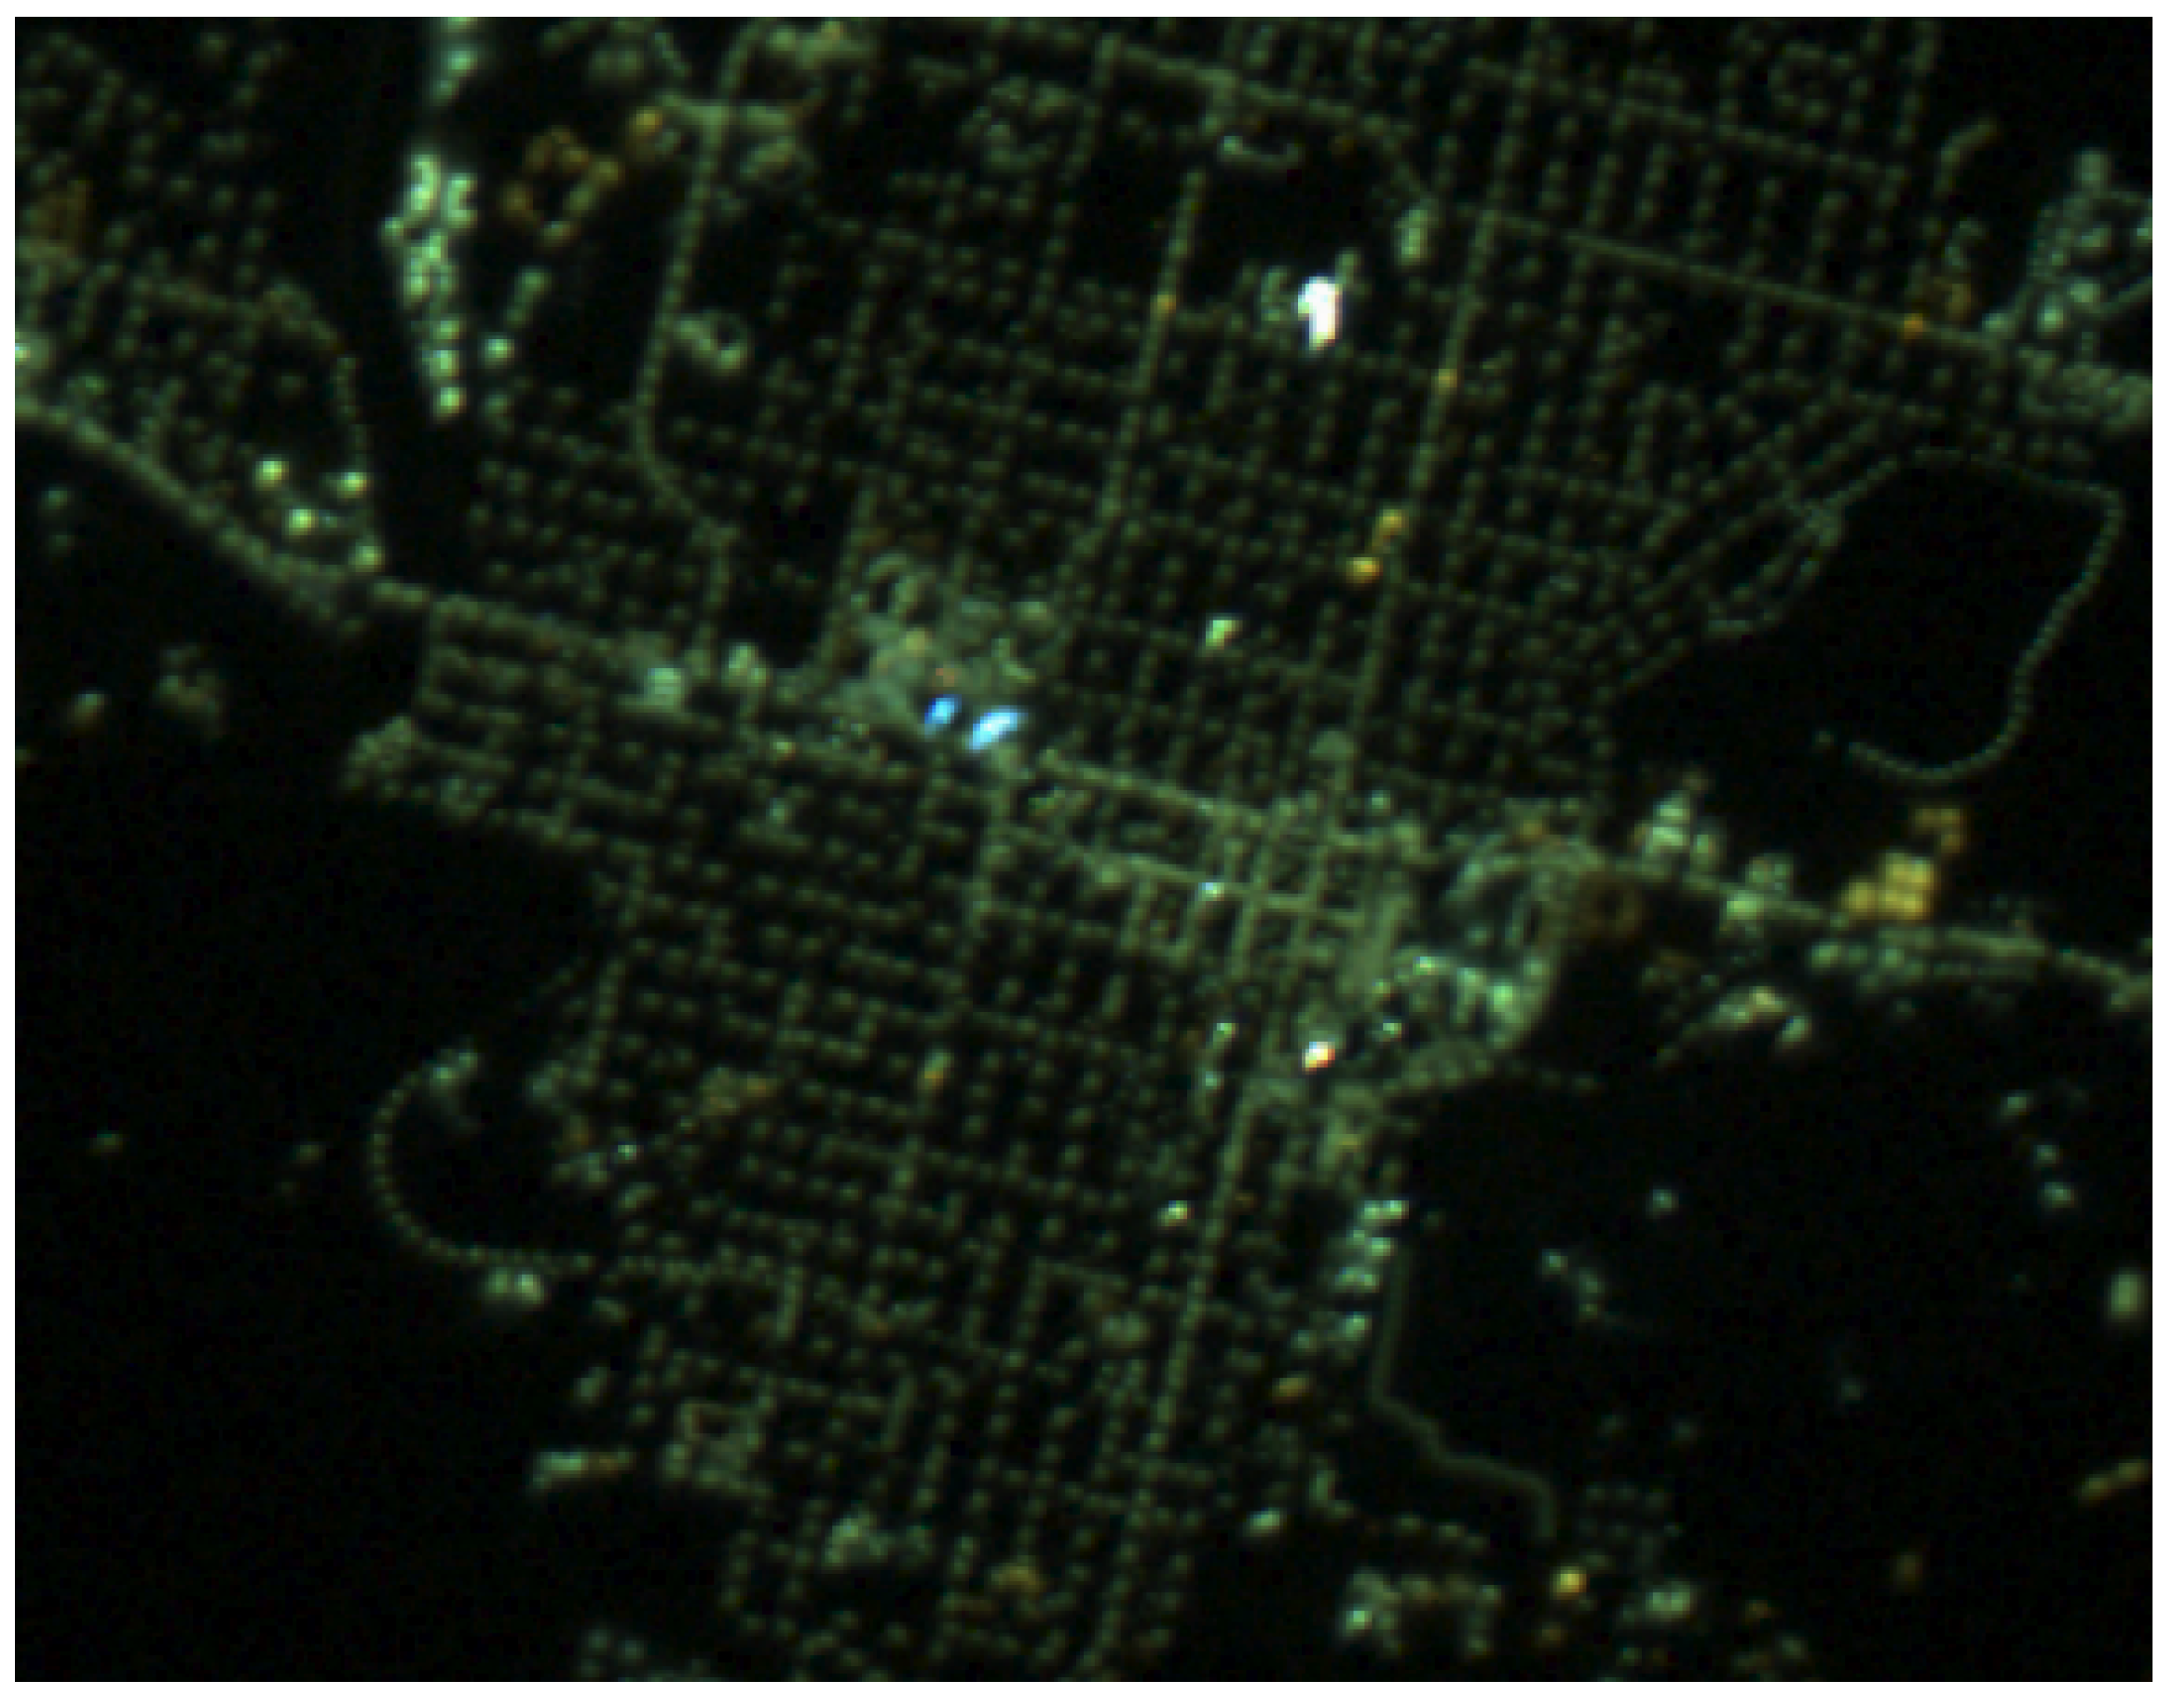
On the night of 26 August 2019, the Canadian Space Agency (CSA) and the french Centre National d’Études Spatiales (CNES) flew a high altitude stratospheric balloon, as a part of the STRATOS program. We had installed a downwards-looking camera on board, the one calibrated in this work. The balloon flew over the city of Timmins, ON, Canada at an altitude of 32.8 km. We took pictures during the whole flight, such as the one shown in
Figure 17 and
Figure 18. These images were calibrated using the methods described previously.
We converted the obtained irradiance
I to the radiance
using the solid angle covered by a single pixel
steradians derived from the geometric distortion map from
Section 3.5 using
The radiance emitted from the ground
was obtained by applying the atmospheric extinction correction previously described in
Section 2.8, using the atmospheric parameters for the closest AERONET station for the night of the flight, Chapais. The obtained values were an AOD of 0.9 and an Ångstrom coefficient of 1.5. Therefore,
By assuming that all the light was reflected on the ground (which is not true everywhere, but assumed here for simplicity purposes, and mostly valid in residential areas) and that the ground was perfectly Lambertian asphalt, the radiosity
J was obtained using
The ground irradiance
was obtained using an asphalt reflectance
approximated to 0.07.
Finally, assuming that the camera green band sensitivity was comparable to the photopic sensitivity of the human eye, the average ground illuminance over a pixel
was obtained using
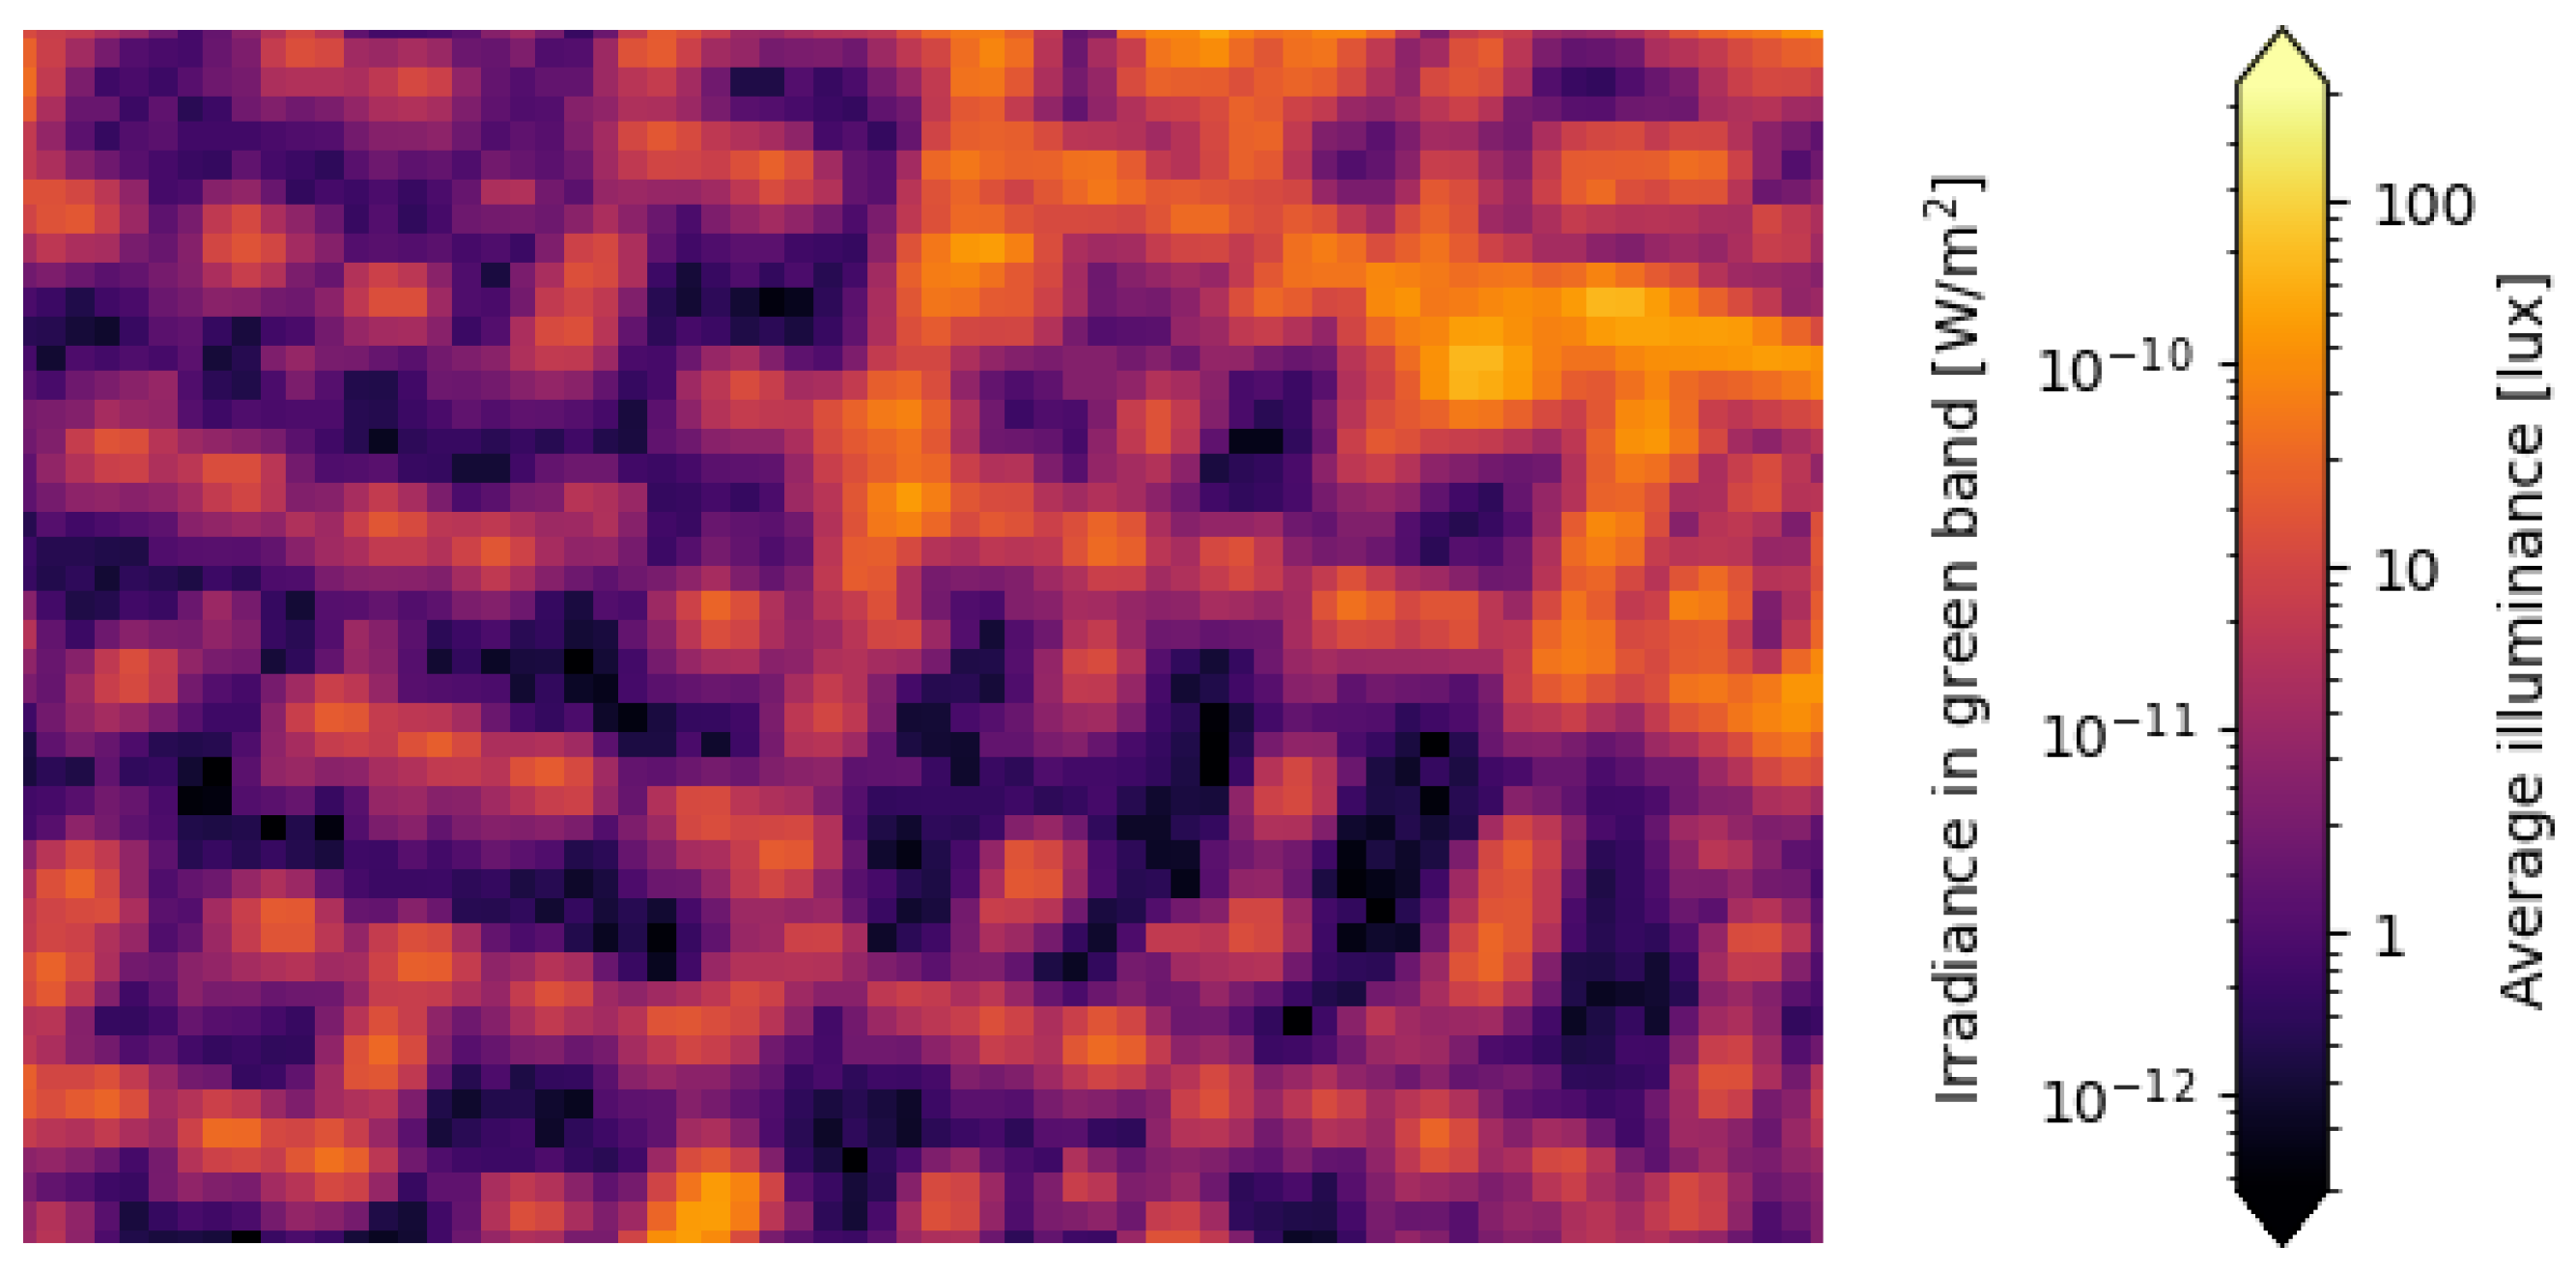
Therefore, the conversion from the measured irradiance to average ground illuminance was obtained using
and is shown in
Figure 19 for the city center, with a zoom-in of a few streets shown in
Figure 20.
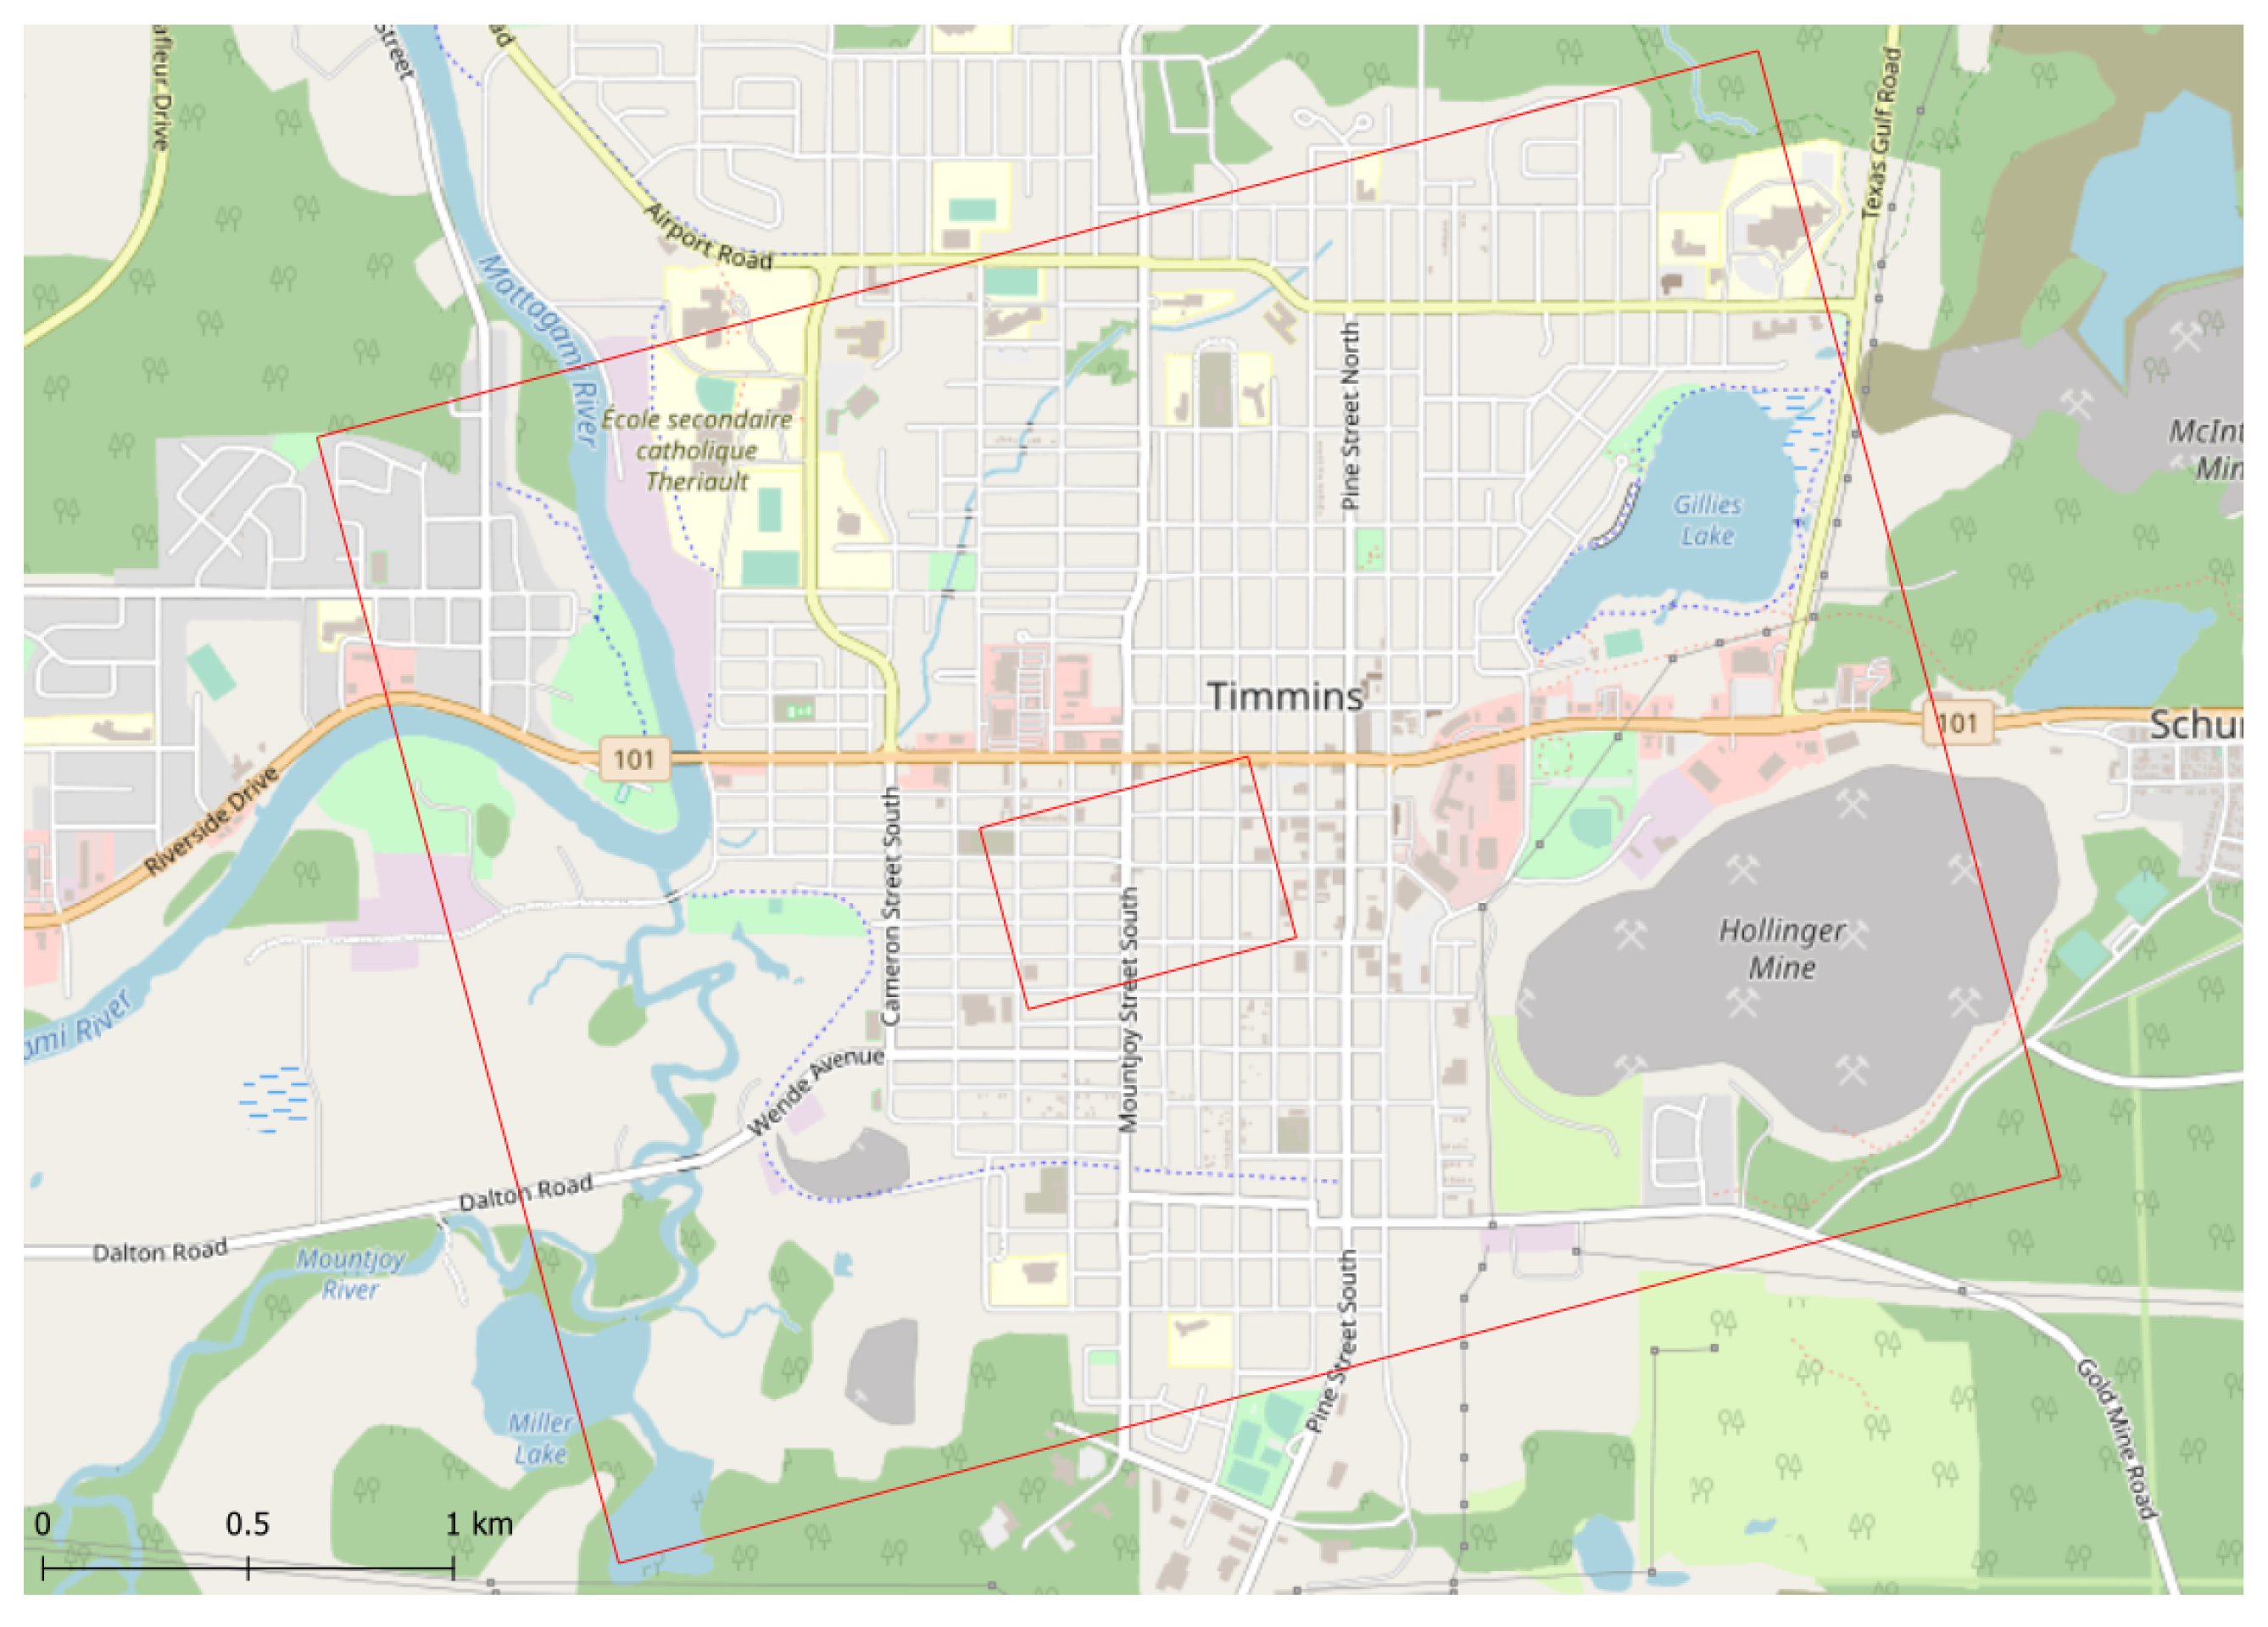
Figure 21 shows the extent of the two irradiance and illuminance maps.
We can see that, in residential areas, we obtained values of about 15 lux directly below the streetlamps, which is of the order of what would be expected for this situation. The brightest values were direct upwards emissions, where our assumptions were wrong. These were mostly located in commercial and industrial areas.
One could use these data to build an inventory of the light sources in the city, but this is outside of the scope of the present work. This application was the initial motivation behind this work, and our team is working on building a remote sensing platform for this specific purpose [
4]. Many other applications of the method presented in this work can be considered, such as the measurement of night sky brightness.
5. Conclusions
In this paper, we demonstrated that it is possible to calibrate a consumer-grade digital camera with simple methods to a precision acceptable (<5%) for scientific purposes. Multiple calibrations steps are required to properly account for all the physical processes that take place when an image is taken. The calibration process must be performed independently for every combination of ISO and aperture that one wants to use.
The Bayer matrix filter is handled by analyzing Bayer cells as pixels. This reduces the resolution of the image by a factor of two, but this corresponds to the effective resolution of every colour layer, apart from the green channel.
The sigma-clipped average of multiple dark frames, taken with the same exposure time and in similar conditions as the image to be calibrated, is removed, to eliminate the background signal caused by sensor bias and thermal effects. Using multiple images also reduces stochastic noise and transient events (such as cosmic rays) in the dark frames.
The linearity of the sensor’s response is evaluated through imaging of a stable extended light source with various exposure times. This is only valid under the assumption that the detected signal is proportional to the exposure time, which seems to break down for the shortest exposure times. This is validated by comparing the linearity curves obtained with sources of varying brightness.
A uniformly lit surface is imaged to correct for any pixel-to-pixel variation in sensitivity, as well as to remove the vignetting effect caused the system optics. As the availability of integrating spheres of sufficiently large diameter for typical cameras is limited, we proposed a method to artificially increase the apparent size and increase the uniformity of a given surface using a motorized camera mount and taking images at various viewing angles.
The absolute calibration of the system is carried out using well-known stars as a reference. Bright, non-variable, isolated stars located close to the zenith are selected and imaged multiple times over the course of a night. By comparing the apparent brightness of the stars with a known database corrected for local atmospheric extinction, a correction factor is established. This method is stable to within 10%, given a well known atmosphere. This justifies the requirement of using multiple measurements to properly account for these variations, although this uncertainty is small for the purposes discussed in
Section 4.
Finally, the angular distortion of the camera is established by taking an image of a star field. By identifying known stars in the image, we establish a deformation function based of the real and apparent position of the identified stars. This also provides a measurement of the solid angle covered by the pixels of the sensor.
The proposed method was compared with a measurement from a spectrometer and was found to be within a few percent, with the largest difference in the green band (5%). This could have been due to many factors, from errors in the atmospheric correction to uncertainties in the geometry of the comparison with the spectrometer, or due to spectrometer calibration errors.
Such a low-cost calibration method is useful for a variety of applications where calibrated imaging sensors are required, such as for building lighting infrastructure inventories using an airborne sensor or directly measuring the night sky brightness.
Author Contributions
Conceptualization, A.S. and M.A.; Data curation, A.S. and M.A.; Formal analysis, A.S. and M.A.; Funding acquisition, M.A.; Investigation, A.S. and M.A.; Methodology, A.S.; Project administration, M.A.; Resources, M.A.; Software, A.S.; Supervision, M.A.; Validation, A.S. and M.A.; Visualization, A.S. and M.A.; Writing—original draft, A.S.; Writing—review and editing, A.S. All authors have read and agreed to the published version of the manuscript.
Funding
This research was funded by the Canadian Space Agency (CSA) FAST program grant numbers 19FACSHB02 and 21FACSHC01, the Fonds de Recherche du Québec—Société et Culture (FRQSC) programme AUDACE #287395, and the Fonds de Recherche du Québec—Nature et technologies (FRQNT) programme de recherche collégiale #285926 and regroupements stratégiques #195116.
Data Availability Statement
Acknowledgments
The authors want to thank Zoltán Kolláth for providing the spectral sensitivity of the camera and Charles Marseille for his input during the conception of the methods.
Conflicts of Interest
The authors declare no conflict of interest.
Abbreviations
The following abbreviations are used in this manuscript:
| AERONET | Aerosol Robotic Network |
| AOD | Aerosol Optical Depth |
| CNES | Centre National d’Études Spatiales |
| CSA | Canadian Space Agency |
| DN | Digital Number |
| DSLM | Digital Single-Lens Mirrorless |
| FRQNT | Fonds de Recherche du Québec—Nature et technologies |
| FRQSC | Fonds de Recherche du Québec—Société et Culture |
| LED | Light Emitting Diode |
| RGB | Red, Green and Blue |
| SD | Standard Deviation |
References
- Jechow, A.; Kyba, C.C.; Hölker, F. Beyond All-Sky: Assessing Ecological Light Pollution Using Multi-Spectral Full-Sphere Fisheye Lens Imaging. J. Imaging 2019, 5, 46. [Google Scholar] [CrossRef] [PubMed]
- Kolláth, Z.; Dömény, A. Night sky quality monitoring in existing and planned dark sky parks by digital cameras. Int. J. Sustain. Light. 2017, 19, 61–68. [Google Scholar] [CrossRef]
- Kuechly, H.U.; Kyba, C.C.; Ruhtz, T.; Lindemann, C.; Wolter, C.; Fischer, J.; Hölker, F. Aerial survey and spatial analysis of sources of light pollution in Berlin, Germany. Remote Sens. Environ. 2012, 126, 39–50. [Google Scholar] [CrossRef]
- Aubé, M.; Simoneau, A.; Kolláth, Z. HABLAN: Multispectral and multiangular remote sensing of artificial light at night from high altitude balloons. J. Quant. Spectrosc. Radiat. Transf. 2023, 306, 108606. [Google Scholar] [CrossRef]
- Stubbs, C.W.; Tonry, J.L. Toward 1% Photometry: End-to-End Calibration of Astronomical Telescopes and Detectors. Astrophys. J. 2006, 646, 1436–1444. [Google Scholar] [CrossRef]
- Sánchez de Miguel, A.; Zamorano, J.; Aubé, M.; Bennie, J.; Gallego, J.; Ocaña, F.; Pettit, D.R.; Stefanov, W.L.; Gaston, K.J. Colour remote sensing of the impact of artificial light at night (II): Calibration of DSLR-based images from the International Space Station. Remote Sens. Environ. 2021, 264, 112611. [Google Scholar] [CrossRef]
- Hänel, A.; Posch, T.; Ribas, S.J.; Aubé, M.; Duriscoe, D.; Jechow, A.; Kollath, Z.; Lolkema, D.E.; Moore, C.; Schmidt, N.; et al. Measuring night sky brightness: Methods and challenges. J. Quant. Spectrosc. Radiat. Transf. 2018, 205, 278–290. [Google Scholar] [CrossRef]
- Yu, L.; Pan, B. Color Stereo-Digital Image Correlation Method Using a Single 3CCD Color Camera. Exp. Mech. 2017, 57, 649–657. [Google Scholar] [CrossRef]
- Bayer, B.E. Color Imaging Array. U.S. Patent 3,971,065, 20 July 1976. [Google Scholar]
- Losson, O.; Macaire, L.; Yang, Y. Chapter 5—Comparison of Color Demosaicing Methods. In Advances in Imaging and Electron Physics; Hawkes, P.W., Ed.; Elsevier: Amsterdam, The Netherlands, 2010; Volume 162, pp. 173–265. [Google Scholar]
- Burnett, C.M. A Bayer Pattern on a Sensor in Isometric Perspective/Projection; Wikimedia Commons: San Francisco, CA, USA, 2006. [Google Scholar]
- van Dokkum, P.G. Cosmic-Ray Rejection by Laplacian Edge Detection. Publ. Astron. Soc. Pac. 2001, 113, 1420–1427. [Google Scholar] [CrossRef]
- McCully, C.; Crawford, S.; Kovacs, G.; Tollerud, E.; Betts, E.; Bradley, L.; Craig, M.; Turner, J.; Streicher, O.; Sipocz, B.; et al. Astropy/Astroscrappy: v1.0.5; Zenodo: Honolulu, HI, USA, 2018. [Google Scholar]
- Niedzwiecki, M.; Rzeckia, K.; Marek, M.; Homolab, P.; Smelcerzab, K.; Castilloc, D.A.; Smolekd, K.; Hnatyke, B.; Zamora-Saa, J.; Mozgovae, A.; et al. Recognition and classification of the cosmic-ray events in images captured by CMOS/CCD cameras. In Proceedings of the 36th International Cosmic Ray Conference; Desiati, P., Gaisser, T., Karle, A., Eds.; Proceedings of Science: Madison, WI, USA, 2021. [Google Scholar]
- Widenhorn, R.; Blouke, M.M.; Weber, A.; Rest, A.; Bodegom, E. Temperature dependence of dark current in a CCD. In Proceedings of the Sensors and Camera Systems for Scientific, Industrial, and Digital Photography Applications III; Sampat, N., Canosa, J., Blouke, M.M., Canosa, J., Sampat, N., Eds.; International Society for Optics and Photonics, SPIE: Bellingham, WA, USA, 2002; Volume 4669, pp. 193–201. [Google Scholar]
- Siew, R. Breaking Down the ‘Cosine Fourth Power Law’. Photonics Online. 2019. Available online: https://vertassets.blob.core.windows.net/download/dce476fc/dce476fc-4372-41ad-a139-eab35d11ec85/03052019_rs_cos4th_final__002_.pdf (accessed on 1 May 2023).
- Deserno, M. How to Generate Equidistributed Points on the Surface of a Sphere; Technical Report; Max-Planck-Institut für Polymerforschung: Mainz, Germany, 2004. [Google Scholar]
- Cardiel, N.; Zamorano, J.; Bará, S.; Sánchez de Miguel, A.; Cabello, C.; Gallego, J.; García, L.; González, R.; Izquierdo, J.; Pascual, S.; et al. Synthetic RGB photometry of bright stars: Definition of the standard photometric system and UCM library of spectrophotometric spectra. Mon. Not. R. Astron. Soc. 2021, 504, 3730–3748. [Google Scholar] [CrossRef]
- Hertzsprung, E. Nachweis der Veränderlichkeit von α Ursae minoris. Astron. Notes 1911, 189, 89–104. [Google Scholar] [CrossRef]
- Mighell, K.J. Algorithms for CCD Stellar Photometry. In Proceedings of the Astronomical Data Analysis Software and Systems VIII; Astronomical Society of the Pacific Conference Series; Mehringer, D.M., Plante, R.L., Roberts, D.A., Eds.; Astronomical Society of the Pacific: San Francisco, CA, USA, 1999; Volume 172, p. 317. [Google Scholar]
- Bodhaine, B.A.; Wood, N.B.; Dutton, E.G.; Slusser, J.R. On Rayleigh Optical Depth Calculations. J. Atmos. Oceanic Technol. 1999, 16, 1854–1861. [Google Scholar] [CrossRef]
- Eck, T.F.; Holben, B.N.; Reid, J.S.; Dubovik, O.; Smirnov, A.; O’Neill, N.T.; Slutsker, I.; Kinne, S. Wavelength dependence of the optical depth of biomass burning, urban, and desert dust aerosols. J. Geophys. Res. Atmos. 1999, 104, 31333–31349. [Google Scholar] [CrossRef]
- Giles, D.M.; Sinyuk, A.; Sorokin, M.G.; Schafer, J.S.; Smirnov, A.; Slutsker, I.; Eck, T.F.; Holben, B.N.; Lewis, J.R.; Campbell, J.R.; et al. Advancements in the Aerosol Robotic Network (AERONET) Version 3 database—Automated near-real-time quality control algorithm with improved cloud screening for Sun photometer aerosol optical depth (AOD) measurements. Atmos. Meas. Tech. 2019, 12, 169–209. [Google Scholar] [CrossRef]
- Aubé, M.; Simoneau, A.; Muñoz-Tuñón, C.; Díaz-Castro, J.; Serra-Ricart, M. Restoring the night sky darkness at Observatorio del Teide: First application of the model Illumina version 2. Mon. Not. R. Astron. Soc. 2020, 497, 2501–2516. [Google Scholar] [CrossRef]
- Kasten, F.; Young, A.T. Revised optical air mass tables and approximation formula. Appl. Opt. 1989, 28, 4735–4738. [Google Scholar] [CrossRef]
- Rawlins, D. An Investigation of the Ancient Star Catalog. Publ. Astron. Soc. Pac. 1982, 94, 359. [Google Scholar] [CrossRef]
- Lang, D.; Hogg, D.W.; Mierle, K.; Blanton, M.; Roweis, S. Astrometry.net: Blind Astrometric Calibration of Arbitrary Astronomical Images. Astron. J. 2010, 139, 1782–1800. [Google Scholar] [CrossRef]
- Rodrigues, O. Des lois géométriques qui régissent les déplacements d’un système solide dans l’espace, et de la variation des coordonnées provenant de ces déplacements considérés indépendants des causes qui peuvent les produire. J. Math. Pures Appl. 1840, 5, 380–440. [Google Scholar]
- Virtanen, P.; Gommers, R.; Oliphant, T.E.; Haberland, M.; Reddy, T.; Cournapeau, D.; Burovski, E.; Peterson, P.; Weckesser, W.; Bright, J.; et al. SciPy 1.0: Fundamental Algorithms for Scientific Computing in Python. Nat. Methods 2020, 17, 261–272. [Google Scholar] [CrossRef]
- Kolláth, Z.; Cool, A.; Jechow, A.; Kolláth, K.; Száz, D.; Tong, K.P. Introducing the dark sky unit for multi-spectral measurement of the night sky quality with commercial digital cameras. J. Quant. Spectrosc. Radiat. Transf. 2020, 253, 107162. [Google Scholar] [CrossRef]
- Aeronet Technical Document. Lunar Aerosol Optical Depth Computation. 2019. Available online: https://aeronet.gsfc.nasa.gov/new_web/Documents/Lunar_Algorithm_Draft_2019.pdf (accessed on 1 May 2023).
Figure 1.
Processing pipeline to calibrate an image taken using a digital camera. The results of the calibrations steps are saved on file, to be reused for multiple images. The different colours indicate the various calibration steps. Processing steps, with the exception of geometric distortions and dark frame subtraction, include taking the sigma-clipped average of multiple frames.
Figure 2.
Dichroic prism system. Figure reproduced as is from [
8].
Figure 2.
Dichroic prism system. Figure reproduced as is from [
8].
Figure 3.
Ordering of the coloured filters on the imaging sensor matrix in a Bayer filter. Figure reproduced as is from [
11].
Figure 3.
Ordering of the coloured filters on the imaging sensor matrix in a Bayer filter. Figure reproduced as is from [
11].
Figure 4.
Examples of cosmic ray events in an imaging sensor. Figure reproduced as is from [
14].
Figure 4.
Examples of cosmic ray events in an imaging sensor. Figure reproduced as is from [
14].
Figure 5.
Experimental setup. The camera is pointing at the back of the tent, which is covered by black paper. The interior LEDs were dimmed using multiple layers of paper, to obtain the required illumination levels. The whole setup was covered by a blanket and the room light was closed during acquisition. We used an Amazon Basics photography tent and the Servocity PT785-S Pan & Tilt System.
Figure 6.
Comparison of the effect of focus on the stellar images. The red, green and blue points corresponds to the RGB pixels of the images on the right and the lines are a sigmoid fit. At the top, the best focus achieved. The star covers only a few pixels. In the middle, a moderate blurring, where the star covers more pixels, but there are still significant variations between values. At the bottom, the blurring used for this method, with a much more uniform distribution of values.
Figure 7.
Stellar radiance integration geometry of stellar images. The yellow area corresponds to the star, and the blue area is the zone integrated to obtain the sky background.
Figure 7.
Stellar radiance integration geometry of stellar images. The yellow area corresponds to the star, and the blue area is the zone integrated to obtain the sky background.
Figure 8.
Digital number (DN) for each pixel of the average of 10 dark images’ green band. Taken with an exposure time of 1/5 s at ISO 6400. A 25-pixel Gaussian blur was applied to further reduce the noise.
Figure 8.
Digital number (DN) for each pixel of the average of 10 dark images’ green band. Taken with an exposure time of 1/5 s at ISO 6400. A 25-pixel Gaussian blur was applied to further reduce the noise.
Figure 9.
Linearity correction factor at ISO 6400 for varying saturation fractions for two different source brightnesses, noted by the different line stroke and point style. The correction factor was obtained by dividing a linear curve normalized at a saturation of 10% by the measured values.
Figure 9.
Linearity correction factor at ISO 6400 for varying saturation fractions for two different source brightnesses, noted by the different line stroke and point style. The correction factor was obtained by dividing a linear curve normalized at a saturation of 10% by the measured values.
Figure 10.
Number of averaged frames for each pixel, when simulating a larger and more uniform flat field. Due to the blurring of the mask, some frames only contributed fractions of pixels to the average.
Figure 10.
Number of averaged frames for each pixel, when simulating a larger and more uniform flat field. Due to the blurring of the mask, some frames only contributed fractions of pixels to the average.
Figure 11.
Flat field obtained by averaging the 500 images taken inside the chamber, normalized by the maximal value in each band. The vignetting effect is clearly visible in the corners. The grey-scale appearance shows that the effect was not colour dependent. The red line shows the line along which the values are plotted in
Figure 12.
Figure 12.
Relative sensitivity along the red line in
Figure 11.
Figure 12.
Relative sensitivity along the red line in
Figure 11.
Figure 13.
Spectral response of the SONY
7s for the three colour bands (RGB). Measurements were performed by Pr. Zoltán Kolláth, according to the method described in [
30].
Figure 13.
Spectral response of the SONY
7s for the three colour bands (RGB). Measurements were performed by Pr. Zoltán Kolláth, according to the method described in [
30].
Figure 14.
Relative distribution of the correction factor for the three bands, red (R), green (G), and blue (G). The distributions were sigma-clipped with .
Figure 14.
Relative distribution of the correction factor for the three bands, red (R), green (G), and blue (G). The distributions were sigma-clipped with .
Figure 15.
Star field used for the angular calibration. The identified stars are circled in red. Taken on 18 June 2020.
Figure 15.
Star field used for the angular calibration. The identified stars are circled in red. Taken on 18 June 2020.
Figure 16.
Deviation of the apparent star position from the position expected with a perfect equiangular lens and resulting fitting equation for the star field of
Figure 15. The fit was forced to intercept at the origin. The dotted parts of the line were obtained by extrapolation of the fitted curve over the angles covered by the camera and are therefore not validated, especially for larger angles.
Figure 17.
Raw image of Timmins, ON obtained on 26 August 2019 at 05:45:01 UTC. No white balance was applied, causing the green tint. At the top of the image, we can see the airport from which the balloon was launched.
Figure 17.
Raw image of Timmins, ON obtained on 26 August 2019 at 05:45:01 UTC. No white balance was applied, causing the green tint. At the top of the image, we can see the airport from which the balloon was launched.
Figure 18.
Zoom on the city center of Timmins, ON.
Figure 18.
Zoom on the city center of Timmins, ON.
Figure 19.
Top of atmosphere green band irradiance and associated illuminance levels for the city center of Timmins.
Figure 19.
Top of atmosphere green band irradiance and associated illuminance levels for the city center of Timmins.
Figure 20.
Top of atmosphere green band irradiance and associated illuminance levels for a few residential streets in Timmins.
Figure 20.
Top of atmosphere green band irradiance and associated illuminance levels for a few residential streets in Timmins.
Figure 21.
Extent of the irradiance and illuminance images of Timmins in
Figure 19 and
Figure 20 are shown in red.
Figure 21.
Extent of the irradiance and illuminance images of Timmins in
Figure 19 and
Figure 20 are shown in red.
Table 1.
Atmospheric parameters for the two measurement nights, where is the AOD, is the Ångstrom coefficient, and p is the air pressure in kPa. Measurement altitudes were 319 m for the calibration and 251 m for and .
Table 1.
Atmospheric parameters for the two measurement nights, where is the AOD, is the Ångstrom coefficient, and p is the air pressure in kPa. Measurement altitudes were 319 m for the calibration and 251 m for and .
| Date | | | p |
|---|
| 28 October 2021 | 0.045 | 1.51 | 99.55 |
| 29 October 2021 | 0.035 | 1.40 | 99.20 |
Table 2.
RGB radiances obtained with the calibrated camera and the spectrometer in mW/m2/sr.
Table 2.
RGB radiances obtained with the calibrated camera and the spectrometer in mW/m2/sr.
| Band | R | G | B |
|---|
| 116.9 | 159.3 | 85.6 |
| 115.7 | 152.1 | 86.6 |
| Disclaimer/Publisher’s Note: The statements, opinions and data contained in all publications are solely those of the individual author(s) and contributor(s) and not of MDPI and/or the editor(s). MDPI and/or the editor(s) disclaim responsibility for any injury to people or property resulting from any ideas, methods, instructions or products referred to in the content. |
© 2023 by the authors. Licensee MDPI, Basel, Switzerland. This article is an open access article distributed under the terms and conditions of the Creative Commons Attribution (CC BY) license (https://creativecommons.org/licenses/by/4.0/).
