Article

Adaptation of a Neuro-Variational Algorithm from SeaWiFS to MODIS-Aqua Sensor for the Determination of Atmospheric and Oceanic Variables

by
Khassoum Correa
1,2,*,†,‡,
Eric Machu
1,2,‡,
Julien Brajard
3,4,‡,
Daouda Diouf
5,‡,
Saïdou Moustapha Sall
1,‡ and
Hervé Demarcq
6,‡
1
Laboratoire de Physique de l’Atmosphère et de l’Océan—Siméon Fongang, Ecole Supérieure Polytechnique, Université Cheikh Anta Diop, Dakar-Fann 5085, Senegal
2
Laboratoire d’Océanographie Physique et Spatiale, Unité Mixte de Recherche 6523, Université de Bretagne Occidentale, CNRS, IRD, Ifremer—IUEM, 29280 Plouzane, France
3
Laboratoire d’Océanographie et du Climat: Expérimentations et Approches Numériques, UMR 7159, MNHN, CNRS, SU, IRD, 75005 Paris, France
4
Nansen Environmental and Remote Sensing Center, 5007 Bergen, Norway
5
Laboratoire de Traitement de l’Information, Ecole Supérieure Polytechnique, Université Cheikh Anta Diop, Dakar-Fann 5085, Senegal
6
MARine Biodiversity, Exploitation and Conservation, IRD, IFREMER, CNRS, Université Montpellier, 34200 Sète, France
*
Author to whom correspondence should be addressed.
Current address: Laboratoire d’Océanographie Physique et Spatiale, Rue Dumont Durville, IUEM Bâtiment D, 29280 Plouzane, France.
These authors contributed equally to this work.
Remote Sens. 2023, 15(14), 3613; https://doi.org/10.3390/rs15143613
Submission received: 27 May 2023 / Revised: 7 July 2023 / Accepted: 14 July 2023 / Published: 20 July 2023
(This article belongs to the Section Biogeosciences Remote Sensing)

Abstract

:
The Sahara desert is a major global source of dust that is mostly transported southwest over the ocean off West Africa. The presence of this dust impacts the remote sensing of ocean surface properties. These aerosols have absorbing properties that are poorly accounted for in the standard ocean color data processing algorithm. This can result in an overestimation of the atmospheric contribution to the ocean color signal and consequently an underestimation of the oceanic contribution. A two-step algorithm initially applied to the Sea-viewing Wide field-of-view Sensor (SeaWiFS) data was adapted to the Moderate Resolution Imaging Spectroradiometer (MODIS-Aqua) sensor in the Northwest African region. The Northwest African region is a very productive region, where pelagic resources are an important socio-economic sector. Improving atmospheric correction of ocean color products is, thus, of particular interest for this oceanic region. The two-step approach of classifying the top-of-atmosphere radiance spectra for a better estimate of aerosol type on the one hand, and using an optimization method to fit the parameters of these aerosols and chlorophyll-a concentration (Chla) on the other hand, allows for a better representation of the optical thickness, a correction of the marine reflectance spectrum, and an increase in the spatio-temporal coverage of the area. To the extent that the properties of the water color signal are improved by this data processing, the Chla estimates should also be improved by this approach. However, it is difficult to conclude on this point from the available in situ observations.

1. Introduction

A first large-scale sampling of Chla at the surface of the ocean was made possible in 1978 with the Coastal Zone Color Scanner (CZCS), the first instrument devoted to the measurement of ocean color onboard a spacecraft [1]. After a ten-year gap in ocean color, the JAXA Japanese Ocean Color Temperature Scanner was launched in 1996 followed by the NASA SeaWiFS in September 1997. Contiguous ocean color era was then applied with a succession of missions of one-off instrument. The NASA MODIS-Aqua instrument was launched in 2002 and has provided daily coverage since [2].
The ocean color signal emerging from the sea is a small portion (<10%) of the satellite-detected top-of-atmosphere (TOA) radiance, because sensors also receive light scattered by different components of the atmosphere (e.g., [3]). Highly accurate atmospheric correction schemes are, thus, needed to retrieve the water signal [4]. A major limitation of standard algorithms remains the determination of absorbing aerosol’s contribution. Aerosol is a gaseous suspension of fine solid or liquid particles that can both absorb and diffuse light. The absorption of an aerosol depends on its composition, often parameterized via its particle size distribution and refractive index [5]. Absorbing can reach up to about 30% of the solar irradiance [6] in both visible and infrared domains, modifying in particular the earth radiation budget [7,8].
The Sahara desert is the world largest source of mineral aerosols, representing almost 40% of overall natural emissions (e.g., [9]). These absorbing aerosols can be transported over considerable distances in the atmosphere (e.g., [10,11,12]) and primarily over the West African coast at different altitudes according to the season or the synoptic situation [13,14]. Desert dust is present over the ocean off Mauritania and Senegal up to 50% of the time [15]. Dust aerosols are, thus, of particular relevance in the processing of the ocean color signal over West African continental margins.
The general approach of the atmospheric correction algorithm is to use spectral bands for which the water-leaving reflectance is known to make an assessment of the aerosol contribution [16,17]. As water-leaving reflectance is essentially zero for near-infrared (NIR) bands, these bands are used to assess the aerosol properties. Gordon and Wang [16] highlighted two concerns in applying the older CZCS atmospheric correction algorithm to the more sensitive sensors of the new generation: first, there is the extrapolation of the spectral variation of the aerosol reflectance from the NIR into the visible; second, there is the influence of multiple scattering. In [16], the authors proposed a new algorithm that utilizes the NIR bands of SeaWiFS (centered at 765 and 865 nm) and MODIS (748 and 869 nm) for atmospheric correction. The basic principle of [16] is formulated based on the single-scattering theory. In the single-scattering scenario, where photons undergo only one scattering event, the reflectance resulting from the interaction between Rayleigh and aerosol scattering (such as photons being successively scattered by air and then by aerosols, or vice versa) is negligible and can be disregarded, provided that multiple scattering is minimal. This condition holds true for small values of Rayleigh and aerosol optical thicknesses, specifically 0.3, as defined in the current OBPG algorithm [18]. The underlying hypothesis of [16] is that if the atmospheric correction parameter between the two spectral bands falls between two aerosol models, then the aerosol contribution to the reflectance will fall between the same two models in the same proportion as this atmospheric correction parameter. Multiple-scattering effects are then added via numerical models using the guidance of the single-scattering theory. NASA’s current standard algorithm (STD) [2,18], which produces MODIS level 2 data, is based on [16], although the original aerosol models and look-up tables of the optical effect of aerosols on the radiance distribution have been updated [19]. The aerosol models used to make up these LUTs partition particles from fine to coarse are based on the Angström exponent, which is inversely proportional to particle size. LUTs are built for ten aerosol types and eight types of relative humidity, i.e., 80 tables. These models, however, cannot account for the presence of strongly absorbing aerosols, whose ability to absorb short wavelengths of the solar spectrum (violet, blue, and green) is potentially highly variable. The STD algorithm can, therefore, render a weak marine signal at blue wavelengths, due to subtracting too much aerosol signal from sensor measurement.
Machine-learning methodologies have also been applied to satellite data to overcome the remaining issues to better estimate water quality parameters. Hassan and Woo [20] carried out a systematic review in peer-reviewed literature from 2001 to 2021 and identified 113 eligible studies, from which Chla, temperature, salinity, colored dissolved organic matter, suspended solids, and turbidity represent the water quality parameters extracted through various machine-learning techniques from satellite data. Approaches based on data assimilation principle have been developed on SeaWiFS and MERIS (Medium Resolution Imaging Spectrometer) to better take into account absorbent aerosols in atmospheric correction [21,22,23,24,25]. Diouf et al. [26] proposed a two-step algorithm for retrieving and monitoring the concentration of Saharan dusts for sea-surface Chla retrieval from SeaWiFS multi-spectral observations. The first step consists of classifying the TOA reflectance spectra and geometric angles simultaneously, using a neuronal classifier, which provides the aerosol type and a first-guess value of the aerosol parameters. A variational method then allows to retrieve accurate measurements of the aerosol, and hence, Chla. More recently, Song et al. [15] analyzed the effects of the vertical distribution of different absorbing aerosols on the TOA reflectance and the retrieved water-leaving radiance quantitatively. In most current atmospheric correction algorithms, it is assumed that the layer of aerosols is either located below the layer of molecules (a two-layer atmosphere) or that aerosol concentration decreases with altitude according to an exponential distribution. Such treatment may lead to underestimation of the retrieved water-leaving radiance over coastal waters with strongly absorbing aerosols, particularly in the short blue bands. Song et al. [15] developed a new aerosol classification algorithm for obtaining the optical models of absorbing aerosols over the ocean. They showed that not considering absorbing aerosols during atmospheric correction might produce 4 to 10% errors in the water-leaving radiance retrieval at 412 nm over turbid waters. The results also showed that the influence of the vertical distribution on the TOA radiance could be up to 8% for dust and 10% for fine-dominated absorbing aerosols, which was comparable with the influence of aerosol optical thickness.
The Canary Upwelling System along the West African coast is one of the most productive oceanic regions, where fishing activities are a key socio-economic sector. Because the quality of atmospheric corrections is a key point in the precise determination of Chla, and therefore, the estimation of the whole primary productivity of the system, their correct quantification is of particular interest for this oceanic region. The study presented here is an adaptation of the atmospheric correction scheme of [26] for MODIS-Aqua data. Data and methods are described in Section 2, while the ability of this methodological approach to define the AOT, to improve the reflectance spectra, and thus, to better estimate surface Chla, is described in Section 3. A discussion is proposed in Section 4.

2. Material and Methods

2.1. MODIS-Aqua Standard Data

MODIS-Aqua L2 data from 2003 to 2018 (16 years) covering the southern part of the Canary Upwelling System (9–23°N and 13–30°W) are used in this study for comparison with the processing proposed in the present study. These data and associated information are available from NASA’s Ocean Color website (https://oceancolor.gsfc.nasa.gov/, last access 6 April 2020) and are called standard data (hereafter STD). STD data have a spatial resolution of 1 km at the nadir. The satellite follows a Helio-synchronous quasi-polar orbit allowing a full view of the Earth’s surface in less than two days [2,27]. The atmospheric correction algorithm of [18] is used to generate MODIS-Aqua Level 2 (L2) products. The different contributions to the TOA radiance ( L t ) can be broken down as in [28]:
L t ( λ ) = [ L r ( λ ) + L a ( λ ) + t d v ( λ ) L f ( λ ) + t d v ( λ ) L w ( λ ) ] t g v ( λ ) t g s ( λ ) f p ( λ )
where L r is the radiance contribution of Rayleigh scattering by air molecules, L a is the contribution of aerosol scattering, including multiple scattering interactions with air molecules, L f is the radiance contribution from surface whitecaps and foam, L w is the water-leaving radiance at sea surface, t d v is the transmittance of diffuse radiation from the sea surface to the sensor, t g v is the transmittance of to absorbing gases for all upwelling radiations traveling along the sensor view swath, t g s is the transmittance of downwelling solar radiation by absorbing gases up to the sea surface, f p is an adjustment for polarization effects, and λ is the wavelength. Most of the terms of Equation (1) are estimated from radiative transfer codes using ancillary data (wind speed, atmospheric pressure, water vapor, etc.). For the estimation of aerosol and marine contributions, the standard algorithm offers two cases (see [5] for details):
For clear oceanic waters (case 1), the marine signal is assumed to be negligible in the NIR spectral domain (dark pixel method [16]), which allows to quantify the contribution of aerosols in the NIR. The spectral difference estimated at 748 and 869 nm (NIR MODIS wavelength) allows to select the two most suitable aerosol models that will be used to estimate the signal attributed to aerosols in the visible bands and to deduce the marine contribution.
When the marine signal is not negligible in the NIR (case 2 waters), the iterative method of [29] is applied to simultaneously compute the aerosol contribution and the marine reflectance.
Marine radiance L w is then used to calculate marine reflectance ρ w or its equivalent, remote sensing reflectance ( R r s ), and Chla as follows:
R r s ( λ ) = L w ( λ , θ s , θ v , φ ) F o ( λ ) f s cos ( θ s ) t d s f b ( λ ) f λ
log 10 ( C h l a ) = a 0 + i = 1 4 a i log 10 m a x R r s ( λ b l e u ) R r s ( λ g r e e n ) i
where a i refers to MODIS parameters for OC3M algorithm, θ s and θ v are, respectively, the solar zenith angle and the sensor’s viewing angle, ϕ is the azimuthal angle, F 0 and f s are the extraterrestrial solar irradiance and its adjustment factor, respectively, f b and f λ are, respectively, correction factors for bidirectional effect and out-of-band response, and t d s is the transmittance of diffuse radiation through the atmosphere in the viewing path from Sun to surface. For ocean and shelf waters, the most common Chla algorithms are band ratios of blue-green wavelengths constructed by regression of in situ observations. The λ b l u e corresponds to either 443 or 488 nm, i.e., the MODIS wavelength in the blue domain of the light spectrum, whereas λ g r e e n corresponds to 547 nm.

2.2. SOM-NV Processing of MODIS-Aqua Data

Equation (1) can be written in terms of reflectance ρ , to reduce the effects of solar illumination and measurement geometry [16]:
ρ t ( λ ) ρ R ( λ ) T ρ g ( λ ) t ρ W C ( λ ) = [ ρ a ( λ ) + ρ R a ( λ ) ] + t ρ w ( λ )
The terms on the left-hand-side in Equation (4) are known with good accuracy for diffuse transmittance t [30,31], Rayleigh scattering ρ R [31], glitter ρ g [32], and whitecaps effects ρ W C [33]; see also [18] for more details. NASA has made available a Multi-Sensor Level-1 to Level-2 (MSL12) tool for atmospheric correction (l2gen contained in the SeaDAS software), which compute the different terms of Equation (4). We used the standard l2gen process (see SeaDAS 7.5.3 version) to generate the various left terms and partially correct the satellite measurement, which now depends only on aerosols ( ρ A = ρ a + ρ R a ) and marine ( t ρ w ) terms for each wavelength:
ρ c o r ( λ ) = ρ A ( λ ) + t ρ w ( λ )
where ρ A is the atmospheric reflectance due to aerosols as well as due to molecule-aerosol diffusion and ρ c o r is the quantity we seek to estimate from the approach [26], here applied to MODIS, whose sensor’s wavelengths are close to the SeaWiFS spectral bands (Table 1).

2.2.1. Algorithm Description

SOM-NV is a two-steps algorithm that uses two different statistical models applied sequentially: the Self-Organizing Map (SOM) and the NeuroVaria method. SOM is an unsupervised learning classification model [34]. It is well suited for visualizing and clustering high-dimensional datasets.
NV is a variational inversion allowing the retrieval of accurate optical thickness and ocean surface Chl. NV is based on an iterative method described in [22,35,36]. It uses a neural network family called MultiLayer Perceptron (MLP), allowing the retrieval of accurate oceanic and atmospheric constituents. One of the great difficulties of this method is to find the accurate input parameters (for the atmosphere and for the ocean), which allow to minimize the cost function. In basic versions of NV, a dedicated MLP inverts the signal from the PIR to determine the input parameters for aerosols, while they are arbitrarily fixed for the ocean.
Two datasets are used for the SOM-NV algorithm: D a t a o b s and a synthetic expert data ( D a t a e x p e r t ), both composed of the reflectance and geometry variables. Reflectance is given at eight wavelengths for SeaWiFS and seven for MODIS (Table 1) and for two angles: the sun zenith angle θ s and the scattering angle γ , defined as follows:
γ = arccos ( cos θ v cos θ s + sin θ v sin θ s cos ( Δ ϕ ) )
where Δ ϕ = ϕ s ϕ v and ϕ s and ϕ v are the solar and sensor azimuthal angles, respectively. The collection of these nine-dimensional vector (7 reflectances + 2 angles) constitutes the observation dataset defined as D a t a o b s . D a t a e x p e r t includes three additional geophysical variables, i.e., the type of aerosol, the AOT, and Chla. This database contains nearly 12,000,000 simulations using the two-layer radiative transfer code of [16], eight SeaWiFS bands, the two angles, and aerosol models. Aerosol models are composed of one absorbing aerosol (African dusts [37]) and four non-absorbing aerosols (maritime, oceanic, coastal, and tropospheric [38]) computed at four different relative humidity (70%, 80%, 90%, and 99%). The size distribution of particles used in SOM-NV follows Junge’s law, as described in [39]. The Angström coefficient, which allows the determination of the AOT, depends on a parameter whose wide variation (from 2 to 4.5) allows to take into account more absorbent aerosols than in the STD processing. D a t a e x p e r t was used to retrieve the aerosol type and the AOT and Chla values and constitutes what will be called the Look-Up Table (LUT).
A set of one-year data ( L e a r n o b s ) is used to train SOM and build a SOM-Angle-Spectrum (SOM-A-S) map. The vectors of the learning dataset are then organized into 600 clusters (20 × 30 neurones), allowing a highly discriminative representation of the data.
D a t a o b s and D a t a e x p e r t (representing the expertise whose associated parameters or labels—Chla, AOT, and aerosol type—are known), are used to label the 600 clusters of SOM-A-S. A labeling of SOM-A-S has evolved since [23]. It is now based on the simultaneous projection of reflectance and angles described in [26]. At the end of this labeling phase, each cluster of SOM-A-S map has captured a set of “expert reflectance” ( ρ e x p ) and takes the corresponding label. In [26], this label is used as input parameters (first-guess) of MLPs.
The second statistical model analyze a satellite observation by projecting the nine-component vector (reflectance and geometry) associated with each pixel on the labeled SOM-A-S map. Pixels belonging to a given cluster are assigned to the Chla, the aerosol type, and optical thickness associated with this cluster. These first guesses are retrieved by the MLPs to start the iterative procedure. The MLPs compute ρ c o r s i m to be compared to ρ c o r o b s for a pixel. NV minimizes iteratively a weighted quadratic cost function J by adjusting geophysical variables to fit the observed reflectance [22]. Given that the terms in Equation (5) are represented by neural networks, the cost function J is fully differentiable and a gradient descent algorithm is used to minimize J. The different steps of the NV algorithm are compiled in the Yao software [24], which works autonomously and saves computation time.
At the end of the minimization, the AOT and an estimation of the three terms in Equation (5) is available for each pixel, including ρ w . Finally, Chla is re-computed using OC3M. It has been discussed in [26] that recomputing Chla by inverting ρ w was more accurate (and better represents the variability) than using the raw value of Chla determined during the minimization process.

2.2.2. Adaptation to MODIS Data

The SOM-NV algorithm is then adapted to MODIS measurements. Seven of the eight SeaWiFS spectral bands are close to those of MODIS (see Table 1). The SeaWiFS sensor crosses the Equator at 12:00 in a descending mode, whereas MODIS crosses it at 13:30 in an ascending mode. See more information on the NASA Ocean Color (https://oceancolor.gsfc.nasa.gov/ accessed on 17 February 2023). The two angles and seven reflectances measured on board MODIS are then projected onto the clusters defined in SOM-A-S. Since different conventions apply to SeaWiFS and MODIS, we modify the azimuthal angle of MODIS ( Φ = 180 Φ ). This adaptation also implies that:
  • The 510 nm band used by SOM-A-S (finding no equivalent on MODIS sensor) is replaced by the 531 nm during the projection of the image;
  • The 765 nm wavelength column of SeaWIFS is replaced by a null vector;
  • F 0 values are taken from the version 7.5 of SeaDAS software to remain in the same standard as SeaWiFS.
According to the methodology described in the previous section, each pixel of the image is associated with a cluster for which the corresponding atmospheric and oceanic variables are known. Finally, we project the portion of each swath contained in our domain on a fixed grid of 1/96 degrees resolution (1.1 km). The variables saved in the SOM-NV archive of MODIS-Aqua are reflectance, AOT at 869 nm, and Chla and geographical coordinates for each pixel.

2.2.3. Coverage Calculation

The percentage of coverage for a daily image ( C o v j r ) was defined as the number of valid pixels (containing a valid Chla; n P C h l a ) divided by the total number of marine pixels ( n P T ):
C o v j r = n P C h l a n P T
Valid Chla is kept in the range 0.001–20 mg·m 3 in order to avoid case-2 coastal waters that could be influenced by other optically active substances (resuspended mineral matter and colored substances resulting from earth leaching and anthropogenic activity). Note that our area of study, which borders the arid regions of eastern Sahel, is rarely subject to important runoffs from the continent or estuaries.

2.2.4. In Situ Data

AERONET Data

NASA has commissioned a network of stations called AERONET (for AErosol RObotic NETwork) to assess aerosols by measuring optical thickness, using ground-based photometers [40]. Although most of these data are located on the mainland, coastal stations can serve to validate AOT given by the water color algorithms. In this study, we used data from two AERONET stations: Mbour (14.394°N, 16.959°W) and Cabo Verde (16.733°N, 22.935°W). We used the version 3 of the 2018 reprocessed L2 data ([41]; https://aeronet.gsfc.nasa.gov/new_web/aerosols.html accessed on 17 February 2023). The L2 data are automatically cloud cleared and quality assured with pre-field and post-field calibration applied. Measurements are made at noon local time; daily observations are used here for comparison with SOM-NV MODIS estimates, and only common dates are considered. MODIS AOT was calculated by taking the mean value in a 10 km radius around AERONET stations.

HPLC Data

Pigment concentration data of surface waters were collected during field surveys UPSEN-1 (7–17 March 2012; https://doi.org/10.17600/12020010), UPSEN-2 (21 February–3 March 2013; https://doi.org/10.17600/13110020), ECOAO (5–20 March 2013; https://doi.org/10.17600/13110030), AWA (24 February–14 March 2014; https://doi.org/10.17600/14001400), and MiniSCOPES 2015 (23–26 November) and 2017 (29 November–2 December). Pigment concentration is obtained from the High Performance Liquid Chromatography (HPLC) method, which is a technique of analytical separation of molecules present in a complex mixture. Depending on organic matter concentration, one to two liters of sea water were filtered onto 25 mm Whatman GF/F filters stored at −80 °C for later analysis. The pigments were separated and quantified according to the method described by [42], adapted from [43]. The analysis was performed with a complete Agilent Technologies system comprising LC ChemStation software. After extraction in methanol, samples were injected on a C8 Zorbax Eclipse XDB column (3 × 150 mm; 3.5 μ m particle size). Pigment concentrations were calculated from the peak areas with external calibration standards, which were provided by DHI Water and environment (Denmark).

Multispectral Fluorometer Data (FluoroProbe)

The bbe Moldaenke FluoroProbe (hereafter FP) is a multispectral fluorometer which illuminates a sampling chamber at six different wavelengths centered at 370, 470, 525, 570, 590, and 610 nm. Emission fluorescence is measured at 680 nm. The sequential and differentiated illuminations provide a fluorescence spectrum used to differentiate four algae groups: green, brown, and blue-green algae, and cryptophytes [44]. The 370 nm LED is used to evaluate and correct the contribution of yellow substances to the fluorescence signal. The inversion of this information to determine the Chla contribution for each algal group is detailed in [44]. FP data were collected continuously (3 s interval) at the surface along the tracks of MiniSCOPES 2015 and 2017. Data are averaged over a radius of 1 km around the position of the satellite pixels to be compared with estimates produced by SOM-NV and STD.

3. Results

3.1. Aerosol Optical Thickness Derived from the SOM-NV Algorithm

Diouf et al. [26] showed that the SOM-NV algorithm applied to SeaWiFS provided a better estimate of AOT than the STD processing (better correlation coefficient) using two stations of the AERONET observation network in Mbour and Cabo Verde. We also evaluated the MODIS AOT estimates made from the STD and SOM-NV processing for these two coastal stations: Mbour, which is located on “la petite côte” of Senegal, and Cabo Verde, which is located in an open oceanic region (Figure 1). In total, 1435 (261) and 1690 (181) collocated retrievals are used for SOM-NV (STD) over the 16-year dataset at Cabo Verde and Mbour, respectively. As for SeaWiFS, absorbing Saharan dusts are generally characterized by high AOT, which are not decoded by the STD MODIS algorithm (threshold for the dust mask set at 0.30). The AOT values retrieved by SOM-NV are consistent with the AERONET estimates, both in Mbour (Figure 1) and Cabo Verde (Figure 1b,c), with a coefficient of determination of 0.423 (p-value = 1.57 × 10 203 ) and 0.446 (p-value = 4.17 × 10 186 ) for Mbour and Cabo Verde, respectively. At the opposite end, weak and insignificant relation was found between collocated STD and AERONET AOT estimates: R = 0.010 (p-value = 0.189) for Mbour and R = 0.002 (p-value = 0.478) for Cabo Verde. The regression lines shown in Figure 1 indicate that both products tend to overestimate AOT values < 0.15 for STD and <0.35–0.4 for SOM-NV, and to underestimate higher values. The flat or descending regression of the SOM-NV product nevertheless underlines the poor ability of STD processing to restore AOTs in this oceanic region.
The average monthly distribution over the 16 years of study (2003 to 2018) shows a seasonality of AOT for which AERONET and SOM-NV are in agreement Figure 1c. The end of the dry season (June) is associated with maxima of AOT, while the lowest AOT values are encountered between November and February. For SOM-NV, season-by-season correlations are highest in winter and lowest in spring (Table 2). AOT estimates from STD processing are much less well correlated with AERONET AOTs, with the exception of summer, when correlations are close.

3.2. Improved Data Coverage

Diouf et al. [26] showed that the dust classification provided by SOM-A-S (first step of SOM-NV) is in agreement with the AERONET measurements of the Angström coefficient and was capable of determining different types of aerosols and dust in particular (e.g., Figure 5d in [26]). This implies that SOM-NV better characterizes the optical effects of desert dust particles, which represent a large proportion of the absorbing aerosols in our study region [15]. The improvement in AOT estimation results from the better determination of aerosol types. As shown in the previous section, the SOM-NV algorithm applied to MODIS-Aqua also better estimates AOT. For instance, on the image of 4 January 2003 (Figure 2), SOM-NV processing allows us to recover 86% of data (compared with 40% for STD), with a clear spatial separation between Saharan dust and the opaque cloud cover. Note however that a consequence of the presence of turbid waters in coastal subdomains (for example Banc d’Arguin—between 20° and 21°N—in Figure 2d) is an overestimation of the contribution of aerosols, since these waters reflect NIR wavelengths, and this contribution is inadequately considered to be of atmospheric origin.
In (Figure 3), we compare the distribution of Chla corresponding to the pixels that are processed by both the SOM-NV and STD (Figure 3c) with the pixels that are processed by SOM-NV only (Figure 3b). It appears that these distributions are not significantly different (chi-square statistic of 8.6 × 10 3 , p-value = 0.25). Each distribution is also close to the overall distribution of the SOM-NV map of 4 January 2003 (Figure 3a). This means that the Chla of pixels masked in STD processing are consistent with the values of those not masked, and that SOM-NV processing reliably recovers data not considered by STD processing. SOM-NV processing applied to 16 years of MODIS data (2003–2018) has increased the data coverage over the southern Canary Upwelling System (Figure 4). Whereas the standard processing exhibits a maximum coverage of 20% off Cape Blanc, SOM-NV shows an average annual coverage of more than 40% for the same area. The percentage of data recovered is, however, not homogeneous in space and time (Figure 4). Altogether, the increase in the data coverage varies between 150% and 400%, respectively, in the north-west and south-east corner of our domain. These results, thus, confirm the capacity of the SOM-NV method to strongly improve data coverage in the presence of Saharan dust.
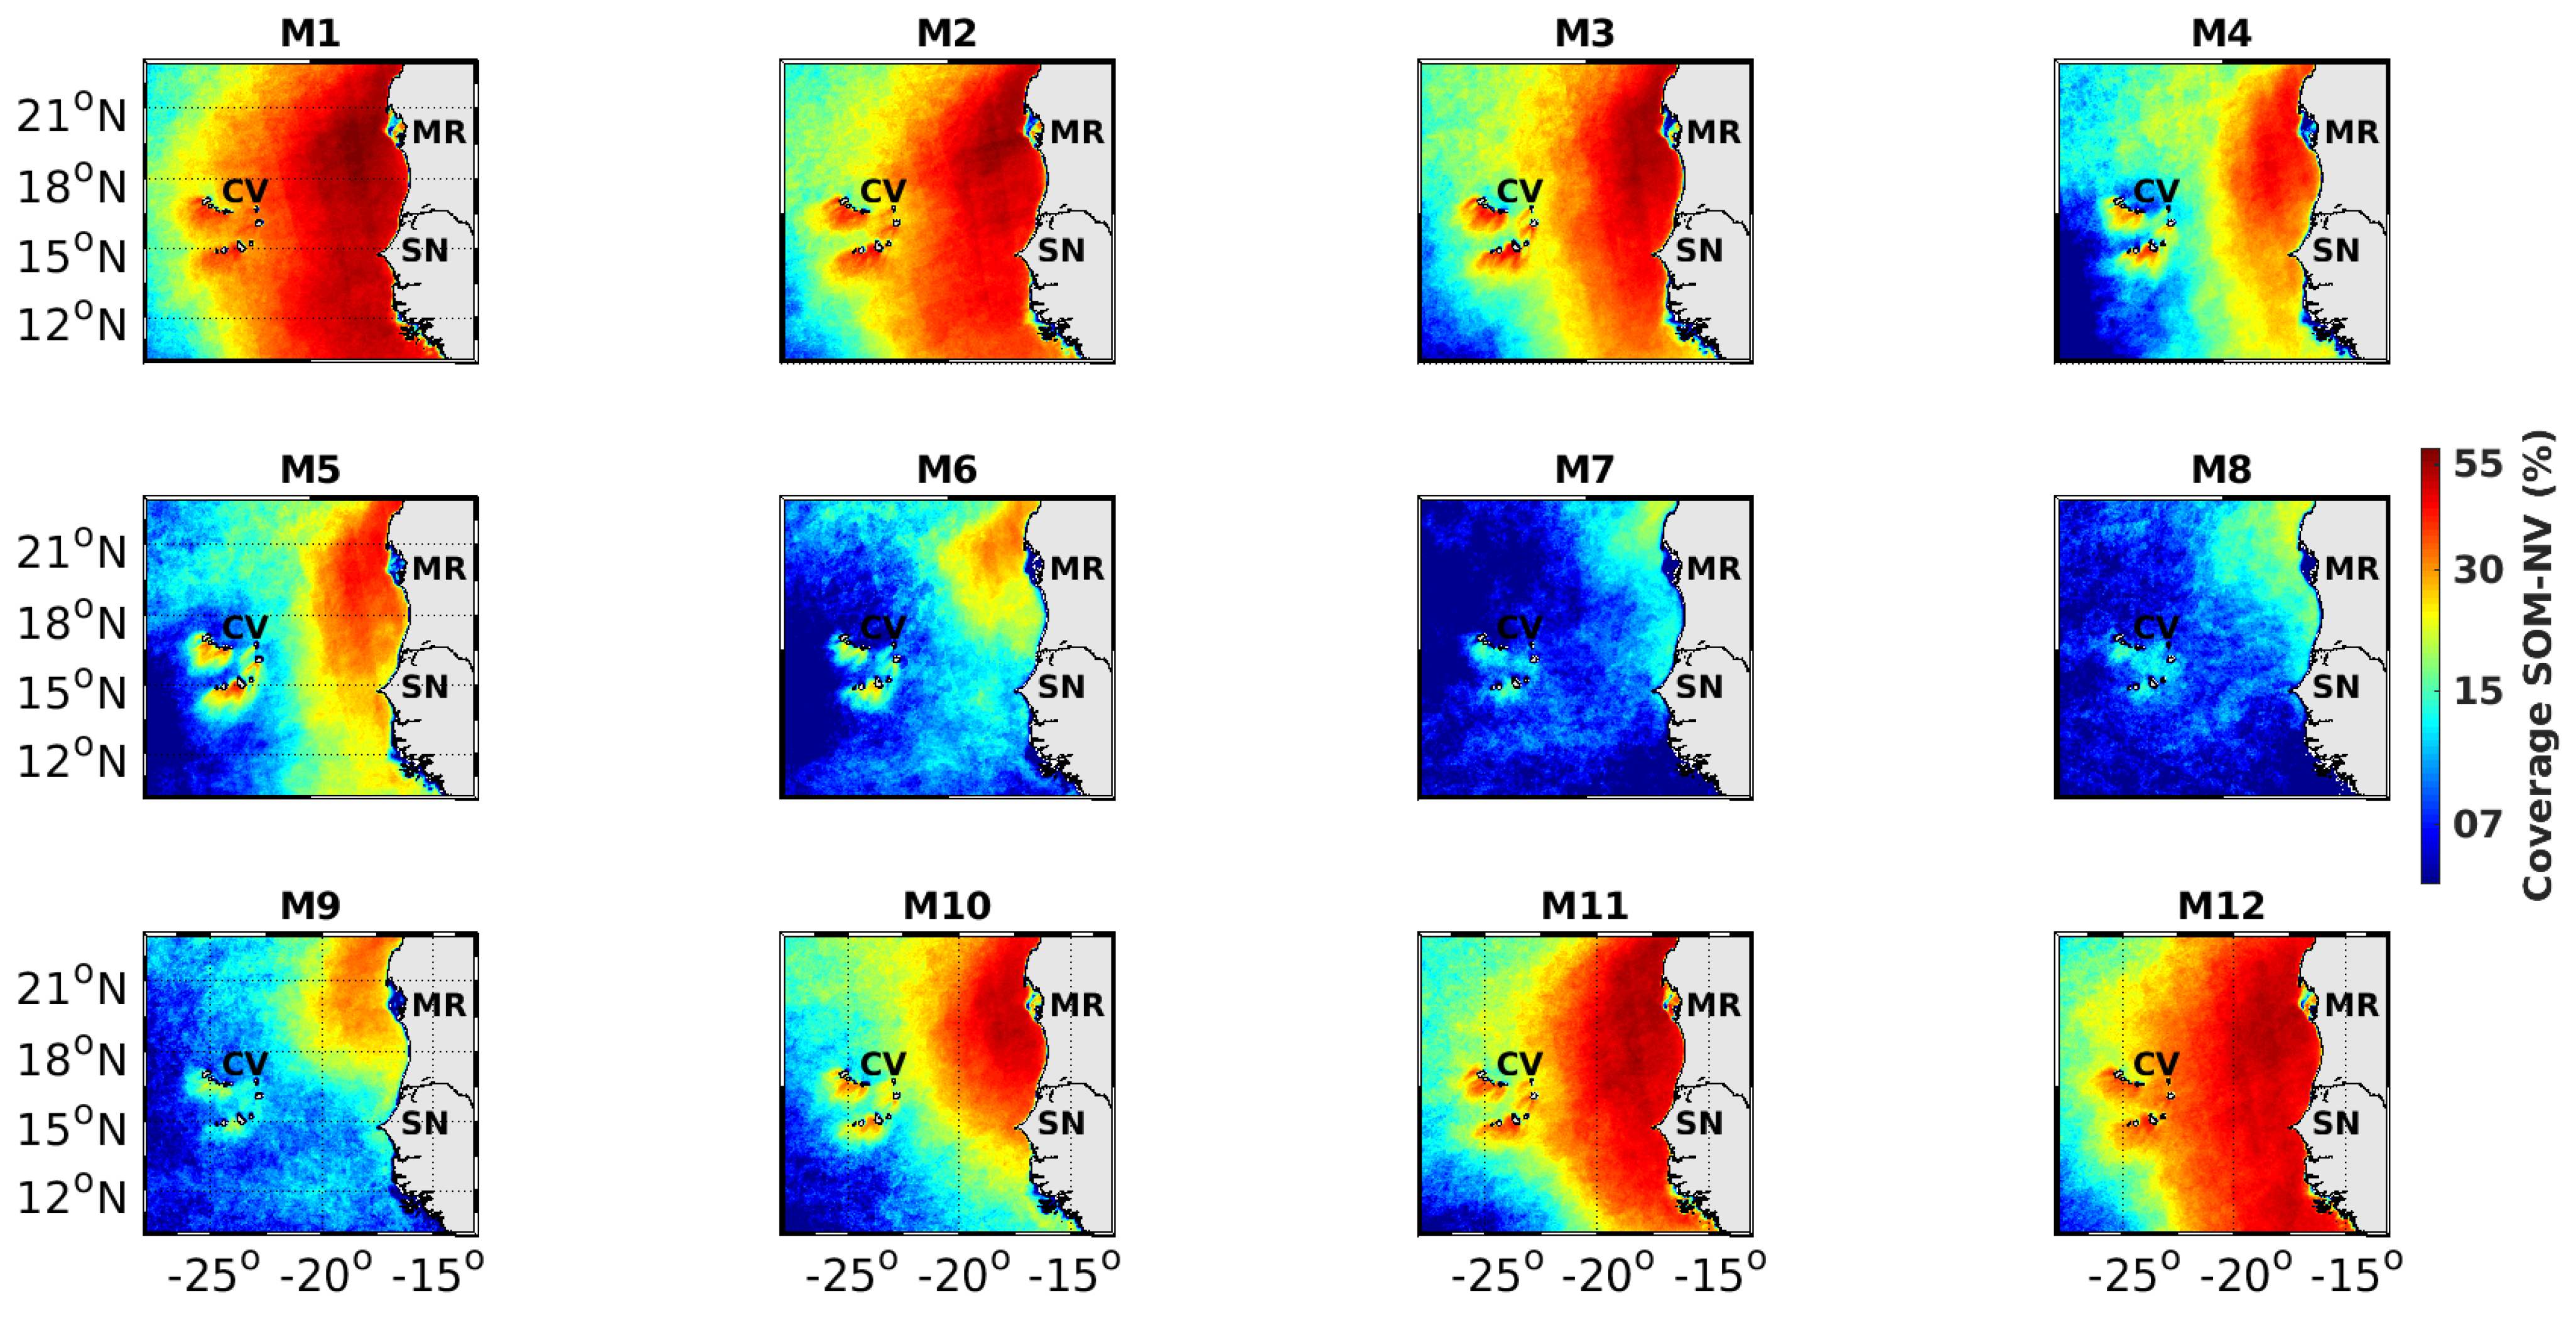
This West African region is characterized by the asymmetric alternation of a dry season (late autumn to late spring) and a rainy season (summer to early autumn). This alternation is related to the position of the Inter Tropical Convergence Zone (ITCZ), which migrates to the latitude of Senegal at the beginning of boreal summer (June). For the entire domain, maximum coverage of around 50% and 15–20% is achieved in January–February for the SOM-NV and STD processing, respectively (Figure 4a). This north–south variability could be explained by the physical effects of the ocean (Figure A1a) and observation constraints (Figure A1b), which seem to show the same meridional trend. The coverage minima correspond to the monsoon season (July–August; 10% and 5%, respectively), during which the ITCZ is at its northern extent and covers the region with clouds. The seasonal northward (southward) migration of the ITCZ from April to August (September to November) is clearly evident in the monthly coverage maps (Figure A2). The improvement of the coverage between SOM-NV and STD processing is best from November to March when aerosols are dominated by desert dust contained in the lower atmospheric boundary layer [14].

3.3. Improving Reflectance Spectra

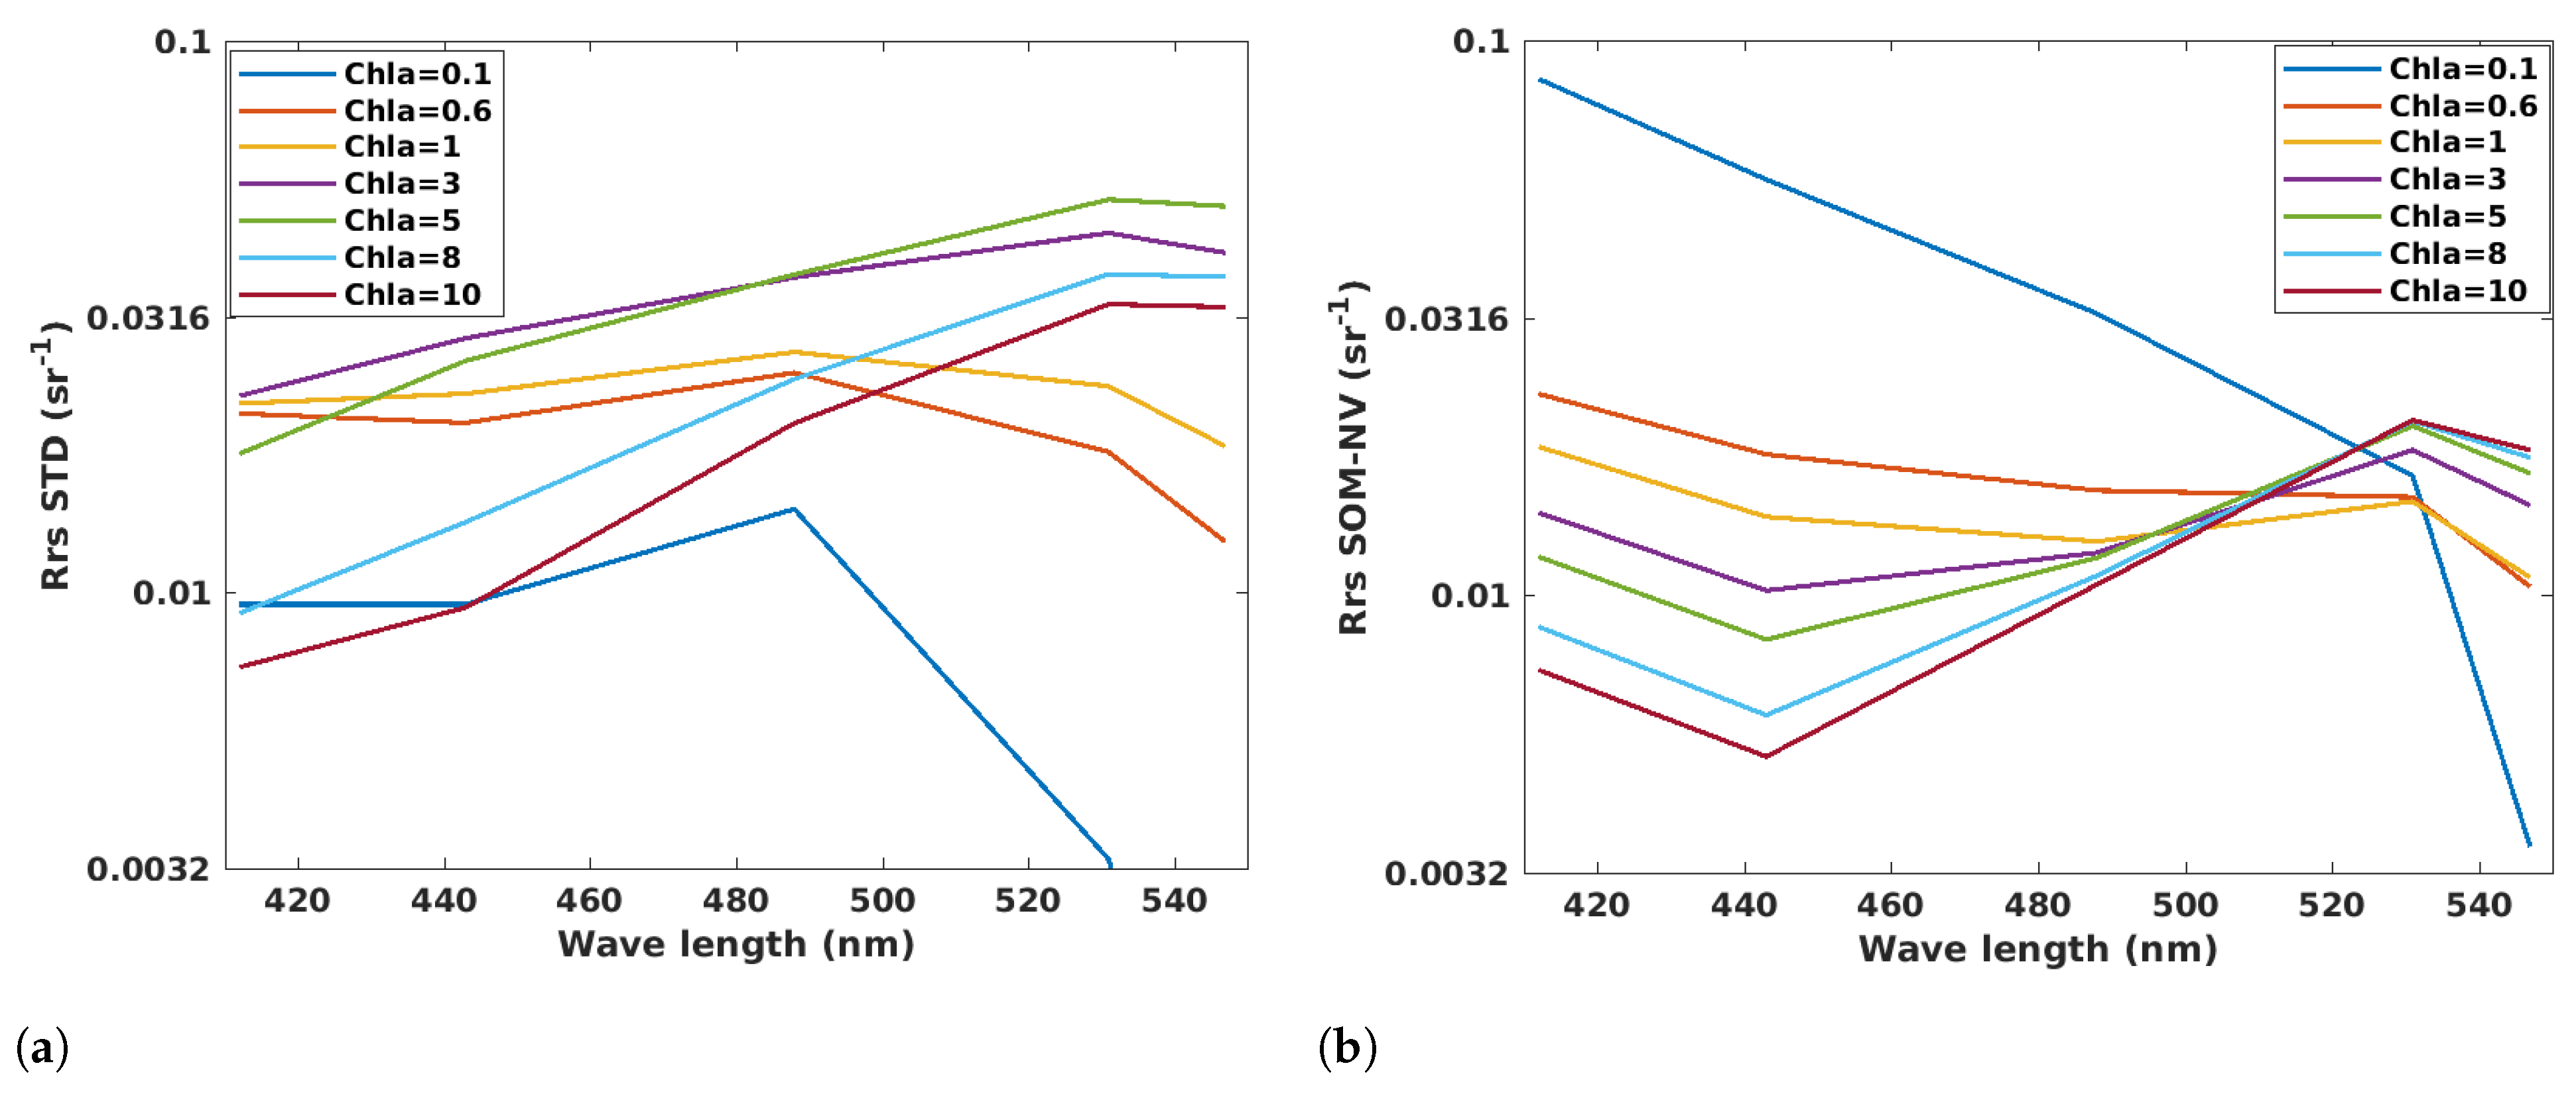
Chla differ between the SOM-NV and the STD processing, but all the small scale structures (filaments, eddies, rib-width gradient) remain identical (Figure 2). The shape of the reflectance spectrum in the visible range, especially of the three wavelengths used to estimate the Chla (Equation (3)), differs very significantly between both processing (Figure 5). Chla is known to reflect the signal in the green wavelengths, and to absorb in the blue. Thus, a lower reflectance at 412 nm (blue) and a higher reflectance at 547 nm (green) is expected when waters contain higher Chla (e.g., coastal areas or upwelling region). It decreases when we move from the coast to the open ocean. The open ocean is assumed to have a contrary distribution. Moreover, the change in reflectance within each wavelength is supposed to be gradual (e.g., [18,45,46]), and related to changes in the optical properties of seawater [5,46,47,48]. The coherency is verified for SOM-NV processing, whereas the STD processing displays fundamental incoherences to this scheme. Faced with such a response of the reflectance spectrum in STD processing, one can expect a biased estimate of Chla in surface waters of this coastal region of the global ocean affected by the presence of desert dust.

3.4. Consequences on Chla Estimates

Validation of Chla Estimated by SOM-NV

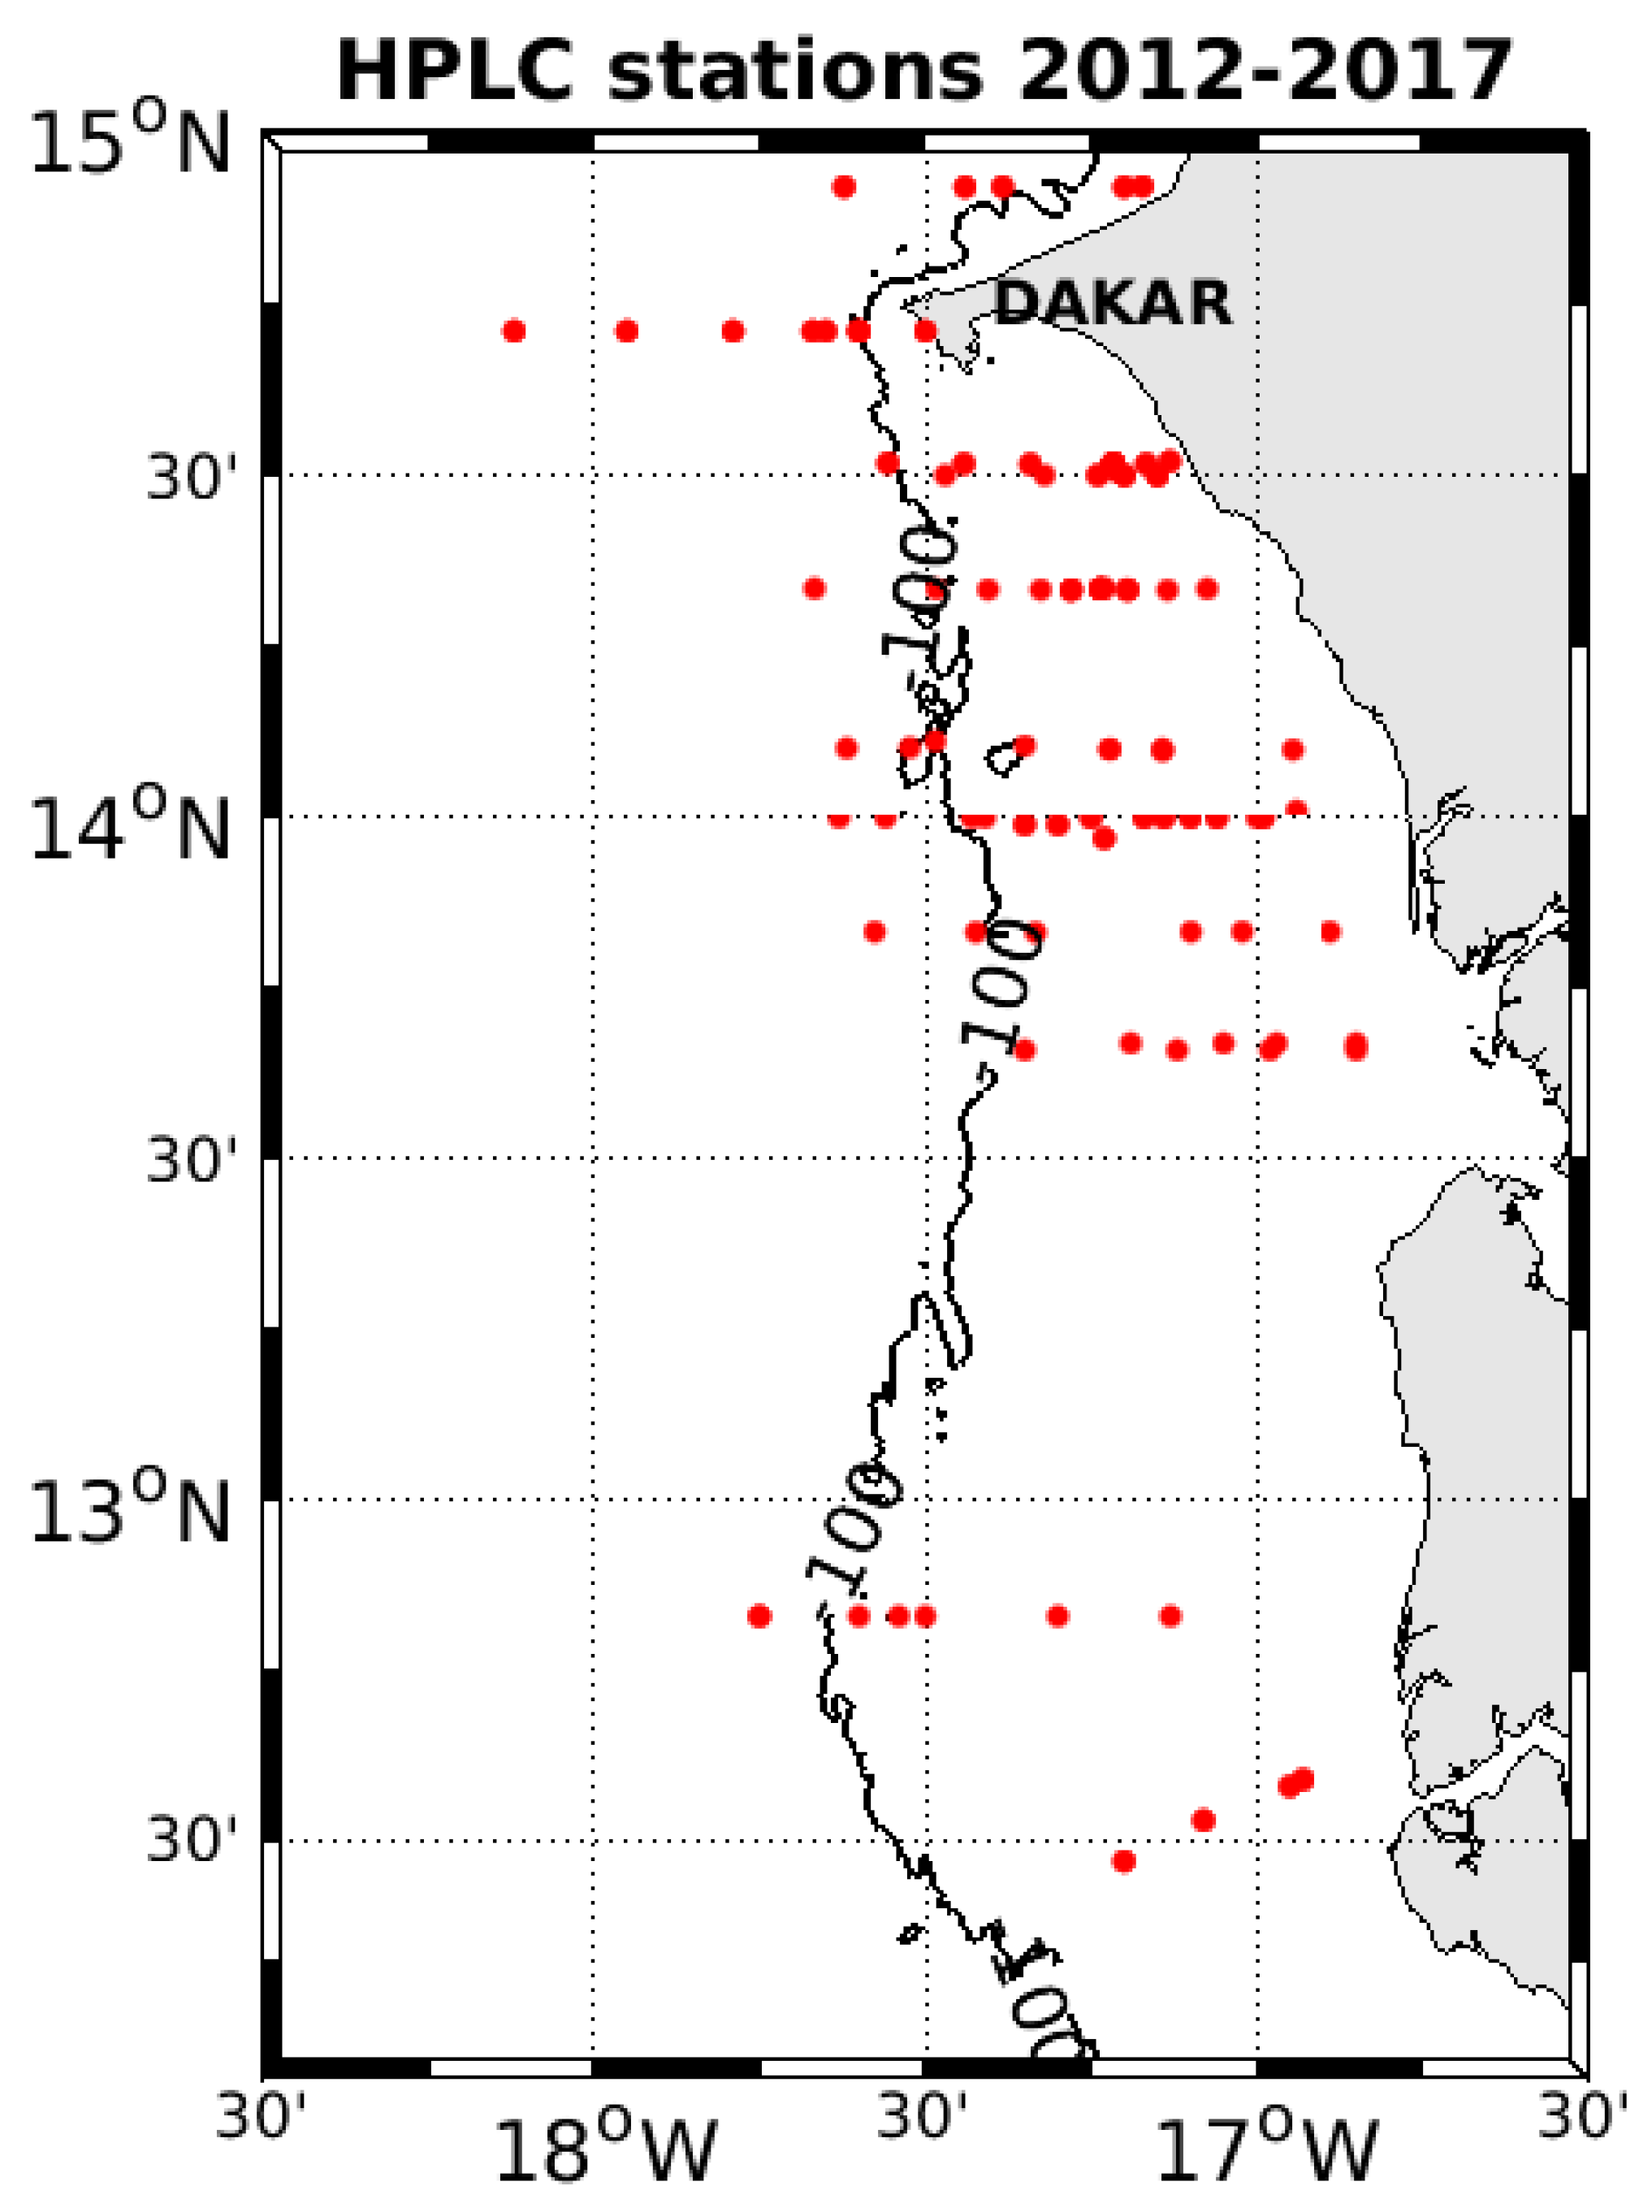
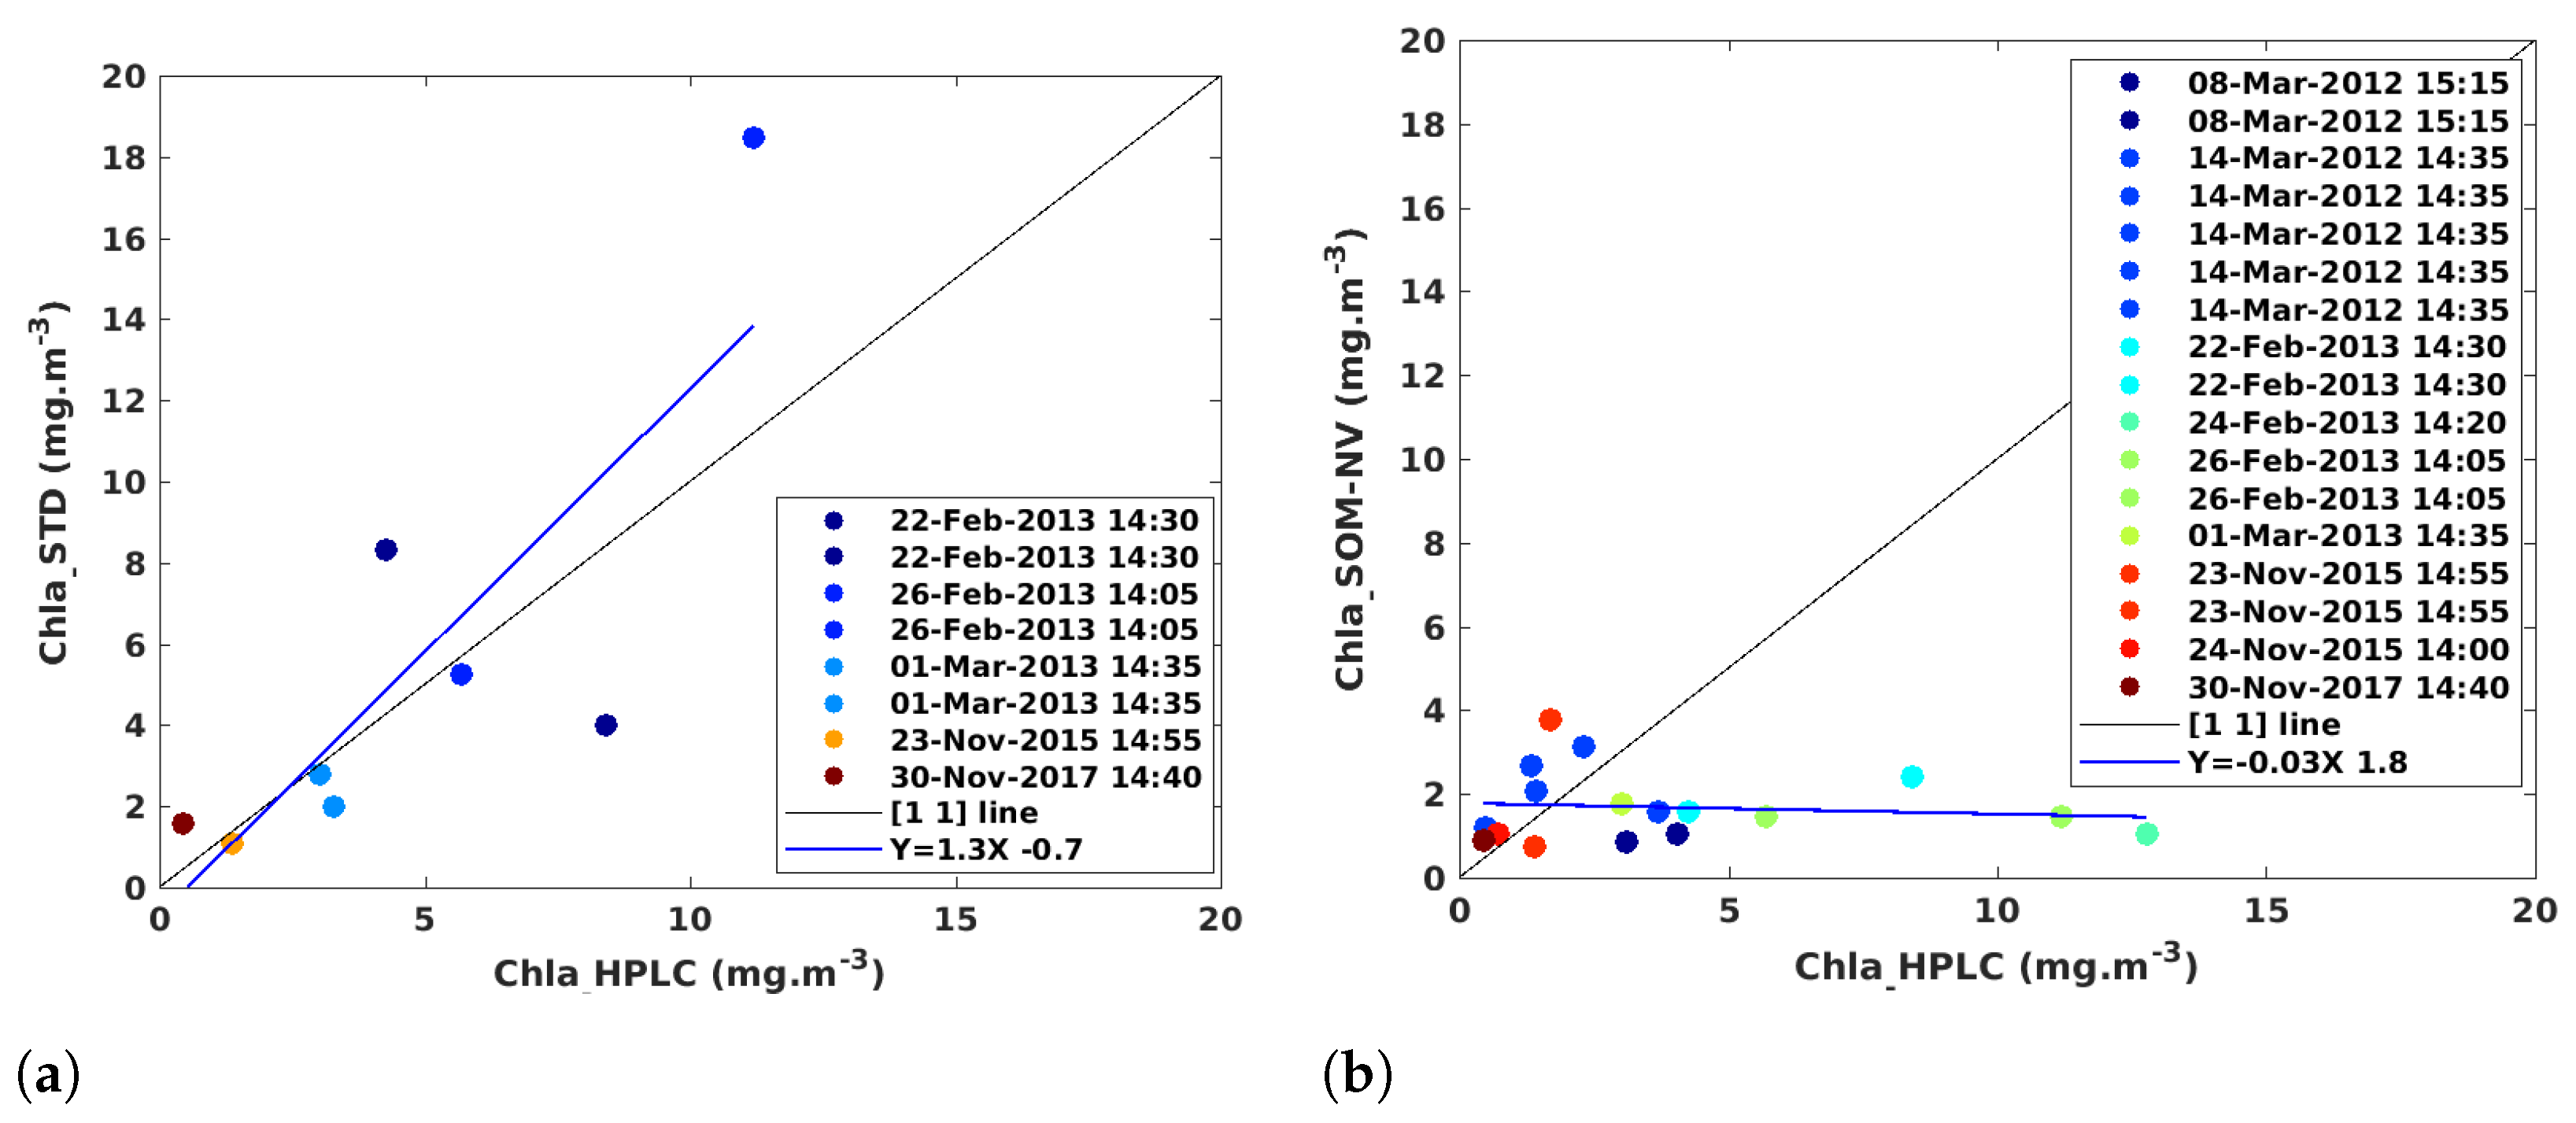
Between 2012 and 2014, four campaigns were conducted on the southern Senegalese shelf between 21 February and 20 March, during the upwelling season, and two in November during the transition season (see Section 2). About 200 samples were analyzed by HPLC to determine the surface Chla (see Figure A3). Between 13°30′N and 14°45′N, the average February–March concentration for the years 2012 to 2014 is 4.1 mgChla·m 3 for in situ data collected during UPSEN-1, UPSEN-2, ECOAO, and AWA campaigns over the shelf (0–100 m). This concentration is much closer to 2.9 mgChla·m 3 than to 6.21 mgChla·m 3 , respectively, obtained from the SOM-NV and STD processing over the same shelf domain.
Station by station, spatial and temporal correspondences between concentrations measured in situ and estimated by satellite are rare. Out of 200 samples, only 13 values could be compared by fixing a maximum radius of 4 km between in situ sampling and the satellite pixel (Figure 6b). The 1 km resolution of the SOM-NV product compared to the characteristic velocities on the shelf are of the order of 10 cm/s ( 10 km/d), which explains the limited accuracy of the matchups. Furthermore, in an upwelling system where mesoscale and submesoscale activity is important (e.g., [49]), the proximity to a front and/or a temporal lag can easily induce significant differences between in situ and satellite Chla values (see Figure A4 as an illustration). Correlation is better between HPLC data and STD estimates than with SOM-NV processing (71% and 23%, respectively, not significant), but the number of points retained is very low (Figure 6).
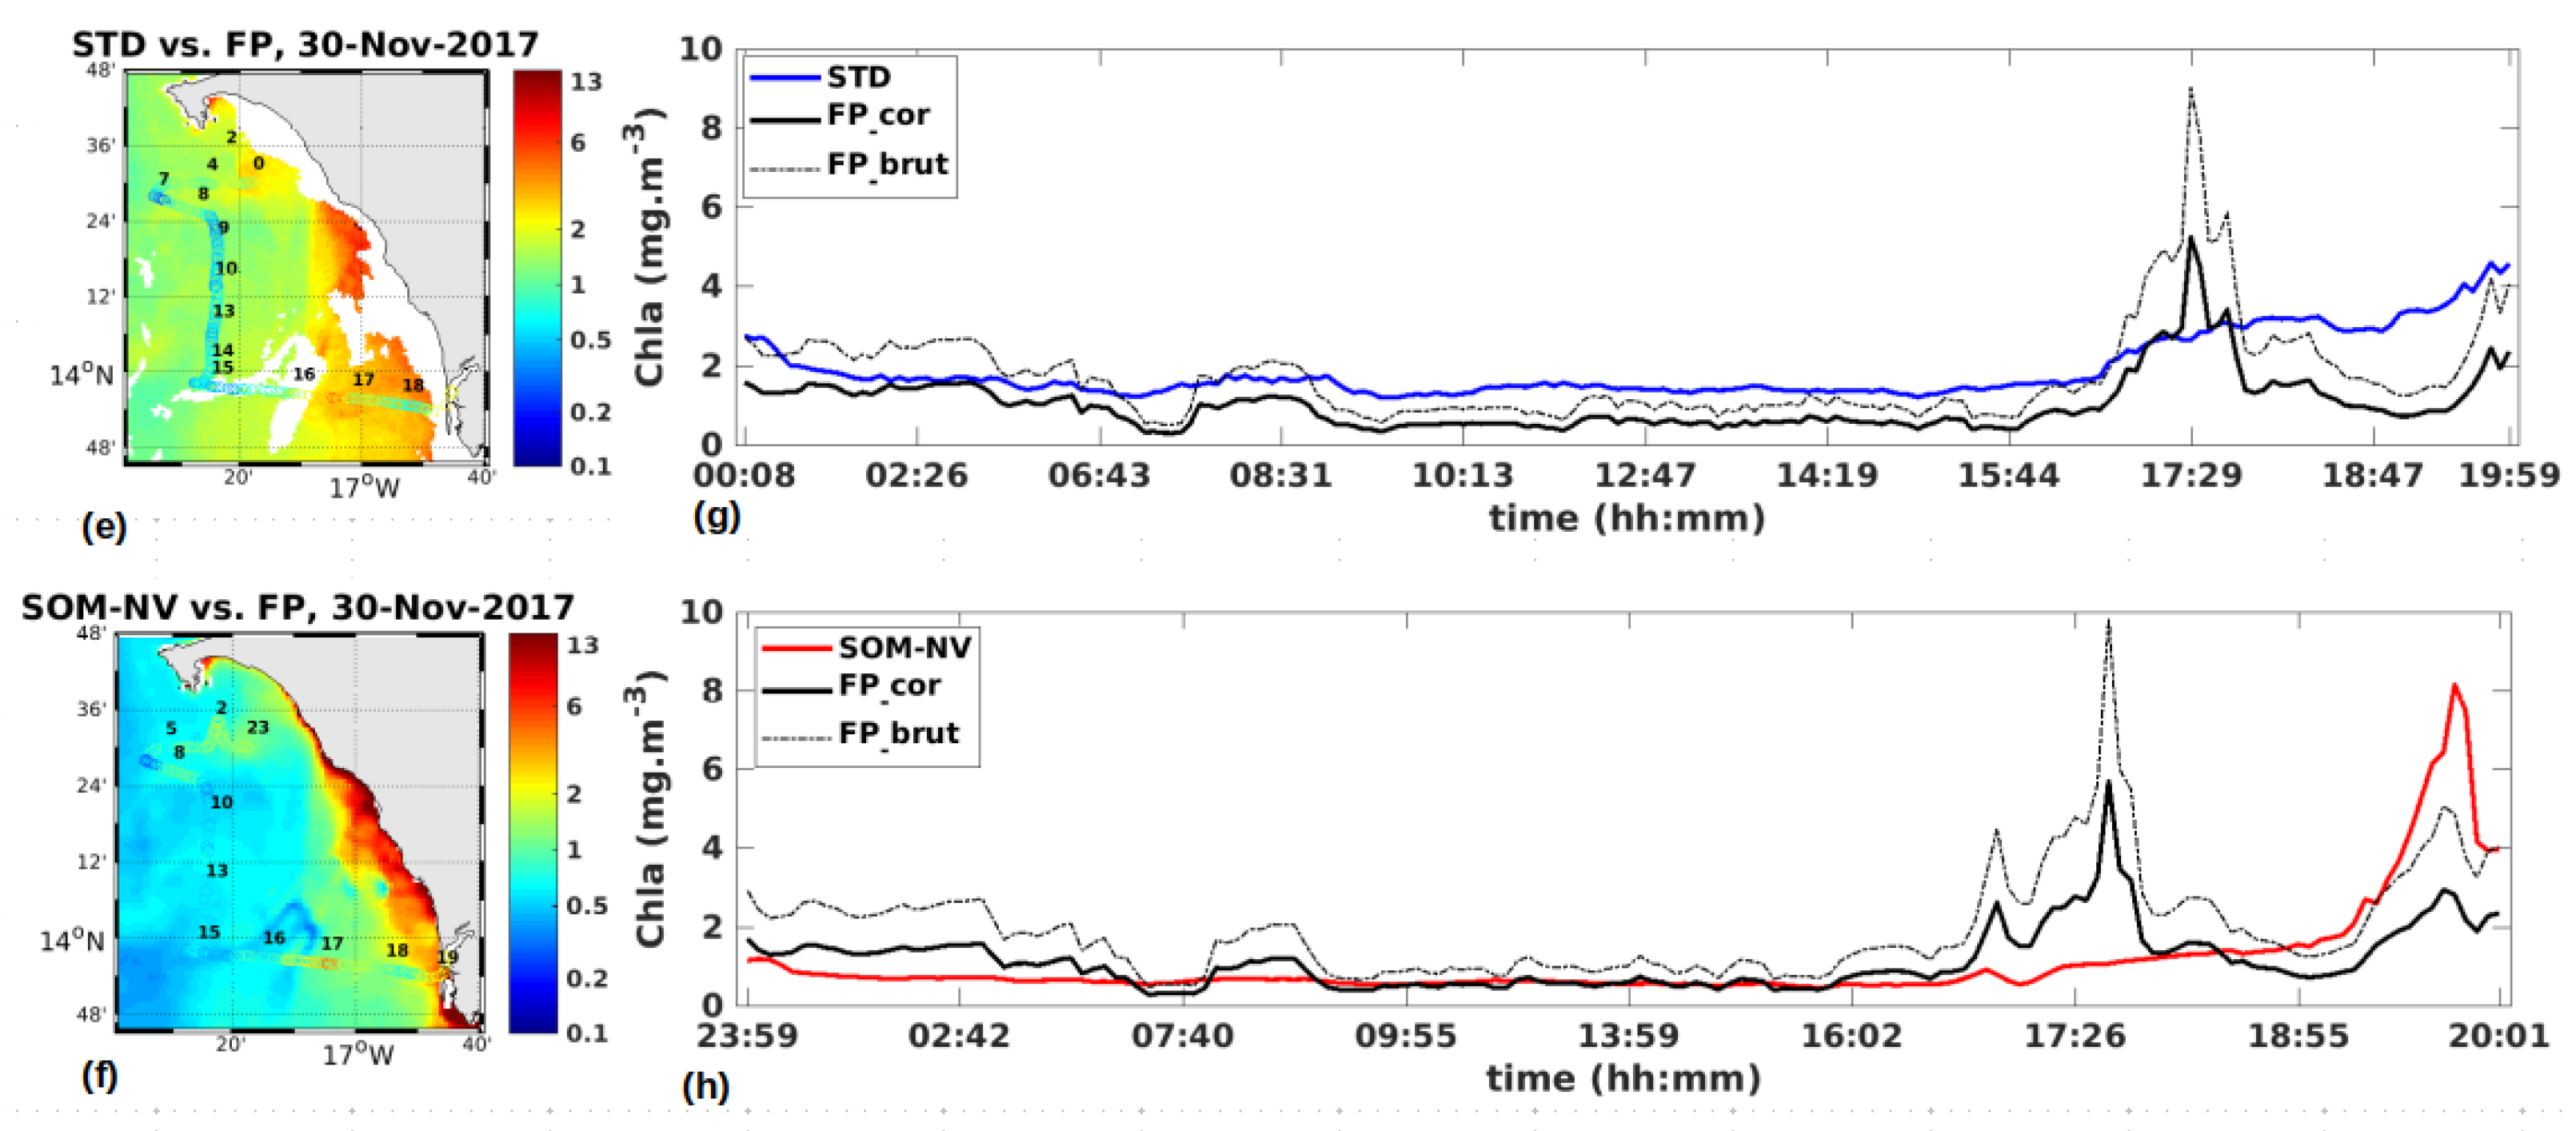
FP data collected during MiniSCOPES 2015 and 2017 (November) are used to validate the ability of SOM-NV to retrieve spatial variability of Chla. These data are superposed on MODIS images in Figure 7. Only a couple of hours recorded along the ship track are compared to MODIS image of 23 November 2015. A much longer transect can be compared on 30 November 2017. The determination coefficients between FP observations and satellite estimates are 0.73 (RMSE = 2.99, p < 0.05) and 0.71 (RMSE = 2.68; p < 0.05), respectively, for SOM-NV and STD (Figure A5). For low concentrations of offshore waters, SOM-NV values of Chla are closer to FP data (Figure 7e,f). Both forms of processing capture the coastal enrichments, but the results can be far from in situ measurements. On November 30th, both processing types miss a feature observed by FP around 5:30 pm. A bloom with Chla up to 40 mgChla·m 3 is measured the next day during a second passage at the same location. The delay between the passage of the satellite and the presence of the ship is, therefore, a good candidate for this discrepancy.

4. Discussion

The marine reflectance is a key quantity to study the properties of the surface layers in the field of ocean color. Atmospheric correction algorithms, which is part of the processing that SOM-NV aims at improving, have a direct impact on the retrieval of atmospheric parameters, i.e., AOT and the variability of spectral marine reflectance, which is at the basis of the Chla algorithms as well as in the determination of dominating plankton groups (e.g., [50]).
As in [26], we saw that SOM-NV processing applied to MODIS-Aqua observations outperformed STD processing in estimating AOTs in our study region, which is dominated by desert dust and high AOT values (e.g., [51]). The correlation coefficients between SOM-NV estimates and AERONET measurements are best in autumn and winter, with the lowest correlation in spring. Senghor et al. [14] showed that the seasonality of AOT, which is an integrated measure of aerosol content, is associated with a very different vertical distribution by season. In the early dry season (December to February), particles are concentrated in the surface atmospheric boundary layer, while from spring onwards to the warm season, they are concentrated in the Saharan Air Layer (2–3 km altitude in spring and 3–4 km in summer). The particles are also larger in the wet season as the particles absorb some of this moisture (condensation nucleus) and change their refractive index [18]. Their Single Scattering Albedo (SSA), which represents the ratio (ranging between 0 and 1) of the scattering coefficient to extinction coefficient, provides information about the absorbing properties of the aerosols. Estimates of SSA by OMI (Ozone Monitoring Instrument) are smaller during the warm season [14], indicating that absorption effects are stronger [52]. The atmospheric model of [37] used to build the SOM-NV LUTs assumes that dust is distributed down to the ocean surface and that only the altitude of the top of this homogeneous layer of absorbing aerosols varies (2, 4, and 6 km). They mentioned that the vertical structure of the dust layer has a strong impact on the atmospheric reflectance in the blue. Using a radiative transfer model, Song et al. [15] studied the effect of a Gaussian distribution of particles in the atmosphere on potential reflectance errors estimated at the TOA when considering an exponential distribution or a two-layer atmosphere. The authors show that the more the Gaussian distribution is centered on a high height, the greater the error is. Similarly, the higher the AOT, the greater the error. Song et al. [15] showed that simplified exponential and two-layer atmospheric vertical distribution models can lead to errors of water-leaving radiance retrieval up to 12–15% and 30–40%, respectively. In our study, region, the greatest potential errors would, therefore, be associated with the late-spring-early-summer period, when aerosols are highest and AOTs are strongest. As the latitudes of our domain are below 20°N, the solar zenith angle remains low [53] and the errors made remain in the lower range of the estimates made by [15].
SOM-NV processing’s determination of the contribution of absorbing aerosols to reflectance at the TOA results in a better determination of the marine contribution across the entire visible spectrum, and particularly at blue wavelengths (Figure 5). The mean STD reflectance spectrum, on the other hand, shows a number of inconsistencies, particularly in the blue, where, for instance, reflectance is underestimated at low Chla. STD processing uses the NIR response to determine the contribution of aerosols over the entire reflectance spectrum [16] and may, therefore, not be sufficiently constrained in the presence of strongly absorbing aerosols which are likely to introduce variability into the response depending on their origin and size, which can vary greatly depending on the source region [54,55] and relative humidity [17]. Song et al. [15] showed that not considering absorbing aerosols during atmospheric correction might produce 4–10% errors in the water-leaving radiance retrieval at 412 nm over coastal waters with strongly absorbing aerosols under the assumption of a Gaussian distribution. Overall, an imperfect vertical distribution assumption and aerosol model selection might induce uncertainty in water-leaving radiance retrieval from 10% to 80% under absorbing aerosol conditions.
Better characterization of aerosols and their impact across the spectrum means we can exploit more pixels in our study region. A better coverage of SOM-NV is, thus, associated with the region between the mainland and Cabo Verde Islands (Figure 4), where plumes of Saharan dust transported by the north-east Harmattan wind are commonly observed [15,37]. These dust patterns are characterized by higher AOT values (e.g., [51]) and are mostly masked in the standard processing, as the MODIS algorithm does not provide an estimate of reflectance in the presence of highly absorbent aerosols or tends to underestimate aerosol absorption, as also shown by [56].
Although coverage is higher off Cape Blanc ( 20°N) than off southern Senegal, SOM-NV recovers more pixels in the south than in the north (Figure 4). The annual mean sea surface temperature distribution shows a marked meridional gradient (Figure A1a), and thus, a greater amount of water vapor in the southern part of the domain. According to [57], relative humidity is between 70 and 90% in the region. As mentioned earlier, this humidity shifts the particle size spectrum towards larger particles and changes their refractive index [18]. Occurrence of observations also diminishes from the north to the south of the dust plume (Figure A1b). All these parameters combine to make atmospheric correction of this region with its complex properties difficult. The obvious improved coverage pattern downwind of the Cabo Verde islands for both the SOM-NV and the STD processing (Figure 4b,c), however, illustrates the effect of moisture on the ability of the algorithms to correct the atmosphere. Indeed, the conservation of potential energy when passing over a mountainous terrain, called the foehn effect, is characterized by a warming and drying of the air mass downwind of this mountain. Both algorithms, thus, performed better at lower relative humidity. Nevertheless, the reason why SOM-NV is able to better characterize the surface water properties when the air is more humid remains difficult to explain based on the proposed algorithm.
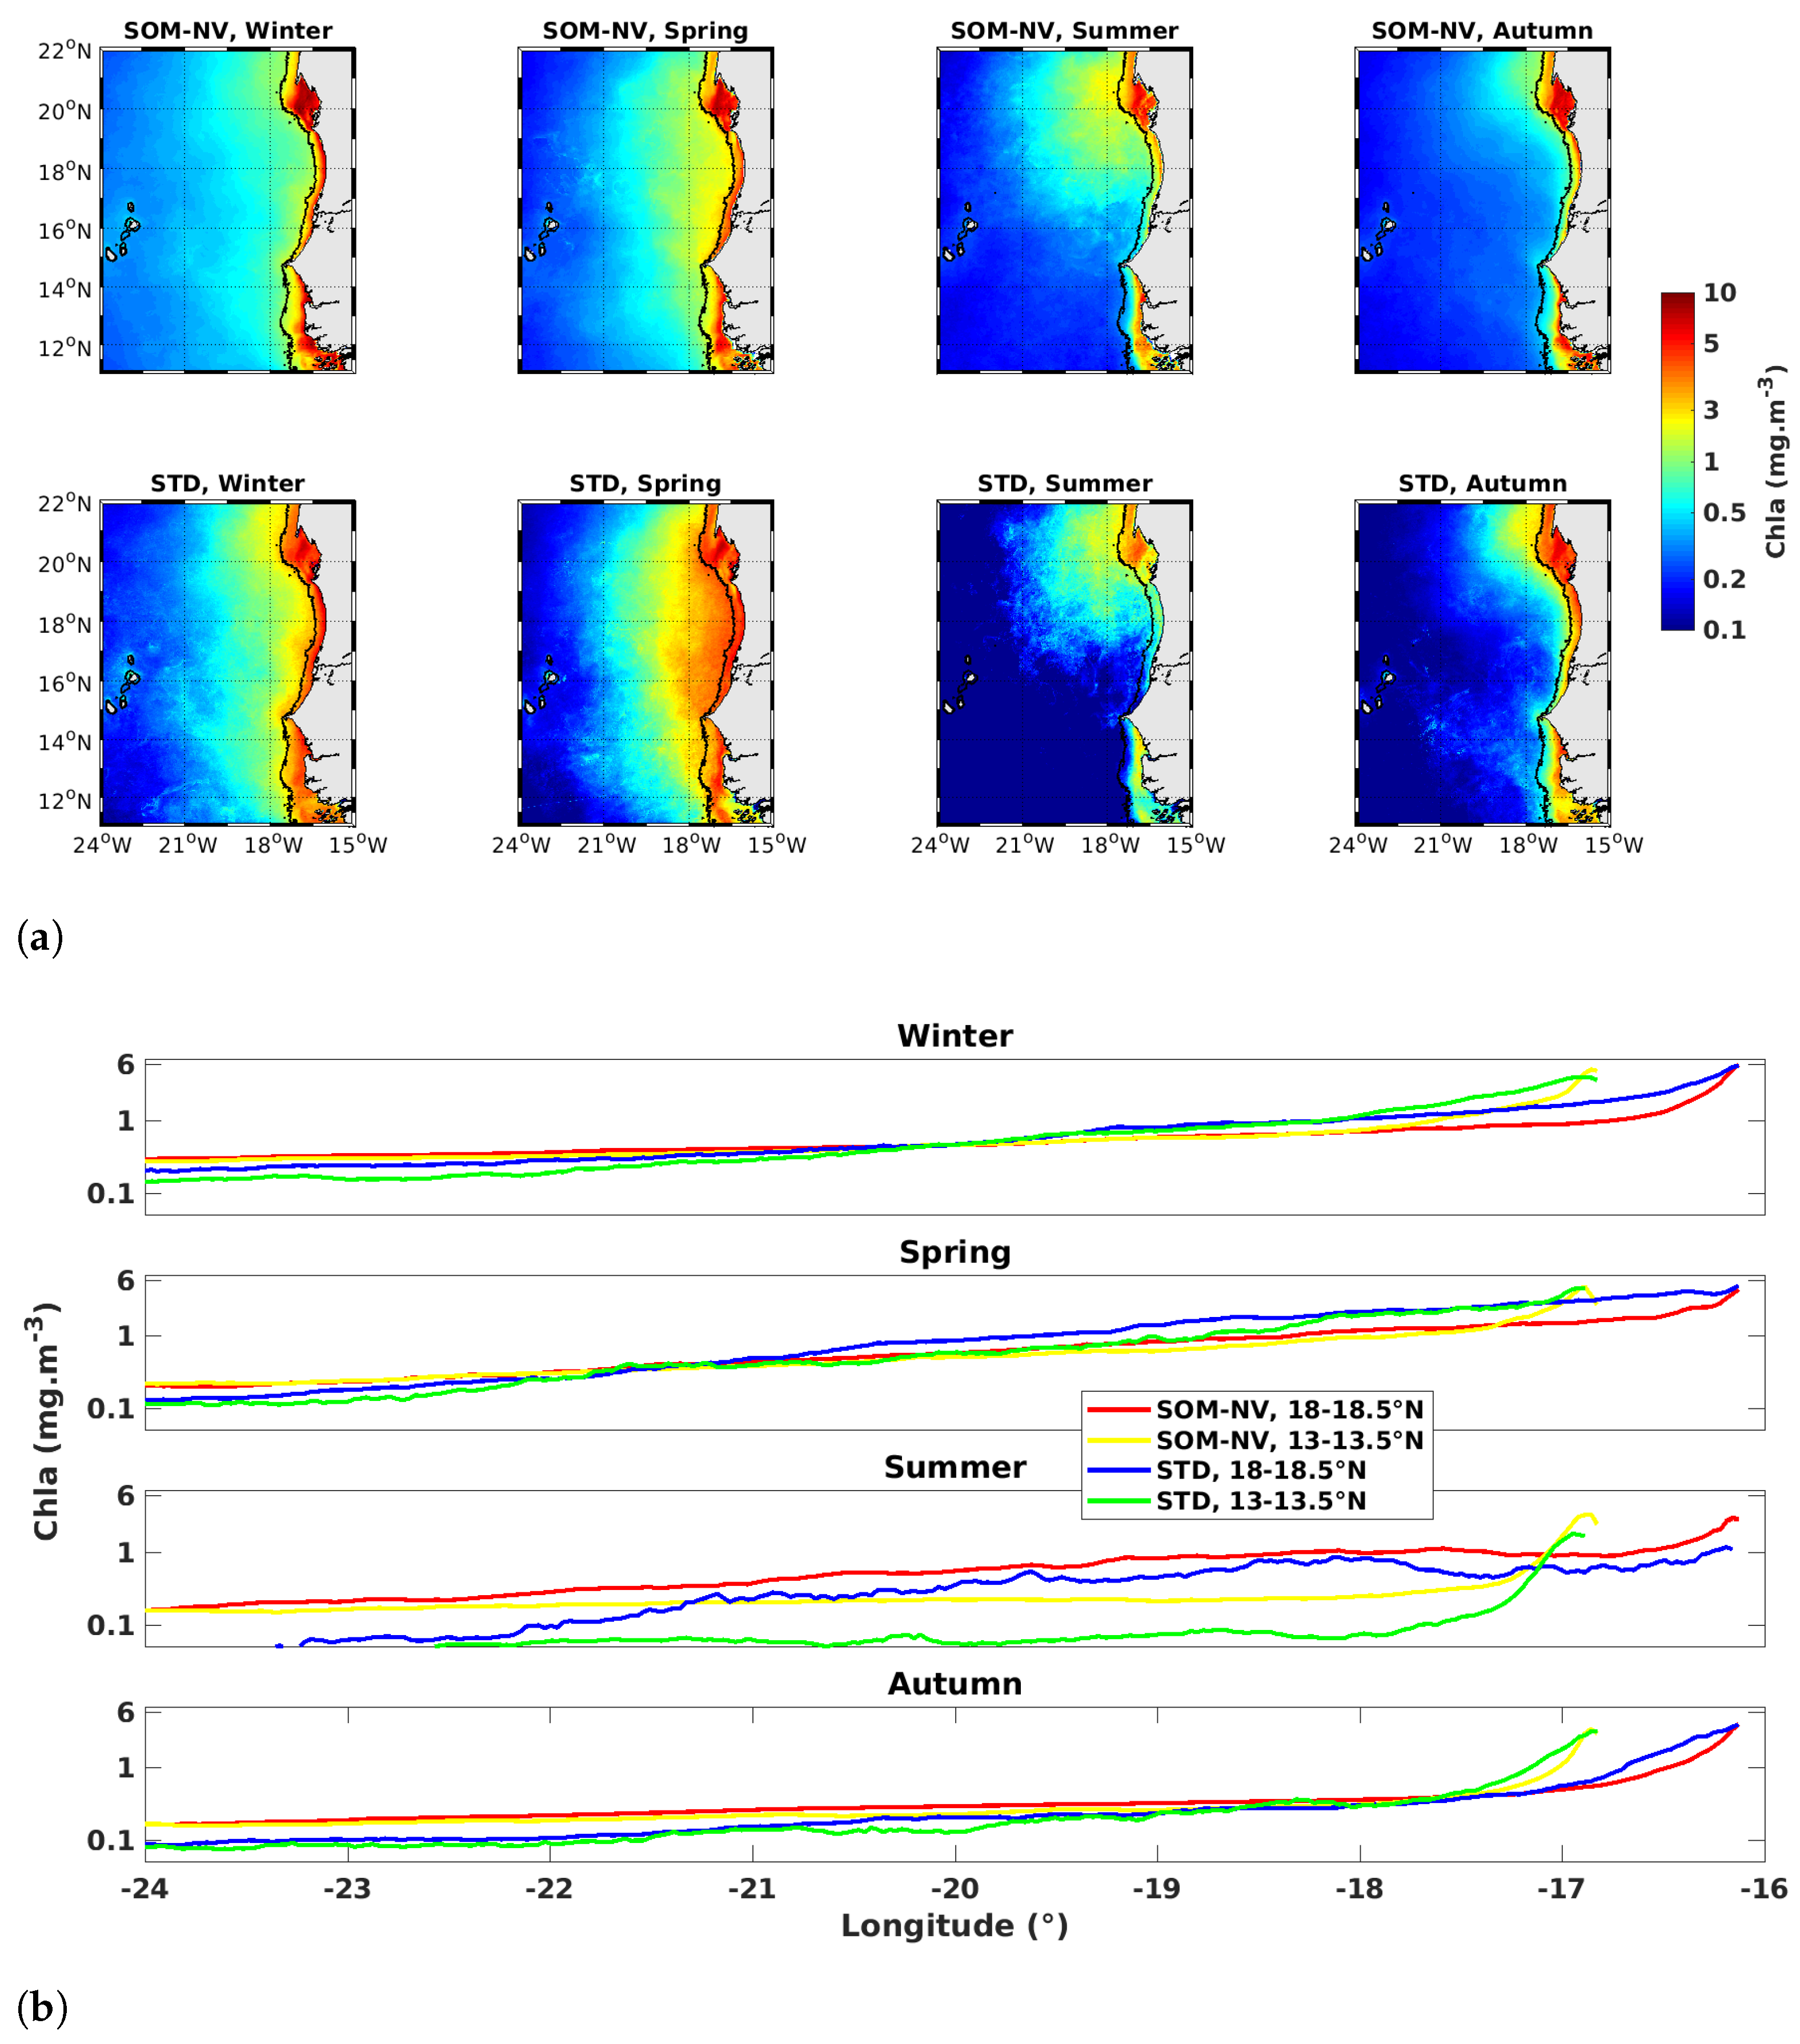
Overall, this atmospheric correction has implication on the recovery of cross-shore Chla. Three regions with fairly different upwelling dynamics characterize the seasonal variability of surface Chla in the Canary Upwelling System [58]. The northern region of the subtropical gyre is characterized by a weak seasonality and Chla confined at the coast, but it is not considered in this study. The inter-gyre region off Cape Blanc (19–24°N) is characterized by the weakest seasonality and a persistent large offshore extension of Chla (Figure 8a). The region of the recirculation gyre between 10° and 19°N is characterized by a strong seasonality and a large offshore extension of Chla from February to May followed by an abrupt Chla drop that propagates northward from May to June (Figure 8a). Chla is maximum inshore throughout the year and remains high in winter and spring in the coastal transition zone (Figure 8b), where destabilization of the upwelling jet occurs and generates filaments and eddies (e.g., [59]). In general, STD processing produces higher Chla than SOM-NV except in summer (July to September) when coverage is very poor (10% for SOM-NV and 5% for STD; Figure 4a). West of 21°W, towards the open oligotrophic ocean, Chla is higher for SOM-NV than for STD, except in summer. The largest differences between both forms of processing occur in the coastal transition zone. In winter, dust aerosols are maintained in the atmospheric boundary layer above the surface of the ocean, whereas in spring, they are uplifted by convection over the continent and are advected westward within the Saharan Air Layer at 3 km height over the ocean [14]. However, AOT is two to three times higher in spring (and summer) than in winter. Note that the difference between STD and SOM-NV is the greatest during spring. Autumn is characterized by low dust levels over the ocean and consequently the lowest difference between the two types of processing. Unfortunately, we lack observations to validate these differences in Chla between STD and SOM-NV in the transition zone between the coast and the open ocean.

5. Conclusions

Taking into account the contribution of absorbing aerosols to better estimate the different components of the signal at the TOA is essential in this oceanic region covered most of the time by air masses loaded with desert dust. The adaptation of SeaWiFS to MODIS-Aqua data processing from the SOM-NV algorithm shows the robustness of the method in retrieving oceanic parameters from satellite radiances measured by multi-spectral ocean-color sensors. Indeed, the two-step approach of classifying the TOA radiance spectra for a better estimate of aerosol type on the one hand, and using an optimization method to fit the parameters of these aerosols and Chla on the other hand, allows for a better representation of the optical thickness, a correction of the marine reflectance spectrum, and a considerable increase in the spatio-temporal coverage of the area.
To the extent that the properties of the water color signal are improved by this processing scheme, the Chla estimates should also be greatly improved by this approach. However, dedicated and numerous in situ data are still necessary to conclude on this point. SOM-NV Chla is closer to HPLC Chla, as shown in March for two different years. Chla, AOT at 869 nm, reflectance at 412, 443, 488, 531, and 547 nm resulting from the SOM-NV processing of MODIS-Aqua from 2003 to 2018 are archived in netcdf format as a regional dataset that is published in https://zenodo.org/, last access on 17 June 2023 (DOI: https://doi.org/10.5281/zenodo.7971187).

Author Contributions

Conceptualization, E.M., H.D., K.C. and D.D.; methodology, D.D., E.M., J.B., H.D. and K.C.; software, D.D., J.B. and H.D.; validation, K.C., H.D. and E.M.; formal analysis, E.M., H.D., J.B. and K.C.; resources, E.M. and H.D.; data curation, K.C., E.M., D.D., H.D. and J.B.; writing—original draft preparation, D.D., E.M. and K.C.; writing—review and editing, K.C., E.M., H.D. and J.B.; supervision, E.M., H.D. and S.M.S.; project administration, K.C. and E.M.; funding acquisition, E.M. and K.C. All authors have read and agreed to the published version of the manuscript.

Funding

This research was funded by SOLAB project, grant number ANR-18-CE32-0009; University of Western Brittany (UBO) through the “Ecole Doctorale des Sciences de la Mer et du Littoral” (EDSML); IRD (Institut de Recherche pour le Développement) for ARTS project; and International Joint Laboratory ECLAIRS.

Data Availability Statement

Acknowledgments

K. Correa was supported for this study by a scholarship from IRD (Institut de Recherche pour le Développement) and by a grant from Région Bretagne. The French National Research Agency (ANR) partly funded this research (SOLAB project; grand ANR-18-CE32-0009). The authors also acknowledge support from the International Joint Laboratory ECLAIRS. The authors thank S.M. Sall for their constant support to this work. We thank NASA Ocean Biology Processing Group. (2017). MODIS-Aqua Level 2 Ocean Color Data Version R2018.0 [OC]. NASA Ocean Biology Distributed Active Archive Center. https://doi.org/10.5067/AQUA/MODIS/L2/OC/2018. We would like to thank Aida Beye ([email protected]) for processing the FP data. We thank also Didier Tanré and their staff for establishing and maintaining the Dakar, Senegal site used in this investigation. We thank Philippe Goloub and their staff for establishing and maintaining the Cabo Verde site used in this investigation.

Conflicts of Interest

The authors declare no conflict of interest. The funders had no role in the design of the study; in the collection, analyses, or interpretation of data; in the writing of the manuscript; or in the decision to publish the results.

Appendix A

Appendix A.1. Coverage Pattern
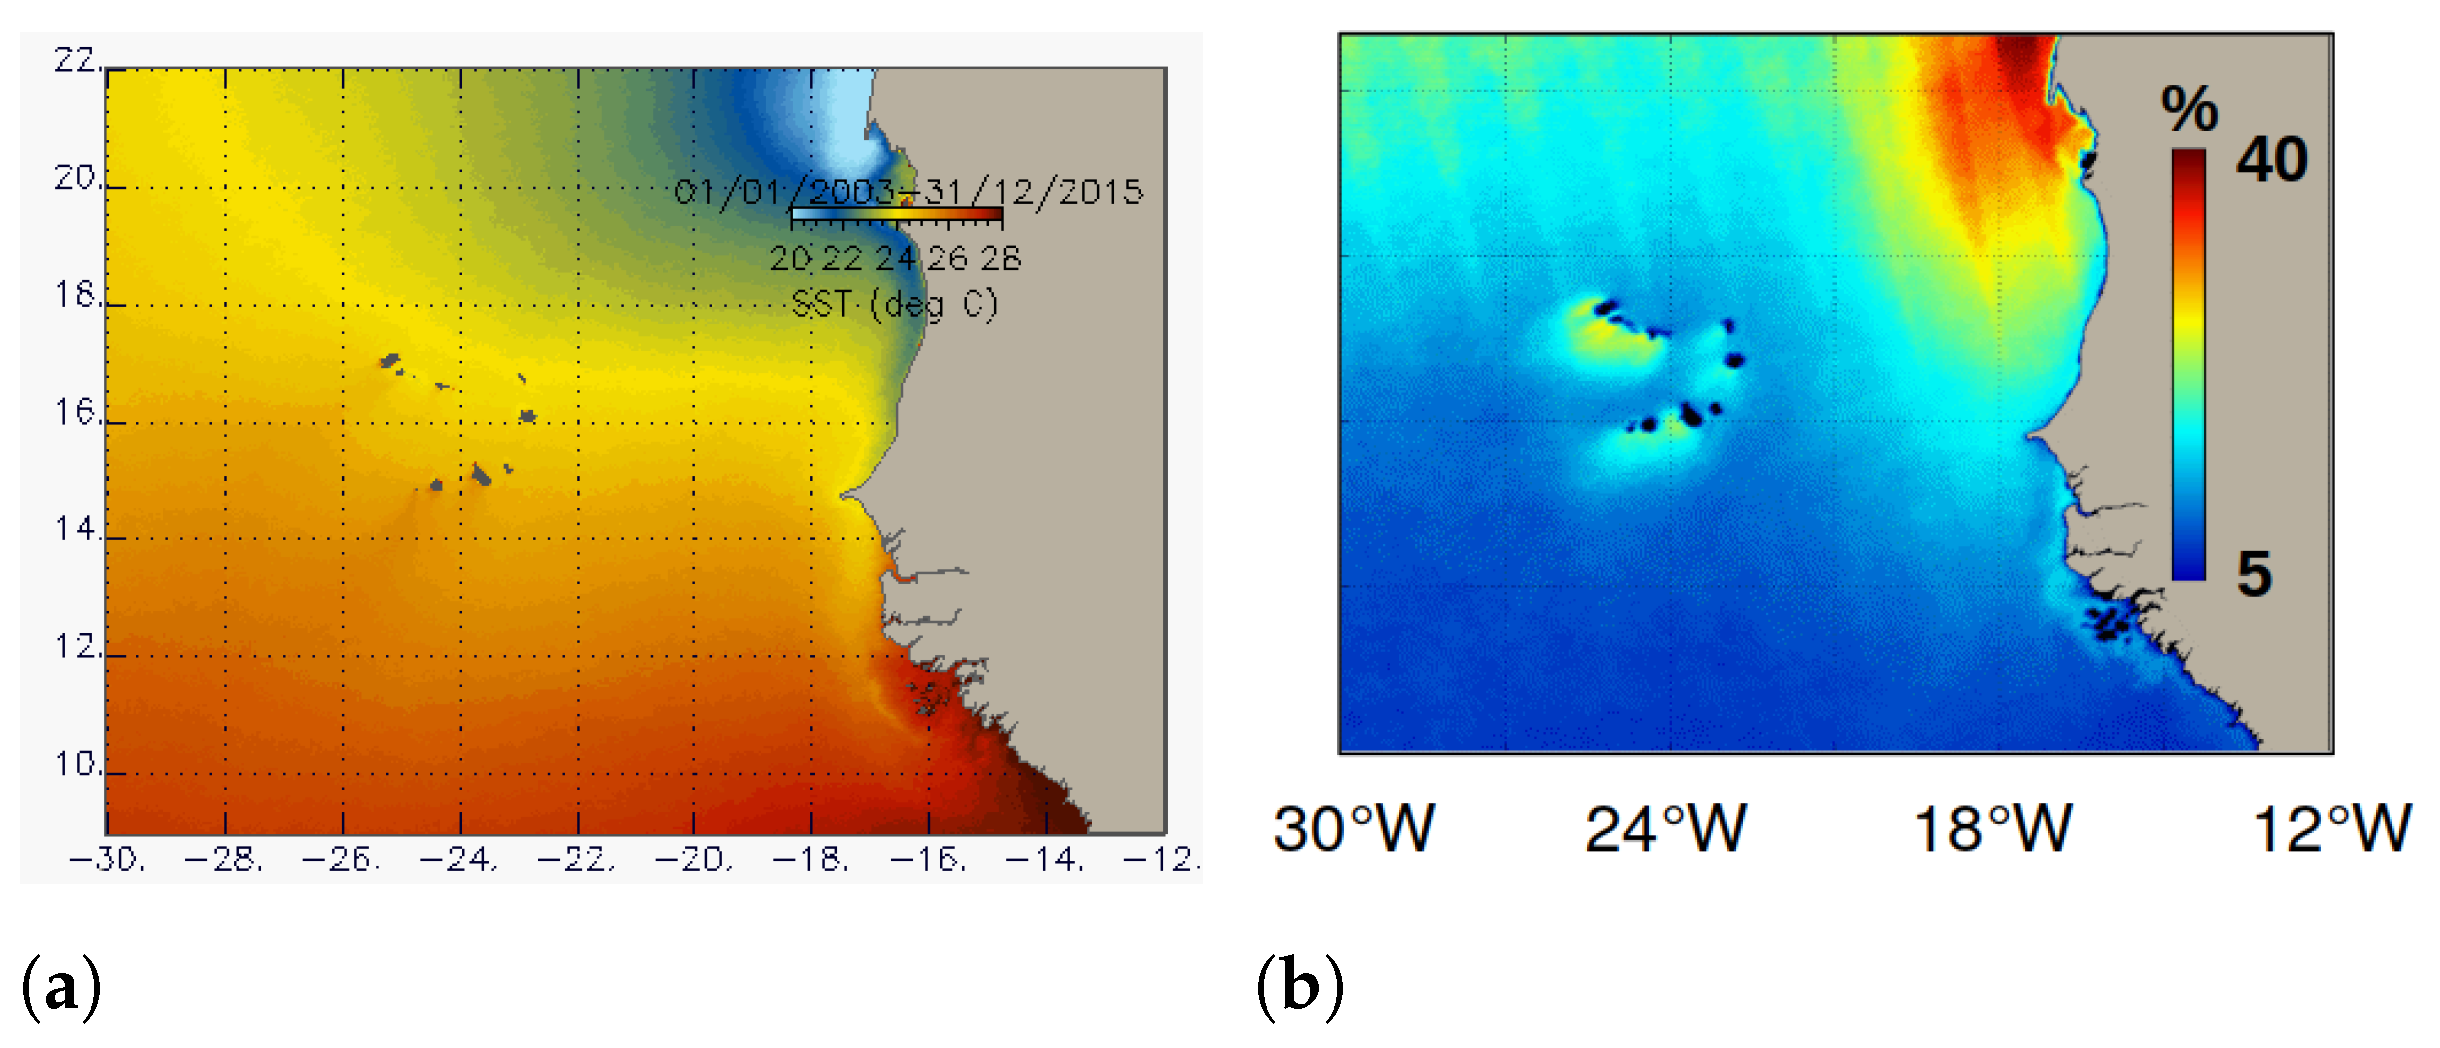
Here, we attach an average SST map (Figure A1a) and an average daily observation (Figure A1b), and show the average SOM-NV coverage map per month (Figure A2). The cold region of northern Mauritania is associated with a better coverage.
Figure A1. (a) Mean MODIS sea surface temperature at 4 km resolution for the period 2003–2015; (b) average (%) of daily observation resulting from standard L3 atmospheric flags (including water vapor and clouds).
Remotesensing 15 03613 g0a1
Figure A2. Average SOM-NV coverage over the period 2003–2018, from January (M1) to December (M12). MR for Mauritania, SN for Senegal, and CV for Cabo Verde.
Remotesensing 15 03613 g0a2

Appendix A.2. Chla Validation

In the middle of the 2012, 2013, and 2014 upwelling seasons, several surface HPLC measurements were made on the southern Senegalese shelf between the latitudes of 13.5° to 15°N (Figure A3).
In Figure 6b, differences between HPLC and satellite Chla are important. The proximity of productive innershelf waters in 24 February Figure A4a illustrates the significant potential difference that can occur between the two estimates associated with small time and space lags, i.e., 1 h 45 and 2.5 km, respectively. Furthermore, since 2015, FP measurements have been taken on campaign days. The FP is continuously towed along the ship, and performs high-frequency measurements. Several measurements are made for a single satellite pixel. Figure A5 shows the distribution of Chla measurements for two dates (23 November 2015 and 30 November 2017). FP measurements have been averaged for each pixel crossed.
Figure A3. Surface HPLC stations during UPSEN-1 and -2, ECOAO, and AWA sampling.
Remotesensing 15 03613 g0a3
Figure A4. Circles are associated with stations carried out during UPSEN-2 (panel (a)): 24 February 2013) and MiniSCOPES 2017 (panel (b): 30 November 2017) November. The color of the circle corresponds to the chlorophyll-a pigment concentration, the colorbar being common with SOM-NV MODIS-Aqua images.
Remotesensing 15 03613 g0a4
Figure A5. (a) Chla (FP vs. SOM-NV) along ship track and (b) Chla FP vs. STD along ship track.
Remotesensing 15 03613 g0a5

Appendix A.3. HPLC vs. FP Regression
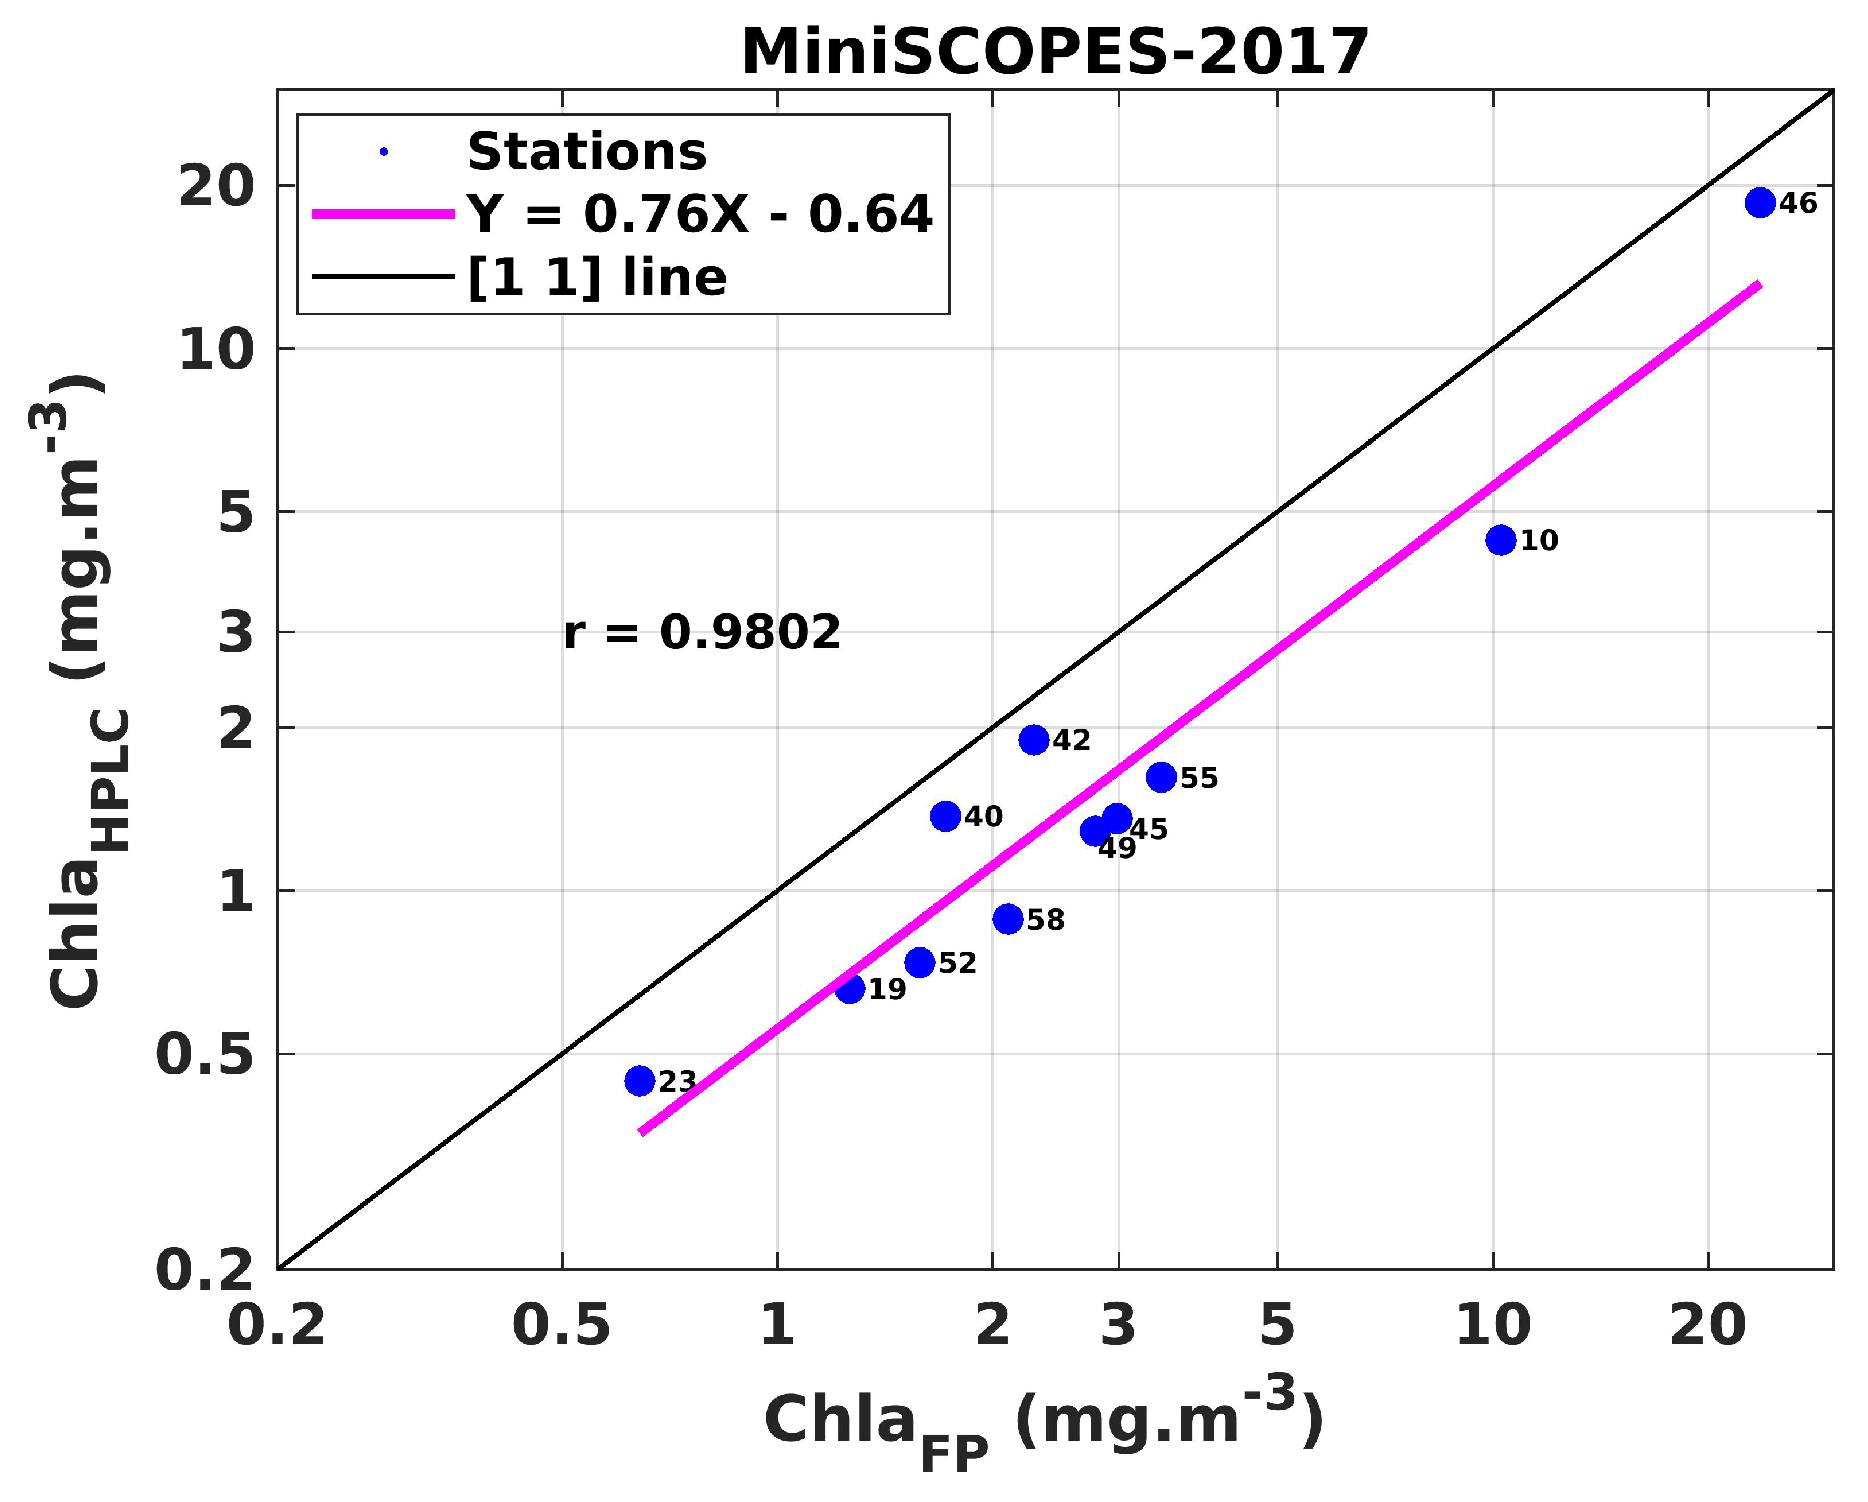
For 2017, the regression between HPLC and FP measurements show that FP overestimates Chla (Figure A5). In Figure 7, and thus, we applied an offset to FP data (FPNew = 0.58 × FP).
Figure A6. Regression between HPLC and FP. Only the data of the year 2017 are considered.
Remotesensing 15 03613 g0a6

References

  1. Hovis, W.; Clark, D.; Anderson, F.; Austin, R.; Wilson, W.; Baker, E.; Ball, D.; Gordon, H.; Mueller, J.; El-Sayed, S.; et al. Nimbus-7 Coastal Zone Color Scanner: System description and initial imagery. Science 1980, 210, 60–63. [Google Scholar] [CrossRef] [PubMed]
  2. Franz, B.; Werdell, P.; Meister, G.; Bailey, S.; Eplee, R., Jr.; Feldman, G.; Kwiatkowska, E.; McClain, C.; Patt, F.; Thomas, D. The continuity of ocean color measurements from SeaWiFS to MODIS. Earth Obs. Syst. X 2005, 5882, 58820W. [Google Scholar]
  3. Clarke, G.; Ewing, G.; Lorenzen, C. Spectra of backscattered light from the sea obtained from aircraft as a measure of chlorophyll concentration. Science 1970, 167, 1119–1121. [Google Scholar] [CrossRef]
  4. Wang, M.; Son, S.; Shi, W. Evaluation of MODIS SWIR and NIR-SWIR atmospheric correction algorithms using SeaBASS data. Remote Sens. Environ. 2009, 113, 635–644. [Google Scholar] [CrossRef]
  5. Mobley, C. Others the Oceanic Optics Book; International Ocean Colour Coordinating Group (IOCCG): Dartmouth, NS, Canada, 2022. [Google Scholar] [CrossRef]
  6. Ogunjobi, K.; Kim, Y.; He, Z. Aerosol optical properties during Asian dust storm episodes in South Korea. Theor. Appl. Climatol. 2003, 76, 65–75. [Google Scholar] [CrossRef]
  7. Andreae, M. Raising dust in the greenhouse. Nature 1996, 380, 389–390. [Google Scholar] [CrossRef]
  8. Solomon, S.; Qin, D.; Manning, M.; Averyt, K.; Marquis, M. Climate Change 2007—The Physical Science Basis: Working Group I Contribution to the Fourth Assessment Report of the IPCC; Cambridge University Press: Cambridge, UK, 2007. [Google Scholar]
  9. Tanaka, T.; Kurosaki, Y.; Chiba, M.; Matsumura, T.; Nagai, T.; Yamazaki, A.; Uchiyama, A.; Tsunematsu, N.; Kai, K. Possible transcontinental dust transport from North Africa and the Middle East to East Asia. Atmos. Environ. 2005, 39, 3901–3909. [Google Scholar] [CrossRef]
  10. Ganor, E.; Osetinsky, I.; Stupp, A.; Alpert, P. Increasing trend of African dust, over 49 years, in the eastern Mediterranean. J. Geophys. Res. Atmos. 2010, 115. [Google Scholar] [CrossRef] [Green Version]
  11. Ansmann, A.; Baars, H.; Tesche, M.; Müller, D.; Althausen, D.; Engelmann, R.; Pauliquevis, T.; Artaxo, P. Dust and smoke transport from Africa to South America: Lidar profiling over Cape Verde and the Amazon rainforest. Geophys. Res. Lett. 2009, 36. [Google Scholar] [CrossRef]
  12. Prospero, J.; Glaccum, R.; Nees, R. Atmospheric transport of soil dust from Africa to South America. Nature 1981, 289, 570–572. [Google Scholar] [CrossRef]
  13. Senghor, H.; Machu, É.; Durán, L.; Jenkins, G.; Gaye, A. Seasonal behavior of aerosol vertical concentration in Dakar and role played by the sea-breeze. Open J. Air Pollut. 2020, 9, 11–26. [Google Scholar] [CrossRef] [Green Version]
  14. Senghor, H.; Machu, É.; Hourdin, F.; Gaye, A. Seasonal cycle of desert aerosols in western Africa: Analysis of the coastal transition with passive and active sensors. Atmos. Chem. Phys. 2017, 17, 8395–8410. [Google Scholar] [CrossRef] [Green Version]
  15. Song, L.; Bi, X.; Zhang, Z.; Li, L.; Dai, Q.; Zhang, W.; Li, H.; Wang, X.; Liang, D.; Feng, Y. Impact of sand and dust storms on the atmospheric environment and its source in Tianjin-China. Sci. Total. Environ. 2022, 825, 153980. [Google Scholar] [CrossRef] [PubMed]
  16. Gordon, H.; Wang, M. Retrieval of water-leaving radiance and aerosol optical thickness over the oceans with SeaWiFS: A preliminary algorithm. Appl. Opt. 1994, 33, 443–452. [Google Scholar] [CrossRef]
  17. IOCCG. IOCCG Atmospheric Correction for Remotely-Sensed Ocean-Colour Products. 2010. Available online: http://www.ioccg.org/reports/report10.pdf (accessed on 20 June 2023).
  18. Mobley, C.; Werdell, J.; Franz, B.; Ahmad, Z.; Bailey, S. Atmospheric Correction for Satellite Ocean Color Radiometry; National Aeronautics: No. GSFC-E-DAA-TN35509; 2016. Available online: https://ntrs.nasa.gov/api/citations/20160011399/downloads/20160011399.pdf (accessed on 20 June 2023).
  19. Ahmad, Z.; Franz, B.; McClain, C.; Kwiatkowska, E.; Werdell, J.; Shettle, E.; Holben, B. New aerosol models for the retrieval of aerosol optical thickness and normalized water-leaving radiances from the SeaWiFS and MODIS sensors over coastal regions and open oceans. Appl. Opt. 2010, 49, 5545–5560. [Google Scholar] [CrossRef]
  20. Hassan, N.; Woo, C. Machine learning application in water quality using satellite data. In IOP Conference Series: Earth Furthermore, Environmental Science; IOP Publishing: Bristol, UK, 2021; Volume 842, p. 012018. [Google Scholar]
  21. Brajard, J.; Moulin, C.; Thiria, S. Atmospheric correction of SeaWiFS ocean color imagery in the presence of absorbing aerosols off the Indian coast using a neuro-variational method. Geophys. Res. Lett. 2008, 35. [Google Scholar] [CrossRef]
  22. Brajard, J.; Jamet, C.; Moulin, C.; Thiria, S. Use of a neuro-variational inversion for retrieving oceanic and atmospheric constituents from satellite ocean colour sensor: Application to absorbing aerosols. Neural Netw. 2006, 19, 178–185. [Google Scholar] [CrossRef]
  23. Niang, A.; Badran, F.; Moulin, C.; Crépon, M.; Thiria, S. Retrieval of aerosol type and optical thickness over the Mediterranean from SeaWiFS images using an automatic neural classification method. Remote Sens. Environ. 2006, 100, 82–94. [Google Scholar] [CrossRef]
  24. Thiria, S.; Badran, F.; Sorror, C. YAO: Un Logiciel pour les Modèles Numériques et l’assimilation de Données (Schéma Direct Adjoint et Assimilation Variationnelle); LOCEAN: Paris, France, 2006. [Google Scholar]
  25. Moulin, C.; Gordon, H.; Chomko, R.; Banzon, V.; Evans, R. Atmospheric correction of ocean color imagery through thick layers of Saharan dust. Geophys. Res. Lett. 2001, 28, 5–8. [Google Scholar] [CrossRef]
  26. Diouf, D.; Niang, A.; Brajard, J.; Crépon, M.; Thiria, S. Retrieving aerosol characteristics and sea-surface chlorophyll from satellite ocean color multi-spectral sensors using a neural-variational method. Remote Sens. Environ. 2013, 130, 74–86. [Google Scholar] [CrossRef]
  27. Esaias, W.; Abbott, M.; Barton, I.; Brown, O.; Campbell, J.; Carder, K.; Clark, D.; Evans, R.; Hoge, F.; Gordon, H.; et al. Others An overview of MODIS capabilities for ocean science observations. IEEE Trans. Geosci. Remote Sens. 1998, 36, 1250–1265. [Google Scholar] [CrossRef] [Green Version]
  28. Franz, B.; Bailey, S.; Werdell, P.; McClain, C. Sensor-independent approach to the vicarious calibration of satellite ocean color radiometry. Appl. Opt. 2007, 46, 5068–5082. [Google Scholar] [CrossRef] [PubMed]
  29. Bailey, S.; Franz, B.; Werdell, P. Estimation of near-infrared water-leaving reflectance for satellite ocean color data processing. Opt. Express 2010, 18, 7521–7527. [Google Scholar] [CrossRef]
  30. Yang, H.; Gordon, H. Remote sensing of ocean color: Assessment of water-leaving radiance bidirectional effects on atmospheric diffuse transmittance. Appl. Opt. 1997, 36, 7887–7897. [Google Scholar] [CrossRef]
  31. Wang, M. The Rayleigh lookup tables for the SeaWiFS data processing: Accounting for the effects of ocean surface roughness. Int. J. Remote Sens. 2002, 23, 2693–2702. [Google Scholar] [CrossRef]
  32. Wang, M.; Bailey, S. Correction of sun glint contamination on the SeaWiFS ocean and atmosphere products. Appl. Opt. 2001, 40, 4790–4798. [Google Scholar] [CrossRef] [PubMed]
  33. Gordon, H.; Wang, M. Influence of oceanic whitecaps on atmospheric correction of ocean-color sensors. Appl. Opt. 1994, 33, 7754–7763. [Google Scholar] [CrossRef] [PubMed]
  34. Kohonen, T.; Kohonen, T. The basic SOM. Self-Organizing Maps; Springer: Berlin/Heidelberg, Germany, 2001; pp. 105–176. [Google Scholar]
  35. Brajard, J.; Niang, A.; Sawadogo, S.; Fell, F.; Santer, R.; Thiria, S. Estimating aerosol parameters above the ocean from MERIS observations using topological maps. Int. J. Remote. Sens. 2007, 28, 781–795. [Google Scholar] [CrossRef]
  36. Jamet, C.; Thiria, S.; Moulin, C.; Crépon, M. Use of a neurovariational inversion for retrieving oceanic and atmospheric constituents from ocean color imagery: A feasibility study. J. Atmos. Ocean. Technol. 2005, 22, 460–475. [Google Scholar] [CrossRef]
  37. Moulin, C.; Gordon, H.; Banzon, V.; Evans, R. Assessment of Saharan dust absorption in the visible from SeaWiFS imagery. J. Geophys. Res. Atmos. 2001, 106, 18239–18249. [Google Scholar] [CrossRef]
  38. Shettle, E.; Fenn, R. Models for the Aerosols of the Lower Atmosphere and the Effects of Humidity Variations on Their Optical Properties; Technical Report, Air Force Geophysics Laboratory, Air Force Systems Command, United States Air Force; Environ. Res. Paper 676, AFGL-TR-79-0214; Hanscom Air Force Base: Bedford, MA, USA, 1979. [Google Scholar]
  39. Chomko, R.; Gordon, H. Atmospheric correction of ocean color imagery: Use of the Junge power-law aerosol size distribution with variable refractive index to handle aerosol absorption. Appl. Opt. 1998, 37, 5560–5572. [Google Scholar] [CrossRef] [PubMed]
  40. Holben, B.; Eck, T.; Slutsker, I.; Tanre, D.; Buis, J.; Setzer, A.; Vermote, E.; Reagan, J.; Kaufman, Y.; Nakajima, T.; et al. Others AERONET—A federated instrument network and data archive for aerosol characterization. Remote. Sens. Environ. 1998, 66, 1–16. [Google Scholar] [CrossRef]
  41. Giles, D.; Sinyuk, A.; Sorokin, M.; Schafer, J.; Smirnov, A.; Slutsker, I.; Eck, T.; Holben, B.; Lewis, J.; Campbell, J.; et al. Others Advancements in the Aerosol Robotic Network (AERONET) Version 3 database–automated near-real-time quality control algorithm with improved cloud screening for Sun photometer aerosol optical depth (AOD) measurements. Atmos. Meas. Tech. 2019, 12, 169–209. [Google Scholar] [CrossRef] [Green Version]
  42. Ras, J.; Claustre, H.; Uitz, J. Spatial variability of phytoplankton pigment distributions in the Subtropical South Pacific Ocean: Comparison between in situ and predicted data. Biogeosciences 2008, 5, 353–369. [Google Scholar] [CrossRef] [Green Version]
  43. Van Heukelem, L.; Thomas, C. Computer-assisted high-performance liquid chromatography method development with applications to the isolation and analysis of phytoplankton pigments. J. Chromatogr. A 2001, 910, 31–49. [Google Scholar] [CrossRef]
  44. Beutler, M.; Wiltshire, K.; Meyer, B.; Moldaenke, C.; Lüring, C.; Meyerhöfer, M.; Hansen, U.; Dau, H. A fluorometric method for the differentiation of algal populations in vivo and in situ. Photosynth. Res. 2002, 72, 39–53. [Google Scholar] [CrossRef] [PubMed]
  45. Morel, A. Optical modeling of the upper ocean in relation to its biogenous matter content (case I waters). J. Geophys. Res. Oceans 1988, 93, 10749–10768. [Google Scholar] [CrossRef] [Green Version]
  46. Morel, A.; Maritorena, S. Bio-optical properties of oceanic waters: A reappraisal. J. Geophys. Res. Oceans 2001, 106, 7163–7180. [Google Scholar] [CrossRef] [Green Version]
  47. Pope, R.; Fry, E. Absorption spectrum (380–700 nm) of pure water. II. Integrating cavity measurements. Appl. Opt. 1997, 36, 8710–8723. [Google Scholar] [CrossRef]
  48. Bricaud, A.; Morel, A.; Prieur, L. Others Absorption by dissolved organic matter of the sea (yellow substance) in the UV and visible domains. Limnol. Oceanogr. 1981, 26, 43–53. [Google Scholar] [CrossRef]
  49. Capet, X.; Estrade, P.; Machu, E.; Ndoye, S.; Grelet, J.; Lazar, A.; Marié, L.; Dausse, D.; Brehmer, P. On the dynamics of the southern Senegal upwelling center: Observed variability from synoptic to superinertial scales. J. Phys. Oceanogr. 2017, 47, 155–180. [Google Scholar] [CrossRef]
  50. Alvain, S.; Moulin, C.; Dandonneau, Y.; Bréon, F. Remote sensing of phytoplankton groups in case 1 waters from global SeaWiFS imagery. Deep. Sea Res. Part I Oceanogr. Res. Pap. 2005, 52, 1989–2004. [Google Scholar] [CrossRef] [Green Version]
  51. Skonieczny, C.; McGee, D.; Winckler, G.; Bory, A.; Bradtmiller, L.; Kinsley, C.; Polissar, P.; De Pol-Holz, R.; Rossignol, L.; Malaizé, B. Monsoon-driven Saharan dust variability over the past 240,000 years. Sci. Adv. 2019, 5, eaav1887. [Google Scholar] [CrossRef] [PubMed] [Green Version]
  52. Jethva, H.; Torres, O.; Ahn, C. Global assessment of OMI aerosol single-scattering albedo using ground-based AERONET inversion. J. Geophys. Res. Atmos. 2014, 119, 9020–9040. [Google Scholar] [CrossRef]
  53. Horváth, Á.; Seethala, C.; Deneke, H. View angle dependence of MODIS liquid water path retrievals in warm oceanic clouds. J. Geophys. Res. Atmos. 2014, 119, 8304–8328. [Google Scholar] [CrossRef]
  54. Wagener, T. Le fer à l’interface océan-atmosphère: Flux et processus de dissolution dans l’eau de mer. Ph.D. Thesis, Université de la Méditerranée-Aix-Marseille II, Marseille, France, 2008. [Google Scholar]
  55. Ryder, C.; Highwood, E.; Lai, T.; Sodemann, H.; Marsham, J. Impact of atmospheric transport on the evolution of microphysical and optical properties of Saharan dust. Geophys. Res. Lett. 2013, 40, 2433–2438. [Google Scholar] [CrossRef]
  56. Shi, W.; Wang, M. Detection of turbid waters and absorbing aerosols for the MODIS ocean color data processing. Remote Sens. Environ. 2007, 110, 149–161. [Google Scholar] [CrossRef]
  57. Pfahl, S.; Sodemann, H. What controls deuterium excess in global precipitation? Clim. Past 2014, 10, 771–781. [Google Scholar] [CrossRef] [Green Version]
  58. Lathuilière, C.; Echevin, V.; Lévy, M. Seasonal and intraseasonal surface chlorophyll-a variability along the northwest African coast. J. Geophys. Res. Oceans 2008, 113. [Google Scholar] [CrossRef] [Green Version]
  59. Barton, E.D.; Arıstegui, J.; Tett, P.; Cantón, M.; Garcıa-Braun, J.; Hernández-León, S.; Nykjaer, L.; Almeida, C.; Almunia, J.; Ballesteros, S.; et al. Others The transition zone of the Canary Current upwelling region. Prog. Oceanogr. 1998, 41, 455–504. [Google Scholar] [CrossRef]
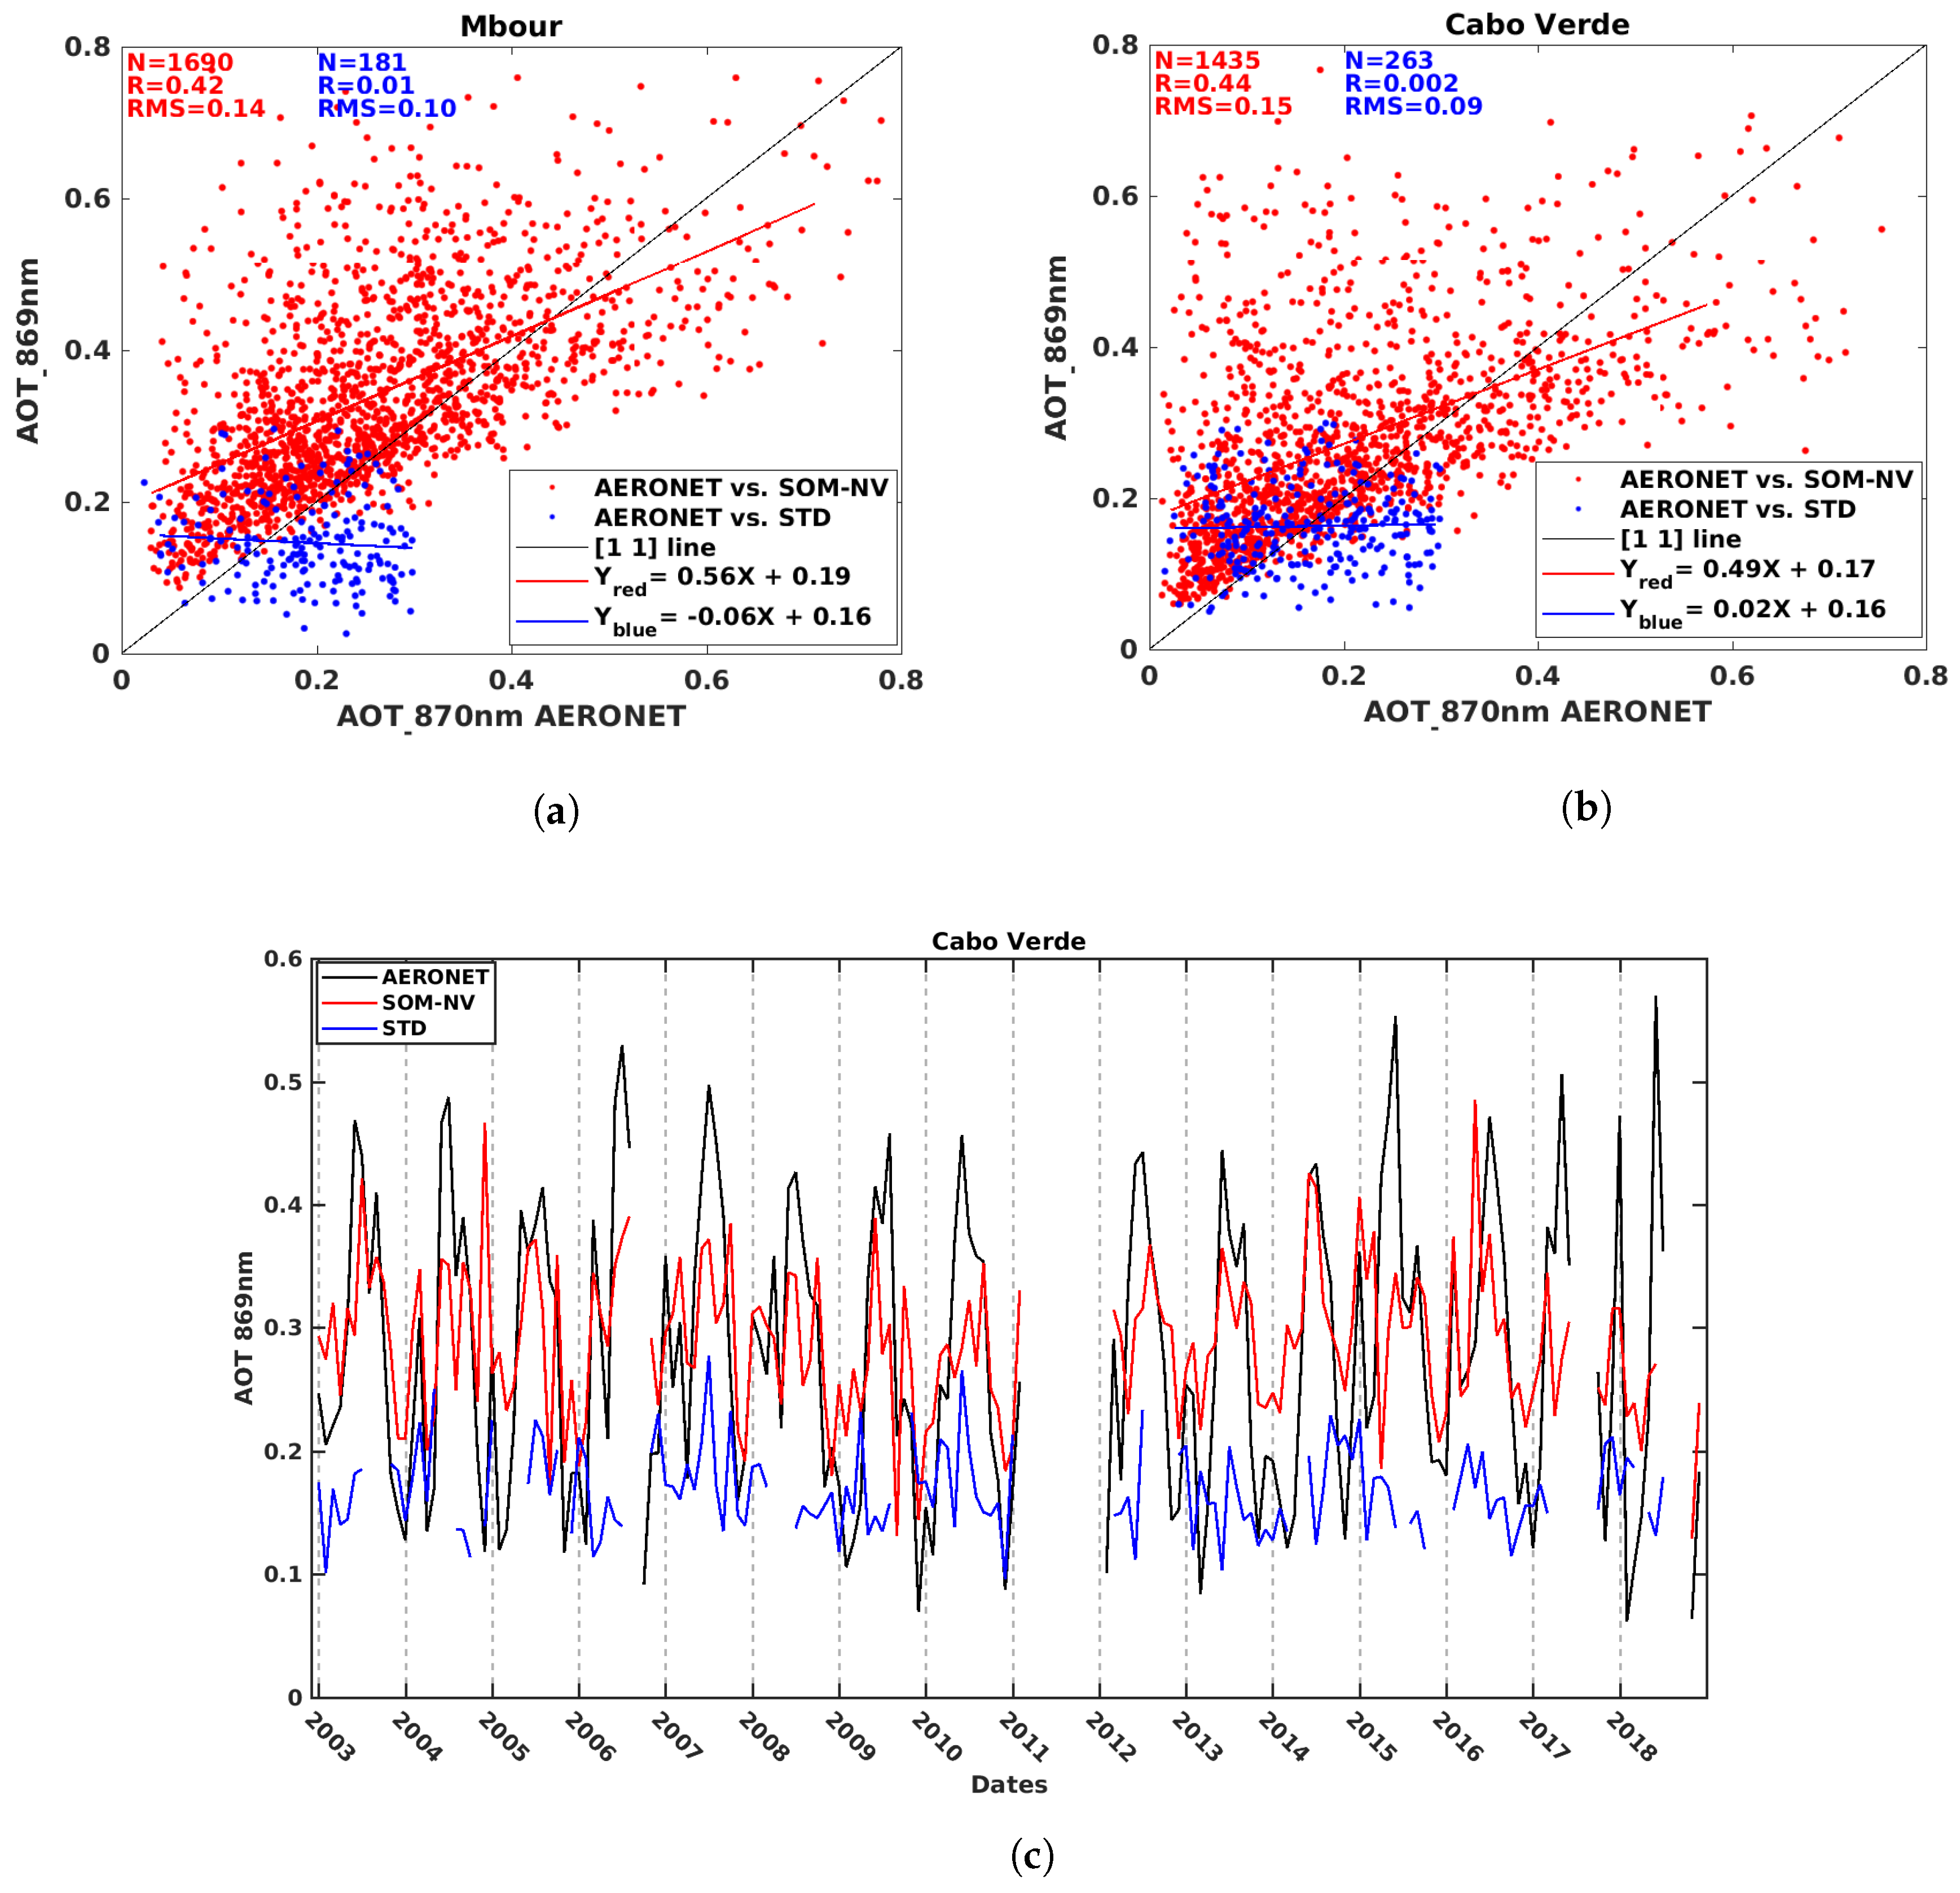
Figure 1. Daily AOT observed at (a) Mbour and (b) Cabo Verde. AERONET stations as a function of daily AOT estimated by standard (blue) and SOM-NV (red) algorithms processing of MODIS Aqua data. Red and blue lines are the linear regressions between AERONET AOTs and SOM-NV and STD, respectively. N, R, and RMS are, respectively, the number of observations, R-squared, and Root-Mean-Square. (c) Monthly time series of AOT at Cabo Verde’s station from 2003 to 2018.
Remotesensing 15 03613 g001
Figure 2. Illustration of the impact of SOM-NV algorithm on AOT and Chla MODIS retrieval for 4 January 2003: (a) True color image, (b) STD Chla concentration, (c) STD AOT at 869 nm, (d) SOM-NV Chla concentration, and (e) SOM-NV AOT at 869 nm. MR for Mauritania, SN for Senegal, CV for Cabo Verde, and BG for Guinea-Bissau.
Remotesensing 15 03613 g002
Figure 3. An example of the SOM-NV’s Chla histogram in three cases for the 4 January 2003 image: (a) distribution for all SOM-NV valid pixels, (b) distribution for pixels processed only by SOM-NV, and (c) distribution for pixels shared with STD processing.
Remotesensing 15 03613 g003
Figure 4. (a) Monthly mean coverage over the whole domain is exhibited on panel (b). (b,c) Annual average of data coverage (%) over the whole domain based on daily L2 images for the years 2003 to 2018 is shown in (b) for SOM-NV and (c) for STD MODIS-Aqua processing. (d) Ratio of annual mean coverage between SOM-NV and STD processing.
Remotesensing 15 03613 g004
Figure 5. Mean reflectance as a function of Chla concentration for the five wavelengths of the MODIS-Aqua sensor in the visible spectrum (412, 443, 488, 531, and 547 nm): (a) STD and (b) SOM-NV processing of MODIS-Aqua images for the period 2003–2018 and for the domain of investigation (9–23°N and 13–28°W).
Remotesensing 15 03613 g005
Figure 6. (a) Chla measured by HPLC as a function of MODIS-Aqua Chla. (b) Chla measured by HPLC as a function of SOM-NV Chla. Colored dots correspond to the date of MODIS-Aqua tracks over our studied region. The HPLC data considered in this validation must be located within 4 km of a valid satellite pixel and collected within 4 h of the satellite’s time of passage.
Remotesensing 15 03613 g006
Figure 7. (a,b) Chla STD MODIS-Aqua and SOM-NV, along with the ship-track FP Chla November 23rd 2015 (2 pm). Numbers along the ship track correspond to daily hour. (c,d) are STD (blue) or SOM-NV (red) satellite and FP (plain and dashed lines) Chla time series along the ship track. Chla regression between HPLC and FP (Figure A6) shows a systematic overestimation of Chla by FP. A factor of 0.58 was, thus, applied to the correct FP Chla (black line). Raw FP Chla is represented by a dashed line. (eh) are equivalent to (ad) for 30 November 2017 (2:40 pm).
Remotesensing 15 03613 g007aRemotesensing 15 03613 g007b
Figure 8. (a) Seasonal averages of surface chlorophyll a concentrations for, from left to right, winter (DJF), spring (MAM), summer (JJA), and fall (SON). Top panels correspond to SOM-NV, bottom panels to STD. (b) Latitudinal cross-shore distribution of Chla between the coast and 24°W over latitude bands 13–13.5°N and 18–18.5°N (red and yellow for SOM-NV and blue and green for STD). From top to bottom: winter, spring, summer, and fall seasons.
Remotesensing 15 03613 g008
Table 1. SeaWiFS and MODIS sensor’s wavelengths used for SOM-NV processing.
SeaWiFS Band NumberSeaWiFS WavelengthMODIS Band NumberMODIS Center Band
14128412
24439443
349010488
451011531
555512547
776515748
886516869
Table 2. Seasonal correlations and significance of satellite and AERONET estimates of AOT869 Cabo Verde.
AutumnWinterSpringSummer
SOM-NV corr.0.530.680.370.43
p-value<0.05<0.05<0.05<0.55
STD corr.0.210.02−0.220.35
p-value0.070.83460.04420.1352
Disclaimer/Publisher’s Note: The statements, opinions and data contained in all publications are solely those of the individual author(s) and contributor(s) and not of MDPI and/or the editor(s). MDPI and/or the editor(s) disclaim responsibility for any injury to people or property resulting from any ideas, methods, instructions or products referred to in the content.