Article

Exploring Multisource Feature Fusion and Stacking Ensemble Learning for Accurate Estimation of Maize Chlorophyll Content Using Unmanned Aerial Vehicle Remote Sensing

1
Institute of Farmland Irrigation, Chinese Academy of Agricultural Sciences, Xinxiang 453002, China
2
School of Surveying and Land Information Engineering, Henan Polytechnic University, Jiaozuo 454003, China
3
Key Laboratory of Water-Saving Irrigation Engineering, Ministry of Agriculture & Rural Affairs, Xinxiang 453002, China
4
Key Laboratory of Water-Saving Agriculture of Henan Province, Xinxiang 453002, China
*
Author to whom correspondence should be addressed.
Remote Sens. 2023, 15(13), 3454; https://doi.org/10.3390/rs15133454
Submission received: 16 June 2023 / Revised: 3 July 2023 / Accepted: 6 July 2023 / Published: 7 July 2023

Abstract

:
Crop chlorophyll content measuring plays a vital role in monitoring crop growth and optimizing agricultural inputs such as water and fertilizer. However, traditional methods for measuring chlorophyll content primarily rely on labor-intensive chemical analysis. These methods not only involve destructive sampling but also are time-consuming, often resulting in obtaining monitoring results after the optimal growth period of crops. Unmanned aerial vehicle (UAV) remote sensing technology offers the potential for rapidly acquiring chlorophyll content estimations over large areas. Currently, most studies only utilize single features from UAV data and employ traditional machine learning algorithms to estimate chlorophyll content, while the potential of multisource feature fusion and stacking ensemble learning in chlorophyll content estimation research remains largely unexplored. Therefore, this study collected UAV spectral features, thermal features, structural features, as well as chlorophyll content data during maize jointing, trumpet, and big trumpet stages, creating a multisource feature dataset. Subsequently, chlorophyll content estimation models were built based on four machine learning algorithms, namely, ridge regression (RR), light gradient boosting machine (LightGBM), random forest regression (RFR), and stacking ensemble learning. The research results demonstrate that (1) the multisource feature fusion approach achieves higher estimation accuracy compared to the single-feature method, with R2 ranging from 0.699 to 0.754 and rRMSE ranging from 8.36% to 9.47%; and (2) the stacking ensemble learning outperforms traditional machine learning algorithms in chlorophyll content estimation accuracy, particularly when combined with multisource feature fusion, resulting in the best estimation results. In summary, this study proves the effective improvement in chlorophyll content estimation accuracy through multisource feature fusion and stacking ensemble learning. The combination of these methods provides reliable estimation of chlorophyll content using UAV remote sensing technology and brings new insights to precision agriculture management in this field.

Graphical Abstract

1. Introduction

Chlorophyll content serves as a crucial indicator of crop photosynthetic and nutritional status [1]. Obtaining accurate spatial and temporal dynamics of chlorophyll content in crops is essential for guiding subsequent resource input and yield estimation. Traditional methods for measuring chlorophyll content in crops predominantly rely on manual chemical analysis, which suffers from low efficiency and high costs. Consequently, these methods fail to meet the demand for rapid acquisition of chlorophyll content on a field scale [2]. In recent years, handheld chlorophyll meters such as the soil plant analysis development (SPAD)-502 plus (Konica Minolta Co., Tokyo, Japan) have emerged as effective tools for rapid and nondestructive acquisition of crop chlorophyll content [3]. However, these devices require manual handheld operation and are still not suitable for the swift acquisition of chlorophyll content estimation across large areas in the field.
Remote sensing technology offers a more cost-effective approach to obtain chlorophyll content estimation in crops compared to ground-based measurements [4]. Satellite remote sensing technology, although capable of large-scale data acquisition, is constrained by weather conditions, spatial resolution, and revisit cycles, making it challenging to obtain precise crop canopy information and unsuitable for rapid field-scale detection of chlorophyll content [5]. In contrast, unmanned aerial vehicle (UAV) remote sensing technology surpasses satellite remote sensing with its advantages of high mobility, low cost, and superior spatial and temporal resolution, presenting unparalleled potential for field-scale chlorophyll content monitoring [6,7,8]. Presently, spectral features derived from UAV multispectral (MS) sensors are widely used to estimate chlorophyll content in current studies [4]. For instance, Wang et al. [3] employed spectral features obtained during the winter wheat overwintering stage and combined them with feature selection methods to enhance chlorophyll content estimation, achieving a coefficient of determination (R2) value of 0.754 and relative root mean squared error (rRMSE) of 4.504%. In another study, Yang et al. [9] utilized spectral features to estimate potato chlorophyll content using an ensemble learning method, resulting in an R2 value of 0.739 and a root mean squared error (RMSE) value of 0.511. Qiao et al. [10] developed vegetation indices (VIs) at the jointing stage to estimate maize chlorophyll content, attaining an R2 value of 0.682 and an RMSE value of 2.361. In addition to spectral features, canopy thermal and structural features obtained from thermal infrared (TIR) sensors and red–green–blue (RGB) sensors have proven successful in recent studies for estimating traits such as biomass, yield, leaf area index, and chlorophyll content [11,12,13,14]. However, these studies solely employed single features, which possess a relatively simple structure and may be influenced by soil context, moisture content, and pest and disease stress [3]. Previous research has indicated that fusing multisource features tends to yield higher accuracy in trait estimation compared to using single features alone [14]. Thus, multisource feature fusion emerges as an effective approach to improving the accuracy of crop chlorophyll content estimation.
In recent years, with the rapid development of computer technology and artificial intelligence, using machine learning for estimating crop growth parameters has become a hot research topic in the field of agriculture [15,16,17]. To improve the accuracy and stability of estimation, machine learning algorithms, especially deep learning methods, have been widely applied in the study of remote-sensing-based estimation of crop growth parameters. Deep learning algorithms, by constructing deep neural network models, can automatically learn high-level feature representations from remote sensing data and optimize parameters through large-scale training samples, thereby enhancing estimation accuracy and generalization ability [18,19]. The advantages of deep learning lie in its ability to model nonlinear relationships in remote sensing data and perform feature extraction and combination through multilayer network structures, overcoming the limitations of traditional methods in feature extraction [20,21]. However, despite the significant achievements of deep learning in remote sensing estimation, it also faces some challenges [22]. Deep learning algorithms typically require a large amount of training samples and high computational resources [23,24]. Additionally, the selection and tuning of hyperparameters can be complex [18]. In order to further improve the performance and robustness of estimation, stacking ensemble learning methods have been introduced into remote sensing estimation research. Stacking ensemble learning, as an effective ensemble learning method, combines multiple different base models to achieve more accurate estimation results [12]. It accomplishes this by using the predictions of the base models as new features that are input into a metamodel for further learning and prediction, thereby improving estimation performance. Stacking ensemble learning possesses strong generalization ability and adaptability, effectively leveraging the complementarity between different base models to further enhance estimation accuracy and robustness [13]. In the study of remote-sensing-based estimation of crop growth parameters, stacking ensemble learning demonstrates its unique advantages. Therefore, this study aims to explore and apply stacking ensemble learning techniques to improve the accuracy and stability of remote-sensing-based estimation of crop growth parameters.
To address this gap, the present study employs a UAV platform to collect spectral, thermal, and structural features for estimating maize chlorophyll content, employing stacking ensemble learning. The specific objectives of this study are as follows: (1) to evaluate the potential of multisource feature fusion in estimating maize chlorophyll content, and (2) to investigate the capabilities of stacking ensemble learning in estimating maize chlorophyll content.

2. Materials and Methods

2.1. Study Area and Experimental Design

The experiments were conducted at the Xinxiang Integrated Experimental Base of the Chinese Academy of Agricultural Sciences, located in Xinxiang County, Henan Province, China (113°45′42″E, 35°08′05″N). Maize was sown on 15 June 2022, covering an area of approximately 1920 m2, divided into 120 plots measuring 2 m × 4 m each (Figure 1). Each set of 30 plots received a different gradient of N fertilizer treatment, resulting in a total of four gradient N fertilizer treatments: N0 (0 kg/hm2), N1 (80 kg/hm2), N2 (120 kg/hm2), and N3 (160 kg/hm2). Ten maize varieties were selected and replanted three times under each N fertilizer treatment gradient. Field management adhered to the local best practices, including timely weeding, pest control, and disease prevention measures.

2.2. Data Acquisition

2.2.1. UAV Data Acquisition

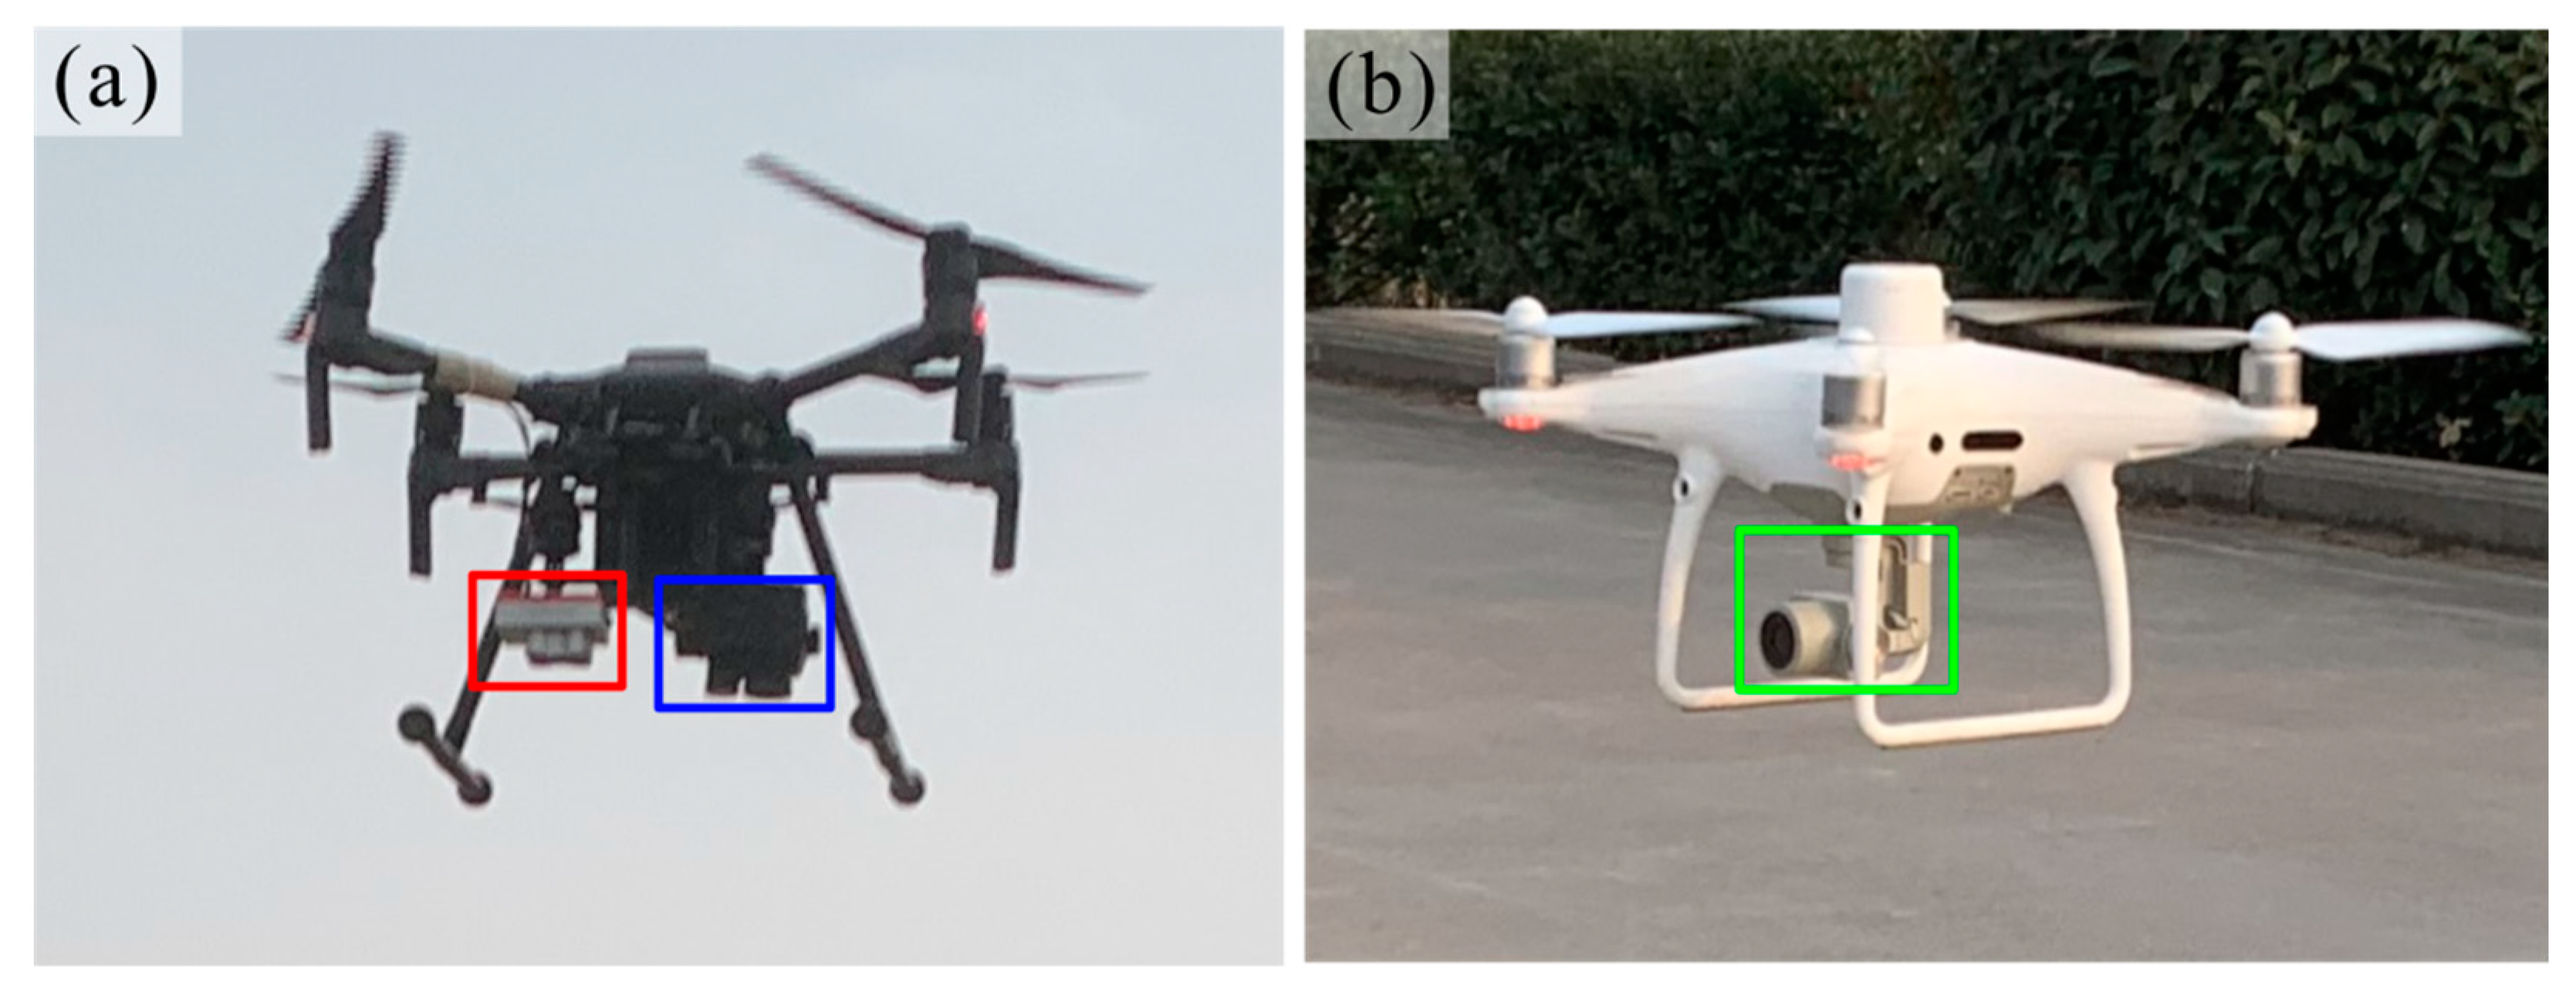
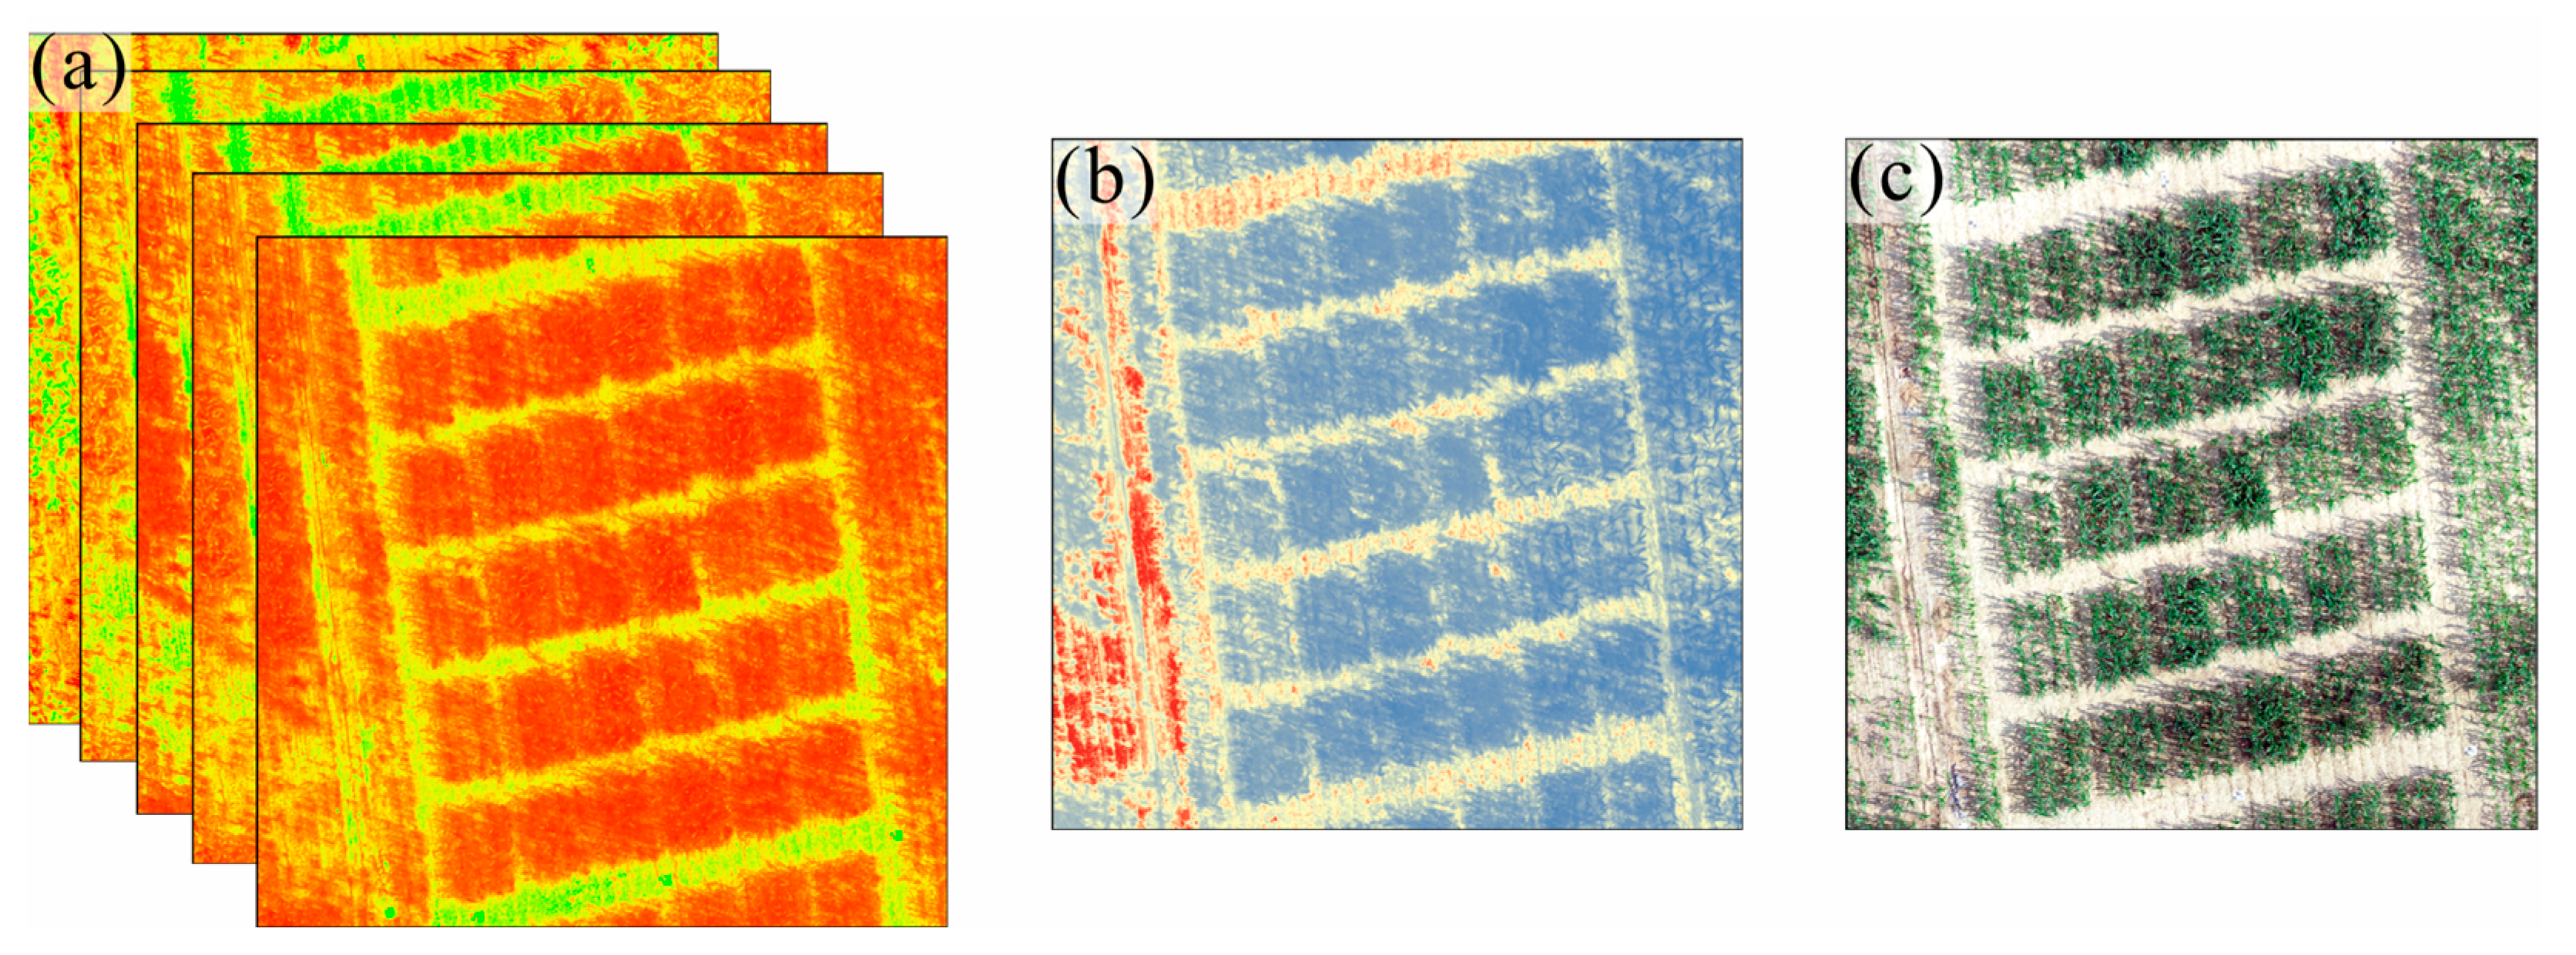
The MS data and TIR data were collected using a DJI M210 UAV (SZ DJI Technology Co., Shenzhen, China) equipped with a RedEdge-MX MS sensor (MicaSense Inc., Seattle, WA, USA) and a Zenmuse XT2 TIR sensor (SZ DJI Technology Co.) (refer to Figure 2). The RGB data was collected using the DJI Phantom 4 RTK UAV (SZ DJI Technology Co.) equipped with an RGB sensor (refer to Figure 2). Please refer to Table 1 for further information on each sensor; Figure 3 shows the images captured by each sensor.
UAV data were collected at three stages of maize growth: the jointing stage (13 July), the trumpet stage (23 July), and the big trumpet stage (2 August). To ensure accurate observations and minimize errors caused by cloud cover, UAV data acquisition was conducted under clear, cloudless, and windless weather conditions. Flight paths were planned using DJI GS PRO 2.0.17 software (SZ DJI Technology Co.). It is crucial to maintain sufficient frontal and side overlap during data collection to ensure a high point cloud density and preserve the quality of the digital orthophoto map (DOM) of the study area. Therefore, the flight altitude was set at 30 m, and the frontal and side overlap were both set at 85% for MS, TIR, and RGB images, respectively. The acquisition of MS data followed the experience of previous studies in which MS images of calibration panels were first collected before the acquisition of MS data. The captured MS images of the calibration panel in each band were then imported into the Pix4D 4.4.12 software (Pix4D, Lausanne, Switzerland) for calibration of the MS data. The calibration formula is shown in the following Equation (1):
R i = D N i D N s i R s i
where Ri is the reflectance of the ground target in the i-band of the MS camera and DNi is the corresponding DN value; Rsi is the reflectance of the calibration panel in the i-band of the MS camera and DNsi is the corresponding DN value.
In addition, 15 ground control points (GCPs) were established in the study area. These GCPs were evenly distributed throughout the study area and remained fixed during the entire growth stage of maize (Figure 1). The precise coordinates of the GCPs were obtained by placing the S3II se GNSS receiver (Situoli Surveying and Mapping Technology Co., Ltd., Guangzhou, China) at the center of each GCP. The exact coordinates of the GCPs were then imported into Pix4D 4.4.12 software to perform geo-calibration of the UAV images.
The acquired UAV images were processed using Pix4D 4.4.12 software to generate a digital orthophoto map (DOM). The main processing steps included: (1) Initializing the UAV images obtained during each mission using an automatic feature point matching algorithm. (2) Importing the coordinates of the 15 GCPs into the image geo-coordinate correction software to generate high-precision point cloud data based on the structure of the motion algorithm. (3) Generating the DOM using the inverse distance weighting method [3].
Once the UAV data were stitched together, the .shp file corresponding to each maize plot was created in ArcMap 10.8 software (Environmental Systems Research Institute, Inc., Redlands, CA, USA). The mean canopy reflectance value of each plot was extracted as the canopy information using the .shp file.

2.2.2. Maize Chlorophyll Content Acquisition

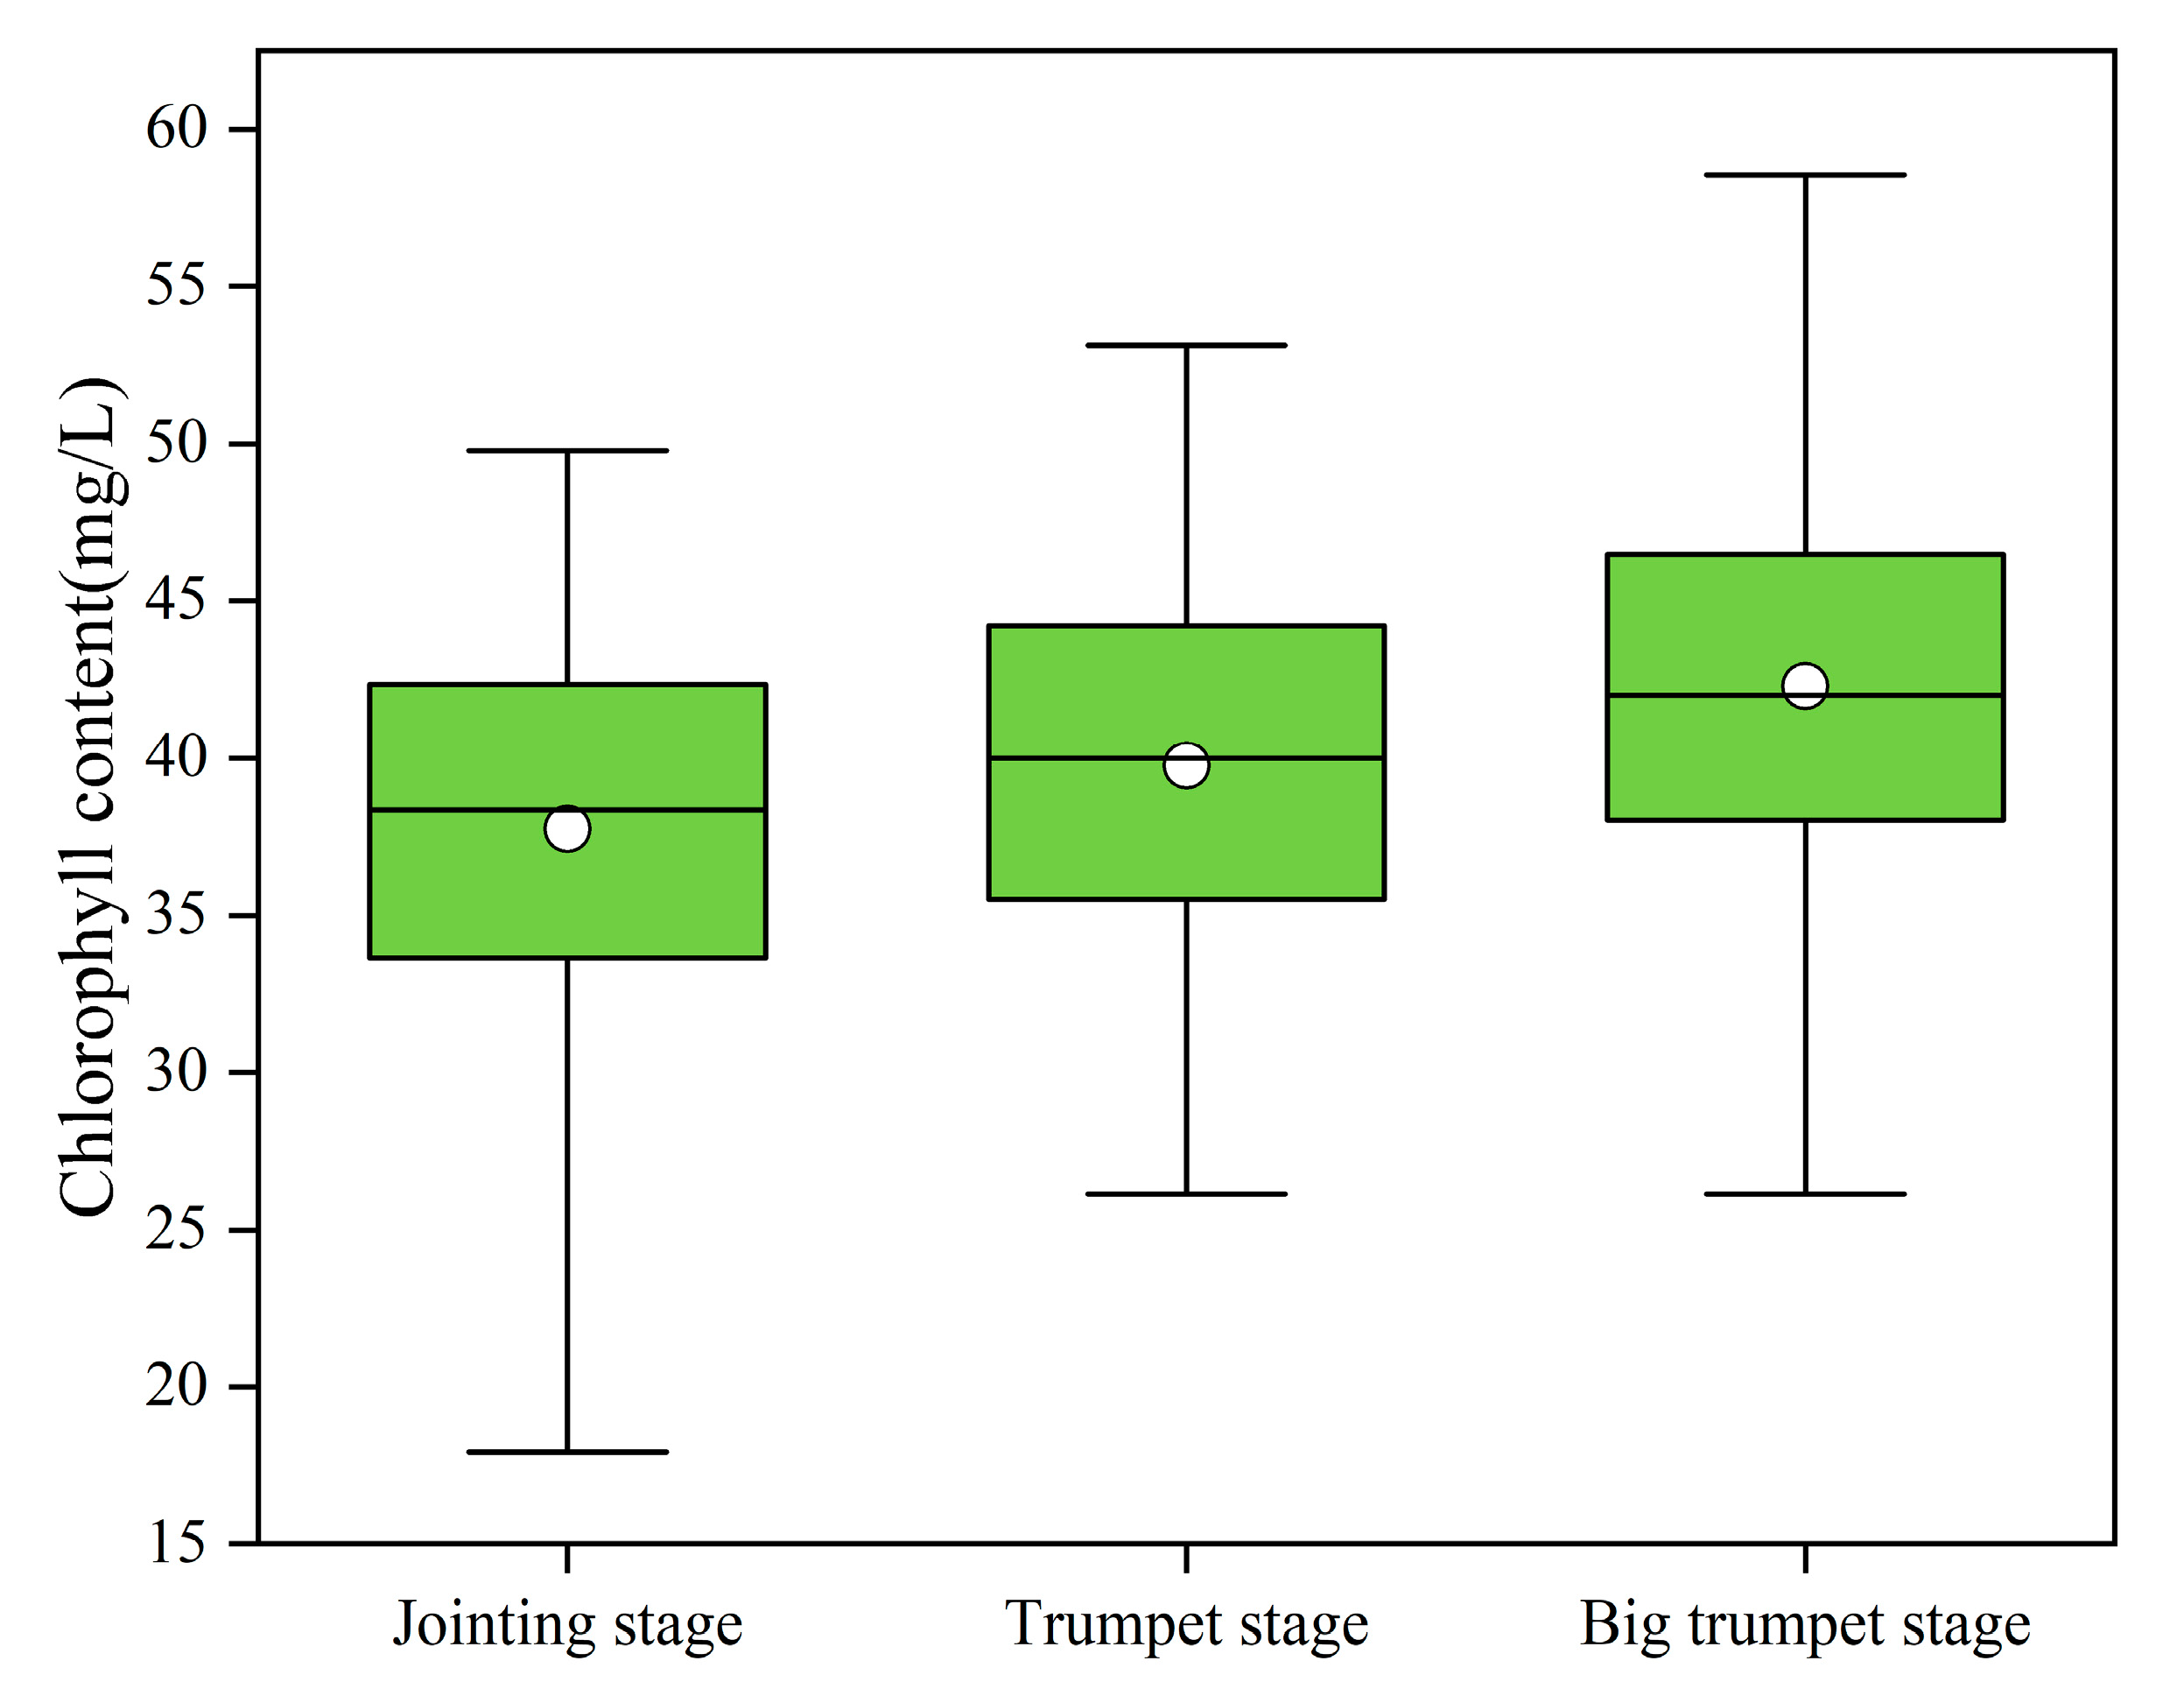
In each plot, three uniformly growing maize plants were randomly selected, and leaf samples were taken from the top canopy leaves. A piece of leaf tissue measuring 4 cm × 4 cm was cut from each leaf and then finely chopped. The chopped leaves were then immersed in 40 mL of 95% ethanol solution and kept in darkness for 72 h. Subsequently, the absorbance of the solution at wavelengths of 649 nm and 665 nm was measured using a UV-visible spectrophotometer (Shanghai Jing Hua Technology Instruments Co., Shanghai, China). The chlorophyll content was calculated based on the absorbance using Formulas (2)–(4) [10]. The distribution of chlorophyll content at the jointing, trumpet, and big trumpet stages is shown in Figure 4.
C a = 13.95 A 665 6.88 A 649
C b = 24.96 A 649 7.32 A 665
C h l o r o p h y l l   c o n t e n t = C a + C b
where A649 and A665 are the absorbance of the solution at wavelengths of 649 nm and 665 nm, respectively; Ca is the chlorophyll a content (mg/L); and Cb is the chlorophyll b content (mg/L).

2.3. Multisource Features Extraction

2.3.1. Canopy Spectral Features Extraction

The MS data were utilized to calculate VIs as spectral features of the canopy for estimating chlorophyll content. Five VIs known to be strongly correlated with crop growth status were employed in this study, and the calculation method for each VI is presented in Table 2.

2.3.2. Canopy Thermal Features Extraction

Normalized relative canopy temperature (NRCT) was calculated from TIR data as canopy thermal features to estimate chlorophyll content. NRCT has been widely used to assess crop growth, and the calculation formula is shown in Formula (5) [39].
N R C T = T i T m i n T m a x T m i n
where Ti is the average canopy temperature of the ith maize plot, Tmin is the lowest temperature in all maize plots, and Tmax is the highest temperature in all maize plots.

2.3.3. Canopy Structural Features Extraction

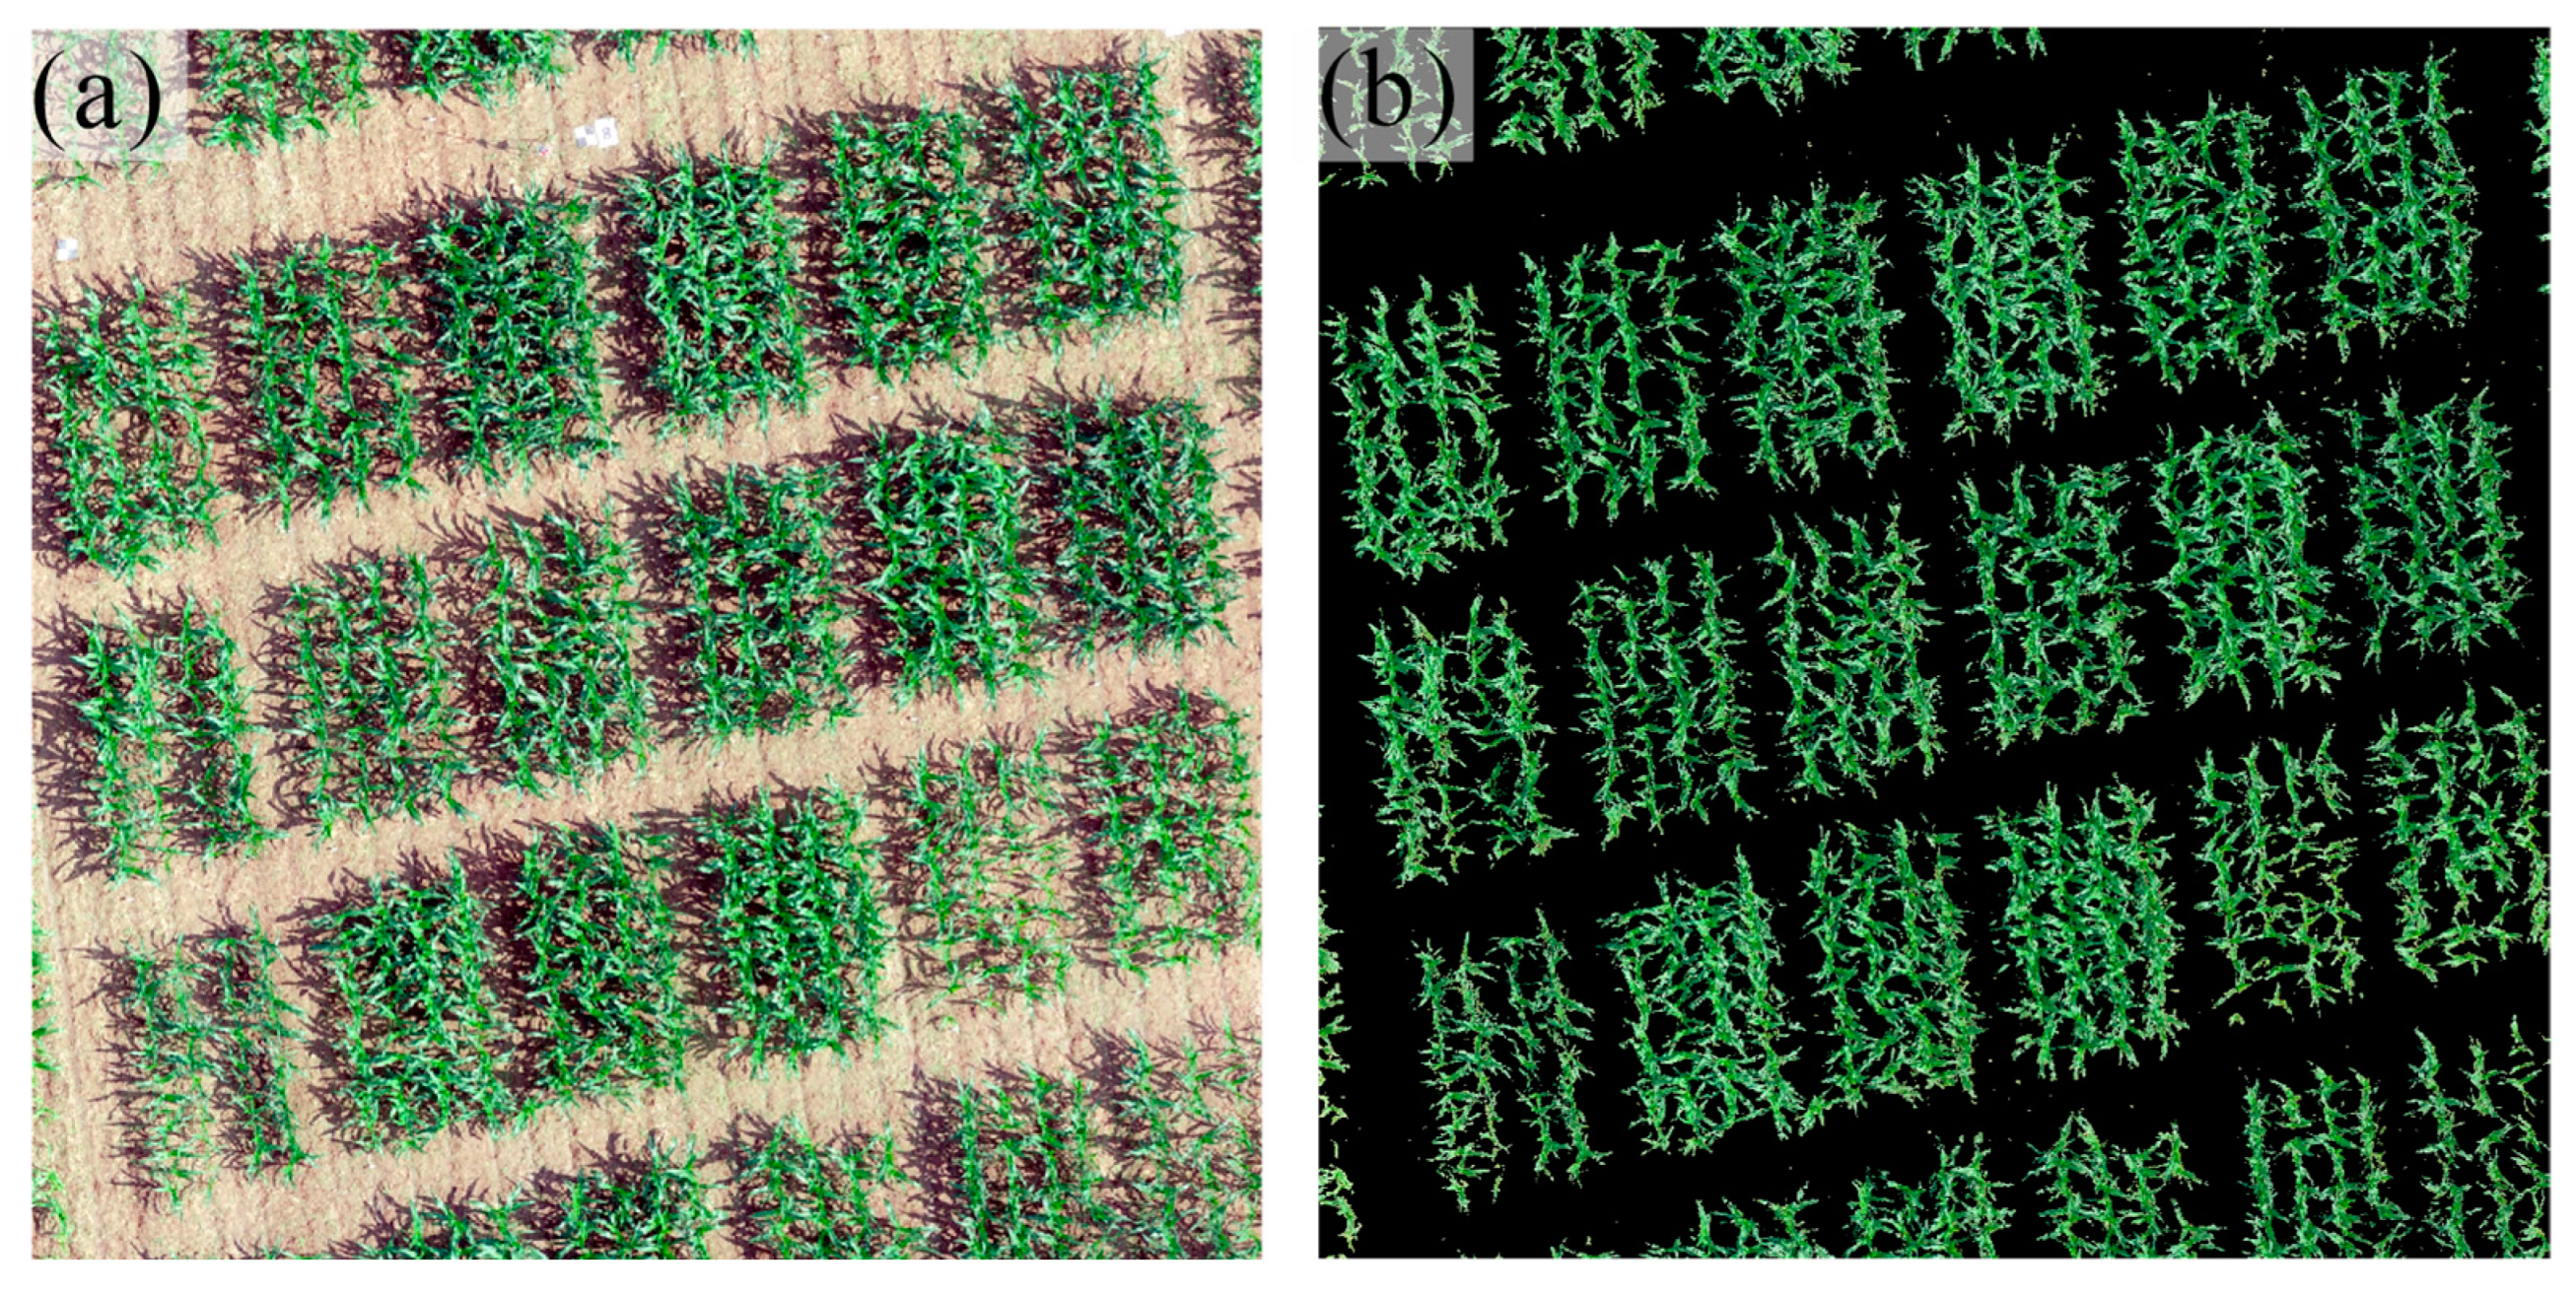
Crop cover (CC) and crop height (CH) were extracted from the RGB data as canopy structural features to estimate chlorophyll content. CC describes the proportion of vegetated area per unit area and can be used to characterize maize growth. In this study, ArcMap 10.8 software was used, and the excess green (EXG) vegetation index was selected for soil background removal. Firstly, in ArcMap 10.8 software, the EXG index was calculated using the red and green bands of the RGB image, according to Formula (6) [12]. The EXG index primarily measures the difference between the green and red bands to assess vegetation. The green band is highly sensitive to vegetation reflectance, while the red band is more strongly correlated with soil reflectance. Therefore, the EXG index can effectively distinguish between vegetation and soil, providing a basis for soil background removal. Next, the Reclassify tool in the Spatial Analyst toolbox was used to classify pixels based on a threshold. A new classified layer was created, where soil pixels were assigned a specific value (e.g., 0) and vegetation pixels were assigned another specific value (e.g., 1). This resulted in a vegetation mask file, which was applied to the original RGB image to effectively remove the soil background, as shown in Figure 5. Finally, the vegetation coverage was calculated by dividing the total number of vegetation pixels by the total number of pixels in the area, according to Formula (7) [40].
E x t r a   G r e e n = 2 G R B
C C = N u m b e r   o f   c r o p   p i x e l s   i n   t h e   p l o t T o t a l   n u m b e r   o f   p l o t   p i x e l s
Digital surface models (DSM) of maize at the jointing, trumpet, and big trumpet stages and bare soil were obtained using Pix4D 4.4.12 software based on RGB images. A raster calculator was applied in ArcMap 10.8 software to subtract the DSM of the bare soil from the DSM of the maize at the jointing, trumpet, and big trumpet stages in turn to obtain the crop height [41]. The average height of the canopy of each plot was extracted as the CH of each plot.

2.4. Model Building and Accuracy Assessment

2.4.1. Regression Techniques

The chlorophyll content estimation model was constructed using light gradient boosting machine (LightGBM), random forest regression (RFR), and ridge regression (RR) algorithms. LightGBM and RFR are machine learning algorithms that use boosting and bagging, respectively, as a framework, both of which have been widely used for crop phenotyping [42,43]. RR is a method used in regression analysis for dealing with multicollinearity problems and provides a way of regularizing the model [44]. In RR, the complexity of the model can be limited by adding an L2 regularization term to prevent overfitting. The tuning of hyperparameters is crucial to the performance of machine learning algorithms. The main hyperparameters adjusted by LightGBM and RFR algorithms are n_estimators and max_depth, where n_estimators are adjusted from 50 to 1000 and max_depth is adjusted from 1 to 10. The parameter to be adjusted by RR is alpha, and the range for adjusting alpha is from 0 to 0.03.
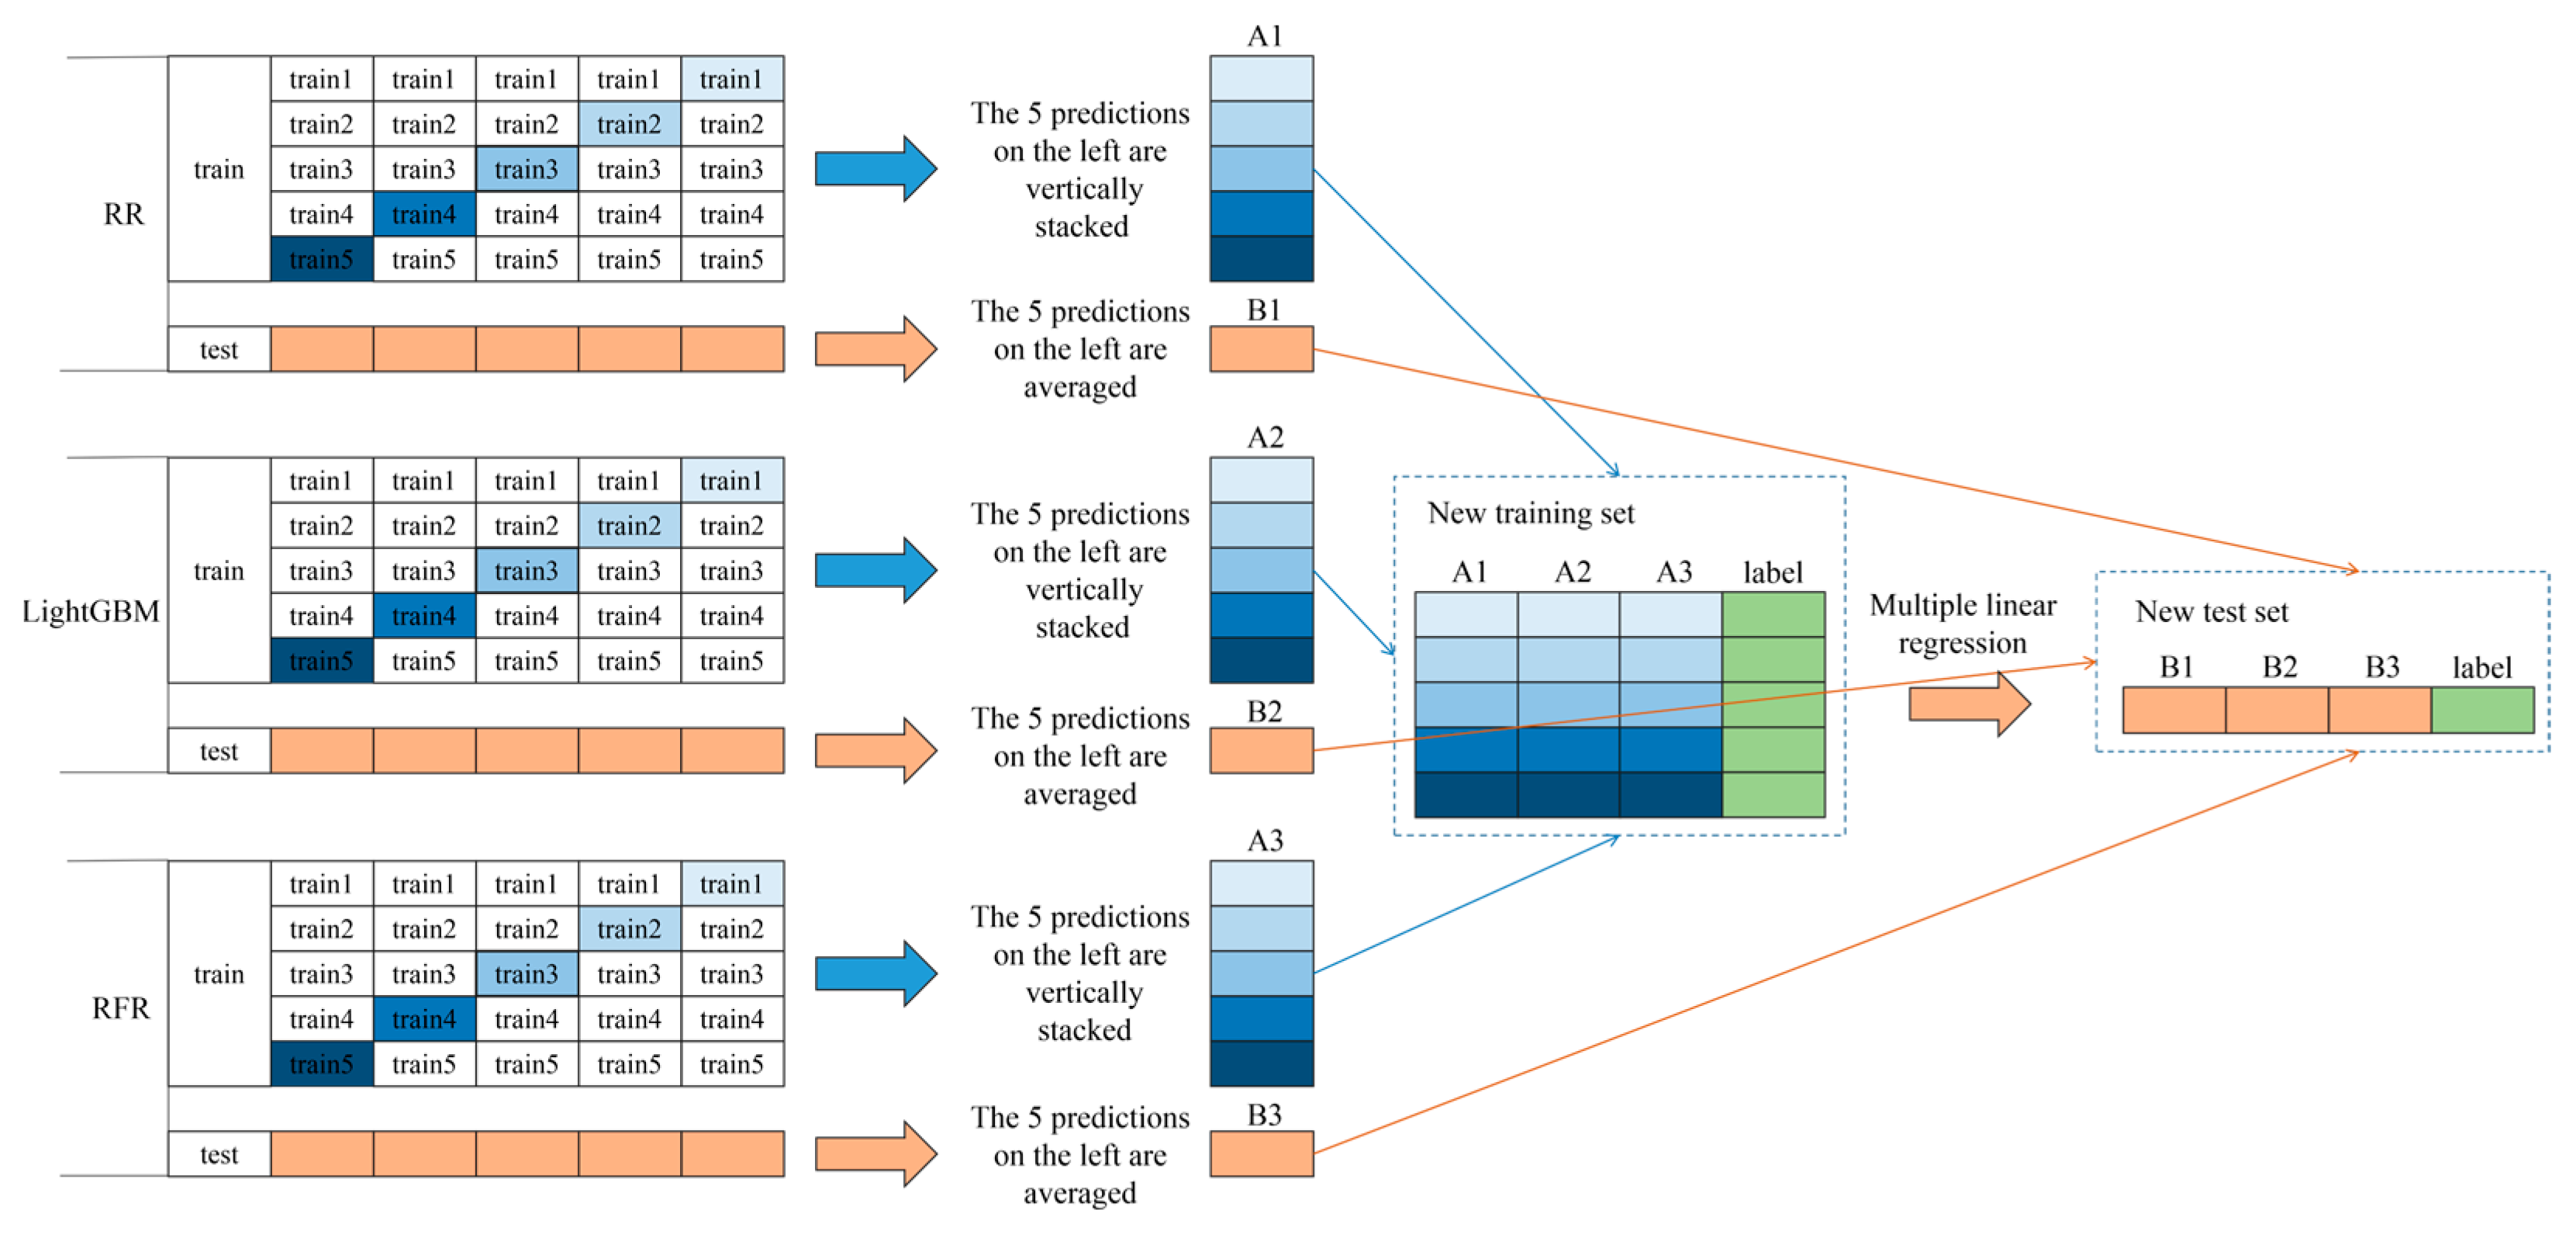
Stacking ensemble learning is a powerful machine learning technique that combines predictions from multiple base learners to obtain more accurate overall predictions [13]. This method hierarchically combines different learning algorithms to improve model performance and generalization ability. The implementation process, which is illustrated in Figure 6, is as follows: Firstly, the dataset is divided into two sets: the original training set and the original test set. The original training set is further divided into five subsets named train1, train2, train3, train4, and train5. Next, the base models are selected. In this study, LightGBM, RFR, and RR are chosen as the base models. Taking LightGBM as an example, each of the train1 to train5 subsets is used as the holdout test set, and the remaining four subsets are used as the training set for a 5-fold cross-validation to train the LightGBM model. Predictions are then made on the original test set. This process generates five sets of predictions obtained from training the LightGBM model on the original training set, as well as five sets of predictions made on the original test set. The predictions obtained from the original training set are vertically stacked to create feature A1, while the predictions obtained from the original test set are averaged to create feature B1. The operations for the RFR and RR models are similar. After training the three base models, their predictions on the original training set are used as features A1, A2, and A3, respectively. Multiple linear regression is employed as the metamodel to train the stacking ensemble model. Using the trained stacking ensemble model, the predictions obtained from the three base models on the original test set are combined to create features B1, B2, and B3. Finally, the model makes predictions using these features to obtain the final prediction results.

2.4.2. Assessment Methods

In this study, the dataset was divided into a training set and a test set in a 4:1 ratio to ensure the accuracy and reliability of model training and evaluation. The results of the dataset division are presented in Table 3. During the training phase, the model’s parameters were adjusted using grid search and fivefold cross-validation on the training set to find the optimal parameter combination. Grid search allows for trying different parameter combinations and evaluating the model’s performance on the training set. This approach helps identify the parameter configuration that maximizes the model’s performance, improving accuracy and stability. Finally, after the model training is completed, it is applied to the test set for evaluation. The evaluation of the model on the test set is conducted using the coefficient of determination (R2) and relative root mean square error (rRMSE) as evaluation metrics to objectively measure the model’s performance. R2 measures the model’s ability to explain the variability of the target variable, while rRMSE quantifies the relative magnitude of prediction errors. The formulas for calculating R2 and rRMSE are provided as Equations (8) and (9), respectively [45,46].
R 2 = 1 i = 1 n ( x i y i ) 2 i = 1 n ( x i y ¯ ) 2
rRMSE = i = 1 n ( x i y i ) 2 n y ¯ × 100 %
where xi is the measured chlorophyll content, yi is the estimated chlorophyll content, y ¯ is the mean of the measured chlorophyll content, and n is the number of samples in the test set.
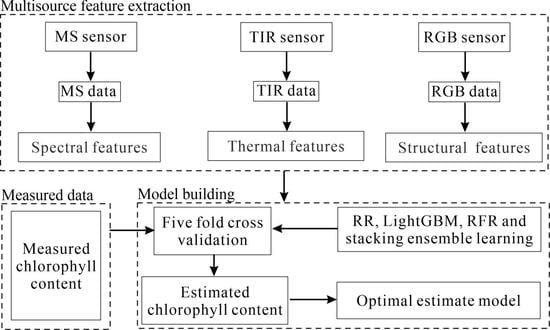
Figure 7 shows the overall workflow of this study. Fifteen VIs was first extracted from the MS data as spectral features, NRCT from the TIR data as thermal features, and CC and CH from the RGB data as structural features. The chlorophyll content of 120 plots measured at three growth stages, a total of 360 samples, were then used as input samples. Finally, the chlorophyll content was estimated based on RR, LightGBM, RFR, and stacking algorithms. The key to this study is to explore the potential of multisource feature fusion with stacking in chlorophyll content estimation.

3. Results

3.1. Multisource Features Fusion Chlorophyll Content Estimation

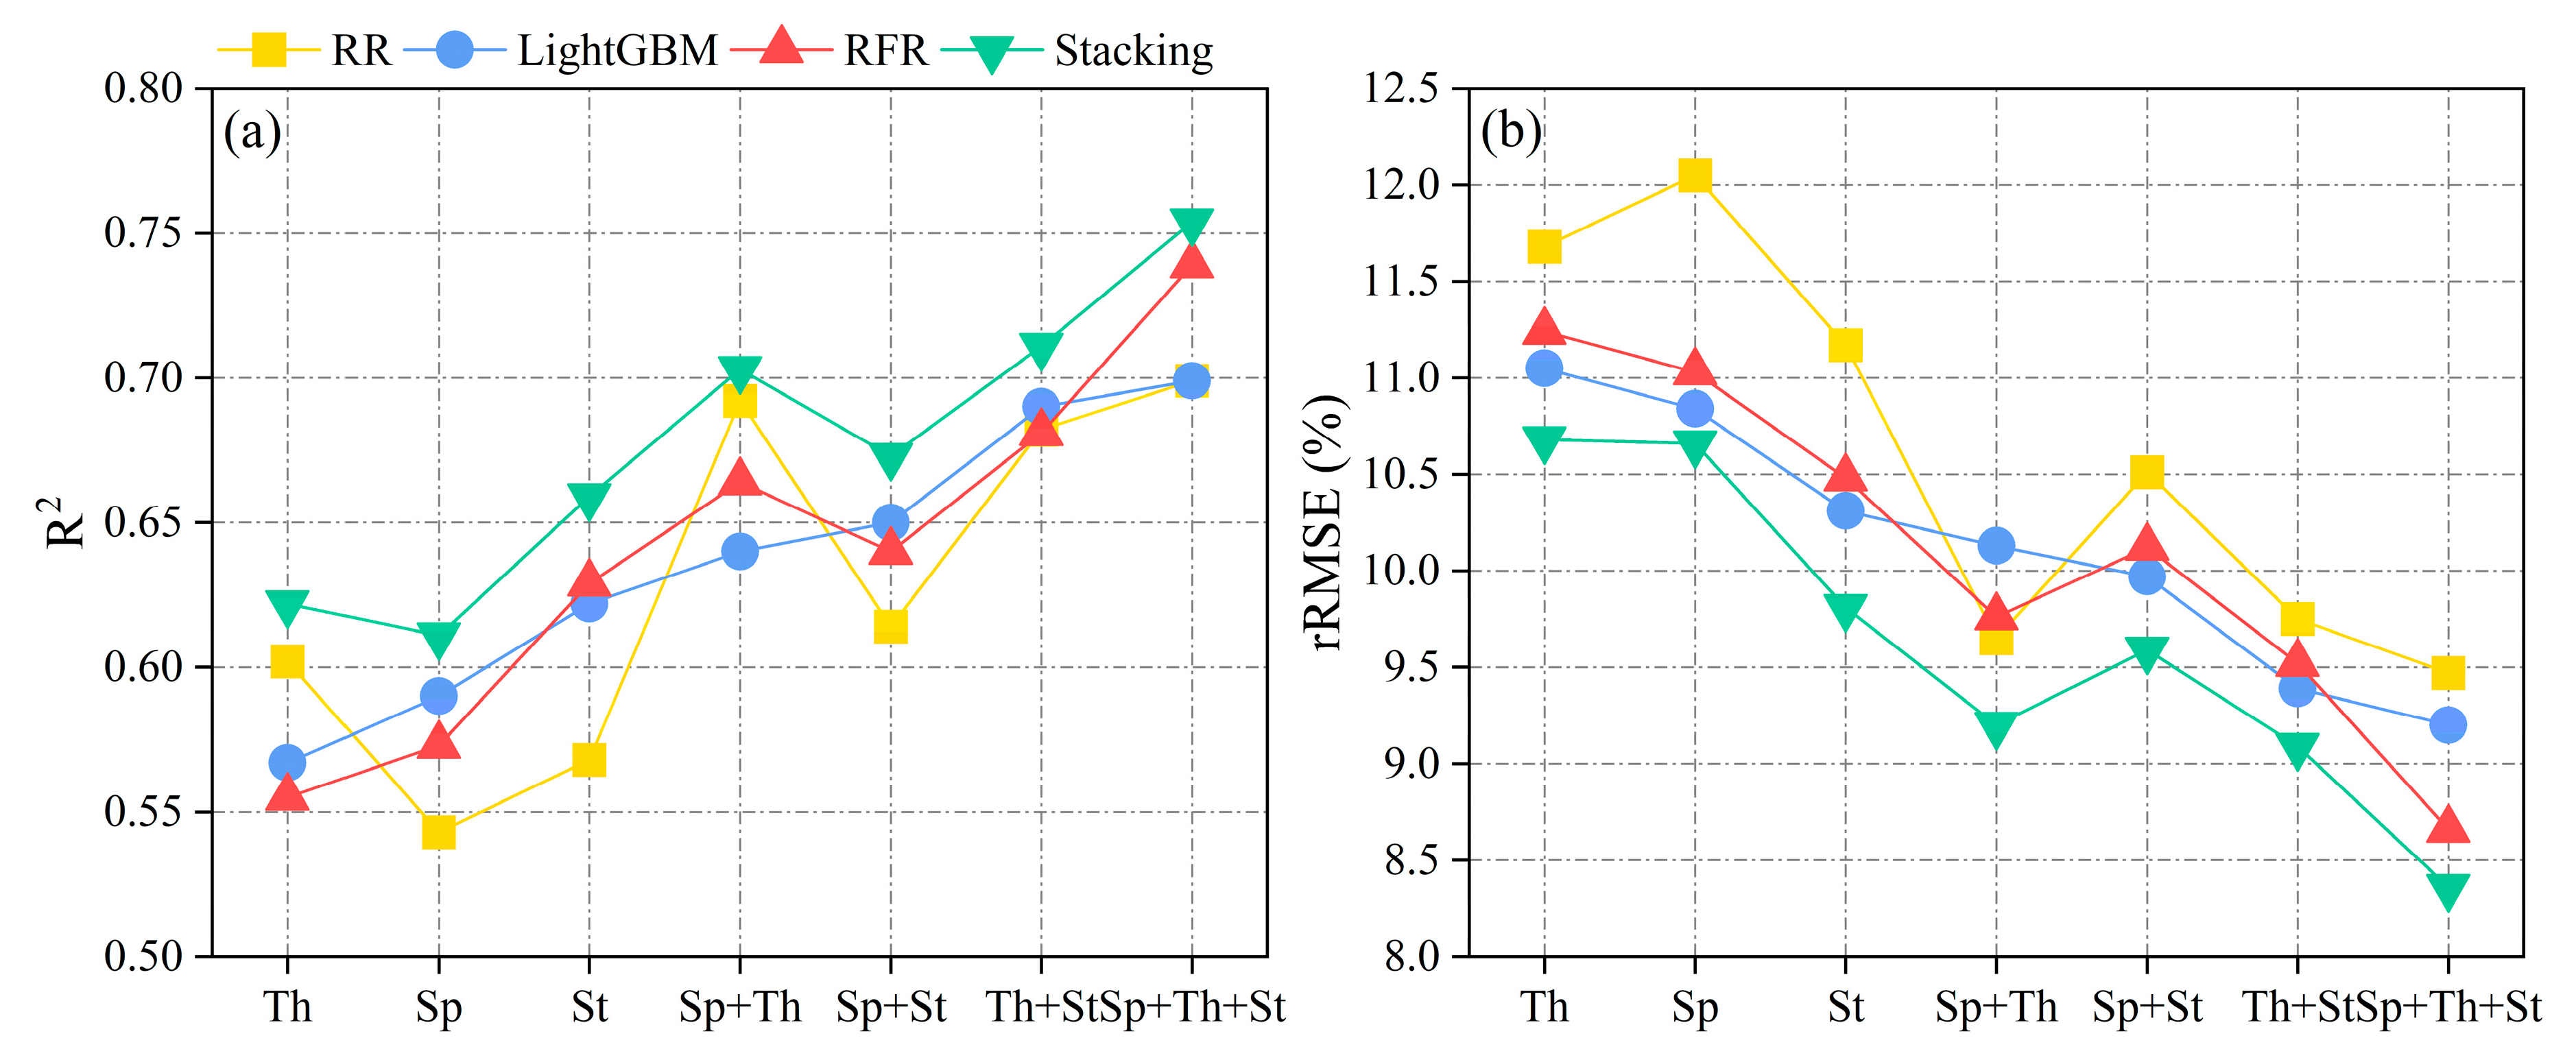
The input variables for estimating the chlorophyll content of maize included three canopy features: spectral, thermal, and structural. RR, LightGBM, RFR, and stacking were employed for estimation, as indicated in Table 4 and Figure 8. In terms of estimating chlorophyll content using single features, the RFR, LightGBM, and stacking algorithms exhibited the highest accuracy when utilizing structural features, yielding R2 values ranging from 0.622 to 0.659 and rRMSE values ranging from 9.81% to 10.48%. While RR gives the highest estimation accuracy when using thermal features, R2 is 0.602 and rRMSE is 11.68%. Notably, the fusion of multisource features led to a significant improvement in estimation accuracy compared to single features. In the case of dual-feature fusion, the thermal + structural combination yielded the best estimation results for the RFR, RR, and stacking algorithms, with R2 values ranging from 0.680 to 0.711 and rRMSE values ranging from 9.09% to 9.52%. The spectral + thermal combination yielded the best estimation results for the RR algorithms, with an R2 value of 0.692 and rRMSE of 9.65%. Moreover, when all three features were fused, the highest estimation accuracies were achieved by the four algorithms, with R2 values ranging from 0.699 to 0.754 and rRMSE values ranging from 8.36% to 9.47%. However, it is worth noting that although the three-feature fusion achieved the highest estimation accuracy, the improvement compared to the optimal two-feature combination was limited.
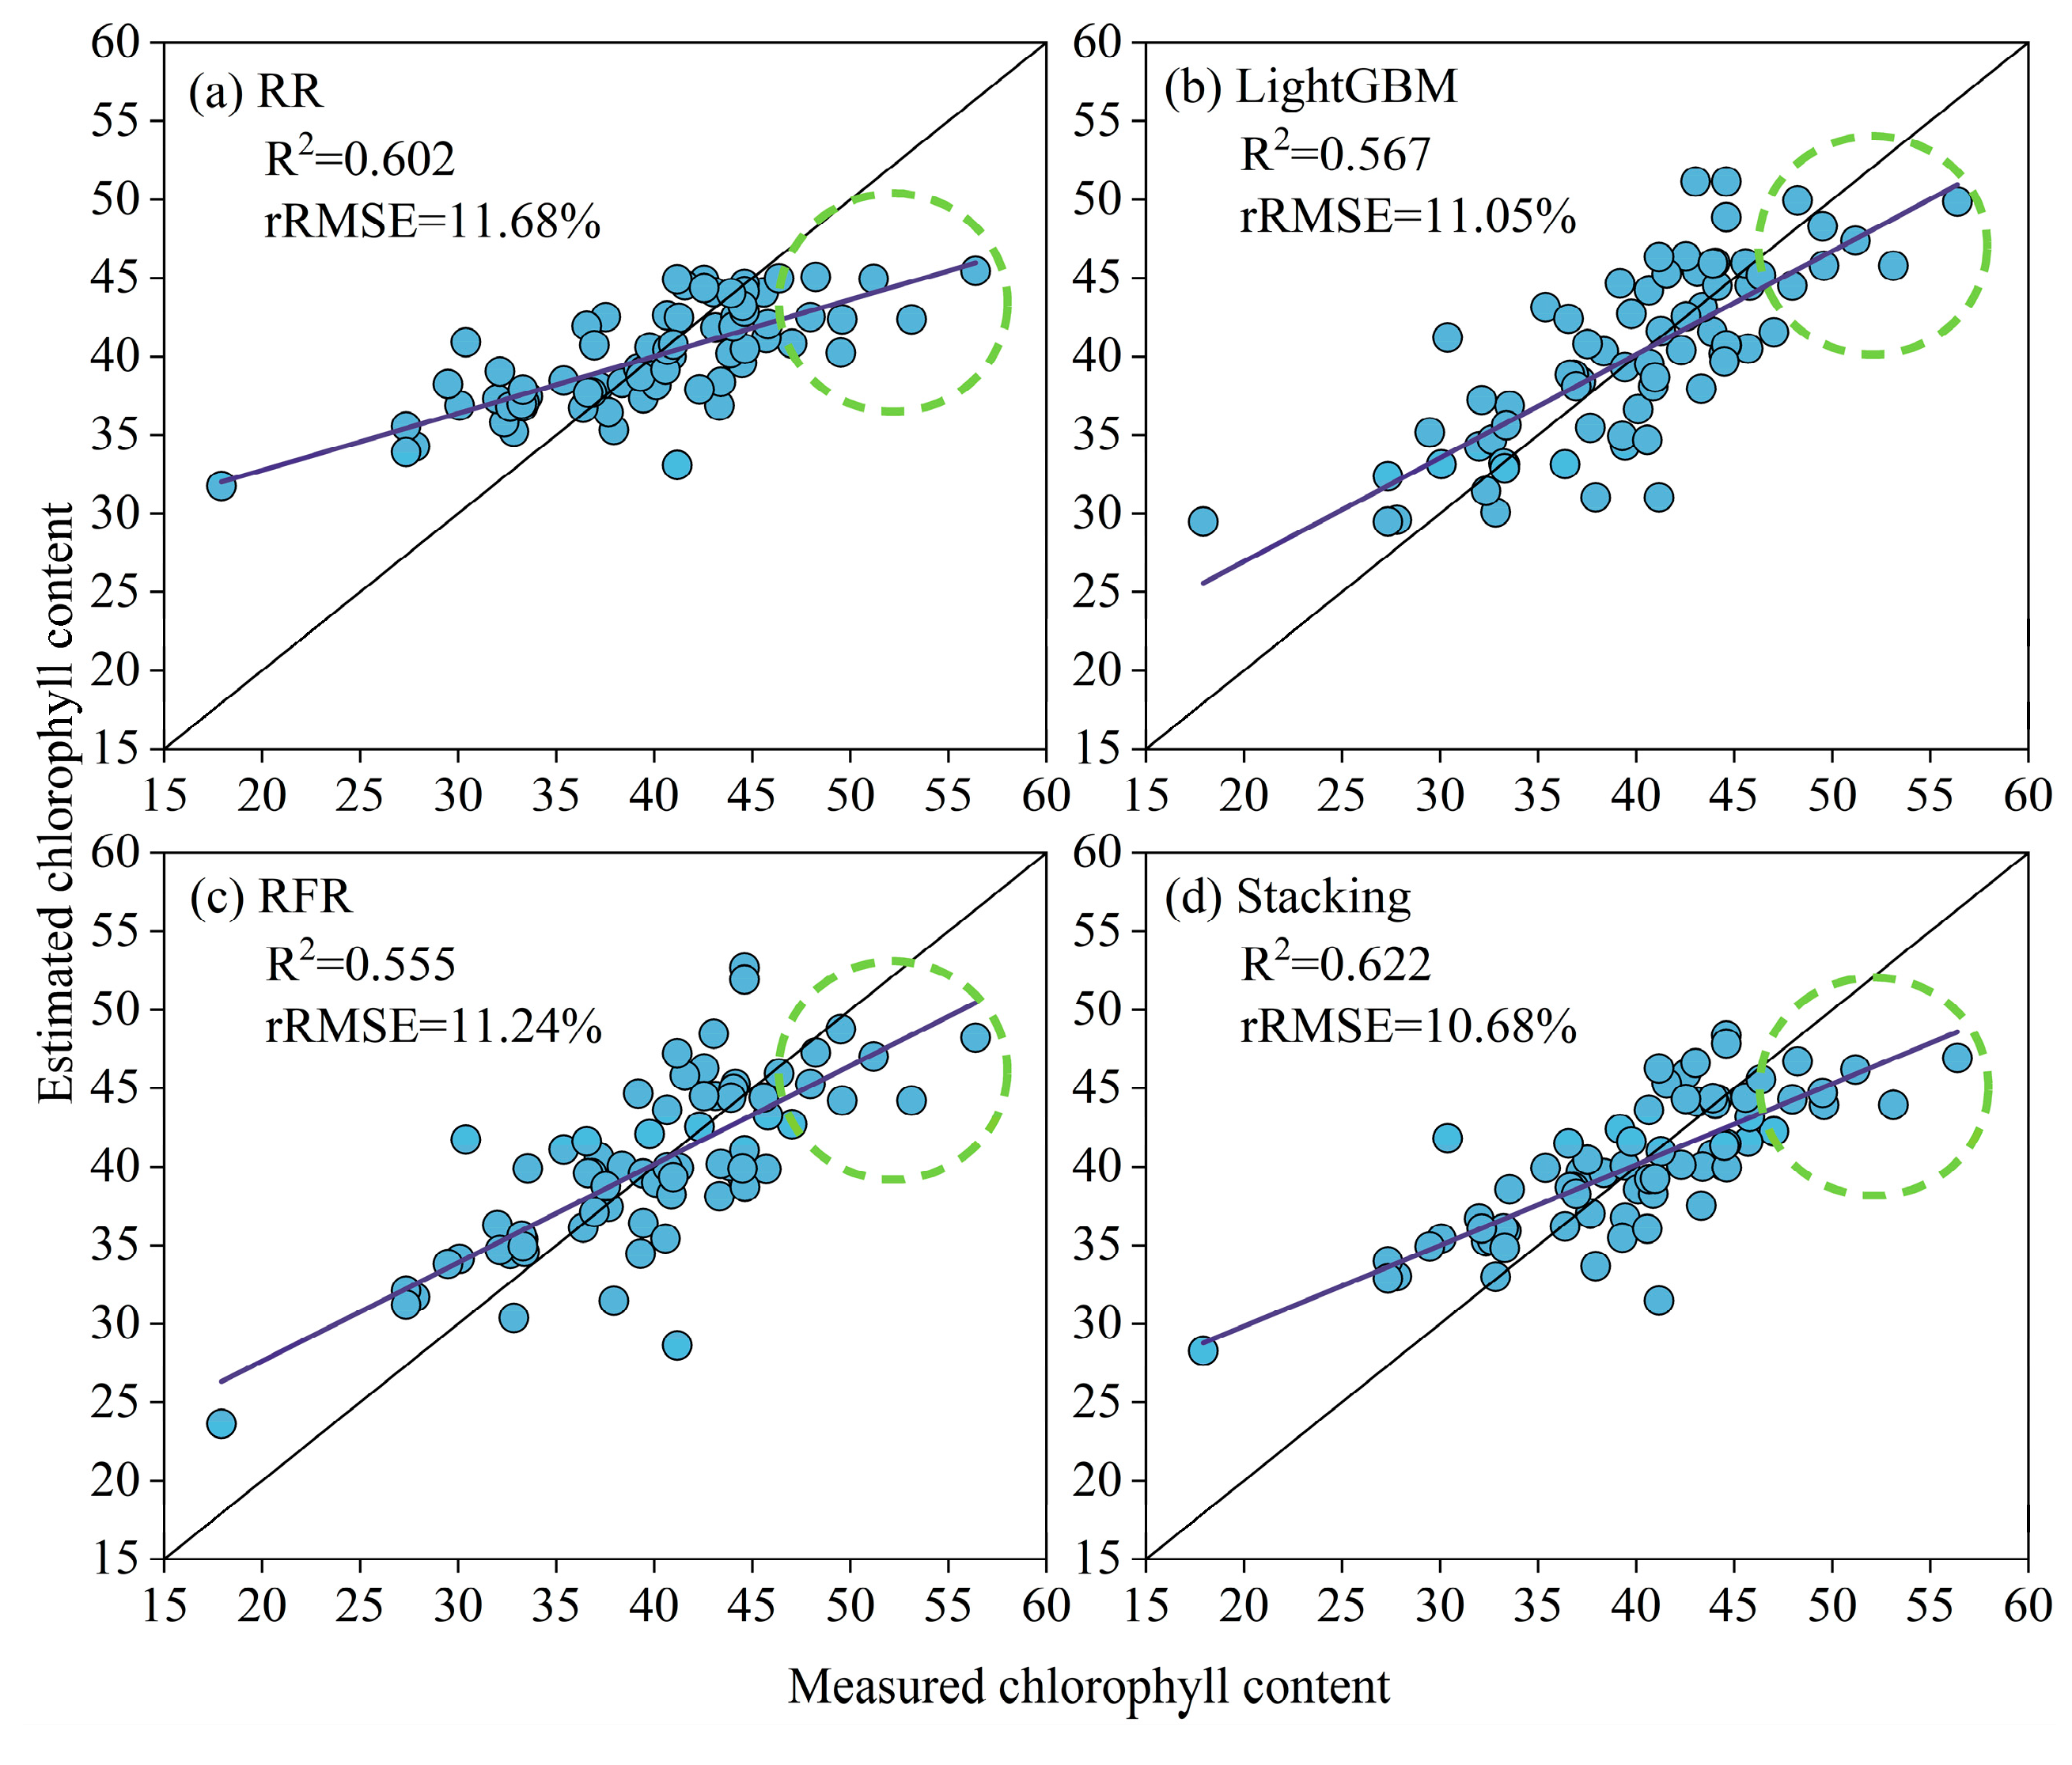
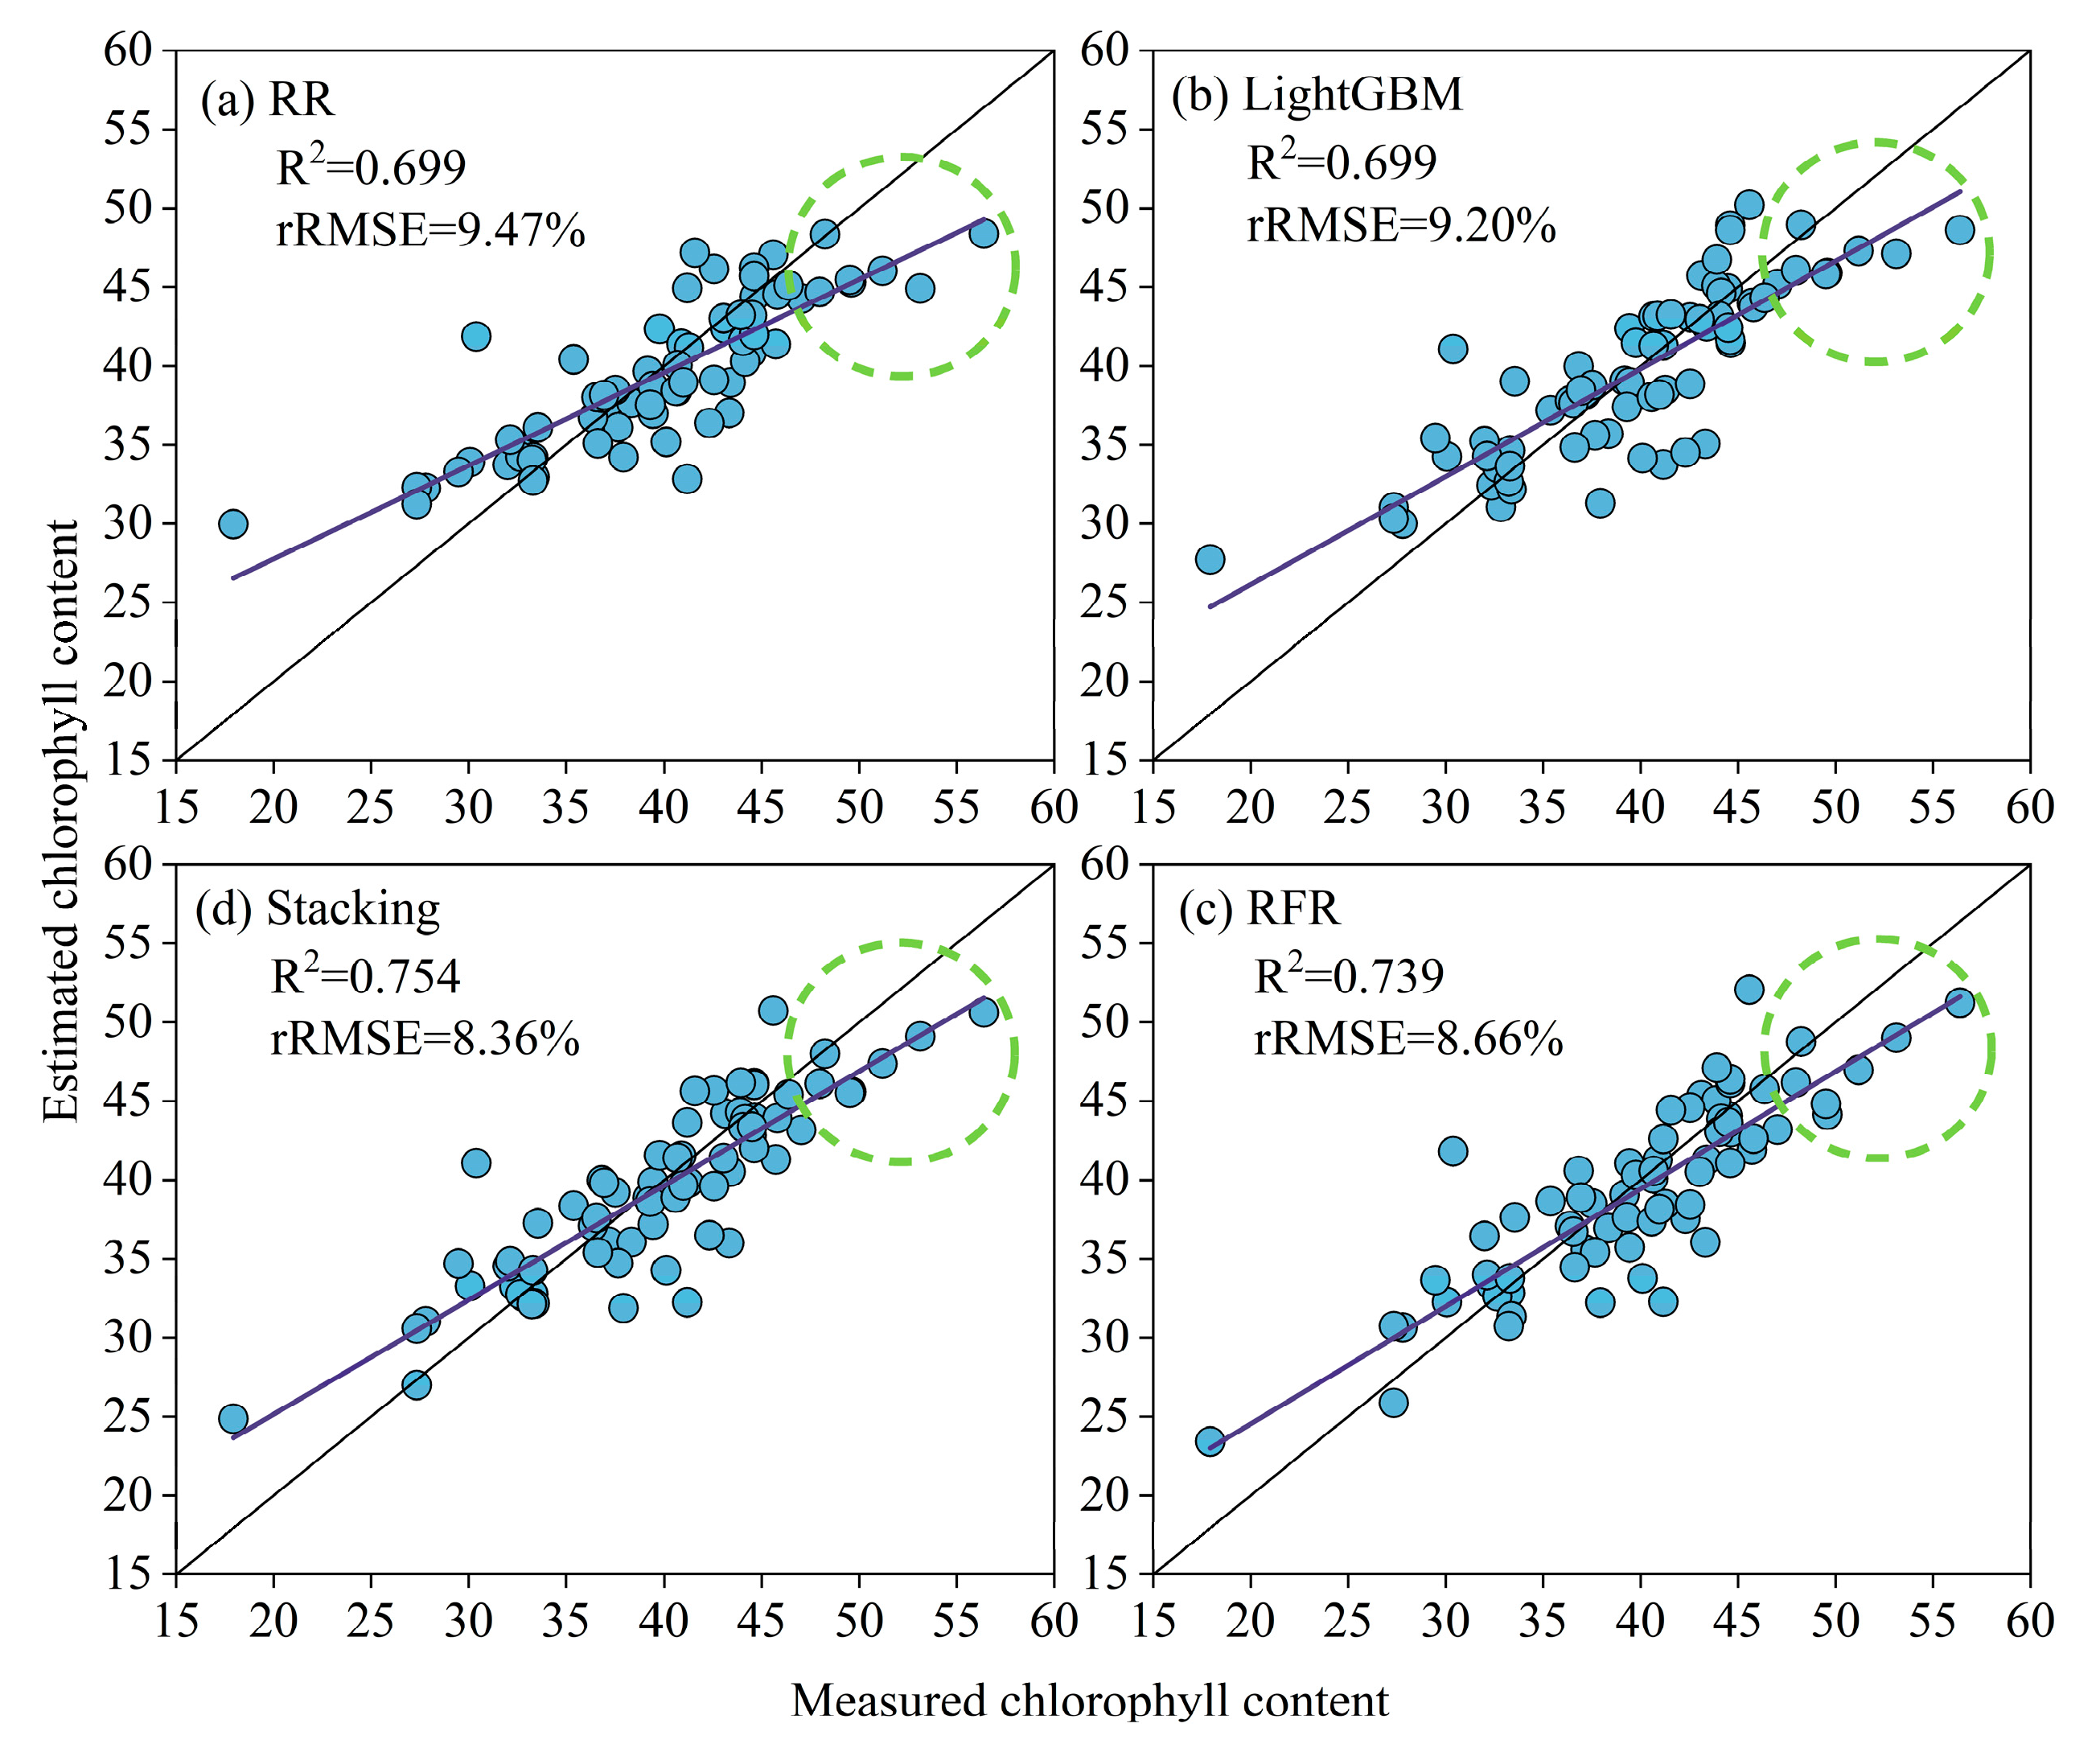
Figure 9 and Figure 10 show scatterplots of the estimated chlorophyll content of maize from the traditional single spectral feature and the fusion of spectral + thermal + structural features. As can be observed from Figure 9, the scatterplot of the single spectral feature model shows a large dispersion, indicating that the model has a large uncertainty and fluctuation in predicting maize chlorophyll. In contrast, based on the close proximity of the scatterplot of the multisource feature fusion model to the 1:1 solid line in Figure 10, it can be concluded that the multisource feature fusion model performs better in predicting maize chlorophyll. Therefore, the use of multisource feature fusion methods can effectively overcome the limitations of single spectral features and improve the stability and accuracy of the estimation models. In addition, as indicated by the green dashed circle in Figure 9 and Figure 10, each model tends to underestimate when the measured chlorophyll content exceeds 46. This issue arises due to spectral saturation in areas with dense vegetation, and similar challenges have been encountered in studies involving crop yield, leaf area index, and nitrogen content estimation [47,48,49]. However, it is noteworthy that the underestimation in the multisource feature fusion has been mitigated and is closer to the actual measured values.

3.2. RR, LightGBM, RFR, and Stacking Chlorophyll Content Estimation

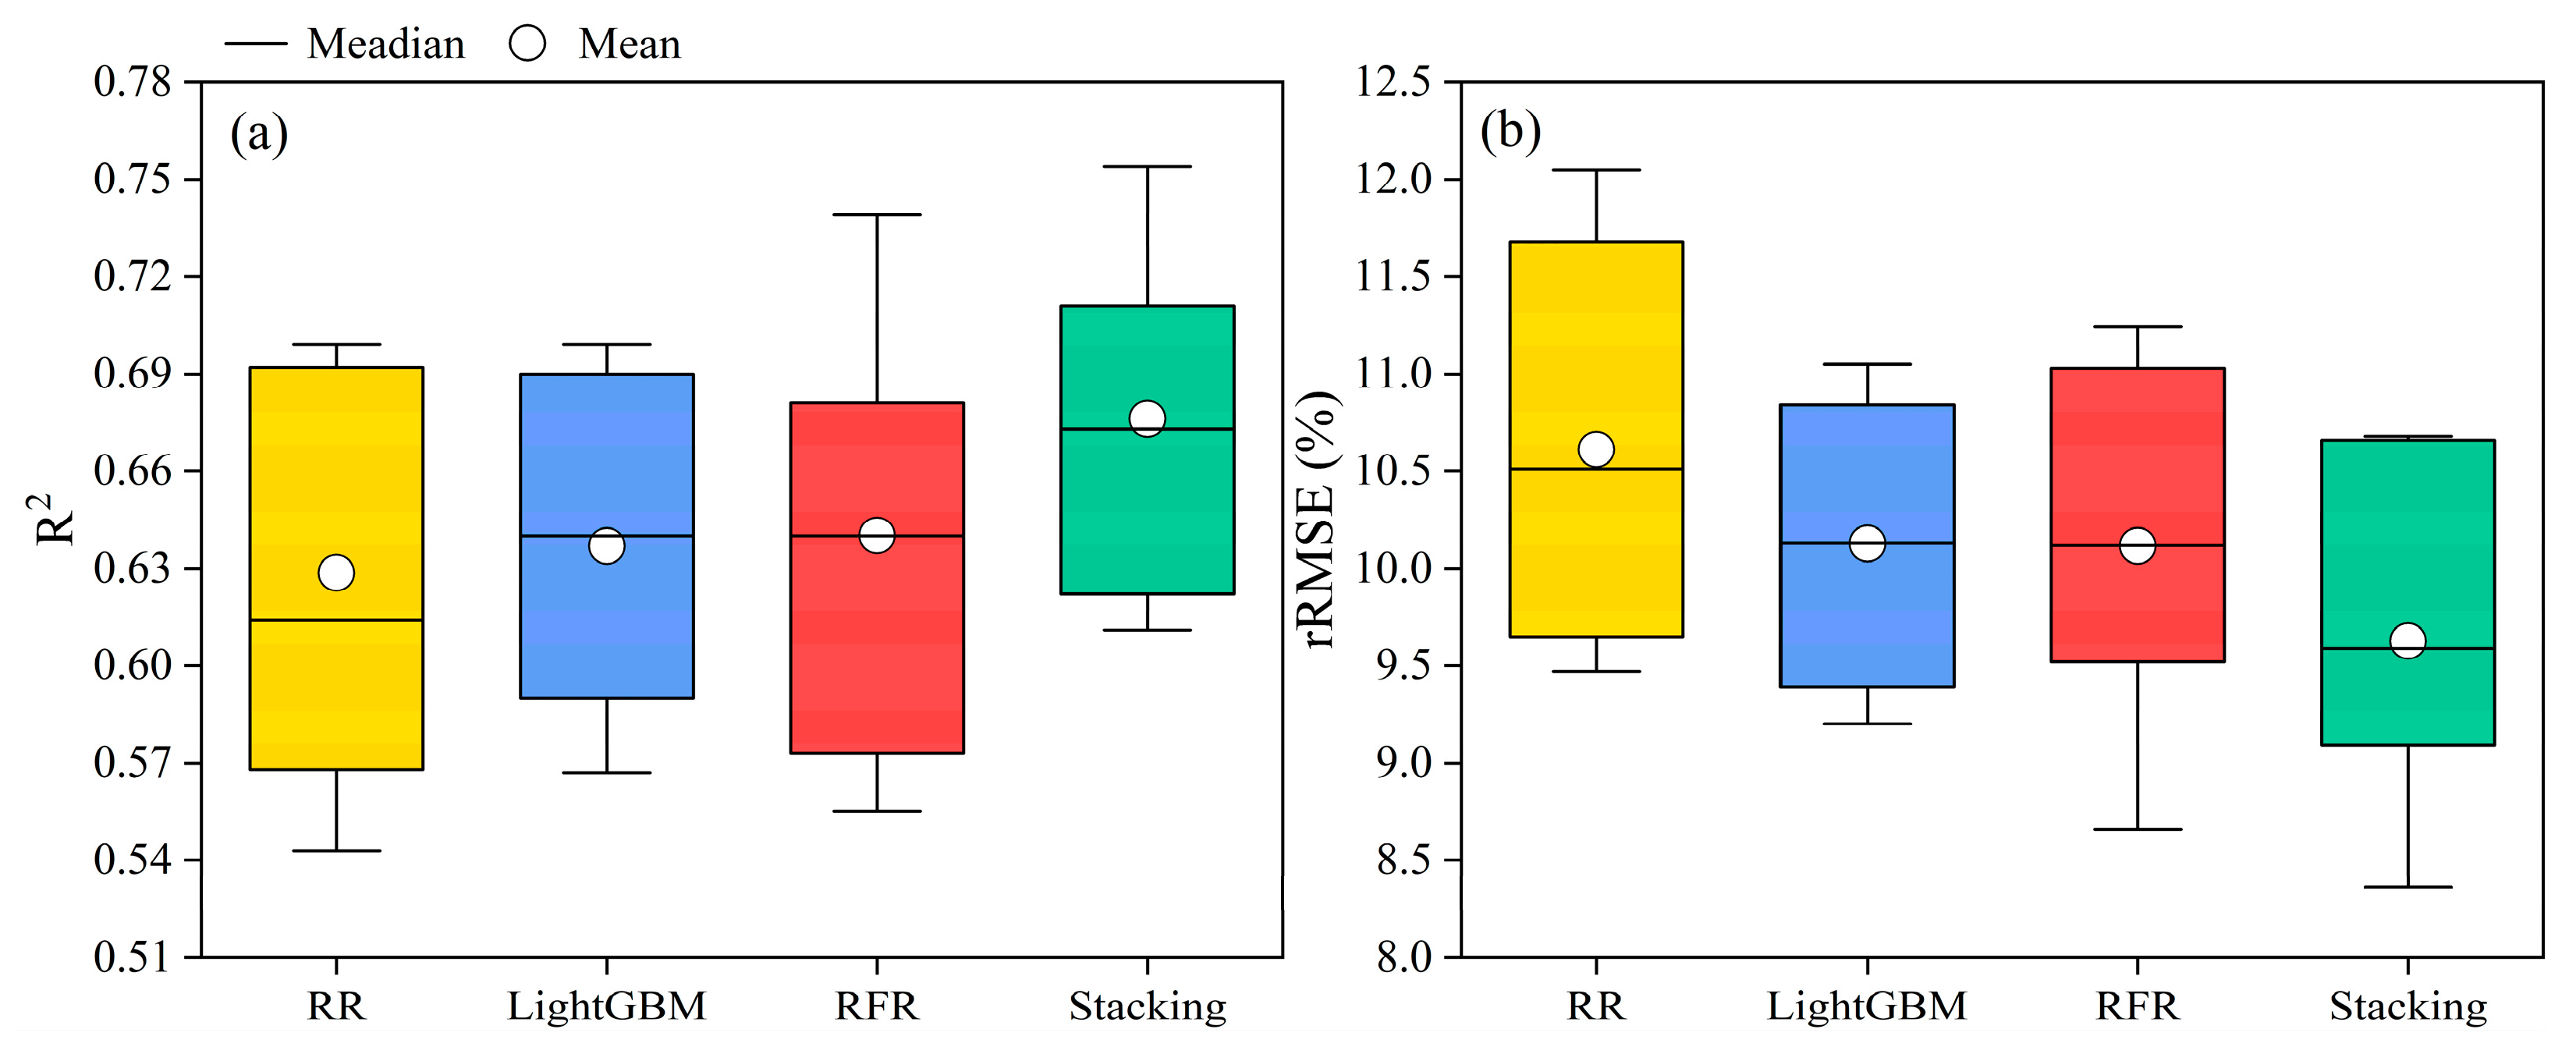
The accuracy of RR, LightGBM, RFR, and stacking in the estimation of chlorophyll content was statistically shown in Figure 11. Stacking can achieve higher R2 and lower rRMSE than the other three traditional machine learning algorithms, namely, RR, LightGBM, and RFR. This demonstrates the robust stability and modelling capability of the stacking model in the estimation of chlorophyll content in maize. By comparing RR, LightGBM, and RFR, it can be observed that LightGBM and RFR exhibit similar accuracy, which is higher than RR.

3.3. Temporal and Spatial Distribution of Chlorophyll Content

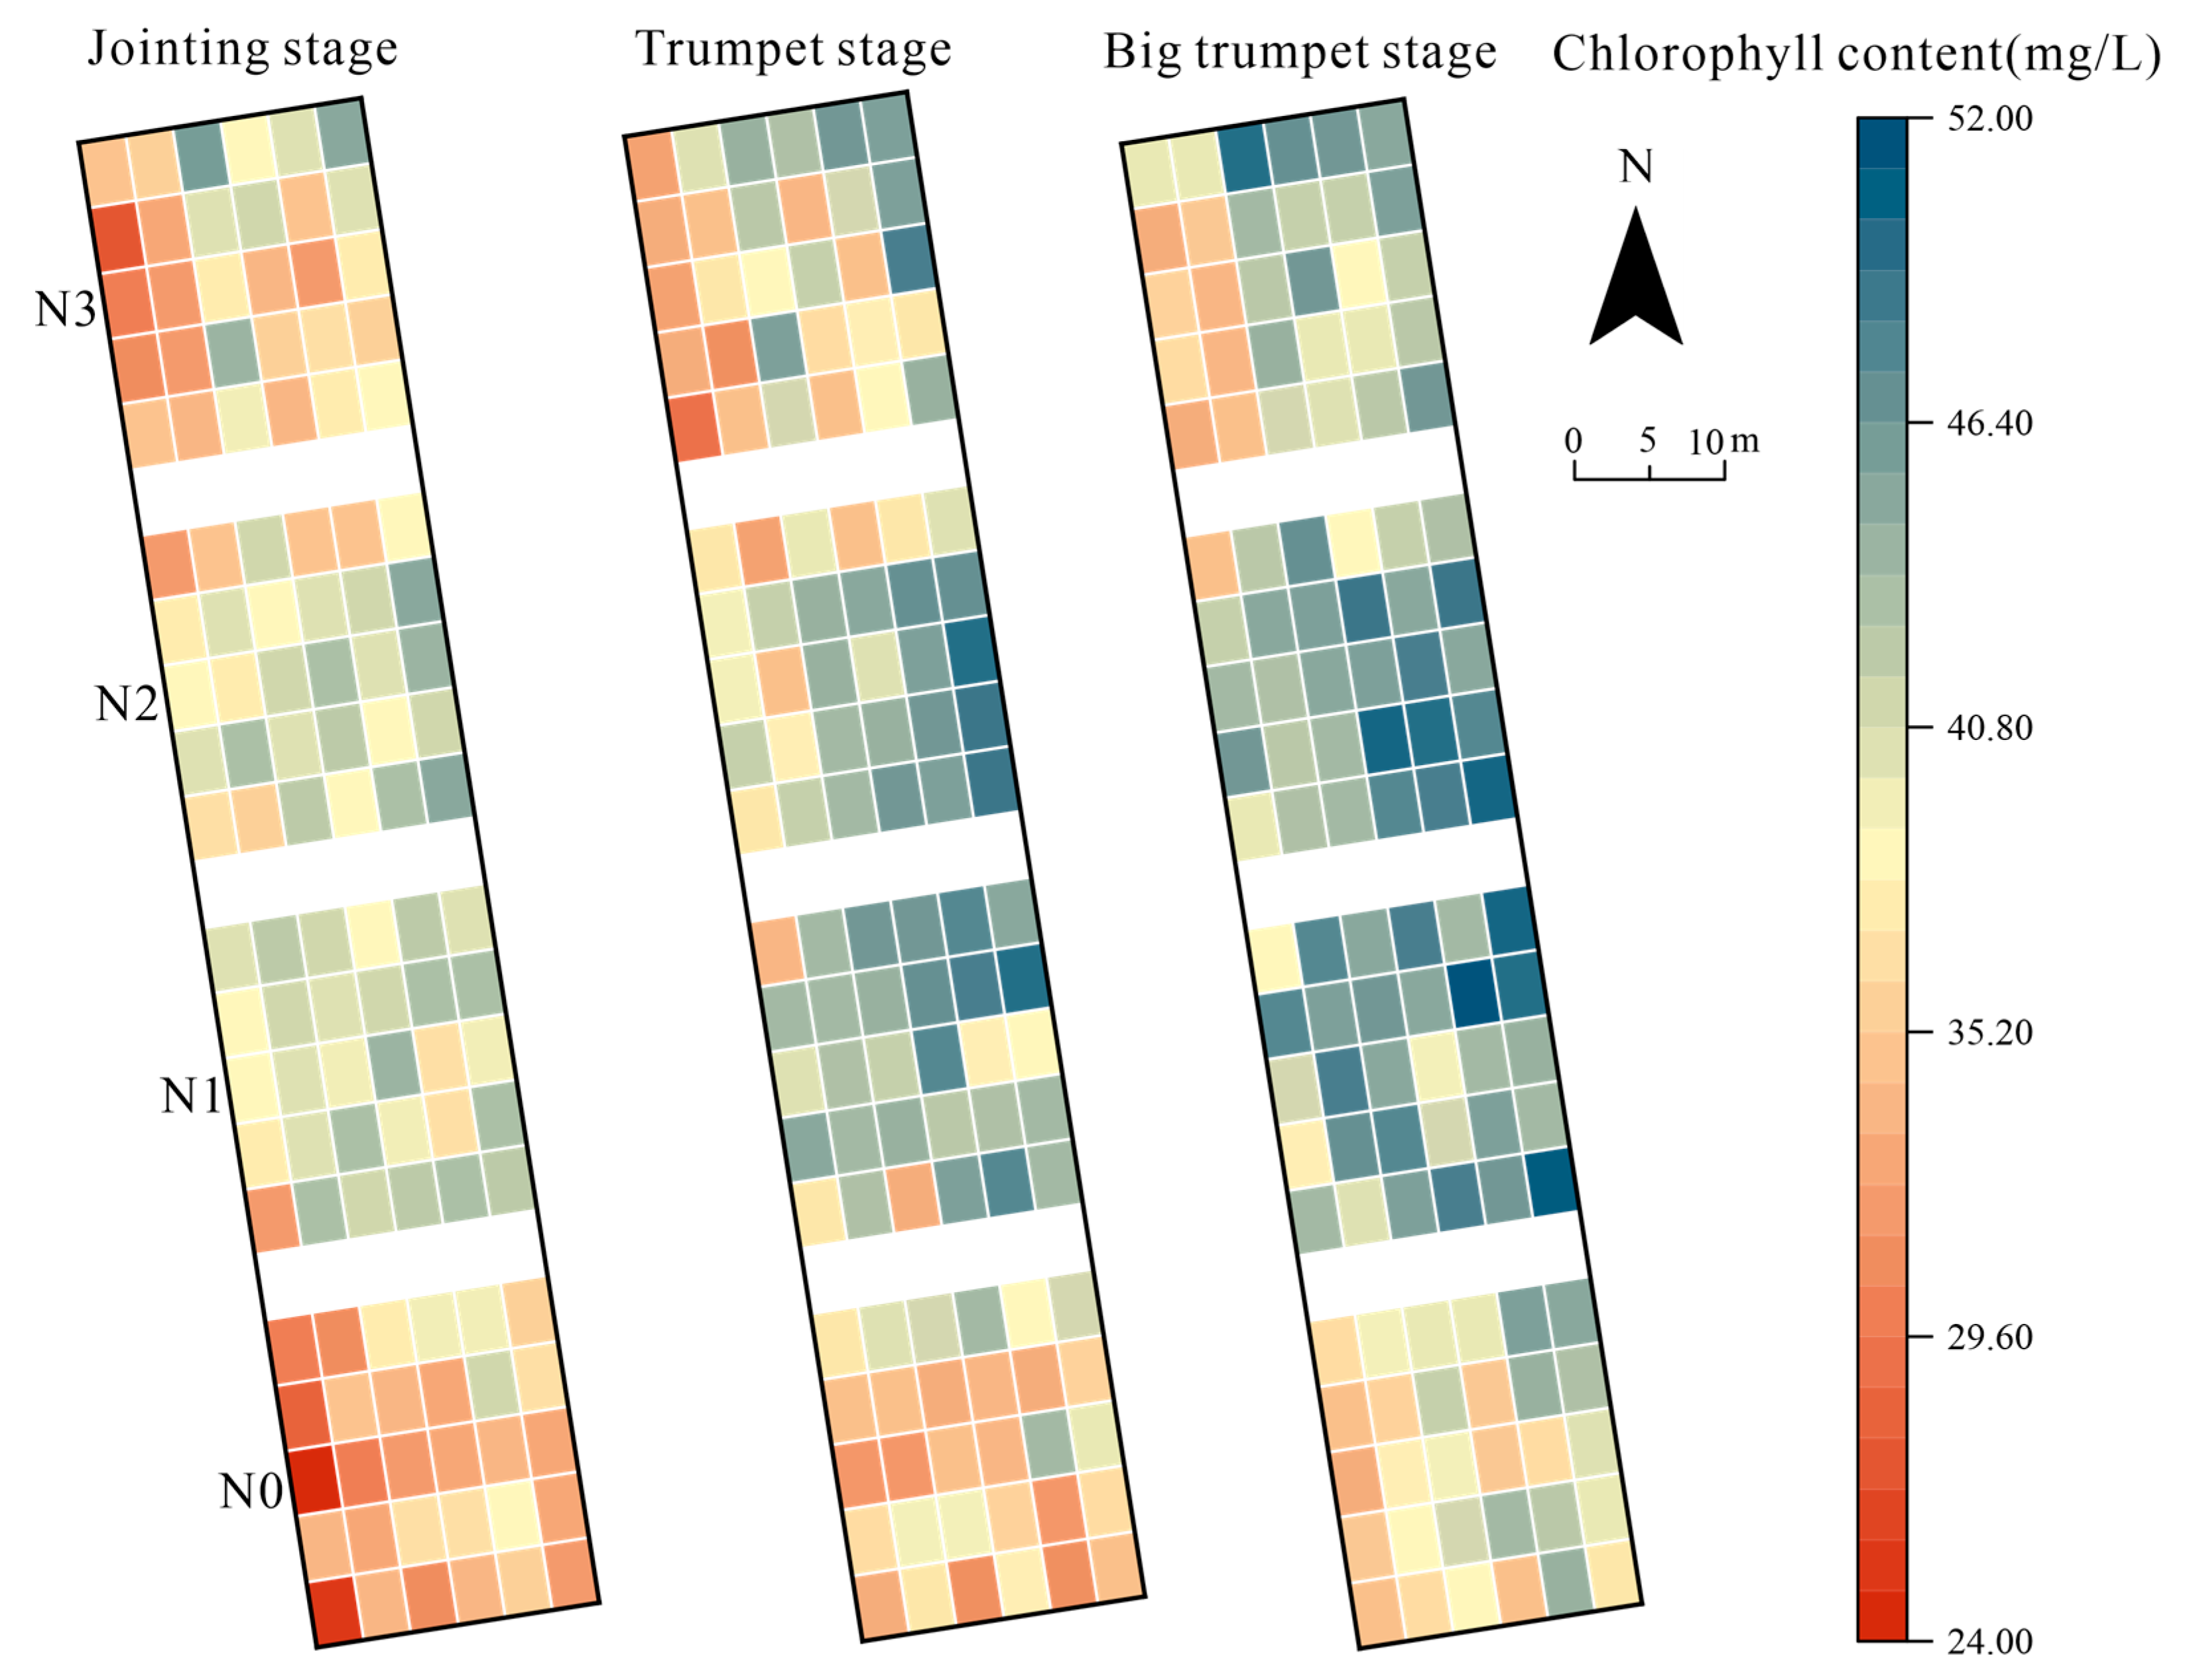
The combination of multisource feature fusion and stacking yielded the highest estimation accuracy. Figure 12 illustrates the estimated temporal and spatial distribution of chlorophyll content across three growth stages. Temporally, the chlorophyll content exhibited an increasing trend from the jointing stage to the big trumpet stage, which is consistent with the measured changes in maize’s chlorophyll content (Figure 2). This increase is attributed to the nutritional growth phase of maize, during which the chlorophyll content gradually rises from the jointing to the big trumpet stage. Spatially, the chlorophyll content exhibited a gradual increase followed by a decrease with varying levels of fertilizer application. For instance, the N1 and N2 treatments showed higher chlorophyll content compared to the N0 treatment. However, the N3 treatment, which received the highest level of fertilizer, exhibited lower chlorophyll content than the N1 and N2 treatments. This decline can be attributed to excessive fertilizer treatments negatively impacting maize growth due to nutrient excess, resulting in decreased chlorophyll content. Previous studies have also demonstrated that excessive fertilizer application not only wastes resources but also hampers crop growth, leading to reduced chlorophyll content [4]. These findings underscore the potential of UAV remote sensing technology in monitoring crop growth status in the field and aiding fertilizer input decisions.

4. Discussion

4.1. Analysis of the Potential for Multisource Feature Fusion

Spectral features have become commonly used for estimating crop chlorophyll content, leaf area index, and yield [9,47,50,51]. However, they can be influenced by sensor characteristics and external environmental conditions, leading to large estimation errors. Therefore, this study aimed to investigate whether fusing multisource features could improve the estimation of chlorophyll content compared to using spectral features alone. The results (Table 4 and Figure 8) demonstrate that multisource feature fusion achieves higher estimation accuracy than single features. This may be attributed to three factors. (1) Complementary information: Each feature type provides unique information for the estimation process. Spectral features capture the reflectance characteristics of leaves, reflecting their biochemical composition [10]. Thermal features obtained through thermal imaging offer insights into plant heat dissipation, which is related to stress levels and metabolic activities [13]. Structural features, such as CC and CH, provide geometric and morphological information about plant growth and development [11]. By combining these diverse features, chlorophyll content estimation models can leverage their complementary nature, resulting in a more robust and accurate estimation of chlorophyll content [47]. (2) Improved discriminative ability: Fusing multiple feature types enhances the discriminative ability of the estimation model. Solely relying on spectral data can sometimes be influenced by confounding factors such as varying lighting conditions or atmospheric disturbances. By incorporating thermal and structural features, the model becomes more resilient to these limitations and gains additional discriminative power [14]. The fusion of multisource feature enables the model to extract relevant information from multiple sources, effectively reducing the impact of noise, and improving the overall accuracy of chlorophyll content estimation [45]. (3) Adaptability to changing conditions: Maize plants exhibit dynamic responses to environmental changes, including variations in light, temperature, and water availability [46]. By integrating spectral, thermal, and structural features, fusion models demonstrate greater adaptability to such changes. They can capture the transient response of spectral features and the long-term effects reflected in thermal and structural features [12]. This adaptability ensures the reliability and effectiveness of the model across different growth stages, environmental conditions, and varieties. Moreover, conventional spectral features often suffer from oversaturation in high vegetation zones, resulting in underestimation of crop yield, leaf area index, and nitrogen content [47,48,49]. Previous studies have shown that incorporating canopy texture features as complementary data can effectively address this issue. Similarly, the results of this study suggest that multisource feature fusion can also mitigate the impact of spectral saturation in high vegetation zones [52]. It is important to note that the fusion of all three features (spectral + thermal + structural) yields the highest estimation accuracy compared to other feature combinations. However, the improvement in accuracy is minimal compared to the estimation accuracy obtained with the best two-feature fusion. This may be attributed to information redundancy among multiple features [53].
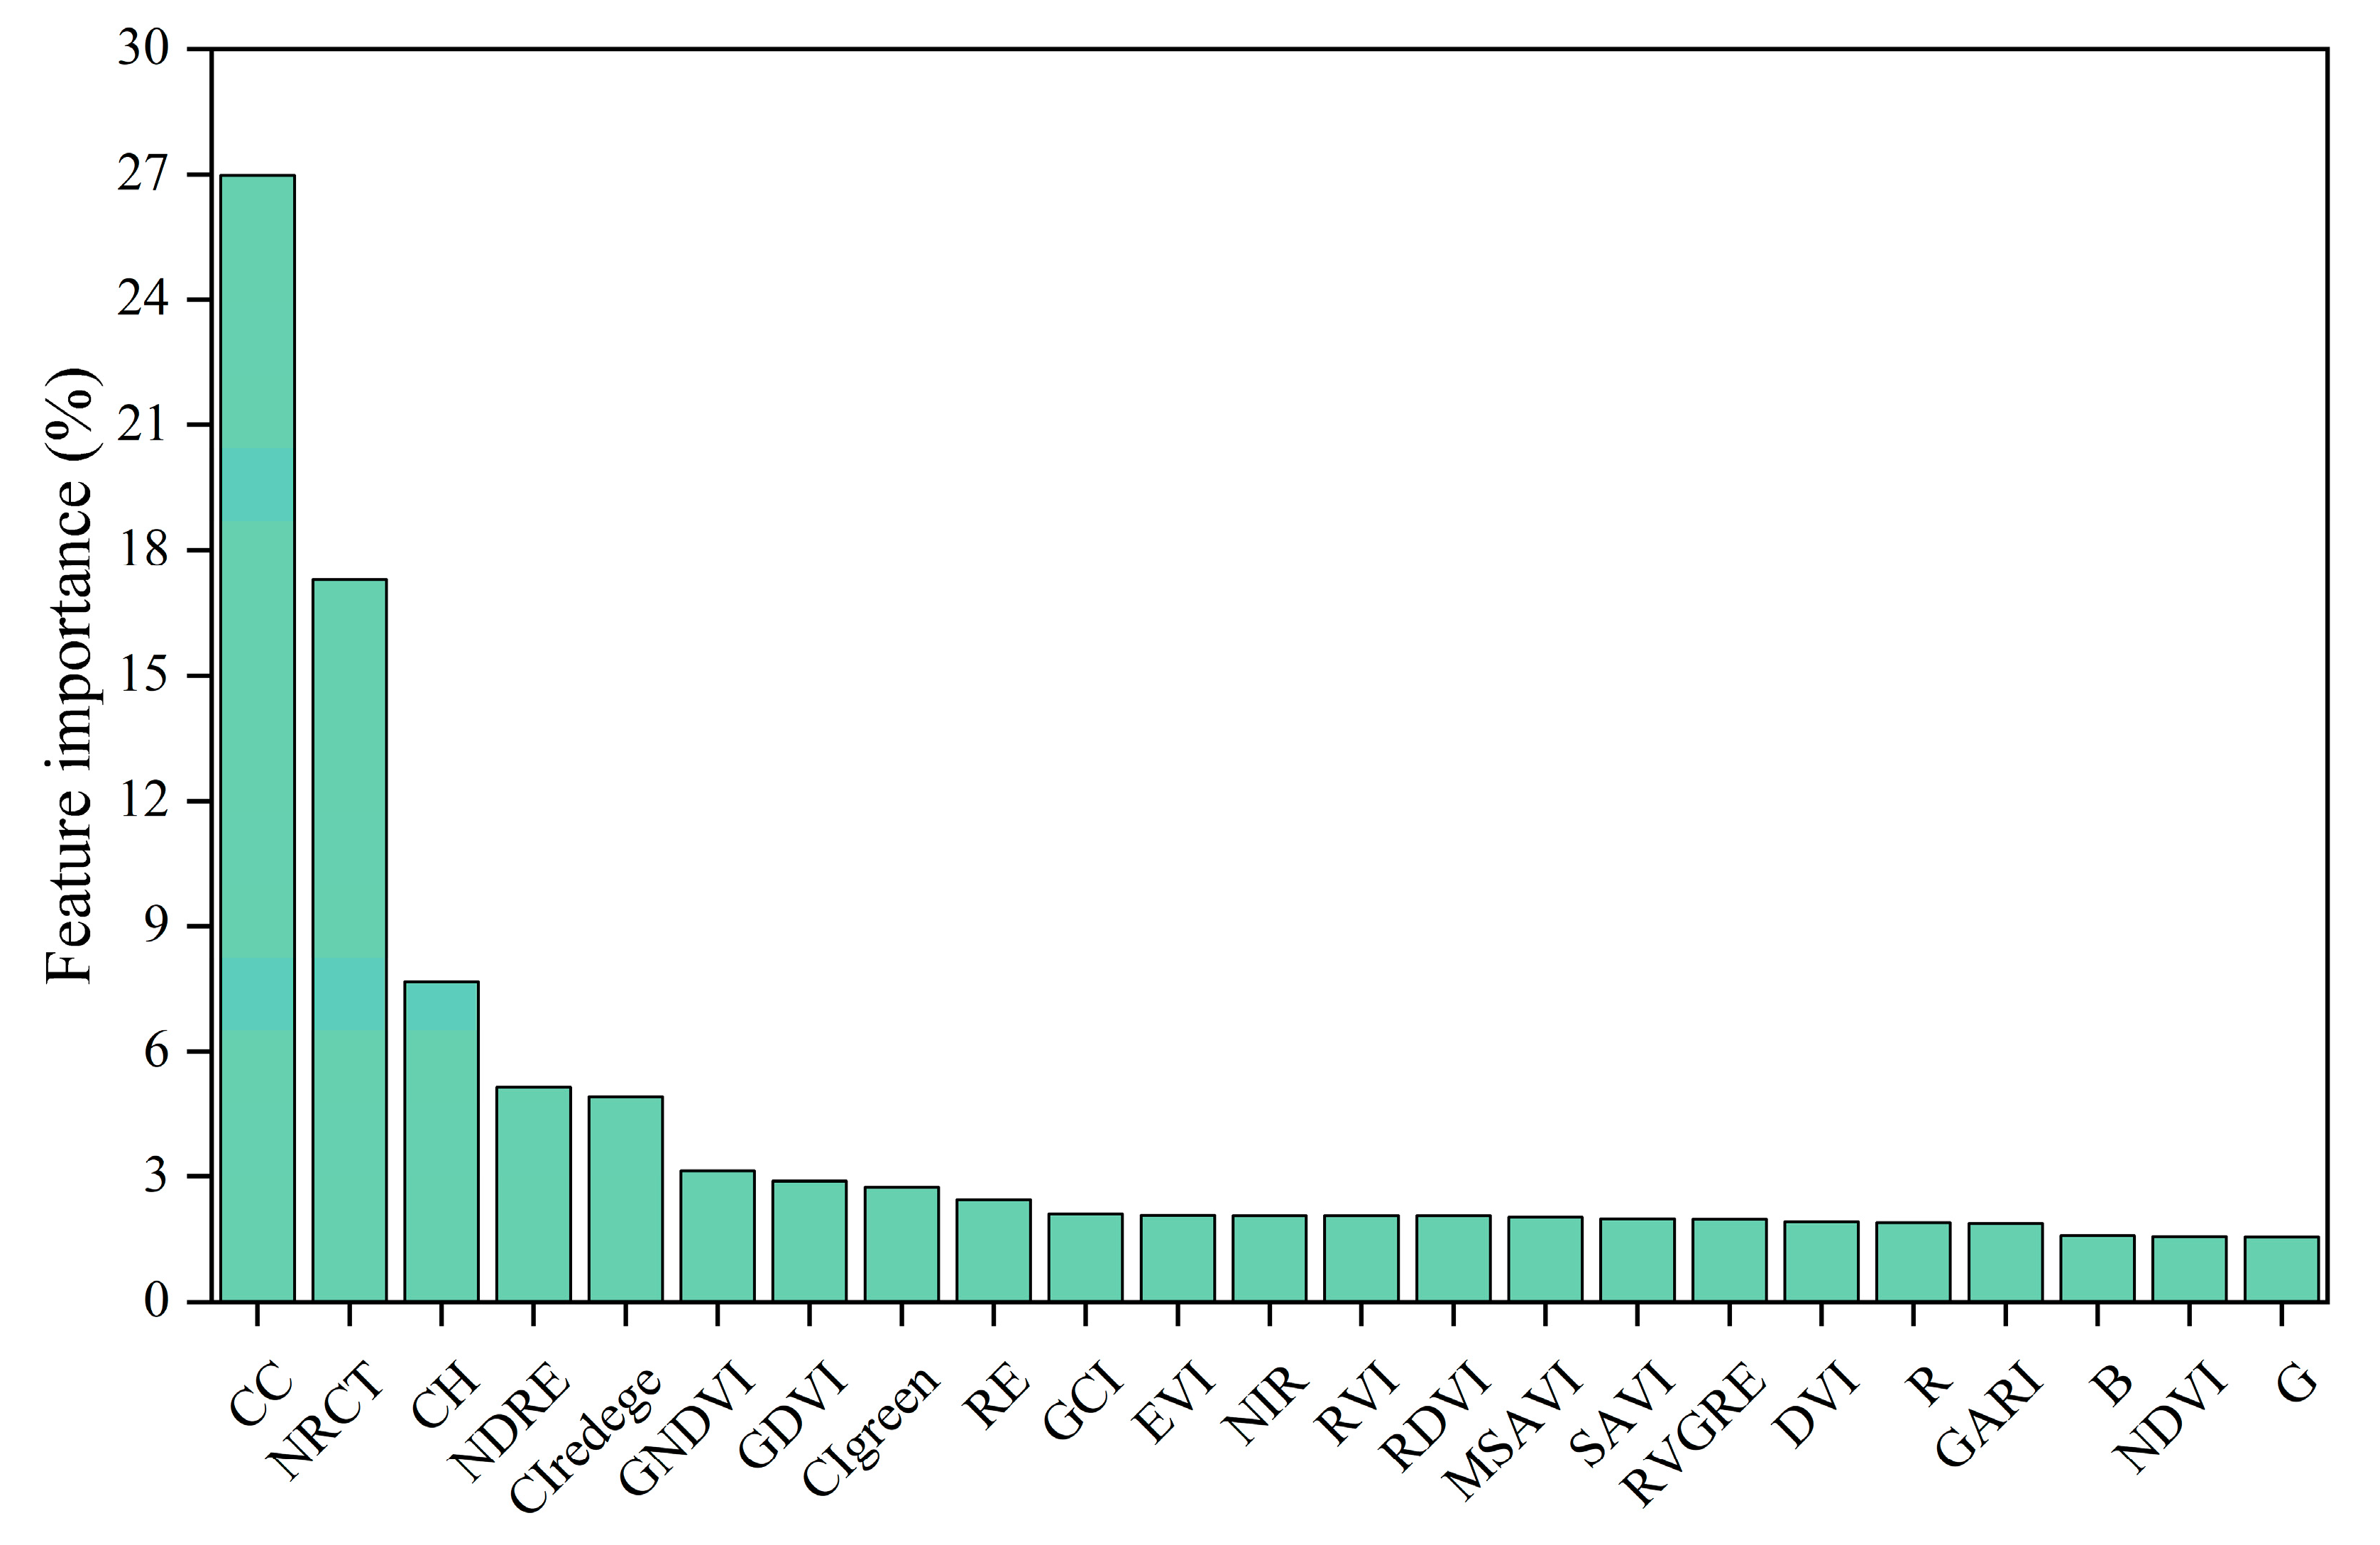
Further evaluation of the importance of each input feature is shown in Figure 13. The results indicate that CC ranks first in the feature importance evaluation with a score of 26.97%. This is likely due to the close correlation between CC and leaf density and growth status of maize plants, which significantly influences chlorophyll content [47]. Next, NRCT ranks second in the feature importance evaluation with a score of 17.29%. This is because temperature is an important indicator of plant growth and photosynthesis, making NRCT a valuable source of information for estimating maize chlorophyll content [49]. CH ranks third in the feature importance evaluation with a score of 7.68%. CH is closely related to crop growth status and biomass, providing important references for estimating chlorophyll content [41]. NDRE, a spectral feature, ranks fourth in the feature importance evaluation with a score of 5.14%. NDRE is sensitive to reflecting plant photosynthesis and changes in chlorophyll content, with less susceptibility to spectral saturation [10]. The importance evaluation of other spectral features falls between 1% and 5%, relatively low. This suggests a potentially severe linear correlation and data redundancy among these spectral features. In summary, CC, CH, and NRCT are important features for estimating maize chlorophyll content, with higher importance than traditional spectral features. These findings support the profound significance of multisource feature fusion in estimating maize chlorophyll content. By evaluating the importance of input features, we can enhance the accuracy and stability of the estimation model, providing valuable guidance for optimizing future methods and improving models for maize chlorophyll content estimation.

4.2. Analysis of the Potential for Stacking in Chlorophyll Content Estimation

Advancements in computing power have opened up new possibilities for extracting valuable insights into and understanding of plant behavior [15,54]. In the field of crop phenotyping, traditional machine learning algorithms such as RR, partial least squares regression, and support vector regression are commonly utilized [12,48]. However, these machine learning algorithms only utilize a single model, which limits their performance and fails to fit complex data patterns effectively, resulting in poor estimation results. In this study, different machine learning algorithms were employed to estimate maize chlorophyll content, and their performances were compared. The results showed that the RR algorithm had the lowest estimation accuracy, while the LightGBM and RFR algorithms performed relatively well but were surpassed by the stacking ensemble learning method. Firstly, the RR algorithm exhibited lower accuracy in estimating the maize chlorophyll content. This could be attributed to the complex nonlinear relationship between chlorophyll content and various factors such as light, temperature, and soil moisture in plant growth [47]. The RR algorithm, being a linear machine learning algorithm, may not adequately capture the nonlinear relationship between chlorophyll content and remote sensing data, thus limiting its estimation accuracy [44]. In contrast, both the LightGBM and RFR algorithms demonstrated better estimation performance. These algorithms leverage the ideas of boosting and bagging, respectively, to integrate multiple decision trees. They possess strong nonlinear modeling capabilities, enabling them to capture the complex relationship between chlorophyll content and remote sensing data more effectively [42,45]. Consequently, they achieve improved estimation accuracy compared to the RR algorithm. However, the highest estimation accuracy was observed with the stacking ensemble learning method. Stacking ensemble learning leverages a multilevel model structure to effectively combine and integrate the predictions from individual base models, thereby minimizing estimation errors and enhancing estimation performance [12]. By combining the strengths of different algorithms, stacking ensemble learning overcomes the limitations of a single model and maximizes their complementary nature in estimating chlorophyll content [13]. As a result, it achieves the highest estimation accuracy.
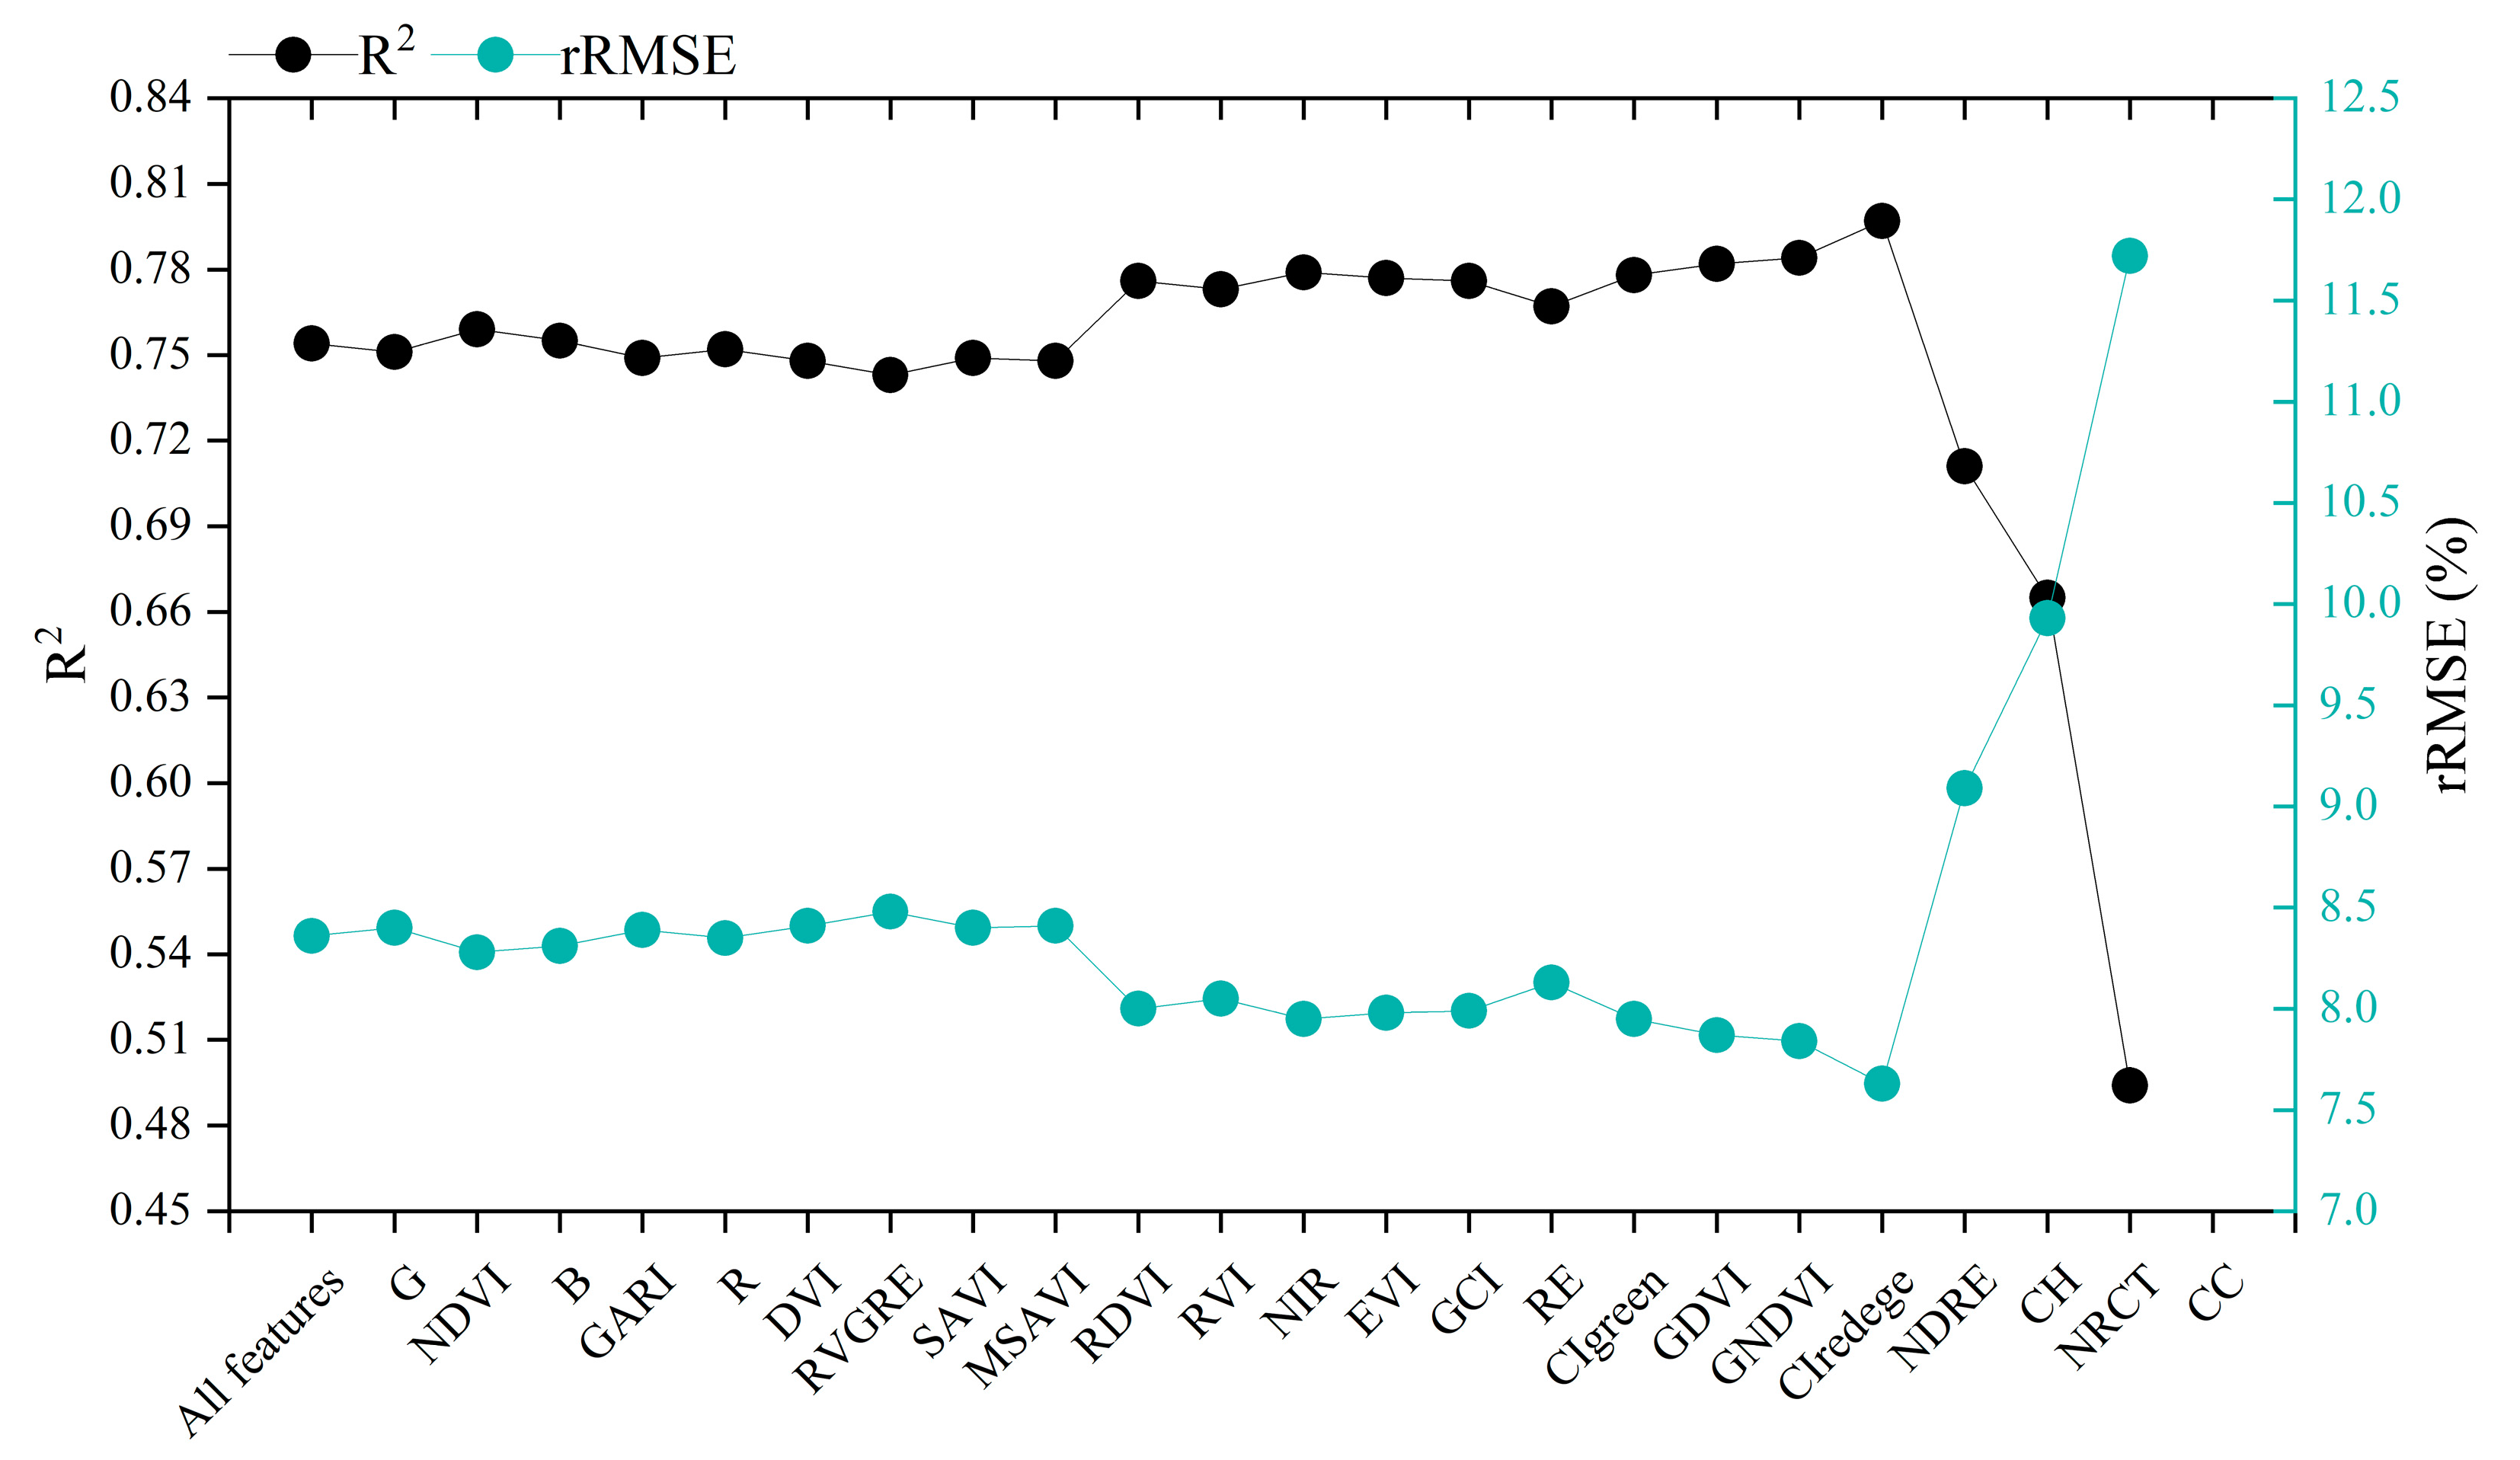
Based on the stacking ensemble learning method, we progressively eliminated features with lower contributions to the model, as determined by the feature importance results in Figure 13, to optimize the application of multisource feature fusion and stacking ensemble learning in estimating maize chlorophyll content. The corresponding results are shown in Figure 14. Observing Figure 14, it can be noticed that as relatively unimportant features were eliminated, the estimation accuracy of the model fluctuated within a certain range but exhibited an overall increasing trend. Particularly, when features such as Clredege and those with lower importance were removed, the model achieved the highest estimation accuracy with an R2 value of 0.797 and rRMSE of 7.63%. Compared to using the full set of input features, the estimation accuracy significantly improved after eliminating relatively unimportant features. These results indicate that by evaluating feature importance and progressively eliminating features with smaller contributions to the model, we were able to optimize the estimation model for maize chlorophyll content. This process helps reduce feature redundancy and enhances the robustness and predictive capabilities of the model. Therefore, the approach based on multisource feature fusion and stacking ensemble learning holds profound significance for estimating maize chlorophyll content, providing valuable guidance and insights for future research and model improvements.

4.3. Implications and Future Research

The contribution of this study lies in proposing a method for estimating maize chlorophyll content based on the fusion of multiple data sources and stacking ensemble learning. Compared to existing research, this method achieves significant improvements in estimation accuracy [10]. By utilizing multiple feature sources from UAV remote sensing data and integrating different machine learning algorithms, we have achieved a reliable estimation of maize chlorophyll content. The innovation of this study lies in demonstrating the potential advantages of multisource feature fusion and stacking ensemble learning in estimating maize chlorophyll content, providing a new perspective for precision agriculture management. Compared to existing methods, our approach has several technical differences. Traditional methods for estimating maize chlorophyll content typically rely on a single-feature source and use conventional machine learning algorithms for modeling. In contrast, our study combines multiple feature sources, including UAV spectral features, thermal features, and structural features, and utilizes the stacking ensemble learning method to achieve a more accurate estimation of maize chlorophyll content. The novelty of this approach lies in its ability to better capture the complex relationship between maize chlorophyll content and remote sensing data, thereby improving estimation accuracy and stability.
In future research, there are several directions for further exploration and optimization. Firstly, it is possible to consider introducing more feature sources. For example, exploring additional remote sensing data sources such as hyperspectral data and radar data can enrich the feature information [14,55]. Secondly, the stacking ensemble learning approach can be further improved, for example, by experimenting with different combinations of base models and optimizing ensemble strategies to further improve estimation accuracy. Lastly, extending this method to other crops and agricultural management issues is also an interesting direction. Precision agriculture management requires monitoring and estimation of the growth and health status of various crops. Therefore, generalizing the methods from this study to other crops such as wheat, soybeans, etc., can provide comprehensive support for agricultural production.

5. Conclusions

This study aimed to assess the feasibility and potential of utilizing UAV multisource feature fusion and stacking ensemble learning for accurately estimating chlorophyll content in crops. The main findings can be summarized as follows:
(1)
UAV multisource feature fusion surpasses the use of single features alone in terms of estimation accuracy. Furthermore, the fusion of multiple features effectively addresses the issue of underestimation caused by spectral saturation in areas with dense vegetation.
(2)
Stacking ensemble learning exhibits superior suitability for chlorophyll content estimation compared to traditional machine learning algorithms. This highlights the substantial potential of stacking ensemble learning in precision agriculture management.
In conclusion, the combination of UAV multisource feature fusion and stacking ensemble learning provides an efficient and nondestructive method for rapidly obtaining accurate chlorophyll content. This approach represents a significant research direction for future UAV remote sensing applications in precision agriculture.

Author Contributions

Conceptualization, W.Z., Q.C. and Z.C.; methodology, W.Z., C.L. and Z.C.; software, W.Z., C.L. and F.D.; validation, W.Z., Q.C. and Z.C.; formal analysis, W.Z. and F.D.; investigation, W.Z. and Q.C.; resources, W.Z., C.L. and Z.C.; data curation, W.Z. and Q.C.; writing—original draft preparation, W.Z.; writing—review and editing, W.Z.; visualization, W.Z.; supervision, W.Z.; project administration, Z.C.; funding acquisition, Z.C. All authors have read and agreed to the published version of the manuscript.

Funding

This research was funded by the Intelligent Irrigation Water and Fertilizer Digital Decision System and Regulation Equipment (2022YFD1900404), Central Public-interest Scientific Institution Basal Research Fund (IFI2023-29, IFI2023-01), Key projects of China National Tobacco Corporation Shandong Province (KN281/202107), the Key Grant Technology Project of Henan (221100110700), the Research on Precision Irrigation for Nitrogen and Moisture Content Estimation Model Based on Deep Learning (IFI2023-29), the 2023 Henan Province Key R&D and Promotion Special Project (Science and Technology Tackling) (232102210093), the Henan Province Collaborative Innovation Centre Open Course (211102), and the Henan Province Science and Technology Research Project (222102110038).

Data Availability Statement

Due to the nature of this research, participants of this study did not agree for their data to be shared publicly, so supporting data are not available.

Acknowledgments

The authors would like to thank the anonymous reviewers for their kind suggestions and constructive comments.

Conflicts of Interest

The authors declare no conflict of interest.

References

  1. Grinberg, N.F.; Orhobor, O.I.; King, R.D. An evaluation of machine-learning for predicting phenotype: Studies in yeast, rice, and wheat. Mach. Learn. 2020, 109, 251–277. [Google Scholar] [CrossRef] [PubMed] [Green Version]
  2. Ye, H.; Huang, W.; Huang, S.; Cui, B.; Dong, Y.; Guo, A.; Ren, Y.; Jin, Y. Recognition of banana fusarium wilt based on UAV remote sensing. Remote Sens. 2020, 12, 938. [Google Scholar] [CrossRef] [Green Version]
  3. Wang, J.; Zhou, Q.; Shang, J.; Liu, C.; Zhuang, T.; Ding, J.; Xian, Y.; Zhao, L.; Wang, W.; Zhou, G.; et al. UAV-and machine learning-based retrieval of wheat SPAD values at the overwintering stage for variety screening. Remote Sens. 2021, 13, 5166. [Google Scholar] [CrossRef]
  4. Qiao, L.; Gao, D.; Zhang, J.; Li, M.; Sun, H.; Ma, J. Dynamic influence elimination and chlorophyll content diagnosis of maize using UAV spectral imagery. Remote Sens. 2020, 12, 2650. [Google Scholar] [CrossRef]
  5. Xie, Q.; Dash, J.; Huete, A.; Jiang, A.; Yin, G.; Ding, Y.; Peng, D.; Hall, C.C.; Brown, L.; Shi, Y.; et al. Retrieval of crop biophysical parameters from Sentinel-2 remote sensing imagery. Int. J. Appl. Earth Obs. Geoinf. 2019, 80, 187–195. [Google Scholar] [CrossRef]
  6. Yang, X.; Yang, R.; Ye, Y.; Yuan, Z.; Wang, D.; Hua, K. Winter wheat SPAD estimation from UAV hyperspectral data using cluster-regression methods. Int. J. Appl. Earth Obs. Geoinf. 2021, 105, 102618. [Google Scholar] [CrossRef]
  7. Sun, Q.; Gu, X.; Chen, L.; Xu, X.; Wei, Z.; Pan, Y.; Gao, Y. Monitoring maize canopy chlorophyll density under lodging stress based on UAV hyperspectral imagery. Comput. Electron. Agric. 2022, 193, 106671. [Google Scholar] [CrossRef]
  8. Cao, Y.; Li, G.L.; Luo, Y.K.; Pan, Q.; Zhang, S.Y. Monitoring of sugar beet growth indicators using wide-dynamic-range vegetation index (WDRVI) derived from UAV multispectral images. Comput. Electron. Agric. 2020, 171, 105331. [Google Scholar] [CrossRef]
  9. Yang, H.; Hu, Y.; Zheng, Z.; Qiao, Y.; Zhang, K.; Guo, T.; Chen, J. Estimation of Potato Chlorophyll Content from UAV Multispectral Images with Stacking Ensemble Algorithm. Agronomy 2022, 12, 2318. [Google Scholar] [CrossRef]
  10. Qiao, L.; Tang, W.; Gao, D.; Zhao, R.; An, L.; Li, M.; Sun, H.; Song, D. UAV-based chlorophyll content estimation by evaluating vegetation index responses under different crop coverages. Comput. Electron. Agric. 2022, 196, 106775. [Google Scholar] [CrossRef]
  11. Liu, Y.; Feng, H.; Yue, J.; Li, Z.; Yang, G.; Song, X.; Yang, X.; Zhao, Y. Remote-sensing estimation of potato above-ground biomass based on spectral and spatial features extracted from high-definition digital camera images. Comput. Electron. Agric. 2022, 198, 107089. [Google Scholar] [CrossRef]
  12. Fei, S.; Hassan, M.A.; Xiao, Y.; Su, X.; Chen, Z.; Cheng, Q.; Duan, F.; Chen, R.; Ma, Y. UAV-based multi-sensor data fusion and machine learning algorithm for yield prediction in wheat. Precis. Agric. 2022, 24, 187–212. [Google Scholar] [CrossRef] [PubMed]
  13. Shu, M.; Fei, S.; Zhang, B.; Yang, X.; Guo, Y.; Li, B.; Ma, Y. Application of UAV Multisensor Data and Ensemble Approach for High-Throughput Estimation of Maize Phenotyping Traits. Plant Phenomics 2022, 2022, 9802585. [Google Scholar] [CrossRef]
  14. Zhu, W.; Sun, Z.; Huang, Y.; Yang, T.; Li, J.; Zhu, K.; Zhang, J.; Yang, B.; Shao, C.; Peng, J.; et al. Optimization of multi-source UAV RS agro-monitoring schemes designed for field-scale crop phenotyping. Precis. Agric. 2021, 22, 1768–1802. [Google Scholar] [CrossRef]
  15. Lu, B.; He, Y. Evaluating empirical regression, machine learning, and radiative transfer modelling for estimating vegetation chlorophyll content using bi-seasonal hyperspectral images. Remote Sens. 2019, 11, 1979. [Google Scholar] [CrossRef] [Green Version]
  16. Guo, Y.; Yin, G.; Sun, H.; Wang, H.; Chen, S.; Senthilnath, J.; Wang, J.; Fu, Y. Scaling effects on chlorophyll content estimations with RGB camera mounted on a UAV platform using machine-learning methods. Sensors 2020, 20, 5130. [Google Scholar] [CrossRef] [PubMed]
  17. Singhal, G.; Bansod, B.; Mathew, L.; Goswami, J.; Choudhury, B.; Raju, P. Chlorophyll estimation using multi-spectral unmanned aerial system based on machine learning techniques. Remote Sens. Appl.-Soc. Environ. 2019, 15, 100235. [Google Scholar] [CrossRef]
  18. Han, D.; Wang, P.; Tansey, K.; Liu, J.; Zhang, Y.; Zhang, S.; Li, H. Combining Sentinel-1 and-3 Imagery for Retrievals of Regional Multitemporal Biophysical Parameters Under a Deep Learning Framework. IEEE J. Sel. Top. Appl. Earth Observ. Remote Sens. 2022, 15, 6985–6998. [Google Scholar] [CrossRef]
  19. Cao, X.; Fu, X.; Xu, C.; Meng, D. Deep spatial-spectral global reasoning network for hyperspectral image denoising. IEEE Trans. Geosci. Remote Sens. 2021, 60, 1–14. [Google Scholar] [CrossRef]
  20. Cui, L.; Jing, X.; Wang, Y.; Huan, Y.; Xu, Y.; Zhang, Q. Improved Swin Transformer-Based Semantic Segmentation of Postearthquake Dense Buildings in Urban Areas Using Remote Sensing Images. IEEE J. Sel. Top. Appl. Earth Observ. Remote Sens. 2022, 16, 369–385. [Google Scholar] [CrossRef]
  21. Wu, X.; Hong, D.; Chanussot, J. Convolutional neural networks for multimodal remote sensing data classification. IEEE Trans. Geosci. Remote Sens. 2021, 60, 1–10. [Google Scholar] [CrossRef]
  22. Yao, J.; Zhang, B.; Li, C.; Hong, D.; Chanussot, J. Extended Vision Transformer (ExViT) for Land Use and Land Cover Classification: A Multimodal Deep Learning Framework. IEEE Trans. Geosci. Remote Sens. 2023, 61, 5514415. [Google Scholar] [CrossRef]
  23. Shao, J.; Tang, L.; Liu, M.; Shao, G.; Sun, L.; Qiu, Q. BDD-Net: A general protocol for mapping buildings damaged by a wide range of disasters based on satellite imagery. Remote Sens. 2020, 12, 1670. [Google Scholar] [CrossRef]
  24. Hong, D.; Hu, J.; Yao, J.; Chanussot, J.; Zhu, X.X. Multimodal remote sensing benchmark datasets for land cover classification with a shared and specific feature learning model. ISPRS-J. Photogramm. Remote Sens. 2021, 178, 68–80. [Google Scholar] [CrossRef]
  25. Tucker, C.J. Red and photographic infrared linear combinations for monitoring vegetation. Remote Sens. Environ. 1979, 8, 127–150. [Google Scholar] [CrossRef] [Green Version]
  26. Candiago, S.; Remondino, F.; De Giglio, M.; Dubbini, M.; Gattelli, M. Evaluating multispectral images and vegetation indices for precision farming applications from UAV images. Remote Sens. 2015, 7, 4026–4047. [Google Scholar] [CrossRef] [Green Version]
  27. Hatfield, J.L.; Prueger, J.H. Value of using different vegetative indices to quantify agricultural crop characteristics at different growth stages under varying management practices. Remote Sens. 2010, 2, 562–578. [Google Scholar] [CrossRef] [Green Version]
  28. Potgieter, A.B.; George-Jaeggli, B.; Chapman, S.C.; Laws, K.; Suárez Cadavid, L.A.; Wixted, J.; Watson, J.; Eldridge, M.; Jordan, D.R.; Hammer, G.L. Multi-spectral imaging from an unmanned aerial vehicle enables the assessment of seasonal leaf area dynamics of sorghum breeding lines. Front. Plant Sci. 2017, 8, 1532. [Google Scholar] [CrossRef]
  29. Jordan, C.F. Derivation of leaf-area index from quality of light on the forest floor. Ecology 1969, 50, 663–666. [Google Scholar] [CrossRef]
  30. Li, F.; Miao, Y.; Feng, G.; Yuan, F.; Yue, S.; Gao, X.; Liu, Y.; Liu, B.; Ustin, S.L.; Chen, X. Improving estimation of summer maize nitrogen status with red edge-based spectral vegetation indices. Field Crop. Res. 2014, 157, 111–123. [Google Scholar] [CrossRef]
  31. Roujean, J.-L.; Breon, F.-M. Estimating PAR absorbed by vegetation from bidirectional reflectance measurements. Remote Sens. Environ. 1995, 51, 375–384. [Google Scholar] [CrossRef]
  32. Gitelson, A.A.; Kaufman, Y.J.; Merzlyak, M.N. Use of a green channel in remote sensing of global vegetation from EOS-MODIS. Remote Sens. Environ. 1996, 58, 289–298. [Google Scholar] [CrossRef]
  33. Broge, N.H.; Mortensen, J.V. Deriving green crop area index and canopy chlorophyll density of winter wheat from spectral reflectance data. Remote Sens. Environ. 2002, 81, 45–57. [Google Scholar] [CrossRef]
  34. Gitelson, A.A.; Gritz, Y.; Merzlyak, M.N. Relationships between leaf chlorophyll content and spectral reflectance and algorithms for non-destructive chlorophyll assessment in higher plant leaves. J. Plant Physiol. 2003, 160, 271–282. [Google Scholar] [CrossRef]
  35. Qi, J.; Chehbouni, A.; Huete, A.R.; Kerr, Y.H.; Sorooshian, S. A modified soil adjusted vegetation index. Remote Sens. Environ. 1994, 48, 119–126. [Google Scholar] [CrossRef]
  36. Rouse, J.W.; Haas, R.H.; Schell, J.A.; Deering, D.W. Monitoring vegetation systems in the Great Plains with ERTS. NASA Spec. Publ. 1974, 351, 309. [Google Scholar]
  37. Gitelson, A.A.; Viña, A.; Ciganda, V.; Rundquist, D.C.; Arkebauer, T.J. Remote estimation of canopy chlorophyll content in crops. Geophys. Res. Lett. 2005, 32. [Google Scholar] [CrossRef] [Green Version]
  38. Dash, J.; Jeganathan, C.; Atkinson, P. The use of MERIS Terrestrial Chlorophyll Index to study spatio-temporal variation in vegetation phenology over India. Remote Sens. Environ. 2010, 114, 1388–1402. [Google Scholar] [CrossRef]
  39. Elsayed, S.; Elhoweity, M.; Ibrahim, H.H.; Dewir, Y.H.; Migdadi, H.M.; Schmidhalter, U. Thermal imaging and passive reflectance sensing to estimate the water status and grain yield of wheat under different irrigation regimes. Agric. Water Manag. 2017, 189, 98–110. [Google Scholar] [CrossRef]
  40. Torres-Sánchez, J.; Peña, J.M.; de Castro, A.I.; López-Granados, F. Multi-temporal mapping of the vegetation fraction in early-season wheat fields using images from UAV. Comput. Electron. Agric. 2014, 103, 104–113. [Google Scholar] [CrossRef]
  41. Li, B.; Xu, X.; Zhang, L.; Han, J.; Bian, C.; Li, G.; Liu, J.; Jin, L. Above-ground biomass estimation and yield prediction in potato by using UAV-based RGB and hyperspectral imaging. ISPRS-J. Photogramm. Remote Sens. 2020, 162, 161–172. [Google Scholar] [CrossRef]
  42. Ke, G.; Meng, Q.; Finley, T.; Wang, T.; Chen, W.; Ma, W.; Ye, Q.; Liu, T.-Y. Lightgbm: A highly efficient gradient boosting decision tree. Adv. Neural Inf. Process. Syst. 2017, 30, 3149–3157. [Google Scholar]
  43. Shao, G.; Han, W.; Zhang, H.; Liu, S.; Wang, Y.; Zhang, L.; Cui, X. Mapping maize crop coefficient Kc using random forest algorithm based on leaf area index and UAV-based multispectral vegetation indices. Agric. Water Manag. 2021, 252, 106906. [Google Scholar] [CrossRef]
  44. Hoerl, A.E.; Kennard, R.W. Ridge regression: Biased estimation for nonorthogonal problems. Technometrics 1970, 12, 55–67. [Google Scholar] [CrossRef]
  45. Cheng, M.; Jiao, X.; Liu, Y.; Shao, M.; Yu, X.; Bai, Y.; Wang, Z.; Wang, S.; Tuohuti, N.; Liu, S.; et al. Estimation of soil moisture content under high maize canopy coverage from UAV multimodal data and machine learning. Agric. Water Manag. 2022, 264, 107530. [Google Scholar] [CrossRef]
  46. Jin, X.; Li, Z.; Feng, H.; Ren, Z.; Li, S. Deep neural network algorithm for estimating maize biomass based on simulated Sentinel 2A vegetation indices and leaf area index. Crop J. 2020, 8, 87–97. [Google Scholar] [CrossRef]
  47. Maimaitijiang, M.; Sagan, V.; Sidike, P.; Hartling, S.; Esposito, F.; Fritschi, F.B. Soybean yield prediction from UAV using multimodal data fusion and deep learning. Remote Sens. Environ. 2020, 237, 111599. [Google Scholar] [CrossRef]
  48. Liu, S.; Jin, X.; Nie, C.; Wang, S.; Yu, X.; Cheng, M.; Shao, M.; Wang, Z.; Tuohuti, N.; Bai, Y.; et al. Estimating leaf area index using unmanned aerial vehicle data: Shallow vs. deep machine learning algorithms. Plant Physiol. 2021, 187, 1551–1576. [Google Scholar] [CrossRef]
  49. Ding, F.; Li, C.; Zhai, W.; Fei, S.; Cheng, Q.; Chen, Z. Estimation of Nitrogen Content in Winter Wheat Based on Multi-Source Data Fusion and Machine Learning. Agriculture 2022, 12, 1752. [Google Scholar] [CrossRef]
  50. Jiang, J.; Johansen, K.; Stanschewski, C.S.; Wellman, G.; Mousa, M.A.; Fiene, G.M.; Asiry, K.A.; Tester, M.; McCabe, M.F. Phenotyping a diversity panel of quinoa using UAV-retrieved leaf area index, SPAD-based chlorophyll and a random forest approach. Precis. Agric. 2022, 23, 961–983. [Google Scholar] [CrossRef]
  51. Qiao, L.; Gao, D.; Zhao, R.; Tang, W.; An, L.; Li, M.; Sun, H. Improving estimation of LAI dynamic by fusion of morphological and vegetation indices based on UAV imagery. Comput. Electron. Agric. 2022, 192, 106603. [Google Scholar] [CrossRef]
  52. Wang, F.; Yi, Q.; Hu, J.; Xie, L.; Yao, X.; Xu, T.; Zheng, J. Combining spectral and textural information in UAV hyperspectral images to estimate rice grain yield. Int. J. Appl. Earth Obs. Geoinf. 2021, 102, 102397. [Google Scholar] [CrossRef]
  53. Cheng, M.; Penuelas, J.; McCabe, M.F.; Atzberger, C.; Jiao, X.; Wu, W.; Jin, X. Combining multi-indicators with machine-learning algorithms for maize yield early prediction at the county-level in China. Agric. For. Meteorol. 2022, 323, 109057. [Google Scholar] [CrossRef]
  54. Shah, S.H.; Angel, Y.; Houborg, R.; Ali, S.; McCabe, M.F. A random forest machine learning approach for the retrieval of leaf chlorophyll content in wheat. Remote Sens. 2019, 11, 920. [Google Scholar] [CrossRef] [Green Version]
  55. Zhang, Y.; Yang, Y.; Zhang, Q.; Duan, R.; Liu, J.; Qin, Y.; Wang, X. Toward Multi-Stage Phenotyping of Soybean with Multimodal UAV Sensor Data: A Comparison of Machine Learning Approaches for Leaf Area Index Estimation. Remote Sens. 2022, 15, 7. [Google Scholar] [CrossRef]
Figure 1. Overview of the study area.
Remotesensing 15 03454 g001
Figure 2. The UAV and the sensors it carries. (a) DJM 210 with MS and TIR sensors, and (b) DJI Phantom 4 RTK with RGB sensors. Note: The red box in (a) is the MS sensor, and the blue box is the TIR sensor. The green box in (b) is an RGB sensor.
Remotesensing 15 03454 g002
Figure 3. Each sensor corresponds to the image captured: (a) MS sensor, (b) TIR sensor, and (c) RGB sensor.
Remotesensing 15 03454 g003
Figure 4. Statistics of the measured chlorophyll content.
Remotesensing 15 03454 g004
Figure 5. CC extraction: (a) RGB original image, and (b) RGB image after removal of soil background.
Remotesensing 15 03454 g005
Figure 6. Stacking ensemble learning implementation process.
Remotesensing 15 03454 g006
Figure 7. Workflow diagram for this study.
Remotesensing 15 03454 g007
Figure 8. Accuracy of chlorophyll content estimation for different input features and different algorithms: (a) R2 and (b) rRMSE. Note: Th denotes thermal features, Sp denotes spectral features, and St denotes structural features.
Remotesensing 15 03454 g008
Figure 9. Scatterplot of chlorophyll content estimation by RR, LightGBM, RFR, and stacking with spectral features.
Remotesensing 15 03454 g009
Figure 10. Scatterplot of chlorophyll content estimation by RR, LightGBM, RFR, and stacking with thermal + spectral + structural features fusion.
Remotesensing 15 03454 g010
Figure 11. Accuracy statistics of RR, LightGBM, RFR, and stacking in the estimation of chlorophyll content: (a) R2 and (b) rRMSE.
Remotesensing 15 03454 g011
Figure 12. Temporal and spatial distribution of chlorophyll content estimates in maize at the jointing, trumpet, and big trumpet stages.
Remotesensing 15 03454 g012
Figure 13. Ranking the importance of spectral, thermal, and structural features.
Remotesensing 15 03454 g013
Figure 14. Optimizing estimation accuracy by feature elimination.
Remotesensing 15 03454 g014
Table 1. Detailed information about each sensor.
Sensor NameSensor TypeBandWavelengthBandwidthImage Resolution
RedEdge MXMultispectralRed668 nm10 nm1280 × 960
Green560 nm20 nm1280 × 960
Blue475 nm20 nm1280 × 960
Red edge717 nm10 nm1280 × 960
Near infrared842 nm40 nm1280 × 960
Zenmuse XT2ThermalThermal infrared10.5 μm6 μm640 × 512
RGBRGBR, G, B--5472 × 3468
Table 2. Spectral features, thermal features, and structural features extracted by each sensor.
Sensor TypeFeaturesFormulationReference
MSNormalized difference vegetation index (NDVI)NDVI = (NIR − R)/(NIR + R)[25]
Green normalized difference vegetation index (GNDVI)GNDVI = (NIR − G)/(NIR + G)[26]
Soil adjusted vegetation index (SAVI)SAVI = (1 + L) × (NIR − R)/(NIR + R + L)(L = 0.5)[27]
Enhanced vegetation index (EVI)EVI = 2.5 × (NIR − R)/(NIR + 6 × R − 7.5 × B + 1)[28]
Difference vegetation index (DVI)DVI = NIR − R[29]
Normalized difference red edge (NDRE)NDRE = (NIR − REG)/(NIR + REG)[30]
Red difference vegetation index (RDVI)RDVI = (NIR − R)/(NIR + R)^0.5[31]
Green difference vegetation index (GDVI)GDVI = NIR − G[32]
Ratio vegetation index (RVI)RVI = NIR/R[33]
Green vhlorophyll index (GCI)GCI = (NIR/G) − 1[34]
Green atmospherically resistant index (GARI)GARI = (NIR − G + 1.7(B − R))/(NIR + G − 1.7(B − R))[32]
Modified soil adjusted vegetation index (MSAVI)MSAVI = 1.5(NIR − R)/(NIR + R) + 0.5[35]
Green ratio vegetation index (RVIGRE)RVIGRE = NIR/G[36]
Chlorophyll index with red edge (CIredege)CIredege = (NIR/REG) − 1[37]
Chlorophyll index with green (CIgreen)CIgreen = (NIR/G) − 1[38]
TIRNormalized relative canopy temperature (NRCT)NRCT = (Ti − Tmin)/(Tmax − Tmin)[39]
RGBCrop cover (CC)CC = number of crop pixels in the plot/total number of plot pixels[40]
Crop height (CH)CH = DSM − DEM[41]
Table 3. Descriptive statistics for chlorophyll content (mg/L) of the training set and the test set.
DatasetSample SizeMinMeanMaxStandard DeviationCoefficient of Variation (%)
Training set28820.5539.9758.566.1215.32
Test set7217.9439.7656.396.7116.87
Table 4. Estimated accuracy of single features and multisource feature fusion.
Sensor CombinationFeatures CombinationRRLightGBMRFRStacking
R2rRMSE (%)R2rRMSE (%)R2rRMSE (%)R2rRMSE (%)
TIRTh0.60211.680.56711.050.55511.240.62210.68
MSSp0.54312.050.59010.840.57311.030.61110.66
RGBSt0.56811.170.62210.310.62910.480.6599.81
MS + TIRSp + Th0.6929.650.64010.130.6649.760.7039.20
MS + RGBSp + St0.61410.510.6509.970.64010.120.6739.59
TIR + RGBTh + St0.6829.750.6909.390.6819.520.7119.09
MS + TIR + RGBSp + Th + St0.6999.470.6999.200.7398.660.7548.36
Note: Th denotes thermal features, Sp denotes spectral features, and St denotes structural features.
Disclaimer/Publisher’s Note: The statements, opinions and data contained in all publications are solely those of the individual author(s) and contributor(s) and not of MDPI and/or the editor(s). MDPI and/or the editor(s) disclaim responsibility for any injury to people or property resulting from any ideas, methods, instructions or products referred to in the content.