Article

Hybrid Deep Learning and S2S Model for Improved Sub-Seasonal Surface and Root-Zone Soil Moisture Forecasting

1
National Engineering Research Center for Geographic Information System, China University of Geosciences (Wuhan), Wuhan 430074, China
2
School of Navigation, Wuhan University of Technology, Wuhan 430063, China
3
School of Geography and Environment, Jiangxi Normal University, Nanchang 330022, China
*
Author to whom correspondence should be addressed.
Remote Sens. 2023, 15(13), 3410; https://doi.org/10.3390/rs15133410
Submission received: 8 May 2023 / Revised: 24 June 2023 / Accepted: 3 July 2023 / Published: 5 July 2023
(This article belongs to the Special Issue GeoAI and EO Big Data Driven Advances in Earth Environmental Science)

Abstract

:
Surface soil moisture (SSM) and root-zone soil moisture (RZSM) are key hydrological variables for the agricultural water cycle and vegetation growth. Accurate SSM and RZSM forecasting at sub-seasonal scales would be valuable for agricultural water management and preparations. Currently, weather model-based soil moisture predictions are subject to large uncertainties due to inaccurate initial conditions and empirical parameterization schemes, while the data-driven machine learning methods have limitations in modeling long-term temporal dependences of SSM and RZSM because of the lack of considerations in the soil water process. Thus, here, we innovatively integrate the model-based soil moisture predictions from a sub-seasonal-to-seasonal (S2S) model into a data-driven stacked deep learning model to construct a hybrid SSM and RZSM forecasting framework. The hybrid forecasting model is evaluated over the Yangtze River Basin and parts of Europe from 1- to 46-day lead times and is compared with four baseline methods, including the support vector regression (SVR), random forest (RF), convolutional long short-term memory (ConvLSTM) and the S2S model. The results indicate substantial skill improvements in the hybrid model relative to baseline models over the two study areas spatiotemporally, in terms of the correlation coefficient, unbiased root mean square error (ubRMSE) and RMSE. The hybrid forecasting model benefits from the long-lead predictive skill from S2S and retains the advantages of data-driven soil moisture memory modeling at short-lead scales, which account for the superiority of hybrid forecasting. Overall, the developed hybrid model is promising for improved sub-seasonal SSM and RZSM forecasting over global and local areas.

Graphical Abstract

1. Introduction

Soil moisture is a key hydrometeorological variable influencing the global water cycle. Soil moisture affects vegetation evapotranspiration, and thus the precipitation process, through land–atmosphere feedback [1,2,3,4,5,6]. Accurate soil moisture forecasting at sub-seasonal-to-seasonal (S2S) scales helps in regional water resources’ management and risk preparations [7,8,9,10], such as early drought warning, estimation of water requirements in precise agriculture and wildfire prediction [11]. For example, the soil moisture prediction up to a two-week lead time can be used to detect flash droughts in agricultural development, and the farmers can prepare for the upcoming water deficits according to the predictive information [12].
With the development of satellite remote sensing techniques, the retrieval of surface soil moisture (SSM) at large spatial scales is feasible, and there are several satellite-based SSM products worldwide, such as the SMAP, SMOS, AMSR2 and FY-3B [13,14,15,16,17]. However, currently, the root-zone soil moisture (RZSM) cannot be directly retrieved by remote sensing sensors and is usually simulated by land surface models or hydrological models [18,19], such as the fifth-generation European Centre for Medium-Range Weather Forecasts (ECMWF) reanalysis (ERA5) [20], the Modern-Era Retrospective analysis for Research and Applications, version 2 (MERRA-2) [21] and the Global Land Data Assimilation System (GLDAS) [22]. The soil moisture at the root-zone layer (~100 cm) is critical for vegetation transpiration and photosynthesis, and thus the RZSM forecasting should gain attention in hydrometeorological prediction. The model-based RZSM products demonstrate appealing accuracy in RZSM representation when compared with in situ data and exhibit great potential for agricultural drought monitoring [23,24,25,26,27]. Therefore, it is reasonable to utilize model-based RZSM data in historical time to predict future RZSM conditions by certain forecasting approaches.
The existing soil moisture forecasting methods can generally be divided into two categories: the data-driven methods and the model-based approaches [28,29,30]. With the advances of artificial intelligence (AI), the data-driven machine learning or deep learning methods are powerful tools to learn the underlying nonlinear relationships between predictors and predictands, and then use the learned rules to predict future states [31,32]. The appealing point of data-driven heuristic methods lies in the fact that the underlying rules can be captured to some degree by the learning methods considering massive data. The learned relationships from known observations of predictors and predictands are assumed as unchanged in future periods to perform prediction [31]. The data-driven methods demonstrate satisfactory predictive accuracy in hourly or daily soil moisture forecasting, especially for areas where the spatiotemporal variations of soil moisture are not very intense or the soil moisture memory is well-kept [29,32,33,34]. If the data distribution of soil moisture changes in the future periods relative to the training data in the historical periods, the data-driven methods may not perform well in spatiotemporal forecasting, especially for long-lead times [28,35]. The data-driven methods may fail to capture the long-lead spatiotemporal dependences of soil moisture because the soil moisture memory attenuates or disappears with the increase of the lead time [36,37]. The model-based approaches use solid physics-based models (e.g., climate model or hydrological model) and initial conditions to simulate future states [20,21,30]. The physics-based models are usually based on differential equations to simulate the complex interactions of numerous factors over the land surface and the layers beneath the soil. The future states are inferred by running the soil moisture modules using the calibrated parameters and the initial conditions from atmosphere, land and ocean spheres. Therefore, the model-based RZSM predictions are physically interpretable, while the data-driven outputs are relatively difficult to interpret. However, the initial conditions, parameters and model structures suffer from substantial uncertainties, and the model-based forecasts are limited by these uncertainty sources [12,28,38,39].
Considering the strengths and limitations of data-driven and model-based soil moisture methods, it seems promising to combine them to construct hybrid forecasting models. The hybrid forecasting generally refers to the joint use of dynamic process-based models and data-driven statistical or machine learning methods in an integrated framework to perform predictions [28,40,41,42]. For example, the precipitation forecasts from a numerical weather model and from a long short-term memory (LSTM) approach are jointly trained in a Bayesian framework, and the prediction is performed by the Bayesian LSTM-weather coupled model. The data-driven modules may also be employed to replace a specific physical module (e.g., the cloud microphysical scheme) in the forecasting model [43]. There are some preliminary exploratory studies highlighting the effectiveness of hybrid forecasting in precipitation forecasting, drought prediction and streamflow prediction [40,42,44]. The data-driven heuristic methods are attractive in reducing the predictive biases, combining novel predictability sources and self-adaptive training [40,42]. Although the hybrid concept is widely proposed in earth science recently, the operational forecasting system prefers the sole use of a process model or artificial intelligence for hydrometeorological forecasting, partly because the integration of data-driven and model-based predictions still lacks convincing interpretations in producing physically consistent results.
As for soil moisture forecasting, several research centers issued global RZSM predictions at sub-seasonal-to-seasonal scales [45,46]. The North American Multi-Model Ensemble (NMME) is a seasonal forecasting system that produces global hydrometeorological predictions for some key variables, such as precipitation, temperature and soil moisture [46]. The ensemble forecasting by NMME models exhibits some skills over global lands [47,48], especially at a one-month lead time. At sub-seasonal timescales, the S2S project provides multiple model-based soil moisture predictions by several major climate centers worldwide [45]. The S2S soil moisture predictions are preliminarily evaluated over regional areas and demonstrate appealing predictive skill for a couple of days in advance [38,39,49]. For example, the European Centre for Medium-Range Weather Forecasts (ECMWF) S2S model exhibits good prediction skill 20 days in advance over the Tibetan Plateau and northwestern China [38]. The S2S predictions are also assessed in South America and utilized in eastern Africa to guide crop management services [39,49]. Although the model-based soil moisture predictions provide some forecasting skills over longer lead times, the uncertainties in the initial conditions, parameters and model structures lead to unexpected biases and errors in forecasting, of which the uncertainty of the initial conditions largely limits the forecasting skill for a specific model.
The emerging data-driven machine learning and deep learning approaches provide new opportunities for soil moisture forecasting and show appealing forecasting skill in existing studies [50,51,52,53]. Typical examples include the extreme learning machine (ELM), LSTM, support vector machine (SVM), convolutional neural network (CNN) and convolutional LSTM (ConvLSTM), and these methods demonstrate satisfactory performance in hourly or daily soil moisture forecasting [31,32,51,54]. It is expected that the data-driven models will perform extremely well in short-term soil moisture forecasting (e.g., 1 day) because of the strong temporal persistence and memory of soil moisture. However, the temporal dependences of soil moisture will attenuate with the increase of the lead time and the machine learning approaches may fail to capture the long-term dependences, as the predictive accuracy substantially decreases when the forecasting lead goes beyond the first several forecasting steps for some forecasting applications [31,32,52,53].
In this study, the data-driven deep learning method and the model-based prediction are jointly utilized in a hybrid forecasting framework to predict soil moisture at the surface (0–5 cm) and root-zone layers (0–100 cm) for 1–46 days in advance. The innovation of this work lies in the subtle integration of data-driven deep learning and process models to combine their strengths for sub-seasonal soil moisture prediction. Compared with existing studies, this is the first attempt to combine AI and S2S models for sub-seasonal SSM and RZSM predictions. We show that the advantage of long-term forward prediction capability for the S2S model and the advantage of nonlinear sequence dependence modeling in deep learning can be effectively integrated to enhance the soil moisture predictive skill. The advantages of the developed hybrid forecasting model are presented by comparing with individual data-driven and model-based predictions in space and time. The rest of this study is organized as follows. Section 2 introduces the study area and data, Section 3 presents the developed forecasting framework, Section 4 demonstrates the experimental results and discussion, and Section 5 concludes this work.

2. Study Area and Data

2.1. Study Area

The study area included two regions, of which one is located at the Yangtze River Basin (YRB) of southern China (Figure 1), featuring the subtropical monsoon climate for most of the YRB regions and the alpine climate in northwestern areas. The averaged RZSM in the study period ranged from 0.01 m3/m3 to 0.60 m3/m3, with wet areas in southern and southeastern regions of the YRB and dry areas in northeastern and southwestern regions. The annual average precipitation of the YRB is approximately 1067 mm and is distributed unevenly in space and time. Although most of the YRB regions feature humid and semi-humid climates, frequent droughts hit the YRB area in recent years and caused severe socioeconomic losses [55,56], such as the 2011 spring drought and the 2022 summer drought events. The major crops in the YRB regions include rice, cotton, oilseed rape and tea, and the major land cover types include forest, cropland, grassland, shrubland and water. The agricultural production of the YRB accounts for ~40% of the total agricultural production in China. Therefore, accurate forecasting of the RZSM would be valuable for agricultural water management and decision-making in the YRB region.
The other selected area was located in the central areas of Europe (EU), spanning from 4°E and 42°N to 30°E and 54°N. The averaged RZSM was higher in western parts of the selected Europe areas, such as Germany, Switzerland and Austria, and lower in northern and eastern areas, such as Poland and Hungary. The major land cover types in Europe areas include cropland, forest, grassland, wetland and water. The drought events also hit Europe and brought unexpected losses to agriculture and economic production in recent years [57,58,59], and the precise RZSM forecasting would be helpful for agricultural adaptations in this area. The selected YRB and Europe areas belong to different continents and have different hydrometeorological conditions, which were chosen to evaluate the proposed forecasting model in order to test the generalization ability.

2.2. The ERA5 Reanalysis Data

The in situ soil moisture stations are often used as ground truth to evaluate the model-based RZSM product and the forecasting accuracy. However, currently, the in situ stations are very limited in China, and the available stations in the International Soil Moisture Network (ISMN) [60] for the YRB region are sparse and span a short period, which cannot be used for validating the prediction in this work. Thus, to ensure the complete coverage of the spatiotemporal domains of SSM and RZSM forecasting, the ERA5 reanalysis data were collected as the SSM and RZSM data source [20]. The ERA5 SSM and RZSM data have been evaluated over global regions and showed good consistency with in situ data over southern China, Tibet Plateau and eastern China [18,23,24,25,26]. The ERA5 hourly 0.1° soil moisture data at three soil layers (0–7 cm, 7–28 cm and 28–100 cm) were downloaded from the Copernicus Climate Change Service (C3S) Climate Data Store (https://cds.climate.copernicus.eu/cdsapp#!/dataset/reanalysis-era5-single-levels?tab=overview (accessed on 6 December 2022)) and aggregated into daily 0–5 cm SSM and 0–100 cm RZSM data by weighted averaging. The 0.1° ERA5 soil moisture data were further aggregated into 1° resolution to match the predictive resolution from deep learning and the S2S model. It should be noted that the soil moisture predictions from deep learning and the S2S model can both be as high as 0.1° if the computational capacity is expanded.

2.3. The S2S Forecasting Data

The S2S project was initialized by the World Climate Research Programme (WCRP), the World Weather Research Programme (WWRP) and the Observing System Research and Predictability Experiment (THORPEX) in November 2009 to set up an appropriate collaborative structure for sub-seasonal prediction. An implementation plan was written for the S2S project under WCRP-WWRP-THORPEX sponsorship in December 2010, and the first 5-year phase of the project began in November 2013. The prime objective of the S2S project is to improve forecast skill and understanding on the sub-seasonal-to-seasonal timescale, with special emphasis on high-impact weather events. As for model-based forecasting, the S2S project is an international cooperation project by the world’s leading operational climate centers to improve forecast skill and understanding on the sub-seasonal-to-seasonal timescales [45]. There are a number of S2S models that can generate RZSM predictions at a certain frequency, such as ECMWF, CMA and NCEP. However, the RZSM outputs among different models suggest considerable inconsistencies due to the differences in forcing data, model structures and initial conditions [12,38,49], which makes it difficult to integrate them to construct ensemble forecasting at a daily scale. Here, we chose the ECMWF S2S model for RZSM forecasting as it has shown some promising predictive skills in different regions. The ECMWF S2S model uses the ERA interim soil reanalysis data as the initial conditions and the HTESSEL model as the land surface scheme [61,62]. The operational ECMWF forecasting is run twice a week (Monday and Thursday) with 51 ensemble members, at a resolution of Tco639 L137 (about 16 km) up to day 15 and Tco319 (about 32 km) after day 15. The S2S data in the native resolution are maintained in individual research centers and are publicly available in the S2S site with an upscaled common 1.5° × 1.5° grid. Therefore, we collected the RZSM predictions from the ECMWF S2S model at the 1.5° resolution and re-gridded them into 1° for further analysis from 1 January 2015 to 29 November 2022. Although the model-based RZSM predictions had a relatively coarse resolution, it can be regarded as an effective mapping of fine-resolution forecasting.

2.4. Auxiliary Datasets

The land cover data for the YRB area were collected from the Resource and Environment Science and Data Center (RESDC) of the Chinese Academy of Sciences, which included multiperiod land cover datasets produced by satellite remote sensing and manual visual interpretation [63]. The land cover data in the year 2020 were downloaded from RESDC at a 1 km resolution (https://www.resdc.cn/DOI/DOI.aspx?DOIid=54 (accessed on 6 December 2022)). The land cover data for the Europe areas were collected from the C3S Climate Data Store at a 300 m resolution for the year 2019 [64], which provided global maps describing the land surface in 22 classes (https://cds.climate.copernicus.eu/cdsapp#!/dataset/satellite-land-cover?tab=overview (accessed on 6 December 2022)). The downloaded land cover datasets over the YRB and Europe areas were resampled to 1° × 1° by majority votes in the analysis.

3. Methodology

3.1. The Machine Learning Forecasting Methods

We selected several machine learning or deep learning methods as baselines to compare with our hybrid forecasting model for RZSM prediction, including the support vector regression (SVR), random forest (RF) and ConvLSTM methods. These AI-based approaches are widely used in hydrometeorological forecasting, such as precipitation and soil moisture predictions [34,65,66]. The data-driven baseline models are powerful in forecasting when considering enough data samples. The three AI-based approaches have been used as baselines to test refined algorithms in existing studies.
SVR is a machine learning method based on VC theory and the rule of structural risk minimization [67]. SVR can be applied to nonlinear regressions by using kernel functions to map the input data to a high-dimensional feature space. The SVR method incorporates slack variables to tolerate some errors in the training period in order to increase the generalization ability of the model. The Gaussian radial basis function was selected as the kernel function for nonlinear mapping. The penalty factor C was set as the division of the interquartile range of the response variable y (RZSM) at 1.349, empirically, i.e., iqr(y)/1.349, and the tolerance parameter ε was set as iqr(y)/13.49, which is an estimate of a tenth of the standard deviation using the interquartile range. In the training process, the historical consecutive three-day RZSM observations were used as predictors and the RZSM in the target day as the predictand. The data from 2015 to 2018 were used as the training samples and the data from 2019 to 2022 were considered as the forecasting samples.
RF is a machine learning method to perform classification and regression based on ensemble of decision trees [68]. In the RF algorithm, each tree is generated by randomly selected predictors and randomly selected samples. The training and forecasting processes by RF can be summarized as follows [69]. First, the ntree bootstrapped samples are drawn from the original data, which account for approximately two-thirds of the training data. Second, an unpruned regression tree is grown with approximately one-third of the predictors being selected. Finally, the out-of-sample forecasts are conducted by aggregating the predictions from the ntree trees. Here, we used all the predictors for node splits in the RF experiment as only the previous three-day RZSM data were used as predictors. The number of trees was set to 100, empirically, by referring to existing studies [70,71].

3.2. The Deep Learning Forecasting Model

The stacked ConvLSTM model was adopted as the deep learning model to predict RZSM in a data-driven way. The ConvLSTM model was chosen because it has shown appealing predictive skills in some spatiotemporal forecasting applications, such as precipitation nowcasting, short-term soil moisture prediction and temperature forecasting [34,44,72]. The ConvLSTM consists of a convolutional module embedded in a LSTM unit and combines the advantages of spatial feature interactions in CNN and the temporal memory modeling in LSTM. Consider the sequence inputs of RZSM as X1, …, Xt, cell outputs C 1 , …, C t , hidden states H1, …, Ht and gates it (input gate), ft (forget gate) and ot (output gate). Some key equations of ConvLSTM are listed below:
i t = σ ( W x i X t + W h i H t 1 + W c i C t 1 + b i )
f t = σ ( W x f X t + W h f H t 1 + W c f C t 1 + b f )
C t = f t C t 1 + i t t a n h   ( W x c X t + W h c H t 1 + b c )
o t = σ ( W x o X t + W h o H t 1 + W c o C t + b o )
H t = o t t a n h   ( C t )
where W is the weight matrix, b is the bias vector and denotes the Hadamard product. For a detailed introduction of the ConvLSTM unit, refer to the previous study [72].
Figure 2 demonstrates the RZSM forecasting model based on the developed stacked ConvLSTM model. The RZSM for the historical three consecutive time steps, i.e., RZSMt−3, RZSMt−2 and RZSMt−1, were used as predictors to predict the RZSM in the target time period (RZSMt+i, i = 0, …, 45). Here, the one-step forecasting strategy was adopted to establish the relationship between the observed RZSM in the historical period and the future RZSM in the target period (lead time of 1–46 days). The stacked ConvLSTM model consists of 3 ConvLSTM layers, of which 2 of them have 50 filters and the last ConvLSTM layer has 1 filter. The input shape of the stacked ConvLSTM model is (32 or 26) × 12 × 3 and the output shape is (32 or 26) × 12 × 1, depending on the study areas. The inputs represent the three-dimensional matrix of image width, height and time for the YRB and EU regions with a 1° resolution. The relu function was used as the activation function for three ConvLSTM layers, and the Adam algorithm was adopted as the optimizer for the parameters. To enable a fair comparison with the S2S model, the joint available data periods for the ERA5 and S2S models from 2015 to 2018 were used as the training periods, and the joint dates from 2019 to 2022 were considered as the forecasting times.

3.3. Hybrid Soil Moisture Forecasting Framework

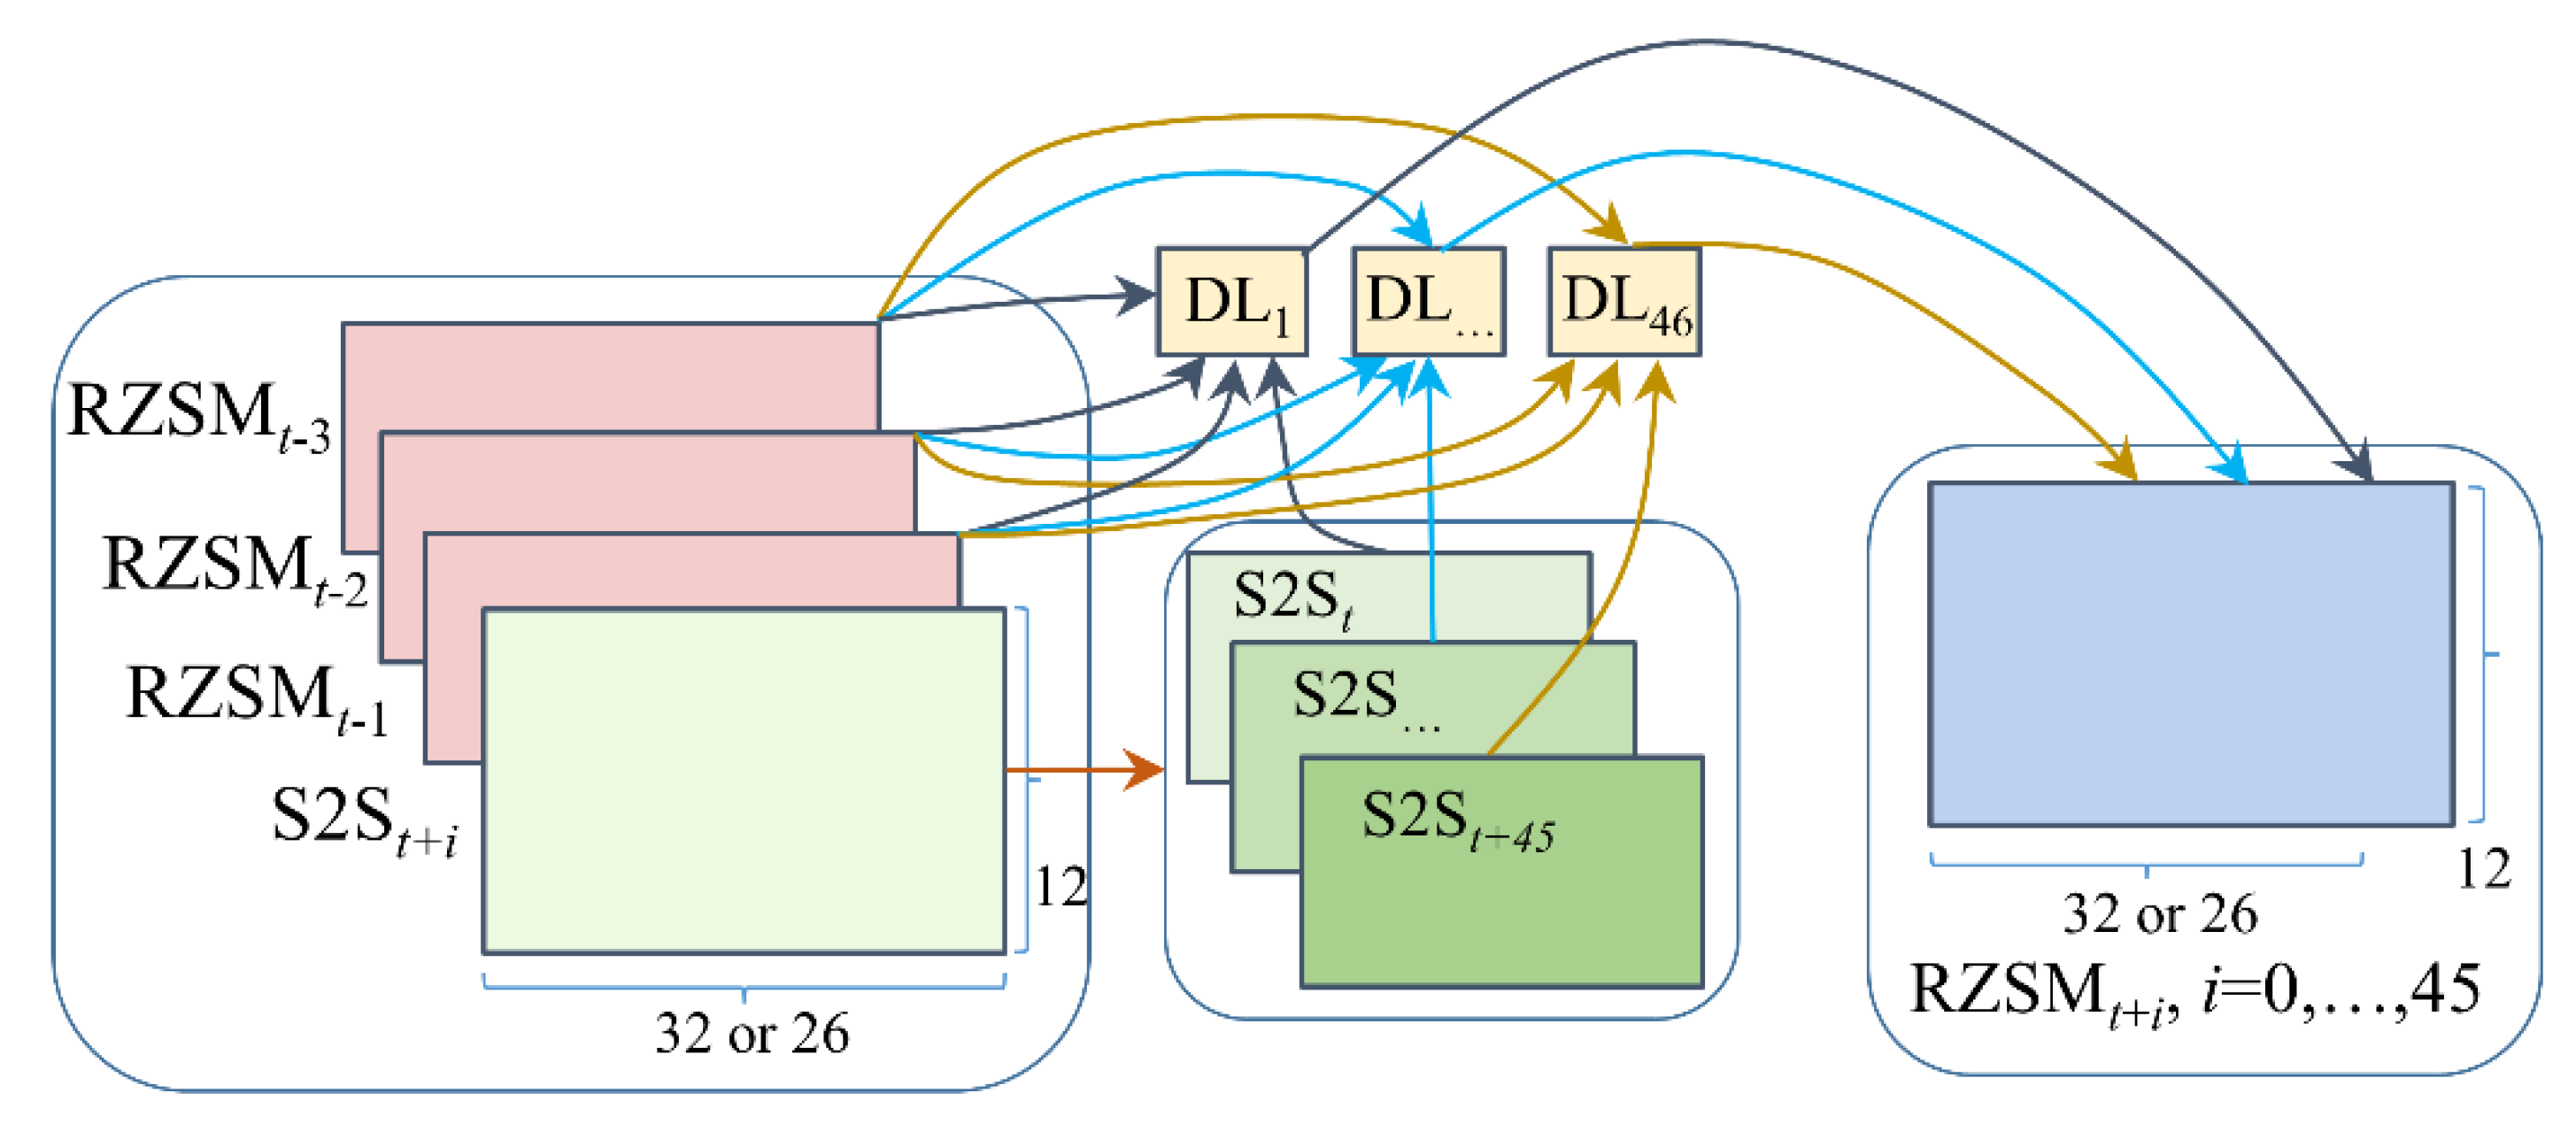
Figure 3 demonstrates the developed hybrid forecasting model by combining the deep learning and the S2S models. The deep learning model is the same as the stacked ConvLSTM model in Section 3.2, and the S2S model was included as an additional predictor in the inputs. The ECMWF S2S model includes 51 ensemble members, and the ensemble mean is concatenated with historical RZSM to train the forecasting model. In this way, the model-based predictions are incorporated into a data-driven model to make the best use of the predictive capability from the process model and deep learning. The hybrid model keeps the heuristic learning ability from data via utilization of the deep learning technique. We expect that the integration of data-driven and model-based predictions could improve the forecasting skill over individual predictions, as the former incorporates more information or knowledge into the forecasting process. The hybrid model was trained the same as the pure data-driven model in Section 3.2.
Before the integration process, we used a sequential bias correction method to further alleviate the prediction errors in the S2S model, except for the empirical quantile mapping approach. The sequential delta correction method calculates the differences between forecasts and observations over the previous five predictions for a specific lead time, and then the differences are applied to future predictions to sequentially reduce the systematic error. The corrected S2S predictions were then concatenated with the RZSM observations in the previous three consecutive time steps for model training. During the training period, we found that the sequential correction method could reduce the systematic error in the predictions for the first three-week lead time and failed to contribute to error alleviation after this lead time, possibly related to the substantial uncertainties for long-lead RZSM forecasting. Therefore, the sequential bias correction was only applied to the first three-week RZSM predictions from S2S, empirically.
The hybrid forecasting model was trained once for each lead time from 1 to 46 days, and a total of 46 hybrid models were obtained. For example, the historical observations on the 1st, 2nd and 3rd days and the predictions from S2S on the 5th day were concatenated to train the hybrid model to forecast RZSM on the 5th day for a 2-day lead time. The hybrid models were trained one-by-one using the training datasets from 2015 to 2018, and the trained models were then utilized to make predictions from 2019 to 2022. It should be noted that the data samples used for training the hybrid model were the same as the sample size of the S2S predictions and the data-driven baseline models.

3.4. Evaluation Metrics

To evaluate the predictive accuracy, the four commonly used statistical metrics were used here, including the Pearson’s correlation coefficient (PCC), unbiased root mean square error (ubRMSE), bias and root mean square error (RMSE). The PCC metric measures the linear correlation between two variables, x and y. A PCC value of 1 (−1) means a complete correlation (negative correlation), and a value of zero represents no correlation.
P C C x , y = i = 1 n x i x ¯ y i y ¯ i = 1 n x i x ¯ 2 i = 1 n y i y ¯ 2
where xi and yi are data samples of x and y, respectively, x ¯ and y ¯ are the arithmetic averages of x and y, respectively, and n denotes the sample size.
The ubRMSE (m3/m3) metric measures the absolute difference between two time series, x and y, after removing the mean signals:
u b R M S E = i = 1 n { x i x ¯ ) ( y i y ¯ } 2 n
The bias (m3/m3) metric measures the mean deviation of forecasts from observations:
b i a s = y ^ ¯ y ¯
where y ^ ¯ and y ¯ are the average of the predicted soil moisture and observations, respectively.
The RMSE (m3/m3) is a commonly used metric for absolute accuracy assessment in forecasting applications:
R M S E = i = 1 n x i y i 2 n
The four selected metrics are widely used in the evaluation of the performance for soil moisture estimation and forecasting. The most ideal case is that the developed model demonstrates consistent improvement over the baseline forecasting methods based on these metrics.

4. Results and Discussion

4.1. Overall Soil Moisture Forecasting Skill

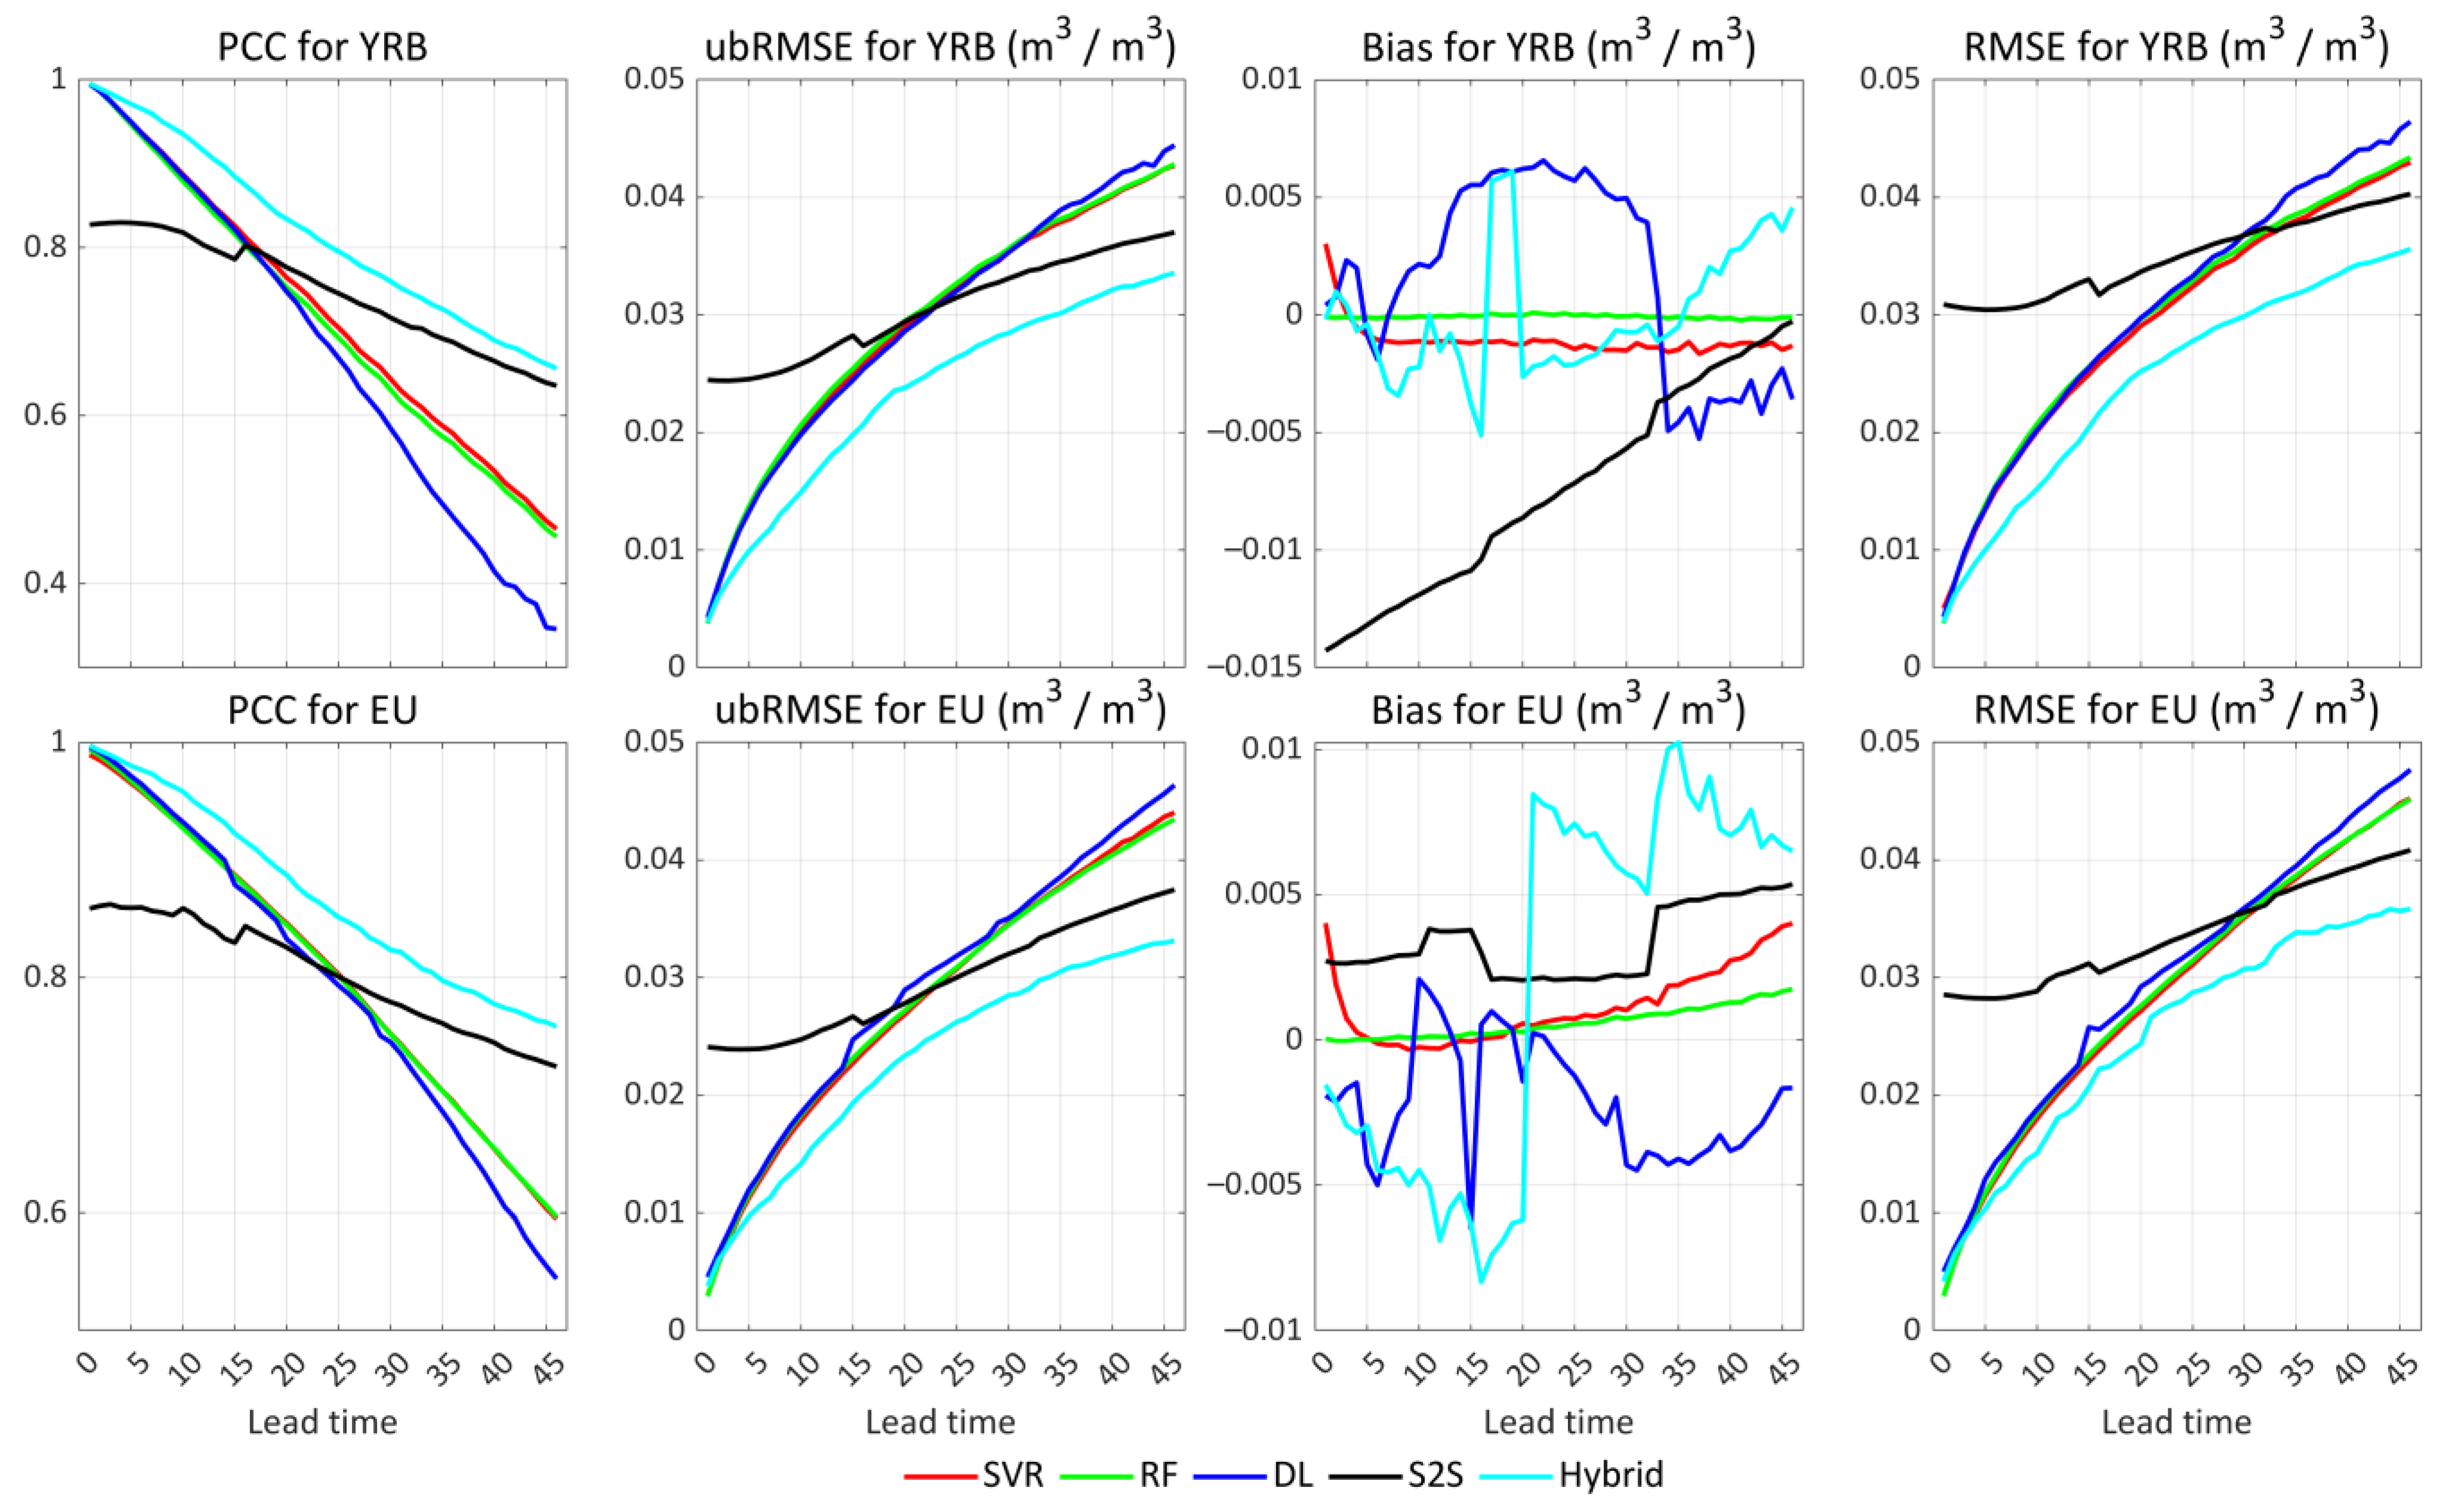
Figure 4 demonstrates the overall RZSM forecasting skills for 1–46 days ahead over the YRB and EU areas, in terms of the PCC, ubRMSE, bias and RMSE metrics. Overall, the hybrid forecasting model exhibited a higher PCC, lower ubRMSE and lower RMSE relative to the SVR, RF, DL and S2S models over both the YRB and EU areas. The hybrid forecasting model may not have performed the best for the first 1- to 2-day leads in terms of the averaged PCC and RMSE metrics, but it suggested better performance for 3- to 46-day RZSM forecasting over the 2 study areas. For example, the RF model showed an equal PCC (0.996) and slightly lower RMSE (0.0038 m3/m3) relative to the hybrid model (RMSE: 0.0039 m3/m3) for the 1-day RZSM prediction over the YRB area. Therefore, the hybrid forecasting model was comparable to the popular machine learning methods for short-term (e.g., 1–2 days) RZSM forecasting. The DL model demonstrated an average RMSE of 0.0043 m3/m3 for the 1-day RZSM prediction over the YRB area, which is less skillful compared to the RF model. The S2S model demonstrated a RMSE of 0.0309 m3/m3 for the 1-day RZSM prediction after bias correction using quantile mapping and a PCC value of 0.827, indicating secondary skill compared to the machine learning approaches. The S2S model was subject to large uncertainties in short-term RZSM predictions in terms of the PCC and RMSE values, which is largely related to uncertainties in initial conditions [12,38,39].
As for the bias metric, the SVR and RF models suggested overall smaller bias values relative to DL and hybrid models. The bias value exhibited irregular fluctuations over different lead times for the DL, S2S and hybrid models, which makes it difficult to determine which model is better. The averaged bias value was generally limited within ±0.01 m3/m3 for the hybrid model, and the random fluctuations were expected because the biases from DL and S2S models both demonstrated uneven distributions. Despite the fluctuating bias values, the hybrid forecasting model exhibited improved performance compared to the SVR, RF, DL and S2S models, as the PCC, ubRMSE and RMSE metrics all demonstrated some improvements for the former versus the latter models at most lead times. We also designed an experiment and compared the predictive performances between the hybrid SVR-S2S, RF-S2S and DL-S2S models. The results (not shown) demonstrated that the hybrid DL-S2S model is more skillful relative to hybrid SVR-S2S or RF-S2S models, in terms of the correlation coefficient and RMSE metrics.
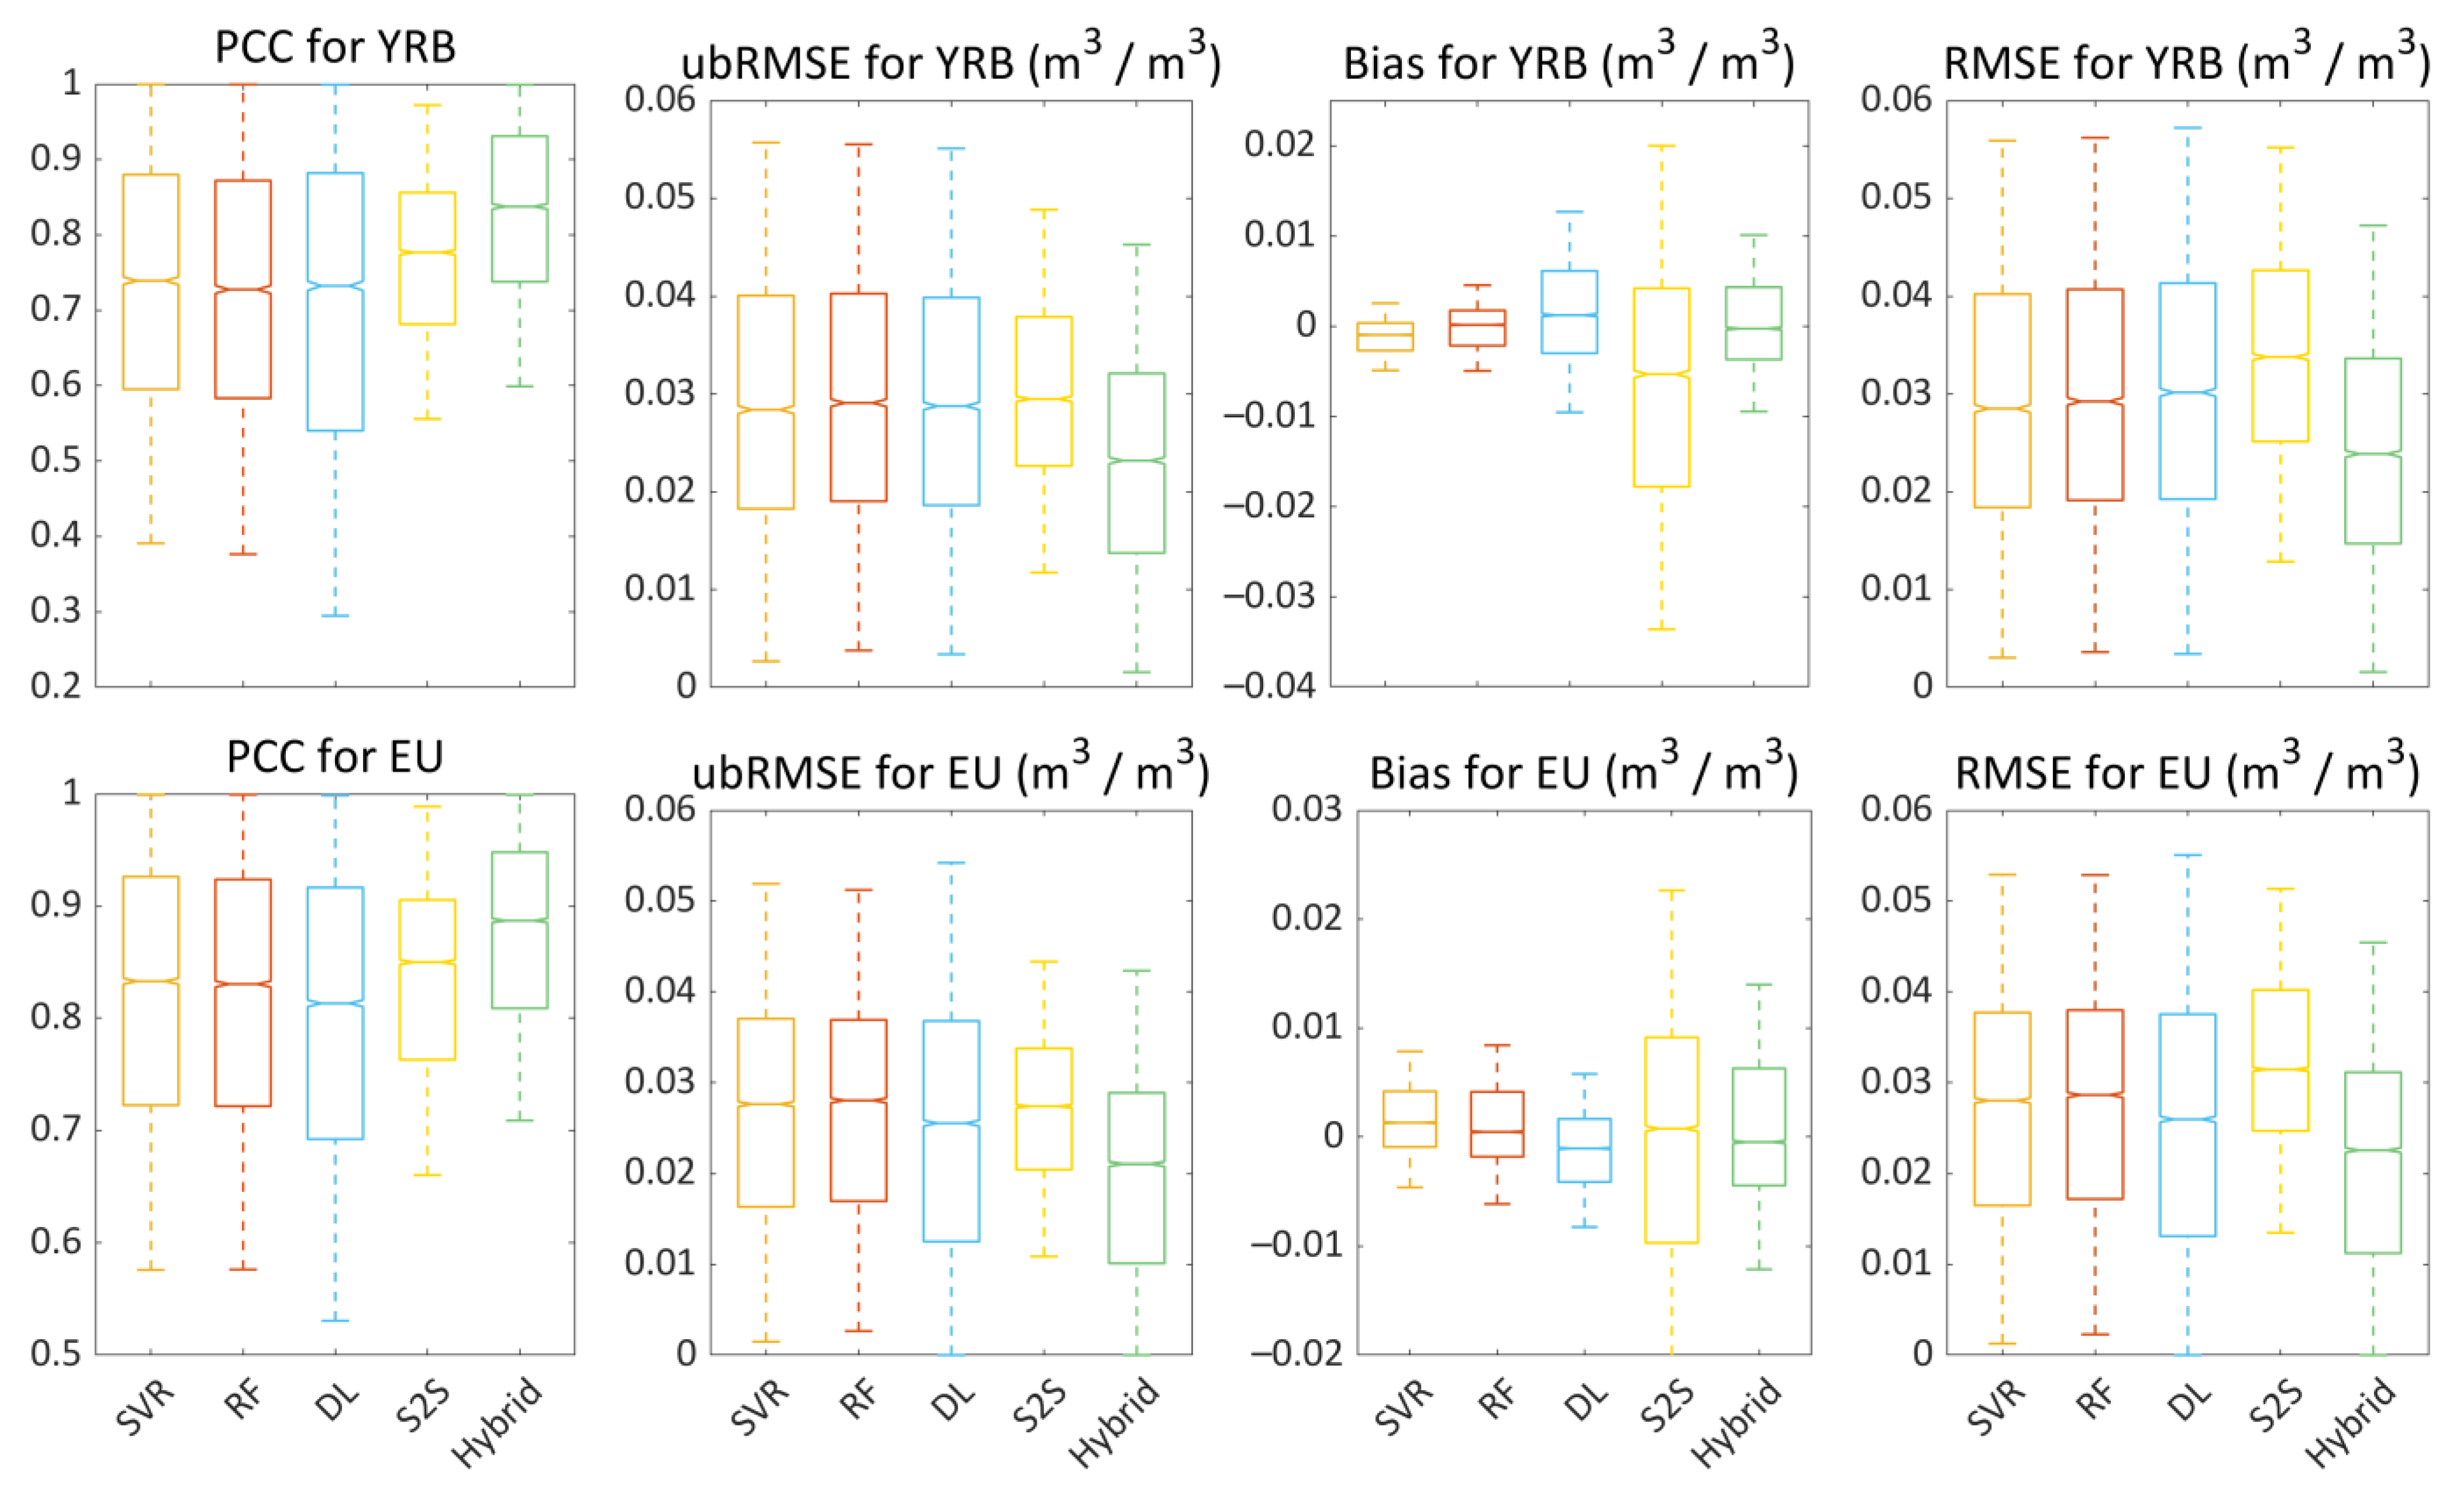
Figure 5 demonstrates the distributions of the predictive skills for the five forecasting models over all the experimental lead times. The developed hybrid forecasting model exhibited a higher PCC, lower ubRMSE and lower RMSE compared to the other models, in terms of the data median and percentiles. Substantial improvements were seen in the hybrid model versus the baseline models as the PCC distributions were lifted and many data samples with low correlation were improved. For example, numerous data samples with a PCC value less than 0.6 in the DL model were lifted to those above 0.6 in the hybrid model over the YRB region. Another example is that the data points with an ubRMSE value above 0.04 m3/m3 in the DL model were converted to those below 0.04 m3/m3 over the EU region. Therefore, the hybrid forecasting model could alleviate the prediction errors in the data-driven model to some degree. As for the bias metric, the data distributions of the hybrid model are likely a compromise between the bias distributions from DL and S2S. The bias distributions of the hybrid model were expected because the bias distributions from DL and S2S deviated far from zero relative to the SVR and RF models. Therefore, the bias of the hybrid model could be further refined by reducing the bias of the DL and S2S models.
The hybrid forecasting model demonstrated great potential in RZSM forecasting relative to the SVR, RF, DL and S2S models, based on the correlation-based and error-based indices. The superiority of the hybrid model lies in the coupling of data-driven and model-based RZSM predictions. First, the data-driven RZSM predictions demonstrated a rapid decline of the predictive skills, in terms of the declining rate of PCC values by lead time (Figure 4), while the PCC for the S2S model decreased more slowly compared to the data-driven approaches. Therefore, the model-based predictions from S2S provided strong complementary information for the data-driven model in the fusion process at long-lead predictions. Second, the model-based predictions failed to compete with the data-driven predictions at very short lead times (e.g., 1–2 days) because of the large uncertainties in the initial conditions [40,42], while the data-driven predictions had advantages at this lead time due to the direct predictive modeling from observations and the high RZSM persistence for the first several forecasting days [36,37]. During the integration process, the strong soil moisture memory and the S2S predictions were paid different attention by the weights’ allocation in short-lead RZSM predictions when training the hybrid model. Therefore, the hybrid model could be comparable to the data-driven methods in short-lead RZSM predictions by leveraging the inputs from observations and S2S predictions. Finally, the model-based predictions from S2S provided new predictability sources besides the soil moisture memory, and the systematic prediction errors could be mitigated in the training process [42]. The advantages from data-driven predictions and model-based predictions could both be incorporated into the hybrid forecasting model, which could account for the appealing performance after integration.
Figure 6 demonstrates the overall predictive skill of SSM (0–5 cm) over the EU area. The hybrid DL-S2S model demonstrated a higher PCC, lower ubRMSE and lower RMSE relative to the SVR, RF, DL and S2S models for nearly all the lead times, suggesting the effectiveness of the developed hybrid forecasting model for SSM. The average bias statistic did not move away from zero and did not expand the bias relative to the single models. Therefore, the developed hybrid forecasting model is suitable for both SSM and RZSM predictions at sub-seasonal scales. We also used the SMAP level 4 RZSM data to test the effectiveness of the proposed hybrid forecasting model (Figure 7) over the YRB area, and the results indicated the superiority of the hybrid DL-S2S model relative to the SVR, RF, DL and S2S models, which further highlights the benefits of hybrid modeling.

4.2. Spatiotemporal Patterns of Predictive Performance

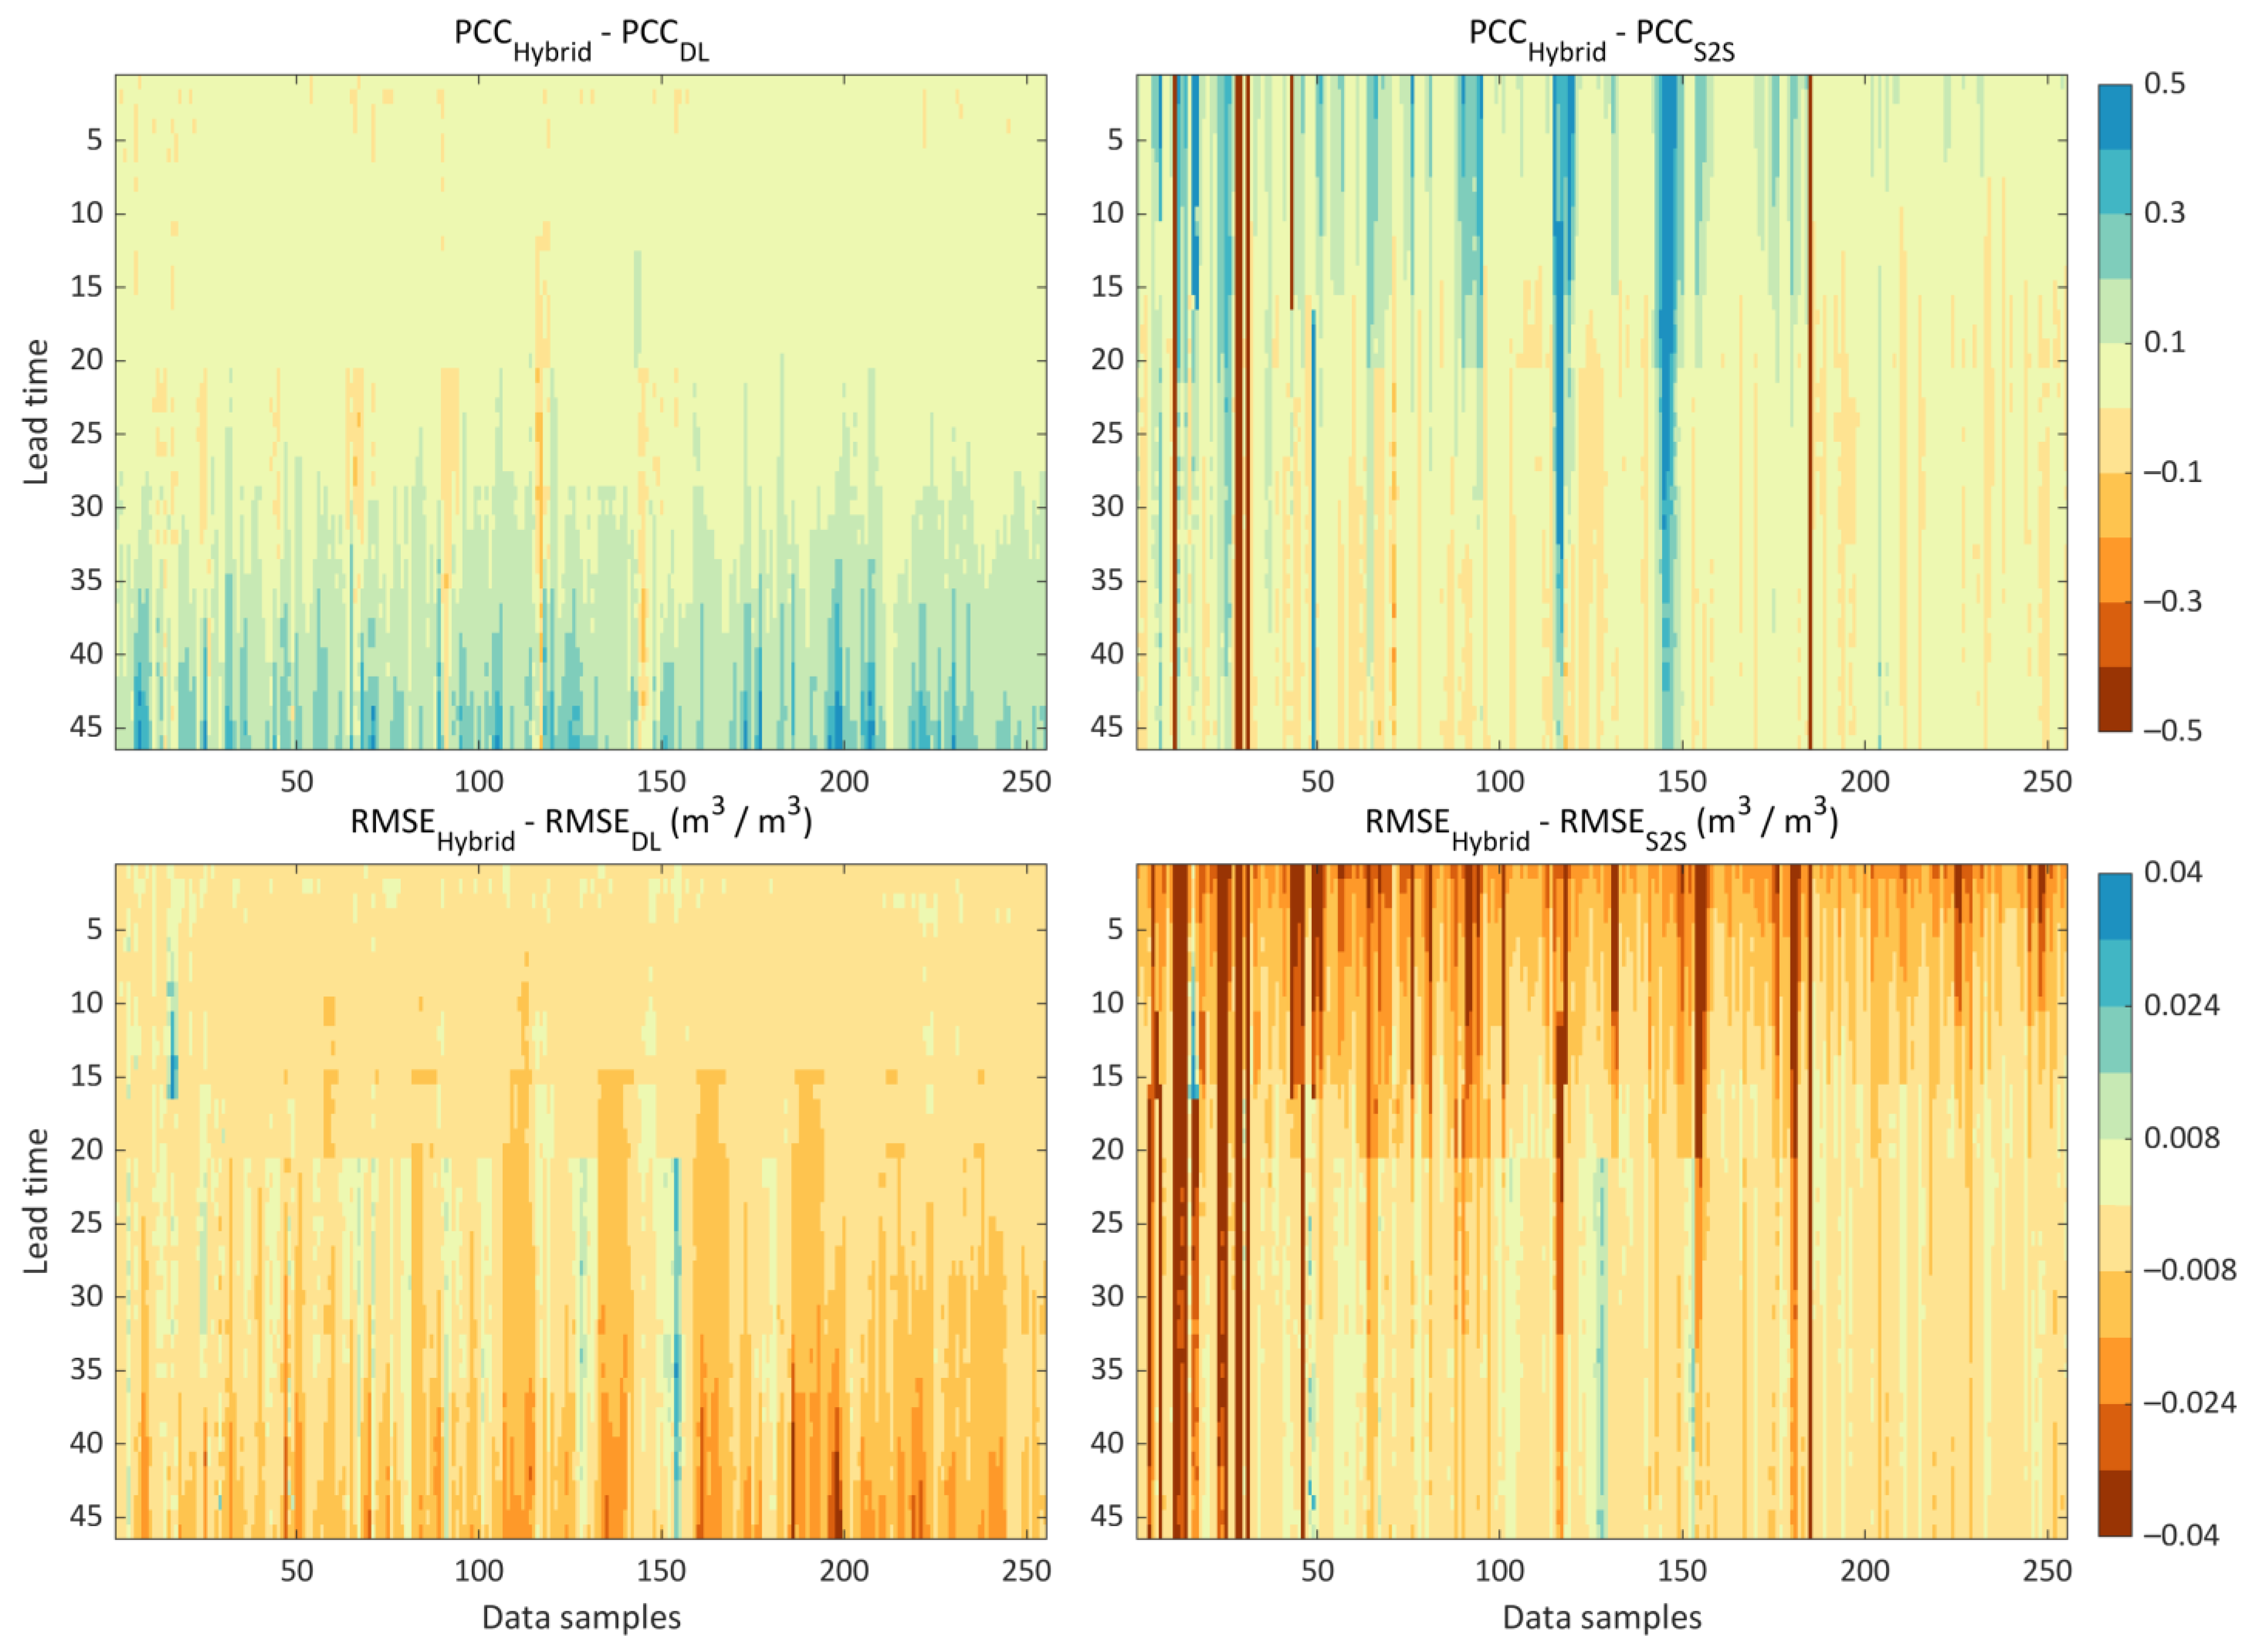
Figure 8 and Figure 9 demonstrate the different results of predictive skills between the hybrid model and the individual predictions from DL or S2S over each involved grid in the YRB and EU regions, respectively. The hybrid model improved the PCC values up to 0.5 relative to the DL model over many data points in the YRB region (Figure 8), especially at longer lead times. On the contrary, the hybrid model improved the PCC at shorter lead times relative to the S2S model over some samples of the YRB area. The RMSE demonstrated similar point patterns with the PCC, as the improvements were more evident at longer lead times for the hybrid model than the DL method and at shorter lead times than the S2S model (Figure 8). As for the EU region, similar improvements were also highlighted for the hybrid model over the individual predictions. Therefore, it is evident that the hybrid model suggests substantial skill improvements at sub-seasonal RZSM predictions, over both the YRB and the EU areas.
In fact, we also noticed that some data samples demonstrated a slight decline of predictive skills for the hybrid model in terms of the differences in the PCC and RMSE. The slight decline of the predictive skills could be related to the side effects when integrating the data-driven and model-based predictions [73,74,75], as the uncertainties from one model may be brought into the hybrid model and may not be eliminated during the training process. Although the uncertainties inside the models could be partly mitigated by optimizing the weights’ distribution during training, the uncertainties could not be fully removed and the advantages of incorporating new models may be overwhelmed by the uncertainties inside the new models. For example, the large prediction errors from the S2S model at shorter lead times may offset or even surpass its positive contribution to the hybrid forecasting model. Therefore, it is not surprising that some data points may demonstrate a tiny decline of predictive skills in the hybrid model.
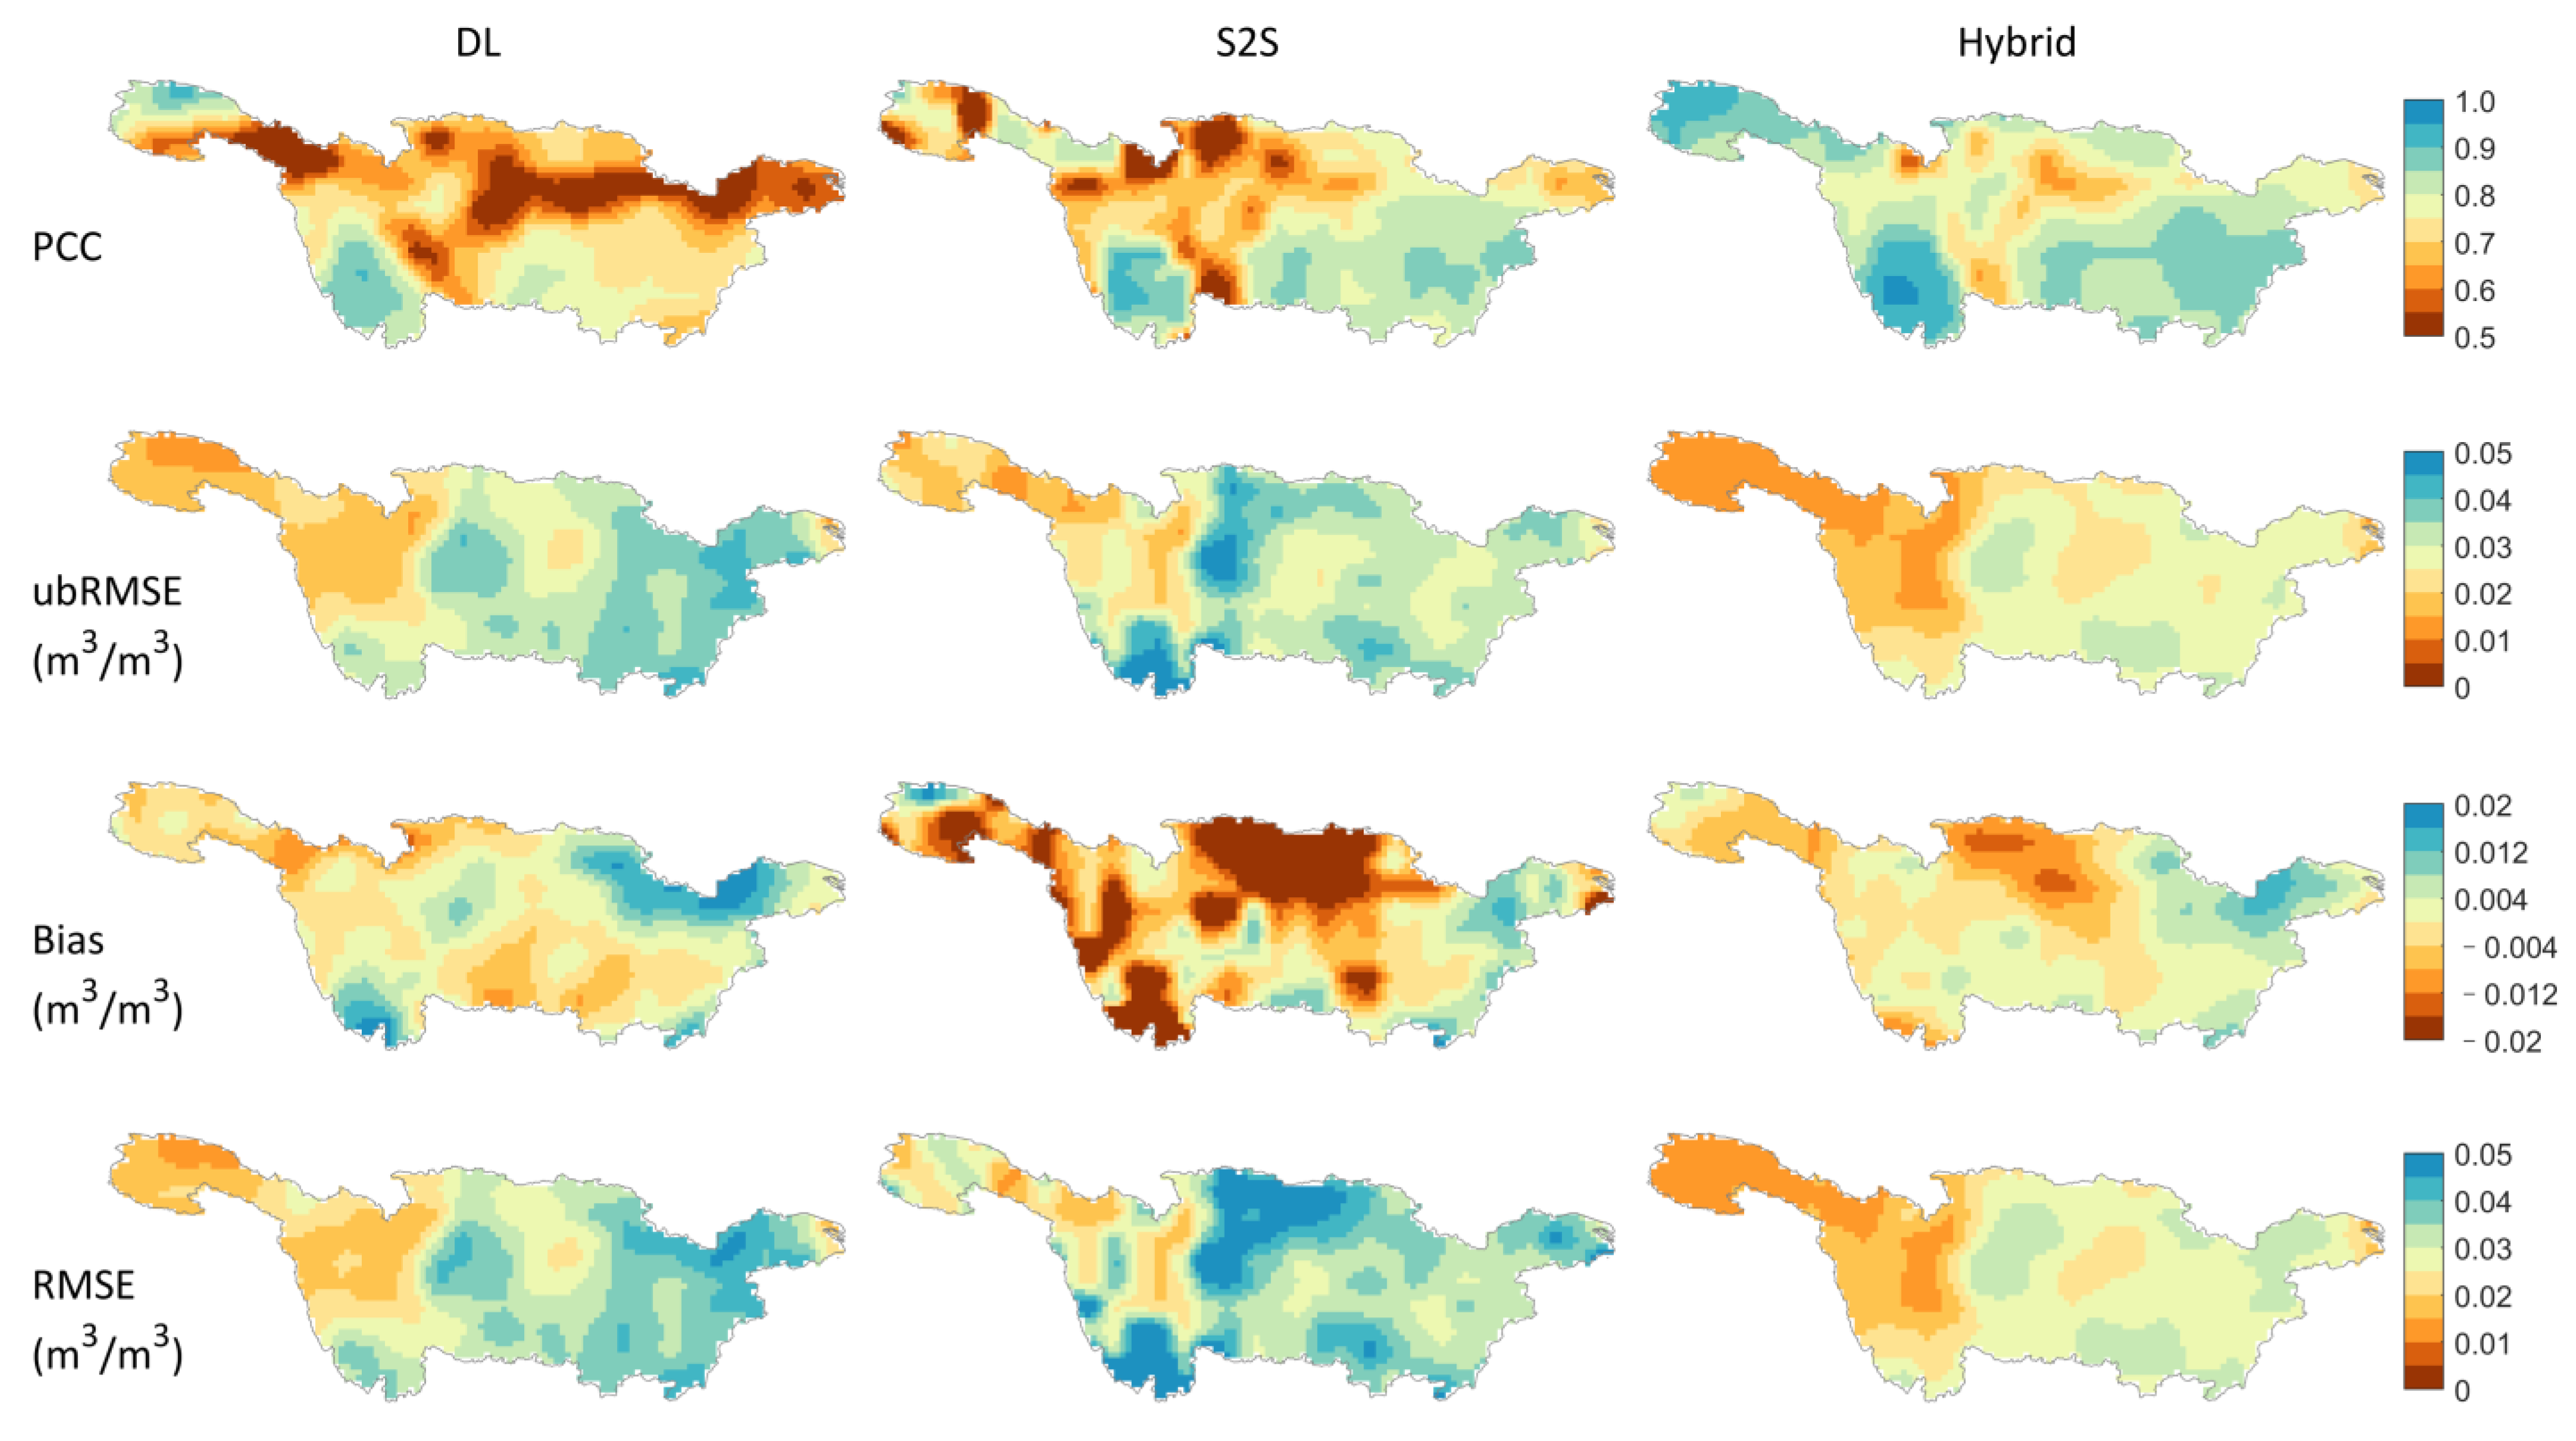
The spatial patterns of the averaged predictive skills of RZSM over the YRB and EU regions are shown in Figure 10 and Figure 11, respectively. In the YRB region, the DL model demonstrated relatively limited predictive skills over the northern and eastern areas, in terms of the PCC, ubRMSE and RMSE metrics (Figure 10), while the hybrid model improved the skills over those areas. The highly negative biases over the northern and western YRB in the S2S model were largely mitigated in the hybrid model. In the EU area, similar improvements could be seen in the hybrid model compared to the DL and S2S models (Figure 11). For example, the low PCC values over southwestern parts of the EU for the DL and S2S models exhibited an obvious increase in the hybrid model, and the RMSE values over the western and central EU were largely reduced in the hybrid model. Therefore, steady improvements were expected by integrating the DL and S2S models spatially based on the PCC, ubRMSE and RMSE measurements.
The results of S2S models demonstrated low predictive skills over the high elevation regions of the EU area, which is possibly related to the considerable discrepancies between the ERA5 RZSM data and the S2S predictions. The ERA5 RZSM data had a relatively low accuracy in the mountainous areas of southwestern Europe based on a previous study [18]. Besides, the ECMWF S2S model used the ERA interim soil reanalysis data as the initial conditions and the HTESSEL model as the land surface scheme, which is different from the strategy used in the production of ERA5 data. Therefore, the relatively low data quality in ERA5 RZSM and the different data generation process between ERA5 and ECMWF S2S both contributed to the low predictive skill in the high-elevation areas.
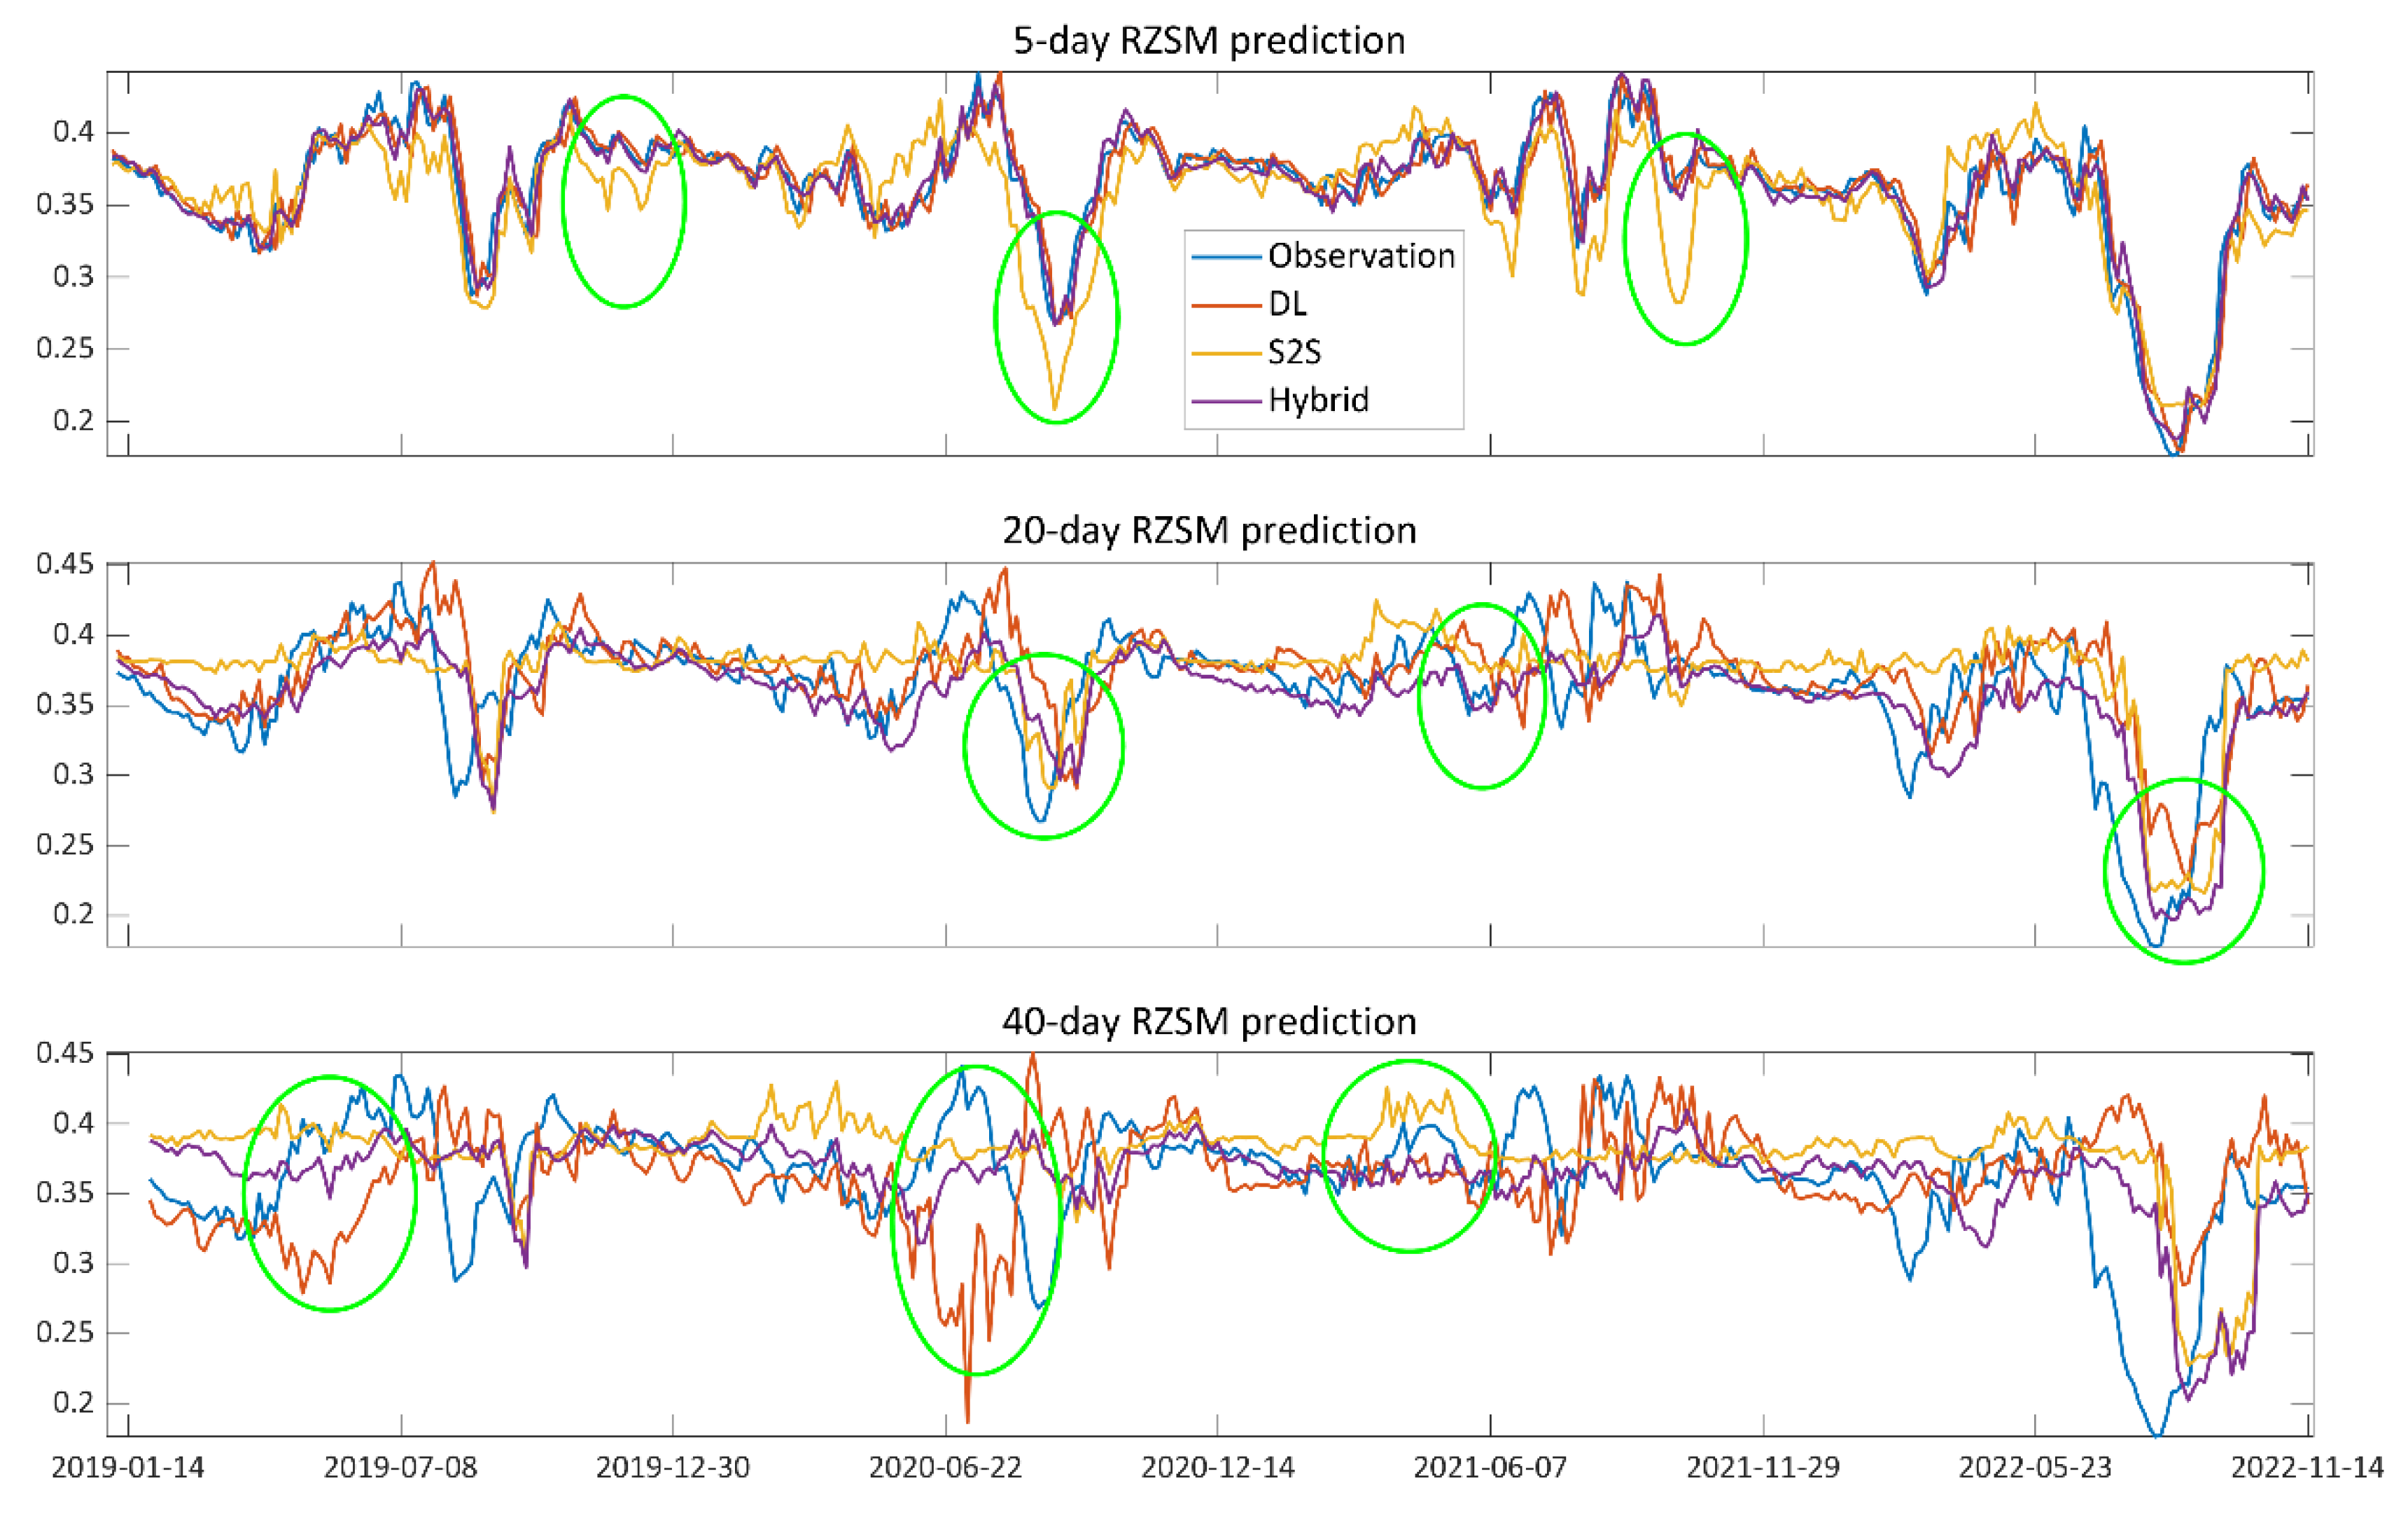
Figure 12 presents the temporal patterns of RZSM forecasting by the DL, S2S and hybrid models over a randomly picked point (106.5°E, 30.5°N) in the YRB area. In the five-day RZSM prediction, the S2S model may have large prediction errors over some days when compared with observations, as shown in the prediction times covered by green ellipses (Figure 12), while the hybrid model could produce reasonable predictions as well as data-driven predictions. In the 20-day RZSM prediction, the hybrid model could compromise between the DL and the S2S models and may generate even better results than the individual predictions over some time steps. In the 40-day RZSM prediction, the large prediction errors in the DL model at some time steps could be partly mitigated in the hybrid model by incorporating the predictive information from the S2S model. Therefore, the hybrid forecasting model could improve the RZSM forecasting relative to solely the DL or S2S predictions, temporally. However, the hybrid forecasting model may fail to produce favorable predictions when data-driven and model-based predictions both show unsatisfactory forecasts at specific time steps.

4.3. The Skill over Different Land Cover Types

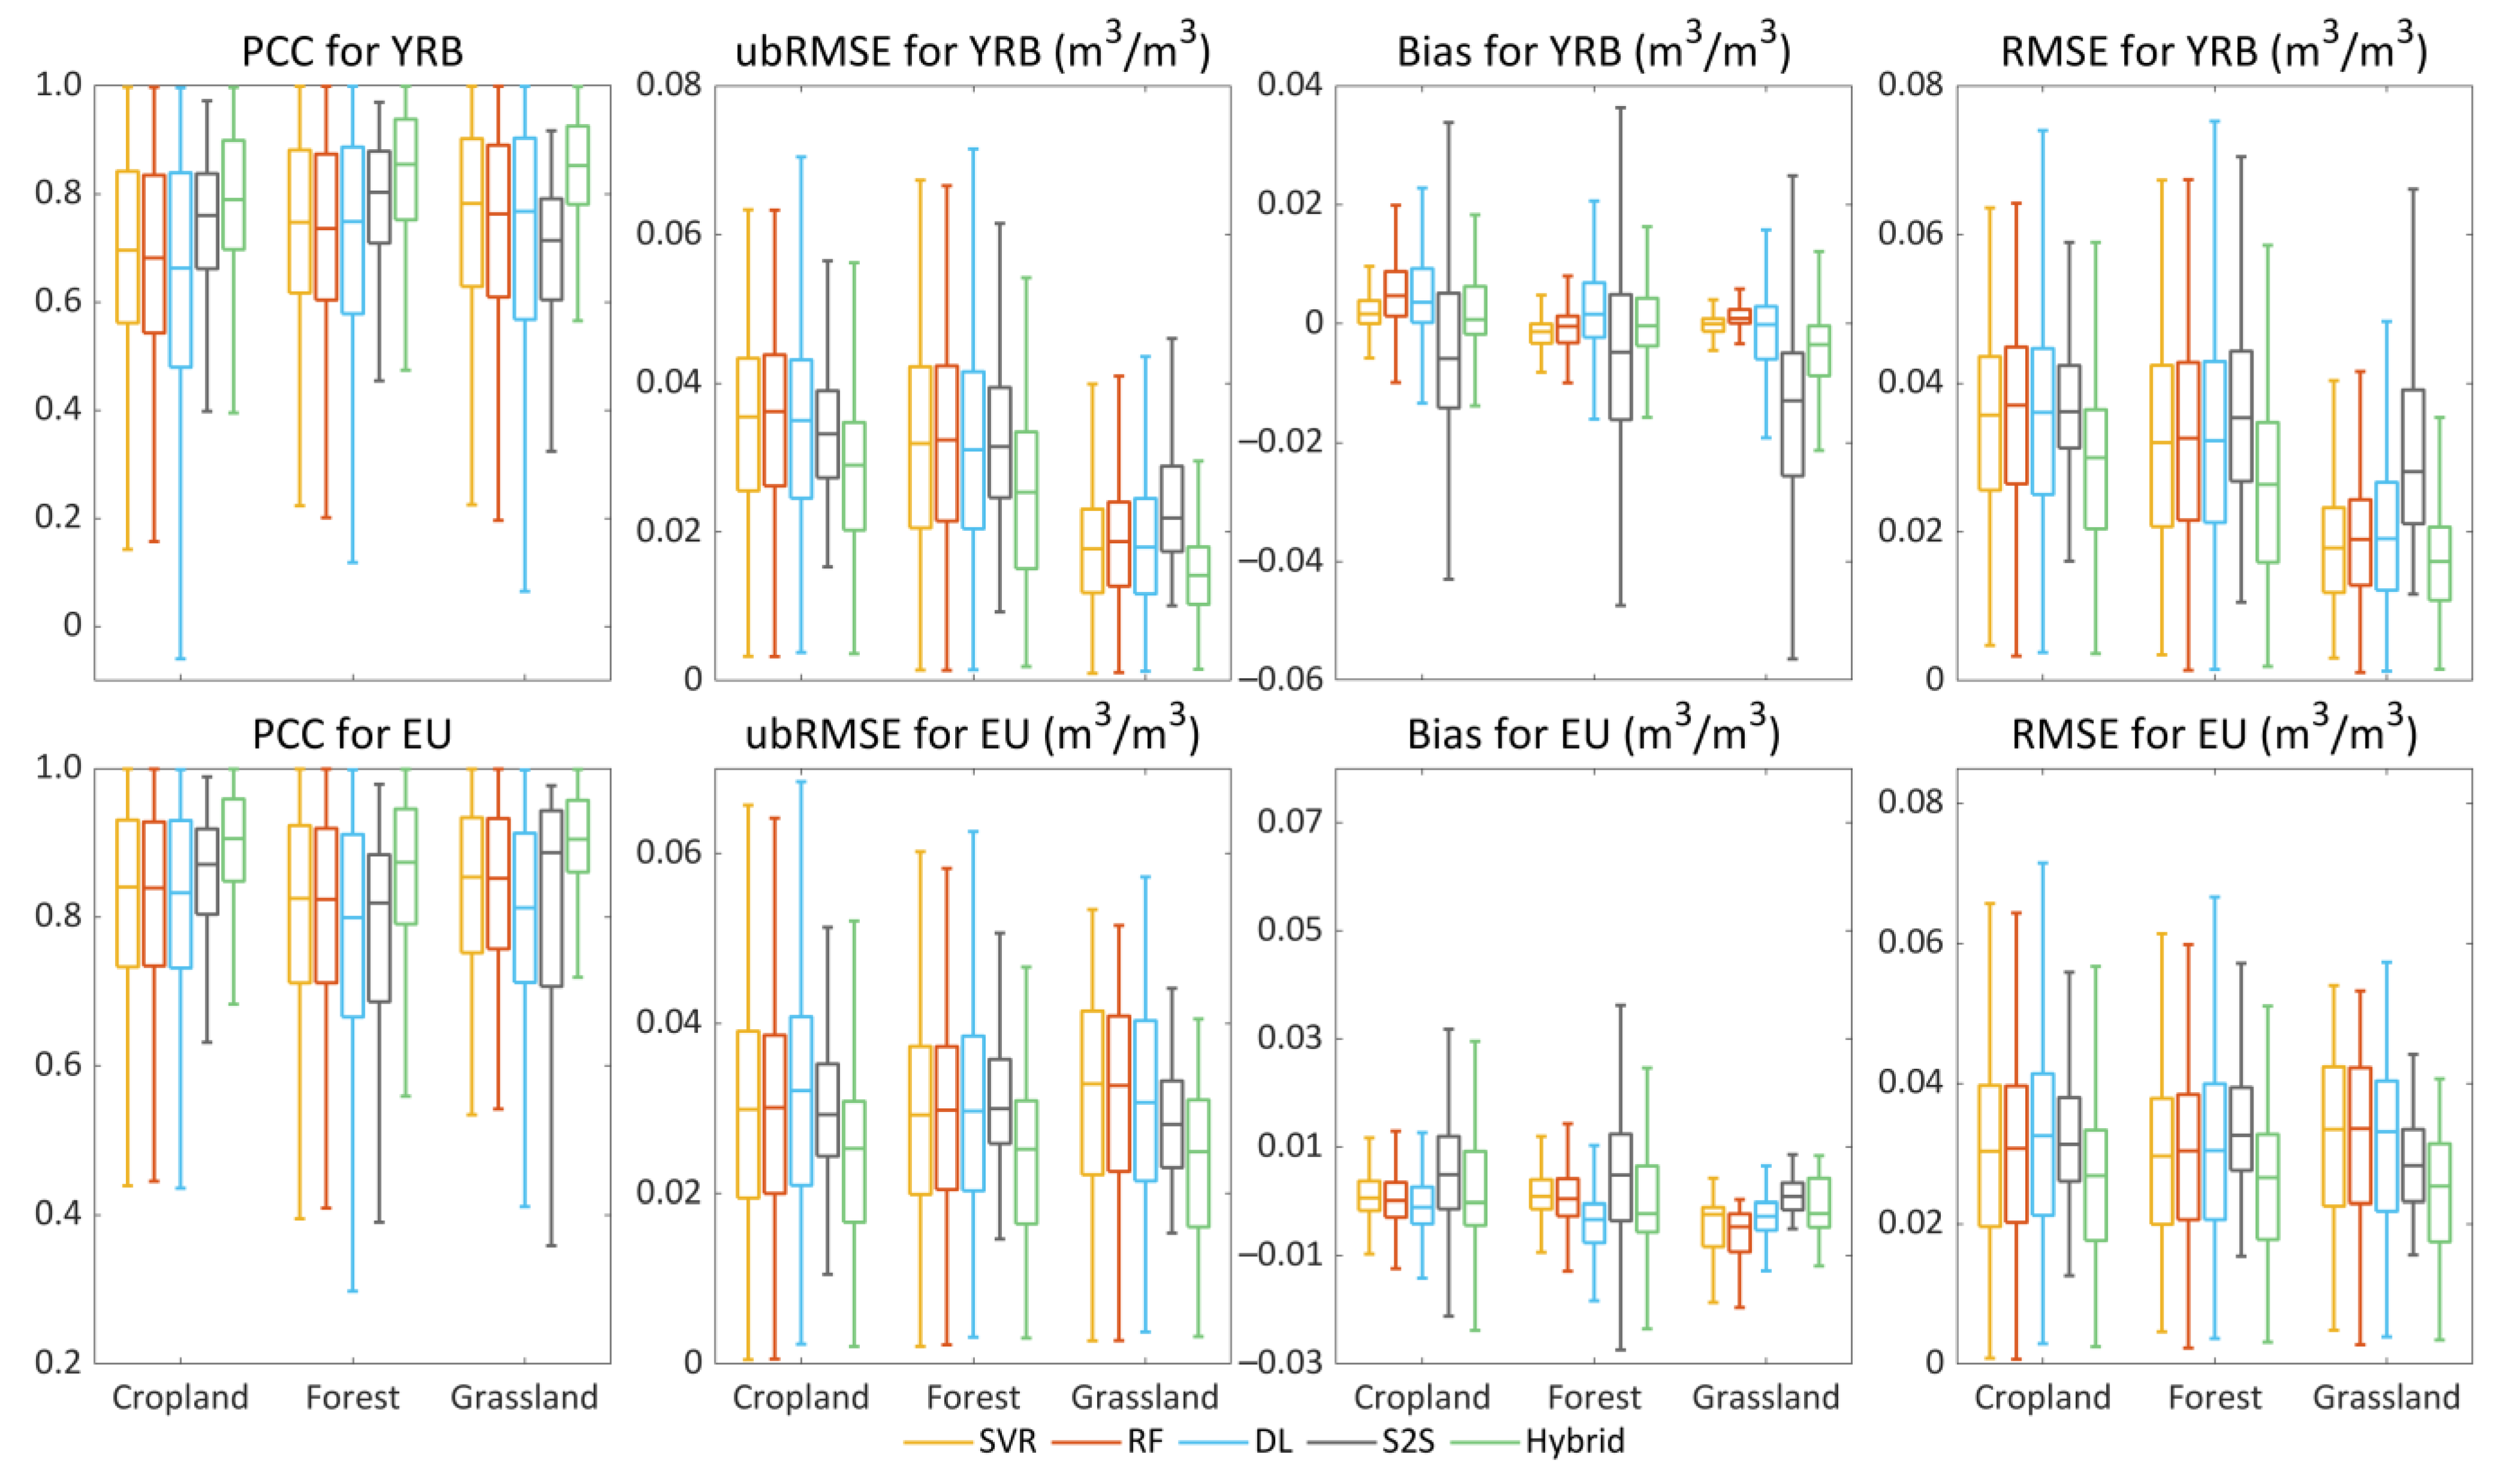
Figure 13 demonstrates the skill distributions of RZSM forecasting over different land cover types for different prediction models. The PCC, ubRMSE and RMSE statistics demonstrated substantial improvements for the hybrid model relative to the SVR, RF, DL and S2S models over cropland, forest and grassland types. For example, the PCC values in data-driven predictions could be as low as 0.2 over the grassland type in the YRB region, while the lower bound of the PCC distributions was close to 0.6 for the hybrid model. The median values of the PCC, ubRMSE and RMSE metrics all exhibited evident refinements for the hybrid model compared to the other models. The bias statistic also demonstrated some improvements over the three land cover types relative to the S2S model, as the large biases for some percentiles were substantially alleviated. The obvious improvements for the hybrid forecasting model over the involved data-driven and model-based predictions highlight the effectiveness of data-model-fused forecasting.

4.4. In Situ Validation

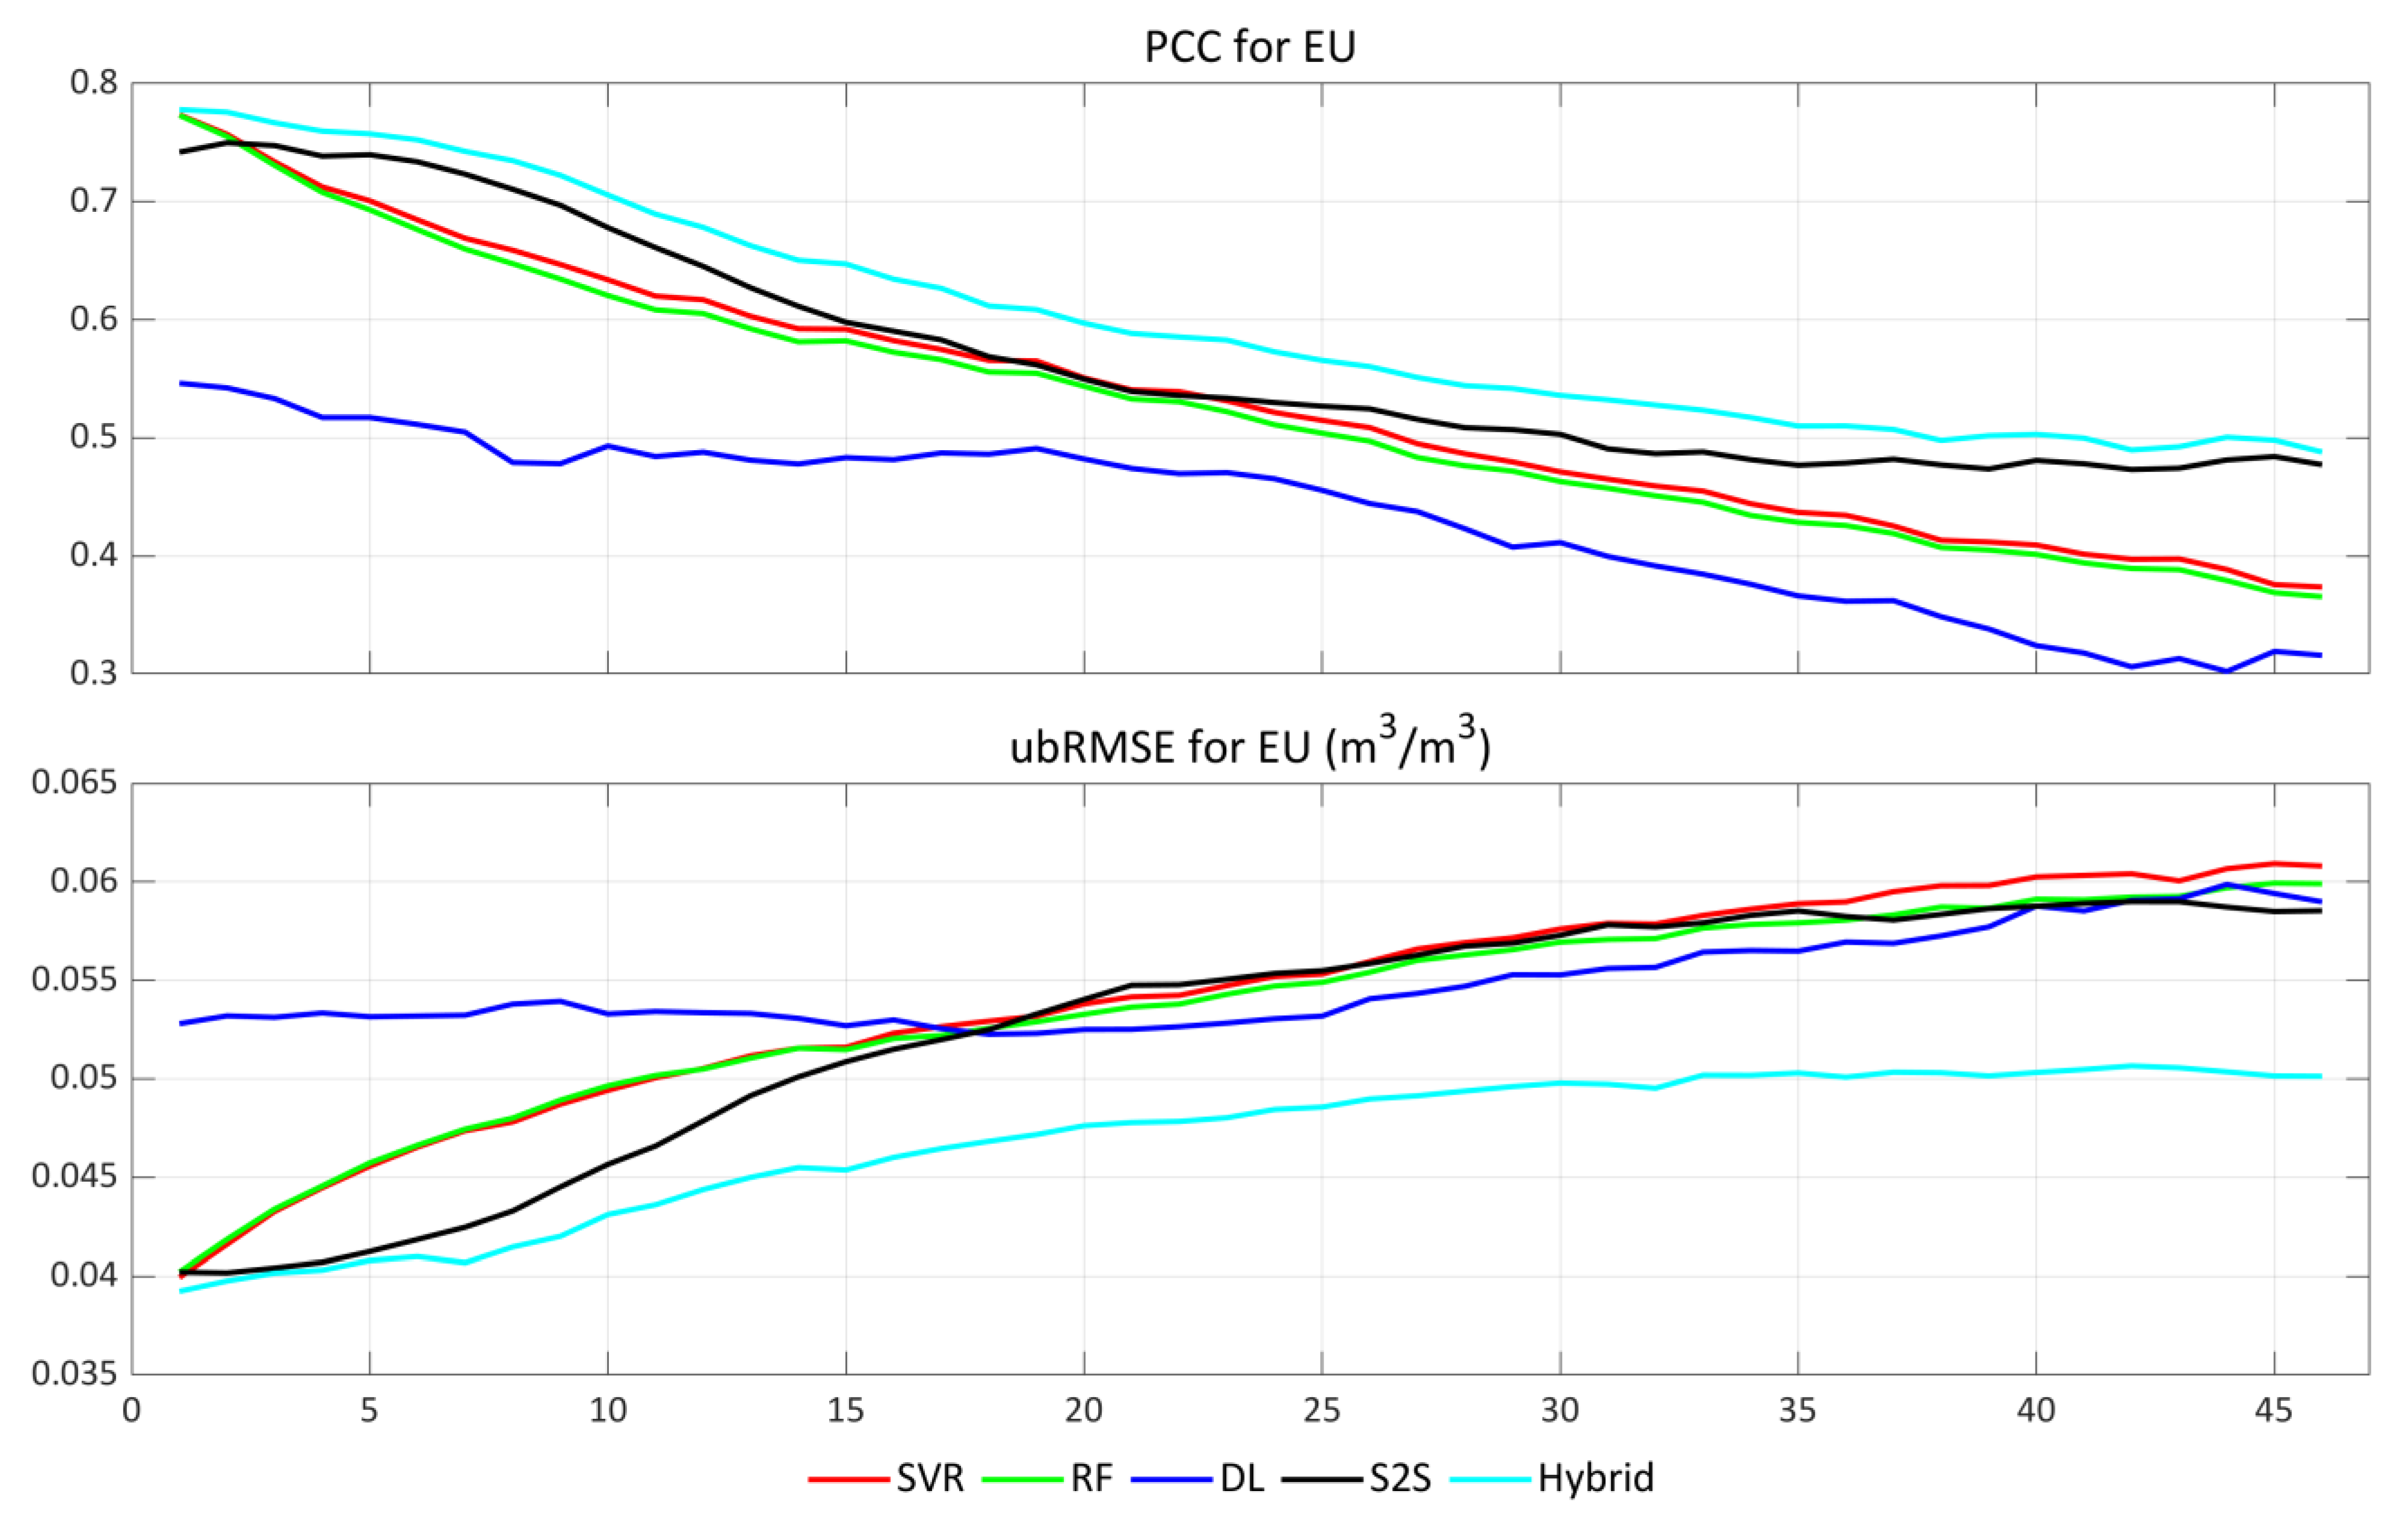
Although the ERA5-based soil moisture could be used to evaluate the predictive skills, it would be more convincing to validate the skills using in situ stations. The in situ stations were collected from ISMN [60] websites over the EU and the western United States (US) to assess the predictive skill. A total of 85 SSM stations are used over the EU area and 110 RZSM stations are used over the US area. Figure 14 and Figure 15 demonstrate the in situ validation skills for SSM predictions over the EU and RZSM predictions over the US, respectively, in terms of the PCC and ubRMSE metrics. The hybrid DL-S2S model exhibited improved soil moisture prediction skills over the EU and the US for nearly all the lead times over the SVR, RF, DL and S2S models, suggesting the superiority of the hybrid modeling relative to the single-model predictions.

4.5. Strengths and Limitations of the Hybrid Model

Compared with existing studies [29,31,33,34,38,39], this study innovatively integrated the data-driven deep learning method and the model-based predictions from S2S to construct the hybrid forecasting model. The physically generated predictions were assumed as a priori knowledge to provide a new predictability source besides the soil moisture memory. The hybrid forecasting model was tested over two different study areas with different climate regimes, and the added values were demonstrated in terms of several metrics. The advantages of the data-driven modeling and the advantages of model-based predictions were integrated within a DL framework to improve the sub-seasonal SSM and RZSM forecasting. The hybrid model is appealing both in short-term soil moisture forecasting by the use of accurate soil moisture memory from data-driven inputs, and in relatively long-term soil moisture forecasting by the use of forward simulations from a physical model. The shortages of the predictive ability from one model over specific timescales are partly complemented by another during the hybrid process [28,40,42]. Therefore, the two predictability sources could produce much more promising predictions relative to single models.
The appealing features of integrated statistical–physical predictions have been highlighted in existing studies in drought forecasting, streamflow prediction and precipitation nowcasting [41,42,76]. The hybrid statistical and physical predictions have advantages in reducing physical biases, combining different predictability sources, increasing the explainability and alleviating the computational burdens [40,42]. As most of the existing studies adopted one kind of model (statistical or physical) to predict RZSM, the feasibility and ability of the hybrid model for RZSM forecasting remain to be settled. Some studies also utilized statistical methods to postprocess the physical predictions to improve soil moisture predictions by aligning the probability distributions [47,48]. However, the prediction errors arising from uncertain initial conditions and uncertain parameters could not be well-eliminated by bias correction. Therefore, here, we combined the advanced climate model and the DL model to construct a hybrid forecasting model and justify the effectivity of hybrid forecasting in RZSM via two independent experiments. The experimental results demonstrated the appealing features of hybrid forecasting in resolving prediction errors from model outputs and alleviating the skill attenuation from statistical approaches.
The prediction experiments were conducted over 1° × 1° grids, which are relatively coarse due to the limitations of data resolution from the S2S model. In fact, the native-resolution (16–32 km) data (not available) from the ECMWF S2S model are upscaled to 1.5° × 1.5° for public availability. Therefore, high-resolution predictions could be easily produced when high-resolution model-based predictions are available. In addition, the grid-based soil moisture data are often validated by in situ stations such as the ISMN [60]. It should also be noted that substantial representation error exists when validating the 1° × 1° gridded RZSM using sparse stations [18,77], which could lead to unexpected and misleading results considering the strong spatial heterogeneity of SSM and RZSM. However, the large-scale in situ-measured observations could reflect the temporal soil moisture variations to some degree [18,23], and the validations suggest the superiority of the developed model. For future work, a global validation using in situ data should be carried out to enrich the results.

5. Conclusions

Accurate SSM and RZSM forecasting up to months in advance would benefit agricultural planning and water management. Currently, the numerical weather model-based forecasting of soil moisture suffers from large uncertainties in the initial conditions and parameterization schemes, leading to strong prediction biases and errors, while the data-driven machine learning methods may fail to capture the long-term temporal dependences without knowledge of the physical process of soil water movement. Therefore, here, we proposed a hybrid forecasting model by incorporating the model-based forecasting from S2S into a data-driven deep learning model to improve sub-seasonal SSM and RZSM predictions. The hybrid model was tested over the YRB and the EU areas, and the results suggest substantial skill improvements of the hybrid model relative to the individual data-driven or model-based baseline predictions. Therefore, the data-driven and model-based soil moisture predictions could be well-integrated within a hybrid framework to complement each other at sub-seasonal scales.
The predictive ability of the hybrid model could be further evaluated over other land areas and land cover types to assess the spatial skills worldwide. In addition, the spatial downscaling techniques could be used to refine the resolution of model-based predictions in order to generate high-resolution SSM and RZSM predictions in the hybrid model. The gridded predictions by the hybrid model could be validated by densely and evenly distributed in situ stations with high-quality observations to further justify the effectiveness. Moreover, it would be promising to establish an open hybrid global SSM and RZSM forecasting platform for public availability and verification of the near-term predictions, which could greatly facilitate the development of forecasting methods and spatial accuracy assessment for agricultural, remote sensing and hydrological sciences.

Author Contributions

Conceptualization, L.X.; methodology, L.X.; formal analysis, L.X.; writing—original draft preparation, L.X.; writing—review and editing, L.X., H.Y., Z.C., W.D., N.C. and M.H.; supervision, L.X.; funding acquisition, L.X. and H.Y. All authors have read and agreed to the published version of the manuscript.

Funding

This research was supported by the National Key Research and Development Program for Young Scientists (2021YFF0704400), the National Natural Science Foundation of China (42201509, 42101429 and 42201438), the fellowship of the China Postdoctoral Science Foundation (2022M722930) and the Fundamental Research Funds for the Central Universities, China University of Geosciences (Wuhan) (162301212687, 2642022009).

Data Availability Statement

The data used here are publicly available and can be obtained via the websites: https://cds.climate.copernicus.eu/cdsapp#!/dataset/reanalysis-era5-single-levels?tab=overview (accessed on 6 December 2022) for ERA5, https://apps.ecmwf.int/datasets/data/s2s/levtype=sfc/type=cf (accessed on 6 December 2022) for S2S and https://cds.climate.copernicus.eu/cdsapp#!/dataset/satellite-land-cover?tab=overview (accessed on 6 December 2022) for C3S land cover data. The code is available upon request from the authors.

Conflicts of Interest

The authors declare no conflict of interest.

References

  1. Dirmeyer, P.A.; Cash, B.A.; Kinter, J.L., III; Stan, C.; Jung, T.; Marx, L.; Towers, P.; Wedi, N.; Adams, J.M.; Altshuler, E.L. Evidence for enhanced land–atmosphere feedback in a warming climate. J. Hydrometeorol. 2012, 13, 981–995. [Google Scholar] [CrossRef] [Green Version]
  2. Schumacher, D.L.; Keune, J.; Dirmeyer, P.; Miralles, D.G. Drought self-propagation in drylands due to land–atmosphere feedbacks. Nat. Geosci. 2022, 15, 262–268. [Google Scholar] [CrossRef] [PubMed]
  3. Zhou, S.; Williams, A.P.; Berg, A.M.; Cook, B.I.; Zhang, Y.; Hagemann, S.; Lorenz, R.; Seneviratne, S.I.; Gentine, P. Land–atmosphere feedbacks exacerbate concurrent soil drought and atmospheric aridity. Proc. Natl. Acad. Sci. USA 2019, 116, 18848–18853. [Google Scholar] [CrossRef] [PubMed] [Green Version]
  4. Koster, R.D.; Dirmeyer, P.A.; Guo, Z.; Bonan, G.; Chan, E.; Cox, P.; Gordon, C.; Kanae, S.; Kowalczyk, E.; Lawrence, D. Regions of strong coupling between soil moisture and precipitation. Science 2004, 305, 1138–1140. [Google Scholar] [CrossRef] [PubMed] [Green Version]
  5. Santanello, J.A., Jr.; Dirmeyer, P.A.; Ferguson, C.R.; Findell, K.L.; Tawfik, A.B.; Berg, A.; Ek, M.; Gentine, P.; Guillod, B.P.; Van Heerwaarden, C. Land–atmosphere interactions: The LoCo perspective. Bull. Am. Meteorol. Soc. 2018, 99, 1253–1272. [Google Scholar] [CrossRef]
  6. Seo, E.; Lee, M.-I.; Jeong, J.-H.; Koster, R.D.; Schubert, S.D.; Kim, H.-M.; Kim, D.; Kang, H.-S.; Kim, H.-K.; MacLachlan, C. Impact of soil moisture initialization on boreal summer subseasonal forecasts: Mid-latitude surface air temperature and heat wave events. Clim. Dynam. 2019, 52, 1695–1709. [Google Scholar] [CrossRef]
  7. Togneri, R.; dos Santos, D.F.; Camponogara, G.; Nagano, H.; Custódio, G.; Prati, R.; Fernandes, S.; Kamienski, C. Soil moisture forecast for smart irrigation: The primetime for machine learning. Expert Syst. Appl. 2022, 207, 117653. [Google Scholar] [CrossRef]
  8. Dubois, A.; Teytaud, F.; Verel, S. Short term soil moisture forecasts for potato crop farming: A machine learning approach. Comput. Electron. Agric. 2021, 180, 105902. [Google Scholar] [CrossRef]
  9. Esit, M.; Kumar, S.; Pandey, A.; Lawrence, D.M.; Rangwala, I.; Yeager, S. Seasonal to multi-year soil moisture drought forecasting. Npj Clim. Atmos. Sci. 2021, 4, 16. [Google Scholar] [CrossRef]
  10. Tian, S.; Van Dijk, A.I.; Tregoning, P.; Renzullo, L.J. Forecasting dryland vegetation condition months in advance through satellite data assimilation. Nat. Commun. 2019, 10, 469. [Google Scholar] [CrossRef] [Green Version]
  11. Dirmeyer, P.A.; Halder, S.; Bombardi, R. On the harvest of predictability from land states in a global forecast model. J. Geophys. Res. Atmos. 2018, 123, 13111–13127. [Google Scholar] [CrossRef]
  12. Ma, R.; Yuan, X. Sub-seasonal ensemble prediction of flash droughts over China. J. Hydrometeorol. 2023, 24, 897–910. [Google Scholar] [CrossRef]
  13. Entekhabi, D.; Njoku, E.G.; O’Neill, P.E.; Kellogg, K.H.; Crow, W.T.; Edelstein, W.N.; Entin, J.K.; Goodman, S.D.; Jackson, T.J.; Johnson, J. The soil moisture active passive (SMAP) mission. Proc. IEEE 2010, 98, 704–716. [Google Scholar] [CrossRef]
  14. Kerr, Y.H.; Waldteufel, P.; Wigneron, J.-P.; Delwart, S.; Cabot, F.; Boutin, J.; Escorihuela, M.-J.; Font, J.; Reul, N.; Gruhier, C. The SMOS mission: New tool for monitoring key elements ofthe global water cycle. Proc. IEEE 2010, 98, 666–687. [Google Scholar] [CrossRef]
  15. Chen, K.; English, S.; Bormann, N.; Zhu, J. Assessment of FY-3A and FY-3B MWHS observations. Weather Forecast. 2015, 30, 1280–1290. [Google Scholar] [CrossRef]
  16. Imaoka, K.; Maeda, T.; Kachi, M.; Kasahara, M.; Ito, N.; Nakagawa, K. Status of AMSR2 instrument on GCOM-W1. In Proceedings of the Earth Observing Missions and Sensors: Development, Implementation, and Characterization II, Kyoto, Japan, 9 November 2012; pp. 201–206. [Google Scholar]
  17. Dorigo, W.; Wagner, W.; Albergel, C.; Albrecht, F.; Balsamo, G.; Brocca, L.; Chung, D.; Ertl, M.; Forkel, M.; Gruber, A. ESA CCI Soil Moisture for improved Earth system understanding: State-of-the art and future directions. Remote Sens. Environ. 2017, 203, 185–215. [Google Scholar] [CrossRef]
  18. Xu, L.; Chen, N.; Zhang, X.; Moradkhani, H.; Zhang, C.; Hu, C. In-situ and triple-collocation based evaluations of eight global root zone soil moisture products. Remote Sens. Environ. 2021, 254, 112248. [Google Scholar] [CrossRef]
  19. Sabater, J.M.; Jarlan, L.; Calvet, J.-C.; Bouyssel, F.; De Rosnay, P. From near-surface to root-zone soil moisture using different assimilation techniques. J. Hydrometeorol. 2007, 8, 194–206. [Google Scholar] [CrossRef]
  20. Hersbach, H.; Bell, B.; Berrisford, P.; Hirahara, S.; Horányi, A.; Muñoz-Sabater, J.; Nicolas, J.; Peubey, C.; Radu, R.; Schepers, D. The ERA5 global reanalysis. Q. J. R. Meteor. Soc. 2020, 146, 1999–2049. [Google Scholar] [CrossRef]
  21. Gelaro, R.; McCarty, W.; Suárez, M.J.; Todling, R.; Molod, A.; Takacs, L.; Randles, C.A.; Darmenov, A.; Bosilovich, M.G.; Reichle, R. The modern-era retrospective analysis for research and applications, version 2 (MERRA-2). J. Clim. 2017, 30, 5419–5454. [Google Scholar] [CrossRef]
  22. Rodell, M.; Houser, P.; Jambor, U.; Gottschalck, J.; Mitchell, K.; Meng, C.-J.; Arsenault, K.; Cosgrove, B.; Radakovich, J.; Bosilovich, M. The global land data assimilation system. Bull. Am. Meteorol. Soc. 2004, 85, 381–394. [Google Scholar] [CrossRef] [Green Version]
  23. Yang, S.; Zeng, J.; Fan, W.; Cui, Y. Evaluating Root-zone Soil Moisture Products from GLEAM, GLDAS, and ERA5 based on in Situ ObServations and Triple Collocation Method Over the Tibetan Plateau. J. Hydrometeorol. 2022, 23, 1861–1878. [Google Scholar] [CrossRef]
  24. Li, H.; Ye, A.; Zhang, Y.; Zhao, W. InterComparison and Evaluation of MultiSource Soil Moisture Products in China. Earth Space Sci. 2021, 8, e2021EA001845. [Google Scholar] [CrossRef]
  25. Shangguan, W.; Zhang, R.; Li, L.; Zhang, S.; Zhang, Y.; Huang, F.; Li, J.; Liu, W. Assessment of Agricultural Drought Based on Reanalysis Soil Moisture in Southern China. Land 2022, 11, 502. [Google Scholar] [CrossRef]
  26. Fan, L.; Xing, Z.; Lannoy, G.D.; Frappart, F.; Peng, J.; Zeng, J.; Li, X.; Yang, K.; Zhao, T.; Shi, J.; et al. Evaluation of satellite and reanalysis estimates of surface and root-zone soil moisture in croplands of Jiangsu Province, China. Remote Sens. Environ. 2022, 282, 113283. [Google Scholar] [CrossRef]
  27. Xu, L.; Abbaszadeh, P.; Moradkhani, H.; Chen, N.; Zhang, X. Continental drought monitoring using satellite soil moisture, data assimilation and an integrated drought index. Remote Sens. Environ. 2020, 250, 112028. [Google Scholar] [CrossRef]
  28. Xu, L.; Chen, N.; Chen, Z.; Zhang, C.; Yu, H. Spatiotemporal forecasting in earth system science: Methods, uncertainties, predictability and future directions. Earth-Sci. Rev. 2021, 222, 103828. [Google Scholar] [CrossRef]
  29. Singh, G.; Sharma, D.; Goap, A.; Sehgal, S.; Shukla, A.; Kumar, S. Machine Learning based soil moisture prediction for Internet of Things based Smart Irrigation System. In Proceedings of the 2019 5th International Conference on Signal Processing, Computing and Control (ISPCC), Solan, India, 10–12 October 2019; pp. 175–180. [Google Scholar]
  30. Becker, E.J.; Kirtman, B.P.; L’Heureux, M.; Muñoz, Á.G.; Pegion, K. A Decade of the North American Multimodel Ensemble (NMME): Research, Application, and Future Directions. Bull. Am. Meteorol. Soc. 2022, 103, E973–E995. [Google Scholar] [CrossRef]
  31. Cai, Y.; Zheng, W.; Zhang, X.; Zhangzhong, L.; Xue, X. Research on soil moisture prediction model based on deep learning. PLoS ONE 2019, 14, e0214508. [Google Scholar] [CrossRef]
  32. Prasad, R.; Deo, R.C.; Li, Y.; Maraseni, T. Soil moisture forecasting by a hybrid machine learning technique: ELM integrated with ensemble empirical mode decomposition. Geoderma 2018, 330, 136–161. [Google Scholar] [CrossRef]
  33. Li, Q.; Wang, Z.; Shangguan, W.; Li, L.; Yao, Y.; Yu, F. Improved daily SMAP satellite soil moisture prediction over China using deep learning model with transfer learning. J. Hydrol. 2021, 600, 126698. [Google Scholar] [CrossRef]
  34. ElSaadani, M.; Habib, E.; Abdelhameed, A.M.; Bayoumi, M. Assessment of a spatiotemporal deep learning approach for soil moisture prediction and filling the gaps in between soil moisture observations. Front. Artif. Intell. 2021, 4, 636234. [Google Scholar] [CrossRef]
  35. Tan, C.; Sun, F.; Kong, T.; Zhang, W.; Yang, C.; Liu, C. A survey on deep transfer learning. In Proceedings of the Artificial Neural Networks and Machine Learning–ICANN 2018: 27th International Conference on Artificial Neural Networks, Rhodes, Greece, 4–7 October 2018; pp. 270–279. [Google Scholar]
  36. McColl, K.A.; Alemohammad, S.H.; Akbar, R.; Konings, A.G.; Yueh, S.; Entekhabi, D. The global distribution and dynamics of surface soil moisture. Nat. Geosci. 2017, 10, 100–104. [Google Scholar] [CrossRef]
  37. McColl, K.A.; He, Q.; Lu, H.; Entekhabi, D. Short-term and long-term surface soil moisture memory time scales are spatially anticorrelated at global scales. J. Hydrometeorol. 2019, 20, 1165–1182. [Google Scholar] [CrossRef]
  38. Zhu, H.; Chen, H.; Zhou, Y.; Dong, X. Evaluation of the subseasonal forecast skill of surface soil moisture in the S2S database. Atmos. Ocean. Sci. Lett. 2019, 12, 467–474. [Google Scholar] [CrossRef] [Green Version]
  39. Gudoshava, M.; Wanzala, M.; Thompson, E.; Mwesigwa, J.; Endris, H.S.; Segele, Z.; Hirons, L.; Kipkogei, O.; Mumbua, C.; Njoka, W.; et al. Application of real time S2S forecasts over Eastern Africa in the co-production of climate services. Clim. Serv. 2022, 27, 100319. [Google Scholar] [CrossRef]
  40. AghaKouchak, A.; Pan, B.; Mazdiyasni, O.; Sadegh, M.; Jiwa, S.; Zhang, W.; Love, C.; Madadgar, S.; Papalexiou, S.; Davis, S. Status and prospects for drought forecasting: Opportunities in artificial intelligence and hybrid physical–statistical forecasting. Philos. Trans. R. Soc. A 2022, 380, 20210288. [Google Scholar] [CrossRef]
  41. Irrgang, C.; Boers, N.; Sonnewald, M.; Barnes, E.A.; Kadow, C.; Staneva, J.; Saynisch-Wagner, J. Towards neural Earth system modelling by integrating artificial intelligence in Earth system science. Nat. Mach. Intell. 2021, 3, 667–674. [Google Scholar] [CrossRef]
  42. Slater, L.; Arnal, L.; Boucher, M.-A.; Chang, A.Y.-Y.; Moulds, S.; Murphy, C.; Nearing, G.; Shalev, G.; Shen, C.; Speight, L. Hybrid forecasting: Using statistics and machine learning to integrate predictions from dynamical models. Hydrol. Earth Syst. Sci. Discuss. 2022, 1–35. [Google Scholar] [CrossRef]
  43. Han, Y.; Zhang, G.J.; Huang, X.; Wang, Y. A moist physics parameterization based on deep learning. J. Adv. Model. Earth Syst. 2020, 12, e2020MS002076. [Google Scholar] [CrossRef]
  44. Xu, L.; Chen, N.; Zhang, X.; Chen, Z. A data-driven multi-model ensemble for deterministic and probabilistic precipitation forecasting at seasonal scale. Clim. Dynam. 2020, 54, 3355–3374. [Google Scholar] [CrossRef]
  45. Vitart, F.; Ardilouze, C.; Bonet, A.; Brookshaw, A.; Chen, M.; Codorean, C.; Déqué, M.; Ferranti, L.; Fucile, E.; Fuentes, M. The subseasonal to seasonal (S2S) prediction project database. Bull. Am. Meteorol. Soc. 2017, 98, 163–173. [Google Scholar] [CrossRef]
  46. Kirtman, B.P.; Min, D.; Infanti, J.M.; Kinter, J.L.; Paolino, D.A.; Zhang, Q.; Van Den Dool, H.; Saha, S.; Mendez, M.P.; Becker, E. The North American multimodel ensemble: Phase-1 seasonal-to-interannual prediction; phase-2 toward developing intraseasonal prediction. Bull. Am. Meteorol. Soc. 2014, 95, 585–601. [Google Scholar] [CrossRef] [Green Version]
  47. Thober, S.; Kumar, R.; Sheffield, J.; Mai, J.; Schäfer, D.; Samaniego, L. Seasonal soil moisture drought prediction over Europe using the North American Multi-Model Ensemble (NMME). J. Hydrometeorol. 2015, 16, 2329–2344. [Google Scholar] [CrossRef]
  48. Yao, M.; Yuan, X. Superensemble seasonal forecasting of soil moisture by NMME. Int. J. Climatol. 2018, 38, 2565–2574. [Google Scholar] [CrossRef]
  49. Chevuturi, A.; Klingaman, N.P.; Guo, L.; Holloway, C.E.; Guimarães, B.S.; Coelho, C.A.S.; Kubota, P.Y.; Young, M.; Black, E.; Baker, J.C.A.; et al. Subseasonal prediction performance for South American land–atmosphere coupling in extended austral summer. Clim. Resil. Sustain. 2022, 1, e28. [Google Scholar] [CrossRef]
  50. Basak, A.; Schmidt, K.M.; Mengshoel, O.J. From data to interpretable models: Machine learning for soil moisture forecasting. Int. J. Data Sci. Anal. 2023, 15, 9–32. [Google Scholar] [CrossRef]
  51. Li, Q.; Zhu, Y.; Shangguan, W.; Wang, X.; Li, L.; Yu, F. An attention-aware LSTM model for soil moisture and soil temperature prediction. Geoderma 2022, 409, 115651. [Google Scholar] [CrossRef]
  52. Yu, J.; Zhang, X.; Xu, L.; Dong, J.; Zhangzhong, L. A hybrid CNN-GRU model for predicting soil moisture in maize root zone. Agric. Water Manag. 2021, 245, 106649. [Google Scholar] [CrossRef]
  53. Ahmed, A.M.; Deo, R.C.; Raj, N.; Ghahramani, A.; Feng, Q.; Yin, Z.; Yang, L. Deep learning forecasts of soil moisture: Convolutional neural network and gated recurrent unit models coupled with satellite-derived MODIS, observations and synoptic-scale climate index data. Remote Sens. 2021, 13, 554. [Google Scholar] [CrossRef]
  54. Ahmad, S.; Kalra, A.; Stephen, H. Estimating soil moisture using remote sensing data: A machine learning approach. Adv. Water Resour. 2010, 33, 69–80. [Google Scholar] [CrossRef]
  55. Jiang, W.; Wang, L.; Feng, L.; Zhang, M.; Yao, R. Drought characteristics and its impact on changes in surface vegetation from 1981 to 2015 in the Yangtze River Basin, China. Int. J. Climatol. 2020, 40, 3380–3397. [Google Scholar] [CrossRef]
  56. Zhang, D.; Zhang, Q.; Werner, A.D.; Liu, X. GRACE-based hydrological drought evaluation of the Yangtze River Basin, China. J. Hydrometeorol. 2016, 17, 811–828. [Google Scholar] [CrossRef]
  57. Xu, L.; Chen, N.; Zhang, X. Global drought trends under 1.5 and 2 C warming. Int. J. Climatol. 2019, 39, 2375–2385. [Google Scholar] [CrossRef]
  58. Spinoni, J.; Vogt, J.V.; Naumann, G.; Barbosa, P.; Dosio, A. Will drought events become more frequent and severe in Europe? Int. J. Climatol. 2018, 38, 1718–1736. [Google Scholar] [CrossRef] [Green Version]
  59. Naumann, G.; Cammalleri, C.; Mentaschi, L.; Feyen, L. Increased economic drought impacts in Europe with anthropogenic warming. Nat. Clim. Chang. 2021, 11, 485–491. [Google Scholar] [CrossRef]
  60. Dorigo, W.; Wagner, W.; Hohensinn, R.; Hahn, S.; Paulik, C.; Xaver, A.; Gruber, A.; Drusch, M.; Mecklenburg, S.; van Oevelen, P. The International Soil Moisture Network: A data hosting facility for global in situ soil moisture measurements. Hydrol. Earth Syst. Sci. 2011, 15, 1675–1698. [Google Scholar] [CrossRef] [Green Version]
  61. Dee, D.P.; Uppala, S.M.; Simmons, A.J.; Berrisford, P.; Poli, P.; Kobayashi, S.; Andrae, U.; Balmaseda, M.; Balsamo, G.; Bauer, P.; et al. The ERA-Interim reanalysis: Configuration and performance of the data assimilation system. Q. J. R. Meteor. Soc. 2011, 137, 553–597. [Google Scholar] [CrossRef]
  62. Balsamo, G.; Boussetta, S.; Dutra, E.; Beljaars, A.; Viterbo, P.; Van den Hurk, B. Evolution of land surface processes in the IFS. ECMWF Newsl. 2011, 127, 78. [Google Scholar]
  63. Dataset: Resource and Environmental Science Data Registration and Publication System, Beijing, China. Available online: https://www.resdc.cn/DOI/doi.aspx?DOIid=54 (accessed on 6 December 2022).
  64. Dataset: Copernicus Climate Change Service. Available online: https://cds.climate.copernicus.eu/cdsapp#!/dataset/10.24381/cds.006f2c9a?tab=overview (accessed on 6 December 2022).
  65. Hong, Z.; Kalbarczyk, Z.; Iyer, R.K. A data-driven approach to soil moisture collection and prediction. In Proceedings of the 2016 IEEE International Conference on Smart Computing (SMARTCOMP), St. Louis, MO, USA, 18–20 May 2016; pp. 1–6. [Google Scholar]
  66. Prasad, R.; Deo, R.C.; Li, Y.; Maraseni, T. Weekly soil moisture forecasting with multivariate sequential, ensemble empirical mode decomposition and Boruta-random forest hybridizer algorithm approach. Catena 2019, 177, 149–166. [Google Scholar] [CrossRef]
  67. Vapnik, V. The Nature of Statistical Learning Theory; Springer Science & Business Media: New York, NY, USA, 1999. [Google Scholar]
  68. Breiman, L. Random forests. Mach. Learn. 2001, 45, 5–32. [Google Scholar] [CrossRef] [Green Version]
  69. Liaw, A.; Wiener, M. Classification and regression by randomForest. R News 2002, 2, 18–22. [Google Scholar]
  70. Oshiro, T.M.; Perez, P.S.; Baranauskas, J.A. How many trees in a random forest? In Proceedings of the Machine Learning and Data Mining in Pattern Recognition: 8th International Conference, MLDM 2012, Berlin, Germany, 13–20 July 2012; pp. 154–168. [Google Scholar]
  71. Adnan, M.N.; Islam, M.Z. Optimizing the number of trees in a decision forest to discover a subforest with high ensemble accuracy using a genetic algorithm. Knowl.-Based Syst. 2016, 110, 86–97. [Google Scholar] [CrossRef]
  72. Shi, X.; Chen, Z.; Wang, H.; Yeung, D.-Y.; Wong, W.-k.; Woo, W.-c. Convolutional LSTM network: A machine learning approach for precipitation nowcasting. Adv. Neural. Inf. Process. Syst. 2015, 28, 802–810. [Google Scholar]
  73. Robertson, D.E.; Wang, Q. A Bayesian approach to predictor selection for seasonal streamflow forecasting. J. Hydrometeorol. 2012, 13, 155–171. [Google Scholar] [CrossRef]
  74. Zhang, R.; Chen, Z.-Y.; Xu, L.-J.; Ou, C.-Q. Meteorological drought forecasting based on a statistical model with machine learning techniques in Shaanxi province, China. Sci. Total Environ. 2019, 665, 338–346. [Google Scholar] [CrossRef]
  75. Liu, T.; Schmitt, R.; Li, L. Global search for autumn-lead sea surface salinity predictors of winter precipitation in southwestern United States. Geophys. Res. Lett. 2018, 45, 8445–8454. [Google Scholar] [CrossRef]
  76. Reichstein, M.; Camps-Valls, G.; Stevens, B.; Jung, M.; Denzler, J.; Carvalhais, N. Deep learning and process understanding for data-driven Earth system science. Nature 2019, 566, 195–204. [Google Scholar] [CrossRef]
  77. Gruber, A.; De Lannoy, G.; Albergel, C.; Al-Yaari, A.; Brocca, L.; Calvet, J.-C.; Colliander, A.; Cosh, M.; Crow, W.; Dorigo, W. Validation practices for satellite soil moisture retrievals: What are (the) errors? Remote Sens. Environ. 2020, 244, 111806. [Google Scholar] [CrossRef]
Figure 1. A demonstration of the study area and the spatial distribution of RZSM. The demonstrated RZSM is calculated by the average of daily RZSM from 1 January 2015 to 29 November 2022 (the study period). (a) The YRB area of southern China and (b) the central areas of Europe.
Remotesensing 15 03410 g001
Figure 2. The RZSM forecasting framework based on the stacked ConvLSTM model. The left part of the framework denotes the inputs, i.e., the three-day consecutive observations before the target day at lead time i. The central part describes the deep learning model, which consists of three sequential ConvLSTM layers. The right side indicates the outputs of the RZSM predictions.
Remotesensing 15 03410 g002
Figure 3. The developed hybrid deep learning and S2S forecasting framework for RZSM forecasting. The left part of the framework denotes the inputs, including the three-day consecutive observations before the target day at lead time i and the forecasts from S2S at the target day. The central part describes the hybrid process in a deep learning approach for 1- to 46-day lead times. The right side indicates the outputs of the RZSM predictions. The hybrid SSM forecasting framework is the same as that of Figure 3, except that the RZSM variable was replaced by SSM.
Remotesensing 15 03410 g003
Figure 4. A demonstration of the overall RZSM forecasting skill over the YRB and EU areas. The first and second rows represent the predictive performance over the YRB and EU areas, and the four columns demonstrate the PCC, ubRMSE, bias and RMSE metrics, respectively.
Remotesensing 15 03410 g004
Figure 5. The distributions of the predictive skills for the SVR, RF, DL, S2S and hybrid models over all the lead times. The transverse line inside each box is the sample median. The bottom and top of each box are the 25th and 75th percentiles of the sample, respectively. The top and bottom whiskers correspond to approximately ±2.7σ of the data samples, respectively, where σ denotes the standard deviation of the data.
Remotesensing 15 03410 g005
Figure 6. A demonstration of the overall SSM forecasting skill over the YRB area.
Remotesensing 15 03410 g006
Figure 7. A demonstration of the overall RZSM forecasting skill over the YRB area based on the SMAP RZSM data.
Remotesensing 15 03410 g007
Figure 8. The differences in the predictive skills between the hybrid model and the individual predictions from DL or S2S over each data sample in the YRB region.
Remotesensing 15 03410 g008
Figure 9. The differences in the predictive skills between the hybrid model and the individual predictions from DL or S2S over each data sample in the EU region.
Remotesensing 15 03410 g009
Figure 10. The spatial patterns of the averaged predictive skills of RZSM over all the lead times for the DL, S2S and hybrid models over the YRB region.
Remotesensing 15 03410 g010
Figure 11. The spatial patterns of the averaged predictive skills of RZSM over all the lead times for the DL, S2S and hybrid models over the EU region.
Remotesensing 15 03410 g011
Figure 12. The temporal patterns of RZSM forecasting by the DL, S2S and hybrid models over a randomly picked point (106.5°E, 30.5°N) in the YRB area. The green ellipses denote highlighted moments.
Remotesensing 15 03410 g012
Figure 13. The predictive skills of RZSM over different land cover types for the SVR, RF, DL, S2S and hybrid models.
Remotesensing 15 03410 g013
Figure 14. The predictive skills of SSM over the EU region validated by in situ stations.
Remotesensing 15 03410 g014
Figure 15. The predictive skills of RZSM over the US region validated by in situ stations.
Remotesensing 15 03410 g015
Disclaimer/Publisher’s Note: The statements, opinions and data contained in all publications are solely those of the individual author(s) and contributor(s) and not of MDPI and/or the editor(s). MDPI and/or the editor(s) disclaim responsibility for any injury to people or property resulting from any ideas, methods, instructions or products referred to in the content.