2.1. Signal Model
Consider a co-located 1D linear antenna array with M transmitting elements that are omnidirectional. The element distance to the reference antenna of the mth, element in the transmitting array is . Note that this definition of the array is general regardless of whether the array is uniform or not. The operating frequency is and the operating wavelength is . There are pulses in one CPI and the PRF , where refers to pulse repetition interval (PRI).
The slow-time MIMO approach split the whole Doppler PRF into M orthogonal Doppler sub-bands with a bandwidth of
via slow-time phase coding. Here, we set the number of the Doppler sub-bands as the same as the number of transmitting antennas to simplify the modeling. Furthermore, the Doppler sub-bands can be redundant, leading to some empty Doppler sub-bands that can be utilized to enlarge the velocity measurement range. The baseband pulse waveform
has varying starting phases
, a function of the transmitting element index
and the pulse index (slow-time)
. The transmitting waveform of the
th element is:
The PAPC-st-MIMO waveform uses phase-coded signals as the pulse modulation method. It is assumed that there are
different continuous phase-coded signals in a frame of a PAPC-coded signal set
, and the code length of each coded signal is
bits. Then the pulse modulation waveform of the group phase-coded signal can be expressed as:
where
is the coding sequence of the
-th group phase-coded signal,
the chip width, and the interval between two adjacent chips. Therefore, the baseband reference signal model of a frame of PAPC coded signal set can be obtained by:
The PAPC pulse modulation waveform represented by (3) is brought into (1), and the PAPC-st-MIMO transmission signal model corresponding to the
th transmit antenna can be obtained:
where
is the frame period of the PAPC signal, the ratio of the number of pulses in the CPI to the number of PAPC signals in a frame,
, is selected as an integer to simplify the model. The transmission waveform of the PAPC-st-MIMO signal is shown in
Figure 1. The PAPC-coded signal set can obtain a signal set with good auto/cross-correlation characteristics through the optimization search algorithm, and its design process will be described in detail in the next section.
2.2. PAPC Signal Set Design
This section provides a detailed introduction to the design method of orthogonal phase-coded signal sets. Firstly, the principles of the Evolutionary Algorithm (EA) and Cyclic Algorithm New (CAN) are introduced, respectively. Then, the hybrid algorithm based on evolutionary algorithm and a new cyclic algorithm: the EA-CAN algorithm, is introduced, and the advantages of this algorithm compared with traditional algorithms are analyzed.
An evolutionary algorithm is a class of stochastic optimization algorithms under the new Darwinian paradigm, where the new Darwinian paradigm is a combination of classical Darwinian evolution, Weismann’s selection theory, and Mendelian genetics [
28]. Classic genetic algorithms (GA), memetic algorithms (MA), etc., belong to evolutionary algorithms. The main operations of evolutionary algorithms include crossover (or recombination), mutation, and selection. Evolutionary algorithms have been widely researched and applied in recent years due to their simple form, strong universality, and ability to obtain globally optimal solutions. Some improved evolutionary algorithms, such as memetic algorithms, after relying on global search capabilities to narrow the possible search range, combine efficient local optimal algorithms such as Tabu Search [
29], Greedy Code Search (GCS) [
30], etc., to optimize the search area to get the optimal solution.
2.2.1. Hybrid Evolutionary Algorithm Based on CAN
To leverage the advantages of global search and local search algorithms, this paper proposes a hybrid evolutionary algorithm called EA-CAN. By adopting evolutionary algorithms as the overarching framework, the algorithm exhibits strong global search capabilities, mitigating the risk of traditional gradient-based algorithms getting trapped in local optima. To address evolutionary algorithms’ limited local refinement ability, the paper introduces the CAN algorithm, which offers efficient local optimization capabilities and computational efficiency as a local search algorithm [
31]. As a result, the EA-CAN algorithm combines global search and local refinement capabilities.
Additionally, the time complexity of hybrid algorithms, such as the MA algorithm, is primarily determined by the time complexity of the local search algorithm. In this regard, introducing Fast Fourier Transform (FFT) significantly improves the time complexity of the local search compared to the general MA algorithm. Consequently, the overall computational efficiency of the algorithm is substantially enhanced.
Considering
Q groups of phase-coded signals with a code length of
:
where
,
. Then the non-periodic cross-correlation function of the
th signal and the
th signal is defined as follows:
where
. When
, the above formula becomes the auto-correlation function of the
th signal. According to the actual working scenario of the radar, different orthogonal phase-coded signal optimization criteria can be selected [
32]. This paper chooses the peak sidelobe as the cost function of the optimization algorithm, which can be expressed as:
where
is the peak sidelobe (Peak Sidelobe Level, PSL) of the
qth signal,
(
) is the peak cross-correlation level (Peak Cross-Correlation Level, PCCL) of the
th and
th signals. Usually, normalized PSL and PCCL are used as measurement indicators, divided by the auto-correlation peak and the code length
. The PSL and PCCL used in the following text refer to normalized values.
The EA-CAN algorithm process is shown in Algorithm 1, where the partial restart strategy is to randomly generate a specified number (partial restart individual number
) of new individuals at intervals of a specified number of generations (partial restart interval generation
) during the evolution of the population and add them to the population to participate in the evolution of the population, to improve the diversity of the population. After each random generation of population individuals and random mutations, CAN will be used for local optimization. Then a new population will be formed or added to the original population. It should be noted that the local search algorithm CAN algorithm is optimized based on the integrated sidelobe level (Integrated Sidelobe Level, ISL), but this does not contradict the overall optimization criteria: choosing the peak sidelobe as the basis for selection ensures that the peak sidelobe continues to decline during the iteration process, while a local search is based on ISL as the criterion to avoid unrobust optimization results brought by only using the peak criterion.
| Algorithm 1: EA-CAN Algorithm |
| 1: | Initialization: |
| 2: | Iteration times . |
| 3: | EA parameter initialization: |
| 4: | Parent population individual number , offspring population individual number , partial restart individual number . |
| 5: | Partial restart interval generation , maximum iteration times and mutation bit number . |
| 6: | Randomly generate individuals as the initial population , and use CAN for local optimization. |
| 7: | Take the top individuals as parents according to the cost function. |
| 8: | Repeat: |
| 9: | If the iteration times is a multiple of , perform a partial restart: |
| 10: | Randomly generate new individuals and add them to the parents after using CAN for local optimization. |
| 11: | Generate offspring: |
| 12: | Randomly select times from the parents . |
| 13: | Perform bit random mutations respectively and get offspring after using CAN for local optimization. |
| 14: | Take the top individuals from the union of parents and offspring as the next generation parents according to the cost function. |
| 15: | Iteration times . |
| 16: | Until the stop condition is met |
2.2.2. Design Results
Two orthogonal phase-coded waveform sets were generated using the EA-CAN algorithm proposed in this paper, serving as the pulse modulation signal set for the PAPC-st-MIMO signal. The code length of waveform set 1 is , and the group number is ; the code length of waveform set 2 is , and the group number is . The algorithm simulation parameters are set as follows: the number of individuals in the parent population is , the number of individuals in the offspring population is , the number of individuals in the partial restart is , the number of generations in the partial restart interval is , the maximum number of iterations in the evolutionary algorithm is , and the number of mutation bits is . The performance of the waveform generated by the EA-CAN algorithm and the impact of the signal set parameters on the waveform performance are analyzed.
The average PSL and PCCL of the two signal sets designed using the EA-CAN algorithm are shown in
Table 1.
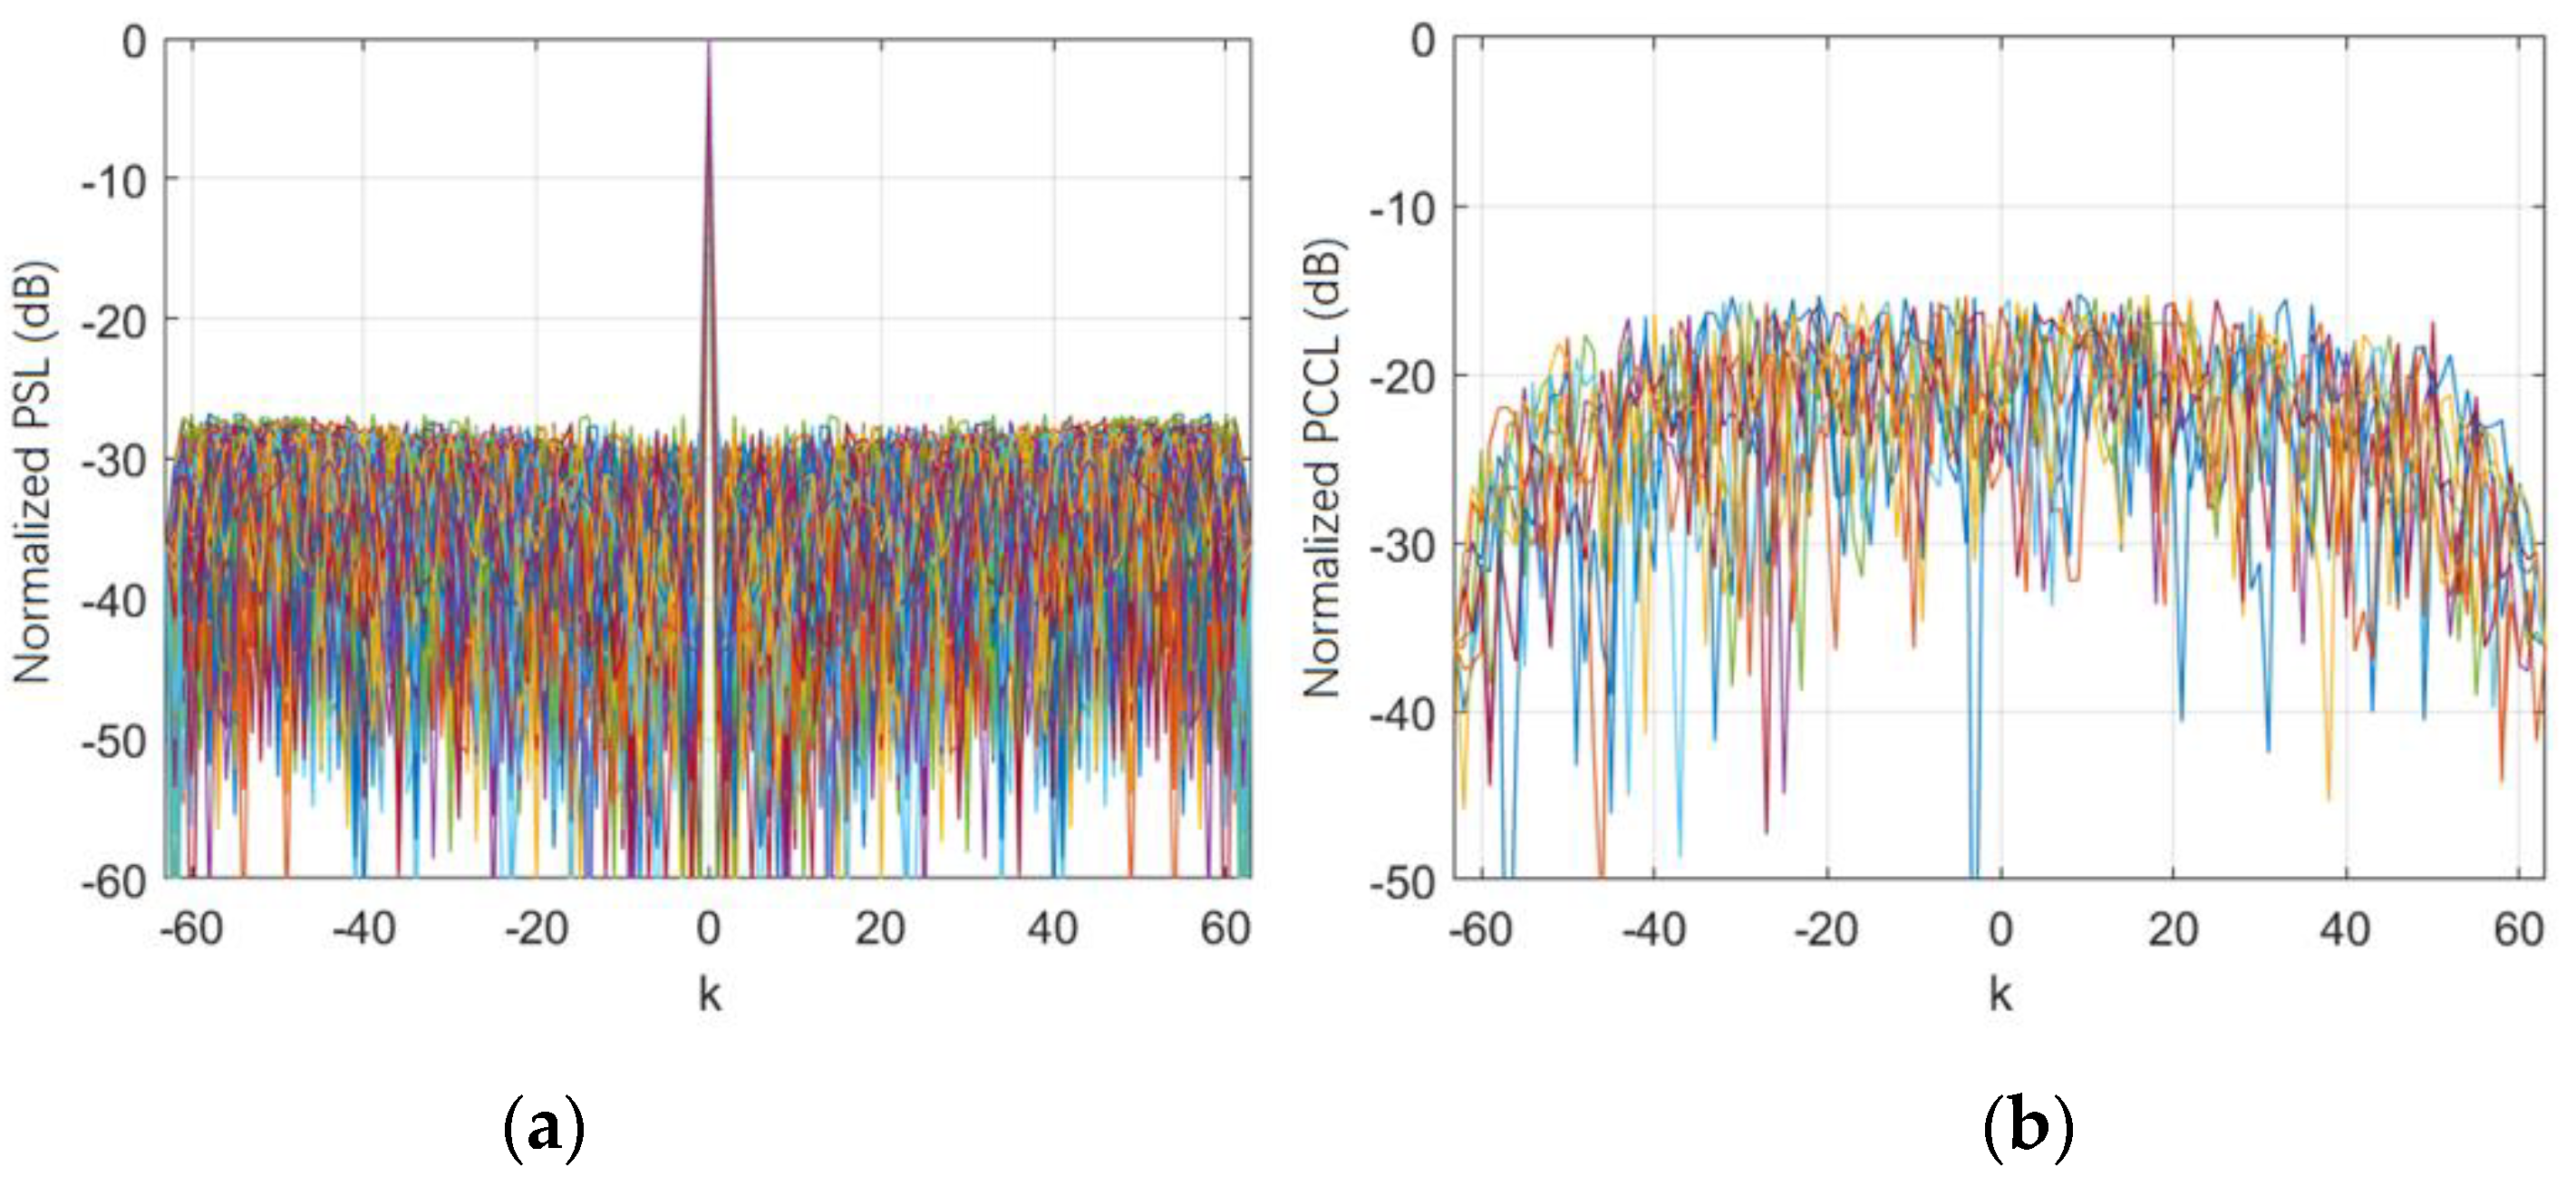
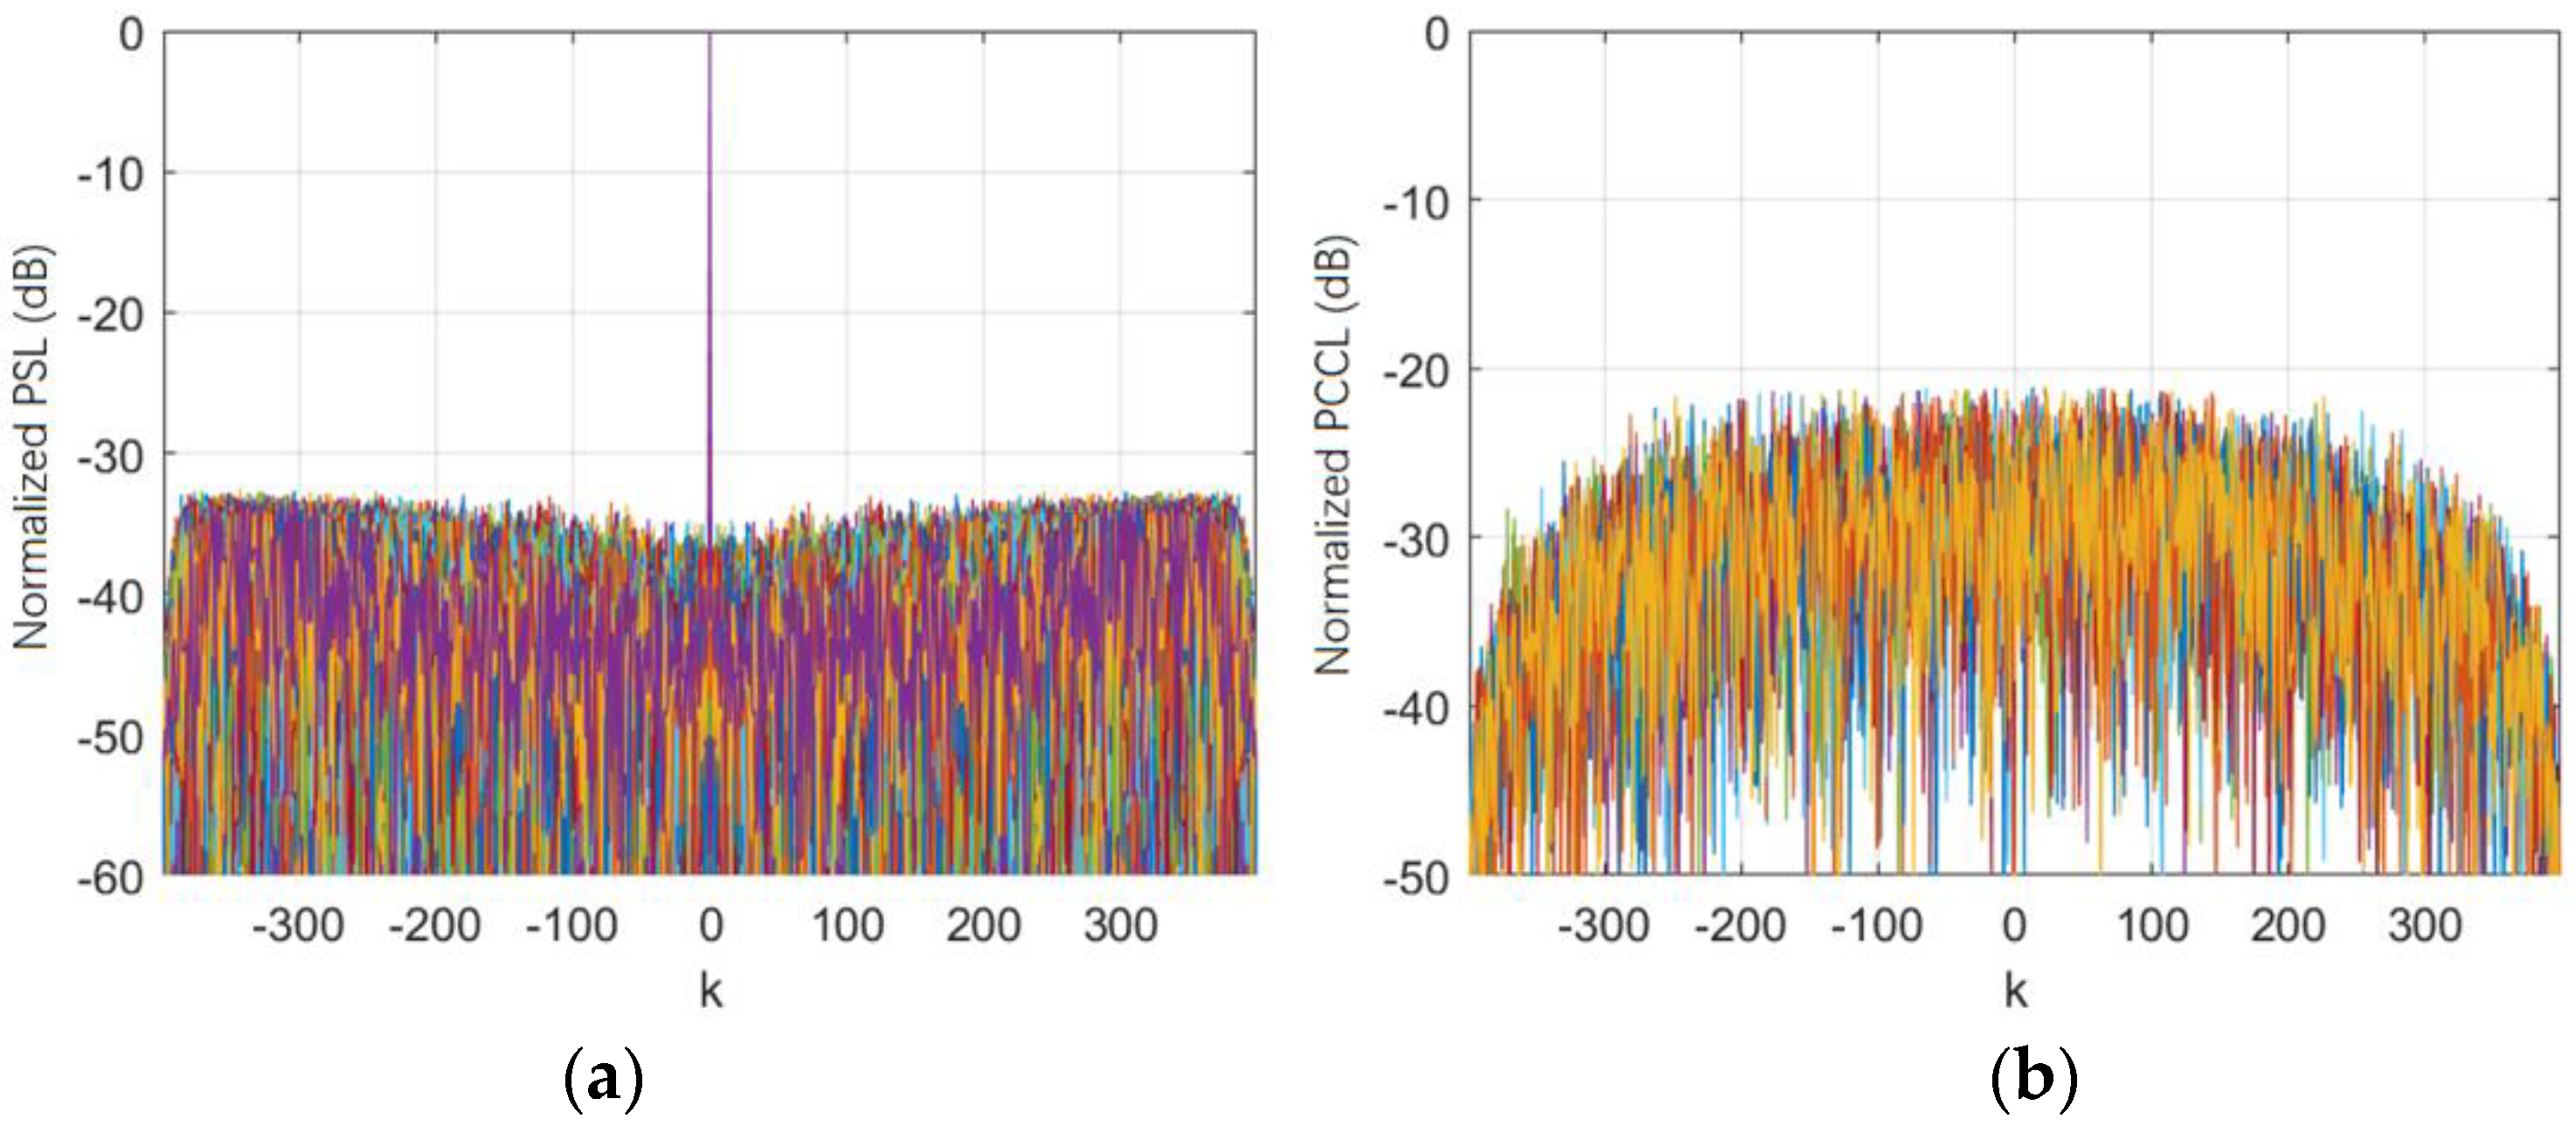
Figure 2 and
Figure 3 show the auto-correlation and cross-correlation results of the two signal sets designed using the EA-CAN algorithm, with different color lines representing different waveforms. It can be seen that the average PSL of the waveform with a code length of
reaches below −28 dB, the average PSL of the waveform with a code length of
reaches below −33 dB, and its average PCCL can approach −19 dB.
The following gives the performance level of the EA-CAN algorithm when designing signal sets with different code lengths and numbers of signals.
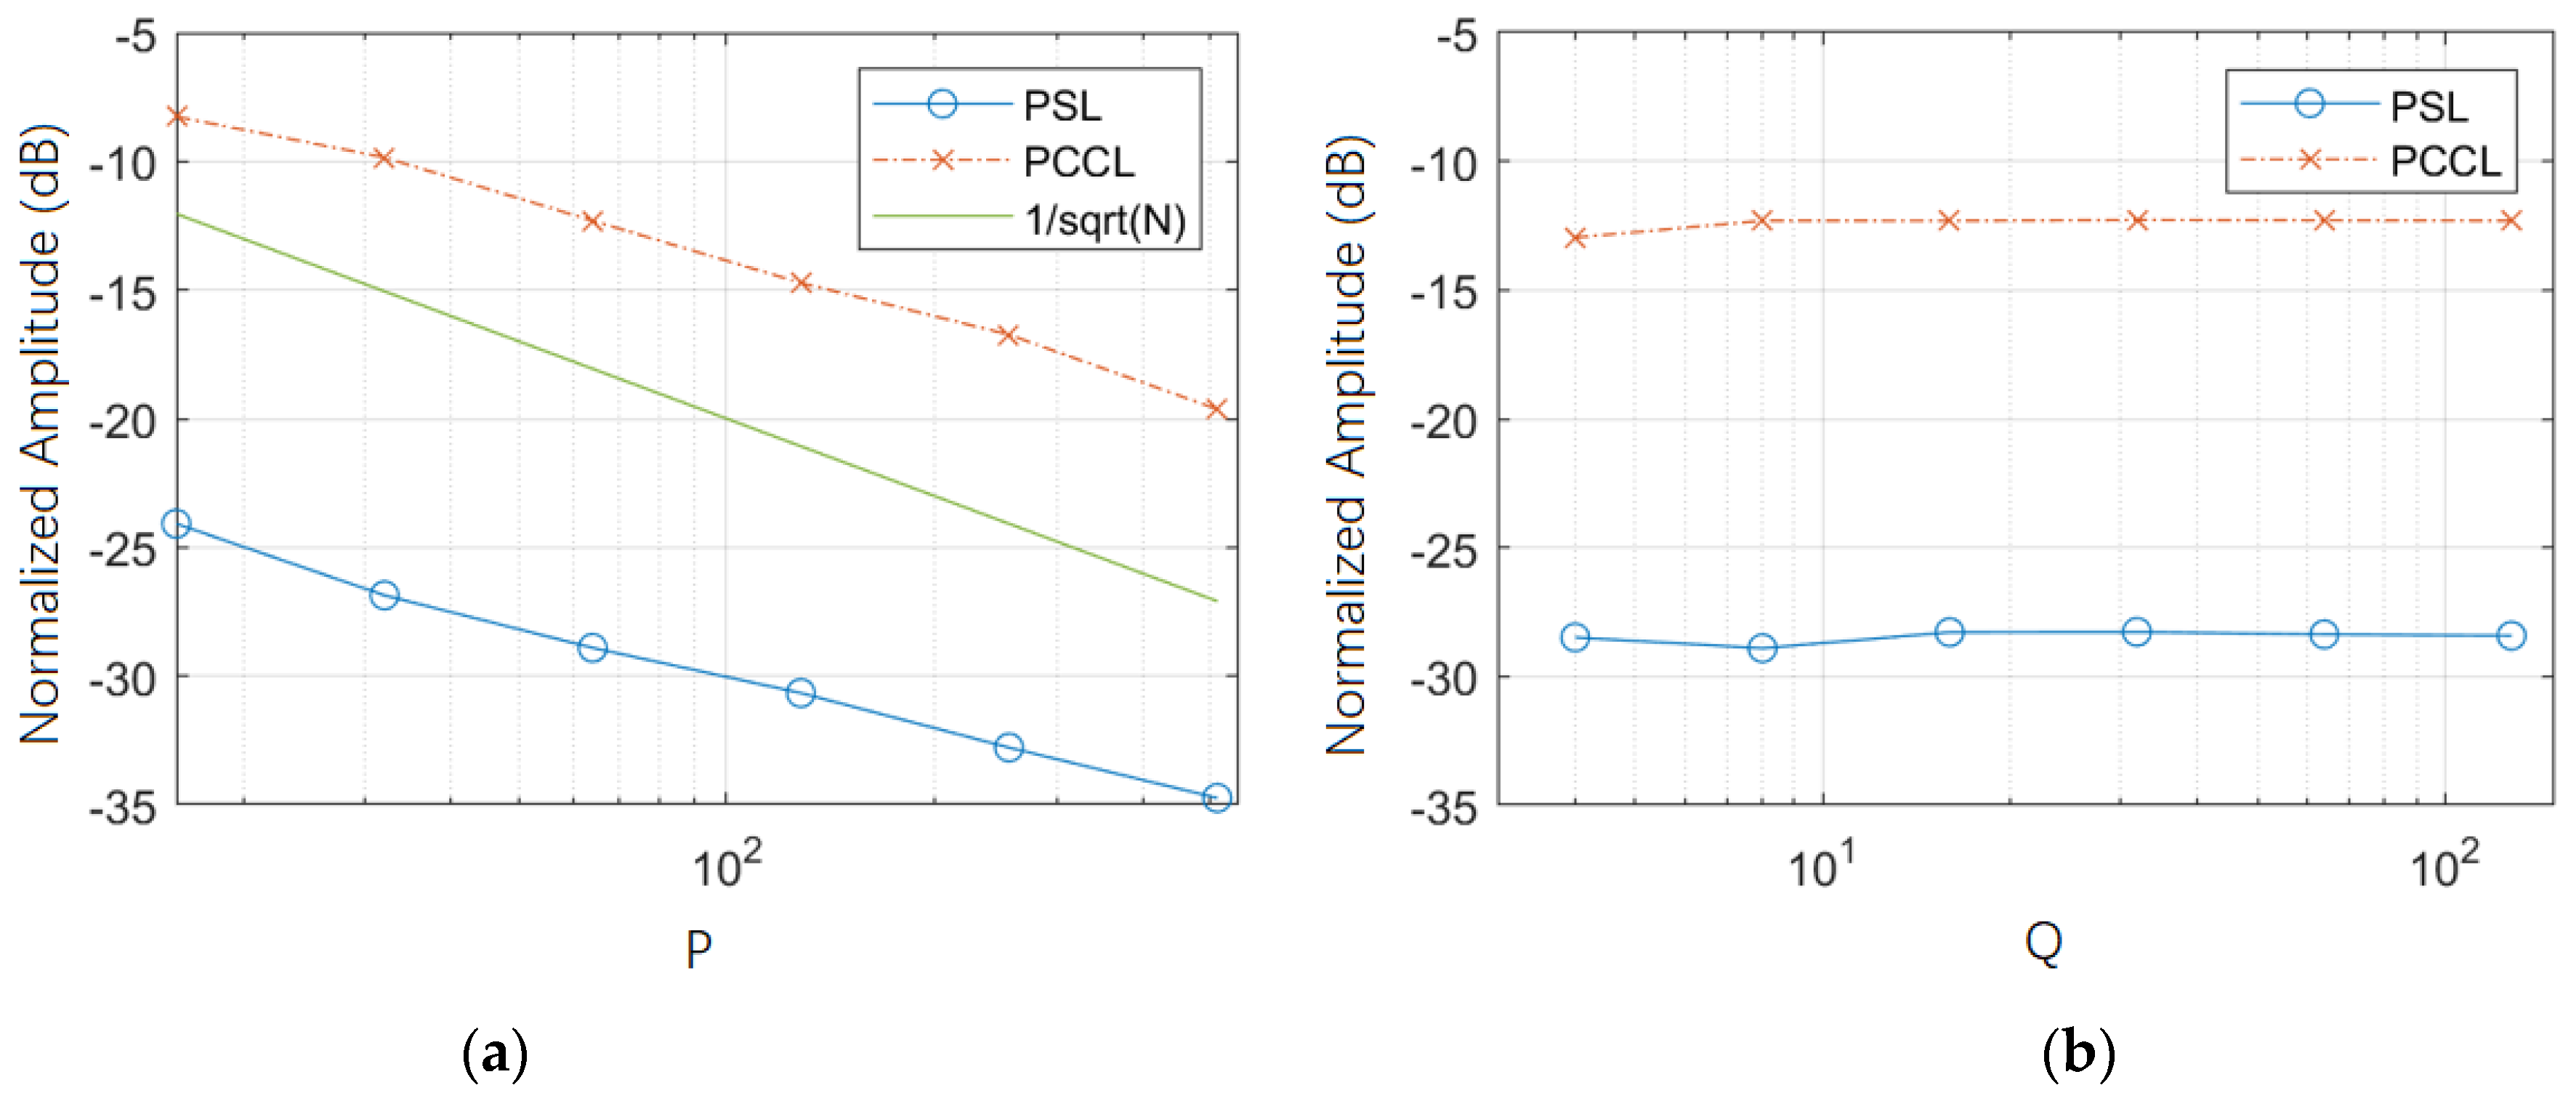
Figure 4a shows the changes in the average PSL and PCCL of the orthogonal phase-coded waveforms generated by the EA-CAN algorithm with the code length
, where
,
P = 16, 32, 64, 128, 256, 512. To observe the trend of PSL and PCCL
is also plotted in the figure. Due to the increase in the code length
bringing more design degrees of freedom, both the average PSL and PCCL decrease with the increase in the code length
, and both fall at a velocity close to
.
Figure 4b shows the changes in the average PSL and PCCL of the orthogonal phase-coded waveforms generated by the EA-CAN algorithm with the number of signals
, where
. The increase in the number of signals brings more constraints to the design, causing the average PSL and PCCL to increase with the increase in the number of signals
. Overall, the choice of code length
has a more significant impact on the performance of the signal set designed by the EA-CAN algorithm.
2.3. PAPC-St-MIMO Signal Processing
The PAPC-st-MIMO waveform achieves range selectivity by utilising the PAPC signal set. In the signal processing procedure, the following steps are performed:
Different range segment filter groups are established and matched with the echo signal. The echo signal in other range segments is intentionally mismatched, resulting in the acquisition of one-dimensional range images for each range segment.
The echo pulse compression signal from different range segments undergoes processing using Pulse-Doppler (PD) techniques.
The traditional st-MIMO signal processing method is employed to demodulate the echo signal orthogonally. This step yields the echo signal for each MIMO receiving-transmitting channel at various ranges.
Finally, the imaging results from each range segment are merged or spliced together, enabling the retrieval of the echo signal for each MIMO receiving-transmitting channel after extending the detecting range.
Theoretically, the PAPC-st-MIMO waveform can obtain an unambiguous detecting range of
, where
is the unambiguous detecting range of a single pulse. The setting of the receiving filter group of different range segments of the PAPC-st-MIMO waveform and the range gating schematic is shown in
Figure 5. The corresponding receiving filter group is set for different range segments, and the corresponding range segment echo can be coherently accumulated.
The following establishes the echo model of the PAPC-st-MIMO signal under the unambiguous scenario and derives the processing process of the PAPC-DDMA signal. Based on the modeling process in
Section 2.2.1, suppose a point target moving at a uniform velocity in the far field of the radar has a range of
from the radar, the radial velocity of the target relative to the radar is
, the corresponding target Doppler is
, and the wave arrival direction of the target is
. Then the echo signal received by the
th receiving antenna corresponding to the
th transmitting antenna can be expressed as:
where
is the echo delay, which has the following form:
Further, the received signal of the
th receiving antenna should be the sum of all
transmitted signals. After down-conversion and low-pass filtering, it can be expressed as:
Then, the echo signals received by each receiving antenna are jointly pulse-Doppler processed in multiple range segments to obtain a comprehensive range-Doppler plane without range ambiguity in multiple range segments. Use different receiving filter groups to match filter processing the received signal and obtain the matched filter output results corresponding to different range segments. Theoretically, a frame with
groups of different codewords of the PAPC signal set can achieve up to
unambiguous detection of range segments. As shown in
Figure 5, the receiving filter group corresponding to the
th range segment should be obtained by cyclically shifting the baseband reference signal
of the PAPC signal set by
pulses. Then the matched filter output result corresponding to the
th range segment can be expressed as:
where
is the matched filter.
Rearrange the matched filter output result of the
th range segment according to the pulse repetition interval, perform slow-time pulse-Doppler processing, that is, perform windowing, zero-padding, and discrete Fourier transform along the slow time, and obtain the range-Doppler plane corresponding to each range segment. Splice the range-Doppler planes corresponding to each segment in sequence to obtain a comprehensive range-Doppler plane of multiple range segments. The result of the FFT processing of the matched filter output result
of the
th range segment rearranged according to the number of pulses has the following form:
where
is the weight value of the slow-time window function, used to suppress the sidelobe of the velocity dimension, and
is the
th pulse of the matched filter output result of the
th range segment, and
represents the output of the
th velocity channel. Splice the pulse-Doppler processing results corresponding to each range segment in sequence to obtain a comprehensive range-Doppler plane of multiple range segments that is:
Finally, use the Doppler filter to demodulate the comprehensive range-Doppler plane corresponding to each receiving antenna of the MIMO and obtain the comprehensive range-Doppler plane after demodulation of each MIMO receiving-transmitting channel. To separate the response of the
th transmitting antenna on the comprehensive range-Doppler plane corresponding to the
th receiving antenna, use the Doppler frequency center
corresponding to the
th transmitting channel to mix with
to get the echo corresponding to the
th transmitting channel with zero Doppler:
Then, use a low-pass filter with a cutoff frequency of
to process
, and obtain the comprehensive range-Doppler plane corresponding to the
th receiving-transmitting channel:
where
is the time-domain response of the low-pass filter. This way, the comprehensive range-Doppler plane corresponding to each MIMO receiving-transmitting channel can be obtained, and slow-time MIMO demodulation can be realized.
The complete PAPC-st-MIMO signal processing process is shown in Algorithm 2:
| Algorithm 2: PAPC-st-MIMO Signal Processing |
| 1: | Begin: |
| 2: | Target parameter initialization. |
| 3: | Received PAPC-DDMA signals of each channel. |
| 4: | Initial range segment q = 0. |
| 5: | While q ≠ Q: |
| 6: | Select q. |
| 7: | Matched filtering using the receive filter for the current range segment. |
| 8: | Pulse-Doppler processing for the current range segment. |
| 9: | Select next q + 1. |
| 10: | End |
| 11: | Synthetic Range-Doppler plot for multiple range segments. |
| 12: | MIMO demodulation using Doppler filters. |
| 13: | Synthetic Range-Doppler plot for multiple range segments of each receiver-transmitter channel. |
| 14: | CFAR detection. |
| 15: | End |

