Technical Note

The Characteristics and Evolution of Structural and Functional Connectivity in a Large Catchment (Poyang Lake) during the Past 30 Years

1
Nanjing Institute of Geography and Limnology, Chinese Academy of Sciences, Nanjing 210008, China
2
University of Chinese Academy of Sciences, Beijing 100049, China
*
Author to whom correspondence should be addressed.
Remote Sens. 2023, 15(13), 3335; https://doi.org/10.3390/rs15133335
Submission received: 25 May 2023 / Revised: 26 June 2023 / Accepted: 28 June 2023 / Published: 29 June 2023

Abstract

:
Hydrological connectivity plays a major role in solving water resource and eco-environmental problems. However, this phenomenon has not been afforded the attention it deserves. The detailed analysis of connectivity in river systems could provide considerable insight into the structural and functional attributes of riverine landscapes. The current study used a graph theory approach and associated connectivity indicators to explore the characteristics and evolution of river systems and hydrological connectivity in a large catchment (Poyang Lake, China). The results revealed that the structure of the river system tended to be complex during 1990–2020, characterized by a dynamic evolution of tributaries in certain northern areas. Both river density and complexity exhibited an increasing trend by up to 15%, with the change rate after 2000 approximately twice as high as that of the preceding period. Overall, human activities across the catchment were more likely to play a key role in leading to significant changes in the quantity, morphometric, and structural characteristics of the river system. Additionally, the functional connectivity analysis indicated that the index of connectivity (IC) in the downstream catchment was stronger than that of the upstream vegetation areas, suggesting a strong contribution to the runoff sediment transport (r = 0.6–0.7). This study highlights the spatial and temporal evolution of both structural and functional connectivity in the large Poyang Lake catchment. The findings of this work will benefit future water resource management and applications by providing a strategy for protecting the surface hydrology and mass transport of large river basins under climate and land use changes.

1. Introduction

The river system plays a crucial role in the formation and evolution of water resources. Its structure and connectivity functions directly affect water resource allocation, water environment carrying capacity, and the ecological environment [1]. Runoff and sediment management is a key issue for water resource utilization and sustainable development at various catchment scales. Hydrological connectivity serves as a vital index for predicting the likelihood of potential runoff sediment transport paths throughout the catchment [2,3]. Understanding the spatial pattern and variability of connectivity is crucial for soil and water resource management and for determining the underlying factors that induce changes in connectivity.
Hydrological connectivity is commonly defined as the process of transferring various matter, energy, and organisms within or between water cycle elements using water as a medium [4], and includes structural connectivity and functional connectivity [5]. Structural connectivity refers to the extent of the physical connectivity of landscape structures or patterns, while functional connectivity is generally used to represent the influence of the interaction between structural features and geomorphic, ecological, and hydrological processes [6,7]. Hydrological connectivity is closely related to multiple ecological processes. It is of practical significance for catchment ecology and management to analyze the spatial and temporal characteristics and driving mechanisms of hydrological connectivity [8,9].
Many approaches have been adopted to quantify hydrological connectivity, including hydrological models, connectivity index, landscape ecology, graph theory, and remote sensing techniques. Among these, connectivity index is the most widely used method, such as topographic index [10], wetness index [11], and directional leakiness index [12]. Borselli et al. [13] proposed the index of connectivity (IC) based on a geomorphic method to estimate connectivity conditions at the catchment scale. The IC is widely applied in the field of hydrological connectivity because its calculations require less data and can assess connectivity in remote or vast areas [14,15]. Given this background, Arabkhedri et al. [16] explored the relationship between the IC and sediment yield in 11 catchments (Iran), demonstrating that the IC plays a key role in controlling sediment yield. Liu et al. [17] employed the IC to investigate the effects of land use/cover changes on the dynamics of hydrological connectivity. These studies indicate that the IC can be used to evaluate the potential of runoff and sediment export capacity throughout the catchment. In recent studies, it was found that the changes in river systems alter the hydrological and hydraulic conditions of stream flows, affecting the material transport and ecological function within the river [18,19]. In order to analyze the spatiotemporal distribution characteristics and evolution tendency of river systems, many studies have conducted extensive work combining landscape ecology and graph theory methods. For instance, Deng et al. [20] analyzed the spatiotemporal evolution of the river patterns in the Taihu Lake plain (China) during 1960–2000 by using six indexes. These previous studies provide a reference for understanding the connectivity evolution of river systems, which is vital for integrated catchment management. However, few attempts have been conducted to determine the spatial variability of hydrological connectivity in complex and large river systems. Previous studies regarding the relationship between connectivity and catchment runoff sediment transport under both land cover and topographic features are also lacking.
The Poyang Lake catchment (Southern China) plays a hydro-ecological role in the middle and lower reaches of the Yangtze River [21]. However, economic development and a population explosion within the catchment have significantly impacted sediment transport, water cycle processes, and the ecological environment [22,23]. Previous work indicated that the frequency and intensity of floods in the Poyang Lake catchment are increasing, potentially leading to the obstruction of hydrological connectivity [24]. The blockage of hydrological connectivity will not only affect the connection of rivers and lakes, but also disrupt material migration and energy exchange, resulting in changes in the hydrological process and ecological environment of the catchment [25]. Recently, Xia et al. [26] proposed a comprehensive method to evaluate hydrological connectivity of the Poyang Lake area based on long-time-series remote sensing images, analyzing the key forces of hydrological connectivity evolution. Li et al. [27] used geostatistical methods in combination with a two-dimensional hydrodynamic model to investigate the seasonal dynamics of hydrological connectivity in the floodplain wetland of Poyang Lake. These previous studies of hydrological connectivity mainly focused on the lake and did not consider the upstream catchment river systems making significant contributions to the lake. Therefore, it is urgent to assess the changes in the river systems and associated hydrological connectivity across the large Poyang Lake catchment, which could provide an important basic background for ecological protection and management in a changing environmental setting.
This study utilizes the dataset of river systems, landscape topography, and land use over the past 30 years to investigate the evolution of river systems and associated hydrological connectivity conditions in a large catchment of Poyang Lake, providing recommendations for future ecological and environmental protection. We hypothesized that climate change and human activities have altered the natural characteristics of the landscape, affecting river flow and connectivity properties. Therefore, the specific objectives of this study are to: (1) identity the dynamics and evolution of the catchment river system during the past 30 years; (2) investigate the changes in the structural connectivity of catchment rivers and identify the factors that influence it; and (3) explore the spatiotemporal distribution patterns of catchment functional connectivity and its relationship with runoff and sediment. This work provides reference for identifying the evolution of river system structure and hydrological connectivity, improving understanding for the integrated management of lake catchments.

2. Materials and Methods
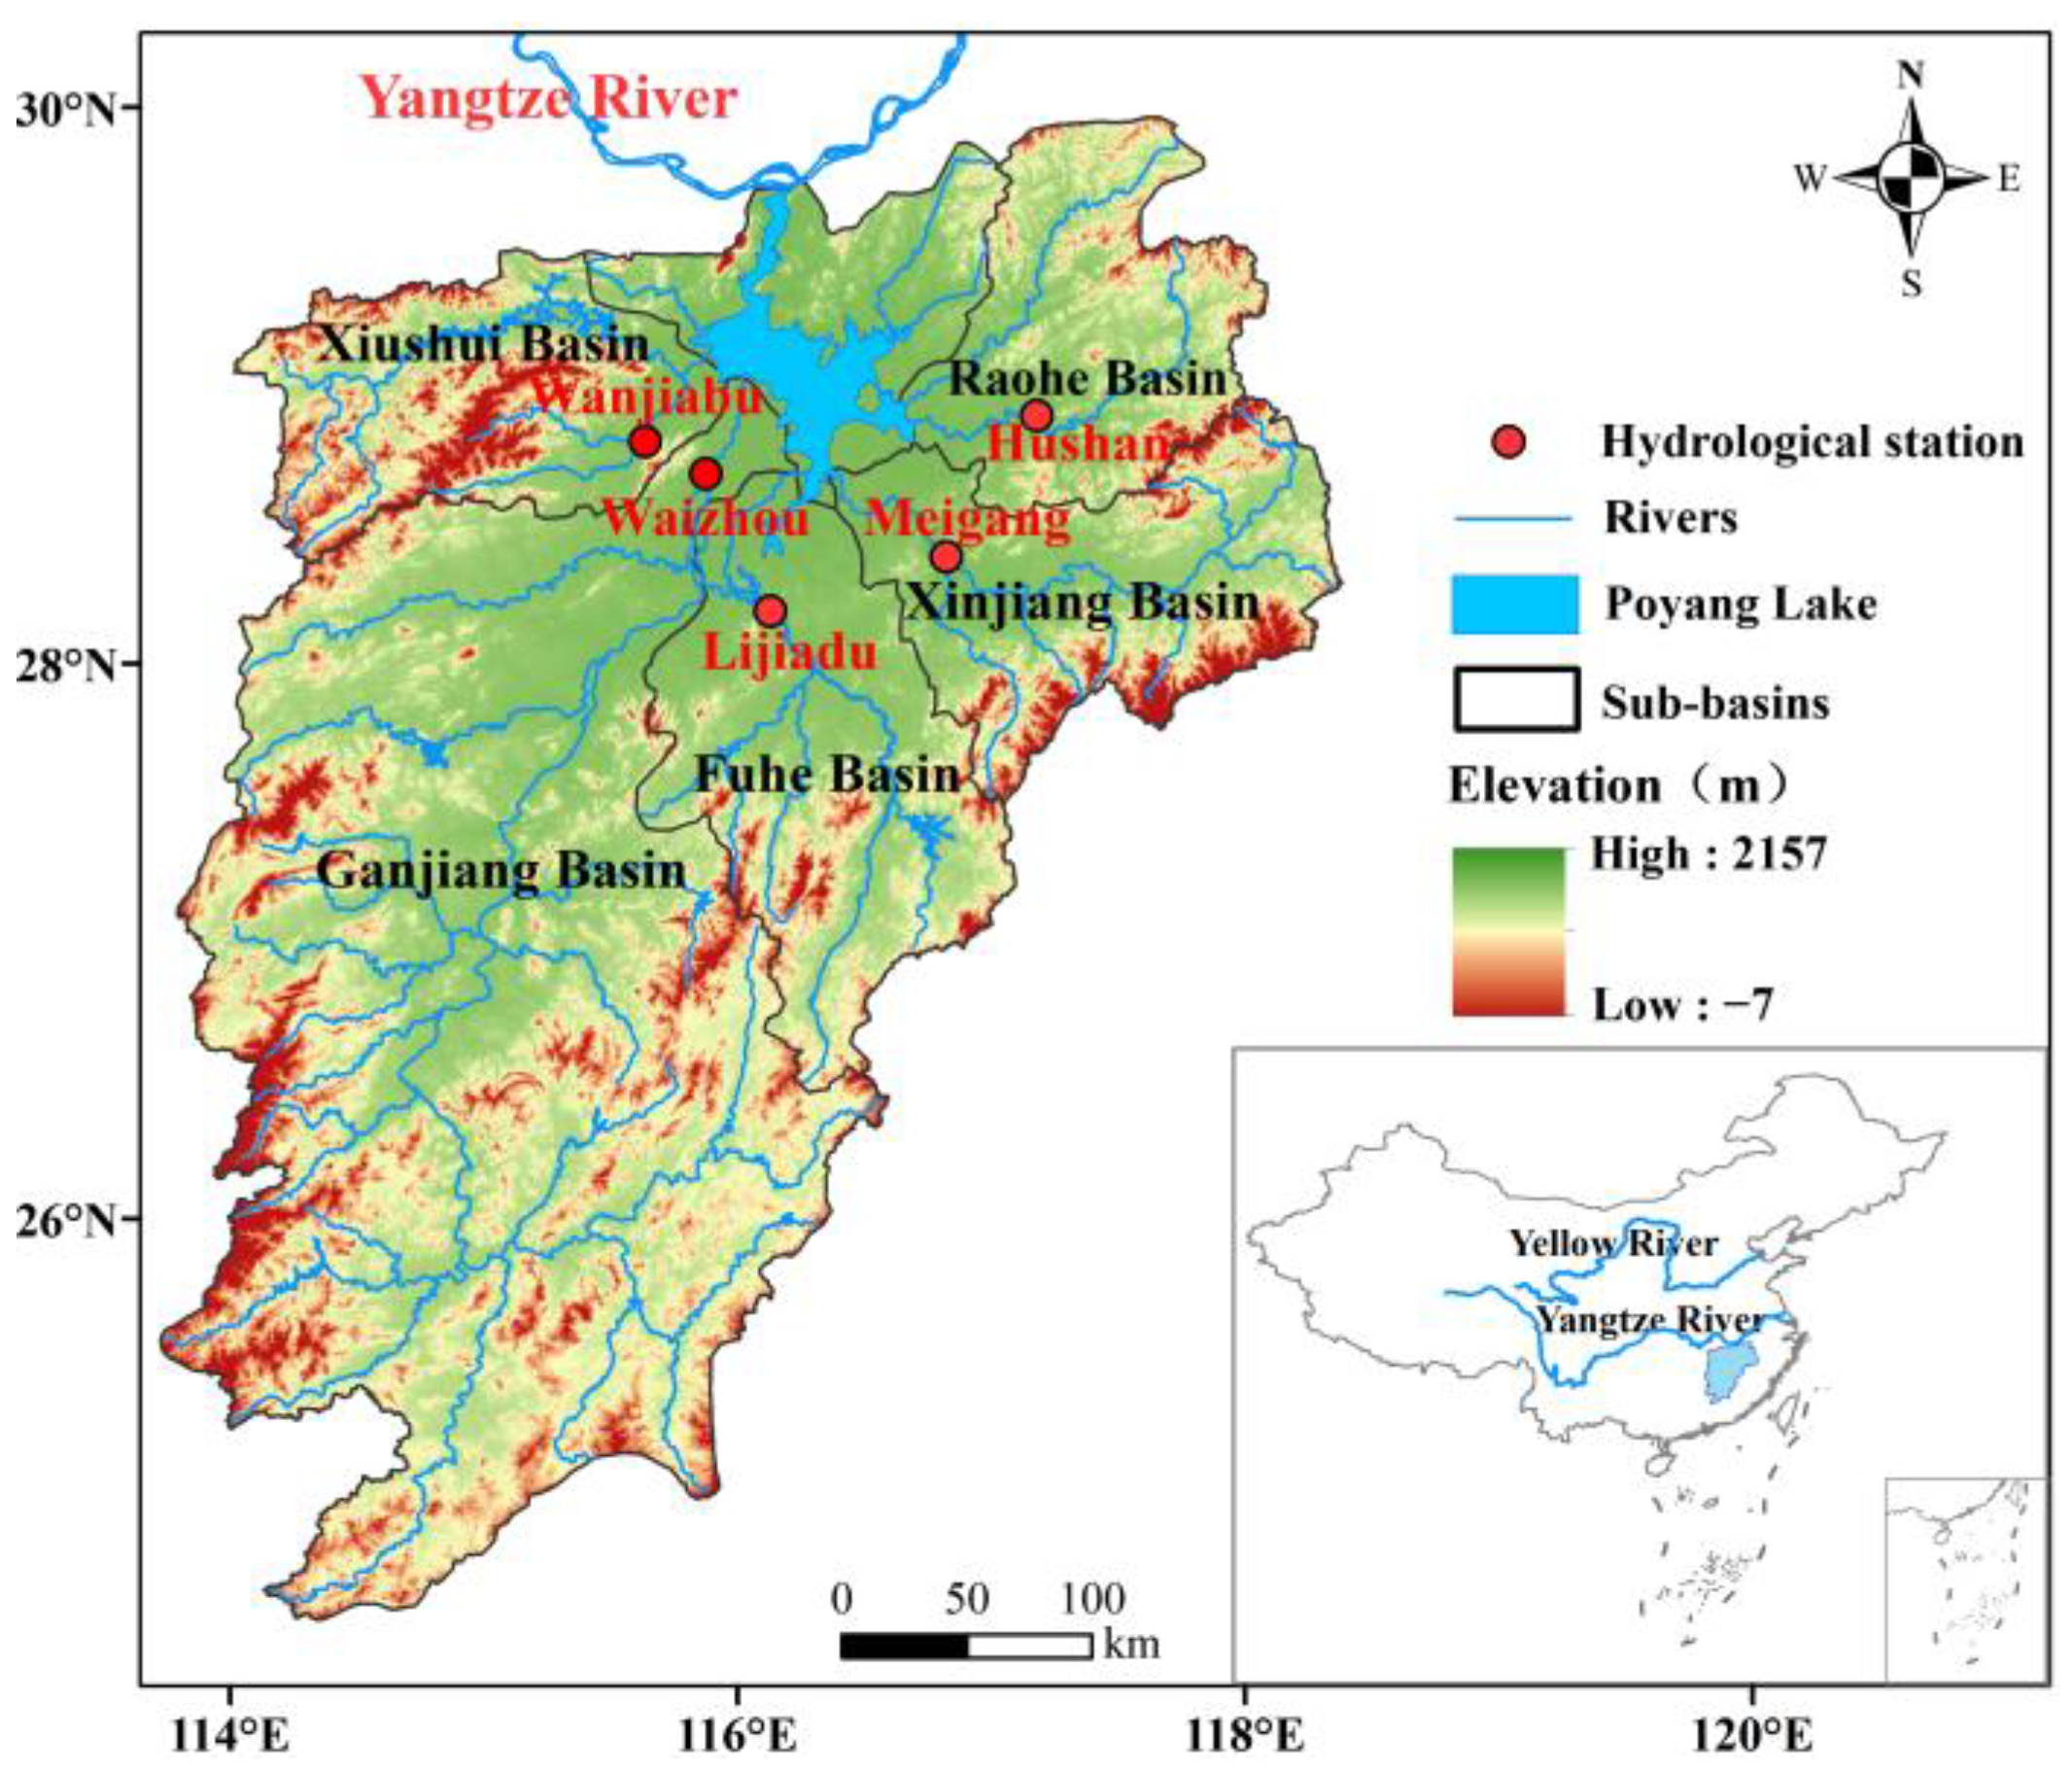
2.1. Study Area

The Poyang Lake catchment (113°35′–118°29′E, 24°29′–30°05′N) covers an area of 1.62 × 10⁵ km2 in the Yangtze River basin. It has a subtropical warm and humid monsoon climate with an annual average temperature of 17.5 °C and an annual average precipitation of 1638 mm [28]. The catchment consists of five sub-basins (i.e., Ganjiang, Fuhe, Xinjiang, Raohe, and Xiushui) and the main Poyang Lake (Figure 1). The primary land use types of the catchment are forest (64%), cropland (26%), and grassland (4%) [29]. It is surrounded by mountains on three sides, with rolling hills in the center and Poyang Lake plain in the north; the elevation of the catchment varies from −7 m to 2157 m (Figure 1). Red soil and yellow soil are the most widely distributed across the catchment, with approximately 20% of the land area in the catchment experiencing soil erosion [30]. The river system of Poyang Lake is composed of five main rivers and various smaller rivers that flow directly into the lake, with the inflows from all rivers discharging into the main stem of the Yangtze River at Hukou. Moreover, the Poyang Lake catchment is dense in rivers and lakes, with about 490 rivers over 100 km2 and 51 rivers over 1000 km2 [31]. The mean annual runoff is 152.5 billion m3, accounting for about 16.3% of the Yangtze River basin. The catchment is also an important production base of rice, cotton, and oilseed rape products in China [32]. During the past few decades, numerous water conservation projects have been implemented in the catchment. For example, more than 10,000 reservoirs have been built in this region, including 30 large reservoirs with a total capacity of about 19 billion m3 [31].

2.2. Methodology

2.2.1. Structural Connectivity Index

According to landscape ecology and graph theory, this study is expected to identify and quantitatively perform a river evolution analysis of the Poyang Lake catchment during 1990–2020. According to previous studies and associated methods [33,34], characteristic indicators of quantity, morphometrics, and structure were adopted to describe the structural connectivity of the river systems (Table 1). River density reflects the degree of river length development and sparseness of distribution. Water surface ratio describes the storage capacity of the river system. River complexity has been used to represent the development degree of the river network, and the higher the value, the more developed the river system. River development coefficient indicates the development degree of tributaries, and the lower the value, the more likely the river system is to trunk [33]. The classical hydrological connectivity index network circuitry (α) represents the level of material–energy exchange at each node. The edge–nodes ratio (β) describes the difficulty of connecting each node to other nodes in river systems. Network connectivity (γ) indicates the connection degree of the river network [34].

2.2.2. Functional Connectivity Index (IC)

In this study, the IC proposed by Borselli et al. [13] was applied to quantify the functional connectivity of the Poyang Lake catchment, representing the potential of catchment runoff and sediment transport to the channel. In the IC calculation, the upslope component (Dup) represents the potential of upstream sediment to move downstream, and the downslope component (Ddn) describes the length of the sediment flow path to the nearest target. The vegetation factor (C) of the soil loss equation (RULSE) is closely related to the vegetation coverage f, which is applicable to the analysis of the catchment dominated by agriculture and vegetation. The primary land use type of the Poyang Lake catchment is forest, and therefore the weighting factor W for forest, grassland, and shrubs in the IC calculation are C values, and W for other land use types, using the categorical assignment method. In addition, water and cropland have a value of 0 and 0.23, respectively, with barren and impervious adopting a value of 0.35 [30]. The IC calculation was implemented in ArcGIS 10.7 using the model builder. The detailed processing methods of the model are presented in Figure 2. The C factor is calculated based on the relationship between C and f [35], where f is derived from the normalized difference vegetation index (NDVI) [36], with the calculation formula expressed as follows:
IC = l o g 10 D u p D d n = W -   ×   S -   ×   A i d i W i × S i
where A is the upslope contribution area (m2), W represents the mean weight factor of the upslope contribution area (-), S indicates the average slope (m/m), d i is the flow path length of the ith cell along the downhill direction (m), and W i and S i are the weight and slope of the ith cell, respectively. The IC value ranges from [ , + ], and a larger IC value indicates that the possibility of runoff sediment transport to the river channel is greater:
C = 1 f 0 0.6508 0.3436 log 10 f   0 < f 78.3 % , 0 f > 78.3 %
  f = NDVI NDVI soil NDVI max NDVI soil
where C ranges from 0 to 1. The C value close to 0 represents densely vegetated and protected soil, while the value close to 1 indicates bare soil at risk of erosion. NDVImax is the NDVI value of a pixel completely covered by vegetation, and NDVIsoil is the NDVI value of bare land or an area without vegetation cover. NDVImax and NDVIsoil are different for different land use types, thus the NDVI value with 95% frequency of forest, grassland, and shrub was defined as the NDVImax, and the NDVI value with 5% frequency was defined as NDVIsoil in our study [37].

2.3. Data Collection and Processing

The ASTER GDEM V2 data used for calculating functional connectivity were derived from the geospatial data cloud (http://www.gscloud.cn/, accessed on 10 August 2022). The land use and NDVI data were available for a total of five periods in 1990, 2000, 2005, 2010, and 2020. Land use maps were acquired from the annual China land cover dataset (CLCD) [38] (http://www.crensed.ac.cn, accessed on 10 August 2022), including cropland, forest, shrub, grassland, water, barren, and impervious. NDVI data were downloaded from Landsat 5/8 images by using the Google Earth Engine (GEE), and the spatial resolution of the data used in this study was 30 m × 30 m, with a coordinate system of WGS_1984_UTM_Zone_50N. River discharge and sediment data during 1990–2020 were collected from five hydrological gauging stations, including the Waizhou station (Ganjiang River), Lijiadu station (Fuhe River), Meigang station (Xinjiang River), Hushan station (Raohe River), and Wanjiabu station (Xiushui River) (Figure 1). Discharge data before the year 2000 were derived from the Jiangxi Provincial Hydrological Bureau, and sediment transport data were obtained from the observed water–sediment relationship of each station. Data after 2000 were acquired from the Changjiang Hydrological Network (http://www.cjh.com.cn/, accessed on 10 August 2022).
The river system data were extracted using the GEE platform and were used to calculate structural connectivity. From the perspective of a long time period, a five- or ten-year interval was adopted to perform interannual changes in connectivity dynamics. We used the GEE software to select Landsat TM/OLI images in 1990, 2000, 2005, 2010, and 2020 based on the clear sky or no cloud cover images in the study area. The annual synthetic modified normalized difference water index (MNDWI) [39] was then generated, and the Otsu method [40] was used for threshold segmentation to extract water bodies. The preliminary river system results of the catchment were converted into vector data, and the center lines of the main rivers were extracted in ArcGIS 10.7. Subsequently, the rivers were checked and corrected using a visual inspection strategy. Finally, digital river system maps of the Poyang Lake catchment in five periods were obtained. According to the Strahler method, the rivers in the Poyang Lake catchment were classified into four orders (I–IV) in this study. In order to establish the spatial dataset for the parameter calculation of the river system structure and connectivity, corresponding fields were added to each layer to obtain attribute values such as number, length, and area.

3. Results

3.1. River System Accuracy and Spatial Pattern Evolution

In this study, the data of the extracted river systems in 2010 and 2020 were used for evaluating the accuracy based on high-resolution images of the same or adjacent years using the Google Earth software. The center of the river was selected as the accuracy verification point at 2 km intervals. In addition, a total of 4000 verification points were generated according to the proportion of different river orders, including 2000 order I rivers, 1200 order II rivers, 600 order III rivers, and 200 order IV rivers (Figure 3d,e). Subsequently, buffers were established to check if the verification point fell within the river. The results showed that the overall verification accuracy of river system in the Poyang Lake catchment was 92% in 2010 and 93% in 2020 (Figure 3d,e). It can be concluded that most of the verification points overlap the extraction results of the river system well, meeting the requirements of river system analysis.
It can be observed that the river system distribution of the Poyang Lake catchment exhibits distinctly interannual changes and has gradually become intensive over the past 30 years (Figure 3). During 1990–2005, the number of river nodes and edges of the river system were generally small, and the spatial pattern had relatively slight changes (Figure 3a–c). However, the number of river nodes and edges increased significantly, and the spatial pattern became more complex in 2010 and 2020 (Figure 3d,e). Additionally, the associated changes mainly occurred in the northern tributaries of the catchment. This is likely due to the growth of tributaries caused by urbanization, dredging, and the widening of rivers. Compared to 1990, the number of river nodes and edges in 2020 increased significantly (Figure 3f), especially in the Xiushui and Xinjiang sub-basin. Overall, the change in the river system in the catchment is quite obvious after the 21st century, probably due to intensive human activities across the catchment (e.g., water conservation projects).

3.2. Characteristics of Structural River Connectivity

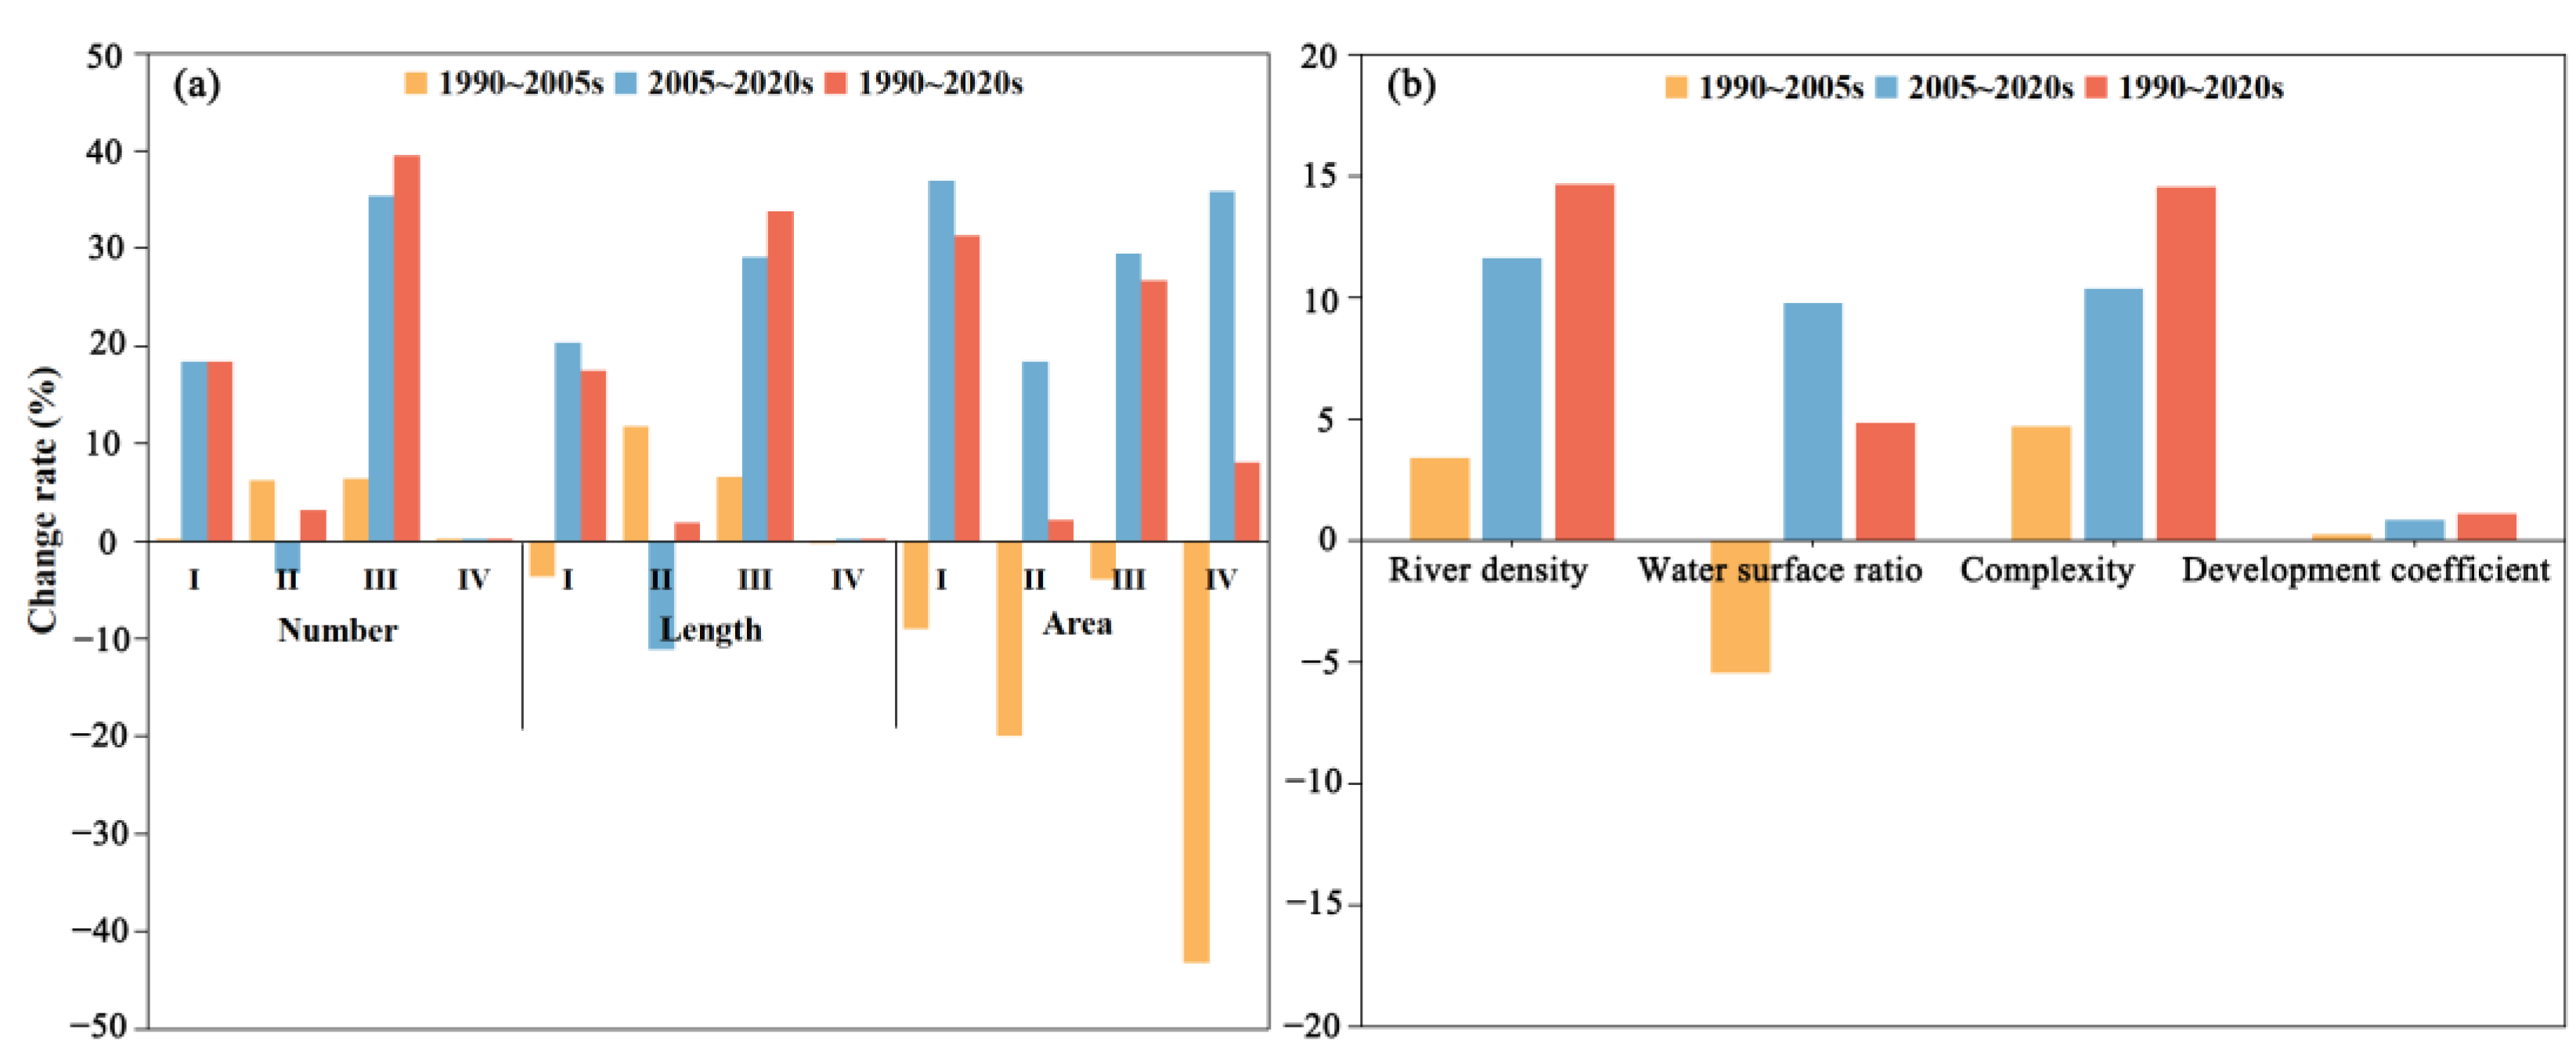
3.2.1. Quantity and Morphometric Characteristics

The changes in river system quantity and morphometric characteristics for different periods of the Poyang Lake catchment are shown in Figure 4. The results showed that the distribution area of all order rivers indicated a decreasing trend during 1990–2005, with the largest decrease rate of around 43.2% for order IV rivers. The number and length of order II and III rivers exhibited an increasing trend, and the associated lengths increased by 11.7% and 6.6%, respectively (Figure 4a). It should be noted that order I and III rivers showed an increasing trend during the period of 2005–2020, but the number and length of order II rivers exhibited a decreasing trend. Additionally, the number and length of order IV rivers remain the same, with the area increasing by approximately 35.9% (Figure 4a). It is notable that some order II rivers are likely to transform into order I rivers or expand to become part of order III rivers. In general, except for the main stream (order IV), the number, length, and area characteristics of the river system structure of the Poyang Lake catchment showed an increasing trend from 1990 to 2020. Specifically, the most notable changes were observed in order III rivers, with growth rates exceeding 20%. Order I rivers showed an increase of over 15%, while order II river exhibited a growth rate of less than 4%.
The river network density tended to increase as the total length of the river expanded (Figure 4b). In addition, the river network complexity gradually rose from 55.47 in 1990 to 63.43 in 2020, with an increase in both river number and length. In particular, both the river density and complexity in the Poyang Lake catchment increased by 15% and the water surface ratio by 5% over the last 30 years. However, there were no significant changes in the river network development coefficient. Both the quantity and morphological characteristics representing structural connectivity showed an increasing trend, indicating a gradual improvement in structural connectivity. In general, the change rate in both quantity and morphometric indicators during 2005–2020 was about twice that during 1990–2005 (Figure 4b). Consequently, the growth rate of the river system structure clearly accelerated, and the spatial pattern of the river network tended to be complicated after the 21st century.

3.2.2. Structural Characteristics of Connectivity

Table 2 lists the structural connectivity analysis of the river system for five periods based on the graph theory approach. The number of river nodes increased from 108 to 127 and the number of river edges increased from 204 to 247 during the period of 1990–2020. In addition, the α, β, and γ indexes of the river system showed an increasing trend. That is, α increased from 0.46 to 0.49, β increased from 1.89 to 1.94, and γ increased from 0.64 to 0.66 (Table 2). Previous research suggests that the values of α and γ typically fall within the range of [0, 1], and β is between [0, 3]. In the current study, each characteristic parameter is in the mid-to-upper range of the interval (i.e., α  0.5, β  2, and γ > 0.6). The larger the index, the higher the connectivity degree and the more complex the river network [41]. The results presented here demonstrate that the river network connection, node connection, and connectivity degree of the river system within the catchment are generally at a good level.

3.3. Characteristics of Functional River Connectivity

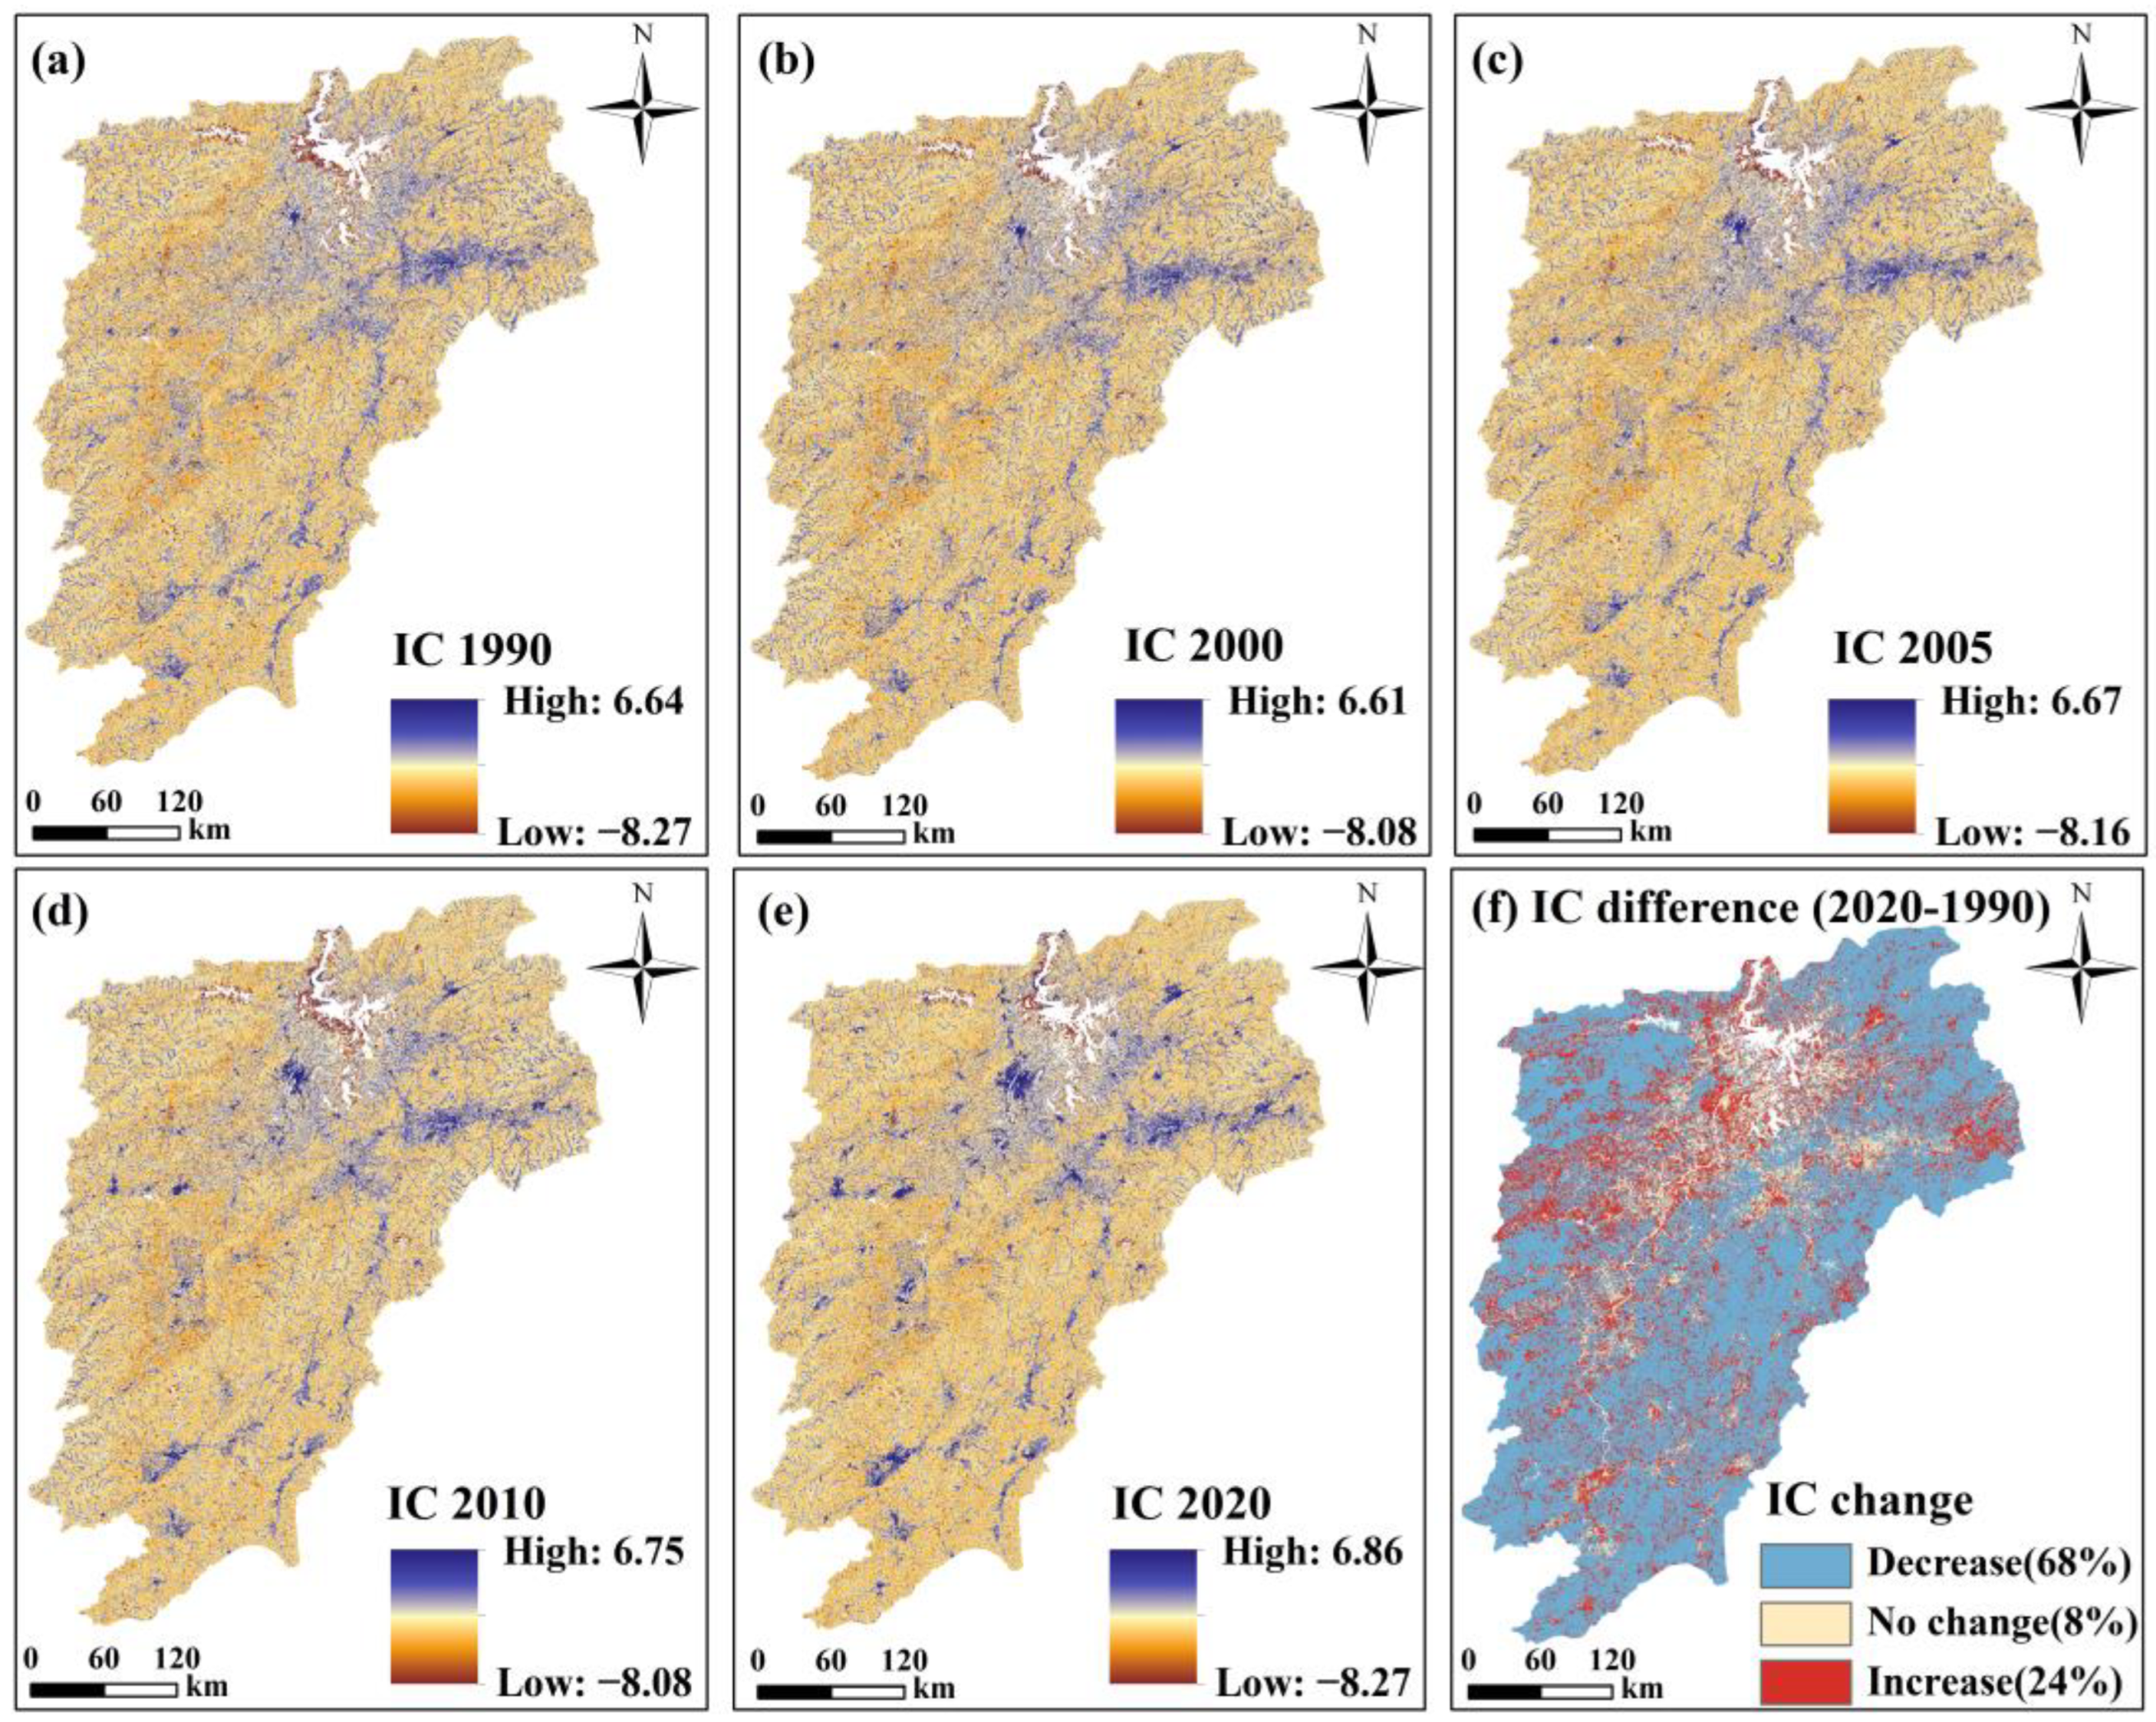
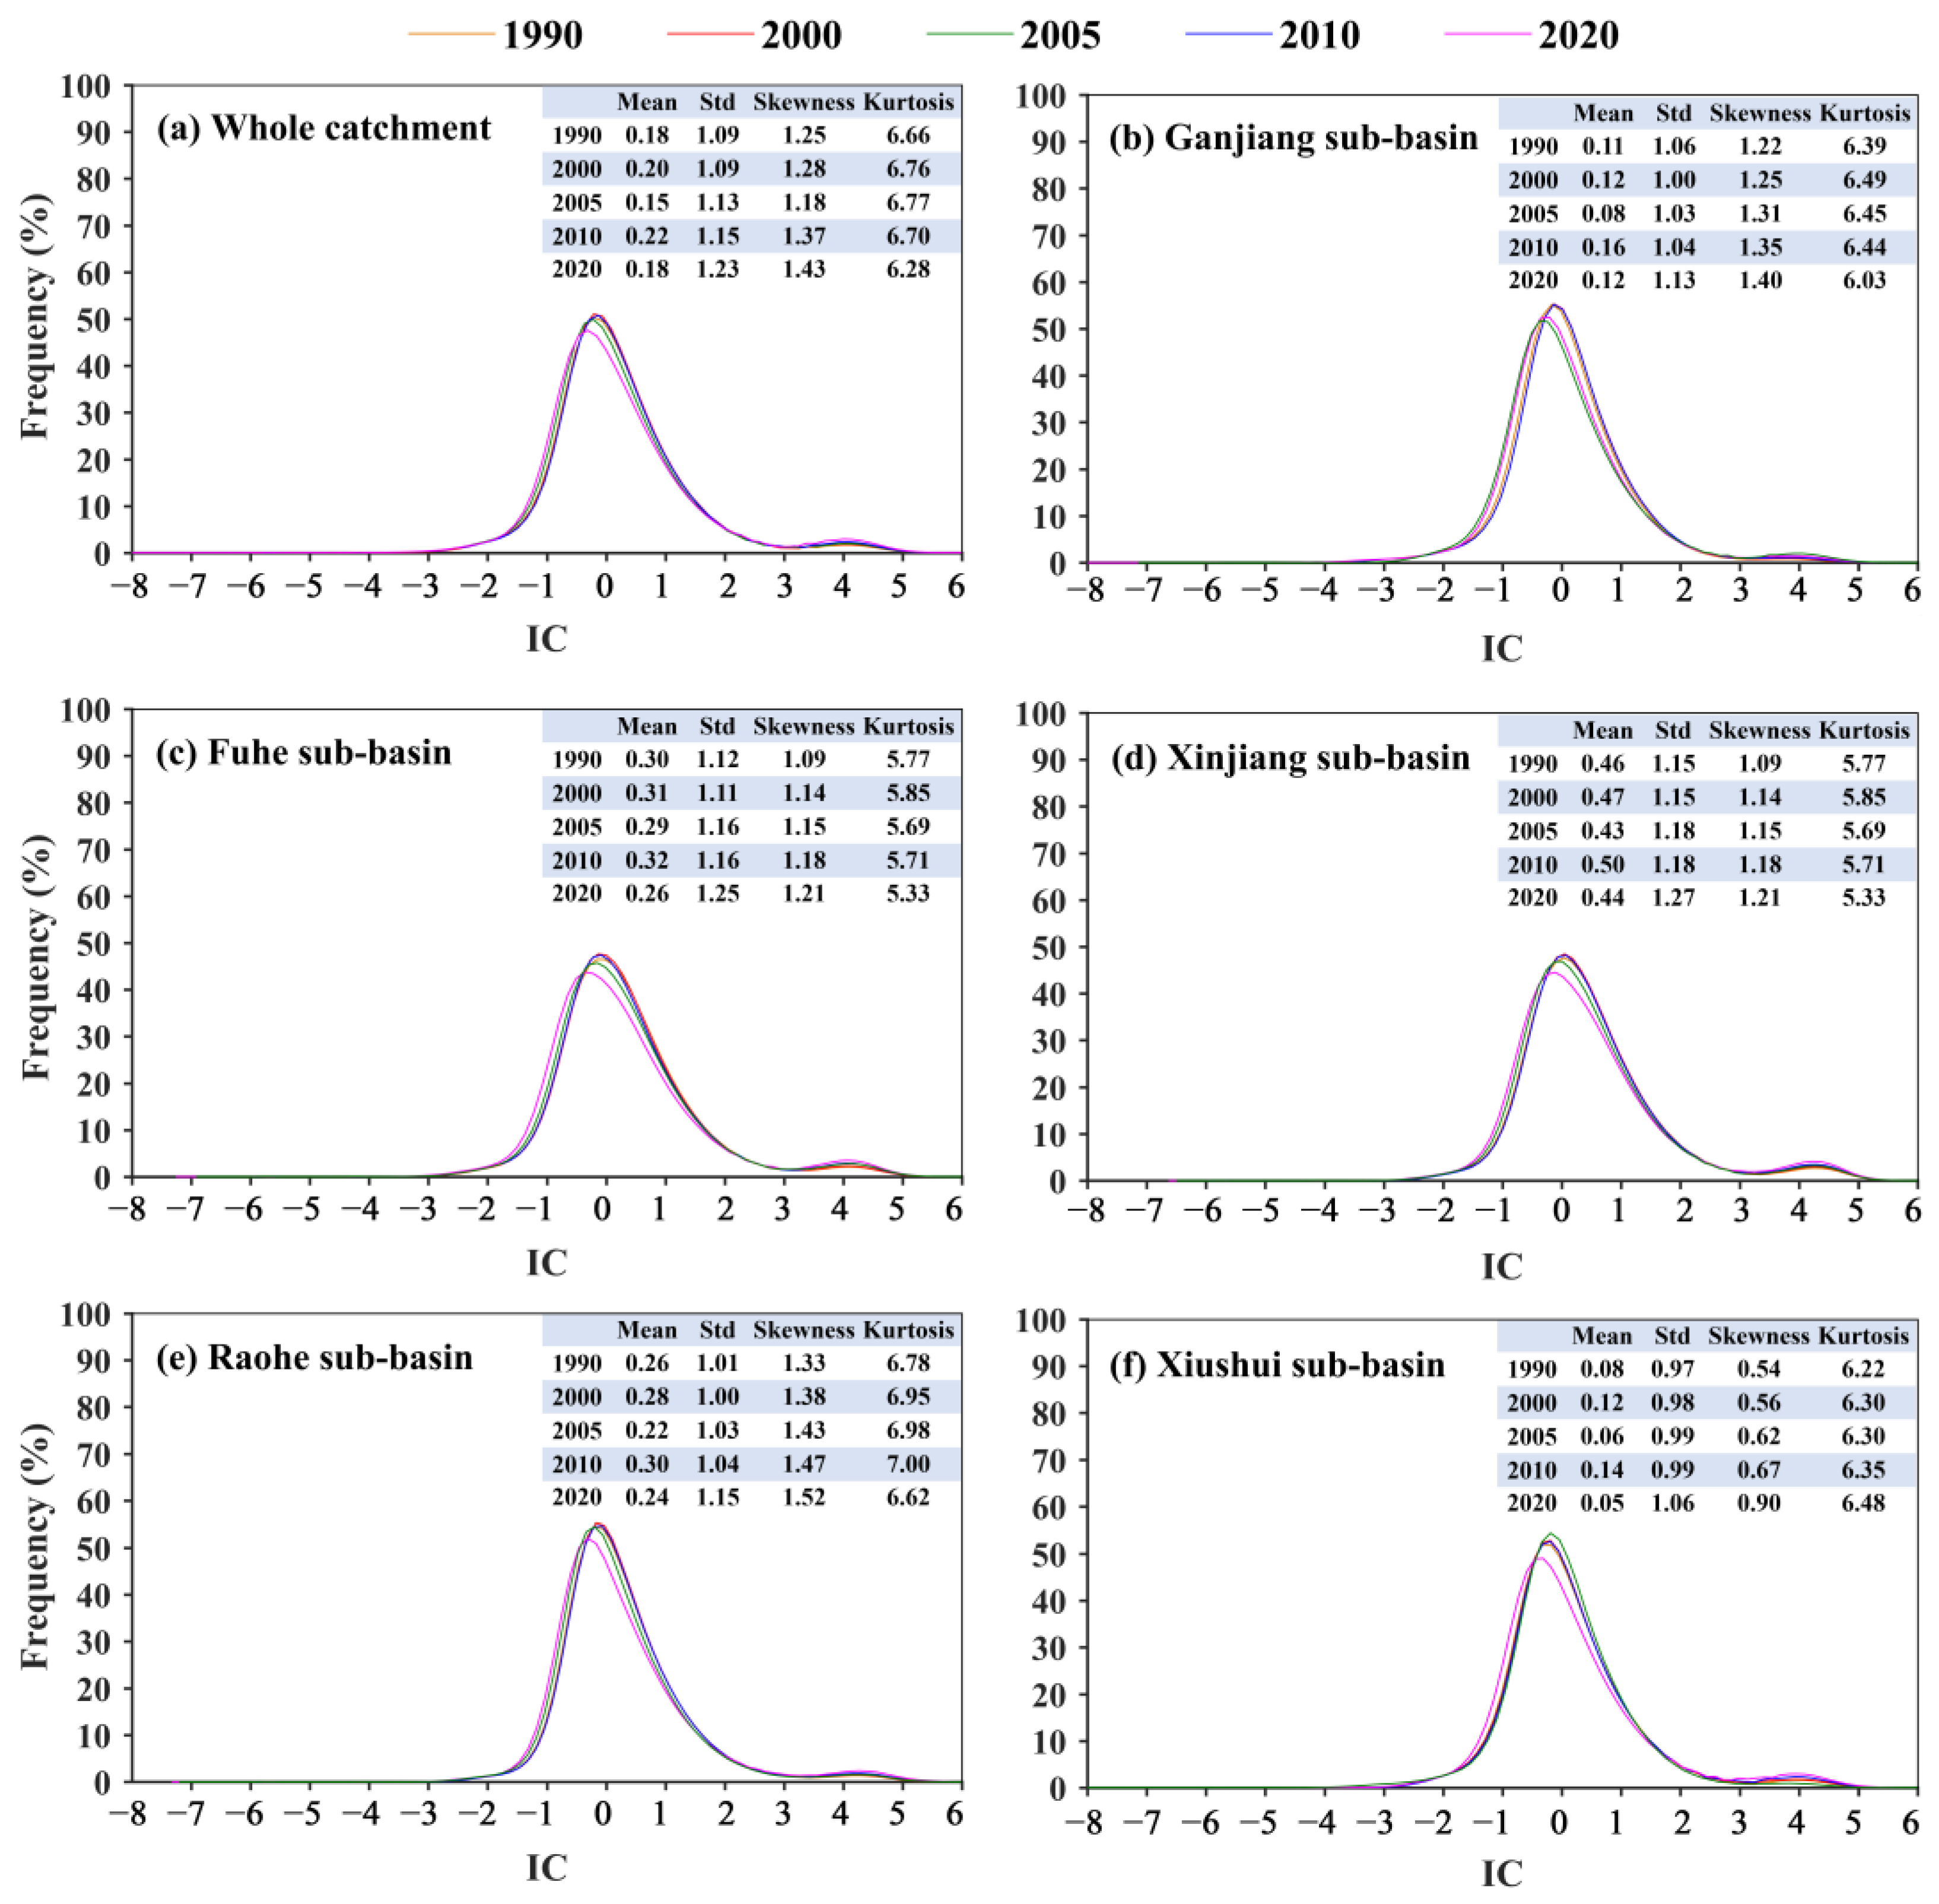
3.3.1. Spatiotemporal Changes in the IC Index

Figure 5 shows the spatial distribution of the IC in 1990, 2000, 2005, 2010, and 2020. Spatially, the results showed that the minimum IC value was −8.27 and the maximum IC value reached 6.86. The spatial distribution of IC in different years is uneven, and the high IC values are mainly distributed near the main river channel and landscapes with sparse vegetation, suggesting a strong ability of water and sediment migration (Figure 5). However, IC values in dense vegetation regions far from river channels are relatively low, indicating a weak role of the downstream sediment transport. In 1990 and 2000, the spatial distribution of the IC exhibited a generally similar pattern, with overall high values in the eastern region and low values in the western region (Figure 5a,b), while the IC values showed significant spatial heterogeneity after 2000. That is, high IC values are distributed around the northern lake and the southernmost catchment, while low IC values are distributed mainly in the central part of the catchment (Figure 5c–e). It can be observed that about 68% of the catchment had a decreasing trend in the IC, 24% of the catchment was characterized by an increasing trend in the IC, and 8% of the catchment exhibited almost no change in 2020, relative to the year 1990 (Figure 5f). The results presented here indicate that the IC of most of the Poyang Lake catchment has changed over the past 30 years, and the decrease in the IC is mainly observed in forest land, while the increasing areas are dispersed.
In order to quantitatively describe the functional connectivity within the catchment, the probability density distribution of the whole catchment and sub-basin IC values are shown in Figure 6. It was found that IC values across the catchment mainly range from −3 to 3, reflecting a positively skewed distribution curve with a kurtosis between 6 and 7 (Figure 6a). The distribution curve of IC values shifts significantly to the left after 2000, indicating a gradual decrease in both local and overall potential sediment delivery. It can be observed that the IC of each sub-basin conforms to positively skewed distribution, with minimal changes observed during 1990–2020 (Figure 6b–f). For example, the Xinjiang sub-basin has the highest mean IC value, mainly attributed to its sparse vegetation distribution and low elevation (Figure 6d). However, the lowest mean IC value is found in the Xiushui sub-basin, due to the distribution of dense vegetation cover and predominantly mountainous areas (Figure 6f). Therefore, the higher the vegetation cover, the lower the IC in the sub-basin. The results presented here demonstrate that the land use/cover in the catchment may play a key role in affecting hydrological functions.

3.3.2. Relationships between Connectivity, Land Use, Runoff, and Sediment

Figure 7 shows the IC distribution for different land use types during 1990–2020. It can be seen that the IC of forest and shrub in the Poyang Lake catchment is mainly distributed between −2 and 2 (Figure 7b,c), the IC of cropland and grassland ranges from −2 to 3 (Figure 7a,d), and the IC of barren and impervious is generally greater than 0 (Figure 7e,f). Furthermore, the IC of forest showed a decreasing trend, and the IC of barren land exhibited an obvious increasing trend. In general, a low IC is mainly distributed in forest and shrub areas, while a high IC is mainly concentrated in impervious and barren land. That is, the denser the vegetation coverage, the stronger the water and sediment interception ability. Bare land and vegetation can be used to represent ‘source’ and ‘sink’ of runoff and sediment production, respectively [13]. Bare land is the main source of flow and sediment production in the catchment, inducing a potential erosion risk across the catchment. In contrast, vegetation has a better water retention capacity and sediment interception, which can trap surface runoff and erosion sediment. Therefore, vegetation reduces the possibility for runoff sediment transport to the river, leading to a decrease in IC values.
The IC and annual runoff sediment discharge in 1990, 2000, 2005, 2010, and 2020 were used for the correlation analysis of the whole catchment and sub-basins (Figure 8). The correlation coefficients (r) of the IC with runoff and sediment discharge in the whole catchment are 0.6 and 0.7 (p < 0.05), respectively, indicating a certain positive correlation. Besides the Xiushui sub-basin, the r between the mean IC and annual runoff and sediment discharge of the other four sub-basins is high, showing a relatively consistent trend(Figure 8). Specifically, the r between the IC and annual runoff and sediment discharge in the Xinjiang sub-basin reaches 0.8, showing a good positive correlation (Figure 8). These findings reveal that the IC mean value in the Poyang Lake catchment can represent the transport capacity of runoff and sediment to a certain extent. Therefore, an increase or decrease in hydrological connectivity is connected to a greater or lesser likelihood of runoff and sediment reaching the river channel. This coincides with the fact that hydrological connectivity is likely to play an important role in predicting hydrological events, such as soil erosion and deposition.

4. Discussion

Changes in the catchment river system are affected by many potential factors, such as topography, climate change, flooding, and hydraulic facilities. Human activities are a major factor altering the hydrological connectivity of river network ecosystems [42]. The results of this study demonstrated that the structural connectivity of the Poyang Lake catchment has gradually improved during the past 30 years, especially in the 21st century. Human activities represented by water conservancy projects are the dominant factors affecting the evolution of river connectivity in the Poyang Lake catchment. In order to withstand natural disasters such as floods and droughts, water construction projects (e.g., the Ganfu levee) were gradually strengthened during 1990–2000 [43]. During the period of 2000–2010, key embankments in major tributaries and plains were successively raised and thickened [44]. In addition, flood control projects focusing on embankment construction were carried out in Jiangxi Province after the historic flood in 1998. It should be noted that the comprehensive implementation of the river chief system has enhanced the capacity to regulate the main streams and tributaries of the five rivers during 2010–2020 [45]. In 1990, there were about 18 large reservoirs and 180 medium-sized reservoirs in the Poyang Lake catchment [44]. The construction scale of reservoirs in the Poyang Lake catchment expanded after 2000 [46], and 30 large reservoirs and over 260 medium-sized reservoirs were built by 2020. Overall, the water conservancy engineering system of the Poyang Lake catchment has improved through the construction of reservoirs, gates, dikes, and other systems. In addition, the length and area of tributaries have increased rapidly over the past 30 years, ultimately forming the current pattern of the river system. This study suggests that river system changes have been primarily influenced by human activities in the Poyang Lake catchment during the last 30 years.
Topography and geomorphology have different influences on hydrological connectivity. For example, the IC shows considerable spatial heterogeneity in the Poyang Lake catchment, with areas near the channel having high connectivity, and regions far from the river channel having lower connectivity, which is generally consistent with previous findings [47]. In fact, land use types within the catchment may play a critical role in determining hydrological connectivity [48]. Figure 7 illustrates that land use types including shrub, forest land, and grassland exhibited lower IC values than land without vegetation cover (e.g., barren and impervious). Additionally, the IC showed a downward trend in most parts of the catchment during the past 30 years. During the period of 1980–2015, a large area of arable land in the catchment decreased and was mainly transformed into forest land and construction land. The forest coverage of the catchment increased from 33% in 1983 to over 63% in 2020 [49,50], suggesting that the IC was also influenced by the distribution of vegetation types. Therefore, the increase in vegetation coverage and the improvement of land use types in our study period enhanced the capacity of catchment soils to retain runoff and sediment, contributing dramatically to a substantial reduction in potential sediment production. The current results indicate that the IC mean values are correlated with runoff and sediment discharge in the catchment. The amount of sediment and runoff from the Poyang Lake catchment that five rivers discharged into the lake has decreased significantly since 2000 [51]. That is, as the hydrologic connectivity of the catchment decreases, the reduction in runoff inhibits sediment stripping and makes it more difficult to transport runoff sediment into the river. Therefore, to some extent the IC can effectively identify soil erosion conditions in the catchment and determine sediment sources and sediment transfer pathways so that action can be taken to reduce or enhance connectivity. Consequently, effective sediment management strategies can be developed by selecting key high- or low-IC-value areas, which can optimize future water and soil resource management, conservation, and restoration efforts.
Connectivity as a concept has been increasingly discussed in hydrology, ecology, and geomorphology [5]. In large and complex river systems, the hydrological structural connectivity and functional connectivity have received little attention, even though they have significant ecological and environmental implications. Compared with previous studies regarding river system structure and associated connectivity which only use some spatial analysis tools, this study applies the GEE software to extract river data by using a threshold method. However, the resolution of the dataset used in this study is not fine enough, and higher resolution products are needed to analyze hydrological connectivity in the future. Similarly, further work is needed to reveal the spatiotemporal evolution characteristics and factors controlling the river system. Additionally, it is also necessary to comprehensively consider the relationship between functional connectivity and runoff sediment discharge, and effectively integrate structural and functional connectivity. Consequently, it is challenging to combine both static and dynamic processes, and associated indicative significance.

5. Conclusions

Investigating the structural and functional connectivity across multiple space and time scales is a key requirement to the interpretation of processes within environmental regimes. This study identifies the characteristics and evolution of hydrological connectivity within a large catchment (Poyang Lake, China) using RS/GIS, landscape ecology, graph theory, and relevant evaluation indicators. The major findings of this work are as follows.
The river system of the Poyang Lake catchment exhibited distinct interannual changes during the past 30 years. Generally, the number and length of order I and order III rivers across the catchment showed a rising trend, while the main rivers remained relatively stable. The water–surface ratio, river development coefficient, density, and complexity demonstrated distinct increasing trends, but the change rate after the year 2000 was around two times that prior to 2000. Overall, the three structural characteristic indicators of network circuitry, edge–nodes ratio, and network connectivity tend to exhibit an increasing trend, characterized by a good connectivity condition. This study suggests that human activities (e.g., water conservation projects) are the dominant factors influencing the evolution of river system connectivity in the Poyang Lake catchment. In addition, the functional connectivity IC exhibited a declining trend in 68% of the catchment area. Spatially, the IC adjacent to the main river channel and the sparse vegetation area had higher values than that of the dense vegetation regions located far from the river channel. The better the vegetation cover, the lower the IC value in the area. The linkage between hydrological connectivity and associated runoff sediment discharge was characterized by a possible correlation relationship, demonstrating the importance of surface connectivity in soil erosion and water loss. In terms of eco-environmental management, structural and functional connectivity is crucial to provide a comprehensive understanding of connectivity and effective decision-making information.

Author Contributions

Conceptualization, B.Z. and Y.L.; methodology, B.Z. and Y.L.; software, B.Z. and Y.L.; validation, Z.T. and J.Y.; formal analysis, B.Z.; investigation, B.Z.; resources, Y.L.; data curation, B.Z.; writing—original draft preparation, B.Z.; writing—review and editing, Y.L.; visualization, Y.L.; supervision, Y.L.; project administration, Y.L.; funding acquisition, Y.L. All authors have read and agreed to the published version of the manuscript.

Funding

This research was funded by the National Key Research and Development Program (2022YFC3204104), the Youth Innovation Promotion Association of the CAS (Y9CJH01001), Jiangxi “Double thousand Plan” (jxsq2023101105), the Henan Province Key Science and Technology Program (222102320222), the National Natural Science Foundation of China (42071036, 42171104), and the Science Foundation of Nanjing Institute of Geography and Limnology, Chinese Academy of Sciences (NIGLAS2022GS08).

Conflicts of Interest

The authors declare no conflict of interest.

References

  1. Li, Y.; Li, J.; Li, Z.; Liu, X.; Tian, Y.; Li, A. Issues and challenges for the study of the interconnected river system network. Resour. Sci. 2011, 33, 386–391. (In Chinese) [Google Scholar]
  2. Li, P.; Xu, G.; Lu, K.; Zhang, X.; Shi, P.; Bai, L.; Ren, Z.; Pang, G.; Xiao, L.; Gao, H.; et al. Runoff change and sediment source during rainstorms in an ecologically constructed watershed on the Loess Plateau, China. Sci. Total Environ. 2019, 664, 968–974. [Google Scholar] [CrossRef] [PubMed]
  3. Pino, J.; Marull, J. Ecological networks: Are they enough for connectivity conservation? A case study in the Barcelona Metropolitan Region (NE Spain). Land Use Policy 2012, 29, 684–690. [Google Scholar] [CrossRef]
  4. Pringle, C. What Is Hydrologic Connectivity and Why Is It Ecologically Important? Hydrol. Process. 2003, 17, 2685–2689. [Google Scholar] [CrossRef]
  5. Wainwright, J.; Turnbull, L.; Ibrahim, T.G.; Lexartza-Artza, I.; Thornton, S.F.; Brazier, R.E. Linking environmental régimes, space and time: Interpretations of structural and functional connectivity. Geomorphology 2011, 126, 387–404. [Google Scholar] [CrossRef]
  6. Heckmann, T.; Cavalli, M.; Cerdan, O.; Foerster, S.; Javaux, M.; Lode, E.; Smetanová, A.; Vericat, D.; Brardinoni, F. Indices of sediment connectivity: Opportunities, challenges and limitations. Earth-Sci. Rev. 2018, 187, 77–108. [Google Scholar] [CrossRef] [Green Version]
  7. Najafi, S.; Dragovich, D.; Heckmann, T.; Sadeghi, S.H. Sediment connectivity concepts and approaches. Catena 2021, 196, 104880. [Google Scholar] [CrossRef]
  8. Zhang, Y.; Huang, C.; Zhang, W.; Chen, J.; Wang, L. The concept, approach, and future research of hydrological connectivity and its assessment at multiscales. Environ. Sci. Pollut. R. 2021, 28, 52724–52743. [Google Scholar] [CrossRef]
  9. Wohl, E.; Brierley, G.; Cadol, D.; Coulthard, T.J.; Covino, T.; Fryirs, K.A.; Grant, G.; Hilton, R.G.; Lane, S.N.; Magilligan, F.J.; et al. Connectivity as an emergent property of geomorphic systems. Earth Surf. Proc. Landf. 2019, 44, 4–26. [Google Scholar] [CrossRef] [Green Version]
  10. Ali, G.A.; Roy, A.G. Shopping for hydrologically representative connectivity metrics in a humid temperate forested catchment. Water Resour. Res. 2010, 46, 65–74. [Google Scholar] [CrossRef]
  11. Lane, S.N.; Brookes, C.J.; Kirkby, M.J.; Holden, J. A network-index-based version of TOPMODEL for use with high-resolution digital topographic data. Hydrol. Process. 2004, 18, 157–171. [Google Scholar] [CrossRef]
  12. Ludwig, J.A.; Eager, R.W.; Bastin, G.N.; Chewings, V.H.; Liedloff, C. A leakiness index for assessing landscape function using remote sensing. Landsc. Ecol. 2002, 17, 157–171. [Google Scholar] [CrossRef]
  13. Borselli, L.; Cassi, P.; Torri, D. Prolegomena to sediment and flow connectivity in the landscape: A GIS and field numerical assessment. Catena 2008, 75, 268–277. [Google Scholar] [CrossRef]
  14. Nicoll, T.; Brierley, G. Within-catchment variability in landscape connectivity measures in the Garang Catchment, upper Yellow River. Geomorphology 2017, 277, 197–209. [Google Scholar] [CrossRef]
  15. Persichillo, M.G.; Bordoni, M.; Cavalli, M.; Crema, S.; Meisina, C. The role of human activities on sediment connectivity of shallow landslides. Catena 2018, 160, 261–274. [Google Scholar] [CrossRef]
  16. Arabkhedri, M.; Heidary, K.; Parsamehr, M.R. Relationship of sediment yield to connectivity index in small watersheds with similar erosion potentials. J. Soil Sediment 2021, 21, 2699–2708. [Google Scholar] [CrossRef]
  17. Liu, W.; Shi, C.; Ma, Y.; Li, H.; Ma, X. Land use and land cover change-induced changes of sediment connectivity and their effects on sediment yield in a catchment on the Loess Plateau in China. Catena 2021, 207, 105688. [Google Scholar] [CrossRef]
  18. Shao, X.; Fang, Y.; Cui, B. A model to evaluate spatiotemporal variations of hydrological connectivity on a basin-scale complex river network with intensive human activity. Sci. Total Environ. 2020, 723, 138051. [Google Scholar] [CrossRef]
  19. Zhang, X.; Li, F.; Zhao, Y. Impact of changes in river network structure on hydrological connectivity of watersheds. Ecol. Indic. 2023, 146, 109848. [Google Scholar]
  20. Deng, X.; Xu, Y.; Han, L.; Yang, M.; Yang, L.; Song, S.; Li, G.; Wang, Y. Spatial–temporal evolution of the distribution pattern of river systems in the plain river network region of the Taihu Basin, China. Quatern. Int. 2016, 392, 178–186. [Google Scholar] [CrossRef]
  21. Hu, Q.; Feng, S.; Guo, H.; Chen, G.; Jiang, T. Interactions of the Yangtze River flow and hydrologic processes of the Poyang Lake, China. J. Hydrol. 2007, 347, 90–100. [Google Scholar] [CrossRef]
  22. Duan, W.; He, B.; Nover, D.; Yang, G.; Chen, W.; Meng, H.; Zou, S.; Liu, C. Water quality assessment and pollution source identification of the eastern Poyang Lake Basin using multivariate statistical methods. Sustainability 2016, 8, 133. [Google Scholar] [CrossRef] [Green Version]
  23. Chen, M.; Xu, X. Lake Poyang ecosystem services changes in the last 30 years. J. Lake Sci. 2021, 33, 309–318. (In Chinese) [Google Scholar]
  24. Li, X.; Zhang, Q.; Xu, C.-Y.; Ye, X. The changing patterns of floods in Poyang Lake, China: Characteristics and explanations. Nat. Hazards 2015, 76, 651–666. [Google Scholar] [CrossRef]
  25. Read, E.K.; Patil, V.P.; Oliver, S.K.; Hetherington, A.L.; Brentrup, J.A.; Zwart, J.A.; Winters, K.M.; Corman, J.R.; Nodine, E.R.; Woolway, R.I.; et al. The importance of lake-specific characteristics for water quality across the continental United States. Ecol. Appl. 2015, 25, 943–955. [Google Scholar] [CrossRef] [PubMed] [Green Version]
  26. Xia, Y.; Fang, C.; Lin, H.; Li, H.; Wu, B. Spatiotemporal evolution of wetland eco-hydrological connectivity in the Poyang Lake area based on long time-series remote sensing images. Remote Sens. 2021, 13, 4812. [Google Scholar] [CrossRef]
  27. Li, Y.; Zhang, Q.; Liu, X.; Tan, Z.; Yao, J. New Insights on the surface hydrological connectivity of water depth thresholds in a flood-pulse-influenced floodplain system (Poyang Lake, China). Stoch. Environ. Res. Risk A 2021, 35, 861–879. [Google Scholar] [CrossRef]
  28. Liu, Z.; Lu, J.; Huang, J.; Chen, X.; Zhang, L. Projection of reference crop evapotranspiration under future climate change in Poyang Lake watershed, China. J. Hydrol. Eng. 2021, 26, 05020042. [Google Scholar] [CrossRef]
  29. Wu, G.; Liu, Y.; Zhao, X.; Ye, T. Spatio-temporal variations of evapotranspiration in Poyang Lake Basin using MOD16 products. Geogr. Res. 2013, 32, 617–627. (In Chinese) [Google Scholar]
  30. Xiong, M. Impacts from Human Activities on Soil Erosion, Sediment Yield and Transport in Poyang Lake Basin. Master’s Thesis, Jiangxi Normal University, Nanchang, China, 2016. (In Chinese). [Google Scholar]
  31. Jiangxi Provincial Water Resources Department; Jiangxi Provincial Bureau of Statistics. Bulletin of the first water conservancy survey in Jiangxi Province. Jiangxi Hydraul. Sci. Technol. 2013, 39, 79–82. (In Chinese) [Google Scholar]
  32. Xu, D.; Lyon, S.W.; Mao, J.; Dai, H.; Jarsjö, J. Impacts of multi-purpose reservoir construction, land-use change and climate change on runoff characteristics in the Poyang Lake Basin, China. J. Hydrol. Reg. Stud. 2020, 29, 100694. [Google Scholar] [CrossRef]
  33. Deng, X. Correlations between Water Quality and the Structure and Connectivity of the River Network in the Southern Jiangsu Plain, Eastern China. Sci. Total Environ. 2019, 664, 583–594. [Google Scholar] [CrossRef] [PubMed]
  34. Wang, Y. The connectivity evaluation of Shanghai urban landscape eco-network. Geogr. Res. 2010, 28, 284–292. (In Chinese) [Google Scholar]
  35. Cai, C.; Ding, S.W.; Shi, Z.; Huang, L. Study of applying USLE and geographical information system IDRISI to predict soil erosion in small watershed. J. Soil Water Conserv. 2000, 14, 19–24. [Google Scholar]
  36. Li, M.; Wu, B.; Yan, C.; Zhou, W. Estimation of Vegetation fraction in the upper basin of Miyun reservoir by remote sensing. Resour. Sci. 2005, 26, 153–159. (In Chinese) [Google Scholar]
  37. Liu, S. Research on Hydrological Connectivity at Different Scales in Yanhe River Catchment. Master’s Thesis, Northwest A&F University, Xianyang, China, 2017. (In Chinese). [Google Scholar]
  38. Yang, J.; Huang, X. The 30 m annual land cover dataset and its dynamics in China from 1990 to 2019. Earth Syst. Sci. Data 2021, 13, 3907–3925. [Google Scholar] [CrossRef]
  39. Xu, H. Modification of normalised difference water index (NDWI) to enhance open water features in remotely sensed imagery. Int. J. Remote Sens. 2006, 27, 3025–3033. [Google Scholar] [CrossRef]
  40. Otsu, N. A threshold selection method from gray-level histograms. IEEE Trans. Syst. Man Cybern. 1979, 9, 62–66. [Google Scholar] [CrossRef] [Green Version]
  41. Deng, X. Changes of Pattern and Connectivity of River System and Its Impacts on Storage and Self-Purification Functions in the Taihu Plain. Master’s Thesis, Nanjing University, Nanjing, China, 2015. (In Chinese). [Google Scholar]
  42. Cote, D.; Kehler, D.G.; Bourne, C.; Wiersma, Y.F. A new measure of longitudinal connectivity for stream networks. Landsc. Ecol. 2009, 24, 101–113. [Google Scholar] [CrossRef] [Green Version]
  43. Kang, R.; Liao, J. 40 years of reform and opening up Jiangxi water conservancy business development achievements and thinking. Water Resour. Dev. Res. 2019, 19, 48–52. (In Chinese) [Google Scholar]
  44. Koci, J.; Sidle, R.C.; Jarihani, B.; Cashman, M.J. Linking hydrological connectivity to gully erosion in savanna rangelands tributary to the Great Barrier Reef using structure-from-motion photogrammetry. Land Degrad. Dev. 2020, 31, 20–36. [Google Scholar] [CrossRef]
  45. Wu, G.; Liu, Y.; Fan, X. Bottom topography change patterns of the Lake Poyang and their influence mechanisms in recent 30 years. J. Lake Sci. 2015, 27, 1168–1176. (In Chinese) [Google Scholar]
  46. Yang, X.; Lu, X. Drastic change in China’s lakes and reservoirs over the past decades. Sci. Rep. 2014, 4, 6041. [Google Scholar] [CrossRef] [Green Version]
  47. Yan, X.; Jiao, J.; Tang, B.; Liang, Y.; Wang, Z. Assessing sediment connectivity and its spatial response on land use using two flow direction algorithms in the catchment on the Chinese Loess Plateau. J. Mt. Sci. 2022, 19, 1119–1138. [Google Scholar] [CrossRef]
  48. Shi, Z.H.; Ai, L.; Li, X.; Huang, X.D.; Wu, G.L.; Liao, W. Partial least-squares regression for linking land-cover patterns to soil erosion and sediment yield in watersheds. J. Hydrol. 2013, 498, 165–176. [Google Scholar] [CrossRef]
  49. Zhang, Q.; Hu, M.; Qi, S.; Zhang, F. Analysis of land use change driven by policy in Jiangxi Province 1980-2005. Jiangxi Sci. 2011, 29, 597–602. (In Chinese) [Google Scholar]
  50. Zhao, Y.; Luo, Z.; Cao, L.; Chen, Z. Assessment of ecological risk in Poyang Lake Basin based on changes in land use. Acta Agric. Univ. Jiangxiensis 2018, 40, 635–664. (In Chinese) [Google Scholar]
  51. Tang, G.; Xu, W.; Hu, Z. Effect from forest vegetation improvement on runoff and sediment transport processes within Poyang Lake watershed. Water Resour. Hydropower Eng. 2017, 48, 12–21. (In Chinese) [Google Scholar]
Figure 1. Topography and major river distributions within the Poyang Lake catchment.
Remotesensing 15 03335 g001
Figure 2. Flow chart of the IC calculation for the hydrological connectivity analysis (different colors represent different data or processes. Rmask denotes the road mask map, Dirmask refers to the FlowDir mask map, and Rivermask represents the mask map obtained by performing flow accumulation on Dirmask.).
Remotesensing 15 03335 g002
Figure 3. Spatial distribution of different river orders in 1990, 2000, 2005, 2010, and 2020.
Remotesensing 15 03335 g003
Figure 4. Interannual change characteristics of river quantity (a) and morphometrics (b) during the study period.
Remotesensing 15 03335 g004
Figure 5. Spatial distribution of the calculated IC values during 1990–2020: the IC distribution maps for 5 periods during 1990–2020 (ae) and the spatial changes of IC during 1990–2020 (f).
Remotesensing 15 03335 g005
Figure 6. Probability density distribution and statistical characteristics of the IC for the whole catchment and different sub-basins during 1990–2020. (Std: Standard Deviation. When skewness = 0, the distribution is symmetric; when skewness > 0, the distribution is right-skewed; and when skewness < 0, the distribution is left-skewed. When kurtosis = 3, the distribution is normal; when kurtosis > 3, the distribution is steeper; and when kurtosis < 3, the distribution is flatter).
Remotesensing 15 03335 g006
Figure 7. IC distribution of different land use types of the Poyang Lake catchment during 1990–2020.
Remotesensing 15 03335 g007
Figure 8. Linear fitting of the IC with runoff (a) and sediment discharge (b) at different catchment scales, and associated correlation coefficients for runoff (c) and sediment discharge (d). Larger circles in (c,d) represent a strong influence of functional connectivity on runoff and sediment.
Remotesensing 15 03335 g008
Table 1. Characteristic indicators of structural river connectivity used in this study [33,34].
TypesIndicatorsComputational Methods
QuantityRiver density
Water surface ratio
R d = L / A
W p = A w A   ×   100 %
L is the total length of the river
A is the total area of the catchment
A w is the total area of the river
MorphometricRiver complexity
River development
coefficient
C R = N 0   ×   L / L m
K w = L t / L m
N 0 is the number of the river classes
L t is the total length of the tributary
L m is the total length of the main river
StructureNetwork circuitry α = ( l v + 1 ) / ( 2 v 5 ) l is the number of nodes
v is the number of river edges
Edge–nodes ratio β = l / v
Network connectivity γ = l / 3 ( v 2 )
Table 2. Changes in structural connectivity indicators for rivers of the Poyang Lake catchment.
Indicator19902000200520102020
Node number108110101115127
River edge number204207212221247
Network circuitry α0.460.460.570.480.49
Edge–nodes ratio β1.891.882.101.921.94
Network connectivity γ0.640.640.710.650.66
Disclaimer/Publisher’s Note: The statements, opinions and data contained in all publications are solely those of the individual author(s) and contributor(s) and not of MDPI and/or the editor(s). MDPI and/or the editor(s) disclaim responsibility for any injury to people or property resulting from any ideas, methods, instructions or products referred to in the content.

