Article

Modelling Spectral Unmixing of Geological Mixtures: An Experimental Study Using Rock Samples

1
Centre of Studies in Resources Engineering, Indian Institute of Technology Bombay, Mumbai 400076, India
2
Indian Institute of Information Technology, Sri City 517646, India
3
Udaipur Solar Observatory, Physical Research Laboratory, Udaipur 313001, India
*
Author to whom correspondence should be addressed.
Remote Sens. 2023, 15(13), 3300; https://doi.org/10.3390/rs15133300
Submission received: 10 May 2023 / Revised: 20 June 2023 / Accepted: 22 June 2023 / Published: 27 June 2023

Abstract

:
Spectral unmixing of geological mixtures, such as rocks, is a challenging inversion problem because of nonlinear interactions of light with the intimately mixed minerals at a microscopic scale. The fine-scale mixing of minerals in rocks limits the sensor’s ability to identify pure mineral endmembers and spectrally resolve these constituents within a given spatial resolution. In this study, we attempt to model the spectral unmixing of two rocks, namely, serpentinite and granite, by acquiring their hyperspectral images in a controlled environment, having uniform illumination, using a laboratory-based imaging spectroradiometer. The endmember spectra of each rock were identified by comparing a limited set of pure hyperspectral image pixels with the constituent minerals of the rocks based on their diagnostic spectral features. A series of spectral unmixing paradigms for explaining geological mixtures, including those ranging from simple physics-based light interaction models (linear, bilinear, and polynomial models) to classification-based models (support vector machines (SVMs) and half Siamese network (HSN)), were tested to estimate the fractional abundances of the endmembers at each pixel position of the image. The analysis of the results of the spectral unmixing algorithms using the ground truth abundance maps and actual mineralogical composition of the rock samples (estimated using X-ray diffraction (XRD) analysis) indicate a better performance of the pure pixel-guided HSN model in comparison to the linear, bilinear, polynomial, and SVM-based unmixing approaches. The HSN-based approach yielded reduced errors of abundance estimation, image reconstruction, and mineralogical composition for serpentinite and granite. With its ability to train using limited pure pixels, the half-Siamese network model has a scope for spectrally unmixing rock samples of varying mineralogical composition and grain sizes. Hence, HSN-based approaches effectively address the modelling of nonlinear mixing in geological mixtures.

1. Introduction

Hyperspectral imaging (HSI) technology has advanced significantly in the last two decades, providing high-quality images with contiguous and narrow spectral bands in the visible-near infrared (VNIR—0.4 to 1.0 µm), shortwave infrared (SWIR—1.0 to 2.5 µm), and thermal infrared (TIR—3 to 10 µm) regions. Recently, the HSI technology is being widely applied in the precise characterization of different surface materials, including rocks, soils, vegetation, and water [1,2,3,4,5,6,7,8,9,10,11,12,13,14,15]. Rocks are mixtures of minerals, which, in turn, are naturally occurring solid crystalline compounds, mainly silicates, with fixed chemical composition and crystal structures. Because minerals are characterized by specific crystal chemistry, they have diagnostic spectral features, which, if resolvable using remote sensing, can be used for remotely mapping of them. However, individual mineral grains are too small to be resolved by satellite-borne or even air-borne hyperspectral sensors, and, therefore, each pixel of a hyperspectral image corresponds to a mixture of minerals in different proportions. The hyperspectral pixel spectrum is generally composed of a mixture of the spectra of individual mineral grains (or endmembers), which are then unmixed to identify the mineral components and to estimate their fractional abundances, thus mapping the rock unit comprising the pixel.
In summary, the reflectance spectrum of a mixture is a combination of the reflectance spectra of the constituent endmembers weighted by their fractional abundance [16,17]. A spectral mixture is linear if the mixture spectrum is a linear combination of the spectra of its constituent endmembers [18]. The linear mixing model assumes that each incident photon interacts with one and only one endmember [19]. Such mixtures are macroscopic in nature, where the fractional abundances of a pixel’s constituents can be expressed as a linear combination of their areal coverage, as in areal mixing [17].
Nonlinear spectral mixing occurs due to the interaction of an incoming photon with multiple endmembers before reaching the sensor [4]. This intimate nature of mixing can be modelled as linear mixing associated with a nonlinear function, which can be additive, multiplicative, polynomial-based, or a combination of them, based on the physics-driven model parameters, describing the nonlinear interaction of light. A commonly assumed type of nonlinear mixing is the volumetric type exhibited at multi-layered scales when photons undergo multiple scattering and transmission from one or more endmembers prior to being received by the sensor, which is termed as multi-layered or volumetric mixing [20,21]. Several workers have attempted the modelling of multi-layered spectral mixing under the assumption that the light received at the sensor is a nonlinear composite of second-order interaction; these constitute the class of bilinear mixing models [22,23,24,25,26,27]. Interactions of orders greater than two are neglected because of the diminishing radiant energy. These models are associated with an additive bilinear component to linear mixing that describes the second-order interactions.
A different class of models for multi-layered mixing is the post nonlinear mixing models (PNMMs) involving linear and quadratic functions of the fractional abundances. Polynomials, sigmoidal functions, and their combinations have shown remarkable properties for endmember source separation problem [28]. For nonlinear mixing at a macroscopic scale, it is reasonable to employ polynomials of first- and second-order terms, as described in the works by Altmann et al. [29,30].
Nonlinear mixing is approached at a different perspective when the endmembers are mixed at spatial scales much smaller than the path length of incident photons [31]. Such nonlinear effects, produced due to intimate or homogeneous mixing at a microscopic scale, exhibit optical interaction at a surface level, known as albedo or surface mixing. This mixing is prevalent in geological materials, such as rock samples and mineral mixtures [16,32,33,34,35]. Hapke [36] derived solutions of Chandrasekhar’s radiative transfer theory for particulate surfaces and further associated the parameters of the mixing model to physical properties of the surface and optical properties of the constituent endmembers, which can be applied to both monomineralic and multimineral mixtures [37].
The nonlinear mixture models discussed above are applicable to geological mixtures (or rocks) depending on their composition and scale of viewing. These models are subjected to the physics-based constraints on fractional abundances as: (1) abundance nonnegativity (ANC) and (2) abundance sum-to-one (ASC). For a mixed pixel, the fractional abundances are estimated by inverting the mixing models applied, i.e., whether linear or non-linear; this is also known as spectral unmixing.
Spectral unmixing can be supervised, semi-supervised, or unsupervised. Supervised techniques are used for estimating the fractional abundances of endmembers based on a-priori knowledge of their occurrence and spectral signatures. Various supervised unmixing techniques have been reviewed [38,39] based on numerical and statistical approaches [24,26,27,29,40,41,42], geometrical methods [43,44,45,46,47,48,49], data-guided sparsity models [50,51], factorization-based algorithms [52,53,54], and interpolation-based approaches [55,56,57,58].
Semi-supervised and unsupervised unmixing techniques do not rely on prior information of endmembers or abundance distribution. These approach the unmixing as a sparse regression (SR) problem, where the spectral libraries are employed to find the optimal subset of the endmember signatures that can best model each mixed pixel of an image [59,60,61,62,63,64,65]. Although the SR-based unmixing approaches do not require pure spectral signatures, they have few potential drawbacks—(1) the spectra of library endmembers are typically acquired under controlled laboratory environment, which may not be the same as the natural environment under which remote sensing images are acquired, (2) inability to obtain sparse solutions for an undetermined system of mixing equations, and (3) higher computational time associated with such unmixing with a large endmember library [60,66]. Unsupervised techniques also approach the unmixing as a blind source separation (BSS) problem that aims to decompose mixed pixels into the collection of endmembers and their fractional abundances [67,68,69,70,71]. However, BSS-based spectral decomposition results in spectral signatures that may not be physically interpretable. Other unsupervised techniques include classification and clustering approaches [72,73,74,75,76,77] that assume the presence of endmembers within the image. However, these approaches may not be pragmatic for real hyperspectral images.
In recent years, a large number of studies documenting the application of machine learning to spectral unmixing have been published [78,79,80,81,82,83,84,85,86]. The nonlinear unmixing of hyperspectral images has been comprehensively reviewed in the work of Heylen et al. [87]. Improvement in the unmixing performances using convolution-based deep networks have been reported in the recent literature [88,89,90,91,92,93,94,95,96,97,98,99].
Spectral unmixing of geological mixtures, such as rocks and soils, pose a complex problem, particularly because these mixtures are typically at microscopic scale, and the endmembers have different grain sizes, shapes, abundances, and natural composition variabilities [19,66,70,100,101,102,103]. Linear spectral unmixing models are typically not applicable to the unmixing of nonlinearly mixed geological mixtures. In this work, we report an experimental study of spectra of selected geological mixtures with known endmembers with the objective of identifying the spectral mixing models that can best represent these mixtures and their subsequent inversions. The proposed modelling approaches consider the limited availability of spectrally pure pixels on the acquired images. The subsequent section of the paper describes the instrumentation used for data-acquisition and methods used for generating geological mixture samples. In Section 3, we apply some of the selected state-of-art unmixing techniques on the samples and discuss their performances in Section 4. The key outcomes are summarized in Section 5, followed by concluding remarks.

2. Methodology

2.1. Instrumentation

A schematic representation of the experimental setup is shown in Figure 1. An imaging spectroradiometer setup, consisting of a laboratory spectroradiometer, a stage translatable along the three spatial dimensions, an instrument controller, and a source of light supplying uniform and stable illumination across the visible and infrared regions were used for spectral acquisition of rock samples. The spectroradiometer had a full range of spectral acquisition from 0.35–2.5 µm at 1 nm spectral resolution. The stage was used to systematically acquire point spectra for a given rock sampled at 1 mm interval along the two planar axes by horizontal translation, while the movement along the vertical axis was used to control the sensor’s field of view (FOV) by varying the sensor’s height from the reflecting surface with a subtending angle of 25°.

2.2. Rock Samples

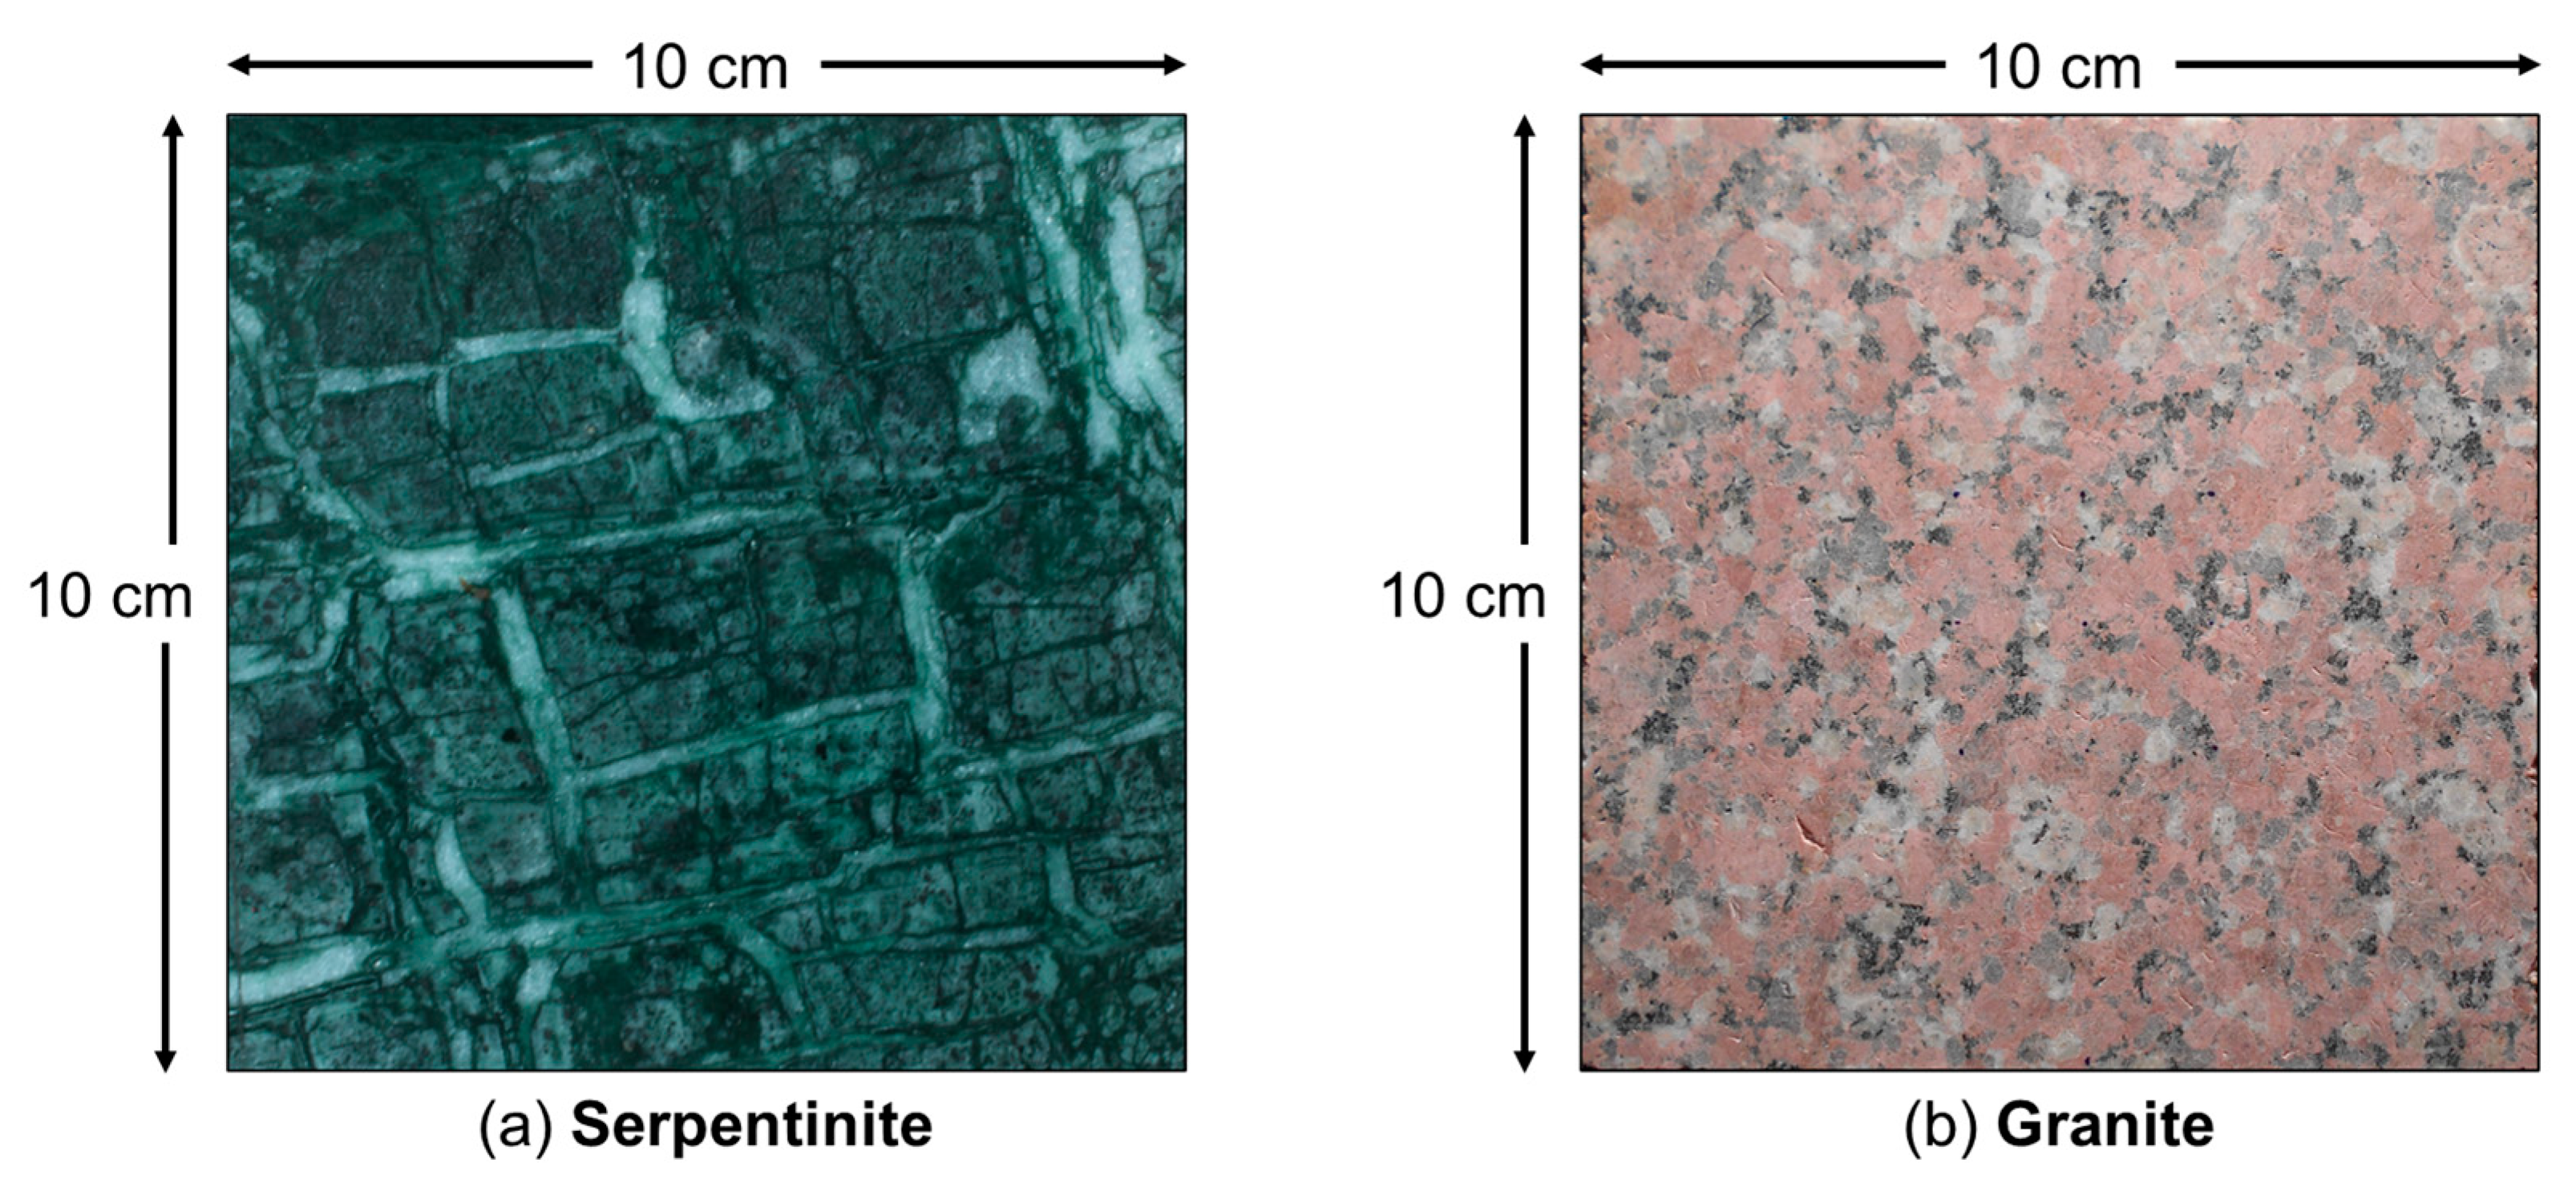
The rock samples used in the experiment were serpentinite (Figure 2a) and granite (Figure 2b). Serpentinite is a metamorphic rock derived from the hydrothermal alteration of ultramafic rocks and contains very little silica (<45%). It is composed of ferromagnesian minerals (Fe-Mg rich), such as the serpentine group (antigorite, lizardite, and chrysotile), along with accessory minerals, such as calcite, talc, chromite, magnetite, etc. Granite, on the other hand, is a high-silica felsic igneous rock (>65% SiO2) and is composed of felsic minerals, such as quartz and feldspars, along with accessory mica and hornblende.

2.3. Proposed Methodology

The proposed methodology is summarized in Figure 3. The serpentinite and granite rock samples were divided into two groups for implementing two different pipelines. The first pipeline was used for identifying the mineral constituents (or physical endmembers) of the rock samples using a hand lens, X-ray diffraction (XRD) analysis, and geochemical analysis using an electron probe micro-analyzer (EPMA). The reflectance spectra of the pure mineral constituents were used as reference spectra in the subsequent analysis.
The second pipeline acquired their hyperspectral images. A 10-by-10 cm tile was cut out of each rock sample. The experimental setup described above was used to acquire reflectance spectra at uniform intervals of 1 mm along the X and Y axes. The spectra were acquired at a sensor height of 2 mm from the tile surface to minimize the point-spread effects. The point spectra were then mosaiced to generate hyperspectral image cubes at 1 nm spectral resolution and 1 mm spatial resolution. The spatial and spectral dimensions of the image cubes were 100-by-100 pixels and 2151 bands, respectively.
Pure pixels were extracted from these image cubes using the pixel purity index (PPI) algorithm [104]. The PPI algorithm was implemented by selecting spectrally pure pixels that are located at the extreme ends of the defined convex hull in the principal component (PC) space. These pure pixels were spectrally matched with the reflectance spectra of the mineral constituents, i.e., the reference spectra, to generate image endmembers. These image endmembers were subsequently used for spectral unmixing of the hyperspectral images.
We applied and tested a number of established spectral unmixing algorithms, ranging from the simplistic physics-based models—linear [105], bilinear [23,24], and polynomial-based [29,106]—to pure pixel-guided training-based models, namely, support vector machines (SVMs) [45,107,108] and the half Siamese network (HSN) [98]. The details of the algorithms and their pseudocodes can be referred to from the above-cited publications.
Linear, bilinear, and polynomial-based unmixing techniques were applied on each pixel with a set of image endmembers that had a maximum spectral similarity with it. These techniques iteratively obtained fractional abundances for each pixel by minimizing the least squares error constrained with the physical laws of ANC and ASC and nonlinearity parameters associated with the latter two techniques. Thus, they required more computational time to provide converging solutions. The SVM-based unmixing technique was cross-validated on the pure pixels for each image endmember class using a one vs. rest approach, which maximized the margin of the decision boundary. Using a 5-fold cross-validation, we optimized the hyperparameters of soft margin-based box constraint = 10, regularization parameter = 0.2, and radial basis kernel function that linearly separated the endmember latent representations. The spectrally mixed pixels projected onto the latent space were estimated for fractional abundances based on the learned model weights.
For the HSN model, the spectra of distinct endmember bundles were fed into the endmember guided network and trained for unit fractional abundance maximizing the spectral similarity with an alternatively chosen pure pixel for the same endmember class. The model was trained for 100 iterations with a batch size of 10. The trained HSN model was used on mixed pixels to estimate their fractional abundances using the reconstruction network. The performance of SVM and HSN models depended on the model parameters and the input endmembers’ spectra.
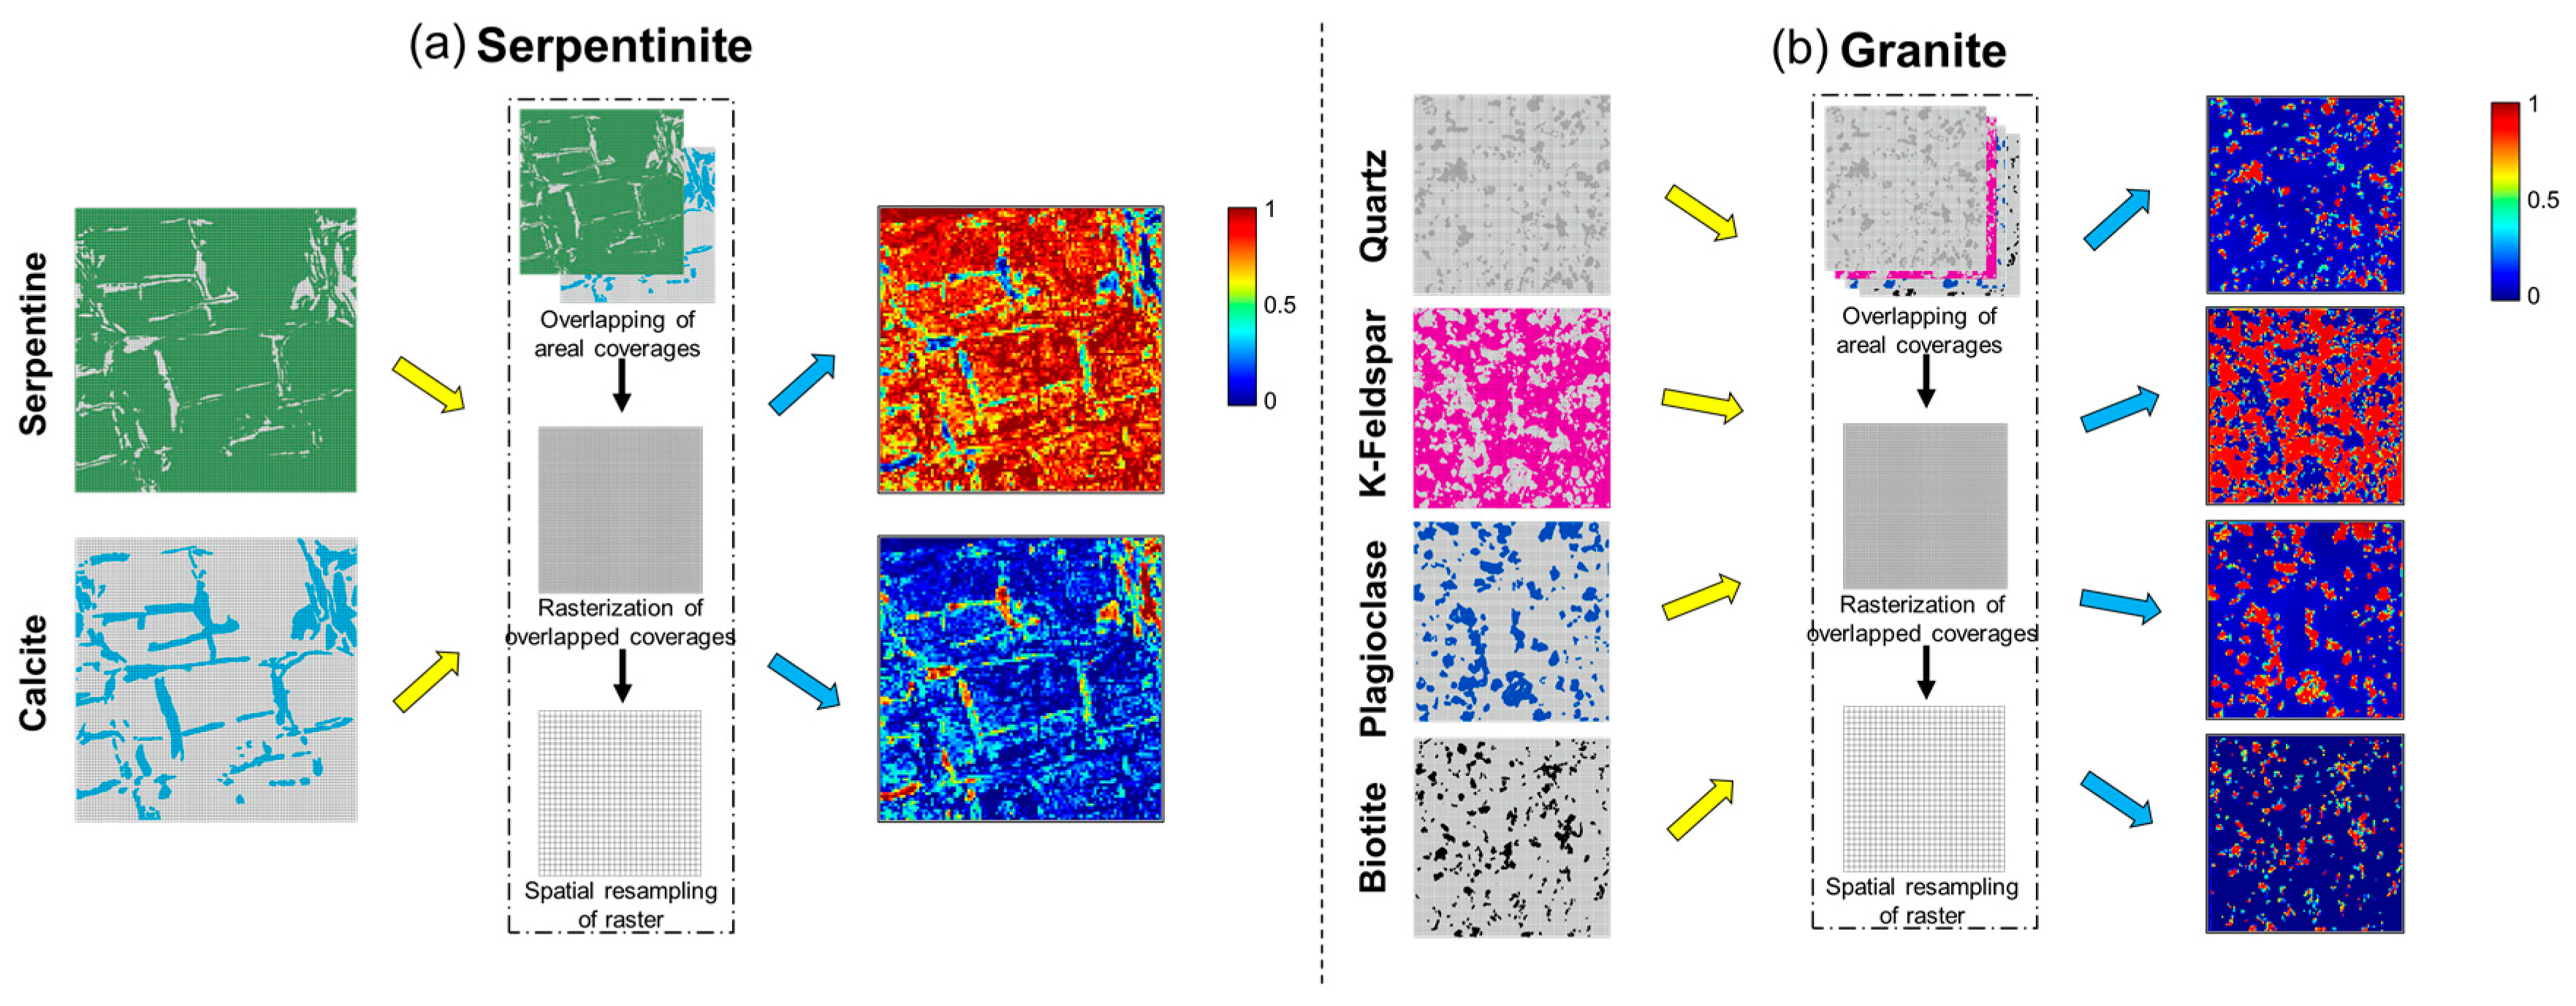
The outputs of the spectral unmixing algorithms were the fractional abundance maps for each of the constituent minerals. These fractional abundance maps were compared with the ground truth, i.e., the actual abundances of different minerals in each tile. The ground truth fractional abundances were determined by the endmembers’ areal coverage for the pixel [31]. For serpentinite and granite, the grains for each constituent mineral were traced on individual transparent sheets that provided mineral maps. These maps were digitized, registered, and rasterized at the hyperspectral image resolution. The fractional abundances of the minerals were estimated for each pixel by overlapping the mineral maps and calculating their areal coverages, thus generating the “ground truth” for assessing the performance of spectral unmixing algorithms. Figure 4 illustrates the procedure used for generating the ground truth images.
With a discussion on spectral characterization of mineral constituents affecting the unmixing, we evaluated the performances of different algorithms using the metrics of root mean squared error (RMSE) and average reconstruction error (ARE) with respect to the ground truth abundances. Further comparison of our estimated fractional abundances with the XRD analysis-based mineralogical composition validated our results.

3. Results

3.1. Identification of Minerals

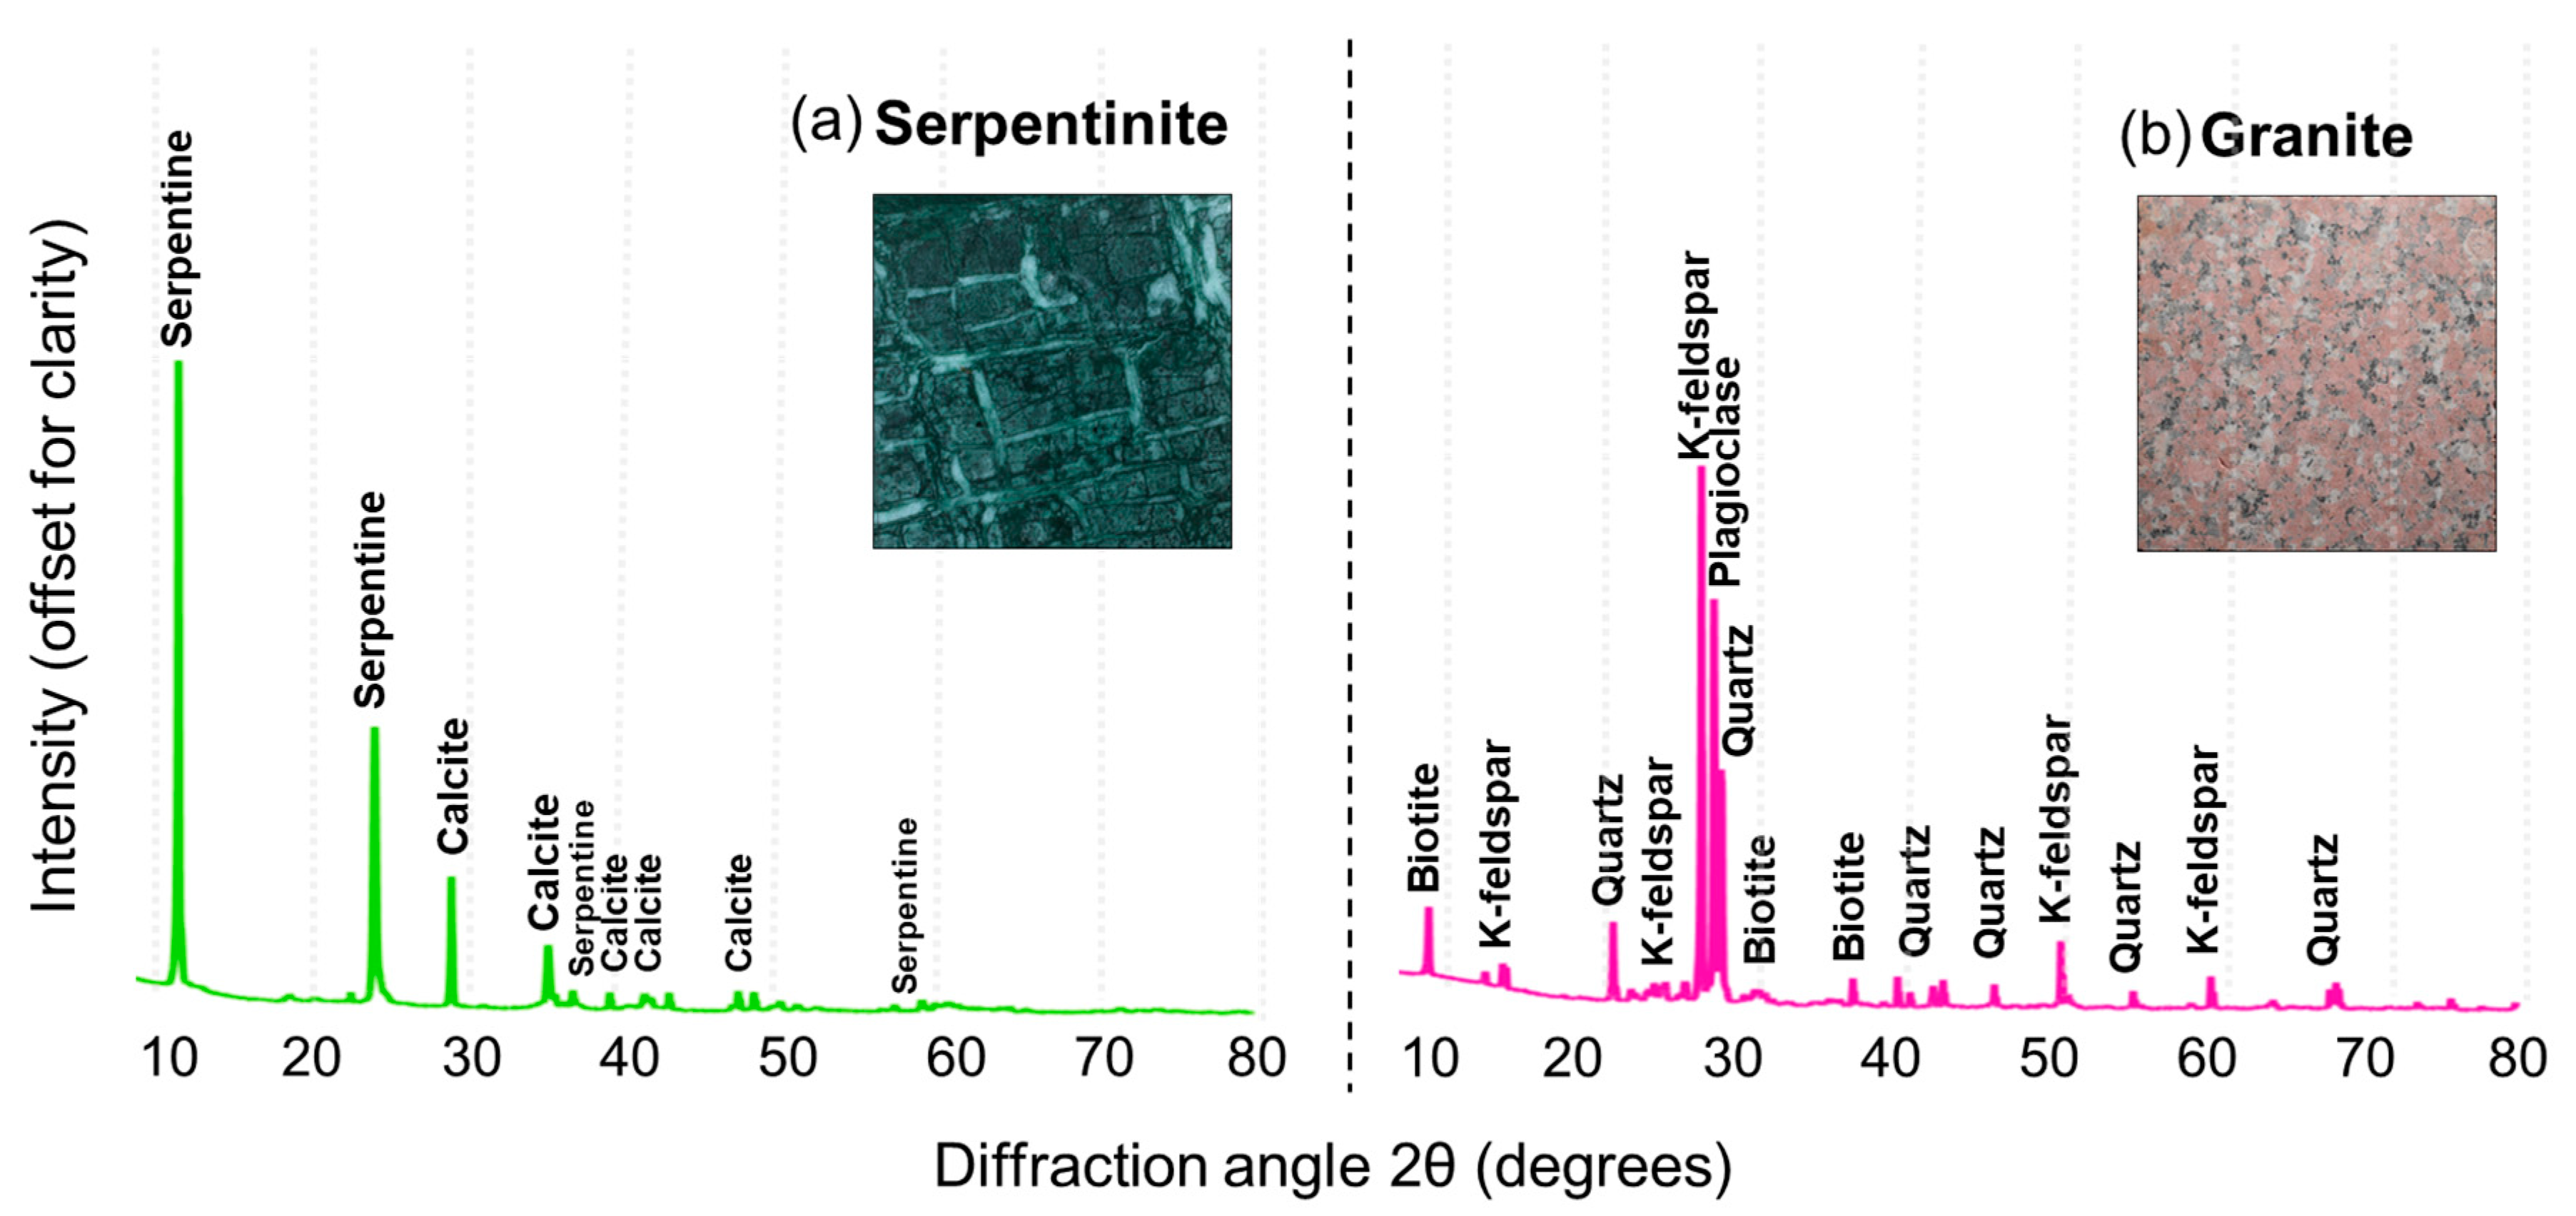
The XRD analyses on the powdered samples (<75 µm) of serpentinite and granite reveal the mineralogical composition present in these rock samples (Figure 5), while EPMA estimates their geochemical composition (Table 1). Serpentinite is composed of an intimately mixed serpentine group of minerals (primarily chrysotile) and calcite, with a higher percentage of Mg and Fe diagnostic to altered ultramafic rocks. Calcite is observed as white veins crisscrossing the grains of serpentine minerals [109]. Granite is composed of four major minerals—quartz, K-feldspar, plagioclase, and biotite, with distinguishable grain boundaries at spatial scales in order of millimeters. The percentage compositions of Si, Al, and Na are higher for felsic minerals (quartz, K-feldspar, plagioclase), while biotite reports a significant Fe composition. The reflectance spectra of pure minerals acquired using the spectroradiometer were used for identifying pure pixels obtained from hyperspectral images, as discussed in the next section.

3.2. Pure Pixels Mapping

Figure 6 shows the extraction and mapping of pure pixels identified from the hyperspectral images of serpentinite and granite onto the respective minerals. The pure pixels extracted from the hyperspectral images of serpentinite and granite using the PPI algorithm constitute a very small proportion (~0.5%) of the total number of pixels. For the serpentinite tile, 28 pixels are found to be spectrally pure, from which 12 are classified for serpentine and 16 for calcite (Figure 6a). We found fifty-seven pure pixels on hyperspectral image of granite, from which four are classified for quartz, eight for K-feldspar, twenty-five for plagioclase, and twenty for biotite (Figure 6b). Spectral matching has been performed jointly using a spectral angle mapper (SAM) and spectral feature fitting (SFF) to reduce the misclassifications for pixels having high spectral similarities among them. Visual examination of the mapped pure pixels and their spatial locations in the tile sample further validated accurate endmember classification, and, hence, were used as image endmembers that facilitated spectral unmixing.

3.3. Spectral Unmixing

Spectral unmixing techniques applied for the hyperspectral images of serpentinite and granite tiles predicted the fractional abundances of each endmember for each pixel.
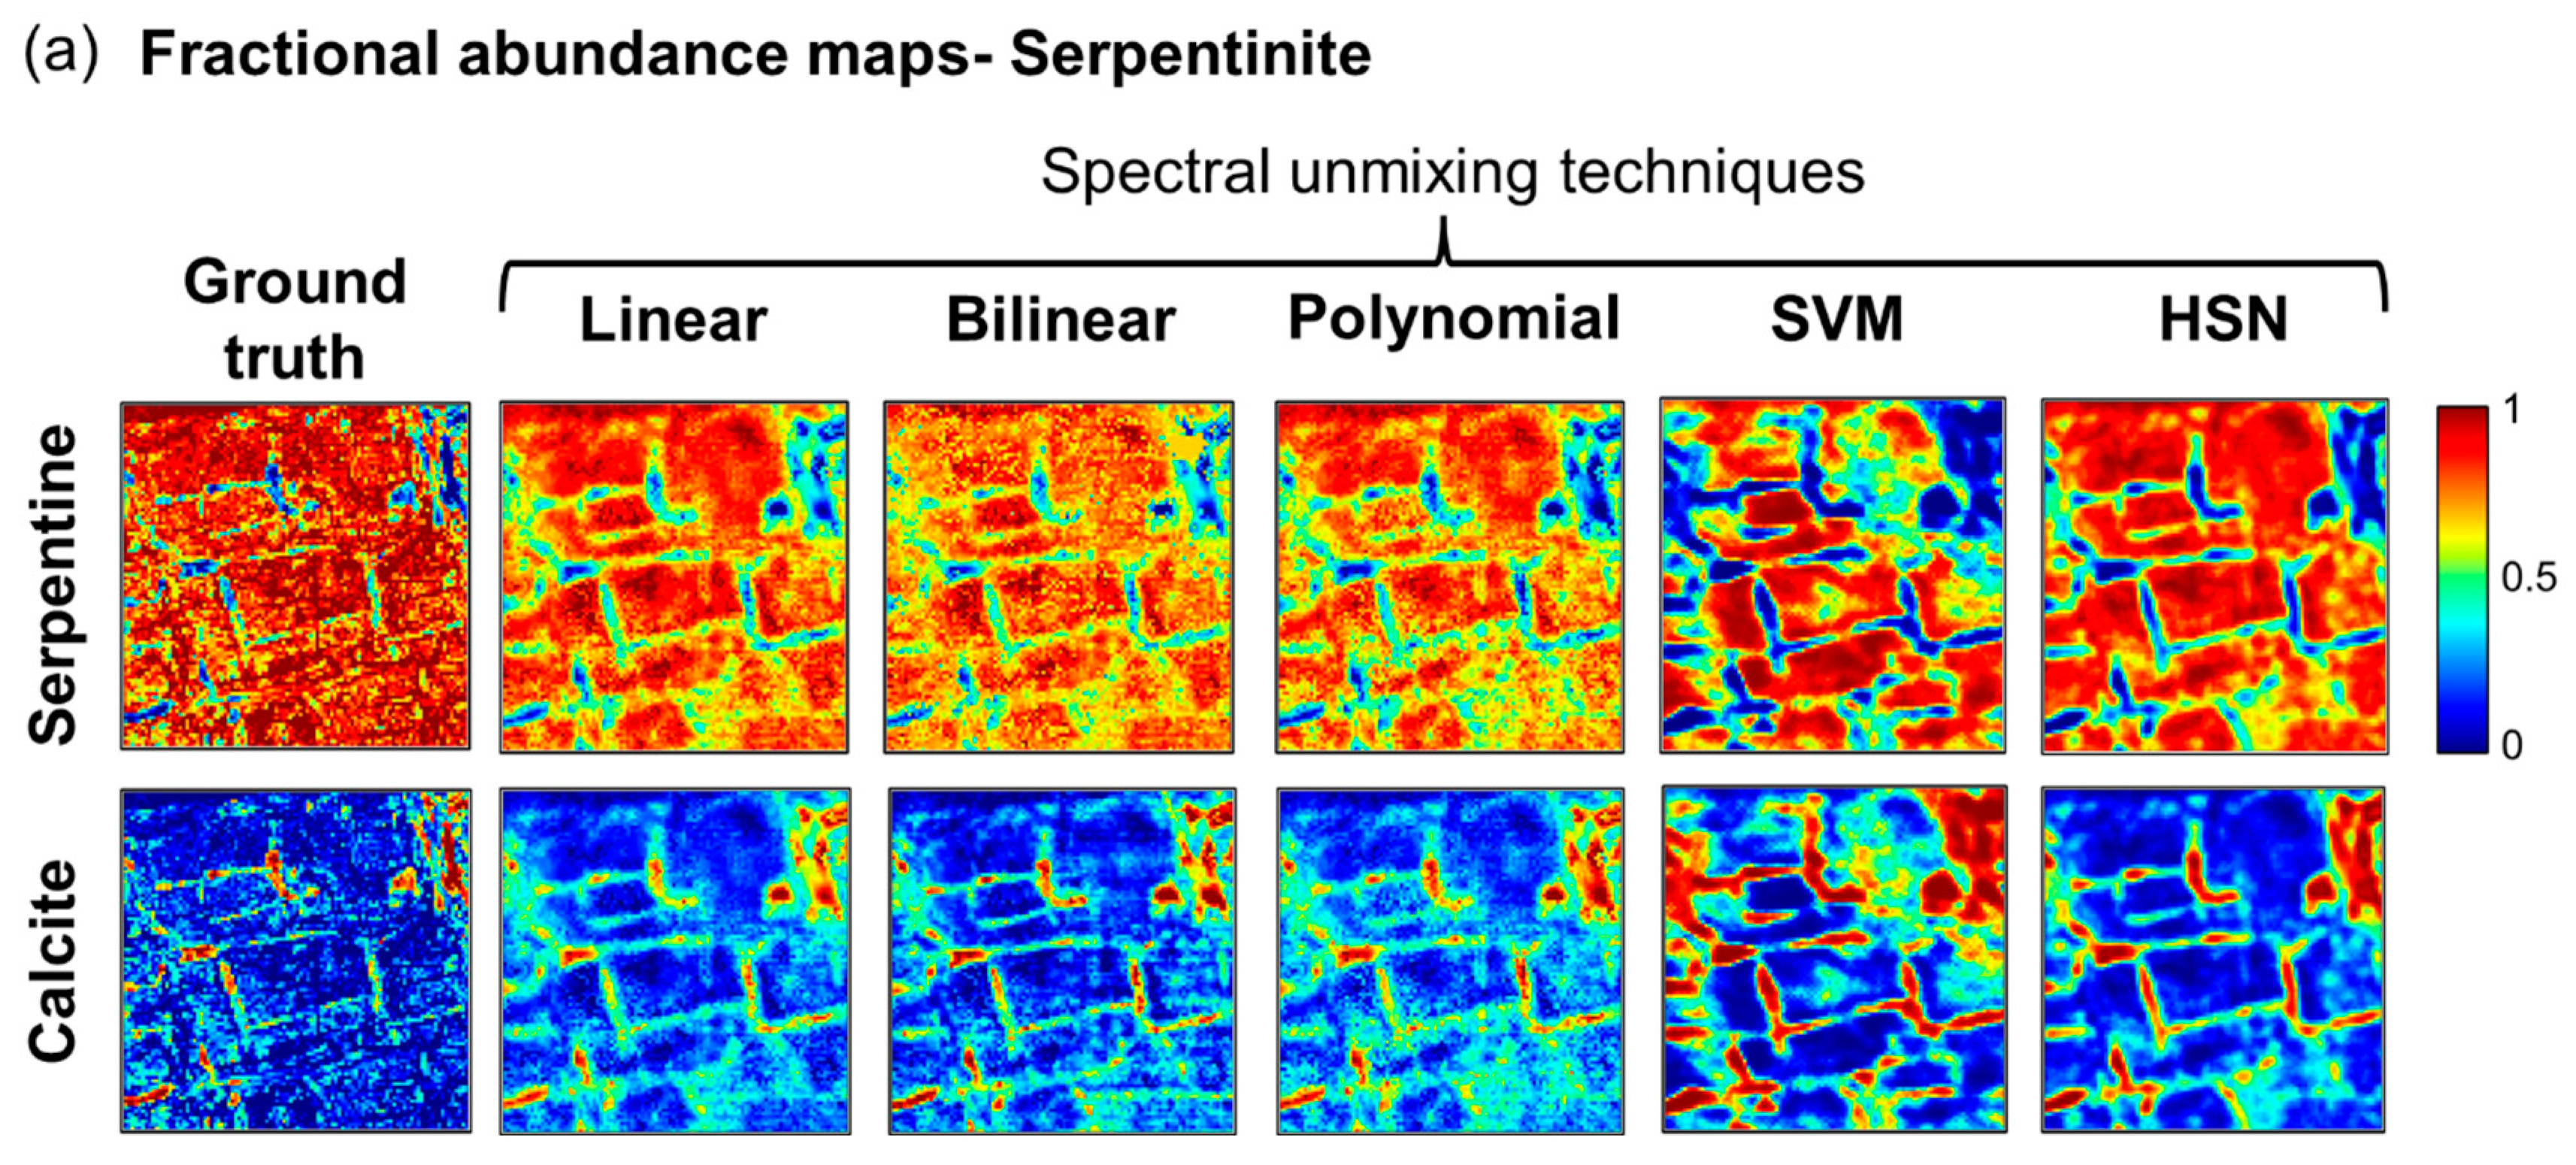
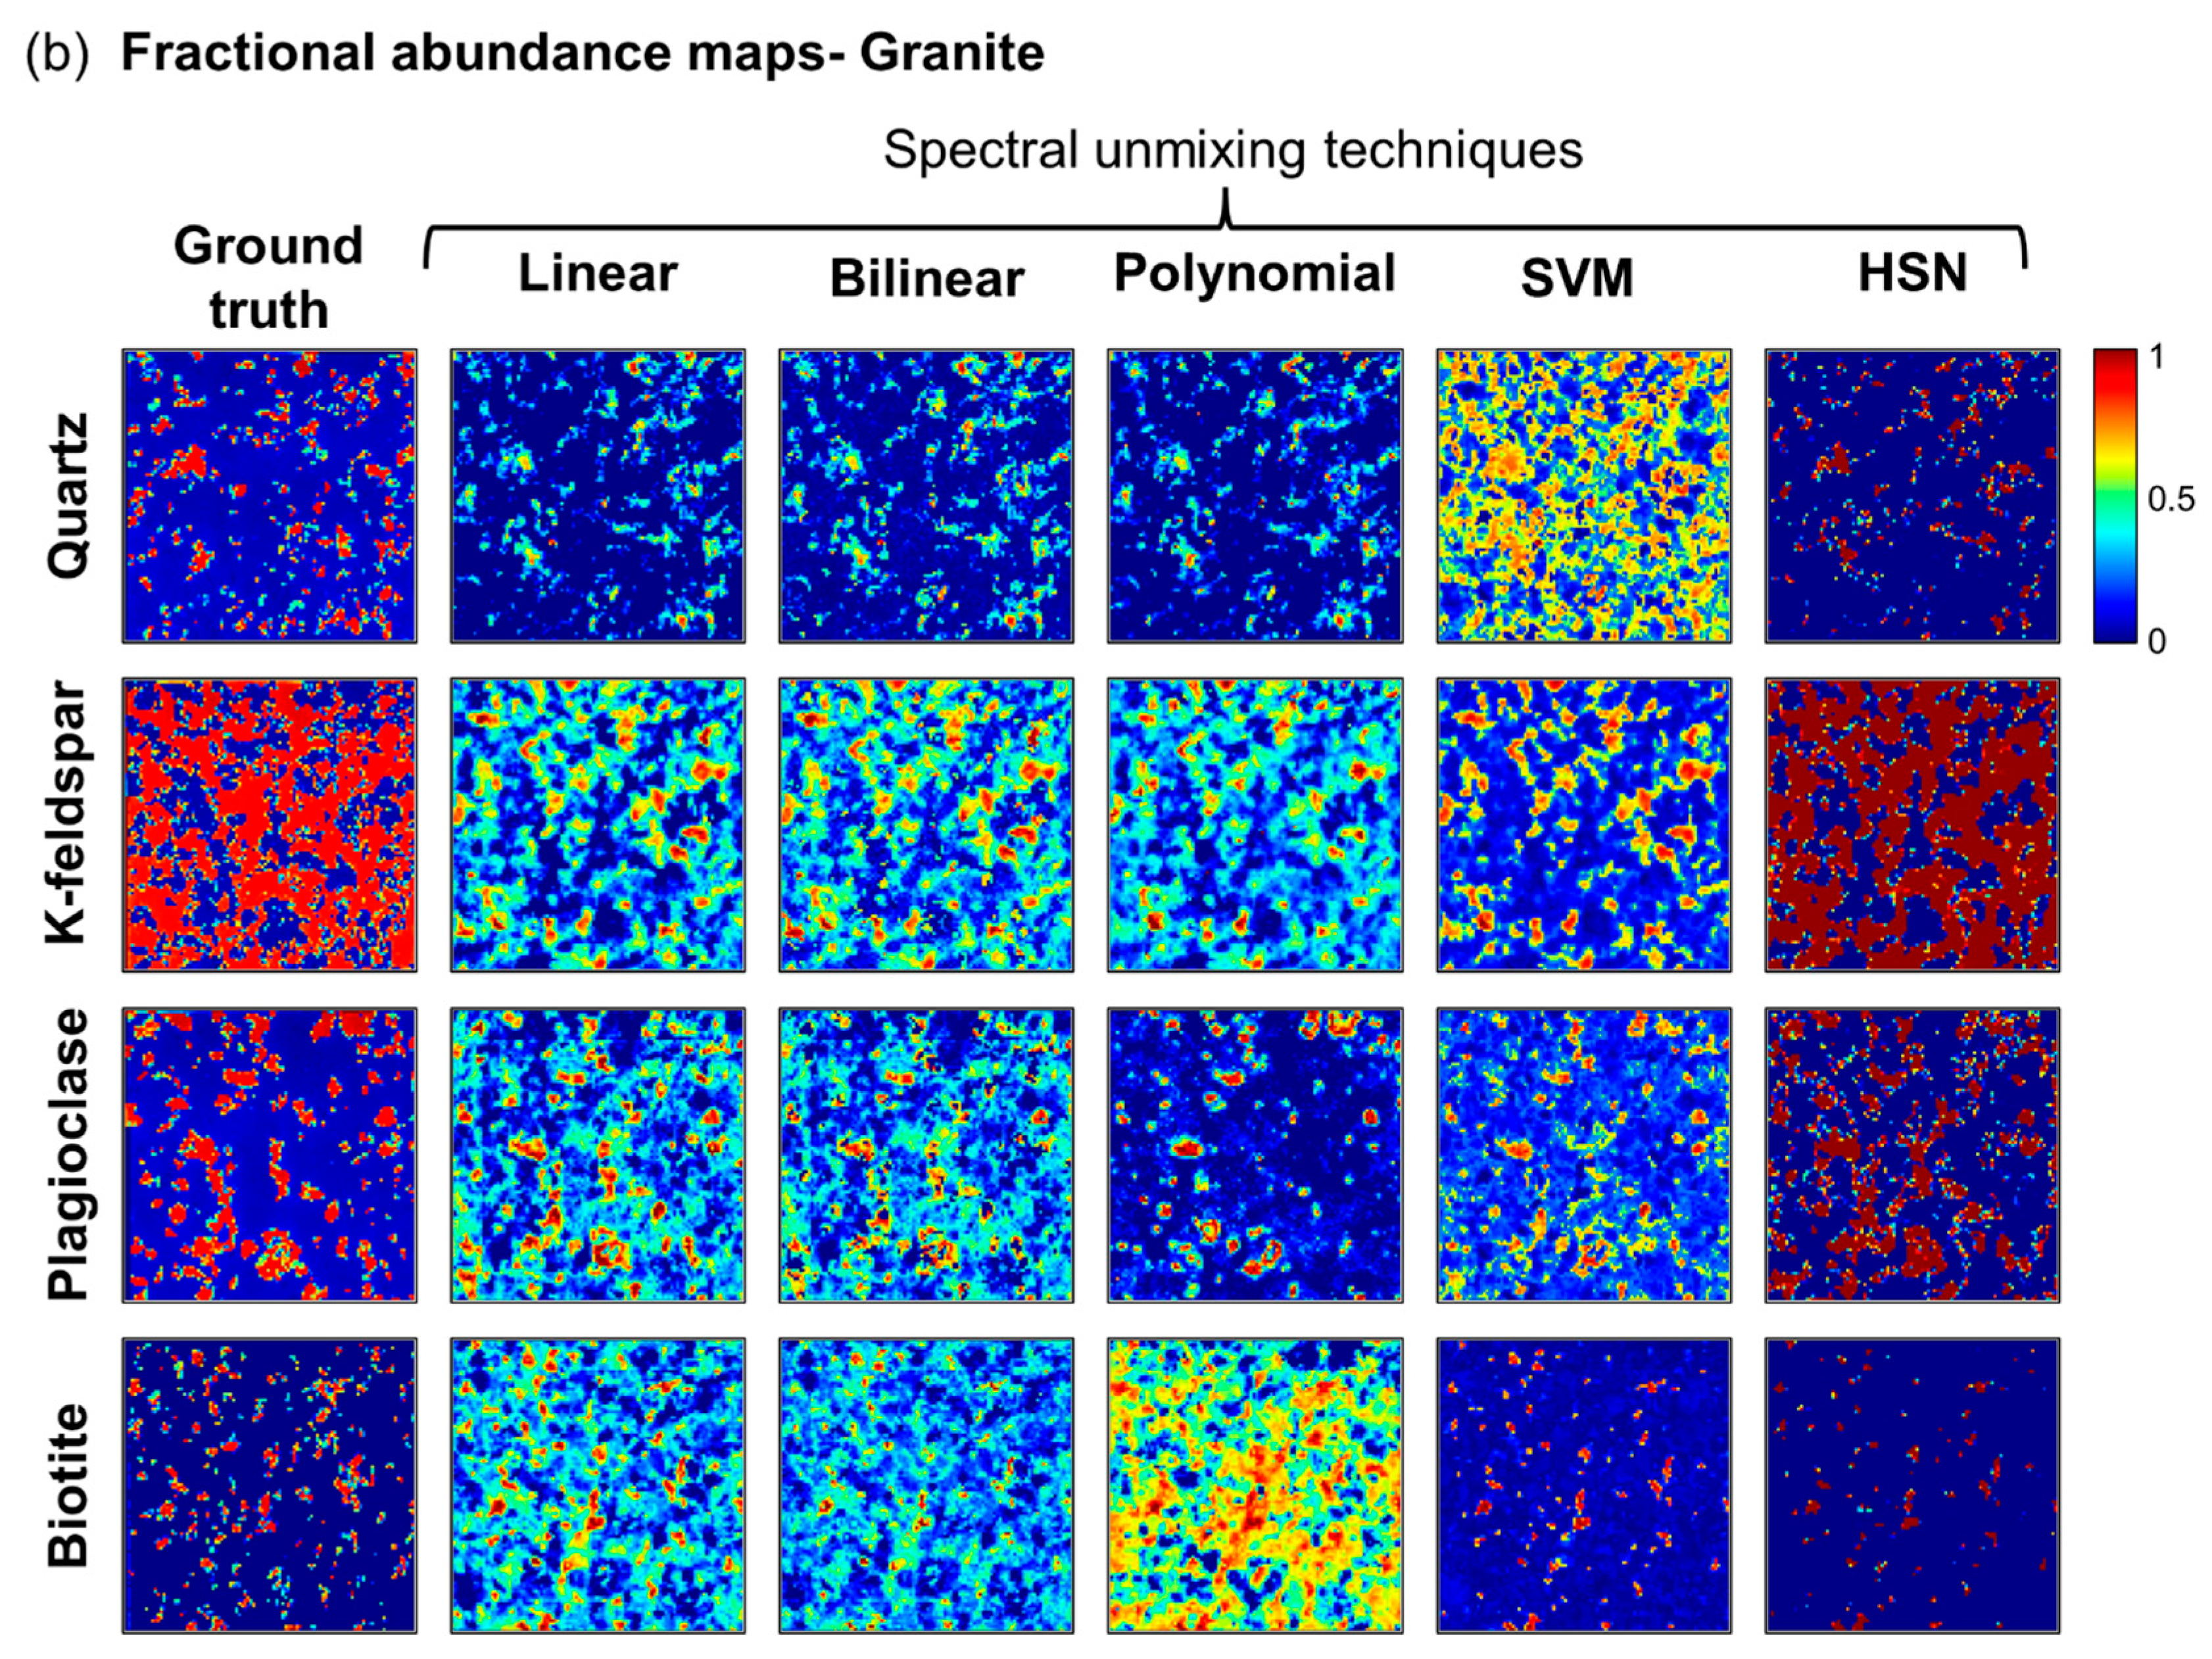
The estimated fractional abundance maps generated for the hyperspectral images of serpentinite and granite tile samples using linear, bilinear, polynomial, SVM, and HSN model-based spectral unmixing techniques are shown in Figure 7. The generated areal coverage-based ground truth maps have been placed alongside for a visual comparison. We observe that the HSN model-based unmixing provides fractional abundance estimates comparable to those of the ground truth. The performance metrics of unmixing techniques, i.e., RMSE and ARE, have been compared after addressing the distinguishability among the mineral constituents through spectral characterization, as discussed in the next section.

4. Discussion

4.1. Spectral Characterization of Mineral Constituents

The identified mineral constituents were spectrally characterized using their continuum removed spectra to observe their spectral distinguishability and analyse their effects in mixing and subsequent inversion (Figure 8). The mineral constituents identified for serpentinite (Figure 8a) exhibit prominent absorption features at 0.45 to 0.5 µm, near 0.7 µm inter-valence and oxygen-metal charge transfers [110], and absorptions at 0.95 to 1.15 µm due to the crystal field splitting of the d-orbitals of Fe2+ [111]. Broad absorptions along 1.4 µm and 1.9 µm indicate the presence of the functional OH group, revealing hydrothermal alteration [18]. Features along the shortwave regions of 2.0–2.5 µm explain the bending and stretching molecular vibrations in the substitutions of Si for transition metals at the OH binding site featuring Al near 2.1 µm [109], Mg at 2.3 µm [110], and their fundamentals beyond 2.3 µm [112]. The absorption feature diagnostic in relation to calcite are used for detection within the range from 1.6 µm to 2.5 µm region with a doublet at 2.1–2.2 µm and the diagnostic broad twin absorption features at ~2.3 µm and ~2.5 µm, explaining the vibrational processes of the carbonate ions [113,114].
Granite is essentially composed of three major felsic-rich silicate minerals, namely, quartz, K-feldspar, and plagioclase, which do not show significant absorption features in the visible, near-infrared, and shortwave infrared regions (Figure 8b). Subtle features observed at 0.85 µm, 1.2 µm, 1.4 µm, and 1.9 µm for quartz indicate water content present in it [115,116]. K-feldspar displays a shallow absorption feature along the visible region (0.4–0.6 µm) and a broad iron feature centered at 0.9 µm, physically exhibiting color transitions between white and pale pink to reddish due to blending of trace Fe-based microcline [117]. Minor absorption troughs at 1.4 µm and 1.9 µm indicate OH bearing phase and water molecules, and a feature centered at 2.2 µm is diagnostic to the substitution of aluminum for silicon at molecular tetrahedral sites, resulting in an Al–OH bend and O–H stretch doublet absorption peak. In plagioclase feldspar, the spectral bands between 1.1 to 1.3 µm exhibit a broad absorption feature with a small band depth attributed to electronic transitions in iron (Fe2+); the Fe absorption feature is rarely produced in the visible region (0.5–0.6 µm) due to its trace concentration [118]. The absorption features near 1.4, 1.9, and 2.2–2.3 µm are due to the OH stretch, H–OH bend, and Al–OH bend modes related to minor amounts of fluid inclusions and mica [119]. Biotite, constituting Fe, Al, and K, shows lower reflectance values and subtle absorption features along the visible region (0.5 µm, 0.7 µm, and 0.86 µm), suppressing the OH and water bands present in the VNIR regions. The features around 1.15 µm can be attributed to crystal field splitting of the d-orbitals of Fe2+ and that around 2.34 µm is likely due to Fe–OH vibrations [120]. The likely presence of alteration minerals, such as clays, may be responsible for the narrow absorption feature centered at 2.25 µm due to the Al–OH bending vibration.

4.2. Evaluation of Spectral Unmixing

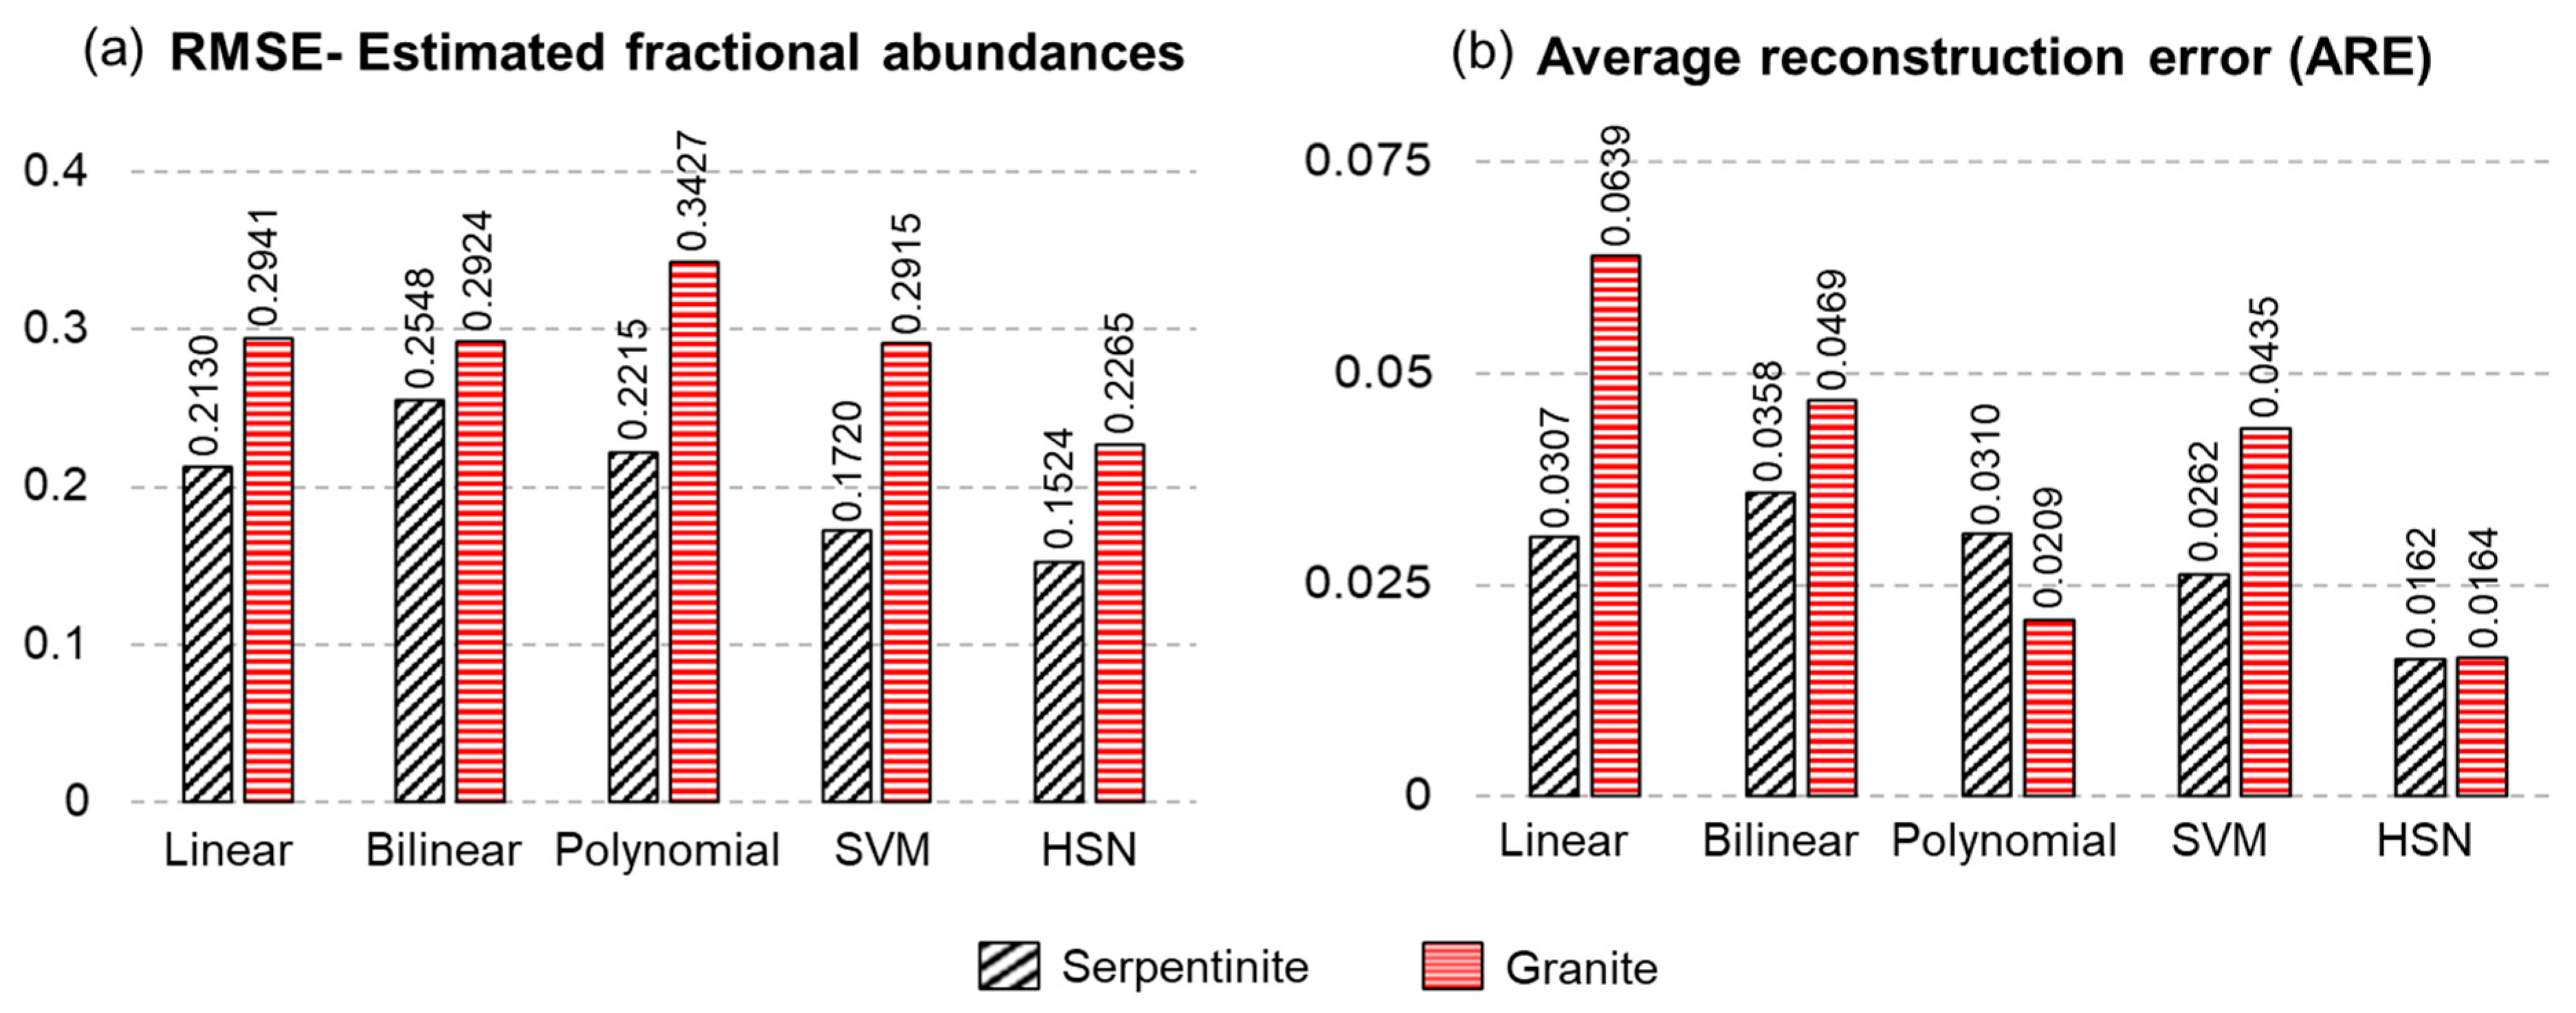
Figure 9 compares the performance metrics evaluated for the spectral unmixing techniques implemented on serpentinite and granite, highlighting the (a) overall root mean squared errors (RMSEs) for estimating fractional abundances and (b) average reconstruction errors (AREs) obtained as average deviation of the reconstructed image from the original hyperspectral image using linear, bilinear, polynomial, SVM, and HSN-based unmixing.
Fractional abundances estimated by spectral unmixing of serpentinite and granite depend on how well the unmixing model captures the interaction of light with the mineral components of the rock. Although linear models approximate the scattering of light for many real-world materials effectively, they have limited applications to geological mixtures. Linear unmixing of the serpentinite image reports an overall RMSE of 0.2130 and ARE of 0.0307. The bilinear unmixing also does not give satisfactory performance (RMSE = 0.2548), possibly due to the additive coefficients corresponding to the bilinear combination between serpentine and calcite that have similar spectra in the rock sample. The image reconstruction error is also high for the bilinear mixture model (ARE = 0.0358). The polynomial-based unmixing model with constrained polynomial coefficients considerably reduced the RMSE (=0.2215) and ARE (=0.0310) for serpentinite, and SVM-based unmixing with a radial basis function nonlinear kernel improves the unmixing accuracy with a reduced RMSE of 0.1720 and image reconstruction error of 0.0262. The HSN- based unmixing with multidimensional latent feature-based learning shows lesser abundance estimation error (RMSE = 0.1524) compared to other unmixing techniques and a reduced ARE of 0.0162, thereby improving the image reconstruction from estimated fractional abundances and model parameters.
Spectral unmixing for the hyperspectral image of granite shows increased RMSEs and AREs compared to those of serpentinite. This is attributed to the endmembers in granite rich in felsic minerals that have a reduced spectral distinguishability due to similar absorption features. The linear, bilinear, and polynomial-based unmixing techniques have larger RMSEs (0.2941, 0.2924 and 0.3427 respectively). These techniques have higher AREs, except for the polynomial-based technique, which reduces the reconstruction error substantially (ARE = 0.0209). Training-based SVM and HSN models reduce the RMSEs (0.2915 and 0.2265) compared to the former three unmixing techniques. The HSN model further provides an improved reconstruction performance (ARE = 0.0164).
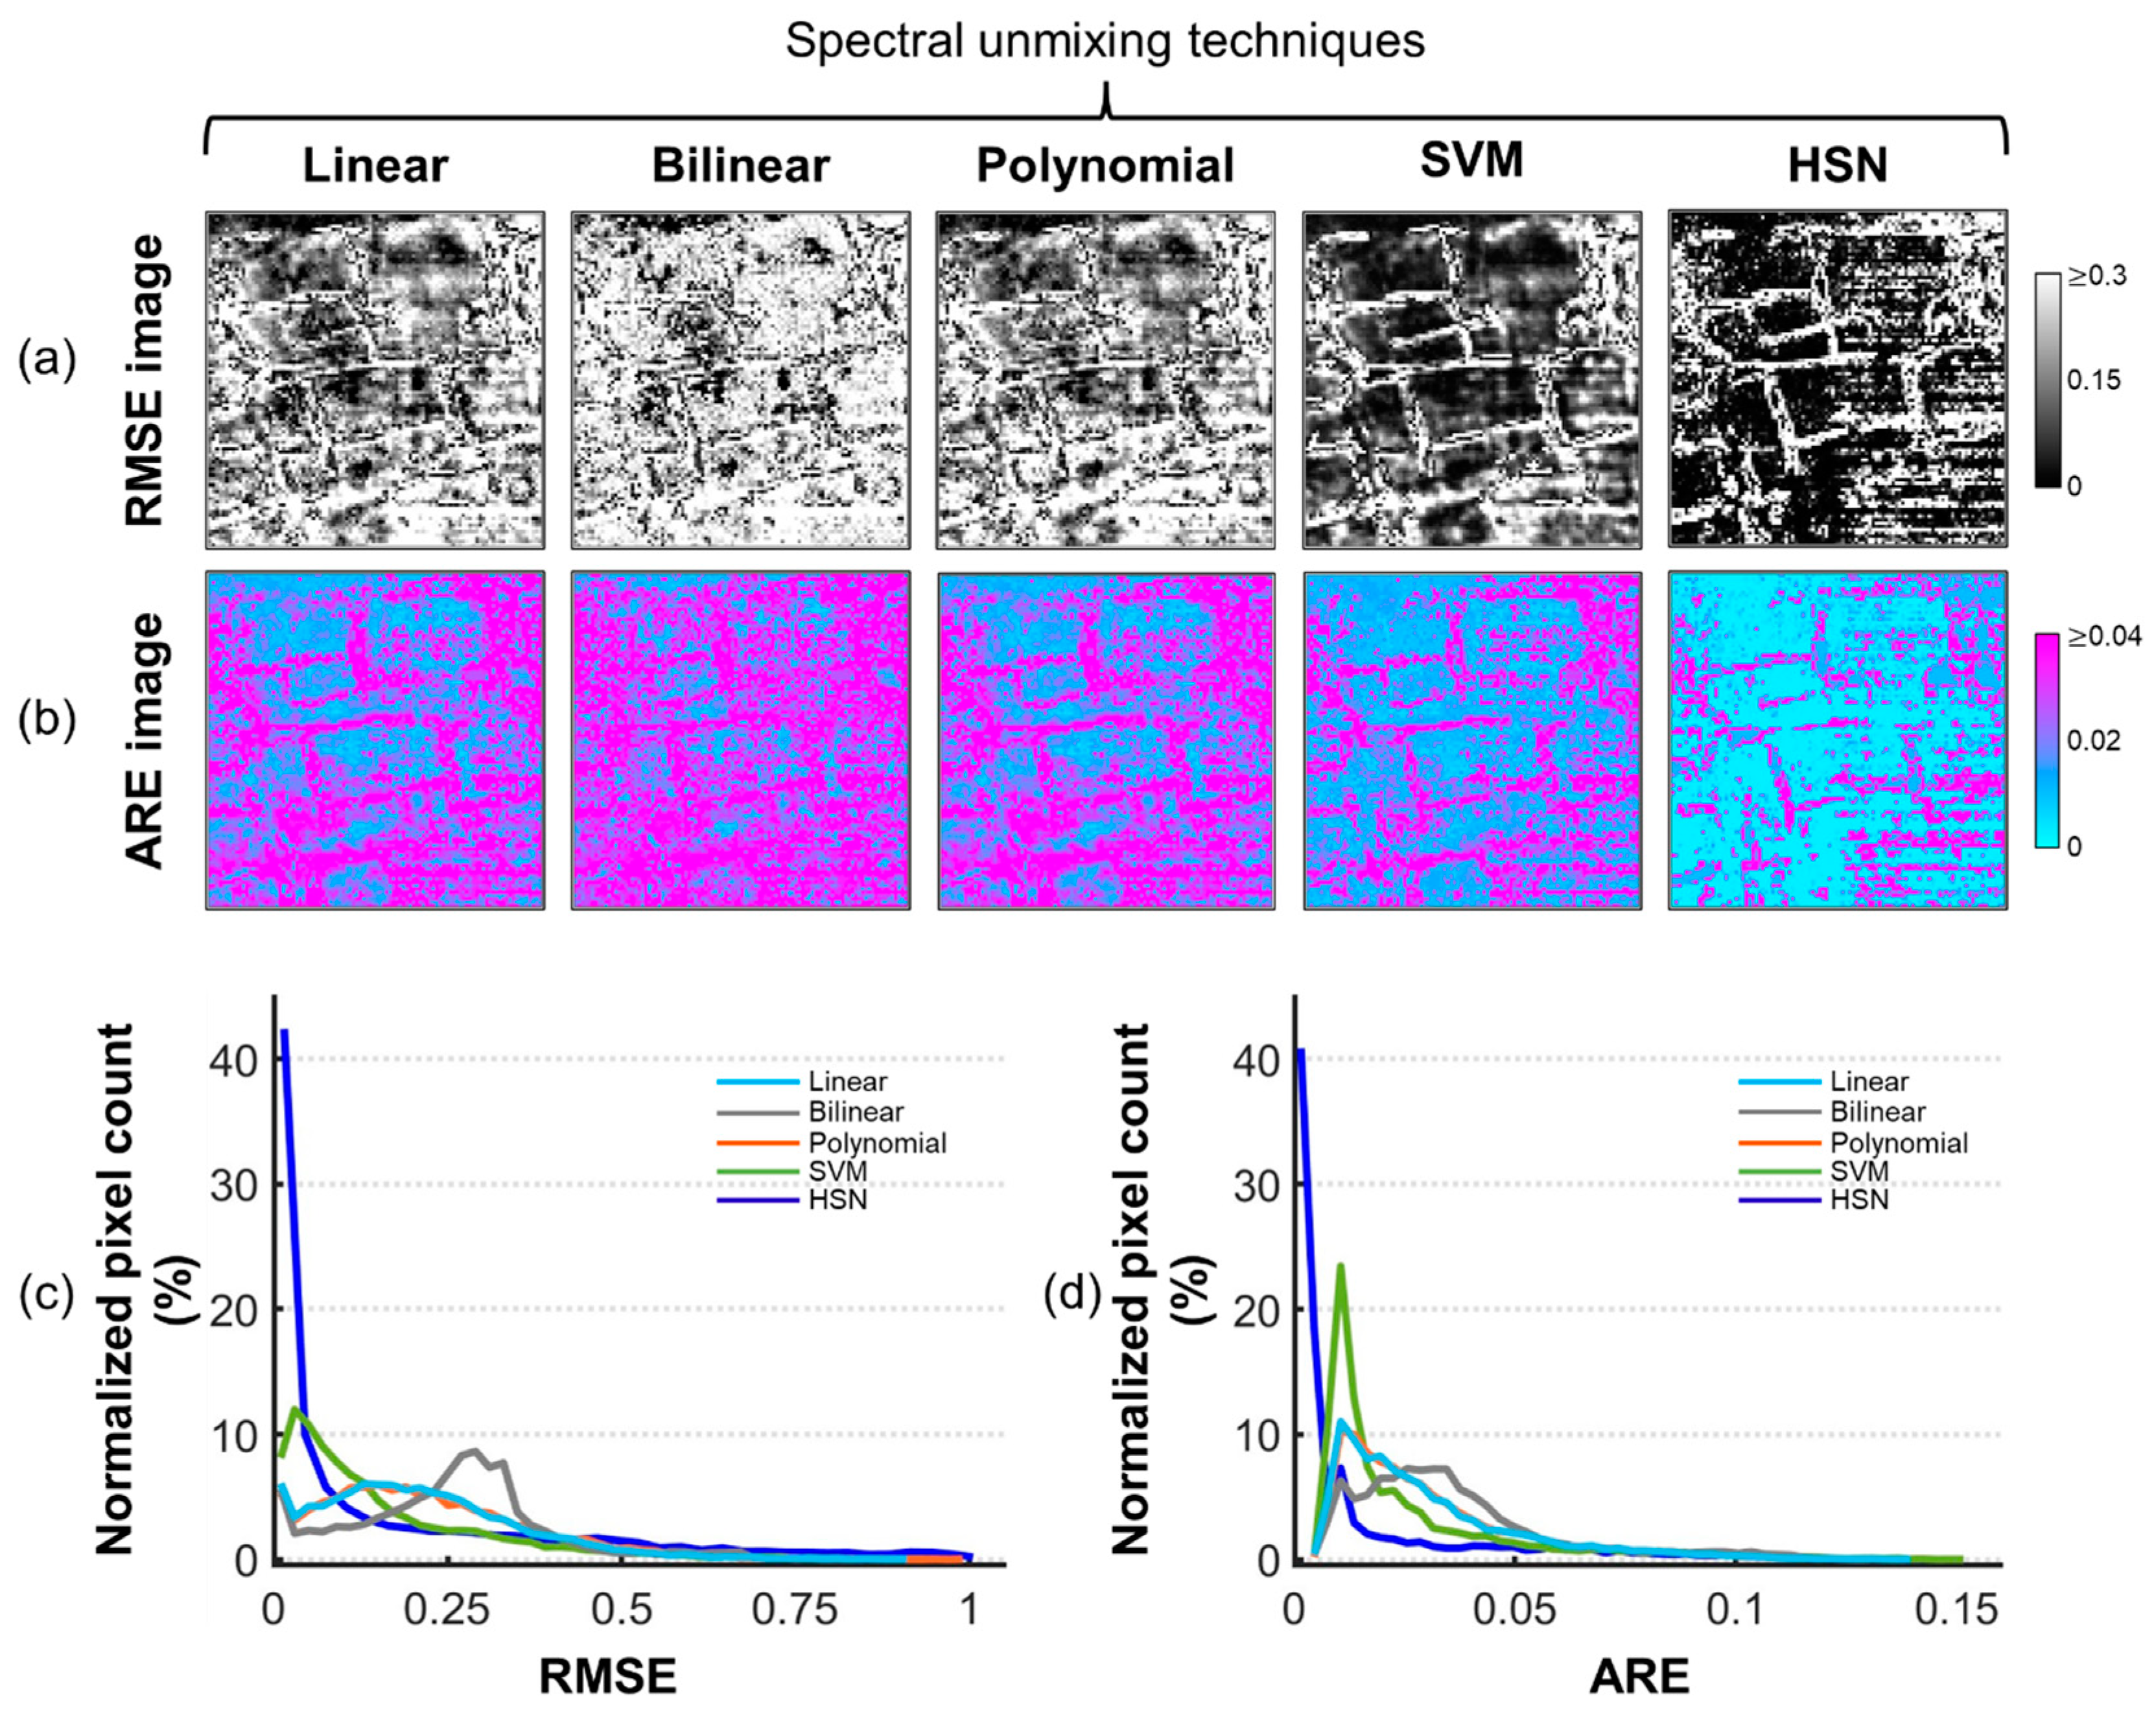
The statistical distributions of RMSEs and AREs obtained from their images (Figure 10a,b and Figure 11a,b) further explain the results obtained from the implemented spectral unmixing techniques. Based on normalized error values, the thresholds have been set for RMSE and ARE images displayed as colormap scales in which the upper limits are indicative of high error magnitudes. The distribution for serpentinite for HSN model-based unmixing shows a higher pixel count along a lower range of RMSE and ARE compared to linear, bilinear, polynomial, and SVM techniques. The RMSE and ARE images also explain the higher magnitude of errors, with RMSE  0.3  and ARE  0.04  for bilinear unmixing and their corresponding distribution on the line histograms (Figure 10c,d). Linear, polynomial, and SVM unmixing techniques show a lower range distribution of errors compared to the bilinear unmixing. Observations from the RMSE distributions for unmixing granite shows a bi-modal curve for polynomial and SVM-based unmixing (Figure 11c), corresponding to errors in estimating fractional abundances for biotite and quartz, respectively (refer Figure 7b). Linear and bilinear unmixing have lesser contrast for RMSEs, but they have a higher magnitude of ARE for linear unmixing (Figure 11d). The error images and distributions for unmixing granite validates that HSN model-based unmixing performs better compared to other implemented techniques.
Evaluation of spectral unmixing performances on these rock samples indicates the efficiency of training-based nonlinear model inversion techniques over the linear model and explains the interaction of light for intimate mixtures. A simplistic model, such as the bilinear, does not perform well for rock samples and contradicts the effect of bilinear spectral signatures for geological mixtures. The polynomial-based technique revealed its capability to substantially lower the image reconstruction error as compared to linear and bilinear models. However, its abundance estimates for granite are not accurate. SVM-based unmixing, though, performs well for serpentinite, having two endmembers, but it lacks the ability to distinguish spectrally similar endmembers for granite. The HSN model with training limited spectrally pure samples, and it exhibits an improved performance over other unmixing techniques, which can further be enhanced with the addition of more pure pixel-based training samples. Spectral variability among pure pixels of endmembers is also a considered factor that affects the unmixing results. These variabilities are attributed to various factors, such as natural composition, trace impurities, fineness of mineral grains, surface texture and roughness, phase angle, illumination, and other parameters [19,66,101,103]. For minerals having lower spectral variabilities, such as those in serpentinite, the estimated abundances and spectral reconstruction have reduced error magnitudes compared to the constituents of granite, having higher variabilities. For a robust unmixing technique, it is essential to retain a balance among the performance metrics that would provide an optimal solution for unmixing geological mixtures.
A comparison of average fractional abundances of endmembers in the rock samples with those obtained from spectral unmixing of their images established an instantaneous way of assessing these unmixing techniques when implemented on any geological mixture. Figure 12 compares the mineralogical composition of serpentinite and granite obtained from XRD analysis with a ground truth map and fractional abundances estimated using the different unmixing techniques. The abundance proportion of mineral constituents derived from the XRD analysis has a closer match for the average fractional abundance estimated using the HSN model-based unmixing technique, demonstrating its efficiency in unmixing geological mixtures.
The spectral unmixing techniques used in our experiment are selected based on our intuition of assumed mixing mechanisms in geological mixtures and availability of pure pixels for model training. Our experiment did not compare other established techniques that are based on blind source separation or sparse dictionary, as they would affect the physical interpretability of spectral signatures or estimated fractional abundances or both. Though it is expected that complex deep learning models would perform better as compared to our implemented techniques, these models are extensively data-guided and would require a significant volume of pure pixels for training, which is not practicable for our datasets. With the evolution of physics-based guided models for spectral mixing, subsequent inversions and estimation of endmembers’ fractional abundances have further scopes of improvement.

5. Conclusions

Our experimental study on modelling spectral mixing for rock samples and their inversion for unmixing provided an understanding of the nonlinear interaction of light in geological mixtures. The rock samples of serpentinite and granite, composed of two and four endmembers with varying spectral distinguishability among them, described the errors associated with their unmixing. Analyses and interpretations of results obtained from the hyperspectral image cubes of these rocks lead to the following conclusions:
  • Rocks with intimately mixed mineral constituents have a better accuracy by modelling them using nonlinear spectral mixture models and subsequent inversions to estimate their fractional abundances.
  • Due to intimate mixing of mineral constituents (or physical endmembers), the availability of spectrally pure pixels on their hyperspectral images is limited. This is constrained only to a few selected models for unmixing these mixtures.
  • Compared to the simplistic techniques, the pure pixel-guided HSN model for spectral unmixing harnesses the nonlinear feature transformation, using a limited set of pure pixels, thereby improving the unmixing performance. Further, a reduced spectral distinguishability among endmembers, which is typical for many rocks, does not affect the HSN model’s performance.
The future scope of our experimental study would focus on modelling spectral unmixing of rocks to address the effect of mixed pixels’ spectra due to grain sizes’ variability. This would further provide novel insights on unmixing geological mixtures.

Author Contributions

Conceptualization, M.M.S. and A.P. (Alok Porwal); methodology, M.M.S.; software, R.K. and S.K.M.; validation, M.M.S., A.P. (Arun PV) and A.P. (Alok Porwal); formal analysis, M.M.S. and R.K.; investigation, M.M.S. and A.P. (Alok Porwal); resources, R.K. and S.K.M.; data curation, M.M.S.; writing—original draft preparation, M.M.S.; writing—review and editing, M.M.S., R.K., A.P. (Arun PV), A.P. (Alok Porwal) and S.K.M.; visualization, M.M.S. and A.P. (Arun PV); supervision, A.P. (Alok Porwal); project administration, A.P. (Alok Porwal). All authors have read and agreed to the published version of the manuscript.

Funding

This research received no external funding.

Data Availability Statement

At the moment, the data are confidential, but this might change in the future.

Acknowledgments

The authors wish to thank the Udaipur Solar Observatory, Physical Research Laboratory for facilitating instrumentation for this experiment, Prime Minister’s Research Fellowship, Ministry of Education, Government of India, and the Indian Institute of Technology, Bombay for supporting this research.

Conflicts of Interest

The authors declare no conflict of interest. The funders had no role in the design of the study, in the collection, analyses, or interpretation of data, in the writing of the manuscript, or in the decision to publish the results.

References

  1. Goetz, A.F.H.; Rock, B.N.; Rowan, L.C. Remote sensing for exploration: An overview. Econ. Geol. 1983, 78, 573–590. [Google Scholar] [CrossRef]
  2. Salisbury, J.W.; Walter, L.S. Thermal infrared (2.5–13.5 μm) spectroscopic remote sensing of igneous rock types on particulate planetary surfaces. J. Geophys. Res. 1989, 94, 9192–9202. [Google Scholar] [CrossRef]
  3. Csillag, F.; Pásztor, L.; Biehl, L.L. Spectral band selection for the characterization of salinity status of soils. Remote Sens. Environ. 1993, 43, 231–242. [Google Scholar] [CrossRef]
  4. Ray, T.W.; Murray, B.C. Nonlinear spectral mixing in desert vegetation. Remote Sens. Environ. 1996, 55, 59–64. [Google Scholar] [CrossRef]
  5. Drake, N.A.; Mackin, S.; Settle, J.J. Mapping vegetation, soils, and geology in semiarid shrublands using spectral matching and mixture modeling of SWIR AVIRIS imagery. Remote Sens. Environ. 1999, 68, 12–25. [Google Scholar] [CrossRef]
  6. Chen, Z.; Muller-Karger, F.E.; Hu, C. Remote sensing of water clarity in Tampa Bay. Remote Sens. Environ. 2007, 109, 249–259. [Google Scholar] [CrossRef]
  7. Mars, J.C.; Rowan, L.C. Spectral assessment of new ASTER SWIR surface reflectance data products for spectroscopic mapping of rocks and minerals. Remote Sens. Environ. 2010, 114, 2011–2025. [Google Scholar] [CrossRef]
  8. Riley, D.N.; Hecker, C.A. Mineral mapping with airborne hyperspectral thermal infrared remote sensing at Cuprite, Nevada, USA. In Thermal Infrared Remote Sensing: Sensors, Methods, Applications. Remote Sensing and Digital Image Processing; Kuenzer, C., Dech, S., Eds.; Springer: Dordrecht, The Netherlands, 2013; Volume 17, pp. 495–514. [Google Scholar] [CrossRef]
  9. Swayze, G.A.; Clark, R.N.; Goetz, A.F.; Livo, K.E.; Breit, G.N.; Kruse, F.A.; Sutley, S.J.; Snee, L.W.; Lowers, H.A.; Post, J.L.; et al. Mapping advanced argillic alteration at Cuprite, Nevada, using imaging spectroscopy. Econ. Geol. 2014, 109, 1179–1221. [Google Scholar] [CrossRef]
  10. Graham, G.E.; Kokaly, R.F.; Kelley, K.D.; Hoefen, T.M.; Johnson, M.R.; Hubbard, B.E. Application of imaging spectroscopy for mineral exploration in Alaska: A study over porphyry Cu deposits in the eastern Alaska Range. Econ. Geol. 2018, 113, 489–510. [Google Scholar] [CrossRef]
  11. Sheffield, J.; Wood, E.F.; Pan, M.; Beck, H.; Coccia, G.; Serrat-Capdevila, A.; Verbist, K. Satellite remote sensing for water resources management: Potential for supporting sustainable development in data-poor regions. Water Resour. Res. 2018, 54, 9724–9758. [Google Scholar] [CrossRef] [Green Version]
  12. Hauser, L.T.; Timmermans, J.; van der Windt, N.; Sil, Â.F.; de Sá, N.C.; Soudzilovskaia, N.A.; van Bodegom, P.M. Explaining discrepancies between spectral and in-situ plant diversity in multispectral satellite earth observation. Remote Sens. Environ. 2021, 265, 112684. [Google Scholar] [CrossRef]
  13. Cawse-Nicholson, K.; Townsend, P.A.; Schimel, D.; Assiri, A.M.; Blake, P.L.; Buongiorno, M.F.; Campbell, P.; Carmon, N.; Casey, K.A.; Correa-Pabón, R.E.; et al. NASA’s surface biology and geology designated observable: A perspective on surface imaging algorithms. Remote Sens. Environ. 2021, 257, 112349. [Google Scholar] [CrossRef]
  14. Wei, J.; Cui, Y.; Zhou, S.; Luo, Y. Regional water-saving potential calculation method for paddy rice based on remote sensing. Agric. Water Manag. 2022, 267, 107610. [Google Scholar] [CrossRef]
  15. Brando, V.E.; Dekker, A.G. Satellite hyperspectral remote sensing for estimating estuarine and coastal water quality. IEEE Trans. Geosci. Remote Sens. 2003, 41 Pt 1, 1378–1387. [Google Scholar] [CrossRef]
  16. Nash, D.B.; Conel, J.E. Spectral reflectance systematics for mixtures of powdered hypersthene, labradorite, and ilmenite. J. Geophys. Res. 1974, 79, 1615–1621. [Google Scholar] [CrossRef]
  17. Keshava, N.; Mustard, J.F. Spectral unmixing. IEEE Signal Process. Mag. 2002, 19, 44–57. [Google Scholar] [CrossRef]
  18. Adams, J.B.; Smith, M.O.; Johnson, P.E. Spectral mixture modeling: A new analysis of rock and soil types at the Viking Lander 1 site. J. Geophys. Res. 1986, 91, 10513. [Google Scholar] [CrossRef] [Green Version]
  19. Somers, B.; Asner, G.P.; Tits, L.; Coppin, P. Endmember variability in spectral mixture analysis: A review. Remote Sens. Environ. 2011, 115, 1603–1616. [Google Scholar] [CrossRef]
  20. Borel, C.C.; Gerstl, S.A.W. Nonlinear spectral mixing models for vegetative and soil surfaces. Remote Sens. Environ. 1994, 47, 403–416. [Google Scholar] [CrossRef]
  21. Williams, D.L. A comparison of spectral reflectance properties at the needle, branch, and canopy level for selected conifer species. Remote Sens. Environ. 1991, 35, 79–93. [Google Scholar] [CrossRef]
  22. Fan, W.; Hu, B.; Miller, J.; Li, M. Comparative study between a new nonlinear model and common linear model for analysing laboratory simulated-forest hyperspectral data. Int. J. Remote Sens. 2009, 30, 2951–2962. [Google Scholar] [CrossRef]
  23. Halimi, A.; Altmann, Y.; Dobigeon, N.; Tourneret, J.-Y. Unmixing hyperspectral images using the generalized bilinear model. In Proceedings of the 2011 IEEE International Geoscience and Remote Sensing Symposium, Vancouver, BC, Canada, 24–29 July 2011; pp. 1886–1889. [Google Scholar] [CrossRef]
  24. Halimi, A.; Altmann, Y.; Dobigeon, N.; Tourneret, J.Y. Nonlinear unmixing of hyperspectral images using a generalized bilinear model. IEEE Trans. Geosci. Remote Sens. 2011, 49 Pt 1, 4153–4162. [Google Scholar] [CrossRef] [Green Version]
  25. Heylen, R.; Scheunders, P. Nonlinear Unmixing with a Multilinear Mixing Model. In Proceedings of the 2015 7th Workshop on Hyperspectral Image and Signal Processing: Evolution in Remote Sensing (WHISPERS), Tokyo, Japan, 2–5 June 2015. [Google Scholar] [CrossRef]
  26. Heylen, R.; Scheunders, P. A multilinear mixing model for nonlinear spectral unmixing. IEEE Trans. Geosci. Remote Sens. 2016, 54, 240–251. [Google Scholar] [CrossRef]
  27. Nascimento, J.M.P.; Bioucas-Dias, J.M. Nonlinear mixture model for hyperspectral unmixing. Image Signal Process. Remote Sens. XV 2009, 7477, 74770I. [Google Scholar] [CrossRef]
  28. Babaie-zadeh, M.; Jutten, C.; Nayebi, K. Blind separating convolutive post non-linear mixtures. In Proceedings of the 3rd Workshop on Independent Component Analysis and Signal Separation (ICA2001), San Diego, CA, USA, 9–13 December 2001; pp. 138–143. [Google Scholar]
  29. Altmann, Y.; Halimi, A.; Dobigeon, N.; Tourneret, J.Y. Supervised nonlinear spectral unmixing using a postnonlinear mixing model for hyperspectral imagery. IEEE Trans. Image Process. 2012, 21, 3017–3025. [Google Scholar] [CrossRef] [PubMed] [Green Version]
  30. Altmann, Y.; Halimi, A.; Dobigeon, N.; Tourneret, J. A post nonlinear mixing model for hyperspectral images unmixing. In Proceedings of the 2011 IEEE International Geoscience and Remote Sensing Symposium, Vancouver, BC, Canada, 24–29 July 2011; pp. 1883–1885. [Google Scholar] [CrossRef] [Green Version]
  31. Hapke, B. Topics in Remote Sensing—Theory of Reflectance and Emittance Spectroscopy, First Paper; Cambridge University Press: Cambridge, UK, 1993. [Google Scholar]
  32. Mustard, J.F.; Pieters, C.M. Quantitative abundance estimates from bidirectional reflectance measurements. J. Geophys. Res. Solid Earth 1987, 92, E617–E626. [Google Scholar] [CrossRef] [Green Version]
  33. Mustard, J.F.; Pieters, C.M. Photometric phase functions of common geologic minerals and applications to quantitative analysis of mineral mixture reflectance spectra. J. Geophys. Res. 1989, 94, 13619–13634. [Google Scholar] [CrossRef]
  34. Milliken, R.E.; Mustard, J.F. Quantifying absolute water content of minerals using near-infrared reflectance spectroscopy. J. Geophys. Res. E Planets 2005, 110, E12001. [Google Scholar] [CrossRef] [Green Version]
  35. Howari, F.M.; Acbas, G.; Nazzal, Y.; Alaydaroos, F. Hapke-based computational method to enable unmixing of hyperspectral data of common salts. Chem. Cent. J. 2018, 12, 90. [Google Scholar] [CrossRef] [Green Version]
  36. Hapke, B. Bidirectional reflectance spectroscopy: 1. Theory. J. Geophys. Res. Solid Earth 1981, 86, 3039–3054. [Google Scholar] [CrossRef] [Green Version]
  37. Hapke, B.; Wells, E. Bidirectional reflectance spectroscopy: 2. Experiments and observations. J. Geophys. Res. Solid Earth 1981, 86, 3055–3060. [Google Scholar] [CrossRef]
  38. Bioucas-Dias, J.M.; Plaza, A.; Dobigeon, N.; Parente, M.; Du, Q.; Gader, P.; Chanussot, J. Hyperspectral unmixing overview: Geometrical, statistical, and sparse regression-based approaches. IEEE J. Sel. Top. Appl. Earth Obs. Remote Sens. 2012, 5, 354–379. [Google Scholar] [CrossRef] [Green Version]
  39. Dobigeon, N.; Tourneret, J.Y.; Richard, C.; Bermudez, J.C.M.; McLaughlin, S.; Hero, A.O. Nonlinear unmixing of hyperspectral images: Models and algorithms. IEEE Signal Process. Mag. 2014, 31, 82–94. [Google Scholar] [CrossRef] [Green Version]
  40. Settle, J.; Campbell, N. On the errors of two estimators of sub-pixel fractional cover when mixing is linear. IEEE Trans. Geosci. Remote Sens. 1998, 36, 163–170. [Google Scholar] [CrossRef]
  41. Eismann, M.T.; Hardie, R.C. Stochastic spectral unmixing with enhanced endmember class separation. Appl. Opt. 2004, 43, 6596–6608. [Google Scholar] [CrossRef]
  42. Rogge, D.M.; Rivard, B.; Jinkai, Z.; Jilu, F. Iterative spectral unmixing for optimizing per-pixel endmember sets. IEEE Trans. Geosci. Remote Sens. 2006, 44, 3725–3735. [Google Scholar] [CrossRef]
  43. Heylen, R.; Burazerovi, D.; Scheunders, P. Fully constrained least squares spectral unmixing by simplex projection. IEEE Trans. Geosci. Remote Sens. 2011, 49, 4112–4122. [Google Scholar] [CrossRef]
  44. Li, J.; Agathos, A.; Zaharie, D.; Bioucas-Dias, J.M.; Plaza, A.; Li, X. Minimum volume simplex analysis: A fast algorithm for linear hyperspectral unmixing. IEEE Trans. Geosci. Remote Sens. 2015, 53, 5067–5082. [Google Scholar] [CrossRef]
  45. Sahoo, M.M.; Arun, P.V.; Porwal, A. Support vector machines for unmixing geological mixtures. In Proceedings of the 2021 11th Workshop on Hyperspectral Imaging and Signal Processing: Evolution in Remote Sensing (WHISPERS), Amsterdam, The Netherlands, 24–26 March 2021; pp. 1–6. [Google Scholar] [CrossRef]
  46. Gu, Y.; Wang, S.; Jia, X. Spectral unmixing in multiple-kernel Hilbert space for hyperspectral imagery. IEEE Trans. Geosci. Remote Sens. 2013, 51, 3968–3981. [Google Scholar] [CrossRef]
  47. Drumetz, L.; Chanussot, J.; Jutten, C.; Ma, W.K.; Iwasaki, A. Spectral variability aware blind hyperspectral image unmixing based on convex geometry. IEEE Trans. Image Process. 2020, 29, 4568–4582. [Google Scholar] [CrossRef] [Green Version]
  48. Honeine, P.; Richard, C. Geometric unmixing of large hyperspectral images: A barycentric coordinate approach. IEEE Trans. Geosci. Remote Sens. 2012, 50, 2185–2195. [Google Scholar] [CrossRef]
  49. Bateson, A.; Curtiss, B. A method for manual endmember selection and spectral unmixing. Remote Sens. Environ. 1996, 55, 229–243. [Google Scholar] [CrossRef]
  50. Zhu, F.; Wang, Y.; Fan, B.; Xiang, S.; Meng, G.; Pan, C. Spectral unmixing via data-guided sparsity. IEEE Trans. Image Process. 2014, 23, 5412–5427. [Google Scholar] [CrossRef] [Green Version]
  51. Canham, K.; Schlamm, A.; Ziemann, A.; Basener, B.; Messinger, D. Spatially adaptive hyperspectral unmixing. IEEE Trans. Geosci. Remote Sens. 2011, 49 Pt 1, 4248–4262. [Google Scholar] [CrossRef]
  52. Févotte, C.; Dobigeon, N. Nonlinear hyperspectral unmixing with robust nonnegative matrix factorization. IEEE Trans. Image Process. 2015, 24, 4810–4819. [Google Scholar] [CrossRef] [Green Version]
  53. Qu, K.; Bao, W. Multiple-priors ensemble constrained nonnegative matrix factorization for spectral unmixing. IEEE J. Sel. Top. Appl. Earth Obs. Remote Sens. 2020, 13, 963–975. [Google Scholar] [CrossRef]
  54. Yuan, Y.; Zhang, Z.; Wang, Q. Improved collaborative non-negative matrix factorization and total variation for hyperspectral unmixing. IEEE J. Sel. Top. Appl. Earth Obs. Remote Sens. 2020, 13, 998–1010. [Google Scholar] [CrossRef]
  55. Wang, Q.; Shi, W.; Atkinson, P.M. Area-to-point regression kriging for pan-sharpening. ISPRS J. Photogramm. Remote Sens. 2016, 114, 151–165. [Google Scholar] [CrossRef]
  56. Wang, Q.; Shi, W.; Atkinson, P.M.; Zhao, Y. Downscaling MODIS images with area-to-point regression kriging. Remote Sens. Environ. 2015, 166, 191–204. [Google Scholar] [CrossRef]
  57. Wang, Q.; Shi, W.; Atkinson, P.M. Sub-pixel mapping of remote sensing images based on radial basis function interpolation. ISPRS J. Photogramm. Remote Sens. 2014, 92, 1–15. [Google Scholar] [CrossRef]
  58. Wang, Q.; Zhang, C.; Atkinson, P.M. Sub-pixel mapping with point constraints. Remote Sens. Environ. 2020, 244, 111817. [Google Scholar] [CrossRef]
  59. Zhong, Y.; Feng, R.; Zhang, L. Non-local sparse unmixing for hyperspectral remote sensing imagery. IEEE J. Sel. Top. Appl. Earth Obs. Remote Sens. 2014, 7, 1889–1909. [Google Scholar] [CrossRef]
  60. Tang, W.; Shi, Z.; Wu, Y.; Zhang, C. Sparse unmixing of hyperspectral data using spectral a priori information. IEEE Trans. Geosci. Remote Sens. 2015, 53, 770–783. [Google Scholar] [CrossRef]
  61. Qi, L.; Li, J.; Wang, Y.; Huang, Y.; Gao, X. Spectral–spatial-weighted multiview collaborative sparse unmixing for hyperspectral images. IEEE Trans. Geosci. Remote Sens. 2020, 58, 8766–8779. [Google Scholar] [CrossRef]
  62. Wang, S.; Huang, T.Z.; Zhao, X.L.; Huang, J. Reweighted sparse unmixing for hyperspectral images with noise level estimation. J. Comput. Appl. Math. 2023, 421, 114843. [Google Scholar] [CrossRef]
  63. Iordache, M.D.; Bioucas-Dias, J.M.; Plaza, A. Sparse unmixing of hyperspectral data. IEEE Trans. Geosci. Remote Sens. 2011, 49 Pt 1, 2014–2039. [Google Scholar] [CrossRef] [Green Version]
  64. Iordache, M.D.; Bioucas-Dias, J.M.; Plaza, A. Total variation spatial regularization for sparse hyperspectral unmixing. IEEE Trans. Geosci. Remote Sens. 2012, 50 Pt 1, 4484–4502. [Google Scholar] [CrossRef] [Green Version]
  65. Iordache, M.; Bioucas-Dias, J.M.; Plaza, A. Collaborative sparse regression for hyperspectral unmixing. IEEE Trans. Geosci. Remote Sens. 2013, 52, 341–354. [Google Scholar] [CrossRef] [Green Version]
  66. Borsoi, R.A.; Imbiriba, T.; Bermudez, J.C.M.; Richard, C.; Chanussot, J.; Drumetz, L.; Tourneret, J.-Y.; Zare, A.; Jutten, C. Spectral variability in hyperspectral data unmixing: A comprehensive review. IEEE Geosci. Remote Sens. Mag. 2021, 9, 223–270. [Google Scholar] [CrossRef]
  67. Yao, J.; Meng, D.; Zhao, Q.; Cao, W.; Xu, Z. Nonconvex-sparsity and nonlocal-smoothness-based blind hyperspectral unmixing. IEEE Trans. Image Process. 2019, 28, 2991–3006. [Google Scholar] [CrossRef]
  68. Tian, Y.; Li, Y.; Lin, H.; Ma, H. A sparse NMF-SU for seismic random noise attenuation. IEEE Geosci. Remote Sens. Lett. 2013, 10, 607–611. [Google Scholar] [CrossRef]
  69. Caiafa, C.F.; Salerno, E.; Proto, A.N.; Fiumi, L. Blind spectral unmixing by local maximization of non-Gaussianity. Signal 2008, 88, 50–68. [Google Scholar] [CrossRef]
  70. Drumetz, L.; Veganzones, M.A.; Henrot, S.; Phylpo, R.; Chanussot, J.; Jutten, C. Blind hyperspectral unmixing using an extended linear mixing model to address spectral variability. IEEE Trans. Image Process. 2016, 25, 3890–3905. [Google Scholar] [CrossRef] [Green Version]
  71. Lagrange, A.; Fauvel, M.; May, S.; Dobigeon, N. Matrix cofactorization for joint spatial–spectral unmixing of hyperspectral images. IEEE Trans. Geosci. Remote Sens. 2020, 58, 4915–4927. [Google Scholar] [CrossRef] [Green Version]
  72. Full, W.E.; Ehrlich, R.; Bezdek, J.C. Fuzzy Qmodel-A new approach for linear unmixing. Math. Geol. 1982, 14, 259–270. [Google Scholar] [CrossRef]
  73. Arun, P.V.; Buddhiraju, K.M.; Porwal, A. Integration of contextual knowledge in unsupervised sub-pixel classification. In Proceedings of the 2016 8th Workshop on Hyperspectral Image and Signal Processing: Evolution in Remote Sensing (WHISPERS), Los Angeles, CA, USA, 21–24 August 2016; pp. 1–5. [Google Scholar] [CrossRef]
  74. Arun, P.V.; Buddhiraju, K.M. Classification and clustering perspective towards spectral unmxing. In Proceedings of the 2016 IEEE International Geoscience and Remote Sensing Symposium (IGARSS), Beijing, China, 10–15 July 2016; pp. 6145–6148. [Google Scholar] [CrossRef]
  75. Xu, X.; Li, J.; Wu, C.; Plaza, A. Regional clustering-based spatial preprocessing for hyperspectral unmixing. Remote Sens. Environ. 2018, 204, 333–346. [Google Scholar] [CrossRef]
  76. Bastin, L. Comparison of fuzzy c-means classification, linear mixture modelling and MLC probabilities as tools for unmixing coarse pixels. Int. J. Remote Sens. 1997, 18, 3629–3648. [Google Scholar] [CrossRef]
  77. Somers, B.; Zortea, M.; Plaza, A.; Asner, G.P. Automated extraction of image-based endmember bundles for improved spectral unmixing. IEEE J. Sel. Top. Appl. Earth Obs. Remote Sens. 2012, 5, 396–408. [Google Scholar] [CrossRef] [Green Version]
  78. Heylen, R.; Andrejchenko, V.; Zahiri, Z.; Parente, M.; Scheunders, P. Nonlinear hyperspectral unmixing with graphical models. IEEE Trans. Geosci. Remote Sens. 2019, 57, 4844–4856. [Google Scholar] [CrossRef]
  79. Li, J.; Li, X.; Huang, B.; Zhao, L. Hopfield neural network approach for supervised nonlinear spectral unmixing. IEEE Geosci. Remote Sens. Lett. 2016, 13, 1002–1006. [Google Scholar] [CrossRef]
  80. Uezato, T.; Murphy, R.J.; Melkumyan, A.; Chlingaryan, A. A novel spectral unmixing method incorporating spectral variability within endmember classes. IEEE Trans. Geosci. Remote Sens. 2016, 54, 2812–2831. [Google Scholar] [CrossRef]
  81. Foody, G.M.; Lucas, R.M.; Curran, P.J.; Honzak, M. Non-linear mixture modelling without end-members using an artificial neural network. Int. J. Remote Sens. 1997, 18, 937–953. [Google Scholar] [CrossRef]
  82. Baraldi, A.; Binaghi, E.; Blonda, P.; Brivio, P.A.; Rampini, A. Comparison of the multilayer perceptron with neuro-fuzzy techniques in the estimation of cover class mixture in remotely sensed data. IEEE Trans. Geosci. Remote Sens. 2001, 39, 994–1005. [Google Scholar] [CrossRef]
  83. Plaza, J.; Plaza, A.; Pérez, R.; Martínez, P. Joint linear/nonlinear spectral unmixing of hyperspectral image data. In Proceedings of the International Geoscience and Remote Sensing Symposium (IGARSS), Barcelona, Spain, 23–28 July 2007; pp. 4037–4040. [Google Scholar] [CrossRef] [Green Version]
  84. Guilfoyle, K.J.; Althouse, M.L.; Chang, C. A quantitative and comparative analysis of linear and nonlinear spectral mixture models using radial basis function neural networks. IEEE Trans. Geosci. Remote Sens. 2001, 39, 2314–2318. [Google Scholar] [CrossRef]
  85. Licciardi, G.A.; Del Frate, F. Pixel unmixing in hyperspectral data by means of neural networks. IEEE Trans. Geosci. Remote Sens. 2011, 49 Pt 1, 4163–4172. [Google Scholar] [CrossRef]
  86. Licciardi, G.A.; Ceamanos, X.; Douté, S.; Chanussot, J. Unsupervised nonlinear spectral unmixing by means of NLPCA applied to hyperspectral imagery. In Proceedings of the 2012 IEEE International Geoscience and Remote Sensing Symposium, Munich, Germany, 22–27 July 2012; pp. 1369–1372. [Google Scholar] [CrossRef] [Green Version]
  87. Heylen, R.; Parente, M.; Gader, P. A review of nonlinear hyperspectral unmixing methods. IEEE J. Sel. Top. Appl. Earth Obs. Remote Sens. 2014, 7, 1844–1868. [Google Scholar] [CrossRef]
  88. Qu, Y.; Qi, H. uDAS: An untied denoising autoencoder with sparsity for spectral unmixing. IEEE Trans. Geosci. Remote Sens. 2019, 57, 1698–1712. [Google Scholar] [CrossRef]
  89. Shi, S.; Zhang, L.; Altmann, Y.; Chen, J. Deep generative model for spatial–spectral unmixing with multiple endmember priors. IEEE Trans. Geosci. Remote Sens. 2022, 60, 5527214. [Google Scholar] [CrossRef]
  90. Borsoi, R.A.; Imbiriba, T.; Bermudez, J.C.M. Deep generative endmember modeling: An application to unsupervised spectral unmixing. IEEE Trans. Comput. Imaging 2019, 6, 374–384. [Google Scholar] [CrossRef] [Green Version]
  91. Hong, D.; Gao, L.; Yao, J.; Yokoya, N.; Chanussot, J.; Heiden, U.; Zhang, B. Endmember-guided unmixing network (EGU-Net)- A general deep learning framework for self-supervised hyperspectral unmixing. IEEE Trans. Neural Netw. Learn. Syst. 2022, 33, 6518–6531. [Google Scholar] [CrossRef]
  92. Qian, Y.; Xiong, F.; Qian, Q.; Zhou, J. Spectral mixture model inspired network architectures for hyperspectral unmixing. IEEE Trans. Geosci. Remote Sens. 2020, 58, 7418–7434. [Google Scholar] [CrossRef]
  93. Wang, M.; Zhao, M.; Chen, J.; Rahardja, S. Nonlinear unmixing of hyperspectral data via deep autoencoder networks. IEEE Geosci. Remote Sens. Lett. 2019, 16, 1467–1471. [Google Scholar] [CrossRef]
  94. Palsson, B.; Ulfarsson, M.O.; Sveinsson, J.R. Convolutional autoencoder for spectral-spatial hyperspectral unmixing. IEEE Trans. Geosci. Remote Sens. 2021, 59, 535–549. [Google Scholar] [CrossRef]
  95. Palsson, B.; Sigurdsson, J.; Sveinsson, J.R.; Ulfarsson, M.O. Hyperspectral unmixing using a neural network autoencoder. IEEE Access 2018, 6, 25646–25656. [Google Scholar] [CrossRef]
  96. Arun, P.V.; Buddhiraju, K.M.; Porwal, A. CNN based sub-pixel mapping for hyperspectral images. Neurocomputing 2018, 311, 51–64. [Google Scholar] [CrossRef]
  97. Pattathal, V.A.; Sahoo, M.M.; Porwal, A.; Karnieli, A. Deep-learning-based latent space encoding for spectral unmixing of geological materials. ISPRS J. Photogramm. Remote Sens. 2022, 183, 307–320. [Google Scholar] [CrossRef]
  98. Han, Z.; Hong, D.; Gao, L.; Zhang, B.; Chanussot, J. Deep half-siamese networks for hyperspectral unmixing. IEEE Geosci. Remote Sens. Lett. 2021, 18, 1996–2000. [Google Scholar] [CrossRef]
  99. Zhang, X.; Sun, Y.; Zhang, J.; Wu, P.; Jiao, L. Hyperspectral unmixing via deep convolutional neural networks. IEEE Geosci. Remote Sens. Lett. 2018, 15, 1755–1759. [Google Scholar] [CrossRef]
  100. Tompkins, S.; Mustard, J.F.; Pieters, C.M.; Forsyth, D.W. Optimization of endmembers for spectral mixture analysis. Remote Sens. Environ. 1997, 59, 472–489. [Google Scholar] [CrossRef]
  101. Bateson, C.A.; Asner, G.P.; Wessman, C.A. Endmember bundles: A new approach to incorporating endmember variability into spectral mixture analysis. IEEE Trans. Geosci. Remote Sens. 2000, 38, 1083–1094. [Google Scholar] [CrossRef]
  102. Anderson, D.T.; Zare, A. Spectral unmixing cluster validity index for multiple sets of endmembers. IEEE J. Sel. Top. Appl. Earth Obs. Remote Sens. 2012, 5, 1282–1295. [Google Scholar] [CrossRef]
  103. Zare, A.; Ho, K.C. Endmember variability in hyperspectral analysis: Addressing spectral variability during spectral unmixing. IEEE Signal Process. Mag. 2014, 31, 95–104. [Google Scholar] [CrossRef]
  104. Boardman, J.W.; Kruse, F.A.; Green, R.O. Mapping target signatures via partial unmixing of AVIRIS data. In Proceedings of the Fifth JPL Airborne Geoscience Workshop, Pasadena, CA, USA, 23–26 January 1995; pp. 23–26. Available online: http://hdl.handle.net/2014/33635 (accessed on 17 September 2022).
  105. Singer, R.B.; McCord, T.B. Mars: Large scale mixing of bright and dark surface materials and implications for analysis of spectral reflectance. In Proceedings of the 10th Lunar and Planetary Science Conference, Houston, TX, USA, 19–23 March 1979; Volume 2, pp. 1835–1848. [Google Scholar]
  106. Altmann, Y.; Halimi, A.; Dobigeon, N.; Tourneret, J.-Y. Supervised nonlinear spectral unmixing using a polynomial post nonlinear model for hyperspectral imagery. In Proceedings of the 2011 IEEE International Conference on Acoustics, Speech and Signal Processing (ICASSP), Prague, Czech Republic, 22–27 May 2011; pp. 1009–1012. [Google Scholar] [CrossRef]
  107. Brown, M.; Gunn, S.R.; Lewis, H.G. Support vector machines for optimal classification and spectral unmixing. Ecol. Model. 1999, 120, 167–179. [Google Scholar] [CrossRef]
  108. Wang, L.; Liu, D.; Wang, Q.; Wang, Y. Spectral unmixing model based on least squares support vector machine with unmixing residue constraints. IEEE Geosci. Remote Sens. Lett. 2013, 10, 1592–1596. [Google Scholar] [CrossRef]
  109. Evans, B.W.; Hattori, K.; Baronnet, A. Serpentinite: What, why, where? Elements 2013, 9, 99–106. [Google Scholar] [CrossRef]
  110. Hunt, G.R.; Ashley, R.P. Spectra of altered rocks in the visible and near infrared. Econ. Geol. 1979, 74, 1613–1629. [Google Scholar] [CrossRef]
  111. Mustard, J.F. Relationships of soil, grass, and bedrock over the kaweah serpentinite melange through spectral mixture analysis of AVIRIS data. Remote Sens. Environ. 1993, 44, 293–308. [Google Scholar] [CrossRef]
  112. King, T.V.V.; Clark, R.N. Spectral characteristics of chlorites and Mg-serpentines using high- resolution reflectance spectroscopy. J. Geophys. Res. 1989, 94, 13997–14008. [Google Scholar] [CrossRef]
  113. Hunt, G.R.; Salisbury, J.W. Visible and near infrared spectra of minerals and rocks: II. Carbonates. Modern Geol. 1971, 2, 23–30. [Google Scholar]
  114. Hexter, R.M. High-resolution, temperature-dependent spectra of calcite. Spectrochim. Acta 1958, 10, 281–290. [Google Scholar] [CrossRef]
  115. Hunt, G.R. Spectral signatures of particulate minerals in the visible and near infrared. Geophysics 1977, 42, 501–513. [Google Scholar] [CrossRef] [Green Version]
  116. Rossel, R.A.V.; McGlynn, R.N.; McBratney, A.B. Determining the composition of mineral-organic mixes using UV-vis-NIR diffuse reflectance spectroscopy. Geoderma 2006, 137, 70–82. [Google Scholar] [CrossRef]
  117. Haldar, S.K. Basic mineralogy. In Introduction to Mineralogy and Petrology; Elsevier: Amsterdam, The Netherlands, 2020; p. 141. [Google Scholar]
  118. Adams, J.B.; Goullaud, L.H. Plagioclase feldspars: Visible and near infrared diffuse reflectance spectra as applied to remote sensing. In Proceedings of the Lunar and Planetary Science Conference Proceedings, Houston, TX, USA, 13–17 March 1978; pp. 2901–2909. [Google Scholar]
  119. Johnson, J.R.; Hörz, F. Visible/near-infrared spectra of experimentally shocked plagioclase feldspars. J. Geophys. Res. Planets 2003, 108, 5120. [Google Scholar] [CrossRef] [Green Version]
  120. Adams, J.B. Interpretation of visible and near-infrared diffuse reflectance spectra of pyroxenes and other rock-forming minerals. In Proceedings of the Infrared and Raman Spectroscopy of Lunar and Terrestrial Minerals; Karr, C., Ed.; Academic Press, Inc.: New York, NY, USA, 1975; pp. 104–106. [Google Scholar]
Figure 1. Schematic representation of the laboratory imaging spectroradiometer-based experimental setup used for spectral acquisition of rock samples, describing its components and working principle.
Remotesensing 15 03300 g001
Figure 2. Rock samples of (a) serpentinite and (b) granite with dimensions 10 by 10 cm used for our experiment.
Remotesensing 15 03300 g002
Figure 3. Flowchart summarizing our proposed methodology.
Remotesensing 15 03300 g003
Figure 4. Generation of areal coverage-based ground truth fractional abundance maps for endmembers of (a) serpentinite and (b) granite tiles.
Remotesensing 15 03300 g004
Figure 5. X-ray diffraction (XRD) graph for powdered samples 75 µm) of (a) serpentinite and (b) granite highlighting the diffraction peaks and identification of constituent minerals.
Remotesensing 15 03300 g005
Figure 6. Extraction and mapping of pure pixels obtained from the hyperspectral images of (a) serpentinite and (b) granite.
Remotesensing 15 03300 g006
Figure 7. Fractional abundance maps estimated for the hyperspectral images of (a) serpentinite and (b) granite using the discussed spectral unmixing techniques and comparison with their ground truth.
Remotesensing 15 03300 g007aRemotesensing 15 03300 g007b
Figure 8. Continuum removed reflectance spectra for mineral constituents of (a) serpentinite and (b) granite obtained from pure regions on the rock samples with highlighting their diagnostic spectral features.
Remotesensing 15 03300 g008
Figure 9. Comparison of performance metrics of spectral unmixing techniques implemented on serpentinite and granite samples: (a) overall root mean squared error (RMSE) of estimated fractional abundances; (b) average reconstruction error (ARE) obtained during image reconstruction from fractional abundance estimates.
Remotesensing 15 03300 g009
Figure 10. Error images and statistical distributions of performance metrics for unmixing serpentinite: (a) RMSE images; (b) ARE images; (c) line histogram of RMSEs showing the normalized pixel count (in percentage); and (d) line histogram of AREs showing the normalized pixel count (in percentage) for each of the spectral unmixing techniques implemented.
Remotesensing 15 03300 g010
Figure 11. Error images and statistical distributions of performance metrics for unmixing granite: (a) RMSE images; (b) ARE images; (c) line histogram of RMSEs showing the normalized pixel count (in percentage); and (d) line histogram of AREs showing the normalized pixel count (in percentage) for each of the spectral unmixing techniques implemented.
Remotesensing 15 03300 g011
Figure 12. Pie charts comparing the composition of (a) serpentinite and (b) granite obtained from XRD analysis with the ground truth and estimated fractional abundance maps obtained using the discussed spectral unmixing techniques implemented on the rock samples.
Remotesensing 15 03300 g012
Table 1. Geochemical composition of serpentinite and granite samples obtained using electron probe micro-analyzer (EPMA).
MineralGeochemical Composition (%)
SiMgFeCaNaAl
Serpentinite
Serpentine43.536.83.70.1-1.3
Calcite-0.3-61.7--
Granite
Quartz98.8----0.1
K-feldspar65.2-0.1-0.918.6
Plagioclase64.9-0.13.310.221.9
Biotite36.38.428.7--15.4
Disclaimer/Publisher’s Note: The statements, opinions and data contained in all publications are solely those of the individual author(s) and contributor(s) and not of MDPI and/or the editor(s). MDPI and/or the editor(s) disclaim responsibility for any injury to people or property resulting from any ideas, methods, instructions or products referred to in the content.