Abstract
Forest fires have become a significant global threat, with many negative impacts on human habitats and forest ecosystems. This study proposed a forest fire identification method by fusing visual and infrared images, addressing the high false alarm and missed alarm rates of forest fire monitoring using single spectral imagery. A dataset suitable for image fusion was created using UAV aerial photography. An improved image fusion network model, the FF-Net, incorporating an attention mechanism, was proposed. The YOLOv5 network was used for target detection, and the results showed that using fused images achieved a higher accuracy, with a false alarm rate of 0.49% and a missed alarm rate of 0.21%. As such, using fused images has greater significance for the early warning of forest fires.
1. Introduction
As an important part of global resources, the forest can provide a habitable environment for human beings, and have a variety of ecological functions such as conserving water and soil, maintaining ecological species diversity, and maintaining the balance of carbon and oxygen in the atmosphere [1,2]. However, due to climate change and global warming, increasingly extreme hot weather has emerged in recent years, causing forest fires to increase dramatically in frequency and scale. Due to the stochastic characteristics of forest fire, it is difficult to put out, which can bring huge losses to forest resources, people’s lives, and properties, and seriously damages the balance of the forest ecosystems [3]. The earlier a forest fire is detected, the sooner it can be extinguished, preventing more extensive damage. To reduce the danger of forest fire, daily monitoring and timely detection of forest fire is of great importance [4,5,6]. The means of forest fire monitoring commonly include ground manual patrol, fixed-point lookout monitoring, satellite remote sensing monitoring [7], and aerial monitoring [8]. The Unmanned Aerial Vehicle (UAV) is a new type of aviation platform. With the constant maturity in its technology, it has been applied in many fields, such as weather monitoring, disaster monitoring, power line inspection, and disaster rescue. In particular, it is easy to operate, highly mobile, low cost, easy to maintain, lightweight, small volume, and has real-time inspection capabilities, etc., in forest fire prevention and forest patrol, and other operations can also show its advantages [9,10,11,12]. Using the images taken by UAVs as data, combined with computer technology such as image processing to identify forest fires, has been one of the most commonly used tools in forest fire monitoring. This is based on an unmanned aircraft forest fire detection (UAV-FFD) platform, where fire images can be captured and transmitted factually to the ground station. Using a large-scale YOLOv3 network, Jiao et al. [13] developed an algorithm for detecting fires that demonstrates a recognition rate of around 91% and can process 30 frames per second. In their study, Francesco et al. [14] suggested a noise-resistant algorithm for detecting forest fires through edge detection. This one-dimensional algorithm uses infrared images captured by unmanned aerial vehicles (UAVs) as input and leverages the established physical attributes of the target of interest to amplify the discontinuity of feature edges. A long short-term memory convolutional neural network model, in combination with the gray wolf optimization algorithm, was introduced by Wang et al. [15] to forecast the spread of fires using infrared images captured by UAVs. This approach yields relatively precise predictions in a timely manner, enabling real-time decision-making to control fire suppression.
Most existing forest fire detection methods employ either visual images or infrared images. Visual images have the advantages of rich color, high resolution, and clear environmental texture information. However, visual images are more susceptible to environmental factors. For example, when the UAV is located at a high altitude, the smoke in the air tends to obscure the information about the ground flames, thus, preventing firefighters from determining the exact location and scale of the fire. Infrared images can show the temperature of an object and are more suitable for flame identification and detection tasks. However, infrared images have a low spatial resolution, low contrast ratio, poor environmental texture information, and blurred visual effects. It is difficult for firefighters to make judgments about the location of the fire, so infrared images play little role in the subsequent forest fire-fighting work. Therefore, if the visual and infrared images can be fused into one image by the method of image fusion, combining the advantages of both, it can not only ensure the accurate detection of forest fire information, but also determine the location of the forest fire more clearly through the environmental information of the image.
Visual and infrared image fusion is an important application of image fusion technology, which can integrate the information from visual and infrared images to obtain a comprehensive image with both the visual and infrared information. Visual images can provide information such as the shape and color of targets, but they are severely limited at night or in low-light conditions. Infrared images, on the other hand, can provide information on the thermal distribution of objects and can accurately detect targets even in dark environments. Visual and infrared images have different features at the object edges, contours, and other aspects, and fusing them can reduce the noise in the image while preserving the important features of both [16]. By inputting both the infrared and visual images into a deep learning network, Li Hui [17] carried out a series of feature extraction and fusion procedures. The unique feature of this network is its adaptability to diverse input resolutions and its ability to generate fusion images with any desired output resolution. Duan et al. [18] proposed a dual-scale fusion method based on parallel salient features. This method first performs saliency detection on the infrared and visible light images to obtain saliency maps of the two images. Then, using dual-scale analysis, the images are divided into two scales. The saliency maps of the two scales are fused separately to obtain two fusion images. Finally, a feature selection method is used to combine the fusion images of the two scales to generate the final fusion image. By breaking down the visual and infrared images into low-frequency and high-frequency components, Yin et al. [19] extracted the feature information pertaining to significant objects in the image from the low-frequency component, and combined the low-frequency components of both the images using a weighted average method. In the high-frequency component, they fused the high-frequency components of both the images using a detail-preserving technique.
Current methods for forest fire recognition and detection mainly focus on single-spectrum images. Visible light images offer rich colors, high resolution, and clear environmental texture information, making observation more intuitive. Flame information can be identified through feature extraction and processing, such as color and brightness. However, visible light images are susceptible to environmental factors, such as smoke, which can obscure the ground fire information, making it difficult to judge the location and size of the fire accurately. Moreover, visible light images may not produce satisfactory results under low-light conditions. Infrared images are grayscale images that display object temperatures, with lower grayscale values indicating higher temperatures, and vice versa. This characteristic makes infrared images more suitable for forest fire recognition and detection tasks, as flame information can be accurately determined by processing the grayscale feature of each pixel in the image. However, infrared images have low spatial resolution, low contrast, poor environmental texture information, and blurry visual effects, making it difficult to judge the fire’s location based on the environmental information in the image. Moreover, the feedback provided by infrared images to firefighters is not always clear. By fusing the visible light and infrared images using image fusion methods, the advantages of both can be combined, ensuring the accurate detection of forest fire information and providing clear information about the fire’s location through the environmental information in the image. This can facilitate the subsequent firefighting work.
To address the limited information expression capacity of single images and inadequate forest fire monitoring under a single spectrum, this study proposed a method of target monitoring based on fused pictures for the early detection of forest fires and achieving the goal of early fire warning. By fusing the visible and infrared photos and utilizing the full information and rich characteristics of the fused images, the method minimized the incidence of false alarms and missed alarms associated with identifying forest fires. The study began by creating a dataset of visible and infrared photos captured by a UAV that included fire information and pre-processing the dataset. A deep learning model of the image fusion network, Fire Fusion-Net (FF-Net), was then proposed based on the VIF-net architecture. The FF-Net was enhanced by adding an attention mechanism based on the unique quality of local brightness in photographs of forest fires, leading to superior image fusion. Target detection on the fused images was performed using the YOLOv5 network. Finally, the experimental results were compared and analyzed. The main contributions of this study are as follows:
- Using an unmanned aerial vehicle, this study built a multispectral image dataset of forest fires through the integration of image fusion and target detection techniques. Compared to publicly available image fusion datasets, this dataset boasted significant advantages in terms of the image quantity, resolution, and content richness. As such, the dataset could be more effectively employed for deep learning-based multispectral image fusion.
- In this study, an image fusion network named Fire Fusion-Net (FF-Net) was proposed, which is based on the dense block architecture. An attention mechanism was incorporated to enhance the fusion effect in regions with prominent features, such as the flames in images. Additionally, the impact of brightness on high-resolution images was taken into account, and the loss function was improved. Fusion experiments were conducted using different algorithms and compared with traditional image fusion datasets and the image fusion datasets constructed in this study. The results indicated that the proposed method outperformed other methods in terms of fusion performance, with lower distortion, noise, and better fusion evaluation metrics. This image fusion approach is not limited to forest fire image fusion tasks and could be applied to other image fusion tasks as well.
- The present study suggested a method of forest fire identification using fused images for target detection, which exhibited a higher accuracy rate and reduced the false alarm and missed alarm rate compared to single spectrum recognition. This approach could significantly enhance the reliability of forest fire identification.
2. Data
2.1. UAV
As shown in Figure 1, the DJI Royal 2 Industry Advance™ UAV was selected as the data acquisition equipment. This drone can be equipped with an RTK module, which is rather important to enhance the precision of the spatial position. The technical parameters related to the UAV are shown in Table 1.
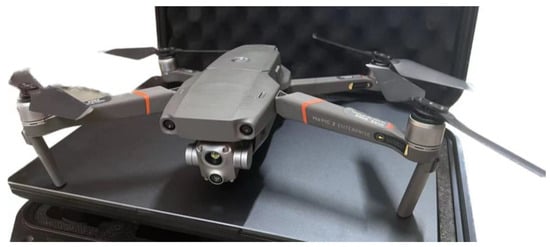
Figure 1.
Exterior view of the UAV. The UAV is equipped with visible and infrared cameras and can capture images from the same angle and position simultaneously.

Table 1.
Technical parameters of the UAV.
The drone was equipped with both an infrared camera and a visible light camera for simultaneous shooting. The infrared camera used an uncooled vanadium oxide micro-thermal radiation calorimeter as a sensor, which can measure wavelengths in the range of 8–14 μm, and its temperature measurement range can reach −25–450 °C. The sensor of the visible light camera lens uses a 1/2-inch CMOS sensor with an effective pixel count of up to 48 million. The output image format is R-JEPG, and the output video format is MP4.
2.2. Dataset
The existing forest fire monitoring images from drones are commonly high-resolution, but the public datasets for image fusion, such as the TNO dataset and INO dataset [20], have issues such as low resolution, small dataset size, and lack of features such as flames and smoke, which cannot meet the needs of this research. Therefore, considering the various influencing factors, this study conducted forest fire simulation experiments and used the UAV for image acquisition. Through data preprocessing, a forest fire image fusion dataset was constructed.
In order to improve the data acquisition efficiency, this study used video recording to obtain the corresponding infrared and visible light video data. Then, images were obtained by extracting frames from the videos. To ensure a sufficient number of data samples while also maximizing the diversity of the dataset contents, this study extracted one image every five frames; the image format was JPEG.
The preprocessing of the images involved resizing the images to a uniform size. The visual and infrared images captured by the drone were already perfectly aligned, and the centers of the two images were the same. However, the resolution of the visible light and infrared cameras was different, resulting in different image sizes. The size of the infrared image was 640 × 512, while the size of the visual image was 1920 × 1080. Therefore, before performing the subsequent image fusion work, the images needed to be cropped to the same size. In this study, the visual image was cropped to the same size as the infrared image, which was 512 × 512, using the center point as the reference. After cropping, the visual and infrared images were of the same size and were considered as a complete set of data, as shown in Figure 2.
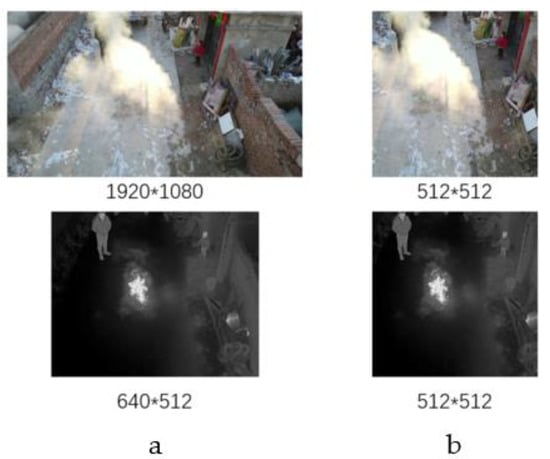
Figure 2.
Comparison of image size before and after pre-processing. (a) is the image before pre-processing; (b) is the image after pre-processing.
The built dataset consisted of two parts. The first part was a dataset of different scenes, which were captured by the drone in various scenarios, including people, trees, vehicles, streets, and other elements. The images were taken at different heights such as low, medium, and high, and at different times of the day, including sunny, cloudy, day, and night. By enriching the content of the dataset, the capability of the image fusion network could be improved during learning. According to the statistics, the scene dataset contained a total of 6972 pairs of images, each pair consisting of one visual image and one infrared image, both of which were of the size 512 × 512. There were 4128 daytime images and 2844 nighttime images. Some of the images are displayed in Figure 3. The classification of the dataset is shown in Table 2.
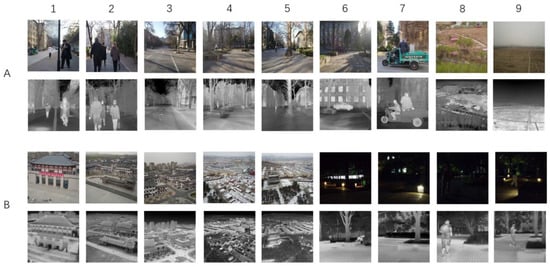
Figure 3.
Scene portion of the image fusion dataset.(A,B and 1–9 are used as serial numbers to guide the images).
Table 2.
Classification of the scenario part of the dataset.
The second part of the dataset was the forest fire image dataset. Due to the objective conditions, it was difficult to obtain the image data containing the forest fires. Therefore, this study mainly simulated forest fires by forest fuel, mainly consisting of dry branches and leaves, supplemented by corn stalks, and used the UAV for aerial photography to obtain the image. To make the content of the dataset richer and more in line with the real forest fire environment, the dataset included images of smoke, fire, smoke and fire, and residual ash after burning. The built dataset was made up of a total of 7193 images, including 4670 daytime images and 2523 nighttime images. Some of the images of the fire dataset are displayed in Figure 4. The classification of the dataset is shown in Table 3.
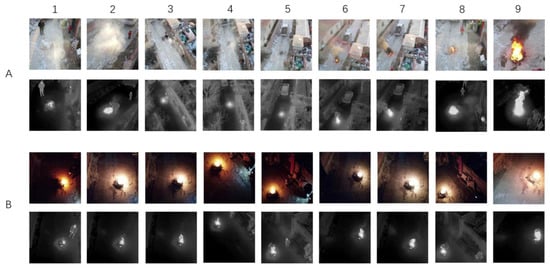
Figure 4.
Fire part of the image fusion dataset. (A,B and 1–9 are used as serial numbers to guide the images).
Table 3.
Classification of the fire part of the dataset.
3. Methods
In this paper, the FE-Net Network was proposed to fuse the visual and infrared images. First, the network architecture of FF-Net was described in detail. Then, the attention mechanism module was introduced in the FE-Network. Finally, the loss function of the network was improved.
3.1. FF-Net Network Architecture
In order to simplify the network structure, the fusion strategy for the RGB visual images was the same as grayscale infrared images in this paper. Feature extraction, feature fusion, and image reconstruction were the three primary parts of the FF-Net network architecture, as seen in Figure 5. IA and IB, respectively, represent the visual and infrared images and were supplied into the dual channels. The feature extraction contained DenseBlock [21] modules. The first layer, C11/C12, contained 3 × 3 filters to extract the rough features and the dense block contained three convolutional layers, which also included 3 × 3 filters, and each layer’s output was cascaded as the input of the next layer.
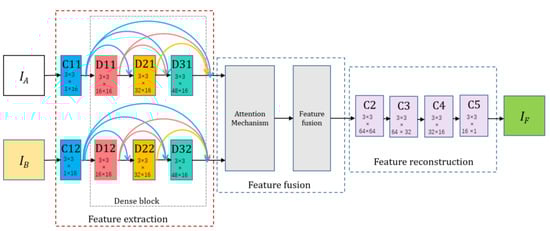
Figure 5.
The architecture of the proposed FF-Net.
For each convolutional layer in the feature extraction part, the input channel number of the feature maps was 16. The architecture of encoder had two advantages. First, the filter size and stride of the convolutional operation were 3 × 3 and 1, respectively. With this strategy, the input image could be any size. Second, the dense block architecture could preserve the deep features as much as possible in the encoding network and this operation could make sure all the salient features were used in the fusion strategy.
The feature fusion section included an attention module and an additive fusion strategy module. The features obtained from the dense blocks were weighted using the attention module, and then the features were fused using the additive fusion strategy. The attention mechanism module will be described in detail in Section 3.2. The additive fusion strategy was the same as the one used in DeepFuse [22], and its operation process is shown in Figure 6.
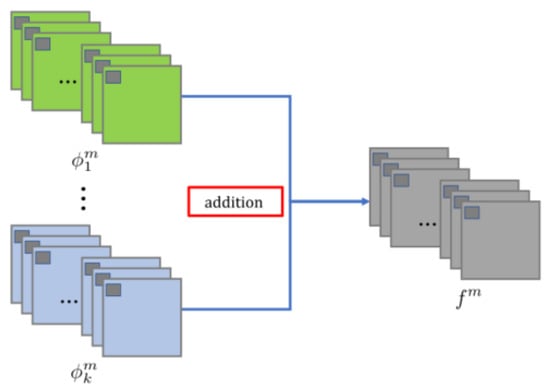
Figure 6.
The procedure of the addition strategy.
In our network, m ∈ {1, 2, · · ·, M}, M = 64 represented the number of feature maps. k indicated the index of feature maps which were obtained from input images. Where (i = 1, · · ·, k) indicated the feature maps obtained by the encoder from the input images, denoted the fused feature maps. The addition strategy was formulated by Equation (1).
where (x, y) denoted the corresponding position in the feature maps and fused feature maps. Then, would be the input to the decoder and the final fused image would be reconstructed by image reconstruction.
Finally, the results of the fusion layer were reconstructed from the fused features by four other convolutional layers, C2, C3, C4, and C5. The more detailed network architecture is shown in Table 4.
Table 4.
The architecture of the training process.
3.2. Attention Mechanism
In the initial network structure, there was no attention module between the feature extraction and feature fusion sections. This was because the initial network was trained using a 64 × 64 randomly cropped dataset extracted from the public dataset TNO. This approach was feasible since the original image fusion dataset had low resolution. However, the existing drone-based forest fire multispectral image dataset has a higher resolution, and some information has obvious local features, such as the flame area in the image. Therefore, this study improved the feature fusion section of the network.
In Sanghyun et al.’s study [23], the attention mechanism not only makes the network focus on the region of interest, but also improves the expression of the region of interest. The goal was to improve the representation by using the attention mechanism: focusing on the important features and suppressing the unnecessary ones. In the feature fusion part of the FF-Net network, the features extracted by the deep feature block were connected to the attention mechanism to refine the global features extracted by the deep feature block before fusion, while enhancing the local features that were of more interest. The features enhanced by the attention mechanism were directly connected to the feature fusion layer.
The convolutional bottleneck attention module (CBAM) [24], an approach that improves the expressiveness of the network, was employed in this paper. CBAM uses two different modules (channel and space) to induce the feature refinement of attention, achieving significant performance improvements while keeping the overhead small. The CBAM was given an intermediate feature map F ∈ R (C × H × W) as the input, and its operation process was generally divided into two parts. First, the input was globally max-pooled and mean-pooled by channel, and the two one-dimensional vectors after pooling were fed to the fully connected layer and summed to generate a one-dimensional channel attention MC ∈ R (C × 1 × 1), and then the channel attention was multiplied with the input elements to obtain the channel attention-adjusted feature map F′. Secondly, F′ was pooled by space for the global maximum pooling and mean pooling, and the two two-dimensional vectors generated by the pooling were spliced and then convolved to finally generate the two-dimensional spatial attention MC ∈ R(1 × H × W), and then the spatial attention was multiplied with F′ by element; the specific process is shown in Figure 7, and the CBAM generation attention process can be described as follows.
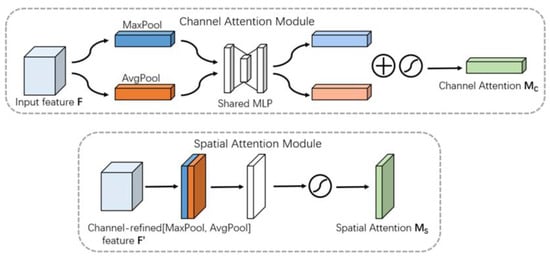
Figure 7.
Diagram of each attention sub-module (Reprinted with permission from Ref. [24]).
3.3. Loss Function
In this section, we set the M-SSIM and TV as loss functions with the aim of implementing unsupervised learning and determining the appropriate parameters to fully utilize the network.
SSIM is the structural similarity index between two different images, as seen in Equation (3). It combines three factors—luminance, structure, and contrast—to comprehensively assess picture quality. In the original network, due to the limitation of the dataset, the luminance at lower spatial resolution could not measure the consistency of the global luminance, so the luminance component was neglected. Let X be the reference image and Y be the test image, which is described as follows.
In our study, however, the multispectral forest fire image dataset was of higher resolution, and there were regions in the image where the local brightness of the flame was more obvious, so we rewrote Equation (3) as Equation (4).
where μ and σ denote the mean and standard deviation respectively, and is the cross-correlation between X and Y. C1 and C2 are stability coefficients to deal with cases where the mean and variance are close to zero. The standard deviation of the Gaussian window was set to 1.5 in the calculation.
Then, and were calculated according to Equation (4), where IA, IB, and IF denoted visual, infrared and fused images, respectively. W represented the sliding window with the size of m × n, which moved pixel by pixel from the top-left to the bottom-right. This study set C1and C2 as 9 × 10⁻⁴, and the size of the window as 11 × 11. Generally, the local grayscale value increases with the richness of the thermal radiation information, so the temperature of a thermal target can be measured by the intensity of its pixels. Therefore, we leveraged to calculate the average intensity of pixels in the local window to measure the score of SSIM, where Pi was the value of pixel i.
A function was created to adaptively learn deep features when is larger than or equal to , indicating that the local window of IB included more thermal radiation. The formulas are provided in Equations (5) and (6).
where N represents the total number of sliding windows in a single image.
This paper introduced the total variation function to design the mixed loss function in order to achieve gradient transformation and remove some noise, which is described as follows.
where R is the difference between the visual and fused images, is the l2 distance, and LTV denotes the total variation loss function. Since the two types of loss functions were not an order of magnitude, when the weight of LSSIM in the loss function was relatively low, this led to low contrast and low quality in the fused image. In contrast, when the weight of LSSIM in the loss function was relatively high, the details in the visual images were lost to a certain degree. To achieve an approximate tradeoff between the infrared and visual features, we set a hyper-parameter λ, which was set as different values to weigh the impact between them. The loss function is described as follows.
3.4. Experimental Parameters Setting
The experiments were implemented on Tensor Flow and trained on a PC equipped with an AMD Ryzen 7 4800 H with Radeon Graphics 2.90 GHz CPU, 8 GB RAM and a NVIDIA GeForce RTX2060 GPU. Some of the comparative experiments were made on a MATLAB R2020a.
To fully evaluate the algorithm, we conducted the experiments on both the TNO dataset and the self-built dataset and compared it with several more advanced image fusion methods, including three traditional methods such as the Dual Tree Complex Wavelet Transform (DTCWT), Adaptive Sparse Representation (ASR), Cross Bilateral Filter (CBF), and three deep learning methods such as Fusion Gan [25], U2Fuison [26], and DenseFuse [27]. All six method implementations are publicly available, and we set the parameters reported in the original paper.
Subjective visual evaluation systems are susceptible to human factors such as visual acuity, subjective preferences, and personal emotions. In addition, the differences between image fusion results based on subjective evaluation are not significant in most cases. Therefore, it is essential to analyze the fusion performance based on quantitative evaluation. Eight image fusion metrics were selected for quantitative evaluation, including entropy (EN), mutual information (MI), QAB/F, standard deviation (SD), spatial frequency (SF), average gradient (AG), mean squared error (MSE), and peak signal-to-noise ratio (PSNR) [28].
Entropy (EN) measures the amount of information contained in the fused image according to information theory. It is defined as follows:
where L represents the number of gray levels and represents the normalized histogram of the corresponding gray level in the fused image. The larger the EN, the more information that is contained in the fused image and the better the fusion algorithm performs.
The mutual information (MI) meter is a quality measurement that calculates the amount of information transferred from the source images to fused images. It is defined as follows:
where and denote the marginal histograms of the source image X and the fused image F, respectively. denotes the joint histogram of the source image X and the fused image F. A high MI measure shows that significant information is transferred from the source images to the fused image, indicating good fusion performance.
QAB/F calculates the amount of edge information transmitted from source images to fused images, assuming that the edge information in the source images is retained in the fused image. It is defined as follows:
where denotes the edge strength and orientation values at location , and denotes the weight that expresses the importance of each source image to the fused image. A high QAB/F ratio indicates that a significant amount of edge information is conveyed to the fused image.
The standard deviation (SD) metric is based on a statistical concept that indicates the distribution and contrast of the fused image. It is defined as follows:
where μ denotes the mean value of the fused image. A fused image with high contrast often results in a large SD, which means that the fused image achieves a good visual effect.
Spatial frequency (SF) is an image quality index based on gradients, i.e., horizontal and vertical gradients, which are also called spatial row frequency (RF) and column frequency (CF), respectively. It is defined as follows:
A fused image with a large SF is sensitive to human perception according to the human visual system and has rich edges and textures.
The average gradient (AG) metric quantifies the gradient information of the fused image and represents its detail and texture. It is defined as follows:
The larger the AG metric, the more gradient information the fused image contains and the better the performance of the fusion algorithm.
The mean squared error (MSE) computes the error of the fused image in comparison with those in the source images and, hence, measures the dissimilarity between the fused image and source images. It is defined as follows:
A small MSE metric indicates a good fusion performance, which means that the fused image approximates to the source image and minimal error occurs in the fusion process.
The peak signal-to-noise ratio (PSNR) metric is the ratio of the peak value power and the noise power in the fused image and, thus, reflects the distortion during the fusion process. It is defined as follows:
where r denotes the peak value of the fused image. The larger the PSNR, the closer the fused image is to the source image and the less distortion the fusion method produces.
4. Results and Discussion
In this section, we first provided the experimental configuration and experimental details. Then, we performed some comparative experiments of image fusion networks on the TNO dataset and on our dataset to evaluate the performance of the FF-Net network. Finally, we made target detection experiments and compared them with the visual and infrared images to demonstrate the superiority of the fused images.
4.1. Contrastive Experiments
To ensure the performance of the fusion network, we need to further discuss the choice of parameters λ. To weigh the effects between them, we first set them to 100, 1000, and 10,000 and performed preliminary analysis. The results of the fused images are shown in Figure 8.
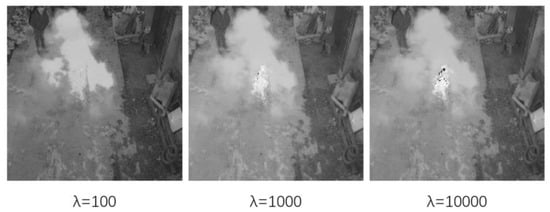
Figure 8.
Results of fused images with different loss function parameters.
From the experimental results in Figure 8, when λ was 100 or 1000, there was little difference in the fusion results, while the brightness of the former was obviously weaker, and there was loss of some texture details. Additionally, when λ was 10,000, there was a more obvious distortion effect in the fusion results, especially in the flame region where the luminance was obvious. To further test the network performance, we set the parameters λ to 100, 300, 500, 800, and 1000. The test image results are shown in Figure 9. In addition, we also conducted a quantitative fusion evaluation of the test results, and the evaluation results are shown in Table 5. In the tables, the best values are in bold type and the second best values are in red type. The same applies to the following tables.
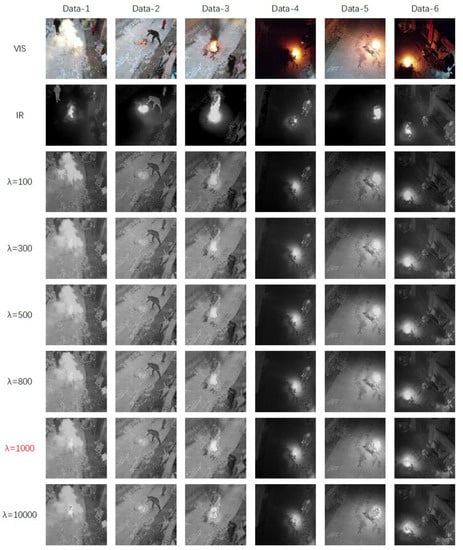
Figure 9.
Results of fused images with different loss function parameters.
Table 5.
Image fusion evaluation results under different loss function parameters.
The experimental results showed that as the parameter λ increased, there were more texture details appearing in the fused image, which resulted in a better evaluation metric. When λ was too high, however, it introduced some redundant information, causing the evaluation index to drop again. Based on the comprehensive consideration of the quantitative metrics and visual performance, we concluded that the best fusion result could be obtained at the λ value of 800 and, therefore, this value was set in the subsequent comparative experiments.
After that, we tested three datasets, including the TNO dataset, the daytime part, and the nighttime part of the self-built dataset, as shown in Figure 10, Figure 11 and Figure 12. In addition, we also performed a quantitative fusion assessment of the test results, which is shown in Table 5 and Table 6.
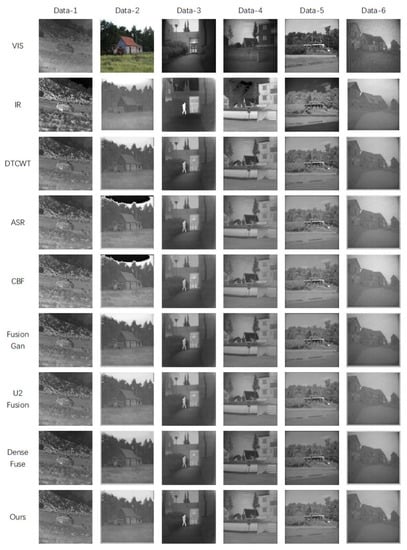
Figure 10.
Image fusion results with the TNO datasets.
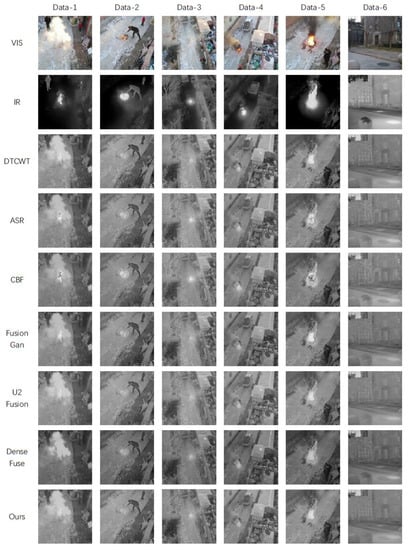
Figure 11.
Image fusion results with the daytime datasets.
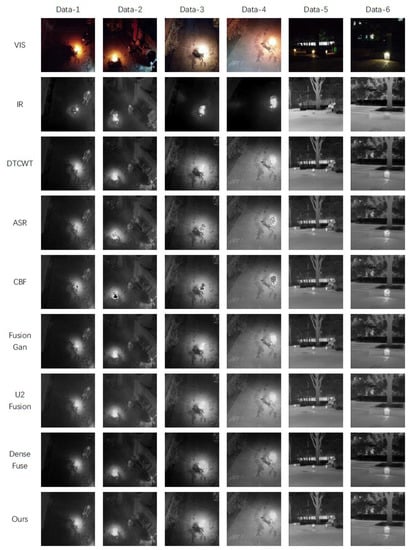
Figure 12.
Image fusion results with the night datasets.
Table 6.
Image fusion evaluation results with the TNO datasets.
According to the results in Figure 10 and Table 6, the performance of the FF-Network and the other methods on the TNO dataset was great, and our network achieved more excellent fusion results. Compared with the traditional methods such as DTCWT and ASR, our method achieved clearer images and obtained more explicit information. Compared with deep learning methods such as Dense Fuse, our method was more advantageous in terms of luminance performance. In particular, the fusion results of Data-3 by our method were clearer on the regions of human shadow with obvious luminance, and more important regions of the image were highlighted, which could also prove that the attention mechanism plays a great role in the enhancement of the results of image fusion. It was also evident from the evaluation data in Table 6 that our network is leading in EN, MI, SF, MSE, and PSNR. In addition, the metrics of QAB/F, SD and AG were the second best, which indicated that the performance of our method on the TNO dataset was superior to other methods.
On the self-built daytime dataset, according to the results in Table 7 and Figure 11, the thermal radiation information of the infrared images could be used as supplementary information for the visual images, which makes the information of the fused image richer and clearer. As shown in Data-1, the information layers of the fused image were more distinct, and the smoke information in the visual images and the flame information in the infrared image at the same time can be seen in the fused images, which makes the judgment of the fire and the fire position easier. The fused images had good visual quality, meaning that they contained the rich texture details of the visual images and the prominent target areas in the infrared image were enhanced. In Figure 11, the fused images obtained by the DTCWT method were relatively more blurred and had less texture details. The ASR and CBF methods could not sharpen the regions with prominent brightness, resulting in distortion, especially where the brightness at the flame was obvious. Although the methods such as FusionGan are relatively successful in fusing the detail information of visual images with the thermal radiation information of infrared images, they inevitably suffer from the interference of useless information in the fusion process. It can be seen from the images that FusionGan did not do well in processing the information of the smaller areas, such as the flame area in Data-3, which was very small due to the heightened view, which makes the fusion effect of Fusion Gan not desirable. Dense Fuse was not good at expressing the brightness of the image, and the overall color of the fused image was dark. In the case of Data-1 and Data-5, where both smoke and fire were contained, Dense Fuse could not clearly express the hierarchy of information. The image fused by U2 Fusion was visually closer to that produced by our network, but U2 Fusion did not make the brightness clearer in the flame area.
Table 7.
Image fusion evaluation results with our datasets.
On the self-built night datasets, based on the results in Figure 12, both the infrared and visual images only provided limited scene information, and it was difficult to judge the fire location based on a single image, so it was a meaningful challenge to adaptively fuse the information in the infrared and visual images. As shown in Data-1 and Data-2, the visual image contained the surrounding environment information based on the flame illumination, but the obscured shadow part could reflect very limited texture information due to the insufficient illumination capability. The grayscale values of the infrared images depended on the different temperature of the object radiating outward, which made the scene information obtained from the infrared image at night more obvious. However, the infrared images reflected few details of the object texture. The fused image combined the rich texture information of the visual image with the characteristic of the infrared image, retaining the sensitivity of the infrared image to temperature. The fused image expressed clearer scene information and was more suitable for human visual habits, while also emphasizing the areas of the image where brightness was more prominent. As can be seen in the listed images in Figure 12, all the algorithms fused the complementary information in the infrared and visual images to some extent, but there were still some subtle differences in the fusion results of the different algorithms. Both ASR and CBF methods were unable to sharpen the regions with prominent luminance, so the fused images by both the above methods have the distortions. Although the Fusion Gan methods were also more successful in fusing the detail information of visual images with the thermal radiation information of the infrared images, they were still inevitably disturbed by useless information in the fusion process. U2Fusion and Fusion Gan did not perform well in detail texture. Dense Fuse still had the problem of poor visual effect in brightness performance, and also failed to achieve the goal of highlighting the significant target regions.
4.2. Ablation Experiment
4.2.1. Attention Mechanism Analysis
To verify the specific role of the attention mechanism, an ablation study on the attention mechanism was made, as shown in Figure 13 and Table 8. Without the attention mechanism, several evaluation metrics of the fusion images were degraded. In contrast, FF-Net achieved enhanced fusion of the salient target regions while effectively improving the performance of the fused images.
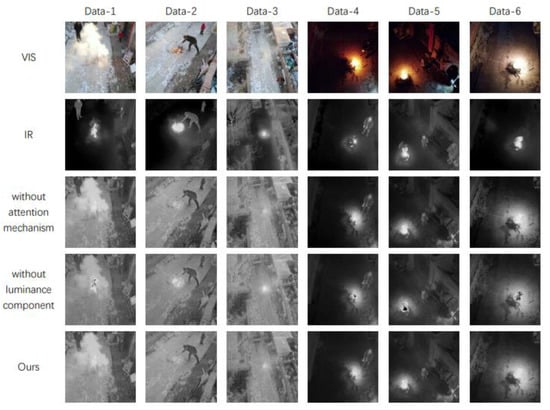
Figure 13.
Image fusion results of the ablation experiment.
Table 8.
Image fusion evaluation of the ablation experiment.
4.2.2. Loss Function Analysis
The ablation study on the loss function was made and the results are shown in Figure 13. It can be seen that the fused method without luminance loss handled the regions with significant luminance very badly, and there was a lot of redundant noise and poor texture details in the fused images. It can also be seen from the data in Table 8 that all the image evaluation metrics decreased in the absence of luminance in the loss function. This indicated that adding the luminance part into the loss function could effectively improve the fusion performance of the network, especially in that it could better handle the fusion of features in the regions of the image with significant luminance.
4.3. Target Detection Experiments
Target detection is a general advanced computer vision task, and its performance also reflects well the semantic information integrated in the fused images. We used a more advanced detector, namely YOLOv5 [29,30], to evaluate the target detection performance on the fused images. We selected 1000 images from the dataset, as a datasets set containing almost all possible scenarios, and manually annotated two key categories, i.e., smoke and fire. The ratio of the training set, test set, and validation set was 3:1:1. The experimental hardware platform was a computer equipped with an AMD Ryzen 7 4800 H and Radeon Graphics 2.90 GHz CPU, with 16 GB of memory and an NVIDIA GeForce RTX2060 GPU. The initial learning rate in training was set to 0.01, and momentum was set to 0.9. If there is a sustained small change in the gradients during training, the learning rate will be moderately increased due to the momentum setting, which accelerates the training process. The batch size was set to eight, and a total of one hundred epochs were trained.
After this, we fed the visual images, infrared images, and fused images directly into the YOLOv5 detector respectively, and used the accuracy (ACC), the false alarm rate (FAR) and the missed alarm rate(MAR) as a measure of the target detection performance. Some example results of the detection are shown in Figure 14 and Figure 15, and the data results are shown in Table 9. Since the recognition of smoke was equally weak at night for the visual and infrared images, only the data for the daytime smoke was analyzed here. As can be seen from the table, both the false alarm rate and the missed alarm rate of the fused images were reduced compared to the visual and infrared images.
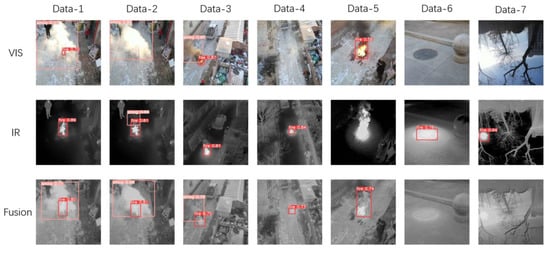
Figure 14.
Target detection results with daytime datasets.
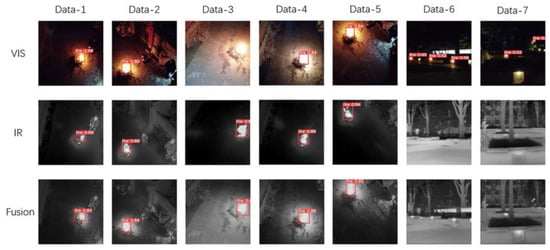
Figure 15.
Target detection results with nighttime datasets.
Table 9.
Results of false alarm rates (FAR) and missed alarm rates (MAR) for target detection.
As can be seen in Figure 14, there were some false alarms and missed alarms in both the visual and infrared images with the daytime datasets. However, the detection performance based on the fused images was better compared to the single images. Infrared images use temperature as the feature basis, which can misreport some non-flame heat source information as forest fire, which makes the false alarm rate increase greatly. Fused images, which present color texture features and temperature features in one image, avoid the above problem and, thus, greatly improve the accuracy of target detection. In addition, fused images also have better features based on the task of forest fire monitoring. As shown in Data-3, the most obvious feature of early forest fire was smoke, and the temperature of the smoke gradually approached that of the environment as it spread, so the infrared images were non-beneficial to identify smoke, while the fusion images inherited the feature that visual images can contribute to detect smoke, which is of greater significance for the early forest fire monitoring. As shown in Data-1 and Data-2, although smoke could help to determine whether a forest fire was occurring, the location and size of the fire source were the main purpose of forest fire monitoring. From the visual images, the thick smoke obscured most or even all of the fire information, so it was difficult to determine the size and the location of the fire source based on the visual images. However, the fused images integrated the visual images with the infrared images, which could help to detect early forest fire and provide more accurate information to judge the size and location of the fire.
As can be seen in Figure 15, there were some false alarms and missed alarms in both the visual and infrared images under the nighttime dataset. However, the detection performance based on the fused images was better compared to the single images. Due to the poor illumination condition in the nighttime, the brightest objects in the visual images were usually mistaken for fire, thus, making the false alarm rate much higher in the visual images. However, the texture and morphological information of fire in the fusion images, derived from the infrared images, made the fire easy to be recognized in the fusion image, so the accuracy of target detection in the fusion images was greatly improved.
In order to verify the performance of our method for a real forest fire, the forest fire data captured by drones included both visual and infrared images and were used to conduct image fusion and fire recognition experiments; some experimental results are shown in Table 10 and Figure 16. As can be seen from Table 10, the recognition accuracy of the fused images was improved, compared to the visual images and infrared images. In the daytime dataset, the fire recognition accuracy was improved by 82.4% and the smoke recognition accuracy was improved by 5.4%, compared to the visual images, and the fire recognition accuracy was improved by 4.2% and the smoke recognition accuracy was improved by 66.5%, compared to the infrared images. In the nighttime dataset, the fire recognition accuracy was improved by 5.5%, compared to the visual images and was improved by 0.8%, compared to the infrared images.
Table 10.
Results of false alarm rates (FAR) and missed alarm rates (MAR) for the real forest fire datasets.
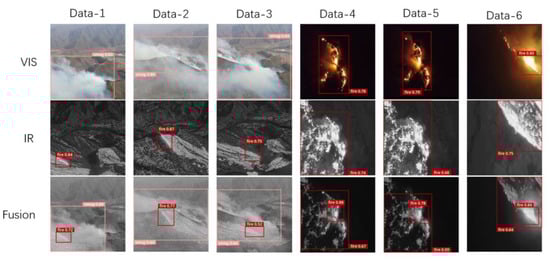
Figure 16.
Target detection results with the real forest fire datasets.
In Figure 16, it can be seen that the proposed approach in this paper was feasible. Data-1, Data-2, and Data-3 were real daytime data. In the visual images, only a large amount of smoke could be observed, and it was difficult to determine whether a fire had occurred and the location of the flames. In the infrared images, the fire characteristics could be recognized, but it was difficult to obtain the environmental texture information, and it was not easy to determine the relative position of the fire. However, compared with the results in the single-spectrum images, both fire and smoke could be clearly identified in the fused images and the location of fire could be more easily obtained. Data-4, Data-5, and Data-6 were real nighttime data. In the fused image, not only could the real condition of the fire be accurately identified, but also the locations of severe fire could be more prominently displayed. This plays a crucial role in subsequent firefighting and rescue work.
5. Conclusions
In order to solve the problem of early warning and monitoring of forest fire, this study proposed a method based on visual and infrared image fusion to detect forest fire, and analyzed the performance of the image fusion network and the detection effect of the fused images. Firstly, we constructed a simulated forest fire dataset containing daytime and nighttime images. Next, an improved FF-Net network combining the attention mechanism with the image fusion network was proposed and experimentally validated in comparison with other image fusion methods. Then, the fused images, visual images, and infrared images were compared for target detection by the YOLOv5 network to analyze the detection effect of the fused images. The results showed that compared with some commonly used image fusion methods, the improved FF-Net network had stronger image fusion capability, the fused images were clearer and more comprehensive in terms of information, and the image fusion indexes such as EN, MI, and SF had obvious improvement. In terms of target detection, compared with the visual and infrared images, the fused images had a higher accuracy rate, and the false alarm and missed alarm rates were reduced, which could effectively improve the reliability of forest fire identification and have great significance for early forest fire warning. In addition, compared with the visual images, the fused images could more accurately determine the specific degree of flame burning; compared with the infrared images, the fused images had more obvious environmental texture information, and it was easier to clearly determine the fire location, which is more meaningful for the accurate judgment of the fire situation and the subsequent suppression work. However, there are still some problems that need to be further solved in subsequent research. This study failed to conduct simulated fire experiments in a real forest environment and did not obtain more realistic forest fire images as dataset support. Validating the effectiveness of the method in a more realistic environment is the main direction of the follow-up work.
Author Contributions
Conceptualization, Y.L., C.Z. and X.L.; methodology, Y.L.; software, Y.L. and X.L.; validation, C.Z.; formal analysis, Y.L.; investigation, Y.L.; resources, Y.T.; data curation, Y.L., X.L. and J.Z.; writing—original draft preparation, Y.L., X.L. and J.Z.; writing—review and editing, Y.T., W.C., C.Z. and X.L.; visualization, Y.L.; supervision, W.C.; project administration, Y.T.; funding acquisition, Y.T. All authors have read and agreed to the published version of the manuscript.
Funding
This research was funded by the National Natural Science Foundation of China, grant number: 31971668.
Data Availability Statement
Data available on request due to restrictions of privacy.
Conflicts of Interest
The authors declare no conflict of interest.
References
- Zhao, Z.; Li, W.; Ciais, P.; Santoro, M.; Cartus, O.; Peng, S.; Yin, Y.; Yue, C.; Yang, H.; Le Yu, L.; et al. Fire enhances forest degradation within forest edge zones in Africa. Nat. Geosci. 2021, 14, 479–483. [Google Scholar] [CrossRef]
- Benzekri, W.; El Moussati, A.; Moussaoui, O.; Berrajaa, M. Early Forest Fire Detection System using Wireless Sensor Network and Deep Learning. Int. J. Adv. Comput. Sci. Appl. 2020, 11. [Google Scholar] [CrossRef]
- Hill, A.; Field, C.B. Forest fires and climate-induced tree range shifts in the western US. Nat. Commun. 2021, 12, 6583. [Google Scholar] [CrossRef] [PubMed]
- Salavati, G.; Saniei, E.; Ghaderpour, E.; Hassan, Q.K. Wildfire Risk Forecasting Using Weights of Evidence and Statistical Index Models. Sustainability 2022, 14, 3881. [Google Scholar] [CrossRef]
- Ghorbani, K.; Baum, T.C.; Thompson, L. Properties and Radar Cross-Section of forest fire ash particles at millimeter wave. In Proceedings of the Microwave Conference (EuMC), 2012 42nd European, Amsterdam, The Netherlands, 29 October–1 November 2012. [Google Scholar]
- Sun, F.; Yang, Y.; Lin, C.; Liu, Z.; Chi, L. Forest Fire Compound Feature Monitoring Technology Based on Infrared and Visible Binocular Vision. J. Phys. Conf. Ser. 2021, 1792, 012022. [Google Scholar] [CrossRef]
- Wang, Z.; Yang, P.; Liang, H.; Zheng, C.; Yin, J.; Tian, Y.; Cui, W. Semantic Segmentation and Analysis on Sensitive Parameters of Forest Fire Smoke Using Smoke-Unet and Landsat-8 Imagery. Remote Sens. 2021, 14, 45. [Google Scholar] [CrossRef]
- Yang, J.; Qian, J.; Gao, H. Forest Wildfire Monitoring and Communication UAV System Based on Particle Swarm Optimization. J. Phys. Conf. Ser. 2021, 1982, 012068. [Google Scholar] [CrossRef]
- Kizilkaya, B.; Ever, E.; Yekta, Y.H.; Yazici, A. An Effective Forest Fire Detection Framework Using Heterogeneous Wireless Multimedia Sensor Networks. In ACM Transactions on Multimedia Computing, Communications, and Applications (TOMM); Association for Computing Machinery: New York, NY, USA, 2022. [Google Scholar]
- Chen, Y.; Zhang, Y.; Xin, J.; Yi, Y.; Liu, D.; Liu, H. A UAV-based Forest Fire Detection Algorithm Using Convolutional Neural Network. In Proceedings of the 2018 37th Chinese Control Conference (CCC), Wuhan, China, 25–27 July 2018. [Google Scholar]
- Chi, Y.; Liu, Z.; Zhang, Y. UAV-based forest fire detection and tracking using image processing techniques. In Proceedings of the International Conference on Unmanned Aircraft Systems, Denver, CO, USA, 9–12 June 2015. [Google Scholar]
- Zhang, T.; Liu, Y.; Li, J. Wheat Canopy Cover Estimation by Optimized Random Forest and UAV Multispectral imagery. J. Phys. Conf. Ser. 2022, 2203, 012013. [Google Scholar] [CrossRef]
- Jiao, Z.; Zhang, Y.; Mu, L.; Xin, J.; Jiao, S.; Liu, H.; Liu, D. A YOLOv3-based Learning Strategy for Real-time UAV-based Forest Fire Detection. In Proceedings of the 2020 Chinese Control and Decision Conference (CCDC), Hefei, China, 22–24 August 2020. [Google Scholar]
- Fdv, A.; Mb, A.; Ej, B. Infra-red line camera data-driven edge detector in UAV forest fire monitoring. Aerosp. Sci. Technol. 2021, 111, 106574. [Google Scholar]
- Wang, X.; Lee, X. Research on real-time forest fire spread prediction model based on UAV. For. Mach. Woodwork. Equip. 2022, 50, 7. [Google Scholar]
- Nayagi, S.B.; Angel, T.S.S. An Efficiency Correlation between Various Image Fusion Techniques. Int. J. Comput. Intell. Appl. 2023, 22, 2341010. [Google Scholar] [CrossRef]
- Li, H.; Cen, Y.; Liu, Y.; Chen, X.; Yu, Z. Different Input Resolutions and Arbitrary Output Resolution: A Meta Learning-Based Deep Framework for Infrared and Visible Image Fusion. IEEE Trans. Image Process. 2021, 30, 4070–4083. [Google Scholar] [CrossRef]
- Duan, C.; Xing, C.; Lu, S.; Wang, Z. Two-scale fusion method of infrared and visible images via parallel saliency features. IET Image Process. 2021, 14, 4412–4423. [Google Scholar] [CrossRef]
- Yin, W.; He, K.; Xu, D.; Luo, Y.; Gong, J. Significant target analysis and detail preserving based infrared and visible image fusion. Infrared Phys. Technol. 2022, 121, 104041. [Google Scholar] [CrossRef]
- Alexander, T. TNO Image Fusion Dataset. 2014. Available online: https://www.altmetric.com/details/2309122 (accessed on 16 June 2023).
- Huang, G.; Liu, Z.; Van Der Maaten, L.; Weinberger, K.Q. Densely Connected Convolutional Networks. In Proceedings of the 2017 IEEE Conference on Computer Vision and Pattern Recognition (CVPR), Honolulu, HI, USA, 21–26 July 2017. [Google Scholar]
- Prabhakar, K.R.; Srikar, V.S.; Babu, R.V. DeepFuse: A Deep Unsupervised Approach for Exposure Fusion with Extreme Exposure Image Pairs. In Proceedings of the 2017 IEEE International Conference on Computer Vision (ICCV), Venice, Italy, 22–29 October 2017. [Google Scholar]
- Hou, R.; Zhou, D.; Nie, R.; Liu, D.; Xiong, L.; Guo, Y.B.; Yu, C. VIF-Net: An Unsupervised Framework for Infrared and Visible Image Fusion. IEEE Trans. Comput. Imaging 2020, 6, 640–651. [Google Scholar] [CrossRef]
- Park, J.; Woo, S.; Lee, J.-Y.; Kweon, I.S. BAM: Bottleneck Attention Module. arXiv 2018, arXiv:1807.06514v2. [Google Scholar]
- Ma, J.; Yu, W.; Liang, P.; Li, C.; Jiang, J. FusionGAN: A generative adversarial network for infrared and visible image fusion. Inf. Fusion 2019, 48, 11–26. [Google Scholar] [CrossRef]
- Xu, H.; Ma, J.; Jiang, J.; Guo, X.; Ling, H. U2Fusion: A Unified Unsupervised Image Fusion Network. IEEE Trans. Pattern Anal. Mach. Intell. 2020, 26, 502–518. [Google Scholar] [CrossRef]
- Hui, X.-J. DenseFuse: A Fusion Approach to Infrared and Visible Images. IEEE Trans. Image Process 2018, 28, 2614–2623. [Google Scholar]
- Ma, J.; Ma, Y.; Li, C. Infrared and visible image fusion methods and applications: A survey. Inf. Fusion 2019, 45, 153–178. [Google Scholar] [CrossRef]
- Jiang, X.; Hu, H.; Liu, X.; Ding, R.; Xu, Y.; Shi, J.; Du, Y.; Da, C. A smoking behavior detection method based on the YOLOv5 network. J. Physics: Conf. Ser. 2022, 2232, 012001. [Google Scholar] [CrossRef]
- Chen, G.; Zhou, H.; Li, Z.; Gao, Y.; Bai, D.; Xu, R.; Lin, H. Multi-Scale Forest Fire Recognition Model Based on Improved YOLOv5s. Forests 2023, 14, 315. [Google Scholar] [CrossRef]
Disclaimer/Publisher’s Note: The statements, opinions and data contained in all publications are solely those of the individual author(s) and contributor(s) and not of MDPI and/or the editor(s). MDPI and/or the editor(s) disclaim responsibility for any injury to people or property resulting from any ideas, methods, instructions or products referred to in the content. |
© 2023 by the authors. Licensee MDPI, Basel, Switzerland. This article is an open access article distributed under the terms and conditions of the Creative Commons Attribution (CC BY) license (https://creativecommons.org/licenses/by/4.0/).