
Footprint of the 2020 COVID-19 Lockdown on Column-Integrated Aerosol Parameters in Spain


Abstract
1. Introduction
2. Instrumentation and Data
3. Methodology
3.1. General Analysis (First Statistical Test)
3.2. Central Tendency Analysis (Second Statistical Test)
3.3. Proportions Hypothesis Test (Third Statistical Test)
4. Results
4.1. Preliminary Analysis
4.2. General Analysis
4.3. Central Tendency Analysis
4.4. Proportions Analysis
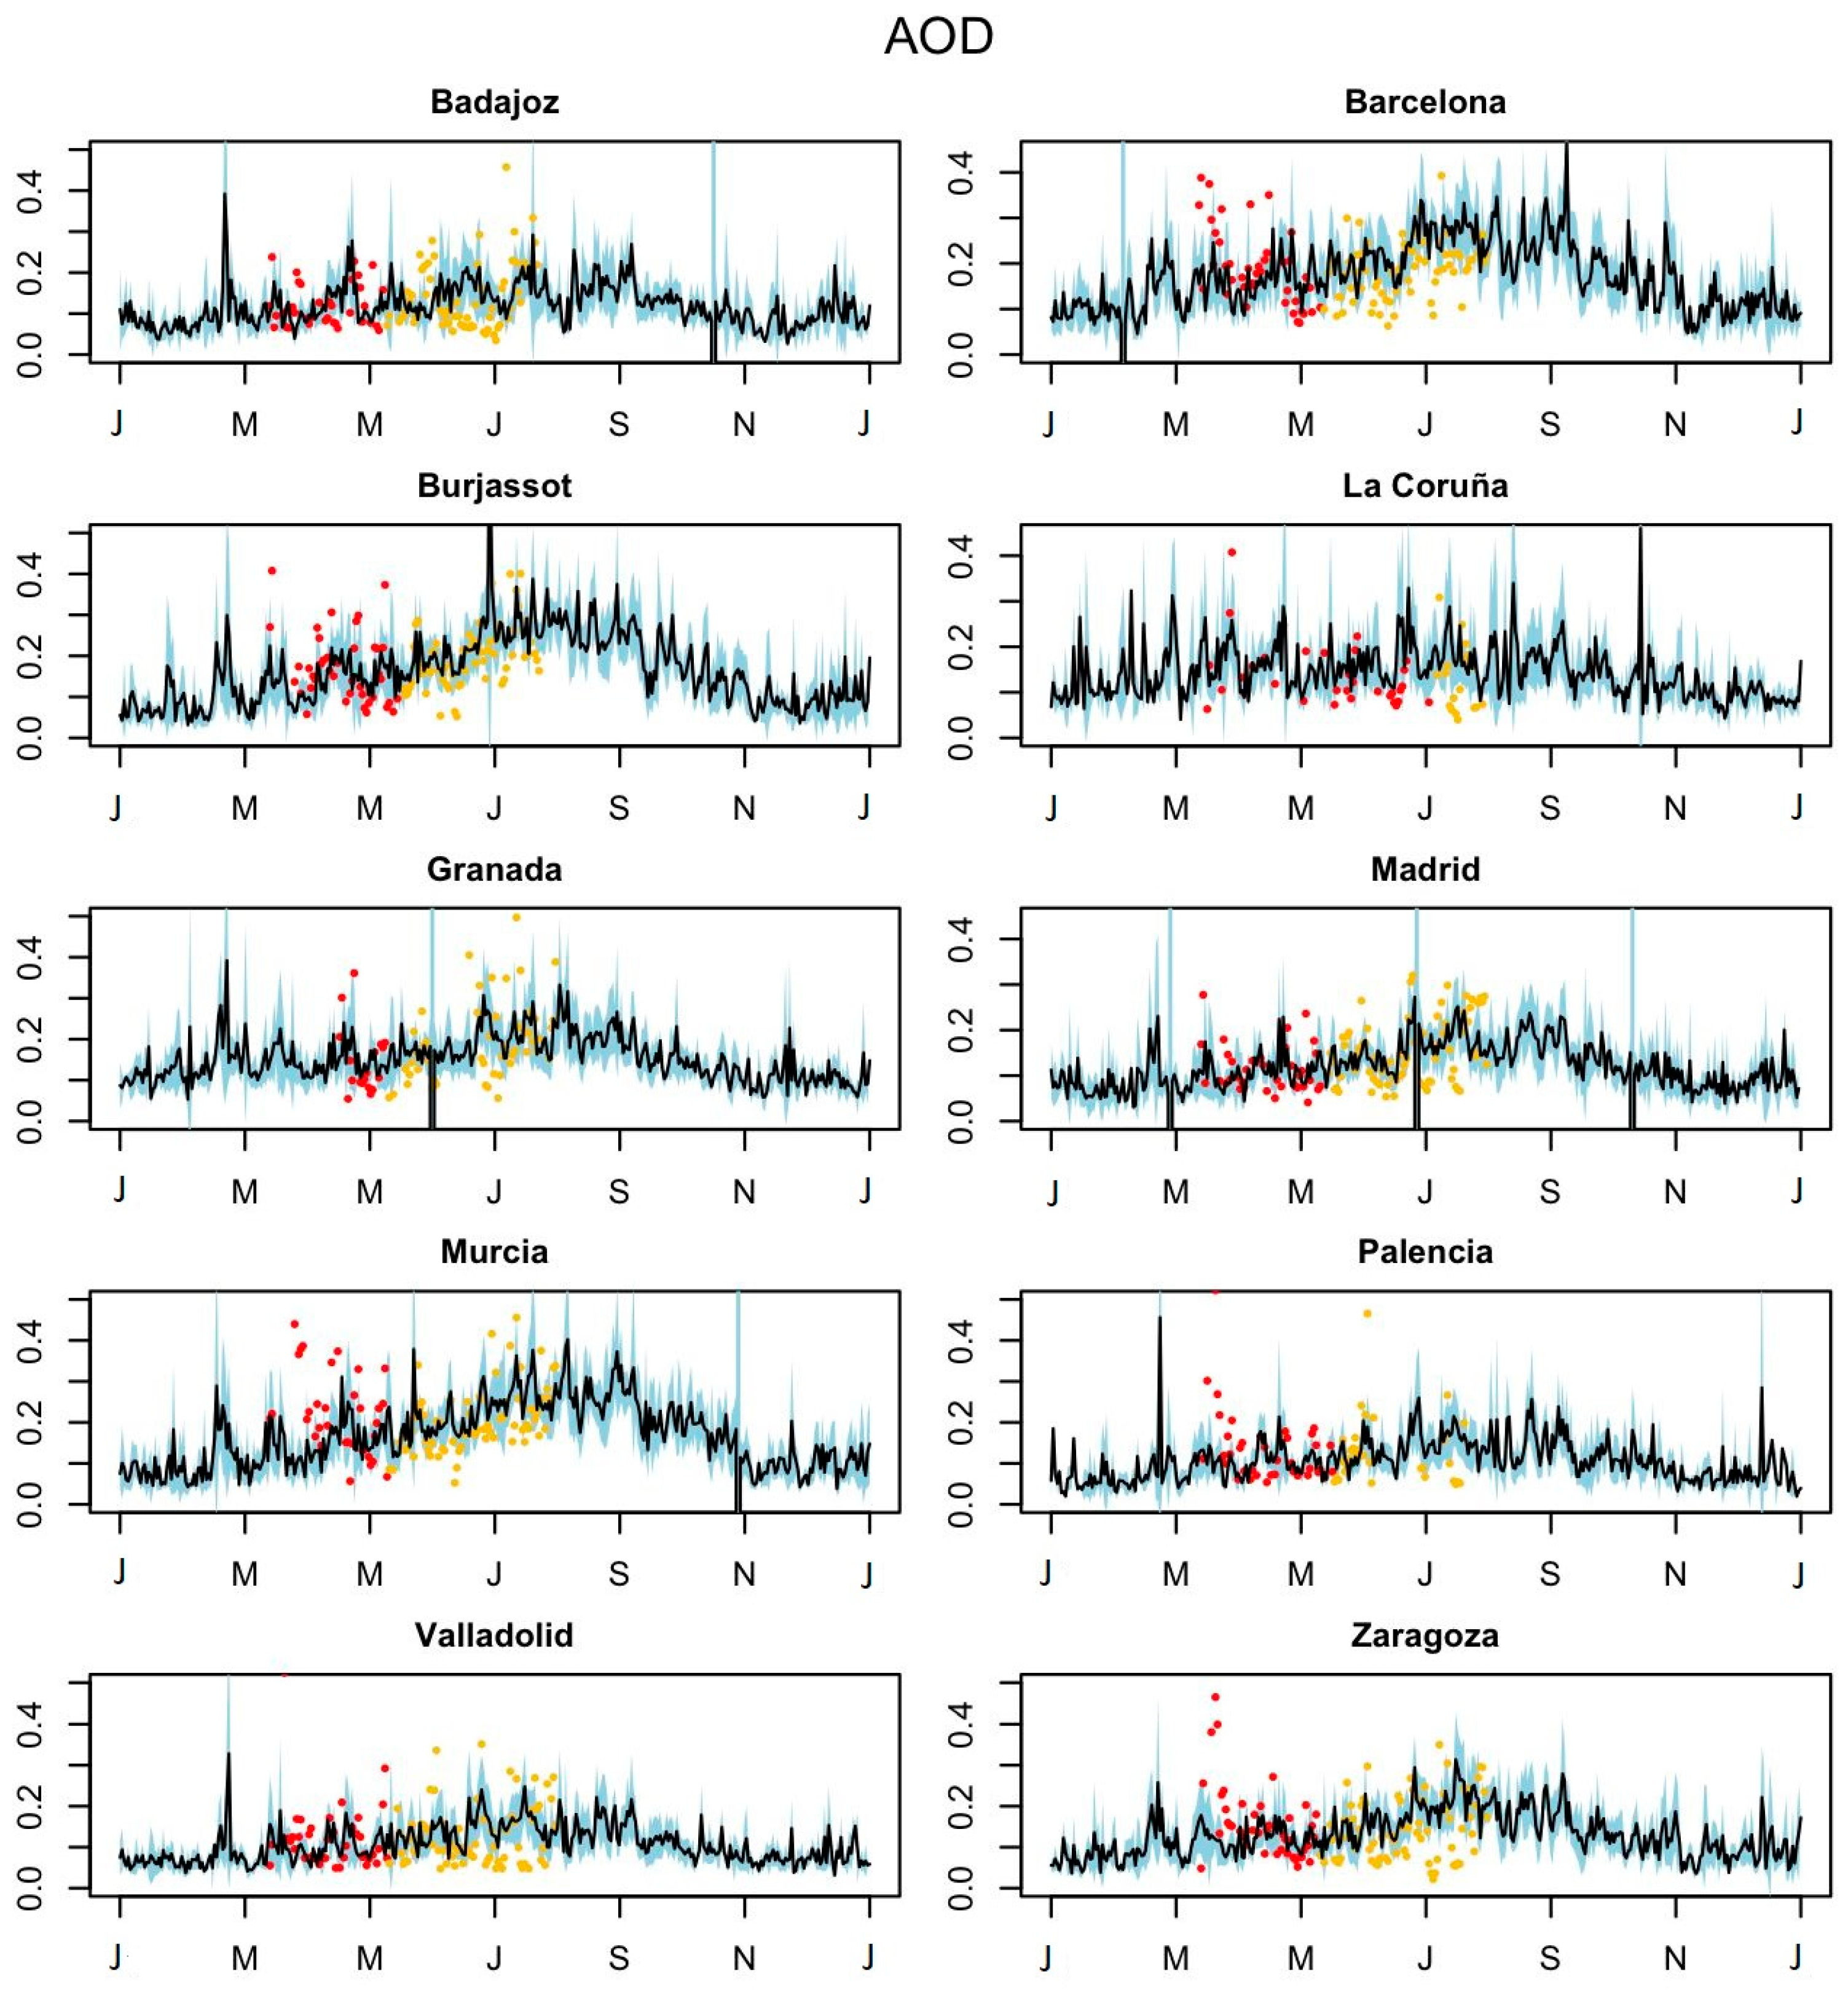
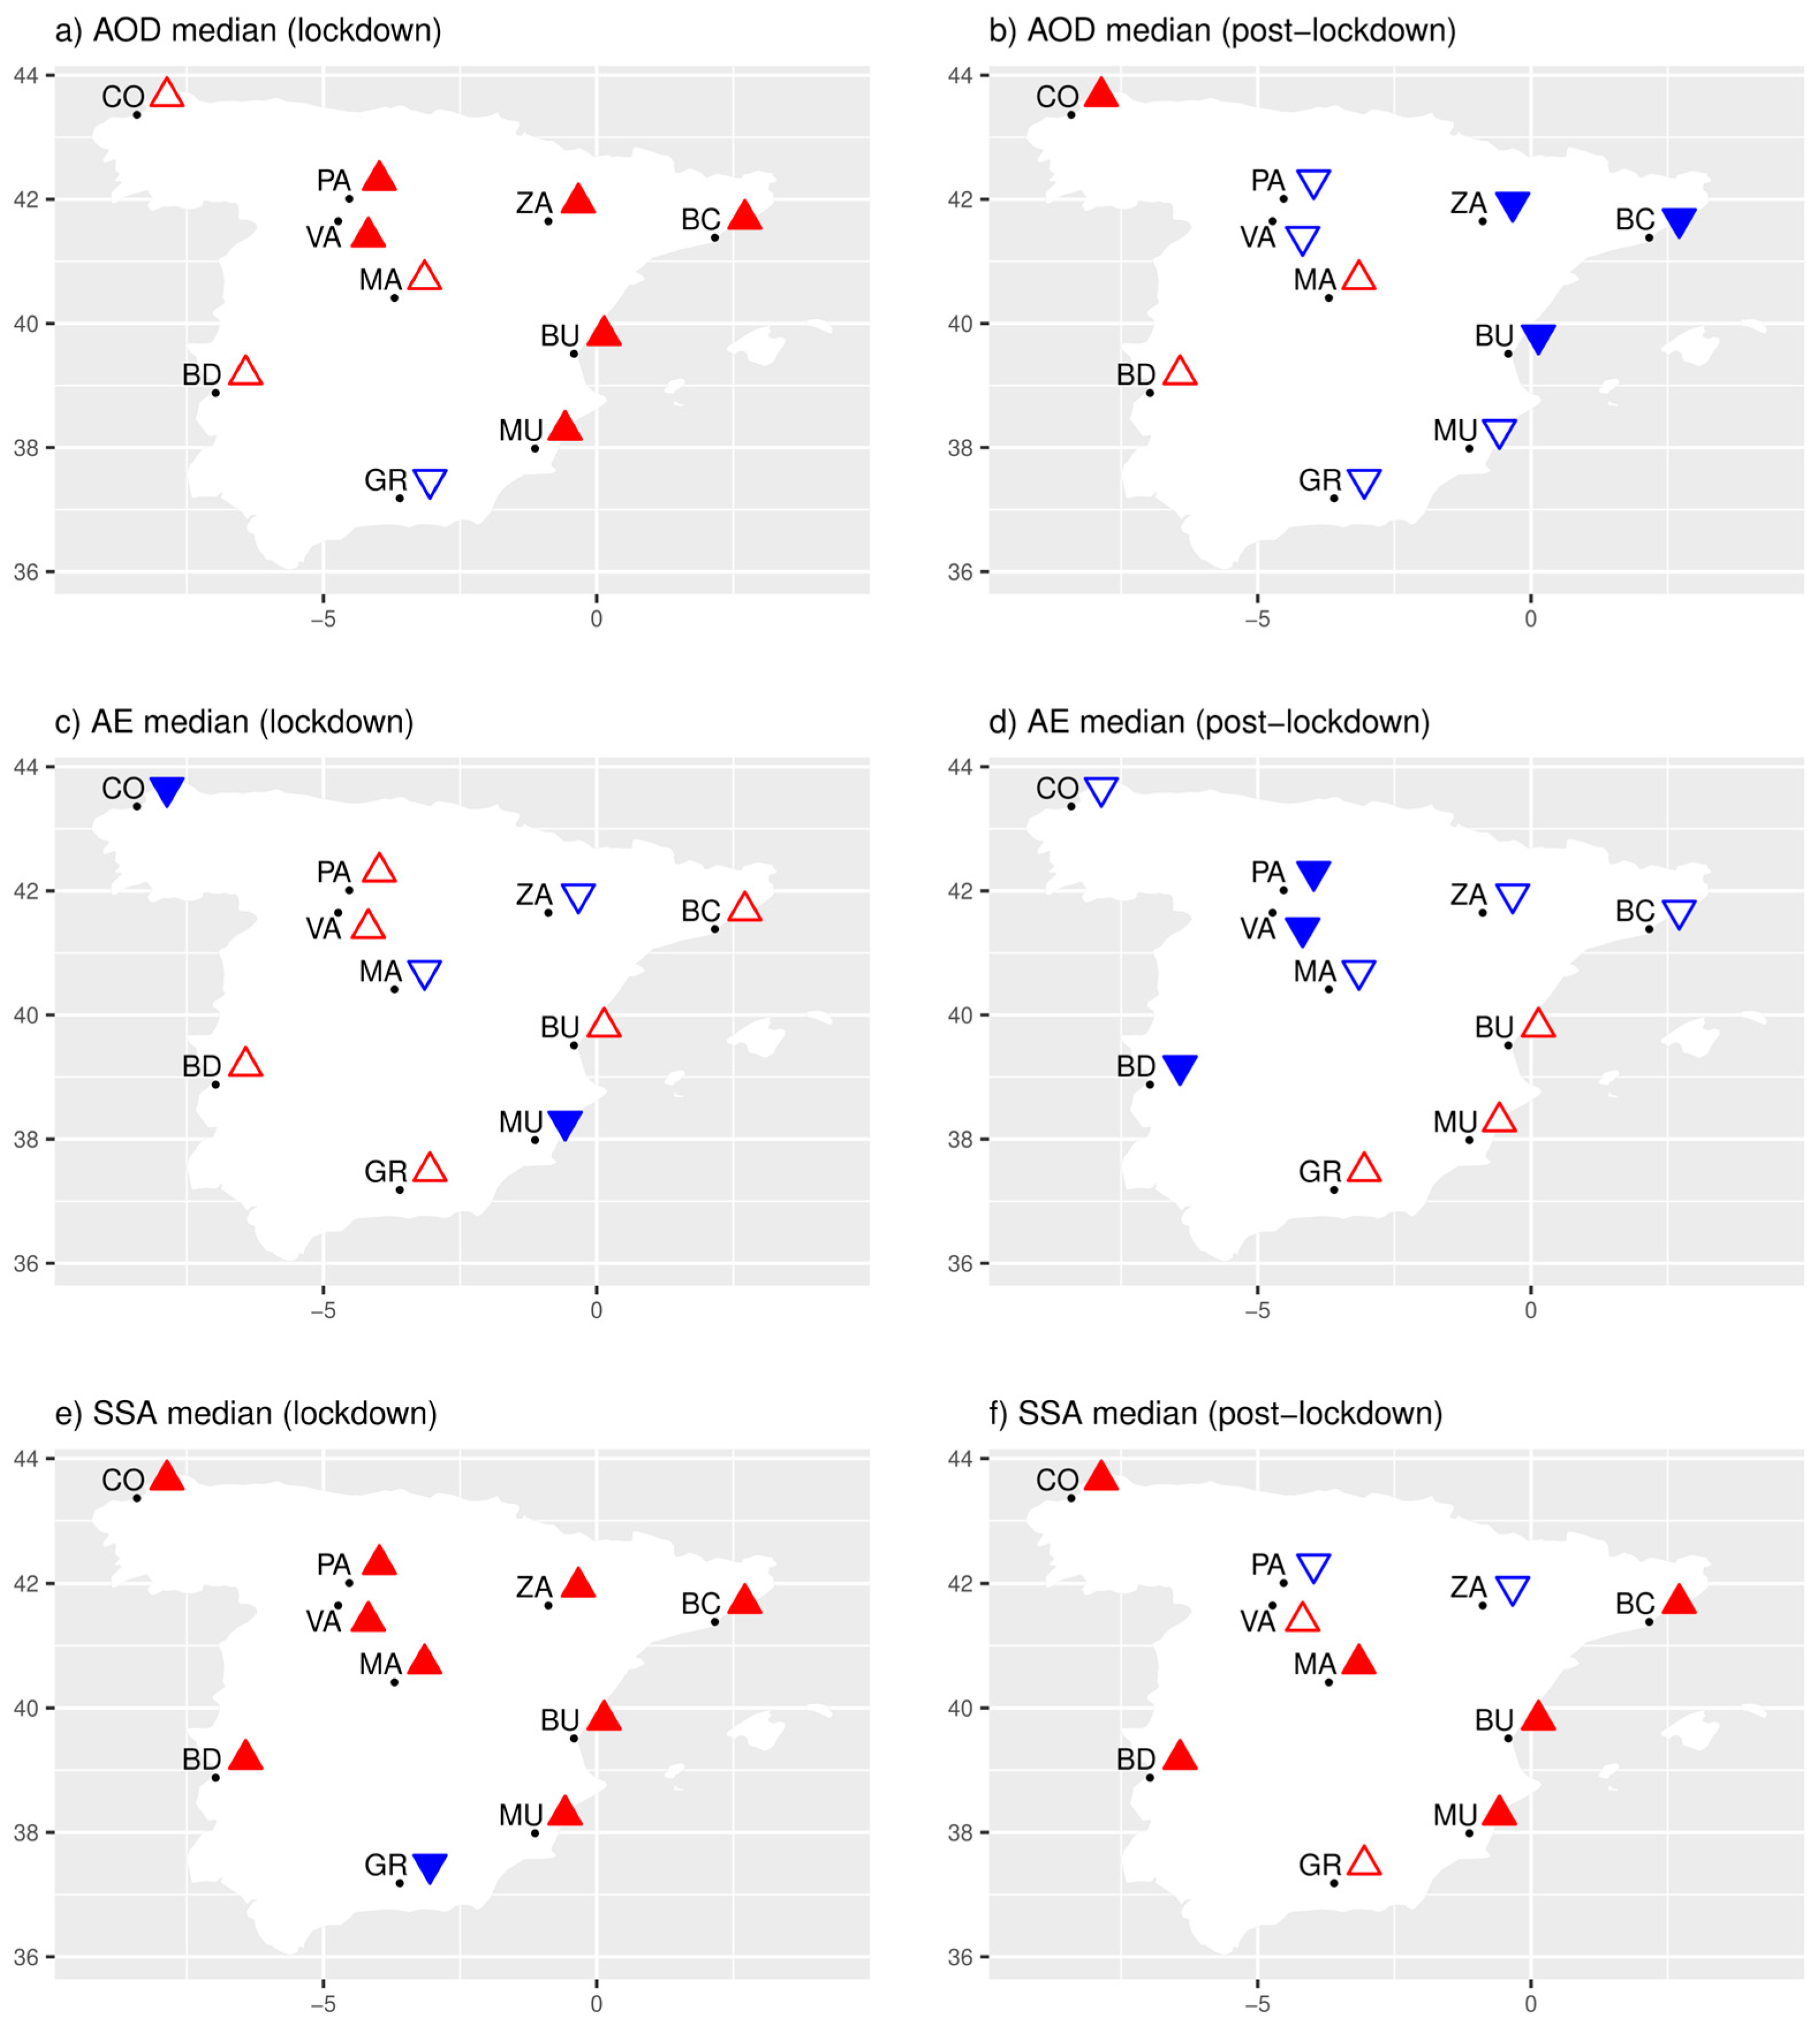
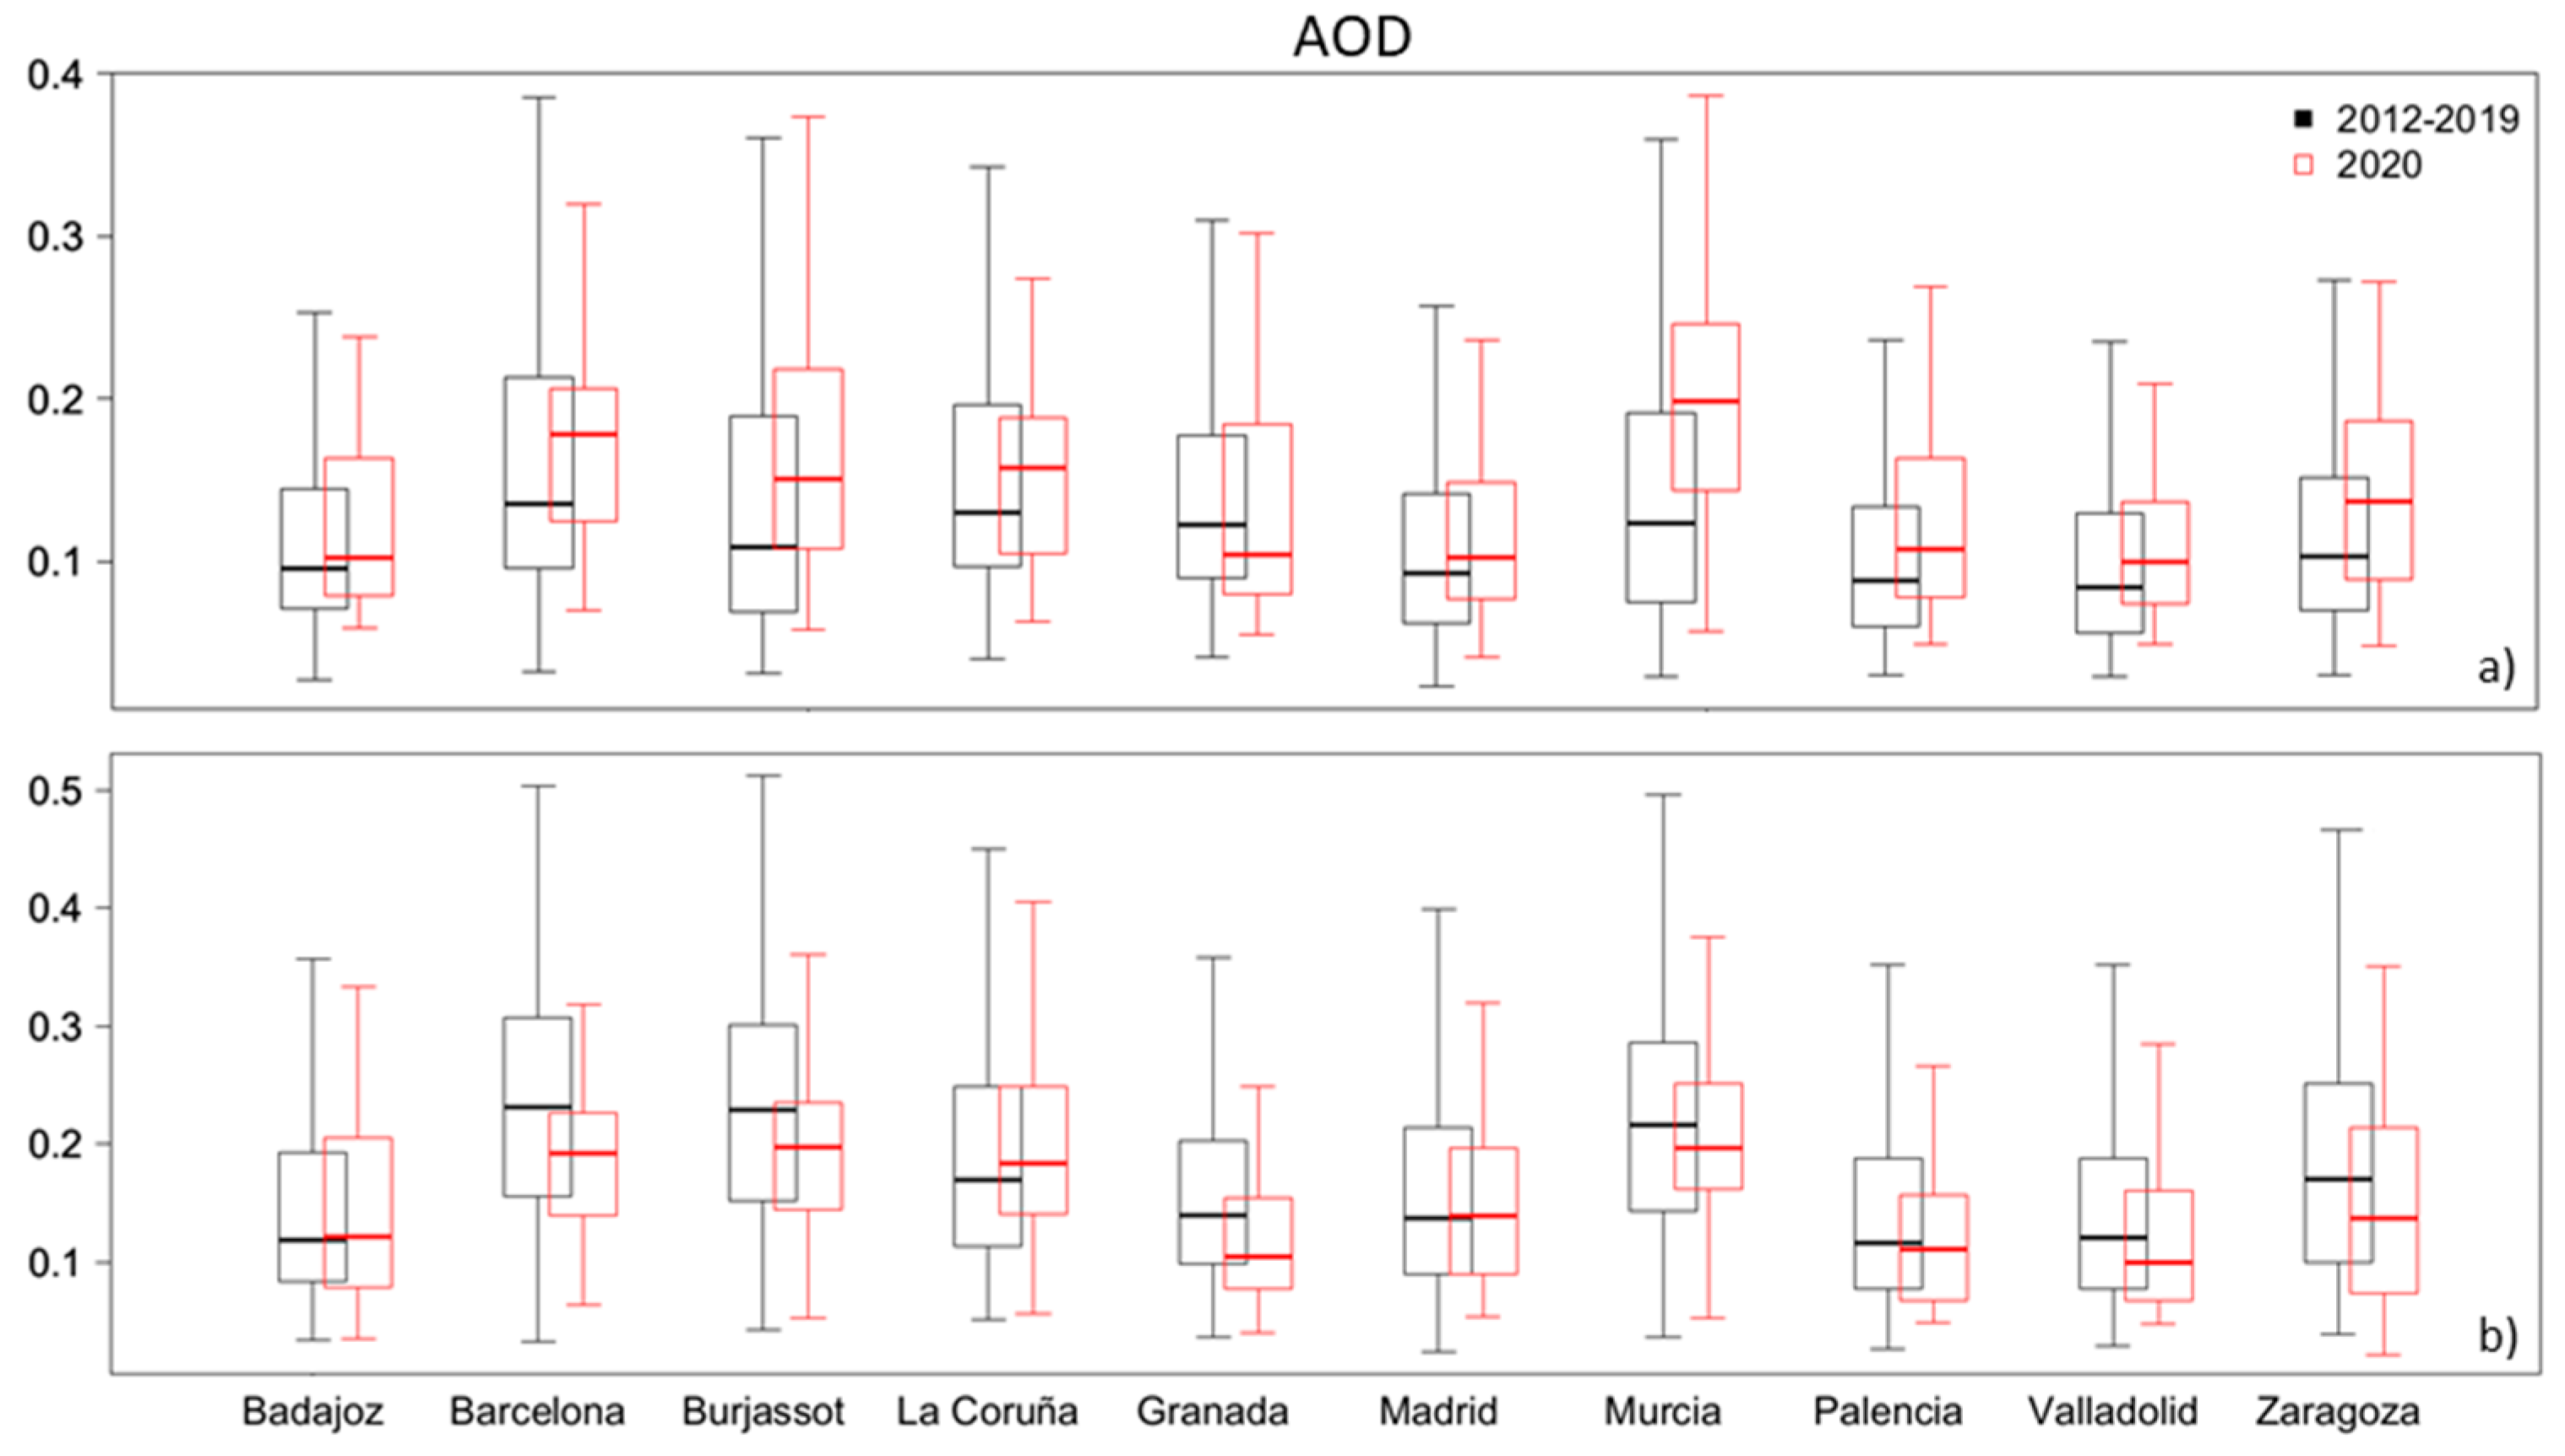
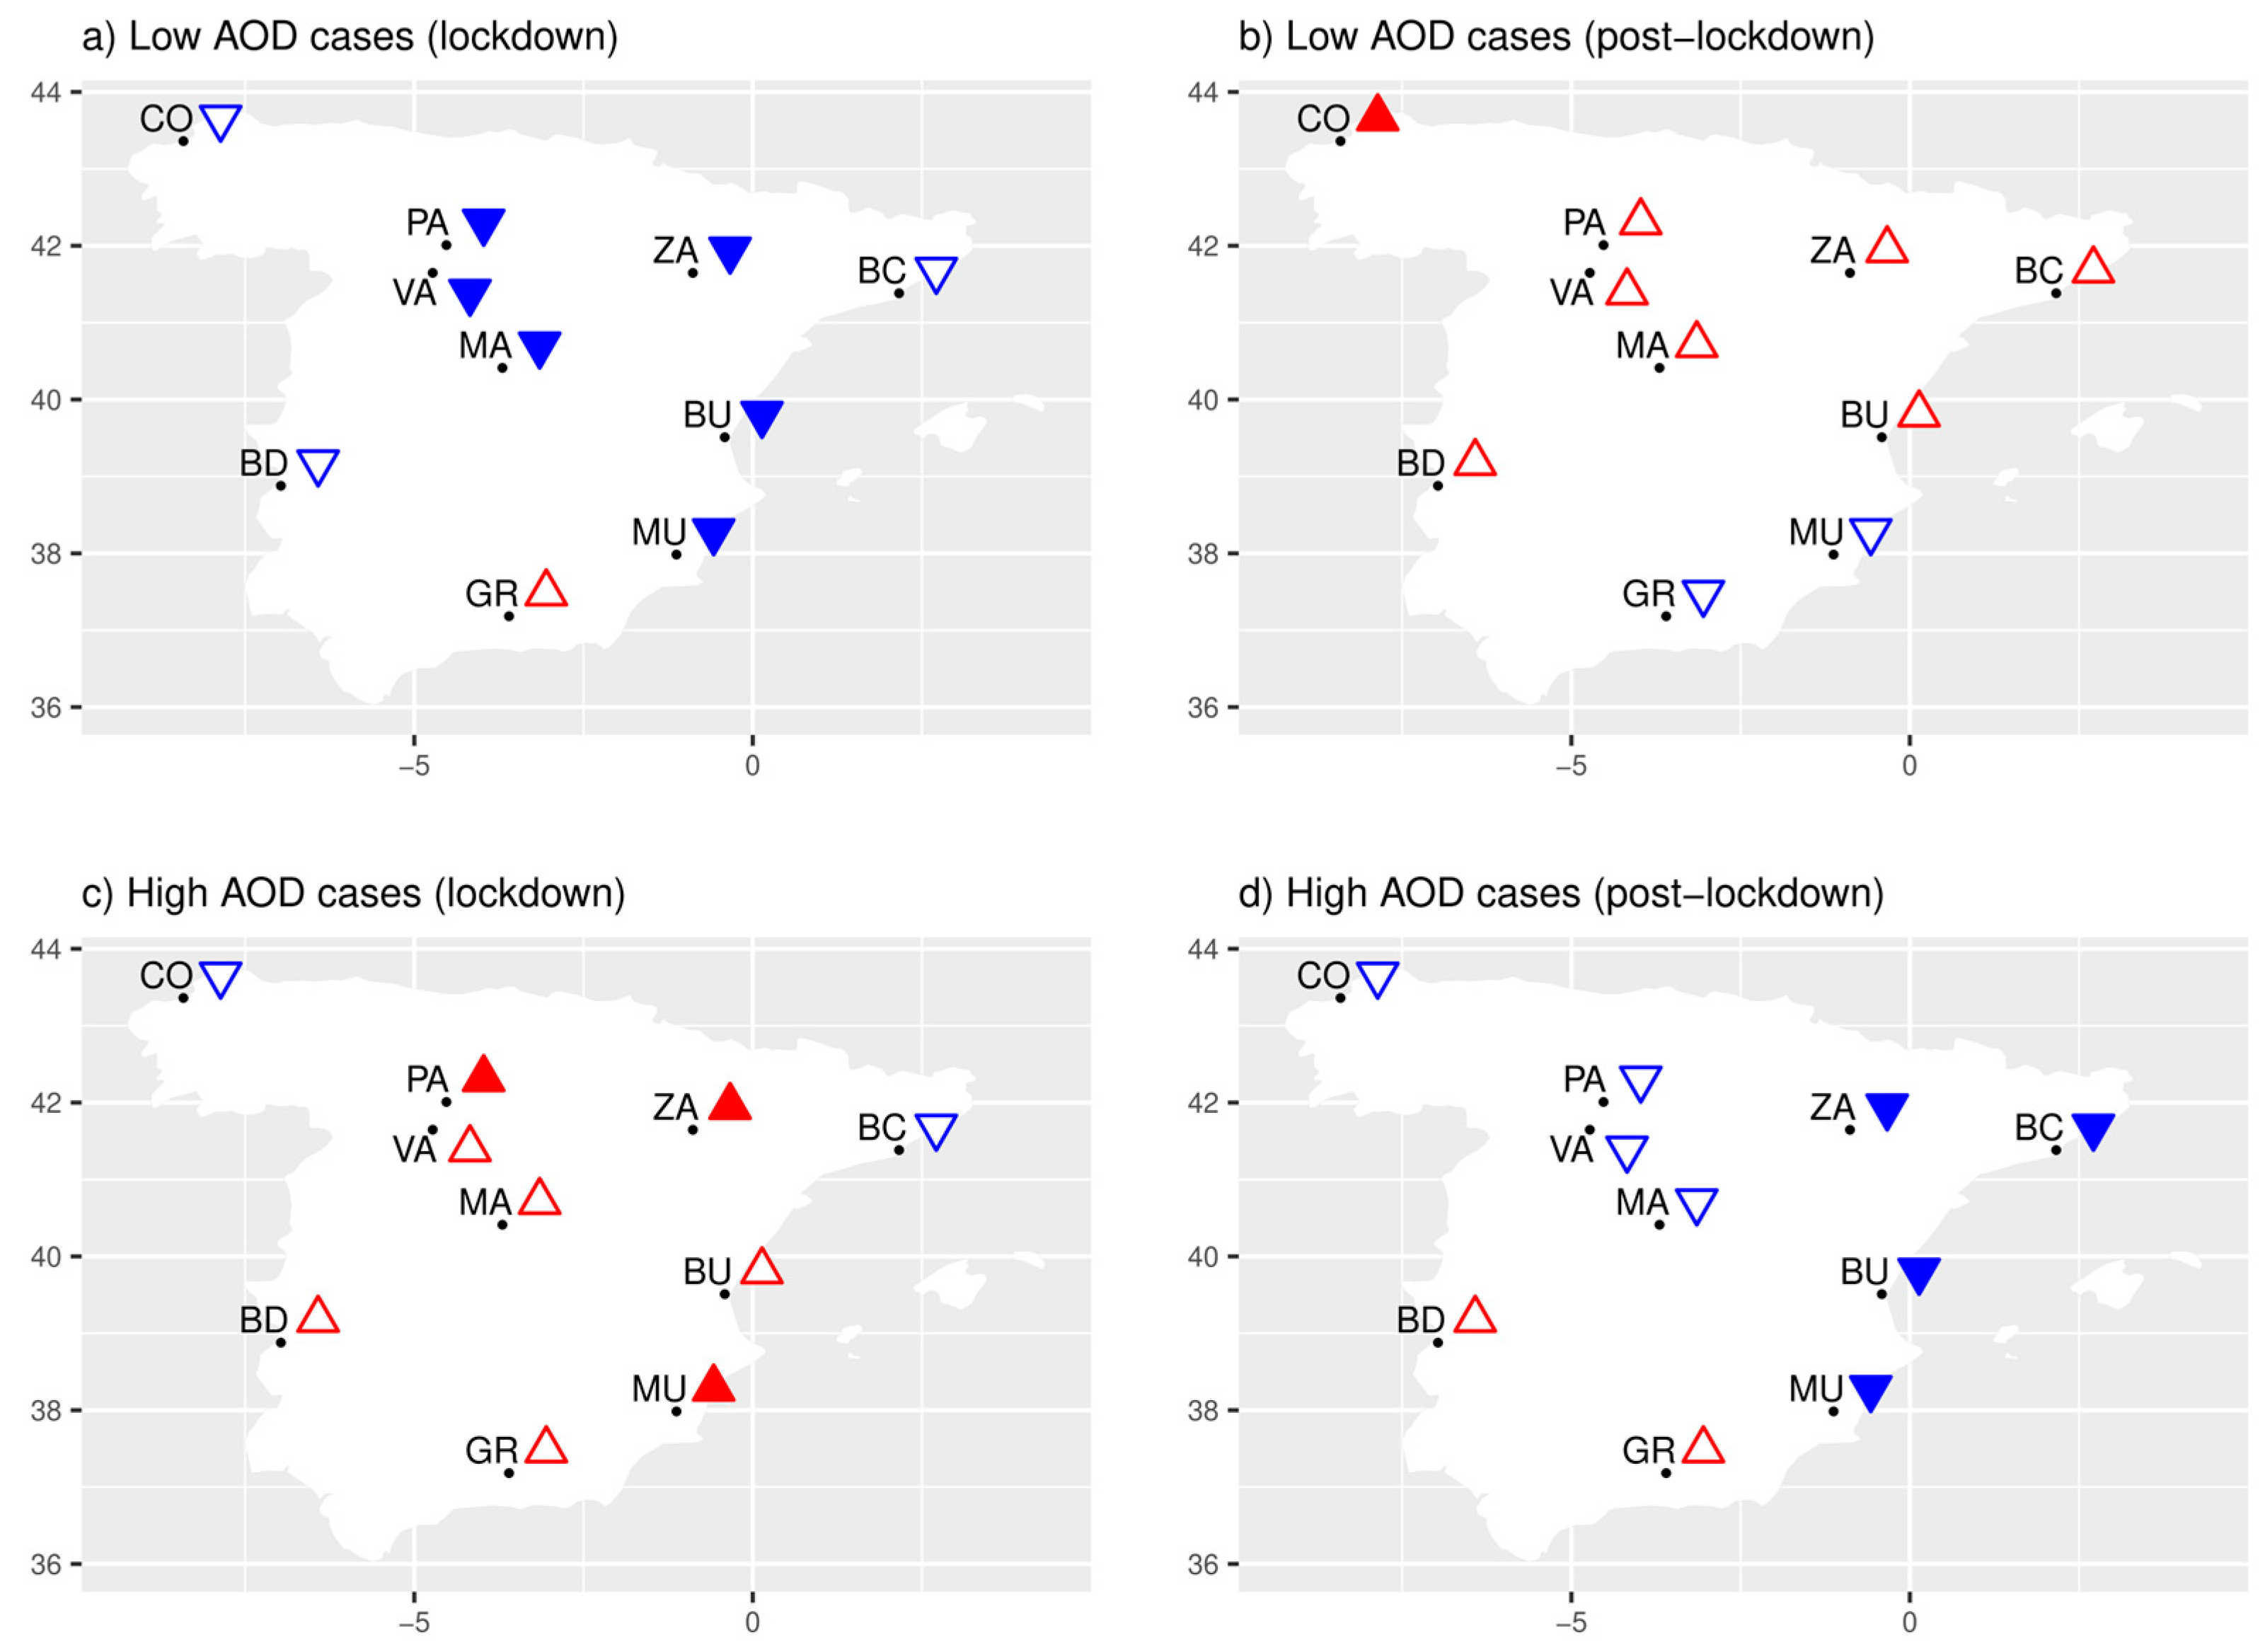
4.4.1. AOD
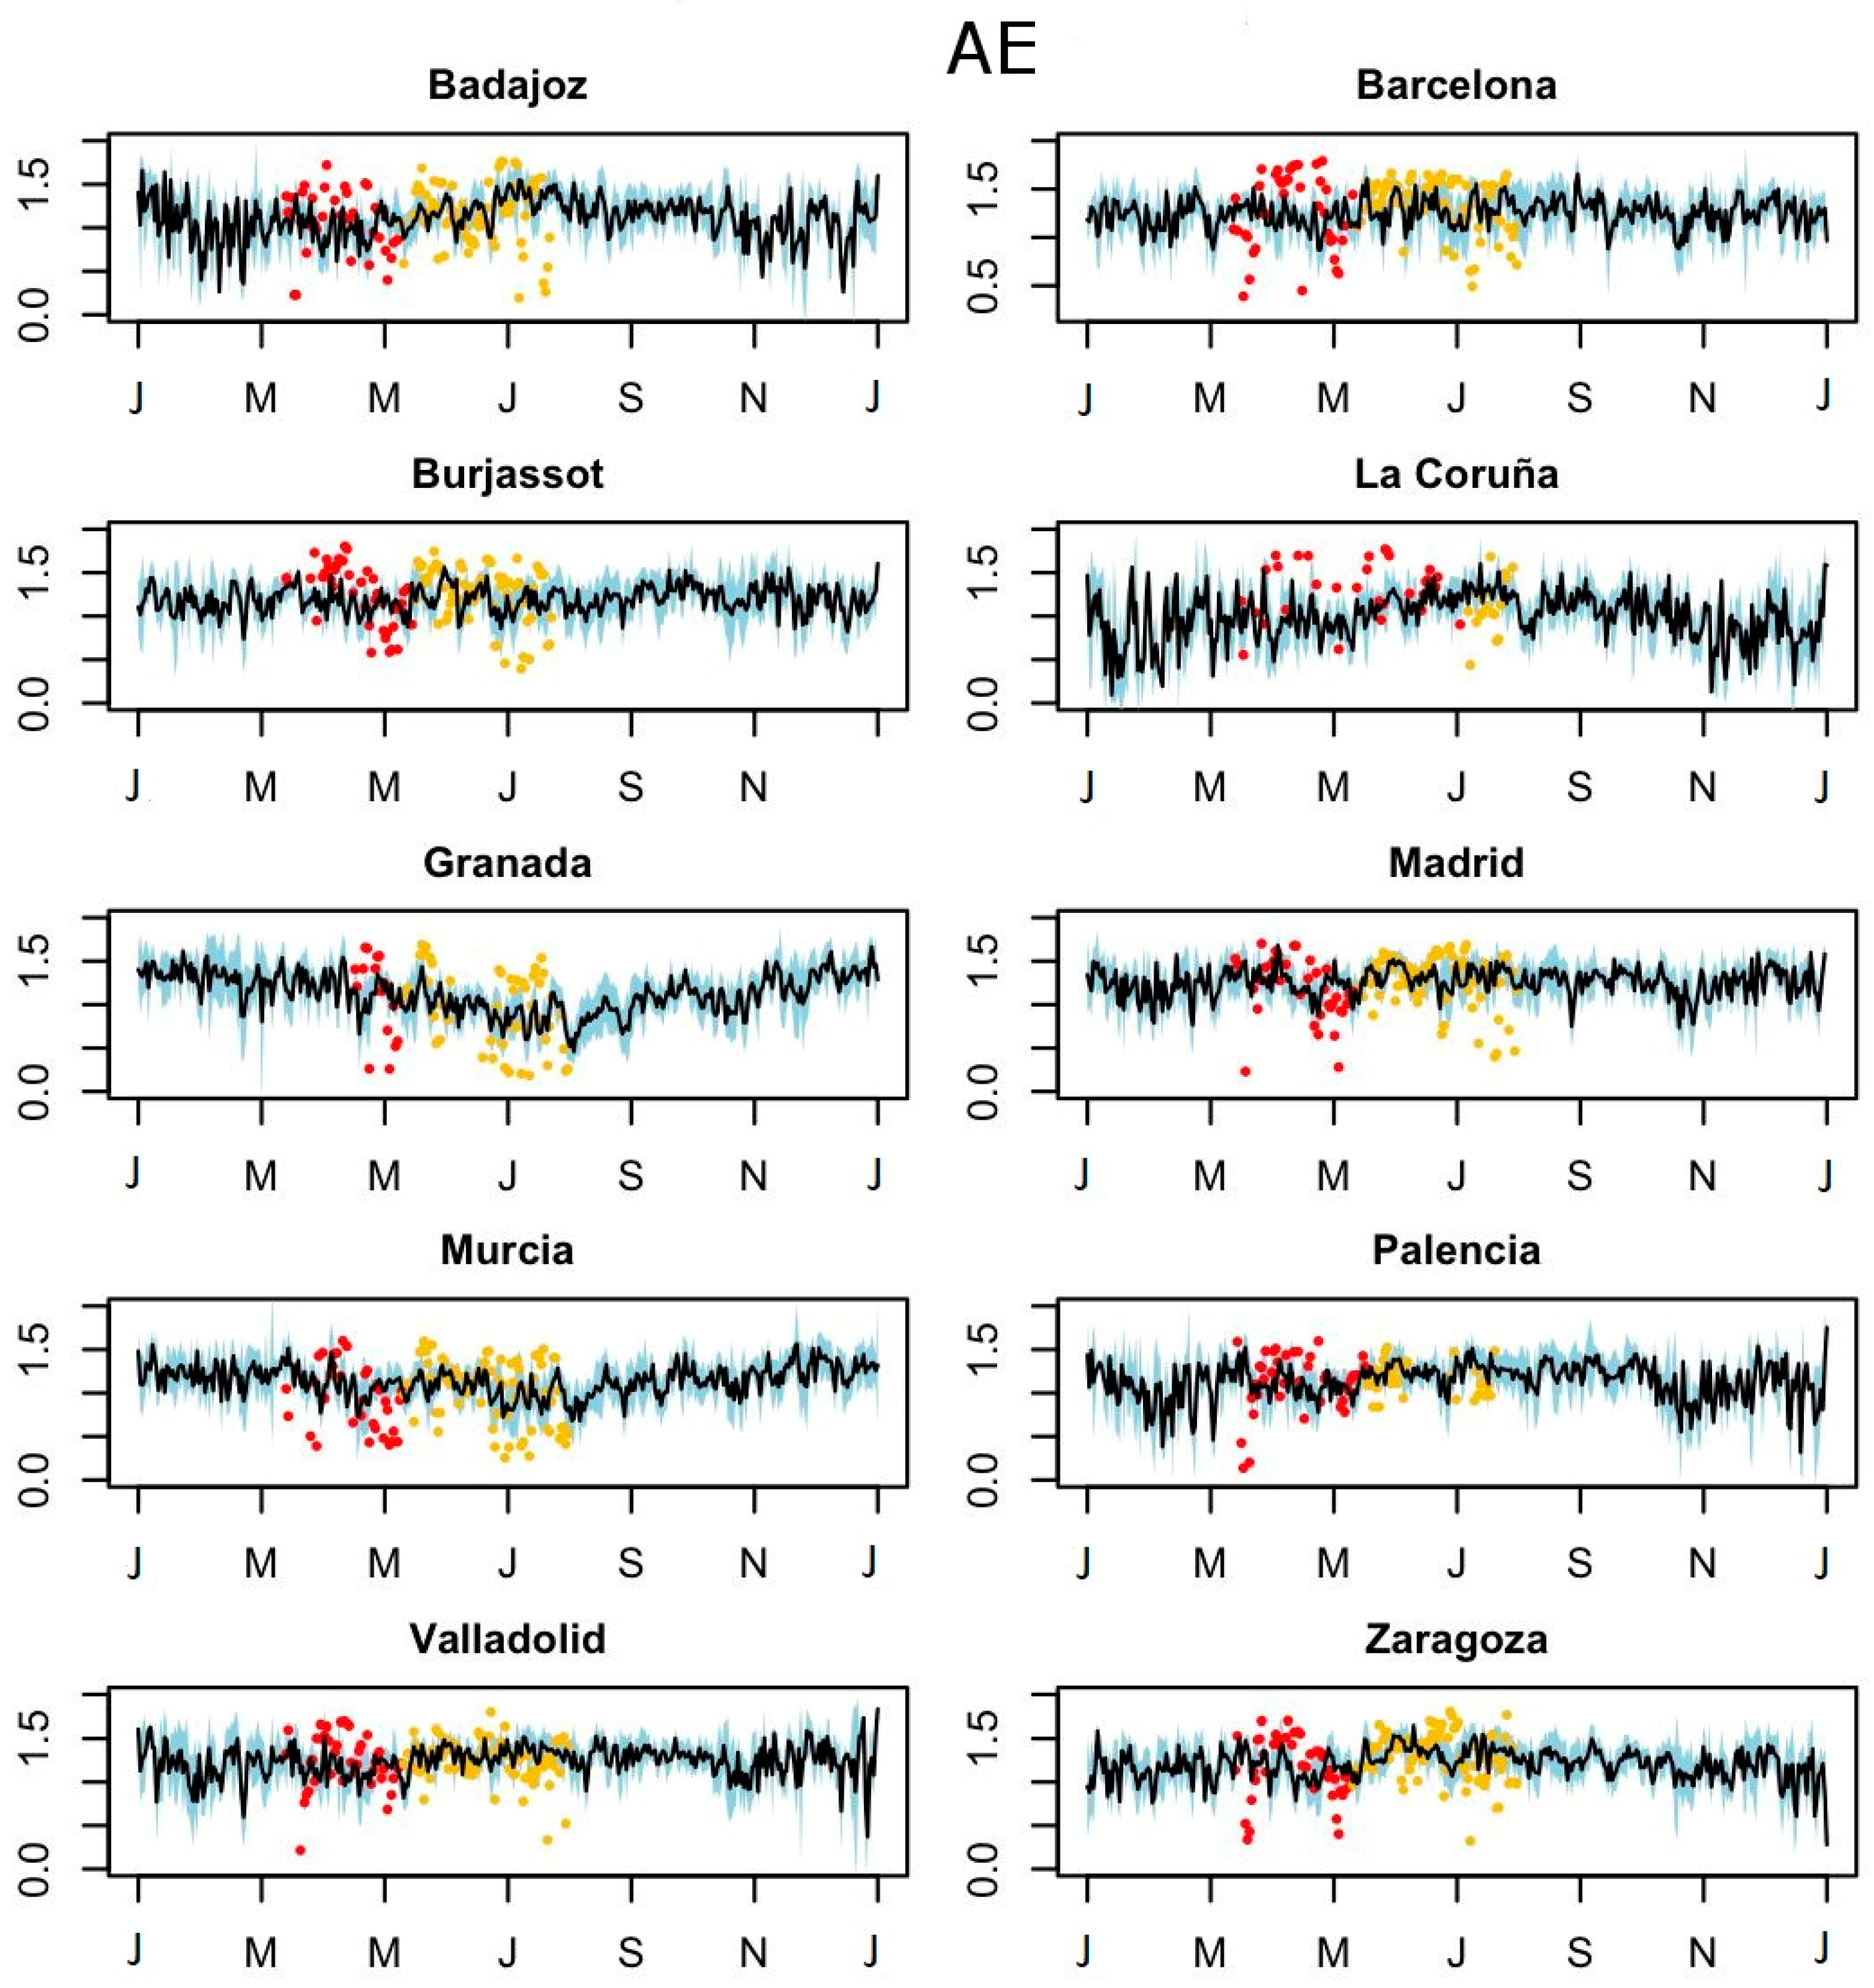
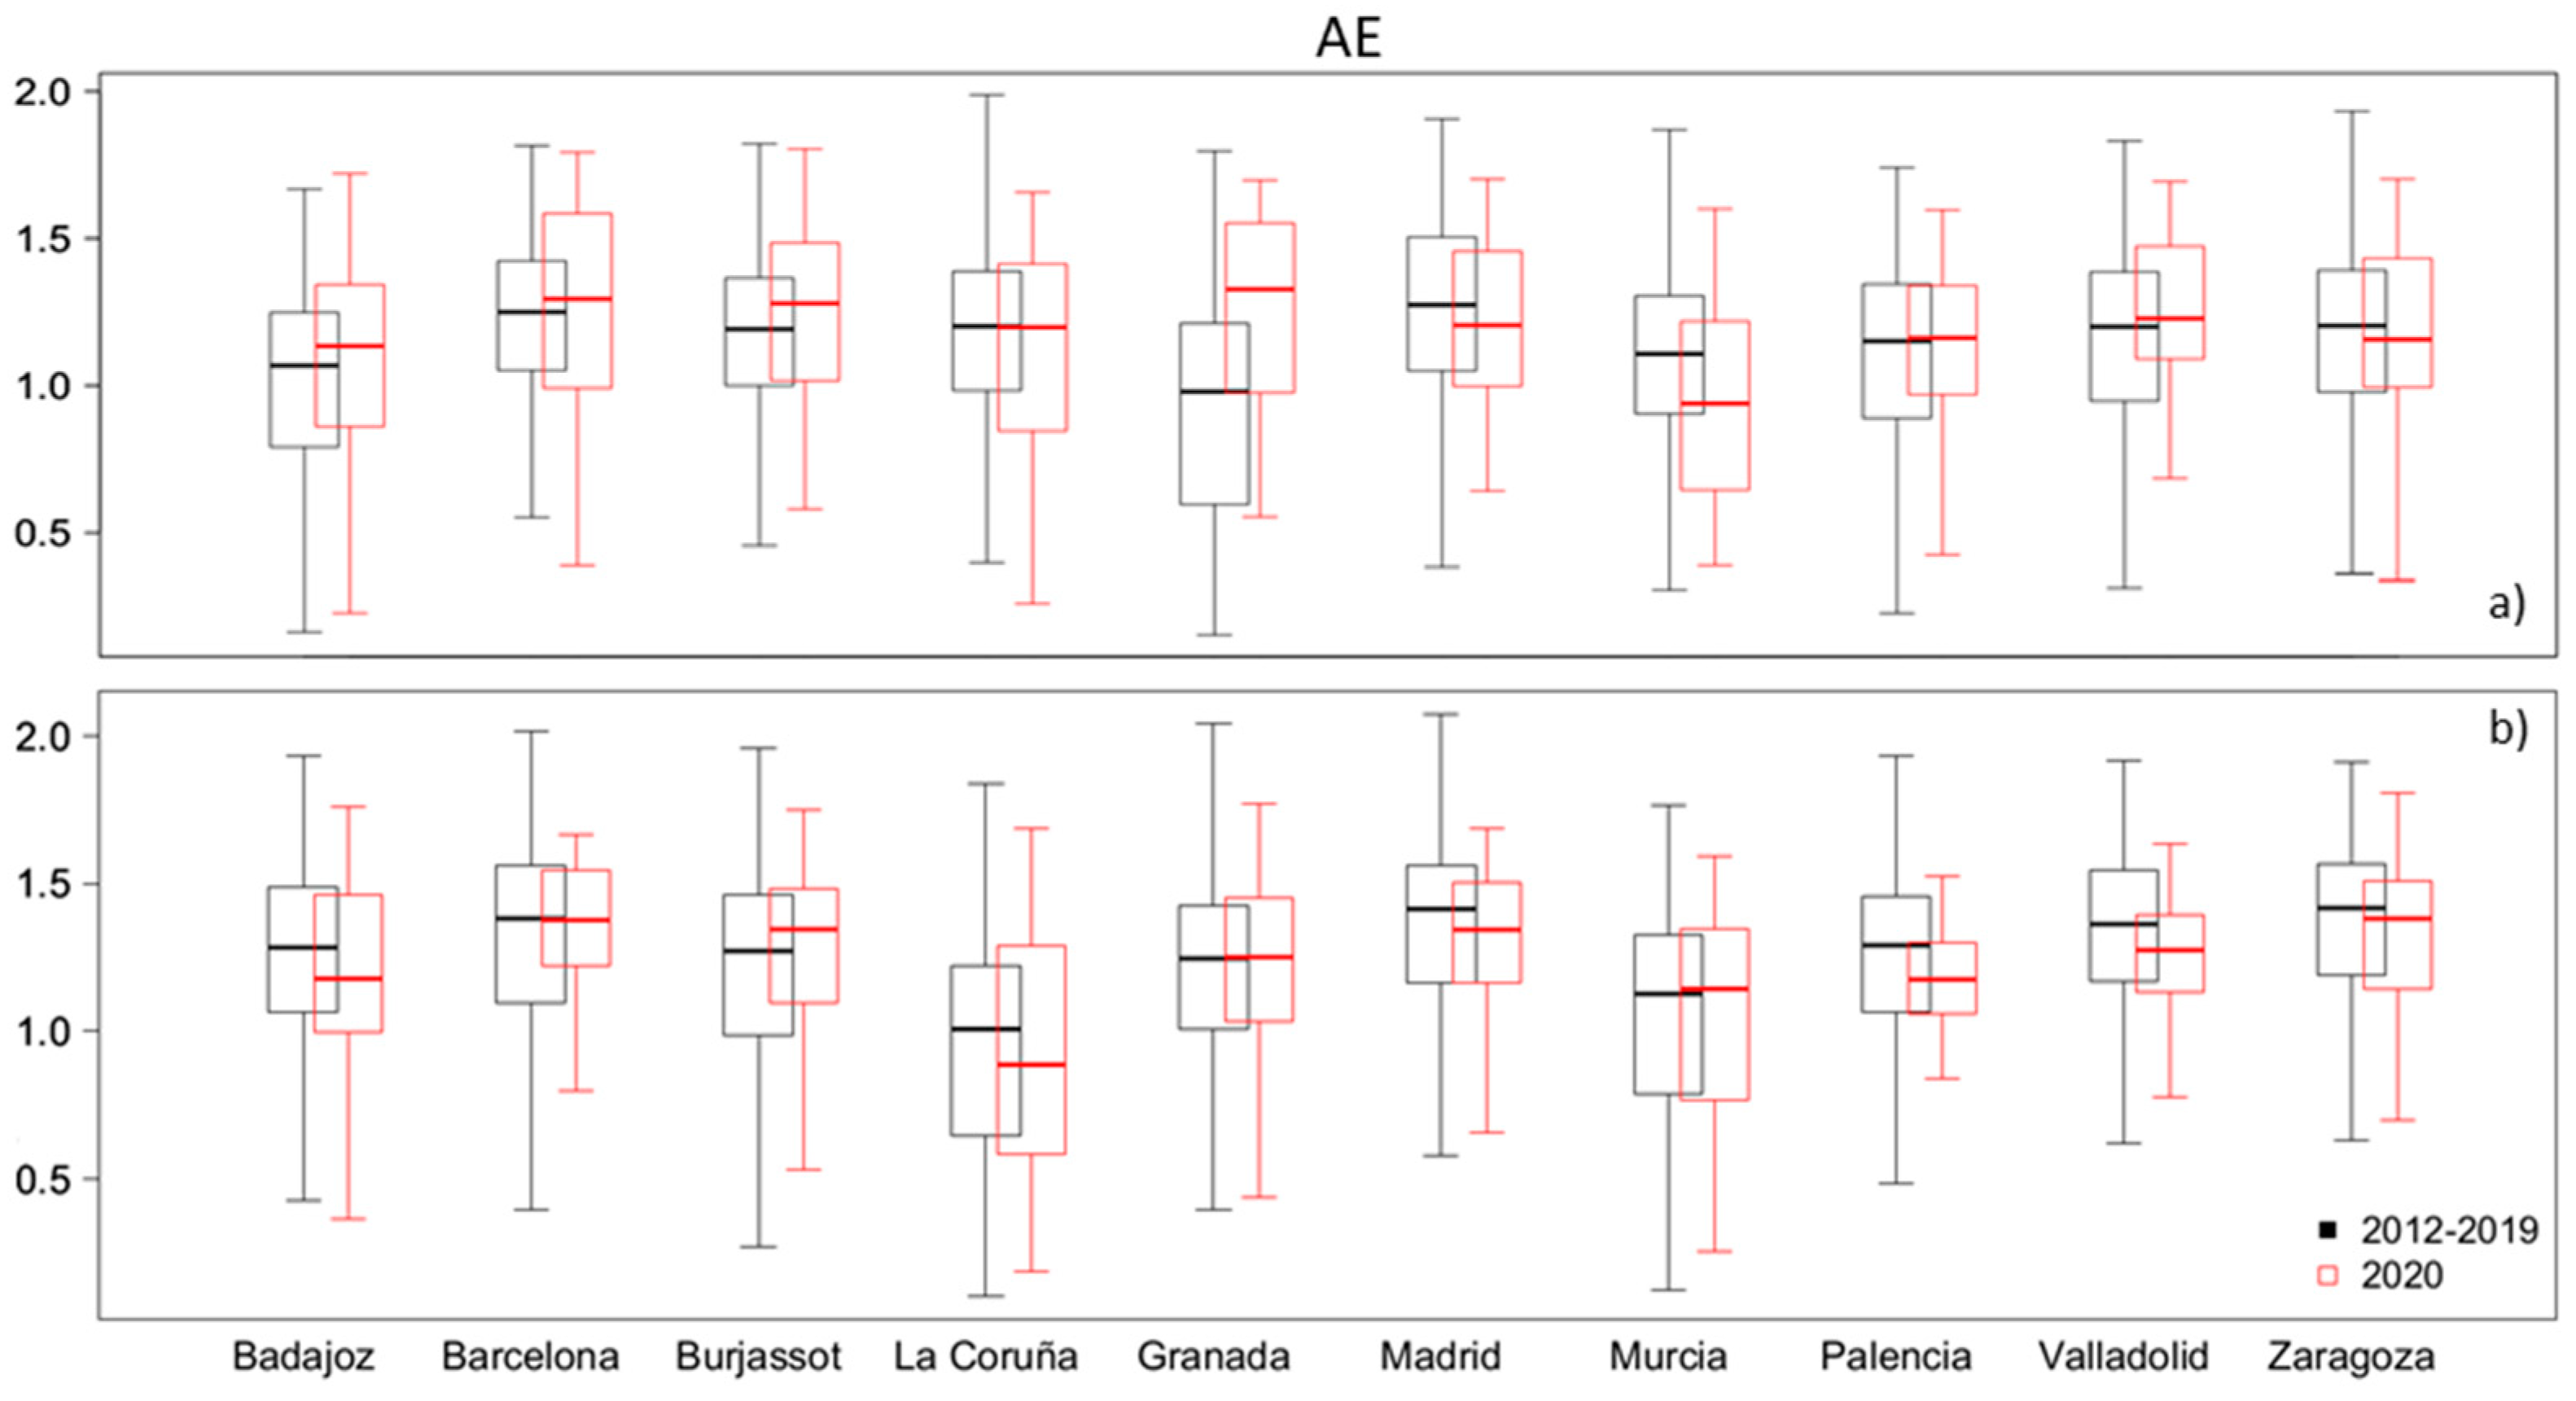
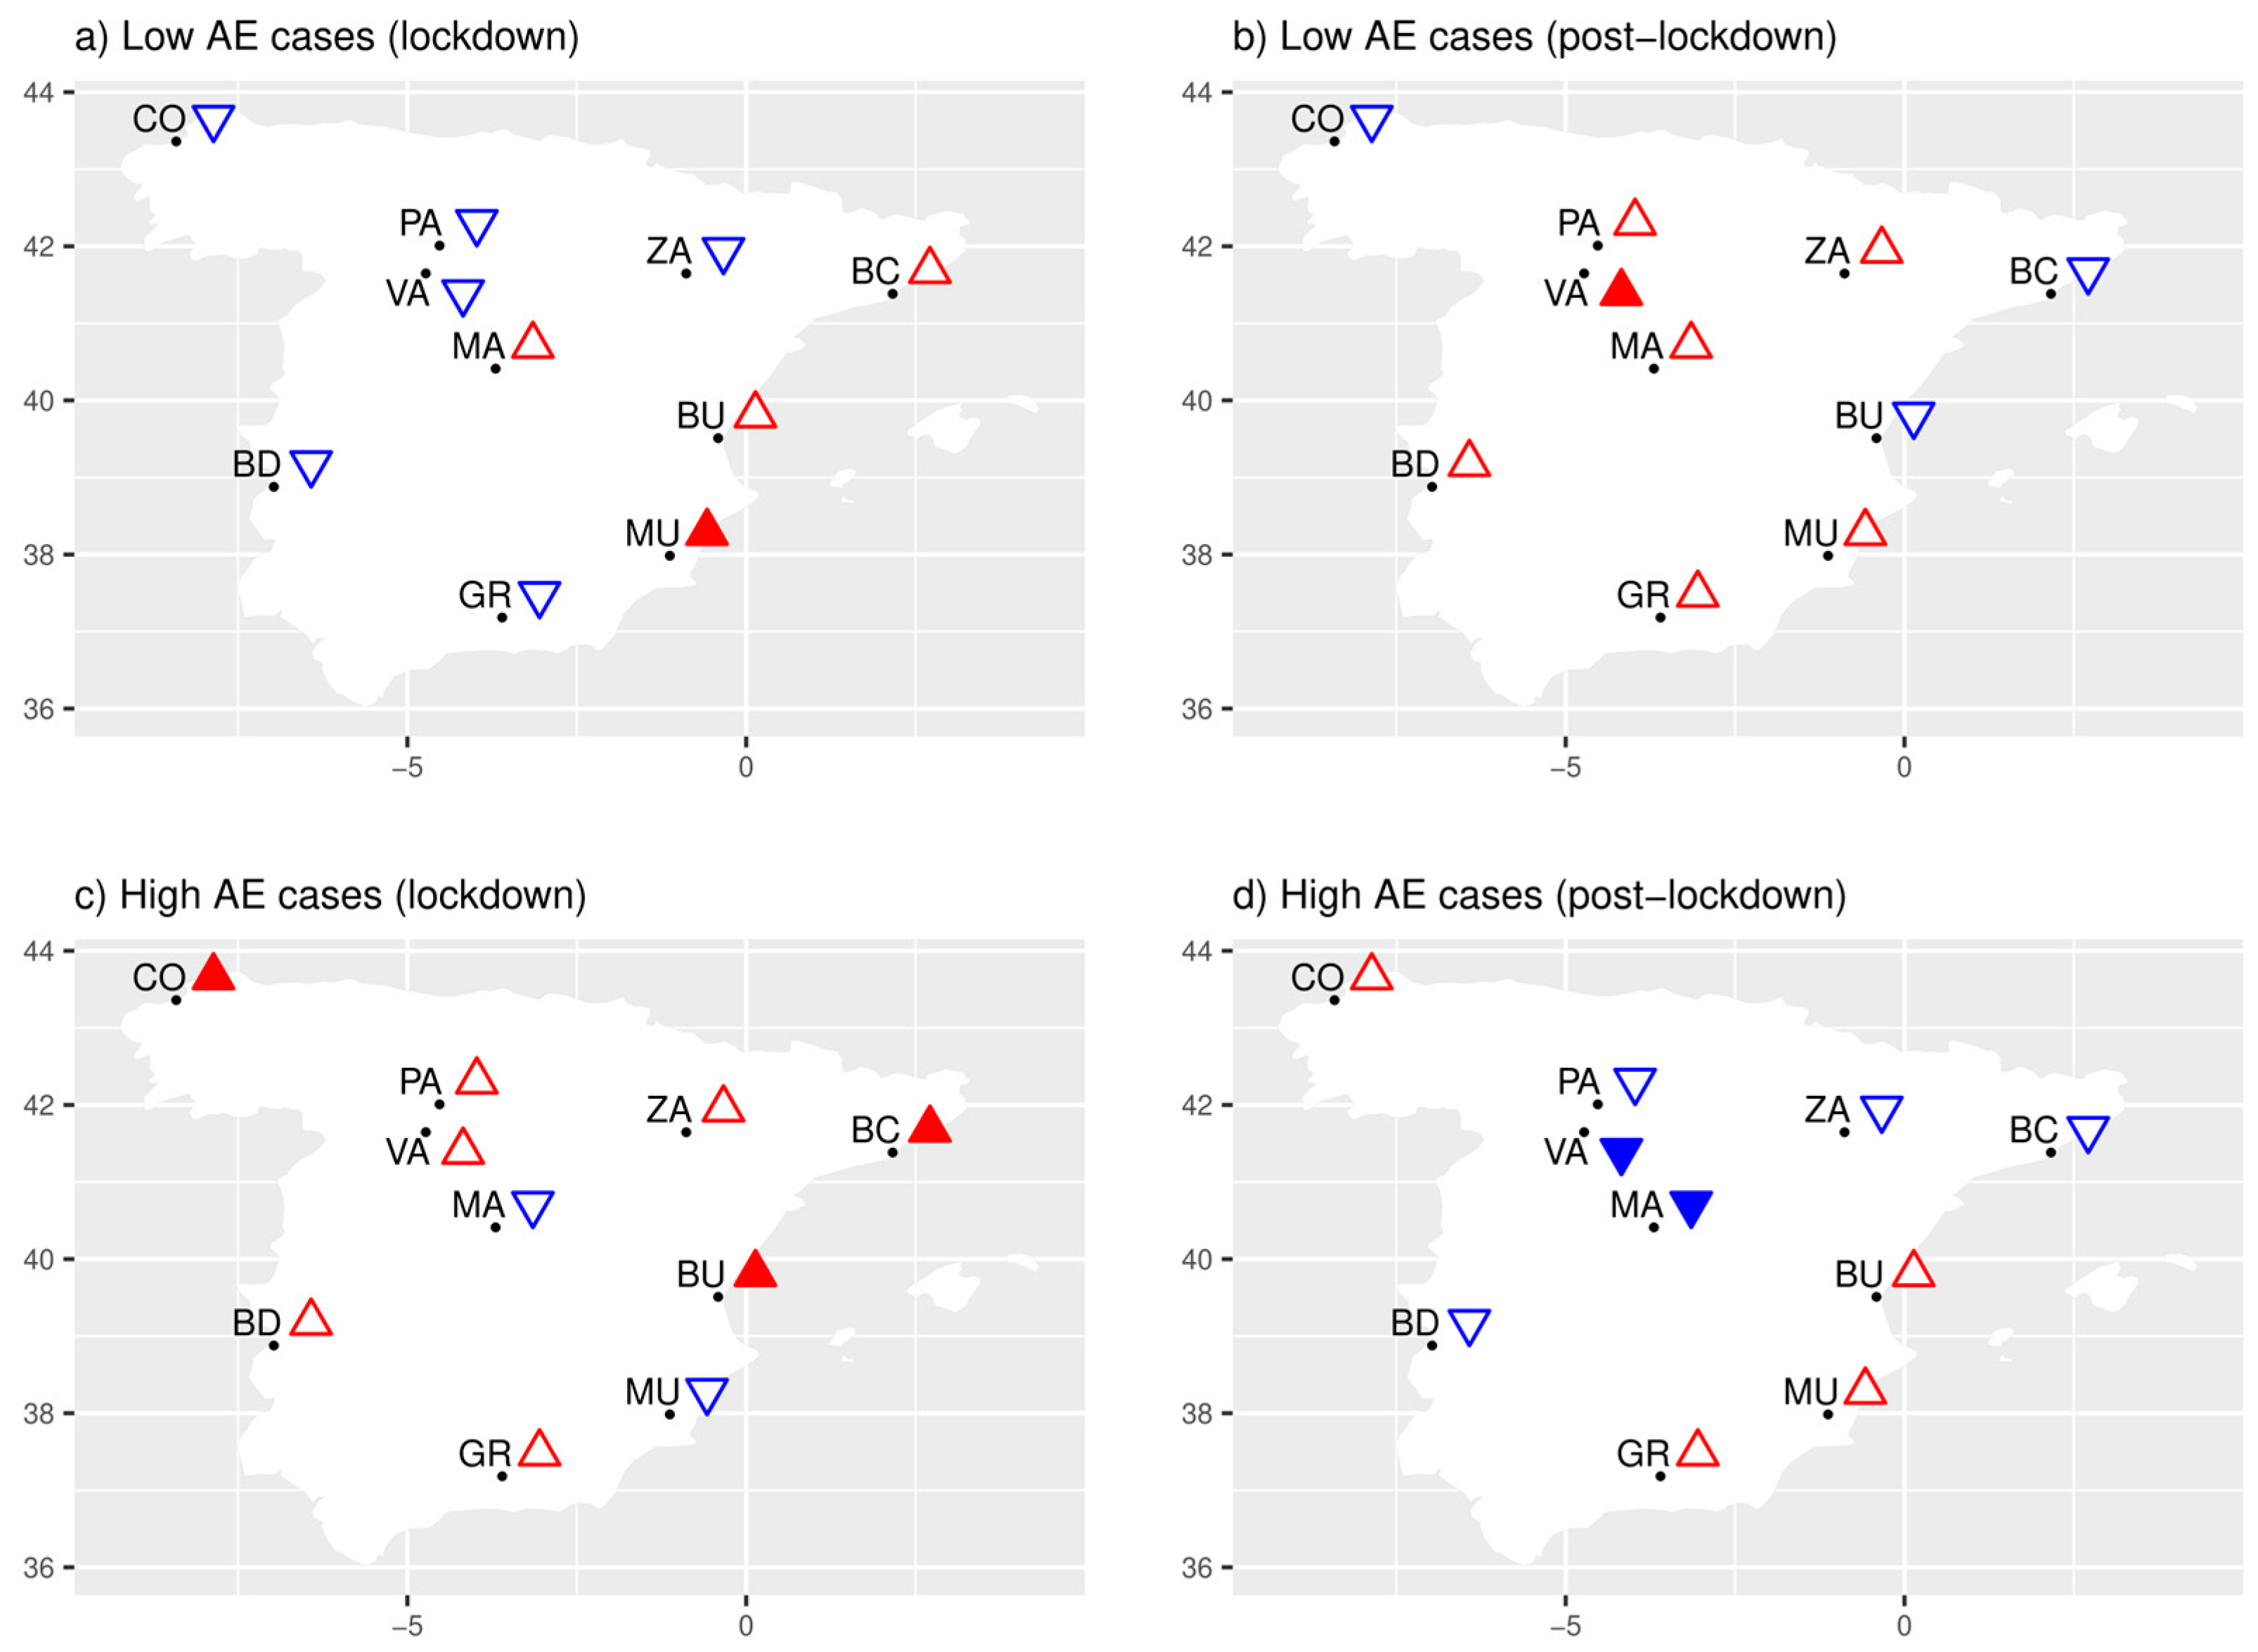
4.4.2. AE
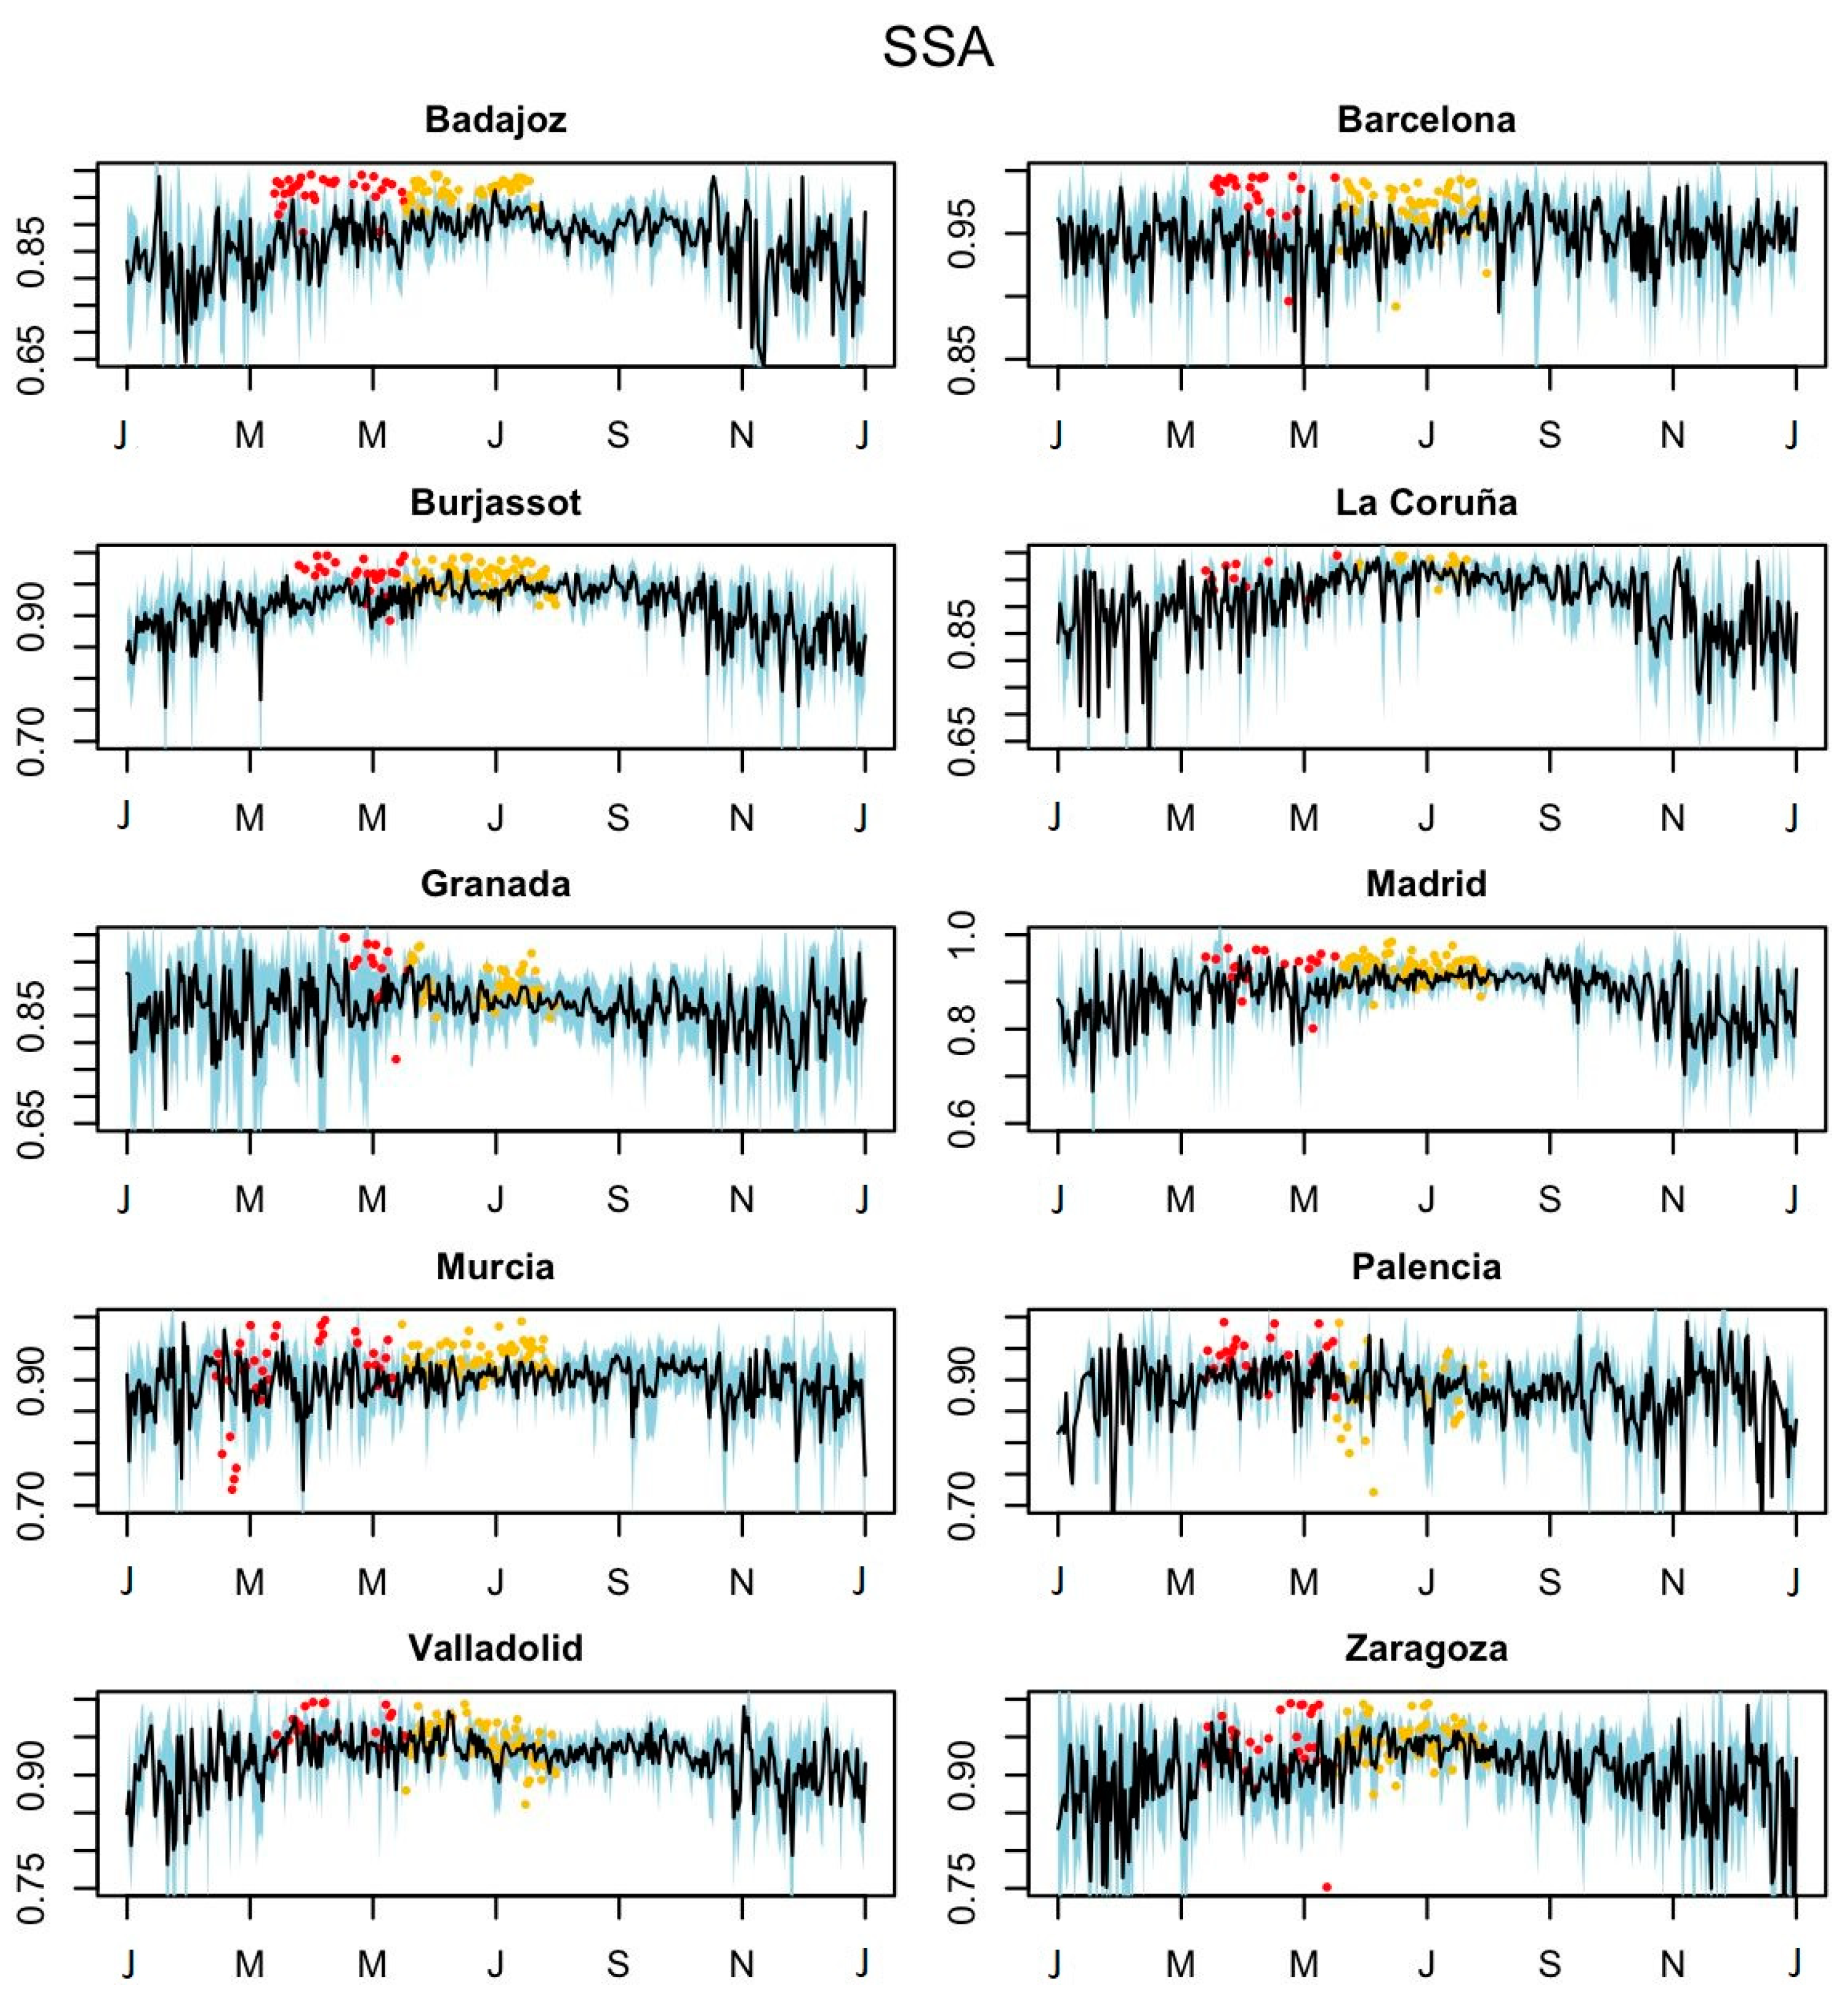
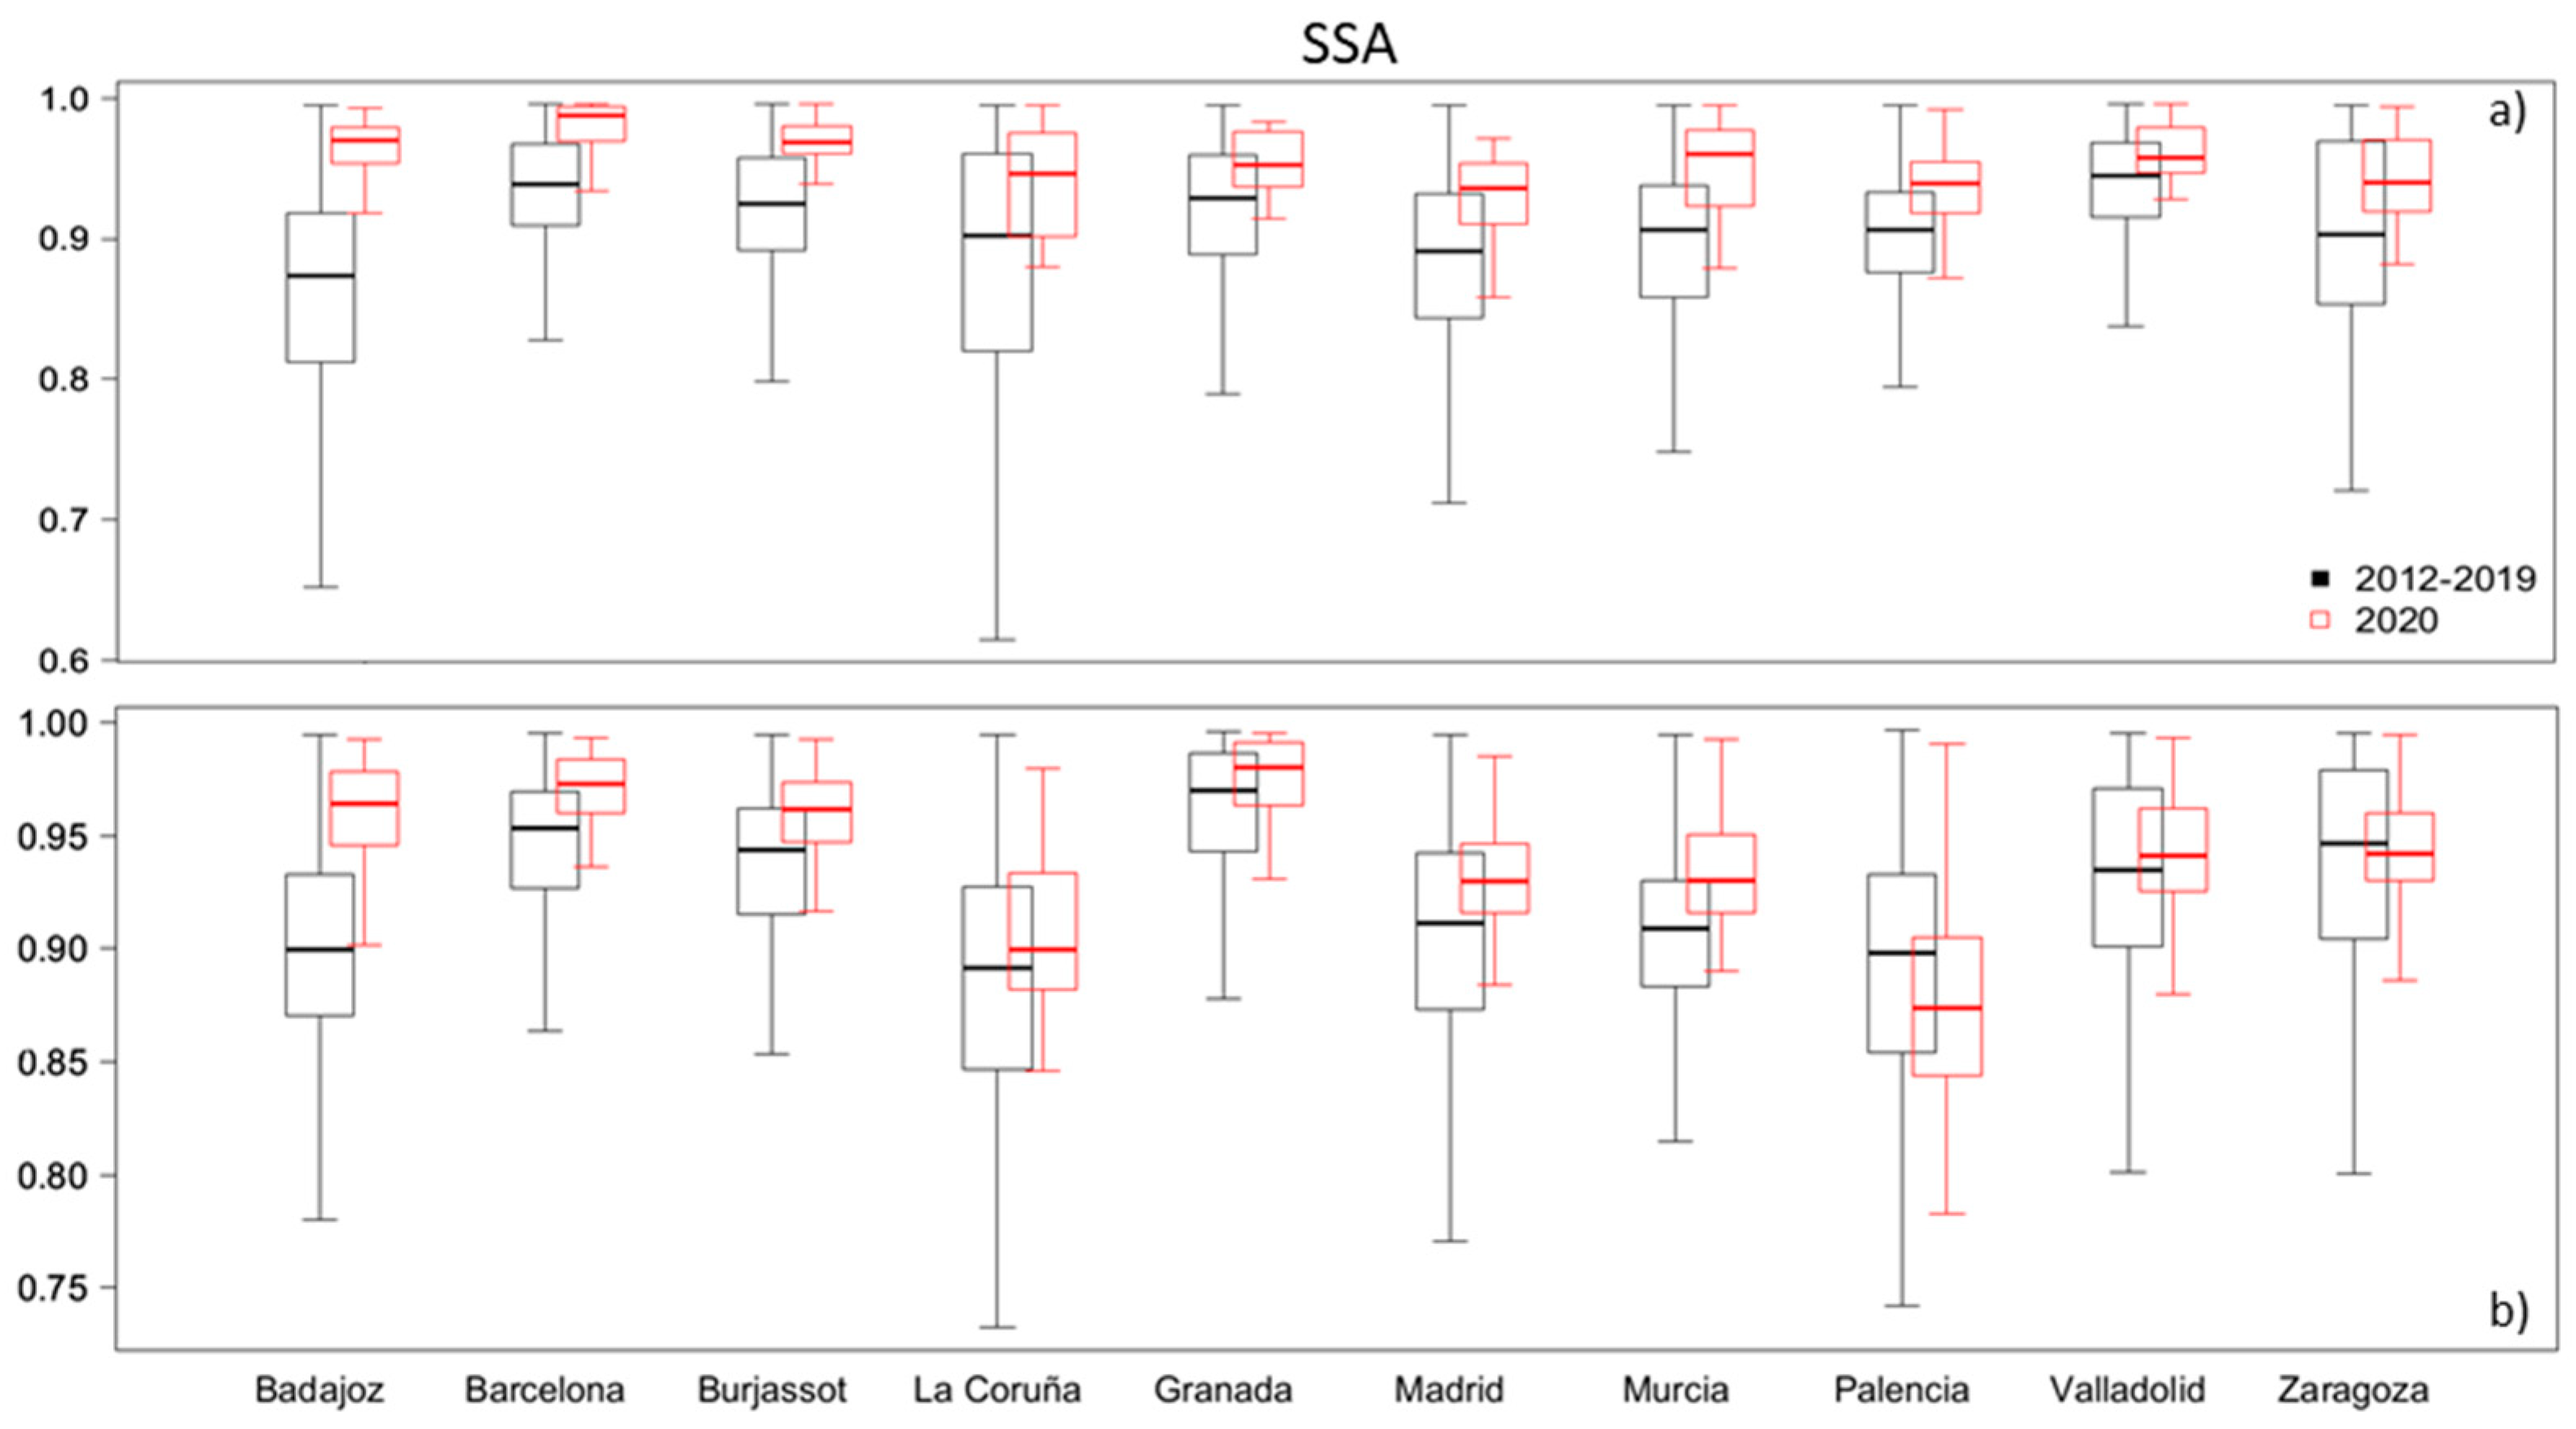
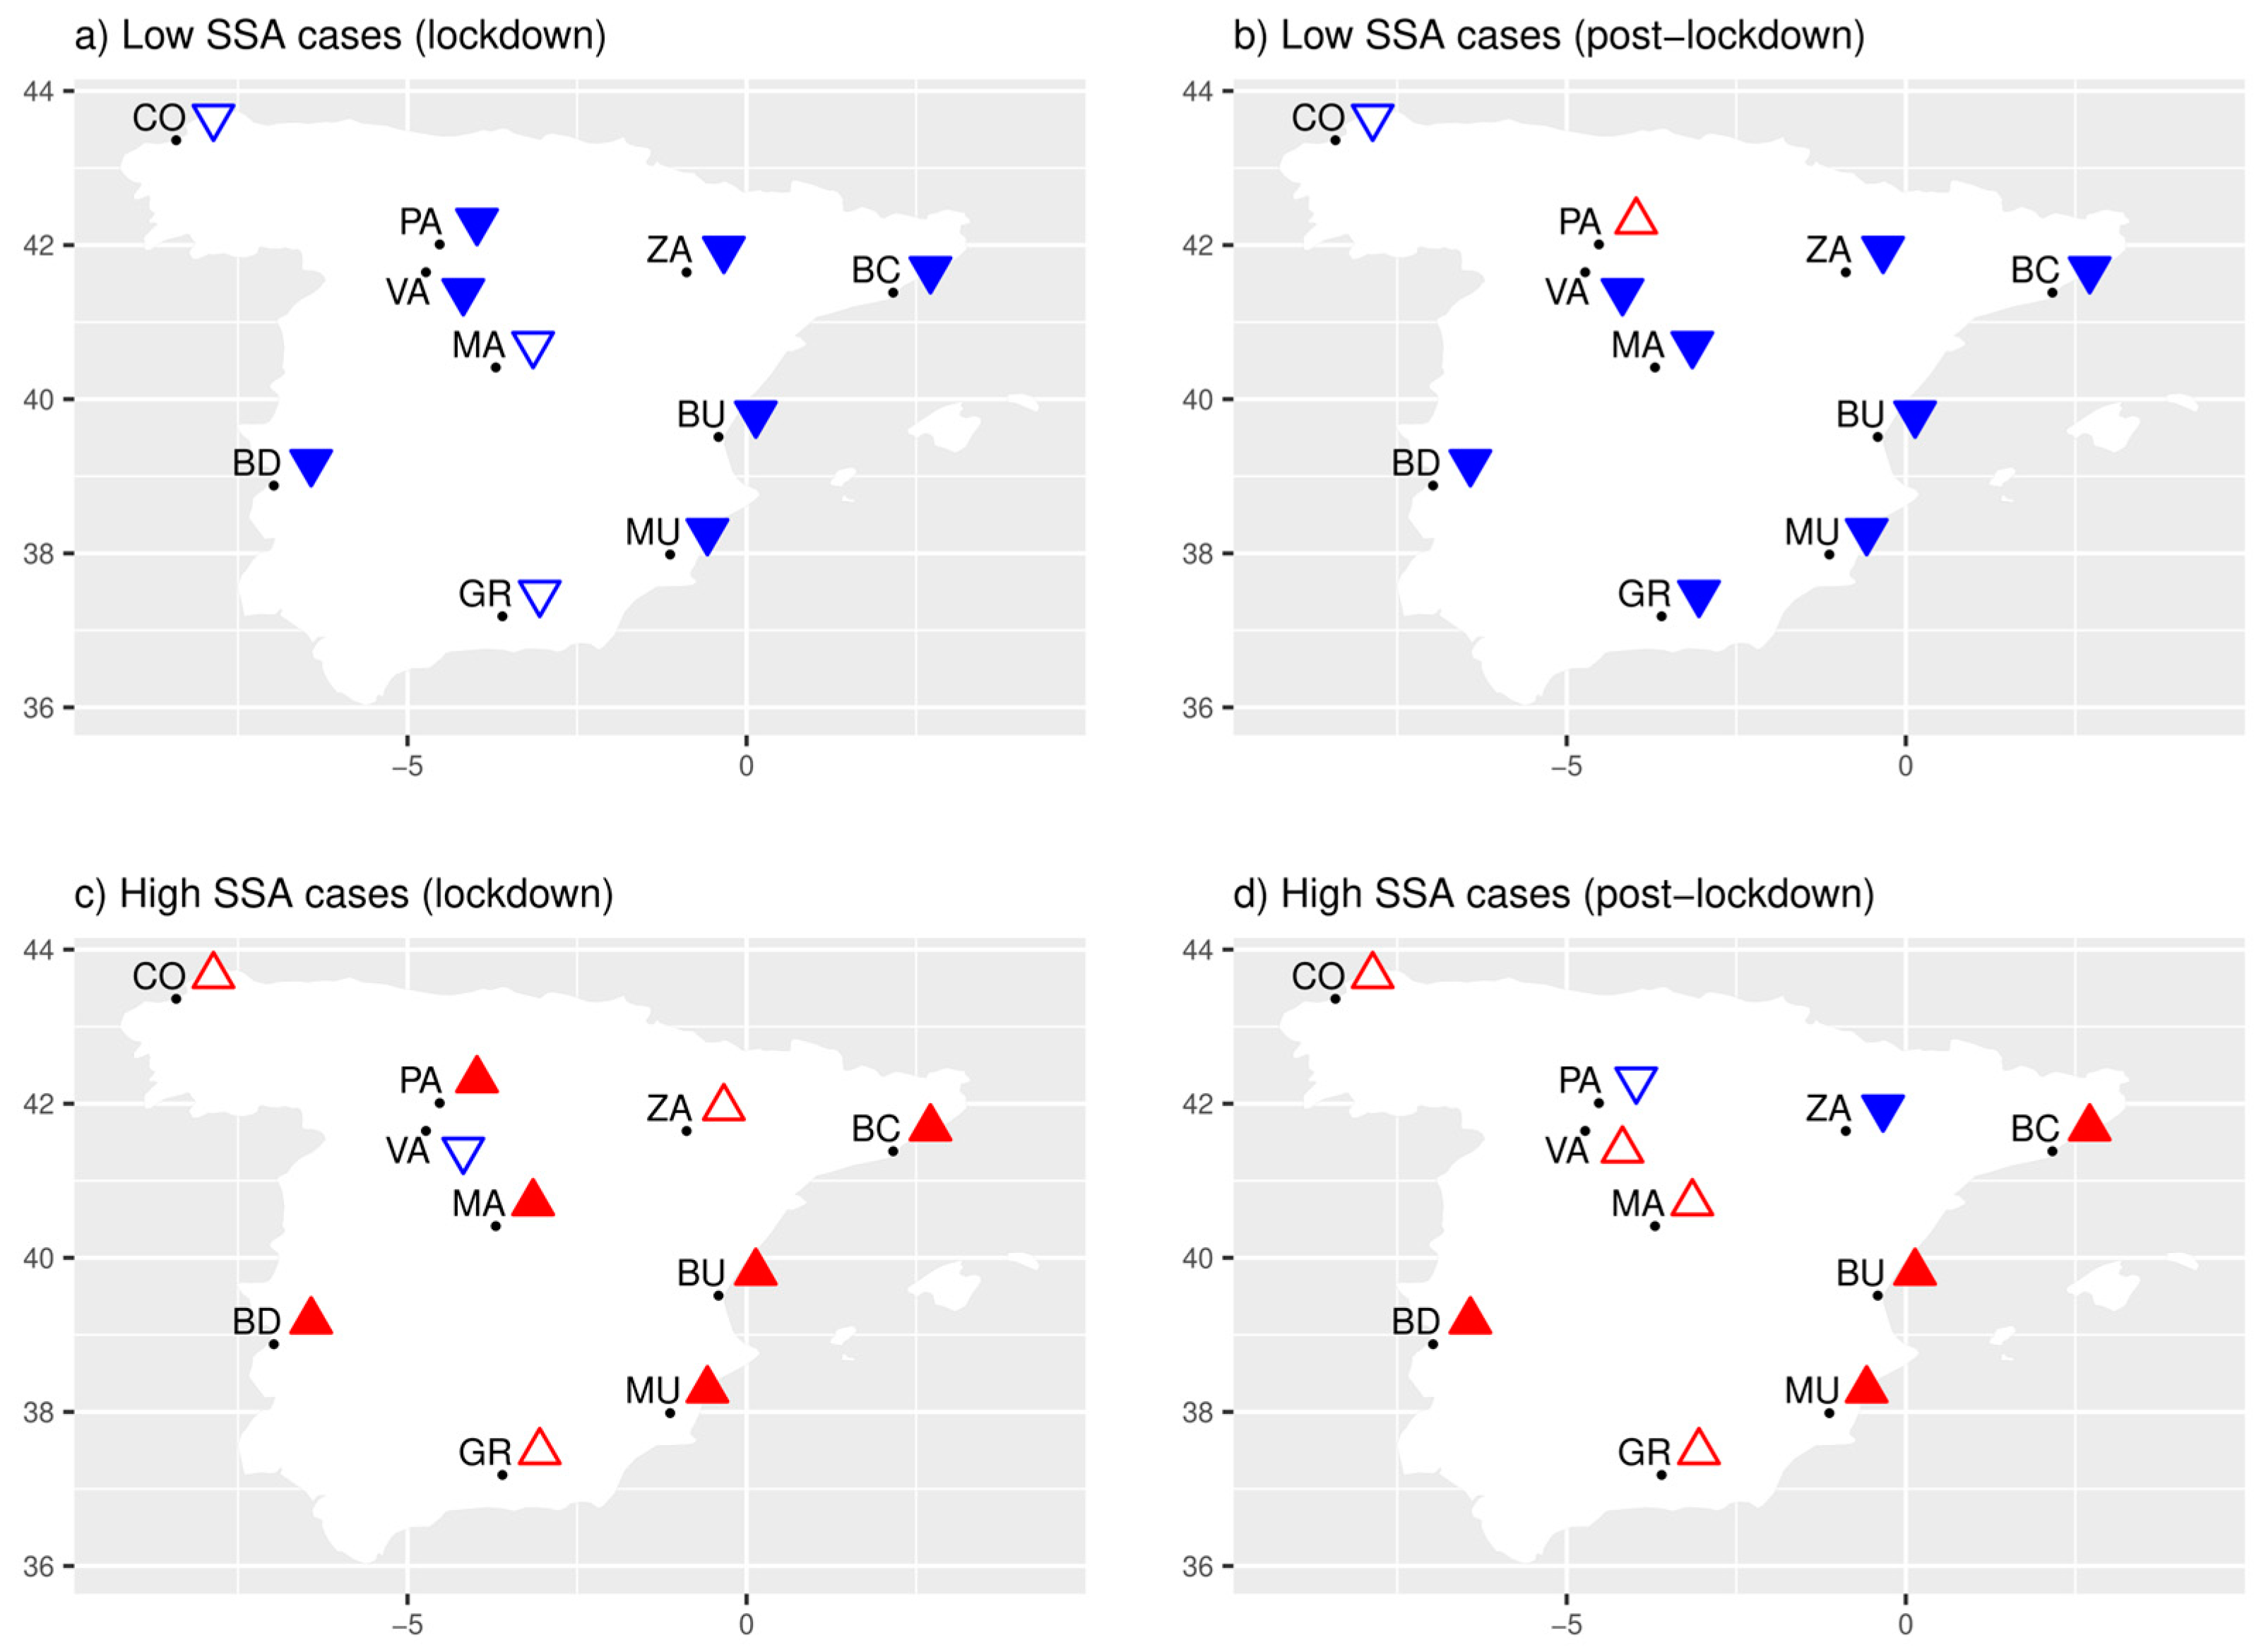
4.4.3. SSA
5. Discussion
6. Conclusions
Author Contributions
Funding
Data Availability Statement
Acknowledgments
Conflicts of Interest
References
- Eyring, V.; Gillett, N.P.; Achuta Rao, K.M.; Barimalala, R.; Barreiro Parrillo, M.; Bellouin, N.; Cassou, C.; Durack, P.J.; Kosaka, Y.; McGregor, S.; et al. Human Influence on the Climate System. In Climate Change 2021: The Physical Science Basis; Contribution of Working Group I to the Sixth Assessment Report of the Intergovernmental Panel on Climate Change; Masson-Delmotte, V.P., Zhai, A., Pirani, S.L., Connors, C., Péan, S., Berger, N., Caud, Y., Chen, L., Goldfarb, M.I., Gomis, M., et al., Eds.; Cambridge University Press: Cambridge, UK; New York, NY, USA, 2021; pp. 423–552. [Google Scholar] [CrossRef]
- IPCC. Climate Change 2022: Impacts, Adaptation, and Vulnerability. In Contribution of Working Group II to the Sixth Assessment Report of the Intergovernmental Panel on Climate Change; Pörtner, H.-O., Roberts, D.C., Tignor, M., Poloczanska, E.S., Mintenbeck, K., Alegría, A., Craig, M., Langsdorf, S., Löschke, S., Möller, V., et al., Eds.; Cambridge University Press: Cambridge, UK; New York, NY, USA, 2022; 3056p. [Google Scholar] [CrossRef]
- Myhre, G.; Myhre, C.E.L.; Samset, B.H.; Storelvmo, T. Aerosols and their Relation to Global Climate and Climate Sensitivity. Nat. Educ. Knowl. 2013, 4, 7. [Google Scholar]
- Chauhan, A.; Singh, R.P. Decline in PM2.5 concentrations over major cities around the world associated with COVID-19. Environ. Res. 2020, 187, 109634. [Google Scholar] [CrossRef] [PubMed]
- Venter, Z.S.; Aunan, K.; Chowdhury, S.; Lelieveld, J. Air pollution declines during COVID-19 lockdowns mitigate the global health burden. Environ. Res. 2020, 192, 110403. [Google Scholar] [CrossRef] [PubMed]
- Habibi, H.; Awal, R.; Fares, A.; Ghahremannejad, M. COVID-19 and the Improvement of the Global Air Quality: The Bright Side of a Pandemic. Atmosphere 2020, 11, 1279. [Google Scholar] [CrossRef]
- He, C.; Hong, S.; Zhang, L.; Mu, H.; Xin, A.; Zhou, Y.; Liu, J.; Liu, N.; Su, Y.; Tian, Y.; et al. Global, continental, and national variation in PM2.5, O3, and NO2 concentrations during the early 2020 COVID-19 lockdown. Atmos. Pollut. Res. 2021, 12, 136–145. [Google Scholar] [CrossRef]
- Kumari, P.; Toshniwal, D. Impact of lockdown on air quality over major cities across the globe during COVID-19 pandemic. Urban Clim. 2020, 34, 100719. [Google Scholar] [CrossRef]
- Rodríguez-Urrego, D.; Rodríguez-Urrego, L. Air quality during the COVID-19: PM2.5 analysis in the 50 most polluted capital cities in the world. Environ. Pollut. 2020, 266, 115042. [Google Scholar] [CrossRef]
- Acharya, P.; Barik, G.; Gayen, B.K.; Bar, S.; Maiti, A.; Sarkar, A.; Ghosh, S.; De, S.K.; Sreekesh, S. Revisiting the levels of Aerosol Optical Depth in south-southeast Asia, Europe and USA amid the COVID-19 pandemic using satellite observations. Environ. Res. 2021, 193, 110514. [Google Scholar] [CrossRef]
- Ibrahim, S.; Landa, M.; Pešek, O.; Pavelka, K.; Halounova, L. Space-Time Machine Learning Models to Analyze COVID-19 Pandemic Lockdown Effects on Aerosol Optical Depth over Europe. Remote Sens. 2021, 13, 3027. [Google Scholar] [CrossRef]
- Sanap, S.D. Global and regional variations in aerosol loading during COVID-19 imposed lockdown. Atmos. Environ. 2021, 246, 118132. [Google Scholar] [CrossRef]
- Smith, S.E.; Ting, M.; Wu, Y.; Zheng, C. Beyond the lockdowns: Satellite observations of aerosol optical depth through 2020, the first year of the COVID-19 pandemic. Environ. Res. Lett. 2022, 7, 17. [Google Scholar] [CrossRef]
- Zheng, H.; Kong, S.; Chen, N.; Yan, Y.; Liu, D.; Zhu, B.; Xu, K.; Cao, W.; Ding, Q.; Lan, B.; et al. Significant changes in the chemical compositions and sources of PM2.5 in Wuhan since the city lockdown as COVID-19. Sci. Total Environ. 2020, 739, 140000. [Google Scholar] [CrossRef] [PubMed]
- Tian, J.; Wang, Q.; Zhang, Y.; Yan, M.; Liu, H.; Zhang, N.; Ran, W.; Cao, J. Impacts of primary emissions and secondary aerosol formation on air pollution in an urban area of China during the COVID-19 lockdown. Environ. Int. 2021, 150, 106426. [Google Scholar] [CrossRef] [PubMed]
- Chen, H.; Huo, J.; Fu, Q.; Duan, Y.; Xiao, H.; Chen, J. Impact of quarantine measures on chemical compositions of PM2.5 during the COVID-19 epidemic in Shanghai, China. Sci. Total Environ. 2020, 743, 140758. [Google Scholar] [CrossRef]
- Huang, X.; Ding, A.; Gao, J.; Zheng, B.; Zhou, D.; Qi, X.; Tang, R.; Wang, J.; Ren, C.; Nie, W.; et al. Enhanced secondary pollution offset reduction of primary emissions during COVID-19 lockdown in China. Natl. Sci. Rev. 2021, 8, nwaa137. [Google Scholar] [CrossRef] [PubMed]
- Chen, Z.; Hao, X.; Zhang, X.; Chen, F. Have Traffic Restrictions Improved Air Quality? A Shock from COVID-19. J. Clean. Prod. 2021, 279, 123622. [Google Scholar] [CrossRef]
- Le, T.; Wang, Y.; Liu, L.; Yang, J.; Yung, Y.L.; Li, G.; Seinfeld, J.H. Unexpected air pollution with marked emission reductions during the COVID-19 outbreak in China. Science 2020, 369, 702–706. [Google Scholar] [CrossRef]
- Mahato, S.; Pal, S.; Ghosh, K.G. Effect of lockdown amid COVID-19 pandemic on air quality of the megacity Delhi, India. Sci. Total Environ. 2020, 730, 086. [Google Scholar] [CrossRef]
- Kerimray, A.; Baimatova, N.; Ibragimova, O.P.; Bukenov, B.; Kenessov, B.; Plotitsyn, P.; Karaca, F. Assessing air quality changes in large cities during COVID-19 lockdowns: The impacts of traffic-free urban conditions in Almaty, Kazakhstan. Sci. Total Environ. 2020, 730, 139179. [Google Scholar] [CrossRef]
- Zoran, M.A.; Savastru, R.S.; Savastru, D.M.; Tautan, M.N. Peculiar weather patterns effects on air pollution and COVID-19 spread in Tokyo metropolis. Environ. Res. 2023, 228, 115907. [Google Scholar] [CrossRef]
- Santoso, M.; Hopke, P.K.; Permadi, D.A.; Damastuti, E.; Lestiani, D.D.; Kurniawati, S.; Khoerotunnisya, D.; Sukir, S.K. Multiple Air Quality Monitoring Evidence of the Impacts of Large-scale Social Restrictions during the COVID-19 Pandemic in Jakarta, Indonesia. Aerosol Air Qual. Res. 2021, 21, 200645. [Google Scholar] [CrossRef]
- Wetchayont, P.; Hayasaka, T.; Khatri, P. Air Quality Improvement during COVID-19 Lockdown in Bangkok Metropolitan, Thailand: Effect of the Long-range Transport of Air Pollutants. Aerosol Air Qual. Res. 2021, 21, 200662. [Google Scholar] [CrossRef]
- Shukla, N.; Sharma, G.K.; Baruah, P.; Shukla, V.K.; Gargava, P. Impact of Shutdown due to COVID-19 Pandemic on Aerosol Characteristics in Kanpur, India. J. Health Pollut. 2020, 10, 201201. [Google Scholar] [CrossRef] [PubMed]
- Shen, L.; Zhao, T.; Wang, H.; Liu, J.; Bai, Y.; Kong, S.; Zheng, H.; Zhu, Y.; Shu, Z. Importance of meteorology in air pollution events during the city lockdown for COVID-19 in Hubei Province, Central China. Sci. Total Environ. 2021, 754, 142227. [Google Scholar] [CrossRef]
- Adams, M.D. Air Pollution in Ontario, Canada during the COVID-19 State of Emergency. Sci. Total Environ. 2020, 742, 140516. [Google Scholar] [CrossRef] [PubMed]
- Chen, L.W.A.; Chien, L.C.; Li, Y.; Lin, G. Nonuniform Impacts of COVID-19 Lockdown on Air Quality over the United States. Sci. Total Environ. 2020, 745, 141105. [Google Scholar] [CrossRef] [PubMed]
- Kutralam-Muniasamy, G.; Pérez-Guevara, F.; Roy, P.D.; Elizalde-Martínez, I.; Shruti, V.C. Impacts of the COVID-19 lockdown on air quality and its association with human mortality trends in megapolis Mexico City. Air Qual. Atmos. Health 2021, 14, 553–562. [Google Scholar] [CrossRef]
- Dantas, G.; Siciliano, B.; França, B.; da Silva, C.M.; Arbilla, G. The impact of COVID-19 partial lockdown on the air quality of the city of Rio de Janeiro, Brazil. Sci. Total Environ. 2020, 729, 139085. [Google Scholar] [CrossRef]
- Nakada, L.Y.K.; Urban, R.C. COVID-19 pandemic: Impacts on the air quality during the partial lockdown in São Paulo state, Brazil. Sci. Total Environ. 2020, 730, 139087. [Google Scholar] [CrossRef]
- Bolaño-Ortiz, T.R.; Pascual-Flores, R.M.; Puliafito, S.E.; Camargo-Caicedo, Y.; Berná-Peña, L.L.; Ruggeri, M.F.; López-Noreña, A.I.; Tames, M.F.; Cereceda-Balic, F. Spread of COVID-19, Meteorological Conditions and Air Quality in the City of Buenos Aires, Argentina: Two Facets Observed during Its Pandemic Lockdown. Atmosphere 2020, 11, 1045. [Google Scholar] [CrossRef]
- Duc, H.; Salter, D.; Azzi, M.; Jiang, N.; Warren, L.; Watt, S.; Riley, M.; White, S.; Trieu, T.; Tzu-Chi Chang, L.; et al. The Effect of Lockdown Period during the COVID-19 Pandemic on Air Quality in Sydney Region, Australia. Int. J. Environ. Res. Public Health 2021, 18, 3528. [Google Scholar] [CrossRef]
- Skirienė, A.F.; Stasiškienė, Ž. COVID-19 and Air Pollution: Measuring Pandemic Impact to Air Quality in five European Countries. Atmosphere 2021, 12, 290. [Google Scholar] [CrossRef]
- Jephcote, C.; Hansell, A.L.; Adams, K.; Gulliver, J. Changes in air quality during COVID-19 ‘lockdown’ in the United Kingdom. Environ. Pollut. 2021, 272, 116011. [Google Scholar] [CrossRef]
- Cao, X.; Liu, X.; Hadiatullah, H.; Xu, Y.; Zhang, X.; Cyrys, J.; Zimmermann, R.; Adam, T. Investigation of COVID-19-related lockdowns on the air pollution changes in augsburg in 2020, Germany. Atmos. Pollut. Res. 2022, 13, 101536. [Google Scholar] [CrossRef]
- Rogulski, M.; Badyda, A. Air Pollution Observations in Selected Locations in Poland during the Lockdown Related to COVID-19. Atmosphere 2021, 12, 806. [Google Scholar] [CrossRef]
- Donzelli, G.; Cioni, L.; Cancellieri, M.; Llopis Morales, A.; Morales Suárez-Varela, M.M. The Effect of the COVID-19 Lockdown on Air Quality in Three Italian Medium-Sized Cities. Atmosphere 2020, 11, 1118. [Google Scholar] [CrossRef]
- Sbai, S.E.; Mejjad, N.; Norelyaqine, A.; Bentayeb, F. Air quality change during the COVID-19 pandemic lockdown over the Auvergne-Rhône-Alpes region, France. Air Qual. Atmos. Health 2021, 14, 617–628. [Google Scholar] [CrossRef]
- Dahech, S.; Abdmouleh, M.A.; Lagmiri, S. Spatiotemporal Variation of Air Quality (PM and NO2) in Southern Paris during COVID-19 Lockdown Periods. Atmosphere 2022, 13, 289. [Google Scholar] [CrossRef]
- Briz-Redón, A.; Belenguer-Sapiña, C.; Serrano-Aroca, A. Changes in air pollution during COVID-19 lockdown in Spain: A multi-city study. J. Environ. Sci. 2020, 101, 16–26. [Google Scholar] [CrossRef]
- Querol, X.; Massagué, J.; Alastuey, A.; Moreno, T.; Gangoiti, G.; Mantilla, E.; Diéguez, J.J.; Escudero, M.; Monfort, E.; García-Pando, C.P.; et al. Lessons from the COVID-19 air pollution decrease in Spain: Now what? Sci. Total Environ. 2021, 779, 146380. [Google Scholar] [CrossRef]
- Gama, C.; Relvas, H.; Lopes, M.; Monteiro, A. The impact of COVID-19 on air quality levels in Portugal: A way to assess traffic contribution. Environ. Res. 2021, 193, 110515. [Google Scholar] [CrossRef] [PubMed]
- Gamelas, C.; Abecasis, L.; Canha, N.; Almeida, S.M. The Impact of COVID-19 Confinement Measures on the Air Quality in an Urban-Industrial Area of Portugal. Atmosphere 2021, 12, 1097. [Google Scholar] [CrossRef]
- Romano, S.; Catanzaro, V.; Paladini, F. Impacts of the COVID-19 Lockdown Measures on the 2020 Columnar and Surface Air Pollution Parameters over South-Eastern Italy. Atmosphere 2021, 12, 1366. [Google Scholar] [CrossRef]
- Piazzola, J.; Bruch, W.; Desnues, C.; Parent, P.; Yohia, C.; Canepa, E. Influence of Meteorological Conditions and Aerosol Properties on the COVID-19 Contamination of the Population in Coastal and Continental Areas in France: Study of Offshore and Onshore Winds. Atmosphere 2021, 12, 523. [Google Scholar] [CrossRef]
- Filonchyk, M.; Hurynovich, V.; Yan, H. Impact of COVID-19 lockdown on air quality in the Poland, Eastern Europe. Environ. Res. 2021, 198, 110454. [Google Scholar] [CrossRef]
- Sannino, A.; D’Emilio, M.; Castellano, P.; Amoruso, S.; Boselli, A. Analysis of Air Quality during the COVID-19 Pandemic Lockdown in Naples (Italy). Aerosol Air Qual. Res. 2021, 21, 200381. [Google Scholar] [CrossRef]
- Tobías, A.; Carnerero, C.; Reche, C.; Massagué, J.; Via, M.; Minguillón, M.C.; Alastuey, A.; Querol, X. Changes in air quality during the lockdown in Barcelona (Spain) one month into the SARS-CoV-2 epidemic. Sci. Total Environ. 2020, 726, 138540. [Google Scholar] [CrossRef]
- Betancourt-Odio, M.A.; Martínez-de-Ibarreta, C.; Budría-Rodríguez, S.; Wirth, E. Local analysis of air quality changes in the community of Madrid before and during the COVID-19 induced lockdown. Atmosphere 2021, 12, 659. [Google Scholar] [CrossRef]
- Donzelli, G.; Cioni, L.; Cancellieri, M.; Llopis-Morales, A.; Morales-Suárez-Varela, M. Relations between air quality and COVID-19 lockdown measures in Valencia, Spain. Int. J. Environ. Res. Public Health 2021, 18, 2296. [Google Scholar] [CrossRef]
- Wirth, E.; Betancourt-Odio, M.A.; Cabeza-García, M.; Zapatero-González, A. Footprints of COVID-19 on Pollution in Southern Spain. Atmosphere 2022, 13, 1928. [Google Scholar] [CrossRef]
- Barragán, R.; Molero, F.; Granados-Muñoz, M.J.; Salvador, P.; Pujadas, M.; Artiñano, B. Feasibility of Ceilometers Data to Estimate Radiative Forcing Values: Application to Different Conditions around the COVID-19 Lockdown Period. Remote Sens. 2020, 12, 3699. [Google Scholar] [CrossRef]
- Mitjà, O.; Arenas, A.; Rodó, X.; Tobías, A.; Brew, J.; Benlloch, J.M. Experts’ request to the Spanish Government: Move Spain towards complete lockdown. Lancet 2020, 395, 1193–1194. [Google Scholar] [CrossRef]
- Holben, B.; Eck, T.F.; Slutsker, I.; Tanre, D.; Buis, J.; Setzer, K.; Vermote, E.; Reagan, J.; Kaufman, Y.; Nakajima, T.; et al. AERONET—A federated instrument network and data archive for aerosol characterization. Remote Sens. Environ. 1998, 66, 1–16. [Google Scholar] [CrossRef]
- Schuster, G.L.; Dubovik, O.; Holben, B.N. Ångström exponent and bimodal aerosol size distributions. J. Geophys. Res. 2006, 111, D07207. [Google Scholar] [CrossRef]
- Dubovik, O.; Smirnov, A.; Holben, B.N.; King, M.D.; Kaufman, Y.J.; Eck, T.F.; Slutsker, I. Accuracy assessments of aerosol optical properties retrieved from Aerosol Robotic Network (AERONET) Sun and sky radiance measurements. J. Geophys. Res. 2000, 105, 9791–9806. [Google Scholar] [CrossRef]
- Jonhson, D.H. The Insignificance of Statistical Significance Testing. J. Wildl. Manag. 1999, 3, 763–772. [Google Scholar] [CrossRef]
- Lakens, D. The practical alternative to the p value is the correctly used p value. Perspect Psychol Sci. 2021, 16, 639–648. [Google Scholar] [CrossRef]
- Fricker, R.D., Jr.; Burke, K.; Han, X.; Woodall, W.H. Assessing the Statistical Analyses Used in Basic and Applied Social Psychology after Their p-Value Ban. Am. Stat. 2019, 73, 374–384. [Google Scholar] [CrossRef]
- Girden, E.R. ANOVA: Repeated Measures; Sage: Thousand Oaks, CA, USA, 1992. [Google Scholar]
- Kaufmann, J.; Schering, A.G. Analysis of variance (ANOVA). In Wiley Encyclopedia of Clinical Trials; D’Agostino, R., Massaro, J., Sullivan, L., Eds.; Wiley: Hoboken, NJ, USA, 2007. [Google Scholar] [CrossRef]
- Black, G.; Ard, D.; Smith, J.; Schibik, T. The impact of the Weibull distribution on the performance of the single-factor ANOVA model. Int. J. Ind. Eng. Comput. 2010, 1, 185–198. [Google Scholar] [CrossRef]
- Lantz, B. The impact of sample non-normality on ANOVA and alternative methods. Br. J. Math. Stat. Psychol. 2013, 66, 224–244. [Google Scholar] [CrossRef]
- Schmider, E.; Ziegler, M.; Danay, E.; Beyer, L.; Bühner, M. Is it really robust? Reinvestigating the robustness of ANOVA against violations of the normal distribution assumption. Methodology 2010, 6, 147–151. [Google Scholar] [CrossRef]
- Blanca Mena, M.J.; Alarcón Postigo, R.; Arnau Gras, J.; Bono Cabré, R.; Bendayan, R. Non-normal data: Is ANOVA still a valid option? Psicothema 2017, 29, 552–557. [Google Scholar]
- Kleidman, R.G.; O’Neill, N.T.; Remer, L.A.; Kaufman, Y.J.; Eck, T.F.; Tanre, D.; Dubovik, O.; Holben, B.N. Comparison of Moderate Resolution Imaging Spectroradiometer (MODIS) and Aerosol Robotic Network (AERONET) remote-sensing retrieval of aerosol fine mode fraction over ocean. J. Geophys. Res. 2005, 110, D22205. [Google Scholar] [CrossRef]
- Lonati, G.; Riva, F. Regional scale impact of the COVID-19 Lockdown on Air Quality: Gaseous Pollutants in the Po Valley, Northern Italy. Atmosphere 2021, 12, 264. [Google Scholar] [CrossRef]
- Marinello, S.; Lolli, F.; Gamberini, R. The Impact of the COVID-19 Emergency on Local Vehicular Traffic and Its Consequences for the Environment: The Case of the City of Reggio Emilia (Italy). Sustainability 2021, 13, 118. [Google Scholar] [CrossRef]
- Ministerio Para la Transición Ecológica y el Reto Demográfico (MITECO). Episodios naturales de Partículas. African Dust Alert System. Available online: https://www.miteco.gob.es/es/calidad-y-evaluacion-ambiental/temas/atmosfera-y-calidad-del-aire/calidad-delaire/evaluacion-datos/fuentes-naturales/default.aspx (accessed on 31 March 2023).
- Elias, T.; Silva, A.; Belo, N.; Pereira, S.; Formenti, P.; Helas, G.; Wagner, F. Aerosol extinction in a remote continental region of the Iberian Peninsula during summer. J. Geophys. Res. 2006, 111, 1–20. [Google Scholar] [CrossRef]
- Otero, L.; Ristori, P.; Holben, B.; Quel, E. Espesor óptico de aerosoles durante el año 2002 para diez estaciones pertenecientes a la red AERONET—NASA. Opt. Pura Apl. 2006, 39, 355–364. [Google Scholar]
- Kaskaoutis, D.; Kambezidis, H.; Hatzianastassiou, N.; Kosmopoulos, P.; Badarinath, K. Aerosol climatology: On the discrimination of aerosol types over four Aeronet sites. Atmos. Chem. Phys. Discuss. 2007, 7, 6357–6411. [Google Scholar]
- Toledano, C.; Cachorro, V.; Berjón, A.; de Frutos, A.; Sorribas, M.; de la Morena, B.; Goloub, P. Aerosol optical depth and Ångström exponent climatology at El Arenosillo AERONET site (Huelva, Spain). Q. J. R. Meteorol. Soc. 2007, 133, 795–807. [Google Scholar] [CrossRef]


| AOD | AE | SSA | ||||
|---|---|---|---|---|---|---|
| Location | Time | Location | Time | Location | Time | |
| p-Value | p-Value | p-Value | ||||
| Lockdown | <2 × 10⁻¹⁶ | 3.83 × 10⁻⁷ | <2 × 10⁻¹⁶ | 0.271 | <2 × 10⁻¹⁶ | <2 × 10⁻¹⁶ |
| Post-lockdown | <2 × 10⁻¹⁶ | 6.67 × 10⁻⁶ | <2 × 10⁻¹⁶ | 0.141 | <2 × 10⁻¹⁶ | <2 × 10⁻¹⁶ |
Disclaimer/Publisher’s Note: The statements, opinions and data contained in all publications are solely those of the individual author(s) and contributor(s) and not of MDPI and/or the editor(s). MDPI and/or the editor(s) disclaim responsibility for any injury to people or property resulting from any ideas, methods, instructions or products referred to in the content. |
© 2023 by the authors. Licensee MDPI, Basel, Switzerland. This article is an open access article distributed under the terms and conditions of the Creative Commons Attribution (CC BY) license (https://creativecommons.org/licenses/by/4.0/).
Share and Cite
Obregón, M.Á.; Martín, B.; Serrano, A. Footprint of the 2020 COVID-19 Lockdown on Column-Integrated Aerosol Parameters in Spain. Remote Sens. 2023, 15, 3167. https://doi.org/10.3390/rs15123167
Obregón MÁ, Martín B, Serrano A. Footprint of the 2020 COVID-19 Lockdown on Column-Integrated Aerosol Parameters in Spain. Remote Sensing. 2023; 15(12):3167. https://doi.org/10.3390/rs15123167
Chicago/Turabian StyleObregón, María Ángeles, Blanca Martín, and Antonio Serrano. 2023. "Footprint of the 2020 COVID-19 Lockdown on Column-Integrated Aerosol Parameters in Spain" Remote Sensing 15, no. 12: 3167. https://doi.org/10.3390/rs15123167
APA StyleObregón, M. Á., Martín, B., & Serrano, A. (2023). Footprint of the 2020 COVID-19 Lockdown on Column-Integrated Aerosol Parameters in Spain. Remote Sensing, 15(12), 3167. https://doi.org/10.3390/rs15123167