Article

ADD-UNet: An Adjacent Dual-Decoder UNet for SAR-to-Optical Translation

State Key Laboratory of Precision Measuring Technology and Instruments, Tianjin University, No. 92, Weijin Road, Nankai District, Tianjin 300072, China
*
Author to whom correspondence should be addressed.
Remote Sens. 2023, 15(12), 3125; https://doi.org/10.3390/rs15123125
Submission received: 23 April 2023 / Revised: 10 June 2023 / Accepted: 12 June 2023 / Published: 15 June 2023
(This article belongs to the Special Issue Machine Vision and Advanced Image Processing in Remote Sensing II)

Abstract

:
Synthetic aperture radar (SAR) imagery has the advantages of all-day and all-weather observation. However, due to the imaging mechanism of microwaves, it is difficult for nonexperts to interpret SAR images. Transferring SAR imagery into optical imagery can better improve the interpretation of SAR data and support the further fusion research of multi-source remote sensing. Methods based on generative adversarial networks (GAN) have been proven to be effective in SAR-to-optical translation tasks. To further improve the translation results of SAR data, we propose a method of an adjacent dual-decoder UNet (ADD-UNet) based on conditional GAN (cGAN) for SAR-to-optical translation. The proposed network architecture adds an adjacent scale of the decoder to the UNet, and the multi-scale feature aggregation of the two decoders improves structures, details, and edge sharpness of generated images while introducing fewer parameters compared with UNet++. In addition, we combine multi-scale structure similarity (MS-SSIM) loss and L1 loss as loss functions with cGAN loss together to help preserve structures and details. The experimental results demonstrate the superiority of our method compared with several state-of-the-art methods.

Graphical Abstract

1. Introduction

With the development of remote sensing technology, diverse remote sensing sensors have found their way into different fields, ranging from prevention to urban planning and scene monitoring. Among the major data sources are optical remote sensing and synthetic aperture radar (SAR) images. While optical imagery boasts advantages in higher spatial resolution, richer spectral information, and better detailed information, it is hindered by adverse weather conditions such as clouds and fog. On the other hand, SAR can provide all-day and all-weather data. However, the imaging mechanism of microwaves poses difficulties in interpreting SAR images. In light of this, translating SAR images into optical-like images can enable non-experts to quickly identify ground information in the absence of optical images, thereby extending the range of SAR image applications and providing a new perspective for the fusion of SAR and optical images.
SAR images are also widely used in cloud removal because of their advantages, such as being able to pass through clouds and smoke. They can be obtained 24 h a day and regardless of the weather conditions. However, disadvantages such as speckle noise, a lack of color information, and geometry distortion and shadows cause experts to be unable to distinguish between different areas. Using SAR-to-optical translated images is a way to solve this problem. For example, Singh and Komodakis [1] trained a CycleGAN to remove clouds, and Darbaghshahi [2] trained two GANs for cloud removal.
In the context of SAR-optical image matching, a significant issue arises from the notable non-rigid deformations (NRDs) between SAR and optical images. These NRDs result in inconsistent texture and structural features between the two image modalities, consequently leading to a decline in matching accuracy. To tackle this problem, Nie [3] proposed a novel dual-generator translation network that effectively integrates the texture and structural features of SAR and optical images. This approach aims to achieve high-quality SAR-optical image matching by mitigating the impact of NRDs and improving the consistency of features between the two image types. Therefore, the exploration of methods for SAR-to-optical translation is a promising avenue for research and the study of SAR-to-optical holds significant theoretical and practical importance.
In the early stages, several pseudo-color-encoding algorithms [4,5,6] were proposed to transfer SAR images into color images. However, these methods had limitations in producing results that resembled real optical images. In recent years, deep learning algorithms have made remarkable strides in the field of computer vision. In the field of pixel-level land-cover class mapping, a novel approach called super-resolution mapping based on spatial-spectral correlation was proposed by Peng Wang [7]. This method aims to mitigate the impact of both linear and nonlinear imaging conditions and leverage the more precise spectral properties of the data. In the context of target detection and classification, Xiaodi Shang [8] introduced a technique known as target-constrained interference-minimized band selection for dimensionality reduction. This technique effectively eliminates redundant bands and selects a subset of bands that adequately represent the entire image. By doing so, it enhances the efficiency and accuracy of target detection and classification tasks.
The opacity of neural network mechanics results in poor interpretability for neural networks when physical information is missing. In order to release the above limitation, the framework for physics-informed machine learning has proposed and the integration architectures of physical information and neural networks have been realized [9,10]. These approaches aim to integrate domain knowledge and physical constraints into the network architecture or loss functions, enhancing the interpretability and generalizability of the models. Such integration facilitates a better understanding of the underlying physical processes and ensures that the generated outputs adhere to known physical laws. These studies demonstrate the potential of combining domain knowledge with neural networks to achieve more accurate and robust results in tasks such as land cover classification, change detection, and image reconstruction. Incorporating the laws of physics into neural networks holds vast potential for application. These architectures allow accurate prior knowledge and constraints added into neural networks, and this leads to better performance and generalization capabilities of the models.
One of the most popular networks for image-to-image transformation tasks is the generative adversarial networks (GAN) [11], which has become an increasingly attractive architecture. Nevertheless, the result of GAN is random and uncontrollable. Therefore, conditional GAN (cGAN) [12] was proposed to guide the process of image generation. Isola et al. [13] explored the effects of cGAN on general image-to-image translation tasks and proposed the renowned pix2pix framework. Both cGAN and pix2pix are supervised methods that require paired datasets for network training. However, acquiring paired datasets can be challenging and costly. To address this problem, CycleGAN [14] was proposed for unpaired dataset translation. In the field of unsupervised image translation, U-GAT-IT [15] was recently introduced and has achieved better results in geometric changes by incorporating a new attention module and adaptive layer-instance normalization.
With the development of GAN, an increasing number of methods based on GAN have been proposed for the SAR-to-optical translation task. A lot of work based on GAN networks has already been proven effective in the task of SAR-to-optical image translation, yielding impressive results. For instance, Niu et al. [16] introduced cGAN to the field of remote sensing image translation. Merkle et al. [17] utilized cGAN to transform optical images into SAR images for registration. Fu et al. [18] proposed a reciprocal GAN for two-directional SAR and optical image translation. Reyes et al. [19] explored the optimization of network parameters based on CycleGAN. Wang et al. [20] combined CycleGAN and pix2pix to enhance the structural information of generated images. Zhang et al. [21] added a VGG perceptual loss to enhance cGAN. Qian Zhang et al. [22] investigated the effects of texture and edge features in enhancing the structural similarities between generated images and ground truth. Guo et al. [23] proposed an edge-preserving GAN (EPCGAN) that improves the structural characteristics and visual clarity of generated images through content-adaptive convolution on feature maps. Li et al. [24] introduced wavelet feature learning to refine SAR-to-optical translation. Wang et al. [25] combined convolutional neural network (CNN) with vision transformer to enhance the representation capability of generator by merging global and local features. The existing GAN-based methods have demonstrated their feasibility in SAR-to-optical translation.
The generator architecture is a crucial element in GAN-based image-to-image methods. Initially, the encoder–decoder was the primary structure employed by researchers [26,27,28,29] as the generator [30]. Currently, the generator structures are mainly derived from the framework proposed by Johnson et al. [31] and UNet [32]. Johnson’s network demonstrated comparable image style transfer quality to Gaty’s method [33], while being much faster. It consists of three components: several convolution layers for down-sampling, a set of residual blocks, and a number of deconvolution layers for up-sampling. This architecture has gained considerable attention in subsequent research [12,19,21,34]. The other widely adopted generator structure is UNet [11,16,18,20,22], which leverages skip connections to combine shallow and low-level features of encoder layers with deep and semantic features of decoder layers, thus improving the network’s performance. However, the optimal depth of UNet is uncertain, and its skip connections and fusion aggregation are limited to the same-scale feature maps of encoder and decoder layers. To address these issues, UNet++ [35] was proposed, which includes decoders of different depths within its architecture and aggregates features of various semantic scales of decoders with dense connections. Despite outperforming UNet in image segmentation tasks, UNet++ requires numerous parameters, which necessitate significant device memory or lengthy training times. Additionally, the effectiveness of individual skip connections from each decoder to the outermost decoder remains in question.
The generative adversarial network (GAN) [9], proposed by Goodfellow, have found applications in various fields, including image translation, super-resolution [36], style transformation [37,38,39], and image retrieval [40,41]. In the GAN framework, the generator model and the discriminator model are trained simultaneously in an adversarial manner. The generator acts as a counterfeiter, aiming to generate fake images that closely resemble real ones, while the discriminator serves as the connoisseur, attempting to distinguish between generated and real images. However, the plain GAN approach often suffers from uncontrollable results and the risk of mode collapse, where the generator fails to explore the full diversity of the target distribution. To address these limitations, conditional GAN (cGAN) [10] was proposed. The cGAN uses an input label as additional information to help constrain the generated image to be relevant to the input label. This label helps constrain the generated image to be relevant to the given input. The loss function of cGAN can be defined as follows:
min G   max D L cGAN ( G , D ) = E log D x , y + E log 1 D x , G x
where G is a generator and D denotes a discriminator. x is a condition label and y is a corresponding realistic photo. G attempts to minimize this objective to make the generated image G x closer to the real image y , while D aims to maximize the objective to distinguish generated images from real ones. G and D work against each other in an adversarial way.
Pix2pix [11] is a classic framework of cGAN, and it has shown excellent performance in image-to-image tasks. Pix2pix adopts the UNet [31] for the generator and patchGAN for the discriminator. The loss function of pix2pix combines L1 loss with cGAN loss, and this combination results in fewer visual artifacts than relying solely on cGAN. L1 loss is defined as:
L L 1 = E G x y 1
The objective function of pix2pix combines cGAN loss and L1 loss.
L = L cGAN + λ L L 1
where λ denotes the weight of L1 loss.
In the field of image translation, methods [26,42] simply using convolutional neural network (CNN) by minimizing the Euclidean distance between the generated images and real ones will lead to blurry results. Compared with these, GAN can produce more realistic images. This is because the discriminator is equivalent to a learnable loss function, and through its confrontation with generator, the differences between generated images and real ones can be gradually narrowed.
Previous research [11] has shown that combining the cGAN loss and a reconstruction loss can enhance the results in image translation tasks. The reconstruction loss, typically measured using L1 loss, acts as a regression function that facilitates the faster convergence of the network. However, using L1 loss directly on a pixel-wise basis can lead to a loss of fine details and structural features. To enhance the quality of generated images, researchers [34,43] have proposed the use of multi-scale discriminators. Zhang et al. [20] used VGG perceptual loss to improve the similarity between generated images and real optical images. Li et al. [44] added SSIM [45] loss to help improve the structural information of generated images, although SSIM loss may introduce artifacts. At present, the utilization of multi-scale features in loss function is less considered. Zhao et al. [46] combined multi-scale structural similarity (MS-SSIM) [47] with L1 loss as a novel loss function in image restoration tasks yielding superior results compared to individual L1, SSIM, or MS-SSIM losses. By incorporating a multi-scale SSIM loss, MS-SSIM better preserves high-frequency information, although it may introduce changes in brightness and color deviation. In contrast, L1 loss better maintains luminance and color consistency. Combining MS-SSIM and L1 loss functions proves to be more effective than either loss alone in preserving image quality.
The proposed adjacent dual-decoder UNet (ADD-UNet) network is an extension of the UNet generator, which adds an adjacent scale decoder to the outer decoder for feature fusion. By aggregating multi-scale semantic features, ADD-UNet can improve structural features, details, and edge sharpness of the generated images with fewer parameters compared to UNet++. The new loss function proposed in this paper combines cGAN loss, MS-SSIM loss [47], and L1 loss, which significantly improves the detail feature and structural similarities between the generated optical and real optical images. The experiments conducted in this paper demonstrate the generalization performance of ADD-UNet on two different datasets, where the method achieves outstanding results. The proposed method has the potential to advance the state-of-the-art in SAR-to-optical image translation tasks.

2. Materials and Methods

This paper presents a novel approach for SAR-to-optical translation, introducing several key contributions. Firstly, we introduce an innovative adjacent dual-decoder UNet network architecture for the generator. This architecture significantly enhances the structural features, details, and edge sharpness of the generated images, while requiring fewer parameters compared to UNet++. Secondly, we propose a hybrid loss function that combines the benefits of MS-SSIM loss, L1 loss, and cGAN loss. This combination serves to improve the detailed features and structural similarities between the generated images and real optical images. By integrating these components, our method aims to achieve superior results in SAR-to-optical translation tasks.

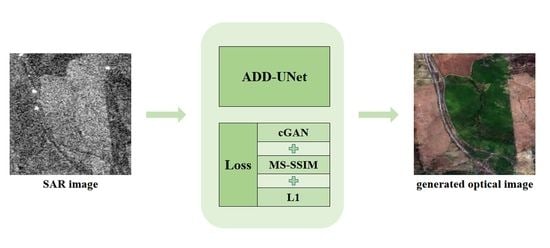
2.1. Adjacent Dual-Decoder UNet

Our initial concept involves the development of a dual-decoder network by incorporating an additional decoder into the UNet architecture. This approach enables the fusion of feature information from both shallow and deep decoders, allowing the outer decoder to access multi-scale semantic features. Figure 1 illustrates our preliminary ideas, showcasing different depths of the UNet architecture with an added decoder. In our experiments outlined in Section 3.1, we discovered that the structure depicted in Figure 1f yields the best performance, leading us to select it as our final architecture. This final structure, referred to as the adjacent dual-decoder UNet (ADD-UNet), consists of two adjacent decoder depths. The inner shallow decoder is positioned next to the outer deeper decoder. Additionally, on each symmetrical layer, the feature maps from the encoder are skip-connected to both decoders. At the same resolution, the feature maps from the shallow decoder are also skip-connected to the deeper decoder. The fusion of these feature maps can be calculated as follows:
d 7 , j = H e 6 , D C e 7 j = 1 H e m , D C d 7 , j 1 2 j < 8 i H e m , d i , j , D C d 7 , j 1 8 i j 6
where e m denotes the feature map of m t h encoder layer and m indexes the feature map of encoder layer from top to bottom. d 7 , j denotes the feature map of j - t h layer of the outer decoder, where j indexes decoder layers from bottom to top and 7 denotes the depth of the outer decoders. Similarly, d i , j denotes the feature map of j - t h decoder layer of the shallow decoder, where i denotes the depth of the shallow decoder. As depicted in Figure 1, in Equation (1), m = 7 j . [ ] denotes a concatenation layer. D C represents a deconvolution layer that up-samples the input. H denotes a convolution operation with an activation function, and the number of its filters is the same as e j . If j < 8 i , d 7 , j receive 2 inputs, of which one input is from the symmetry encoder layer and the other is the deconvolution output of its former layer (skip connections in this case are similar to UNet). Additionally, if 8 i j 6 , d 7 , j receives 3 inputs, of which 2 inputs are feature maps of the same resolution from the shallow decoder and the encoder, and the 3rd input is from the deconvolution output of the ( j 1 ) - t h layer of the deeper decoder.
The encoder component of our network comprises seven convolutional layers responsible for down-sampling. Each convolutional layer is followed by batch normalization (BN) and LeakyReLU (LR) activation. The convolutional kernel size is set to 4 × 4, and the stride is set to 2, enabling efficient down-sampling. The decoders, on the other hand, perform up-sampling using deconvolution layers. The deconvolution layers utilize a 4 × 4 convolutional kernel with a stride of 2. At the same resolution, the feature maps of the encoder are connected to both decoders through skip connections. Furthermore, the feature maps of the shallow decoder are skip-connected to their corresponding counterparts in the deep decoder. When fusing the feature maps in the decoder layers, the number of channels increases. To address this, a convolutional layer is employed to restore the number of channels in the current decoder layer to match that of the symmetrical encoder layer. The generator takes SAR images as conditional input and generates optical-like images. To obtain an optical-like image, the output feature map from the deep decoder is up-sampled to restore its size to 256 × 256. Subsequently, a convolutional kernel with three channels and a stride of 1 is applied to convert the feature map to the RGB color space.
In this paper, the discriminator employed is based on a 5-layer convolutional neural network (CNN) structure, as depicted in Figure 2. The architecture follows the PatchGAN design, which focuses on analyzing local image patches rather than the entire image. This approach allows for a more fine-grained evaluation of the generated images, enabling the discriminator to provide detailed feedback and guidance to the generator network. The optical image and the conditional SAR image are input together into the network through channel concatenation. The output of the discriminator is a 16 × 16 matrix. Each pixel in the matrix represents the probability that its corresponding patch in the input optical image comes from a real optical image rather than a generated one. The pixel value is in the range of [0, 1]. “1” means that the patch is from a real optical image, and “0” means that the patch is from the generated optical image.

2.2. Improved Loss Function

In this paper, the loss function employed is a combination of three components: cGAN loss, MS-SSIM loss, and L1 loss. The cGAN loss is responsible for ensuring that the generated images resemble real optical images. The MS-SSIM loss is utilized to enhance the structural features and detail refinement of the generated images. Lastly, the L1 loss contributes to preserving the luminance and colors of the images, promoting more accurate color reproduction. By combining these three loss components, the overall loss function guides the training process to optimize both structural features and color fidelity in the generated optical images.
MS-SSIM method: The generated optical image G x and its corresponding real optical image y are, respectively, taken as two inputs. Then, a pyramid of M levels is computed by applying low-pass filter and 1/2 down-sampling iteratively. The original image is at scale 1 and the highest scale is at scale M . The image of highest scale is obtained through ( M 1 ) iterations. For the j t h scale, contrast comparison c j G x , y and structural similarity comparison s j G x , y are calculated. The luminance similarity L G x , y is only calculated at scale M . Down-sampling by 1/2 is performed using average pooling with stride 2. Low-pass filter is performed with a Gaussian filter. The final MS-SSIM is the weighted multiplication of the indexes of each scale:
MS - SSIM G x , y = [ l M ( G ( x ) , y ) ] α M j = 1 M c j ( G ( x ) , y ) β j s j ( G ( x ) , y ) γ j
where l M denotes the luminance at scale M , c j represents the contrast at scale j , and s j denotes the structural similarity. The value range of MS-SSIM is [0, 1]. The higher the value is, the more similar the two images are. In this paper, M = 5 . α , β , γ are used to adjust the weight of each component. Additionally, we used the empirical weight value in [47].
α j = β j = c j α 1 = 0.0448 , α 2 = 0.2856 , α 3 = 0.3001 , α 4 = 0.2363 , α 5 = 0.1333
For a specific scale,
l ( G ( x ) , y ) = 2 u G ( x ) u y + c 1 u G ( x ) 2 + u y 2 + c 1 c ( G ( x ) , y ) = 2 σ G ( x ) σ y + c 2 σ G ( x ) 2 + σ y 2 + c 2 s ( G ( x ) , y ) = σ G ( x ) y + c 3 σ G ( x ) σ y + c 3
where u G x is the mean of image G ( x ) and u y is the mean of image y . σ G x and σ y are, respectively, the standard deviations of image G ( x ) and image y . σ G x y is the covariance of G ( x ) and y . C 1 and C 2 are constants to prevent the denominator from being 0.
The MS-SSIM loss function is defined as:
L MS - SSIM = 1 - MS - SSIM ( G ( x ) , y )
In summary, the combined loss function of our method is defined as:
L = L cGAN ( G , D ) + λ 2 L MS - SSIM + λ 3 L L 1
where λ 2 and λ 3 denote the weight of L MS - SSIM and L L 1 , respectively.

2.3. Datasets

In this study, the SEN1-2 dataset, established by Schmitt et al. [48], was utilized for the SAR-to-optical translation experiments. The SEN1-2 dataset comprises paired Sentinel-1 (SEN-1) SAR images and Sentinel-2 (SEN-2) optical images. The optical images in the dataset are created by combining bands 4, 3, and 2 to form RGB images. The dataset covers various random regions globally across four different seasons. Two independent subsets were selected from the SEN1-2 dataset for the experiments. The first subset, referred to as the Test1 dataset, consists of 4080 pairs of SAR-optical images representing four typical scenes: forest, urban areas, farmland, and mountain. The second subset, called the Test2 dataset, includes 1140 pairs of SAR-optical images and represents complex situations in urban areas and farmland. To partition the datasets for training and testing purposes, each dataset was split into 80% training data and 20% test data. This division ensures that the models are trained on a majority of the data while still reserving a portion for evaluating their performance.

2.4. Evaluation Metrics

In this study, two commonly used image quality evaluation metrics, peak signal-to-noise ratio (PSNR) and structural similarity index measure (SSIM) [45], were employed for the quantitative assessment of the proposed method in the image translation task.
PSNR measures the ratio between the maximum possible power of a signal and the power of the noise corrupting that signal. It is often used to evaluate the fidelity or similarity between two images. A higher PSNR value indicates a better quality of the generated image compared to the reference image.
SSIM, on the other hand, assesses the structural similarity between two images by measuring the similarity of patterns, structures, and textures. It takes into account luminance, contrast, and structural information to determine the similarity between the images. The SSIM value ranges from 0 to 1, with 1 indicating a perfect match between the two images.
By utilizing both the PSNR and SSIM metrics, the proposed method can be quantitatively evaluated in terms of image quality, with higher PSNR values and higher SSIM scores indicating better performance and similarity between the generated images and the target images.

2.5. Implementation Details

We apply pix2pix as our baseline and make all improvements on it. At our baseline, we use a 7-layer UNet for generator, since it is commonly used in SAR-to-optical translation tasks [20,22]. In Equation (3), λ [11] is the weight of L1 loss relative to cGAN loss. Increasing the proportion of L1 loss will result in fuzzier images while increasing the proportion of cGAN loss will lead to sharper results. If the value of λ is too large, the generated images will be blurry. To obtain sharper translation results, we set λ = 10 instead of 100. For the same reason, we set the weight λ 2 = 10 , λ 3 = 10 in Equation (9). All experiments were performed using a NVIDIA RTX 2080 Ti GPU with 11 G memory on PyTorch framework. The input to was single-channel SAR images of 256 × 256 in size. The output from generator was generated optical images of 256 × 256 × 3 in size. The Adam optimizer was chosen to optimize the network with a learning rate set to 2 × 10⁻⁴. A least-square loss [49] was utilized to replace the negative loglikelihood objective in LSGAN in Equation (1), as it was more stable and was able to produce results of higher quality. Specifically, D minimizes E [ D ( x , y ) 1 2 ] + E [ D ( x , G ( x ) ) 2 ] and G minimizes E [ D ( x , G ( x ) ) 1 2 ] .
To verify the performance of our method, several state-of-the-art methods were employed, including CycleGAN [12] and U-GAT-IT [13]. These methods were implemented using official codes.

3. Results

3.1. Selection of the Additional Decoder Branch

Our initial idea was to build a dual-decoder network by adding an additional decoder to UNet. We carried out experiments on the optimal depth of the additional decoder branch and found that the additional decoder was the most effective when it was the adjacent depth to the outer decoder. The baseline was set as pix2pix without an additional decoder branch (UNet7 in our case). As illustrated in Figure 1b–f, the additional decoder branch with depth from 2 to 6, respectively, were added to UNet7, and then the network architectures of UNet27, UNet37, UNet47, UNet57, and UNet67 are constructed, respectively. The loss function of all these networks is consistent with our baseline, and it is combined of GAN loss and L1 loss.
Table 1 lists the performance of dual-decoder UNet with additional decoder branches of different depths. Of the SSIM and PSNR metrics on the two datasets, UNet67 performed best. On the Test1 dataset, the SSIM value of UNet67 exceeds UNet by 25.6% and its PSNR value surpasses UNet by 6.3%. On the Test2 dataset, the SSIM value of UNet67 exceeds UNet by 19.8% and its PSNR value surpasses UNet by 9.0%. This suggests that images generated by UNet67 are not only closest to real optical images but also of the best quality. On the larger dataset Test1, the deeper the additional coder, the higher the SSIM accuracy. Nevertheless, on the smaller dataset Test2, the SSIM value of UNet57 is lower than Unet37. This shows that the size of the dataset has an impact on the performance of the network structure. However, UNet67 has good performance on both datasets, reflecting its generalization.
Figure 3 visualizes the feature maps of the last layer at the shallow and deep decoder of UNet with additional decoder of varying depths. The feature map for a layer is obtained by averaging all its feature maps and displayed in the form of its heatmap. The real optical image (ground truth) presents the mountain landform with a ridge line. As shown in Figure 3c, in feature maps at shallow decoder of UNet27 and UNet37, the contour of the ridge line is indistinguishable from its left surroundings. For UNet57, the ridge line is intermittent. UNet67 is the only method that restored the continuous ridge line and a small line structure next to it. From Figure 3d, only the ridge line at deep decoder of UNet67 is continuous. In conclusion, the capability of structure representation of UNet67 is the best, and thus UNet67 is used as the generator structure in this paper. UNet67 is termed as an adjacent dual-decoder UNet for its additional decoder is adjacent to the outer decoder.

3.2. Comparison of Different Generators

To assess the effectiveness of our proposed generator, ADD-UNet, we conducted the comparison experiments of different generators and compared the performance of ADD-UNet with Johnson’s [31], UNet++ [35] and UNet (UNet7). The UNet7 method is the realized pix2pix as our baseline. To compare different generators, we keep other settings of these methods the same as the baseline, including loss functions. Johnson’s network has achieved impressive results on image style transfer and is widely used as a generator in image-to-image tasks. For fairness, we constructed a network with four convolutional layers, nine residual blocks intermediate, and four deconvolutional layers according to Johnson’s method, and the specific settings of each layer are consistent with UNet at baseline. In our experiment, UNet++ is conducted by filling up the inside of UNet7 with decoders of all depths following the connectivity scheme of UNet++.
Table 2 lists the performance comparison of different generators in terms of SSIM and PSNR results. Table 3 lists the number of parameters and inference time of different generators. In terms of SSIM value, ADD-UNet outperforms the other methods on both datasets. This suggests that images generated by ADD-UNet are closest to real optical images. Compared with UNet++, the SSIM accuracy of our method is 3.9% higher on the Test1 dataset and 7.2% higher on the Test2 dataset, and the number of parameters is reduced by 27.6%. A smaller number of parameters makes our networks portable for mobile devices and avoids expensive computing or high memory requirements. The results demonstrate that the proposed ADD-UNet achieves a significant reduction in inference time, approximately halving the time required compared to UNet++. Both our method and UNet++ provides a higher PSNR compared with other generators. On the Test1 dataset, the PSNR accuracy of ADD-UNet is only reduced by 0.3% compared with UNet++. On the Test2 dataset, the PSNR accuracy of ADD-UNet is 3.0% higher than UNet++.
Figure 4 presents translation results by the proposed ADD-UNet and other advanced networks on the Test1 dataset. The examples generated by ADD-UNet and UNet++ have better structures and details than those by UNet and Johnson’s. As marked with red boxes in the first row of Figure 4, a border line is across the middle of the forest in the original optical image. The border line is almost missing from the results of UNet and Johnson’s. However, most of the border line is restored in generated images by both UNet++ and ADD-UNet. In the second row of Figure 4, the generated images by ADD-UNet and UNet++ are sharper than other methods and both of the methods can restore the long line along the building block within the red box. From red boxes of the third row in Figure 4, both ADD-UNet and UNet++ recovered the U-shaped crack structure feature while other methods did not. In summary, both UNet++ and ADD-UNet perform better in keeping structural features, detail fineness, and outline sharpness than UNet. Furthermore, the parameter quantity of ADD-UNet is much lower (27.6%) than that of UNet++, and this is the advantage of ADD-UNet.
Figure 5 displays the translation results of different generators on the Test2 dataset. From the red boxes of the first and second row, only ADD-UNet restored the structure and texture of buildings while other methods cannot. In the third row, only ADD-UNet restored the three blocks within the red box, among which the small block in the middle is surrounded by white edge. Additionally, in the green box of the third row, the structure of the small block generated by ADD-UNet is closest to ground truth.

3.3. Comparison of Different Loss Functions

To verify the effectiveness of the proposed loss function, we carried out the comparison experiments on two loss functions, including our loss function (cGAN + MS-SSIM + L1) and pix2pix’s loss function (cGAN + L1). All models are trained with ADD-UNet. As listed in Table 4, compared with (cGAN + L1), both the SSIM and PSNR values are higher with (cGAN + MS-SSIM + L1). The SSIM value of our results has improved by 10.7% on the Test1 dataset and 7.9% on the Test2 dataset, compared with (cGAN + L1) loss. This means that the generated images from our loss function are more similar to the ground truth than those with only the (cGAN + L1) loss applied.
Figure 6 presents the translation results of the proposed loss function and (cGAN + L1) on the Test1 dataset. In the first row, with the proposed loss (cGAN + MS-SSIM+ L1), the border line in the forest within the marked red boxes is restored longer than that with the loss (cGAN + L1). In the original optical of the second row, a small white path is within the red box. The generated image of our proposed loss restores the path better than that of (cGAN + L1). Then, the generated samples with the proposed loss have the advantage of preserving more realistic structural features and details than that with (cGAN + L1). As highlighted with red boxes of the third row, our loss function can generate clearer contour of the U-shaped detail. Overall, our proposed loss function (cGAN + MS-SSIM+ L1) performs better than the loss function of (cGAN + MS-SSIM + L1), and it has a better ability to keep structure features and detail fineness.
Figure 7 presents the translation results of the proposed loss function and (cGAN + L1) on the Test2 dataset. From the red boxes on the first row, in the generated image by (cGAN + L1), an elliptical structure of farmland is incorrect. Our method correctly restored the linear contour of the farmland. In the second row, the separate structure feature of the two blocks within the red box is recovered by our method. However, in the generated image of (cGAN + L1), the two blocks are connected incorrectly. From the red box of the third row, our method restored more details than (cGAN + L1).

3.4. Comparison with the State of the Art

We compare our method with several state-of-the-art methods. As listed in Table 5, on the Test1 dataset, the SSIM index of our method is 0.529, 32.6% higher than pix2pix. On the Test2 dataset, the SSIM index of our method is 0.724, 35.6% higher than pix2pix. The SSIM of our method also far exceeds the other two unsupervised methods (CycleGAN and U-GAT-IT). This indicates that the images generated by our methods are closer to the real optical images in terms of structure features, contrast, and luminance. On the Test1 dataset, the PSNR value of our method reaches up to 20.763, which is 7.9% higher than pix2pix. On the Test2 dataset, the PSNR value of our method reaches is up to 23.395, which is 10.1% higher than pix2pix. The PSNR of our method surpasses other methods, and the possible reason is that our generated images contain less noise.
Figure 8 shows the results of different methods of SAR-to-optical translation on the Test1 dataset. Compared with other methods, images generated by our method have more realistic details. The first row presents a ridge line. From the SAR image, both the ridge line and the rock to the left of it are dark, appearing to be a “wider gap”. In the generated images by CycleGAN and U-GAT-IT, the colors are incorrect, and the ridge line and the rock to its left have been incorrectly restored to the same category of landform that looks different from the background. In the generated image by pix2pix, although the rock on the left can be distinguished from the ridge line, the texture and structural features of the rock are not accurate. Our method is the only method of recovering both the ridge line and the texture characteristics of its left rock surface. As marked with red boxes of the second row, the optical image of SEN-2 exhibits a rectangular-like bright spot on the water surface. Our method clearly restored the structure of the bright spot while other methods failed. From the third to the fourth row, compared with results of other methods, the colors, and texture features of images produced by our method are closest to real optical images. The images generated by CycleGAN and U-GAT-IT contain structures close to the ground truth, but their color information is wrong. For images generated by pix2pix, their colors are closer to the ground truth, but they seem noisy and unclear. In the red boxes of the fifth and sixth row, the farmland structure restored by our method exhibits richer details and shaper outline than other methods.
Figure 9 shows the results of different methods on the Test2 dataset. In the first row, only our method restored the structure of the long road within the red box. In the second row, our method recovered the line structure in the farmland, and is shaper than pix2pix. From row 3 (a), the SEN-2 optical image presents a curved black structure within the red box and the magnified view of the structure is shown on row 3 (b). Our method accurately restored this structure while other methods failed. From the images of the fourth to sixth row, the structural details and texture restored by our method are closest to ground truth.
In all, compared with other methods, the images generated by our method are closer to real optical images. The generated optical images of our method provide finer details, sharper outline, and better structure information.

4. Discussion and Conclusions

In this paper, the proposed ADD-UNet model demonstrates its effectiveness in SAR-to-optical translation tasks. The key contributions of this research are as follows: Firstly, the adjacent dual-decoder structure of ADD-UNet enables the learning of multi-scale semantic features, which improves the quality of the generated images by capturing both global and local information. Secondly, a hybrid loss function consisting of cGAN loss, MS-SSIM loss, and L1 loss is employed to enhance the structural and textural features of the generated images. This combination of loss functions helps to preserve important details and structures, leading to more visually appealing results.
The experimental results conducted on two different datasets highlight the superior performance of our method compared to advanced techniques, such as pix2pix and UNet++. The proposed ADD-Unet achieves significant improvements in terms of SSIM and PSNR values, demonstrating its effectiveness in enhancing image quality and generalization across diverse datasets. Furthermore, the comparison with other advanced networks reveals that ADD-Unet outperforms Unet++ in terms of SSIM accuracy, while also reducing the number of parameters required.
The comparative experiments with different loss functions emphasize the advantages of our proposed loss function (cGAN + MS-SSIM + L1) over the alternative (cGAN + L1). The proposed loss function successfully preserves structural features and finer details in the generated images.
In conclusion, the proposed ADD-UNet model and the hybrid loss function show promising results in SAR-to-optical translation. Future work will focus on further improving the accuracy and generalization capabilities of the model to enhance its practical applications.

Author Contributions

Conceptualization, Q.L. and H.L.; methodology, H.L.; validation, H.L.; Writing—original draft, H.L.; writing—review and editing, Q.L., H.L. and Z.C.; visualization, H.L.; supervision, Q.L. and J.L. All authors have read and agreed to the published version of the manuscript.

Funding

This research was supported by Key Project of Tianjin Natural Science Foundation under Grant (21JCZDJC00670); National Engineering Laboratory for Digital Construction and Evaluation Technology of Urban Rail Transit under grant (No. 2021ZH04); Tianjin Transportation Science and Technology Development Project under grant (No. 2022-40, 2020-02); and the National Natural Science Foundation of China Grant under grant (No. 41601446).

Data Availability Statement

The SEN1-2 dataset is included in this published article (https://doi.org/10.5194/isprs-annals-IV-1-141-2018 (accessed on 23 April 2023)). The SEN1-2 dataset can be downloaded at a persistent link provided by the library of the Technical University of Munich: https://mediatum.ub.tum.de/1436631 (accessed on 23 April 2023).

Conflicts of Interest

The authors declare no conflict of interest.

References

  1. Singh, P.; Komodakis, N. Cloud-Gan: Cloud Removal for Sentinel-2 Imagery Using a Cyclic Consistent Generative Adversarial Networks. In Proceedings of the IGARSS 2018-2018 IEEE International Geoscience and Remote Sensing Symposium, Valencia, Spain, 22–27 July 2018; pp. 1772–1775. [Google Scholar]
  2. Darbaghshahi, F.N.; Mohammadi, M.R.; Soryani, M. Cloud Removal in Remote Sensing Images Using Generative Adversarial Networks and SAR-to-Optical Image Translation. IEEE Trans. Geosci. Remote Sens. 2021, 60, 1–9. [Google Scholar] [CrossRef]
  3. Nie, H.; Fu, Z.; Tang, B.-H.; Li, Z.; Chen, S.; Wang, L. A Dual-Generator Translation Network Fusing Texture and Structure Features for SAR and Optical Image Matching. Remote Sens. 2022, 14, 2946. [Google Scholar] [CrossRef]
  4. Zhou, X.; Zhang, C.; Li, S. A Perceptive Uniform Pseudo-Color Coding Method of SAR Images. In Proceedings of the 2006 CIE International Conference on Radar, Shanghai, China, 16–19 October 2006; pp. 1–4. [Google Scholar]
  5. Li, Z.; Liu, J.; Huang, J. Dynamic Range Compression and Pseudo-Color Presentation Based on Retinex for SAR Images. In Proceedings of the 2008 International Conference on Computer Science and Software Engineering, Wuhan, China, 12–14 December 2008; Volume 6, pp. 257–260. [Google Scholar]
  6. Deng, Q.; Chen, Y.; Zhang, W.; Yang, J. Colorization for Polarimetric SAR Image Based on Scattering Mechanisms. In Proceedings of the 2008 Congress on Image and Signal Processing, Sanya, China, 27–30 May 2008; pp. 697–701. [Google Scholar]
  7. Wang, P.; Wang, L.; Leung, H.; Zhang, G. Super-Resolution Mapping Based on Spatial–Spectral Correlation for Spectral Imagery. IEEE Trans. Geosci. Remote Sens. 2020, 59, 2256–2268. [Google Scholar] [CrossRef]
  8. Shang, X.; Song, M.; Wang, Y.; Yu, C.; Yu, H.; Li, F.; Chang, C.-I. Target-Constrained Interference-Minimized Band Selection for Hyperspectral Target Detection. IEEE Trans. Geosci. Remote Sens. 2021, 59, 6044–6064. [Google Scholar] [CrossRef]
  9. Cuomo, S.; Di Cola, V.S.; Giampaolo, F.; Rozza, G.; Raissi, M.; Piccialli, F. Scientific Machine Learning Through Physics–Informed Neural Networks: Where We Are and What’s Next. J. Sci. Comput. 2022, 92, 88. [Google Scholar] [CrossRef]
  10. Chen, Z.; Liu, Y.; Sun, H. Physics-Informed Learning of Governing Equations from Scarce Data. Nat. Commun. 2021, 12, 6136. [Google Scholar] [CrossRef]
  11. Goodfellow, I.; Pouget-Abadie, J.; Mirza, M.; Xu, B.; Warde-Farley, D.; Ozair, S.; Courville, A.; Bengio, Y. Generative Adversarial Networks. Commun. ACM 2020, 63, 139–144. [Google Scholar] [CrossRef]
  12. Mirza, M.; Osindero, S. Conditional Generative Adversarial Nets 2014. arXiv 2014, arXiv:1411.1784. [Google Scholar]
  13. Isola, P.; Zhu, J.-Y.; Zhou, T.; Efros, A.A. Image-to-Image Translation with Conditional Adversarial Networks. In Proceedings of the 2017 IEEE Conference on Computer Vision and Pattern Recognition (CVPR), Honolulu, HI, USA, 21–26 July 2017; pp. 5967–5976. [Google Scholar]
  14. Zhu, J.-Y.; Park, T.; Isola, P.; Efros, A.A. Unpaired Image-To-Image Translation Using Cycle-Consistent Adversarial Networks. In Proceedings of the IEEE International Conference on Computer Vision, Venice, Italy, 22–29 October 2017; pp. 2223–2232. [Google Scholar]
  15. Kim, J.; Kim, M.; Kang, H.; Lee, K.H. U-GAT-IT: Unsupervised Generative Attentional Networks with Adaptive Layer-Instance Normalization for Image-to-Image Translation. In Proceedings of the International Conference on Learning Representations, Addis Ababa, Ethiopia, 26–30April 2020. [Google Scholar]
  16. Niu, X.; Yang, D.; Yang, K.; Pan, H.; Dou, Y. Image Translation Between High-Resolution Remote Sensing Optical and SAR Data Using Conditional GAN. In Proceedings of the Advances in Multimedia Information Processing—PCM 2018: 19th Pacific-Rim Conference on Multimedia, Hefei, China, 21–22 September 2018; Springer: Berlin/Heidelberg, Germany; pp. 245–255. [Google Scholar]
  17. Merkle, N.; Auer, S.; Muller, R.; Reinartz, P. Exploring the Potential of Conditional Adversarial Networks for Optical and SAR Image Matching. IEEE J. Sel. Top. Appl. Earth Obs. Remote Sens. 2018, 11, 1811–1820. [Google Scholar] [CrossRef]
  18. Fu, S.; Xu, F.; Jin, Y.-Q. Translating SAR to Optical Images for Assisted Interpretation 2019. arXiv 2019, arXiv:1901.03749. [Google Scholar]
  19. Fuentes Reyes, M.; Auer, S.; Merkle, N.; Henry, C.; Schmitt, M. SAR-to-Optical Image Translation Based on Conditional Generative Adversarial Networks—Optimization, Opportunities and Limits. Remote Sens. 2019, 11, 2067. [Google Scholar] [CrossRef] [Green Version]
  20. Wang, L.; Xu, X.; Yu, Y.; Yang, R.; Gui, R.; Xu, Z.; Pu, F. SAR-to-Optical Image Translation Using Supervised Cycle-Consistent Adversarial Networks. IEEE Access 2019, 7, 129136–129149. [Google Scholar] [CrossRef]
  21. Zhang, J.; Zhou, J.; Lu, X. Feature-Guided SAR-to-Optical Image Translation. IEEE Access 2020, 8, 70925–70937. [Google Scholar] [CrossRef]
  22. Zhang, Q.; Liu, X.; Liu, M.; Zou, X.; Zhu, L.; Ruan, X. Comparative Analysis of Edge Information and Polarization on SAR-to-Optical Translation Based on Conditional Generative Adversarial Networks. Remote Sens. 2021, 13, 128. [Google Scholar] [CrossRef]
  23. Li, H.; Gu, C.; Wu, D.; Cheng, G.; Guo, L.; Liu, H. Multiscale Generative Adversarial Network Based on Wavelet Feature Learning for SAR-to-Optical Image Translation. IEEE Trans. Geosci. Remote Sens. 2022, 60, 1–15. [Google Scholar] [CrossRef]
  24. Wang, Z.; Ma, Y.; Zhang, Y. Hybrid CGAN: Coupling Global and Local Features for SAR-to-Optical Image Translation. IEEE Trans. Geosci. Remote Sens. 2022, 60, 1–16. [Google Scholar] [CrossRef]
  25. Guo, J.; He, C.; Zhang, M.; Li, Y.; Gao, X.; Song, B. Edge-Preserving Convolutional Generative Adversarial Networks for SAR-to-Optical Image Translation. Remote Sens. 2021, 13, 3575. [Google Scholar] [CrossRef]
  26. Pathak, D.; Krahenbuhl, P.; Donahue, J.; Darrell, T.; Efros, A.A. Context Encoders: Feature Learning by Inpainting. In Proceedings of the 2016 IEEE Conference on Computer Vision and Pattern Recognition (CVPR), Las Vegas, NV, USA, 27–30 June 2016; pp. 2536–2544. [Google Scholar]
  27. Wang, X.; Gupta, A. Generative Image Modeling Using Style and Structure Adversarial Networks. In Proceedings of the Computer Vision—ECCV 2016, Amsterdam, The Netherlands, 11–14 October 2016; Leibe, B., Matas, J., Sebe, N., Welling, M., Eds.; Springer: Cham, Switzerland, 2016; pp. 318–335. [Google Scholar]
  28. Zhou, Y.; Berg, T.L. Learning Temporal Transformations from Time-Lapse Videos. In Proceedings of the Computer Vision—ECCV 2016, Amsterdam, The Netherlands, 11–14 October 2016; Leibe, B., Matas, J., Sebe, N., Welling, M., Eds.; Springer: Amsterdam, The Netherlands, 2017; pp. 262–277. [Google Scholar]
  29. Yoo, D.; Kim, N.; Park, S.; Paek, A.S.; Kweon, I.S. Pixel-Level Domain Transfer. In Proceedings of the Computer Vision—ECCV 2016, Amsterdam, The Netherlands, 11–14 October 2016; pp. 517–532. [Google Scholar]
  30. Hinton, G.E.; Salakhutdinov, R.R. Reducing the Dimensionality of Data with Neural Networks. Science 2006, 313, 504–507. [Google Scholar] [CrossRef] [Green Version]
  31. Johnson, J.; Alahi, A.; Fei-Fei, L. Perceptual Losses for Real-Time Style Transfer and Super-Resolution. In Proceedings of the Computer Vision—ECCV 2016, Amsterdam, The Netherlands, 11–14 October 2016; Springer: Cham, Switzerland, 2016; pp. 694–711. [Google Scholar]
  32. Ronneberger, O.; Fischer, P.; Brox, T. U-Net: Convolutional Networks for Biomedical Image Segmentation. In Proceedings of the Medical Image Computing and Computer-Assisted Intervention—MICCAI 2015, Munich, Germany, 5–9 October 2015; Springer: Cham, Switzerland, 2015; pp. 234–241. [Google Scholar]
  33. Gatys, L.A.; Ecker, A.S.; Bethge, M. A Neural Algorithm of Artistic Style 2015. arXiv 2015, arXiv:1508.06576. [Google Scholar]
  34. Wang, T.-C.; Liu, M.-Y.; Zhu, J.-Y.; Tao, A.; Kautz, J.; Catanzaro, B. High-Resolution Image Synthesis and Semantic Manipulation With Conditional GANs. In Proceedings of the IEEE Conference on Computer Vision and Pattern Recognition, Salt Lake City, UT, USA, 18–22 June 2018; pp. 8798–8807. [Google Scholar]
  35. Zhou, Z.; Siddiquee, M.M.R.; Tajbakhsh, N.; Liang, J. UNet++: Redesigning Skip Connections to Exploit Multiscale Features in Image Segmentation. IEEE Trans. Med. Imaging 2020, 39, 1856–1867. [Google Scholar] [CrossRef] [Green Version]
  36. Qian, Z.; Huang, K.; Wang, Q.-F.; Xiao, J.; Zhang, R. Generative Adversarial Classifier for Handwriting Characters Super-Resolution. Pattern Recognit. 2020, 107, 107453. [Google Scholar] [CrossRef]
  37. Fang, Y.; Deng, W.; Du, J.; Hu, J. Identity-Aware CycleGAN for Face Photo-Sketch Synthesis and Recognition. Pattern Recognit. 2020, 102, 107249. [Google Scholar] [CrossRef]
  38. Li, D.; Du, C.; He, H. Semi-Supervised Cross-Modal Image Generation with Generative Adversarial Networks. Pattern Recognit. 2020, 100, 107085. [Google Scholar] [CrossRef]
  39. Xu, W.; Shawn, K.; Wang, G. Toward Learning a Unified Many-to-Many Mapping for Diverse Image Translation. Pattern Recognit. 2019, 93, 570–580. [Google Scholar] [CrossRef] [Green Version]
  40. Zhao, S.; Li, J.; Wang, J. Disentangled Representation Learning and Residual GAN for Age-Invariant Face Verification. Pattern Recognit. 2020, 100, 107097. [Google Scholar] [CrossRef]
  41. Yao, R.; Gao, C.; Xia, S.; Zhao, J.; Zhou, Y.; Hu, F. GAN-Based Person Search via Deep Complementary Classifier with Center-Constrained Triplet Loss. Pattern Recognit. 2020, 104, 107350. [Google Scholar] [CrossRef]
  42. Zhang, R.; Isola, P.; Efros, A.A. Colorful Image Colorization. In Proceedings of the Computer Vision—ECCV 2016, Amsterdam, The Netherlands, 11–14 October 2016; Springer: Cham, Switzerland, 2016; pp. 649–666. [Google Scholar]
  43. Yang, X.; Zhao, J.; Wei, Z.; Wang, N.; Gao, X. SAR-to-Optical Image Translation Based on Improved CGAN. Pattern Recognit. 2022, 121, 108208. [Google Scholar] [CrossRef]
  44. Li, Y.; Fu, R.; Meng, X.; Jin, W.; Shao, F. A SAR-to-Optical Image Translation Method Based on Conditional Generation Adversarial Network (CGAN). IEEE Access 2020, 8, 60338–60343. [Google Scholar] [CrossRef]
  45. Wang, Z.; Bovik, A.C.; Sheikh, H.R.; Simoncelli, E.P. Image Quality Assessment: From Error Visibility to Structural Similarity. IEEE Trans. Image Process. 2004, 13, 600–612. [Google Scholar] [CrossRef] [Green Version]
  46. Zhao, H.; Gallo, O.; Frosio, I.; Kautz, J. Loss Functions for Image Restoration With Neural Networks. IEEE Trans. Comput. Imaging 2017, 3, 47–57. [Google Scholar] [CrossRef]
  47. Wang, Z.; Simoncelli, E.P.; Bovik, A.C. Multiscale Structural Similarity for Image Quality Assessment. In Proceedings of the Thrity-Seventh Asilomar Conference on Signals, Systems & Computers, Pacific Grove, CA, USA, 9–12 November 2003; pp. 1398–1402. [Google Scholar]
  48. Schmitt, M.; Hughes, L.H.; Zhu, X.X. The SEN1-2 Dataset for Deep Learning in SAR-Optical Data Fusion 2018. arXiv 2018, arXiv:1807.01569. [Google Scholar]
  49. Mao, X.; Li, Q.; Xie, H.; Lau, R.Y.K.; Wang, Z.; Paul Smolley, S. Least Squares Generative Adversarial Networks. In Proceedings of the IEEE International Conference on Computer Vision, Venice, Italy, 22–29 October 2017; pp. 2794–2802. [Google Scholar]
Figure 1. UNet with additional decoder branch of varying depths. (a) UNet7. (b) UNet27. (c) UNet37. (d) UNet47. (e) UNet57. (f) UNet67 (ADD-UNet). The blue and yellow boxes correspond to multi-channel feature maps. The blue downward arrows indicate convolutional layers, the blue upward arrows indicate deconvolutional layers. The gray arrows indicate skip connections.
Remotesensing 15 03125 g001
Figure 2. Discriminator architecture. Each group of numbers denote the size of feature maps.
Remotesensing 15 03125 g002
Figure 3. Feature visualization of UNet with an additional decoder of varying depths. The image from the first line to the sixth line are feature maps of UNet7 to UNet67. From left to right are: (a) single-channel SAR image input; (b) heatmap of the last layer at shallow decoder; (c) heatmap of the last layer at deeper decoder; (d) output generated image; and (e) ground truth (SEN-2 optical image).
Remotesensing 15 03125 g003
Figure 4. Examples of translation results of different generators on the Test1 dataset. Column 1 comprises input SAR images, column 2 is ground truth for generated optical images.
Remotesensing 15 03125 g004
Figure 5. Examples of translation results of different generators on the Test2 dataset. Column 1 comprises input SAR images, column 2 is ground truth for generated optical images.
Remotesensing 15 03125 g005
Figure 6. Examples of translation results of different loss functions on the Test1 dataset. Column 1 comprises input SAR images, column 2 is the ground truth for generated optical images.
Remotesensing 15 03125 g006
Figure 7. Examples of translation results of different loss functions on the Test2 dataset. Column 1 comprises input SAR images, column 2 is ground truth for generated optical images.
Remotesensing 15 03125 g007
Figure 8. Examples of different methods for SAR-to-optical translation in the Test1 dataset. Column 1 comprises input SAR images, column 2 is ground truth for generated optical images.
Remotesensing 15 03125 g008
Figure 9. Examples of different methods for SAR-to-optical translation on the Test2 dataset. Column 1 comprises input SAR images, column 2 is ground truth for generated optical images. The images in row 3 (b) are the magnified view of the scene in the red boxes in row 3 (a).
Remotesensing 15 03125 g009
Table 1. Comparison of additional decoder branch with different depths. The best values for each quality index are shown in bold.
IQADatasetUNet7UNet27UNet37UNet47UNet57UNet67
SSIMTest10.3990.3500.3920.4120.4260.478
Test20.5340.5980.5990.5720.5500.671
PSNRTest119.24918.98319.58619.75119.69020.462
Test221.24222.12722.13321.82321.27323.146
Table 2. Comparison of different generators. The best values for each quality index are shown in bold.
IQADatasetUNetJohnson’sUNet++ADD-UNet
SSIMTest10.3990.3090.4600.478
Test20.5340.6190.6260.671
PSNRTest119.24918.14920.53120.462
Test221.24222.15522.48123.146
Table 3. Parameters and inference time of different generators. The best values for each quality index are shown in bold.
GeneratorParams.Inference Time (s)
UNet41.83 M0.016
Johnson’s48.01 M0.022
UNet++102.29 M0.071
ADD-UNet74.03 M0.031
Table 4. Comparison of loss functions. The best values for each quality index are shown in bold.
IQADatasetcGAN + L1cGAN + MS-SSIM + L1
SSIMTest10.4780.529
Test20.6710.724
PSNRTest120.46220.763
Test223.14623.395
Table 5. Comparison with state-of-the-art methods. The best values for each quality index are shown in bold.
IQADatasetPix2pixCycleGANU-GAT-ITOurs
SSIMTest10.3990.1600.1540.529
Test20.5340.1250.1480.724
PSNRTest119.24913.30112.37120.763
Test221.24212.44612.56023.395
Disclaimer/Publisher’s Note: The statements, opinions and data contained in all publications are solely those of the individual author(s) and contributor(s) and not of MDPI and/or the editor(s). MDPI and/or the editor(s) disclaim responsibility for any injury to people or property resulting from any ideas, methods, instructions or products referred to in the content.

