Article

Urban Flood Dynamic Risk Assessment Based on Typhoon Rainfall Process: A Case Study of Typhoon “Lupit” (2109) in Fuzhou, China

1
Institute of Geography, Fujian Normal University, Fuzhou 350117, China
2
College of Geographical Science, Fujian Normal University, Fuzhou 350117, China
3
School for Environment and Sustainability, University of Michigan, Ann Arbor, MI 48109, USA
4
Fujian Provincial Engineering Research Center for Monitoring and Accessing Terrestrial Disasters, Fujian Normal University, Fuzhou 350117, China
5
Key Laboratory for Humid Subtropical Eco-Geographical Processes of the Ministry of Education, Fujian Normal University, Fuzhou 350117, China
*
Author to whom correspondence should be addressed.
Remote Sens. 2023, 15(12), 3116; https://doi.org/10.3390/rs15123116
Submission received: 22 May 2023 / Revised: 8 June 2023 / Accepted: 12 June 2023 / Published: 14 June 2023

Abstract

:
Flood disasters caused by typhoon rainfall seriously threaten regional social and economic development. Accurately assessing the risk of typhoons and their secondary disasters is a great challenge in disaster prevention and reduction. To address this, the city of Fuzhou, Fujian Province, which was severely affected by Typhoon “Lupit” (2109), was selected as a case study. A typhoon rainfall flood disaster system including four components (the disaster-causing factor, disaster-pregnant environment, disaster-bearing body, and disaster prevention and reduction capacity) was constructed. A typhoon-rainfall process comprehensive intensity index (TPCI) based on different time scales within the typhoon process was developed to accurately evaluate the flood risk. The TPCI represented the disaster-causing factors of rainfall intensity, duration, and concentration features. Geographical similarity and random forest (RF) were applied to screen 23 typical indices for an urban flood disaster risk assessment model. The results indicated that the TPCI based on a 6 h precipitation simulation at a 24 h time scale was highly effective in highlighting the role of short-term precipitation in the typhoon process. A total of 66.5% of the floodplain area had a medium-grade or higher TPCI value, while 32.5% of the area had a low-grade TPCI. Only 1% of the flooded areas were not identified, which indicated that the TPCI could accurately capture the risk of typhoon rainfall. The urban flood disaster risk assessment model comprehensively considered socioeconomic and natural environment conditions. High-risk areas were identified as regions with extreme precipitation and dense populations. The dynamic evaluation results accurately described the spatiotemporal differences in the flood disaster risk. A period of extreme precipitation lagged the landfall time of Typhoon “Lupit”, causing the proportion of areas above the medium–high-risk threshold of flood disasters to rapidly increase from 8.29% before the landfall of the typhoon to 23.57% before its demise. The high-risk areas of flood disasters were mainly distributed in the towns of Shangjie, Nanyu, and Gaishan, which was consistent with the observed disasters. These study findings could contribute to the development of effective measures for disaster prevention and reduction, and improve the resilience of urban areas to typhoon disasters.

Graphical Abstract

1. Introduction

Typhoons are tropical cyclones that form in the Northwest Pacific Ocean and the South China Sea, where sea surface temperatures exceed 26 °C and central wind forces exceed grade 12. The Chinese mainland abuts the Pacific Ocean to the east, with an extensive coastline of over 18,000 km. Typhoon disasters in the southeast coastal areas are particularly severe [1,2]. Heavy rainfall, strong winds, and storm surges induced by typhoons are the main causes of disasters, damaging the regional ecological environment and endangering people’s lives and property. The rainfall from typhoons is often influenced by a combination of subtropical high pressure [3,4], southwest monsoons [5,6,7], and topographic effects [8,9,10], which can easily trigger flash floods, landslides, urban floods, and other disasters in sequence. In recent years, typhoon disasters have caused significant economic losses due to the rapid economic development in the southeast coastal area of China [11]. One of the most prominent examples is Super Typhoon “Likima” (1909), which landed in eastern China, causing 56 fatalities and a direct economic loss of 53.72 billion CNY. Floods occurred in many places, including the historic flood in the Lingjiang River Basin of Zhejiang Province, which led to an accumulation of up to 10 m of water in the city of Linjiang (https://www.ndrcc.org.cn/, accessed on 9 May 2023). Due to the peripheral airflow of the Severe Typhoon “In-Fa” (2106), the city of Zhengzhou in Henan Province experienced unprecedented flooding, resulting in 380 deaths and disappearances [12,13,14]. Humanity needs to learn and adjust flood prevention strategies from such severe flood events, incorporating human behaviour, flood prevention policies, and infrastructure investments into flood risk modelling to advance our understanding of coupled human-water systems and reduce the impact of hydrological disaster risks on society [15,16,17,18]. As a result, it has become critical to scientifically assess the risk of typhoon-induced floods for disaster prevention and mitigation in coastal cities in China.
Heavy rainfall is the primary cause of flood disasters. It is crucial to have a precise understanding of the temporal and spatial characteristics of rainfall and its impact on floods, which is an essential aspect of disaster mechanism research [19]. Various researchers have used rainfall indices, such as process total precipitation [20], daily cumulative precipitation [21,22], and precipitation 1–3 days before a flood [23,24,25], to analyse flood disaster risks. The risk of heavy rainfall is higher during typhoons and the flooding formation time is shorter, resulting in more severe disasters. However, applying the above rainfall indices in analysing urban typhoon-induced floods can be challenging, as these indices may affect the accuracy of the risk distribution. To address this issue, some researchers have analysed hourly precipitation data and discovered that floods are closely linked to the intensity of hourly precipitation [26,27] and cumulative precipitation in 4–6 h [28], indicating that an increase in short-term precipitation will intensify floods. Nevertheless, this relationship is not universal due to differences in regional climatic and hydrological conditions [29,30]. Additionally, the concentration reflecting the changes in precipitation intensity within the rainfall process is also a critical factor influencing the severity of floods [31]. Zhang et al. [32] conducted a study in which they designed various rainfall scenarios to explore the response characteristics of urban waterlogging under different rainfall patterns and concentrations. They found that the higher the concentration of precipitation, the more severe the inundation during the same return period.
The typhoon rainfall process typically exhibits multi-peak shapes with intermittent periods of precipitation (i.e., large amounts of zero rainfall values) and a high degree of concentration [33,34,35]. At the same time, urban flood disasters are characterized by shorter durations and higher spatial dispersion compared with basin floods [36]. In the case of fast-moving typhoons, it is necessary to consider the distribution of precipitation intervals during the typhoon process and analyse the impact of the dynamic characteristics at different time scales on the risk of urban flood disasters. Therefore, dynamic assessment is key to accurately identifying the risk of typhoon-induced flood disasters.
Urban flood risk is influenced by a range of factors beyond rainfall, including surface conditions, asset exposure, and disaster prevention and reduction capacity [37,38,39,40]. Flood risk assessment is a complex process that requires the consideration of multiple factors to determine the probability of risk. The index system method is a useful tool for assessing flood risk, with some researchers proposing indices such as disaster-causing factors, disaster-pregnant environments, disaster-bearing bodies, and disaster prevention and reduction capacity. By calculating the weight of each index, it is possible to obtain a quantitative expression of flood disaster risk [41,42]. However, the selection and weighting of indices are crucial for ensuring the validity of the assessment process. Various methods, such as information gain [43,44], frequency ratio, random forest (RF) [45,46], and the analytic hierarchy process (AHP) [47,48], can be used to analyse the importance of risk indices. For example, Fang et al. [46] used RF to determine that the topographic wetness index (TWI) was the most significant index for the flood sensitivity mapping of the Xinluo upper subwatershed of the Jiulong River watershed, whereas Du et al. [44] and Arora et al. [45] reached different conclusions.
Notably, the importance of a risk index may vary across different regions, with some indices having a high impact on floods in certain areas and little impact in others. Researchers have used geographical similarity to measure the possibility of landslides in regions based on factors such as topography and land cover, finding that risk indices related to landslides differ regionally [49,50,51]. Given the strong correlation between floods and landslides, it is essential to apply the principle of geographical similarity to flood risk assessment, although there has been limited research on this topic to date. Therefore, it is important to use geographical similarity to assess the contribution of various geographical features (e.g., slope, river density, and relative elevation) in a study area to flood disasters and further analyse the importance of the indices, thus ensuring that the risk assessment results reflect the characteristics of the study area and are widely accepted in academic circles.
At 11:00 on 5 August 2021 (Chinese standard time; the same hereafter), Typhoon “Lupit” (2109) made landfall in Nan’ao County, Guangdong Province, causing significant damage to several provinces. Despite its relatively low wind speed, the typhoon resulted in heavy and prolonged rainfall, which triggered severe floods in the city of Fuzhou (http://fz.fjdsfzw.org.cn/, accessed on 9 May 2023). To assess the dynamic flood risk during the typhoon rainfall process of “Lupit”, this study developed a typhoon-induced flood risk system based on four aspects of the natural disaster system theory [52,53]: the disaster-causing factor, disaster-pregnant environment, disaster-bearing body, and disaster prevention and reduction capacity. Then, the hourly precipitation observation data from automatic rainfall stations were used to determine the typhoon-related hourly precipitation data. A typhoon-rainfall process comprehensive intensity index (TPCI), which integrated the rainfall intensity, duration, and concentration to assess the impact of extreme precipitation, was proposed, and its effect was verified. Finally, we used geographical similarity to identify suitable risk indices for the quantitative assessment of urban flood disaster risk during the typhoon rainfall dynamic process.

2. Study Area and Typhoon Overview

2.1. Study Area

The study area, Fuzhou, is situated in the eastern part of Fujian Province, China (118°08′–120°31′, 25°15′–26°39′). It is located in the coastal region of the lower reaches of the Min River and faces Taiwan Province across the sea, as depicted in Figure 1a–c. Fuzhou serves as the capital of Fujian Province and is the central city of the economic zone on the western side of the strait. The city has a typical subtropical monsoon climate with abundant precipitation throughout the year, averaging 1360 mm annually. In the summer and autumn, typhoon activity is concentrated, leading to heavy rainfall and flooding. Fuzhou is considered one of China’s primary flood control cities. The Rainfall Intensity Assessment Area (RAA) covers the entire Fuzhou region (Figure 1b), while the Flood Disaster Risk Assessment Area (FAA) includes the main urban districts and peripheral development zones, such as Gulou District, Taijiang District, Cangshan District, and parts of Jin’an District, Mawei District, and Minhou County (Figure 1c).

2.2. Typhoon Overview

Typhoons that develop in the South China Sea differ from those in the Northwest Pacific Ocean in terms of their lower wind speeds and meandering tracks. These features allow them to interact with tropical clouds and southwest monsoons, leading to heavy precipitation. Typhoon “Lupit” (2109) is a typical example of a South China Sea typhoon, as illustrated by its track in Figure 1a. At 17:00 on 2 August 2021, a tropical depression formed in the sea near the city of Zhanjiang, Guangdong Province, which later intensified into a tropical storm at 8:00 on 4 August. At approximately 11:00 on 5 August, “Lupit” made landfall in Nan’ao County, Guangdong Province, with a grade 9 maximum central wind force (23 m/s), before reaching Dongshan County, Fujian Province, at 16:50 on the same day. It weakened to a tropical depression at 17:00 on 5 August, but strengthened back to a tropical storm near the eastern coast of Fujian Province later that evening. By 7 August, “Lupit” had weakened again to a tropical depression, and the National Meteorological Center of the China Meteorological Administration stopped issuing further updates on 9 August at 14:00.

3. Data Preprocessing

In this study, 23 indices were selected as the initial assessment measures for flood disaster risk. Among them, the TPCI was chosen to represent the disaster-causing factor in the typhoon rainfall process. Additionally, 11 indices were used to analyse the environmental conditions that predisposed the area to flooding disasters. These included the topographic slope (TS), topographic aspect (TA), topographic relief (TR), depression depth (DD), topographic wetness index (TWI) [54], stream power index (SPI) [55], river density (RD), height above nearest drainage (HAND) [56], impermeability (Imper), runoff coefficient (RC), and vegetation coverage (FVC). Furthermore, the disaster-bearing bodies were represented by four indices, including population density (PD), GDP density (GD), road network density (RND), and the number of key places within 500 m (NKP). Finally, the capacity of emergency preparedness and response mechanisms were investigated in this study by considering metrics such as the proportion of health technicians per 10,000 people (PHT), material reserve ratio per 10,000 people (MRT), funding ratio per 10,000 people (FR), meteorological and hydrological station density (DMHS), transfer road network density (TRD), number of fire brigades within 3 km (NFB), and capacity of emergency shelters within 500 m (CES).
The data used in this study are presented in Table 1. The TPCI data during “Lupit” were derived from hourly precipitation data from automatic meteorological stations and typhoon track data. TS, TA, TR, DD, SPI, TWI, and HAND data were obtained from a digital elevation model and river distribution data of the study area. The 2021 FVC data were derived using remote sensing data. RC data were obtained by assigning corresponding values to land cover types based on the “Standard for the Design of Building Water Supply and Drainage (GB50015-2019)” (https://std.samr.gov.cn/, accessed on 15 June 2022). Imper and river density (RD) data were calculated using impervious surface and river data from the land cover data, respectively. PD and GD data were obtained by updating GHSL building distribution data with population and GDP statistics. RND and TRD data were calculated from road distribution data. NKP, DMHS, NFB, and CES data were obtained from the distribution data of key sites, meteorological and hydrological stations, fire brigades, and emergency shelters, respectively. PHT, MRT, and FR data were obtained by interpolating the statistical data of administrative villages and hospitals using IDW. The flood disaster distribution information used to verify the effect of TPCI was sourced from the Fuzhou Bureau of Natural Resources and Planning (http://zygh.fuzhou.gov.cn/, accessed on 15 June 2022) and news media reports. All layers were prepared in the ArcGIS Pro 3.0 environment.

4. Methods

The methodology employed in this study is presented in Figure 2. The methods included the development of an urban flood risk assessment index system, computation of typhoon rainfall process intensity, selection of flood risk indices, and a flood disaster risk assessment model.

4.1. Calculation of Risk Assessment Index

In this section, we describe the methodology used to calculate the flood risk assessment indices, with a focus on the calculation of the disaster-causing factor, while the other indices are processed as mentioned in Section 3. The spatial resolution of the 23 indices was standardized to 200 m to facilitate assessment. The spatial distribution of each index in the FAA, which consisted of 21,155 grid cells, is shown in Figure A1.

4.1.1. Influencing Elements of Typhoon Rainfall Process

To calculate the TPCI, the typhoon precipitation must be separated from the overall regional precipitation, which was achieved using the Objective Synoptic Analysis Technique (OSAT) [57,58,59] adapted to the characteristics of typhoon ”Lupit” (Table A1).
The comprehensive intensity assessment model of the rainfall process considered two elements, the intensity and duration of rainfall, as proposed by the National Meteorological Center [60,61]. However, considering the suddenness of typhoon disasters and the intermittent rainfall process, this study proposes to assess the comprehensive intensity of the typhoon rainfall process by using rainfall intensity, duration, and concentration as the influencing elements.
We defined the statistical time period (TP) and substatistical time period (Sub-TP), where TP is greater than Sub-TP and both are greater than 1 h. The relationship between TP and Sub-TP was maintained at a ratio of 1:N, and the same was true for Sub-TP and 1 h.
Rainfall intensity ( R ): To calculate the rainfall intensity (R) within the TP, we used a weighted average of the maximum rainfall value of the Sub-TP and the average rainfall value of each Sub-TP, with a weight of 0.5, as shown in Equation (1) [60,61].
R = r m a x + i = 1 m r i m 2
In the formula, R represents the rainfall intensity of the TP; r m a x is the maximum rainfall value of the Sub-TP (unit: mm); m is the number of Sub-TPs in the TP, and r i is the rainfall value of the i th Sub-TP (unit: mm).
Rainfall duration ( T ): T is defined as the number of Sub-TPs within a TP where the total precipitation of Sub-TP reaches a certain impact magnitude.
Concentration intensity ( C ): C within the TP is calculated with 1 h precipitation as the smallest unit. Specifically, C is determined as the weighted average of the maximum concentration of Sub-TP and the average concentration of each Sub-TP, with a weight of 0.5, as expressed in Equations (2) and (3) [32].
C = c m a x + i = 1 m c i m 2
c i = j = 1 n c i j 2 j = 1 n c i j 2 × 100 %
where C represents the concentration intensity of TP; c m a x is the maximum concentration of Sub-TP (unit: %); m is the number of Sub-TPs in the TP; c i is the concentration of the i -th Sub-TP (unit: %); n is the number of hours of the Sub-TP; and c i j is the j -th hour precipitation in the i -th TP.

4.1.2. Typhoon-Rainfall Process Comprehensive Intensity Index (TPCI)

The process of typhoon rainfall is characterized by heavy rainfall events induced by typhoons, which can have significant impacts on a local region. We calculated three influencing elements of the typhoon-rainfall process (see Section 4.1.1) to obtain three corresponding indices: the rainfall intensity index (RI), rainfall duration index (TI), and concentration intensity index (CI).
The TPs used for the calculation of the TPCI were the 24 h and process periods, and 24 h and 6 h periods were used for the corresponding Sub-TP. According to Guan et al.’s research on the extreme precipitation threshold of typhoons in Fujian Province, the RIs for the 24 h and 6 h periods were determined [62]. TI was determined by counting the number of Sub-TPs corresponding to the 24 h rainfall intensity ≥ 50 mm and 6 h rainstorm intensity ≥ 20 mm within the TP. CI was divided into four grades based on three thresholds (10%, 20%, and 25%). Values of 1, 2, 3, and 4 represent the degrees of RI, TI, and CI from small to large, and the specific division standards are provided in Table 2.
Combining R I , T I , and C I yields T P C I as in Equation (4).
T P C I = R I × T I × C I   ( 1 T P C I 64 )
where R I is the rainfall intensity index, T I is the rainfall duration index, and C I is the concentration intensity index.

4.2. Screening of Disaster-Causing Factors and Disaster-Pregnant Environmental Indices

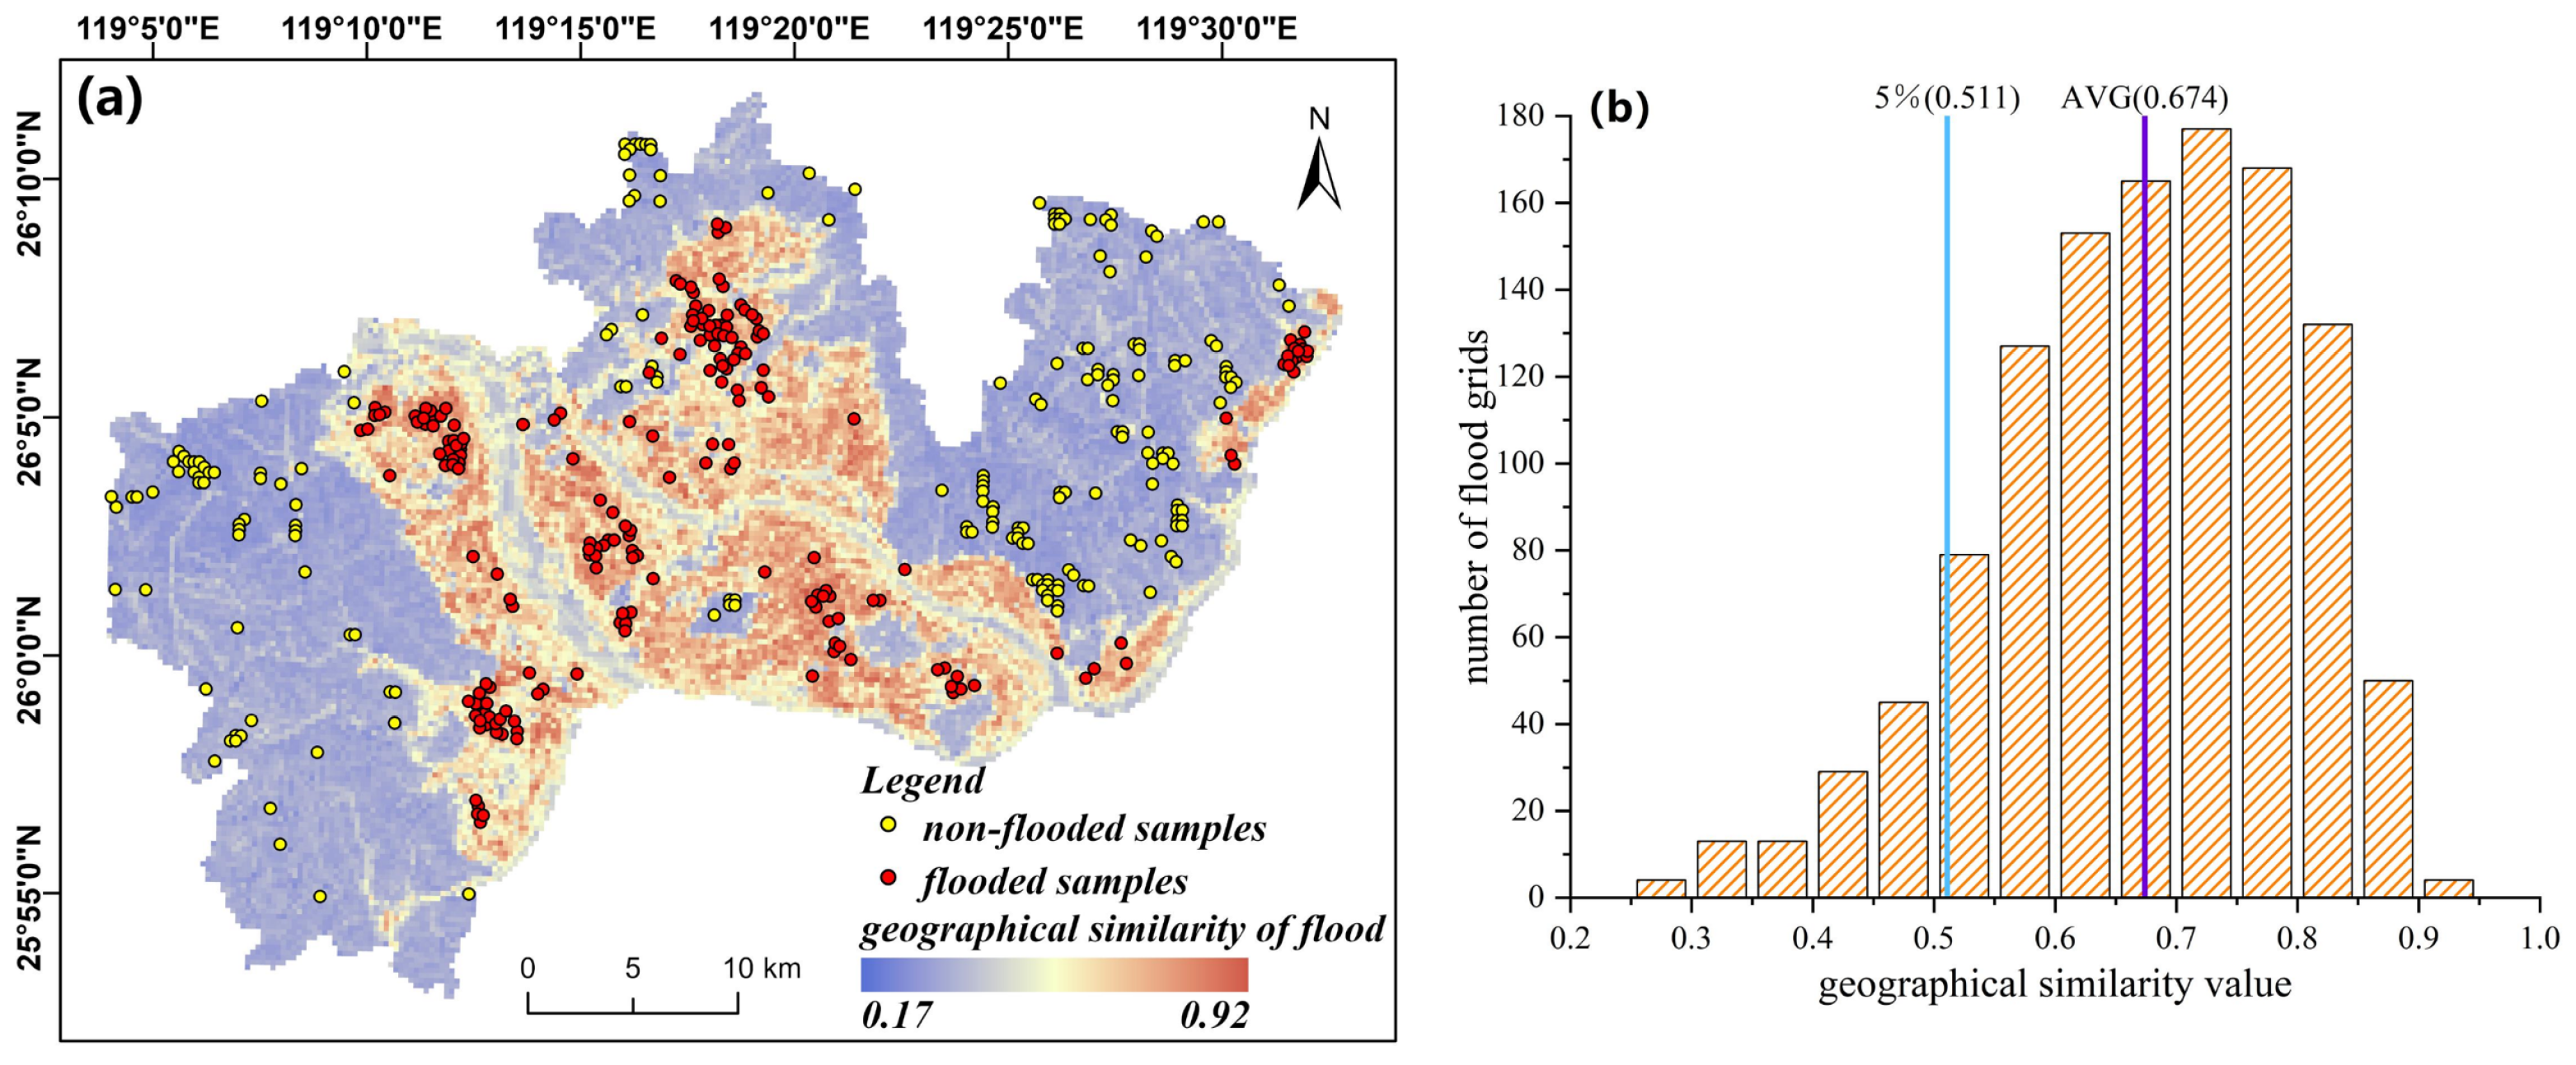
4.2.1. Geographical Similarity

The geographical similarity is a measure of the overall similarity between two spatial locations in the geographical environment, and its calculation method is described in reference [51]. The degree of geographical similarity between the geographic environment and the flooded area in a region is positively correlated with the flood risk in that region. In this study, the average similarity was used to represent the comprehensive similarity of each grid, as presented in Equation (5).
S i m = avg S i m 1 , S i m 2 , S i m 3 , S i m k
In the formula, S i m is the comprehensive similarity of each grid; S i m k is the geographical similarity of each index; and k is the number of indices.
Two hundred flood samples were randomly selected to calculate the S i m distribution of each grid in the FAA, as shown in Figure 3a. The S i m value of more than 95% of the flooded grids was greater than 0.5, thereby validating the effectiveness of the method (Figure 3b). Conversely, non-flooded areas were expected to have relatively small S i m values. To construct a sample set, the first 200 grids with the smallest S i m values were selected as non-flood samples and combined with the flood samples.

4.2.2. Random Forest

Random forest (RF) is an ensemble learning algorithm proposed by Breiman [63]. It is based on a decision tree algorithm and a bagging idea, where random attributes are introduced to the training process of decision trees through a learning ensemble. To avoid multicollinearity issues, Pearson’s correlation coefficients were calculated among the explanatory variables using the sample set (see Figure A2). Indices with correlation coefficients greater than 0.8 were selected, and in turn, each index with a higher sum of the absolute value of the correlation coefficient than those of the other indices was removed. After this calculation, TS, FVC, and RC were removed, and the remaining 9 indices were used as explanatory variables for RF classification. The importance of each variable in the RF model is shown in Figure A3, where TA was found to be the least important index. Although TA may not have a high correlation with floods, it is closely related to precipitation, especially in mountainous regions where the windward side of the mountain range receives more precipitation than the leeward side. Therefore, TA was further removed from the analysis.

4.3. Flood Disaster Risk Assessment Model

The AHP has been widely employed to determine the weights of flood disaster risk assessment indices [47,48]. AHP is a systematic and hierarchical analysis method that combines qualitative and quantitative analyses and can be used to calculate subjective weights [64]. Based on the weight of each index, a weighted synthesis was performed to construct the flood disaster risk assessment model using Equation (6) [52,53].
R i s k = H × W H + E × W E + V × W V + R × W R
where R i s k is the risk of flood disaster, H is the hazard of the disaster-causing factor, E is the sensitivity of the disaster-pregnant environment, V is the vulnerability of disaster-bearing bodies, R is the disaster-prevention and reduction capacity, and W is the weight of the index.
The importance results of the RF and the knowledge of local experts were utilized to construct judgement matrices for the disaster-causing factor and the disaster-pregnant environment. The weight values of each flood disaster index were calculated based on the judgement matrix, as presented in Figure 4. Considering the geographical similarity and the actual situation in the region, the 19 selected indices were categorized as low-grade, medium-grade, medium–high-grade, and high-grade and assigned specific values as shown in Table 3.

5. Results

5.1. Analysis of TPCI

5.1.1. Calculation Results of TPCI

The OSAT method was used to isolate the hourly precipitation caused by Typhoon “Lupit” in the RAA. The typhoon impacted the region from 5:00 on 3 August 2021, to 9:00 on 8 August 2021. The precipitation process line for the typhoon and non-typhoon events is presented in Figure A4, and the cumulative precipitation during the process is shown in Figure A5. Starting at noon on 3 August, a small amount of typhoon precipitation was observed in the RAA, which gradually increased and exhibited a multimodal morphology. On 4 and 5 August, there were more intermittent periods of precipitation, and the peak type of precipitation was sharper and thinner. On 6 August, the most precipitation occurred during the typhoon process, with heavy precipitation that had a long duration.
We calculated T P C I p r o c e s s and T P C I 24 h based on the precipitation data of typhoon “Lupit” from 12:00 on 3 August to 12:00 on 7 August and followed the division standards in Table 3. Figure 5a–d show the results of T P C I p r o c e s s and its constituent elements. Overall, T P C I p r o c e s s roughly reflected the distribution trend of the comprehensive rainfall intensity, with most areas having a medium-grade TPCI or higher. High-grade areas were distributed in a dotted pattern in central Minhou County, northern Changle District, and the northern part of the city of Fuqing, and medium-high-grade areas showed a banded, irregular distribution (Figure 5a). The high-grade areas of R I were mainly located in southern and northern Minhou County, eastern Fuqing, Cangshan District, Lianjiang County, and Luoyuan County (Figure 5b). The T I s in all regions were above a medium grade, indicating that the duration of the impact of “Lupit” was more than 2 days (Figure 5c). The C I s in all regions were above a medium grade, indicating that, although “Lupit” had a long impact time, the main precipitation periods were very concentrated (Figure 5d). On the other hand, T P C I 24 h could better reflect short-term torrential rain intensity during the typhoon influence process. T P C I 24 h was low-grade and had a smaller distribution from noon on 3 August to noon on 5 August (Figure 5e,f), and it was stronger in most areas from noon on 5 August to noon on August 6th (Figure 5g), when the main precipitation period occurred. As the rain decreased, the T P C I 24 h grades decreased in most areas from noon on August 6th to noon on 7 August (Figure 5h).

5.1.2. Validation of TPCI Results

We analysed the rationality of the calculation process of the 24 h time scale TPCI. Two groups of 24 h rainfall events were designed with the same 6 h total precipitation, but different concentrations (Figure 6a,b). The TPCI calculation processes of each precipitation event are shown in Table 4. The uniform rainfall pattern resulted in a TPCI value of 0, while the non-uniform rainfall pattern resulted in a TPCI value of 8 in the rainfall event with 72 mm of precipitation in 24 h. When the 24 h precipitation increased to 192 mm, the precipitation concentration of Event 8 was the lowest, but its 6 h precipitation was >20 mm, resulting in the same TPCI value as that of Event 7. In the case of high process precipitation, the uniform rainfall pattern could also lead to a higher risk of disaster.
To further analyse the effect of the TPCI on the actual rainfall process, some meteorological stations with severe flood disasters in the nearby area were selected: S1 (Nanyu Town Meteorological Station), S2 (Shangjie Town Meteorological Station), S3 (Fujian Provincial Sports Center Meteorological Station), and S4 (Gaishan Town Meteorological Station) (Figure 6c–f). The amount of precipitation controlled the calculation process of the TPCI. From 12:00 on the 3rd to 12:00 on the 5th, the precipitation was lower and there were more intermittent periods of precipitation, resulting in a higher concentration. However, under a reasonable precipitation classification, the 24 h time scale TPCI based on the 6 h short duration accurately reflected the changes in the rainfall process and captured the dynamic characteristics of the disaster risk of typhoons.
The TPCI can be utilized to assess the risk of natural disasters, such as floods, landslides, and mudslides, resulting from heavy rainfall. To verify the efficacy of the TPCI as an index representing the cause of the flood, flood disaster data from Typhoon “Lupit” were examined, which consisted of temporal and spatial attributes. To conduct this verification, the flooded areas included in T P C I p r o c e s s and T P C I 24 h were analysed at various TPCI grades (Table 5). The spatial overlay results of the TPCI and flood locations at different time scales demonstrated that approximately 66.5% of the flood locations were in areas with medium-grade TPCI values or higher, 32.5% were low-grade, and only 1% were not identified by the TPCI. Specifically, for T P C I 24 h , from noon on the 3rd to noon on the 4th, the majority of flooded areas were at medium-grade; from noon on the 4th to noon on the 5th, the flooded area more than doubled that of the previous period, with most areas having low-grade values; from noon on the 5th to noon on the 6th, the total flood area reached its peak, and TPCI was dominated by medium–high-grade, with high-grade appearing locally; and from noon on the 6th to noon on the 7th, the total flood area decreased by 4.73 km2 compared with that of the previous period, with most regional strengths being medium-grade and above.
Regarding T P C I p r o c e s s , 2.75% of the flooded areas were not graded, and medium-high-grade areas accounted for 51% of the total flooded areas. While T P C I p r o c e s s provided a clearer expression of the rainstorm intensity over the time scale of the overall process, numerous flood areas were ungraded. In contrast, T P C I 24 h reflected the spatiotemporal changes in rainstorm intensity and could identify 6 h, short-duration rainfall on a 24 h time scale. Notably, the TPCI in flooded areas did not necessarily correlate with the highest grade, indicating that the flood disaster was related to local underlying surface characteristics. Therefore, TPCI with a reasonable threshold can effectively identify flooded areas.

5.2. Analysis of Flood Disaster Dynamic Risk

5.2.1. Risk Assessment

The flood disaster risk assessment model was used to evaluate the distribution of the flood disaster risk and changes in the proportion of affected areas caused by typhoon “Lupit” on both the process time scale and the 24 h time scale in the FAA. The flood risk at the process time scale showed a general trend of decreasing from the centre of the built-up area outwards, with high-risk areas accounting for 7.08% of the FAA and primarily distributed in the southeastern and northwestern parts of Cangshan District, northern Minhou County, central and northern Jin’an District, and northeastern Gulou District (Figure 7). Medium–high-risk areas accounted for 26.47% and were mainly located on the periphery of the high-risk areas, while medium-risk areas accounted for 38.19% and were mostly located on the periphery of the medium–high-risk area and northwestern Minhou County. Low-risk areas accounted for 28.26% and were concentrated in the northwestern part of Minhou County and the western part of Mawei District, mostly at the edge of the FAA.
From noon on the 3rd to noon on the 4th, medium–high-risk and high-risk areas accounted for 8.29% of the FAA and were concentrated in the northwestern part of the FAA, with scattered locations elsewhere (Figure 8a). From noon on the 4th to noon on the 5th, the flood risk range shifted to the south–central part of the FAA with a slightly reduced extent (Figure 8b). Typhoon “Lupit” made two landfalls at approximately 11:00 and 16:00 on the 5th. From noon on the 5th to noon on the 6th, the flood risk range rapidly expanded, with 23.57% of the areas of medium–high-risk and above located primarily in built-up areas. Most of the medium- and low-risk areas in the previous period were upgraded to medium–high-risk (Figure 8c). From noon on the 6th to noon on the 7th, the flood risk range was reduced, with the high- and medium-high-risk areas remaining largely unchanged. Central Cangshan District, southern Jinan District, and western Mawei District were reduced to no-risk levels (Figure 8d). The risk grade conversion flow shown in Figure 8e indicates that the sharp changes in T P C I 24 h under the influence of typhoon “Lupit” led to dynamic changes in the flood risk area.

5.2.2. Validation of Risk Assessment Results

To assess whether the flood disaster risk classifications at both the typhoon process time scale and the 24 h time scale were reasonable, we plotted radar diagrams of the average values of the standardized indices at different risks, as shown in Figure 9a,b. For the process time scale, areas with high- and medium–high-risk generally exhibited lower TS, higher impermeability, higher TPCI values, and greater damage due to higher GP and PD. The medium- and low-risk areas tended to have less precipitation and sparse populations. Notably, the TPCI calculated per 24 h showed better distinguishability than the TPCI calculated by the process at different risk grades, suggesting that intermittent and short ephemeral intense precipitation at the process scale is more strongly associated with urban flooding.
We also conducted additional flood disaster causation analysis for the grid area within a 500 m radius of meteorological stations S1–S4. Figure 9c shows the average standardized index values for the four station areas, all of which exhibited high TPCI grades. S4 is surrounded by the Gaishan Investment Area, which has high impermeability and high population and economic densities. S3 is in an area surrounded by dense viaducts, which creates a “funnel” effect underneath the viaducts. As a result, rainwater accumulates and forms pooling water, which disrupts the traffic in the affected areas. S2 is surrounded by old residential areas with ageing drainage pipes, low drainage standards, and lagging drainage systems. S1 is in a rural area on the outskirts of the city, with a small population, low elevation, poor drainage, and few disaster prevention and mitigation facilities, making rescues difficult. During the impact of Typhoon “Lupit”, severe floods occurred in these areas, and the dynamic risk of urban flooding calculated in this study also showed a high risk, supporting the validity of the results. Therefore, our study demonstrates that the obtained risk classifications are realistic.

6. Discussion

The occurrence of floods is often a result of complex and interrelated factors, including the physical geography and socioeconomic conditions of a region, rather than a single isolated event caused solely by sudden and intense precipitation. In this study, a framework for urban flood risk assessment was established based on the heavy rainfall process during a typhoon, using natural hazard system theory to investigate and screen relevant factors for flood risk. Through this framework, the risk of flooding in Fuzhou caused by Typhoon “Lupit” (2109) was accurately assessed over multiple periods. While hydrodynamic flood modelling based on physical mechanisms may provide a closer approximation of real flood conditions [65], the assessment framework proposed in this study does not require highly precise data, allowing for a faster computational speed and accurate spatial prediction of risk.
In this study, a data-driven approach was employed to select indicators for flood risk assessment using the principles of geographical similarity and random forest. This approach overcomes the limitations of traditional indicator selection methods, which are often influenced by human subjectivity and fail to capture complex nonlinear relationships between data. Furthermore, a typhoon-rainfall process comprehensive intensity index (TPCI) that integrates the intensity, duration, and concentration of precipitation was proposed to account for the intermittent nature of the typhoon precipitation process. This index not only captures trends in precipitation intensity at different time scales, but can also be used to assess the risk of natural disasters, such as floods, landslides, and mudslides caused by heavy rainfall during typhoons. The study by Ye et al. [66] demonstrated that designing different flood inundation scenarios based on the statistical characteristics of historical precipitation can be applied to flood hazard risk mapping for urban planning. The TPCI-based assessment method proposed in our study is particularly effective in dealing with the non-stationary nature of typhoon precipitation [67], which is characterized by significant temporal variability.
In addition, this study utilizes remote sensing and geographic information systems (GIS) to spatially analyse disaster-bearing bodies and disaster prevention and reduction measures. By using a grid-based approach for risk assessment, it is possible to capture the variation in risk within administrative areas and better understand the changes in risk over time. This approach is more effective than traditional methods that rely solely on statistical socio-economic factors in administrative areas.

7. Conclusions

In this study, we conducted a dynamic risk assessment of floods caused by Typhoon “Lupit” (2109) in Fuzhou, Fujian Province, China, by constructing a typhoon-rainfall process comprehensive intensity index (TPCI). To screen influencing factors of flood disaster risk, we utilized geographical similarity and RF algorithms. The main results are summarized as follows:
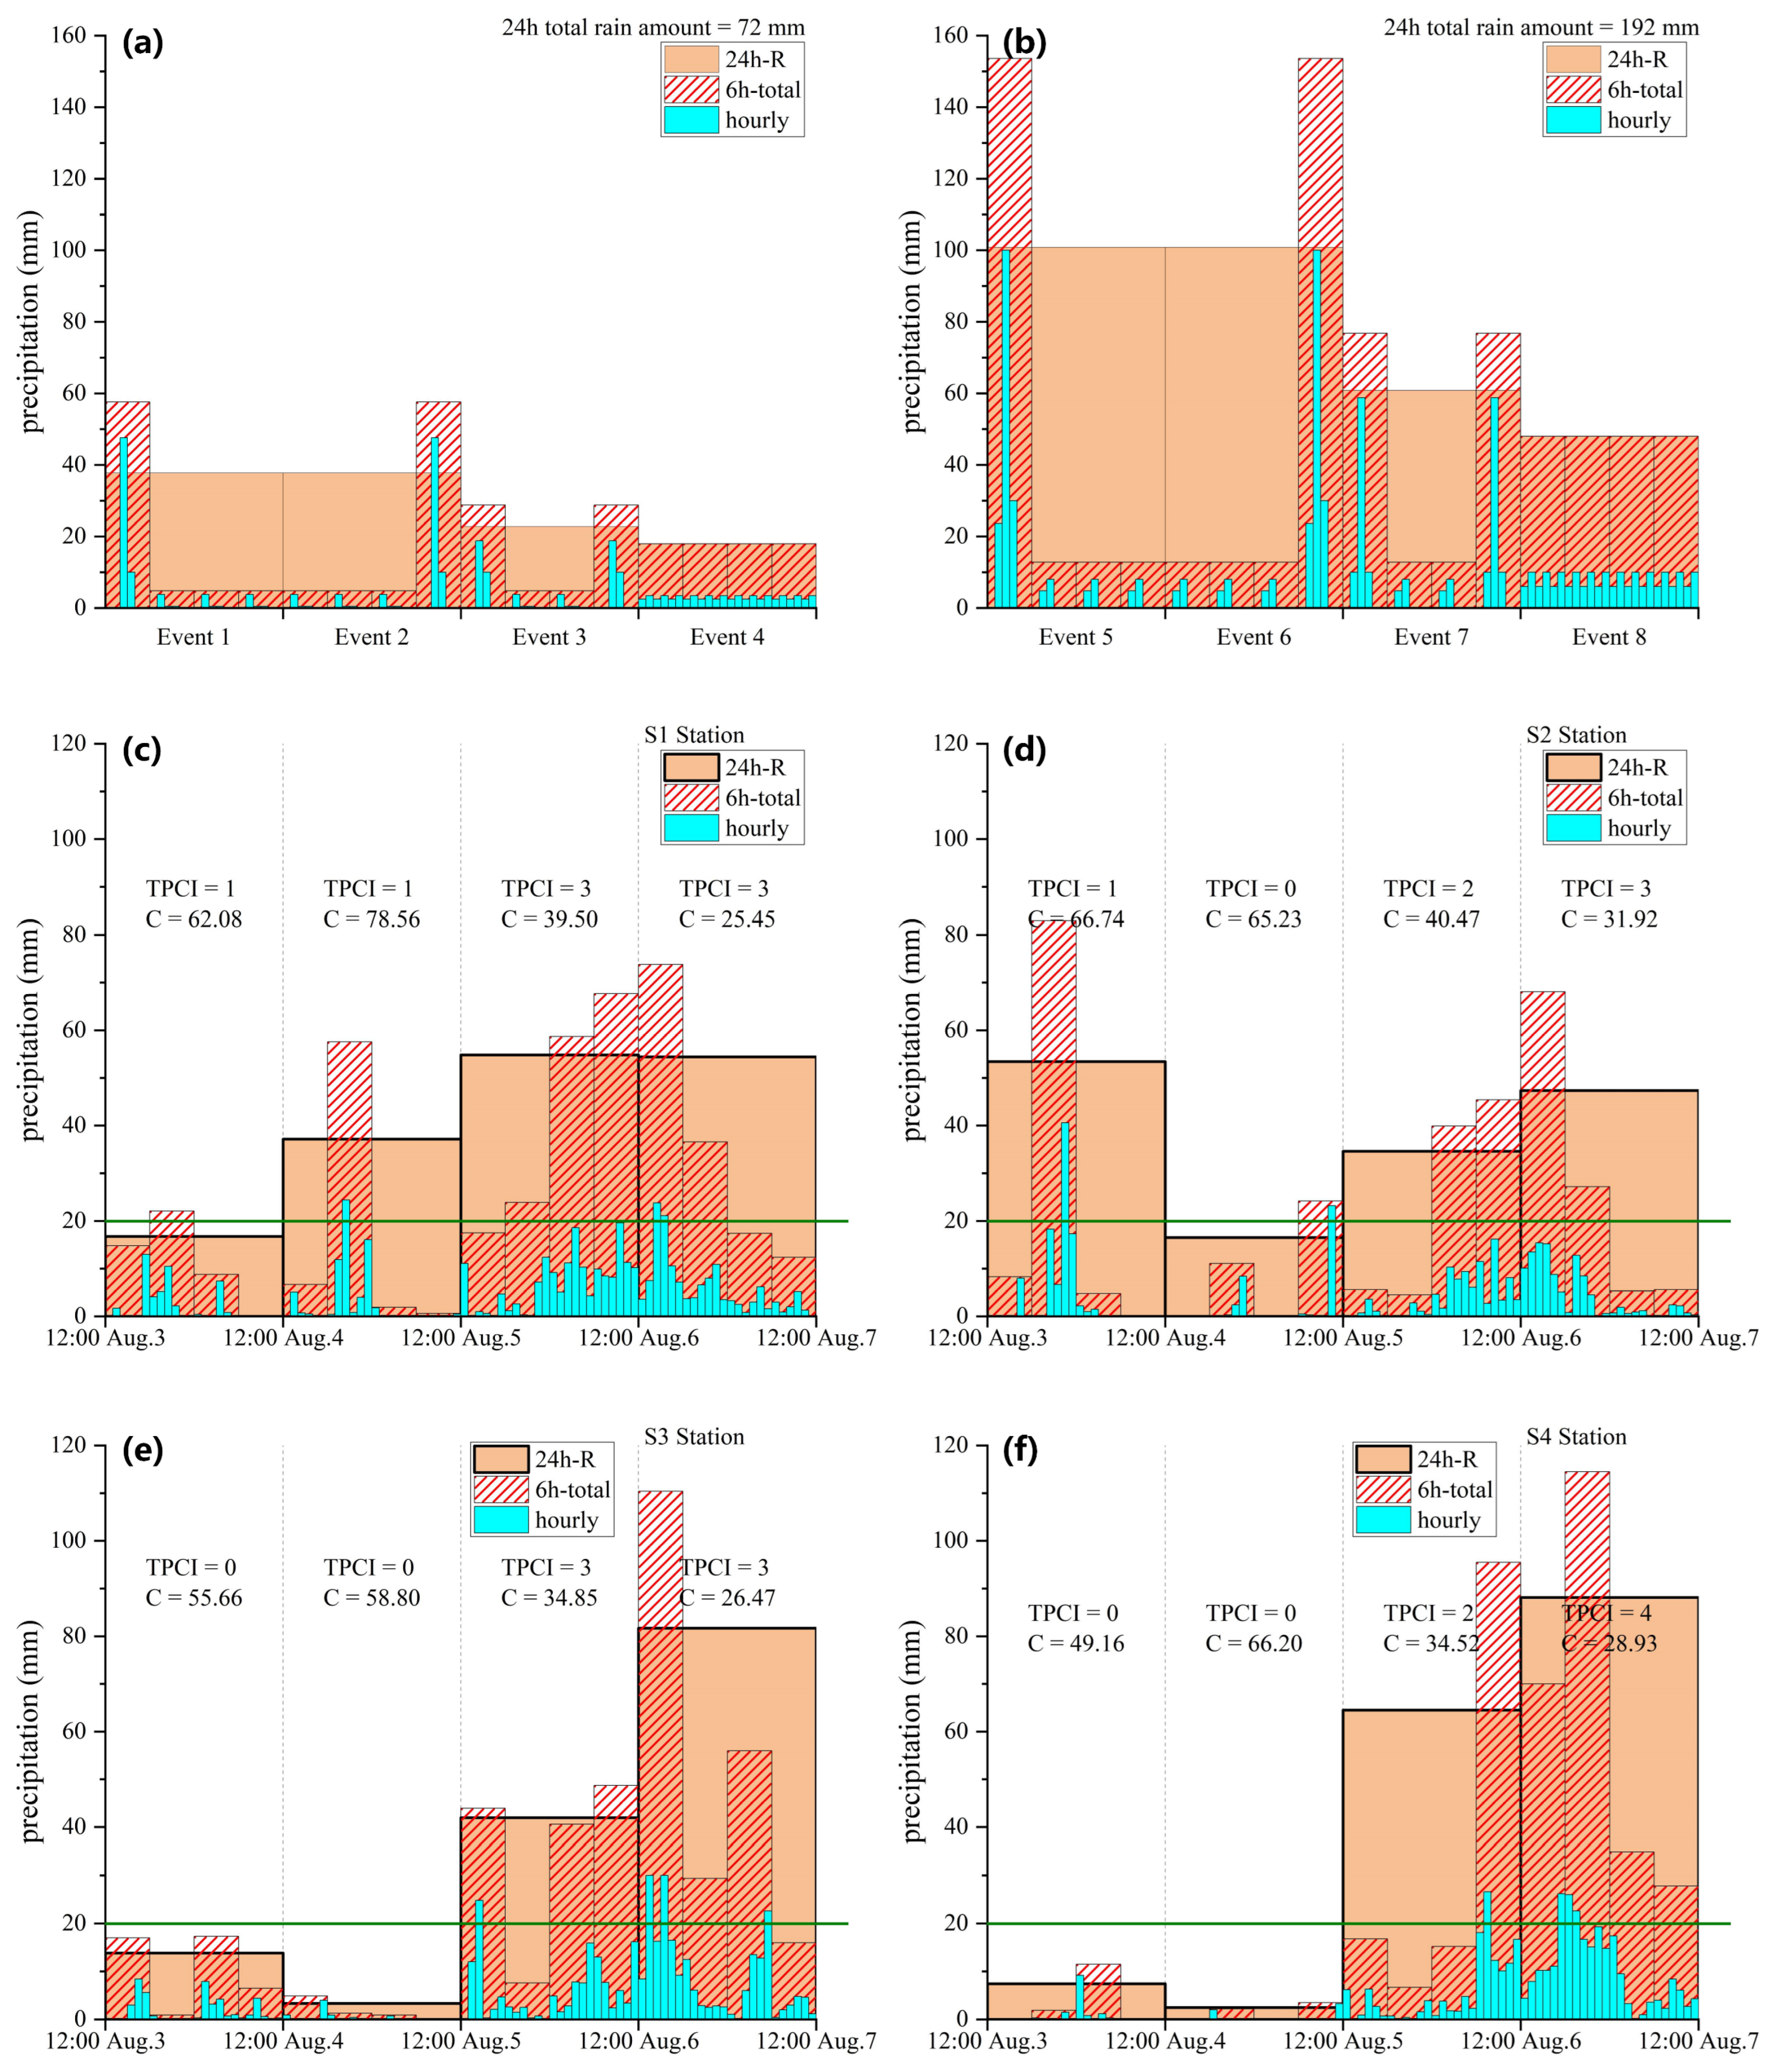
  • The TPCI was developed by using regional precipitation thresholds and considered the effects of precipitation intensity, duration, and concentration on rainfall processes at different time scales. This index is a scientifically valid measure that is user-friendly and easy to calculate. Its feasibility was tested and verified using both short-term (6 h) and daily (24 h) precipitation time scales. The results showed that 66.5% of the flood locations were classified as having a medium-grade or higher TPCI value, 32.5% had a low-grade TPCI value, and only 1% were not identified by the TPCI. The study also found that uniform rainfall patterns were associated with a higher likelihood of flooding, particularly at greater precipitation amounts.
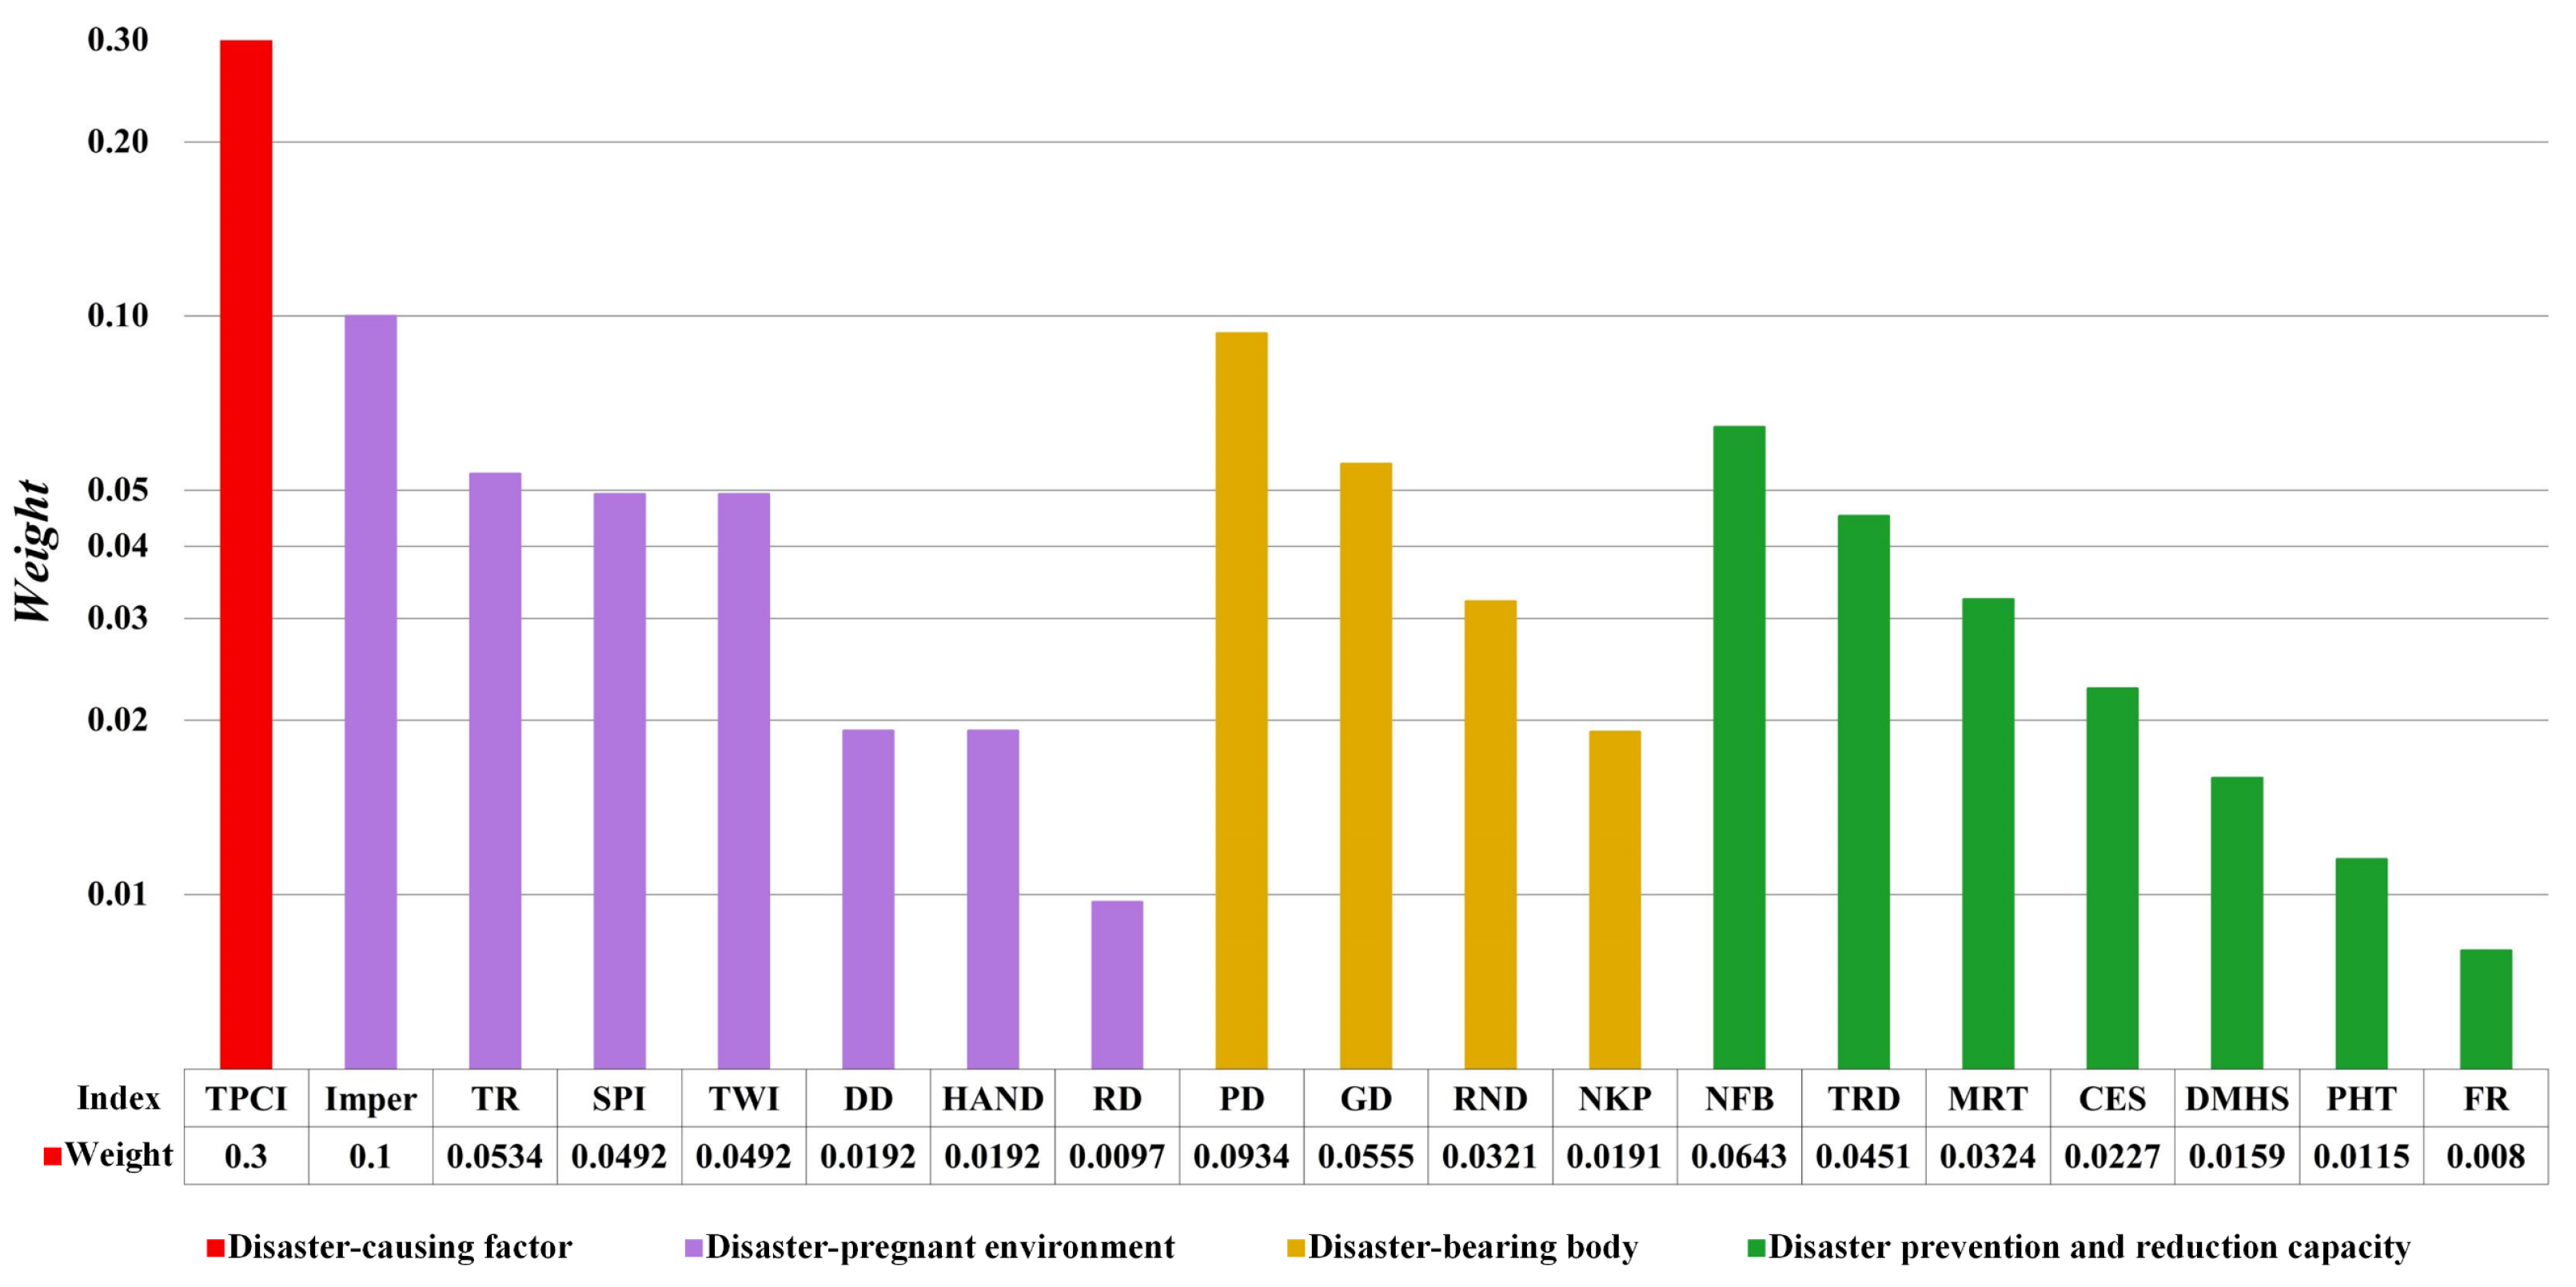
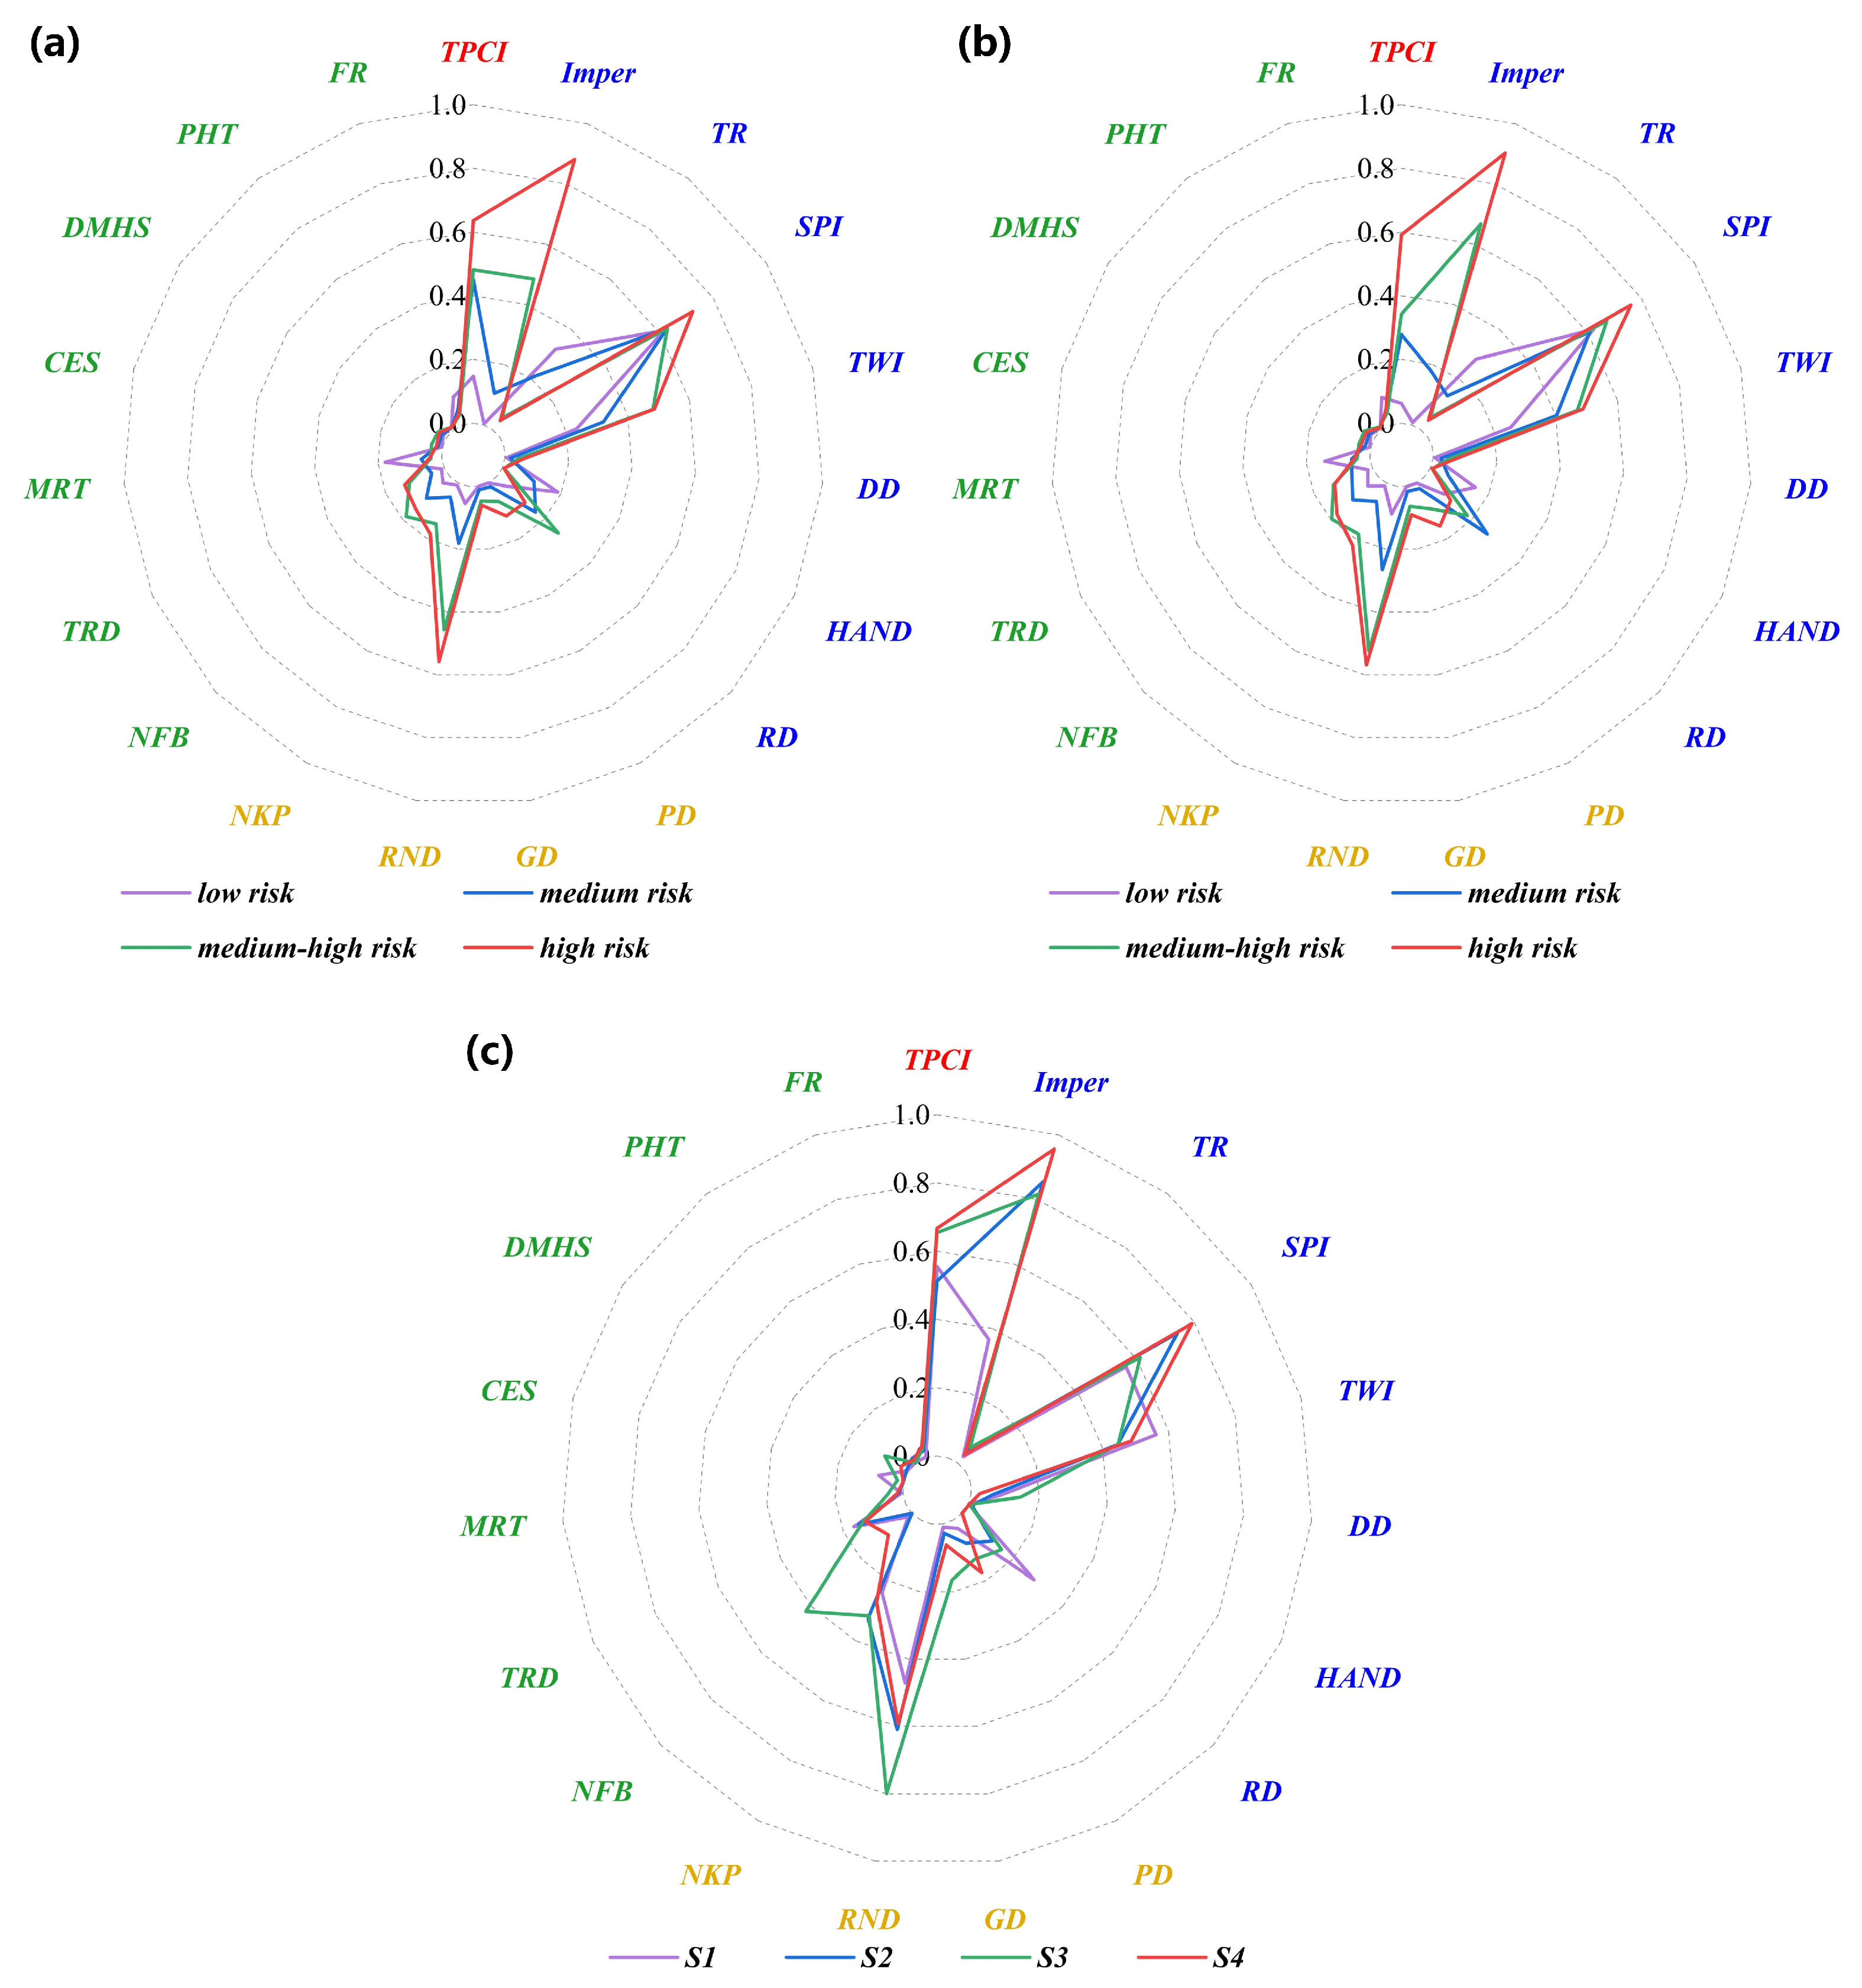
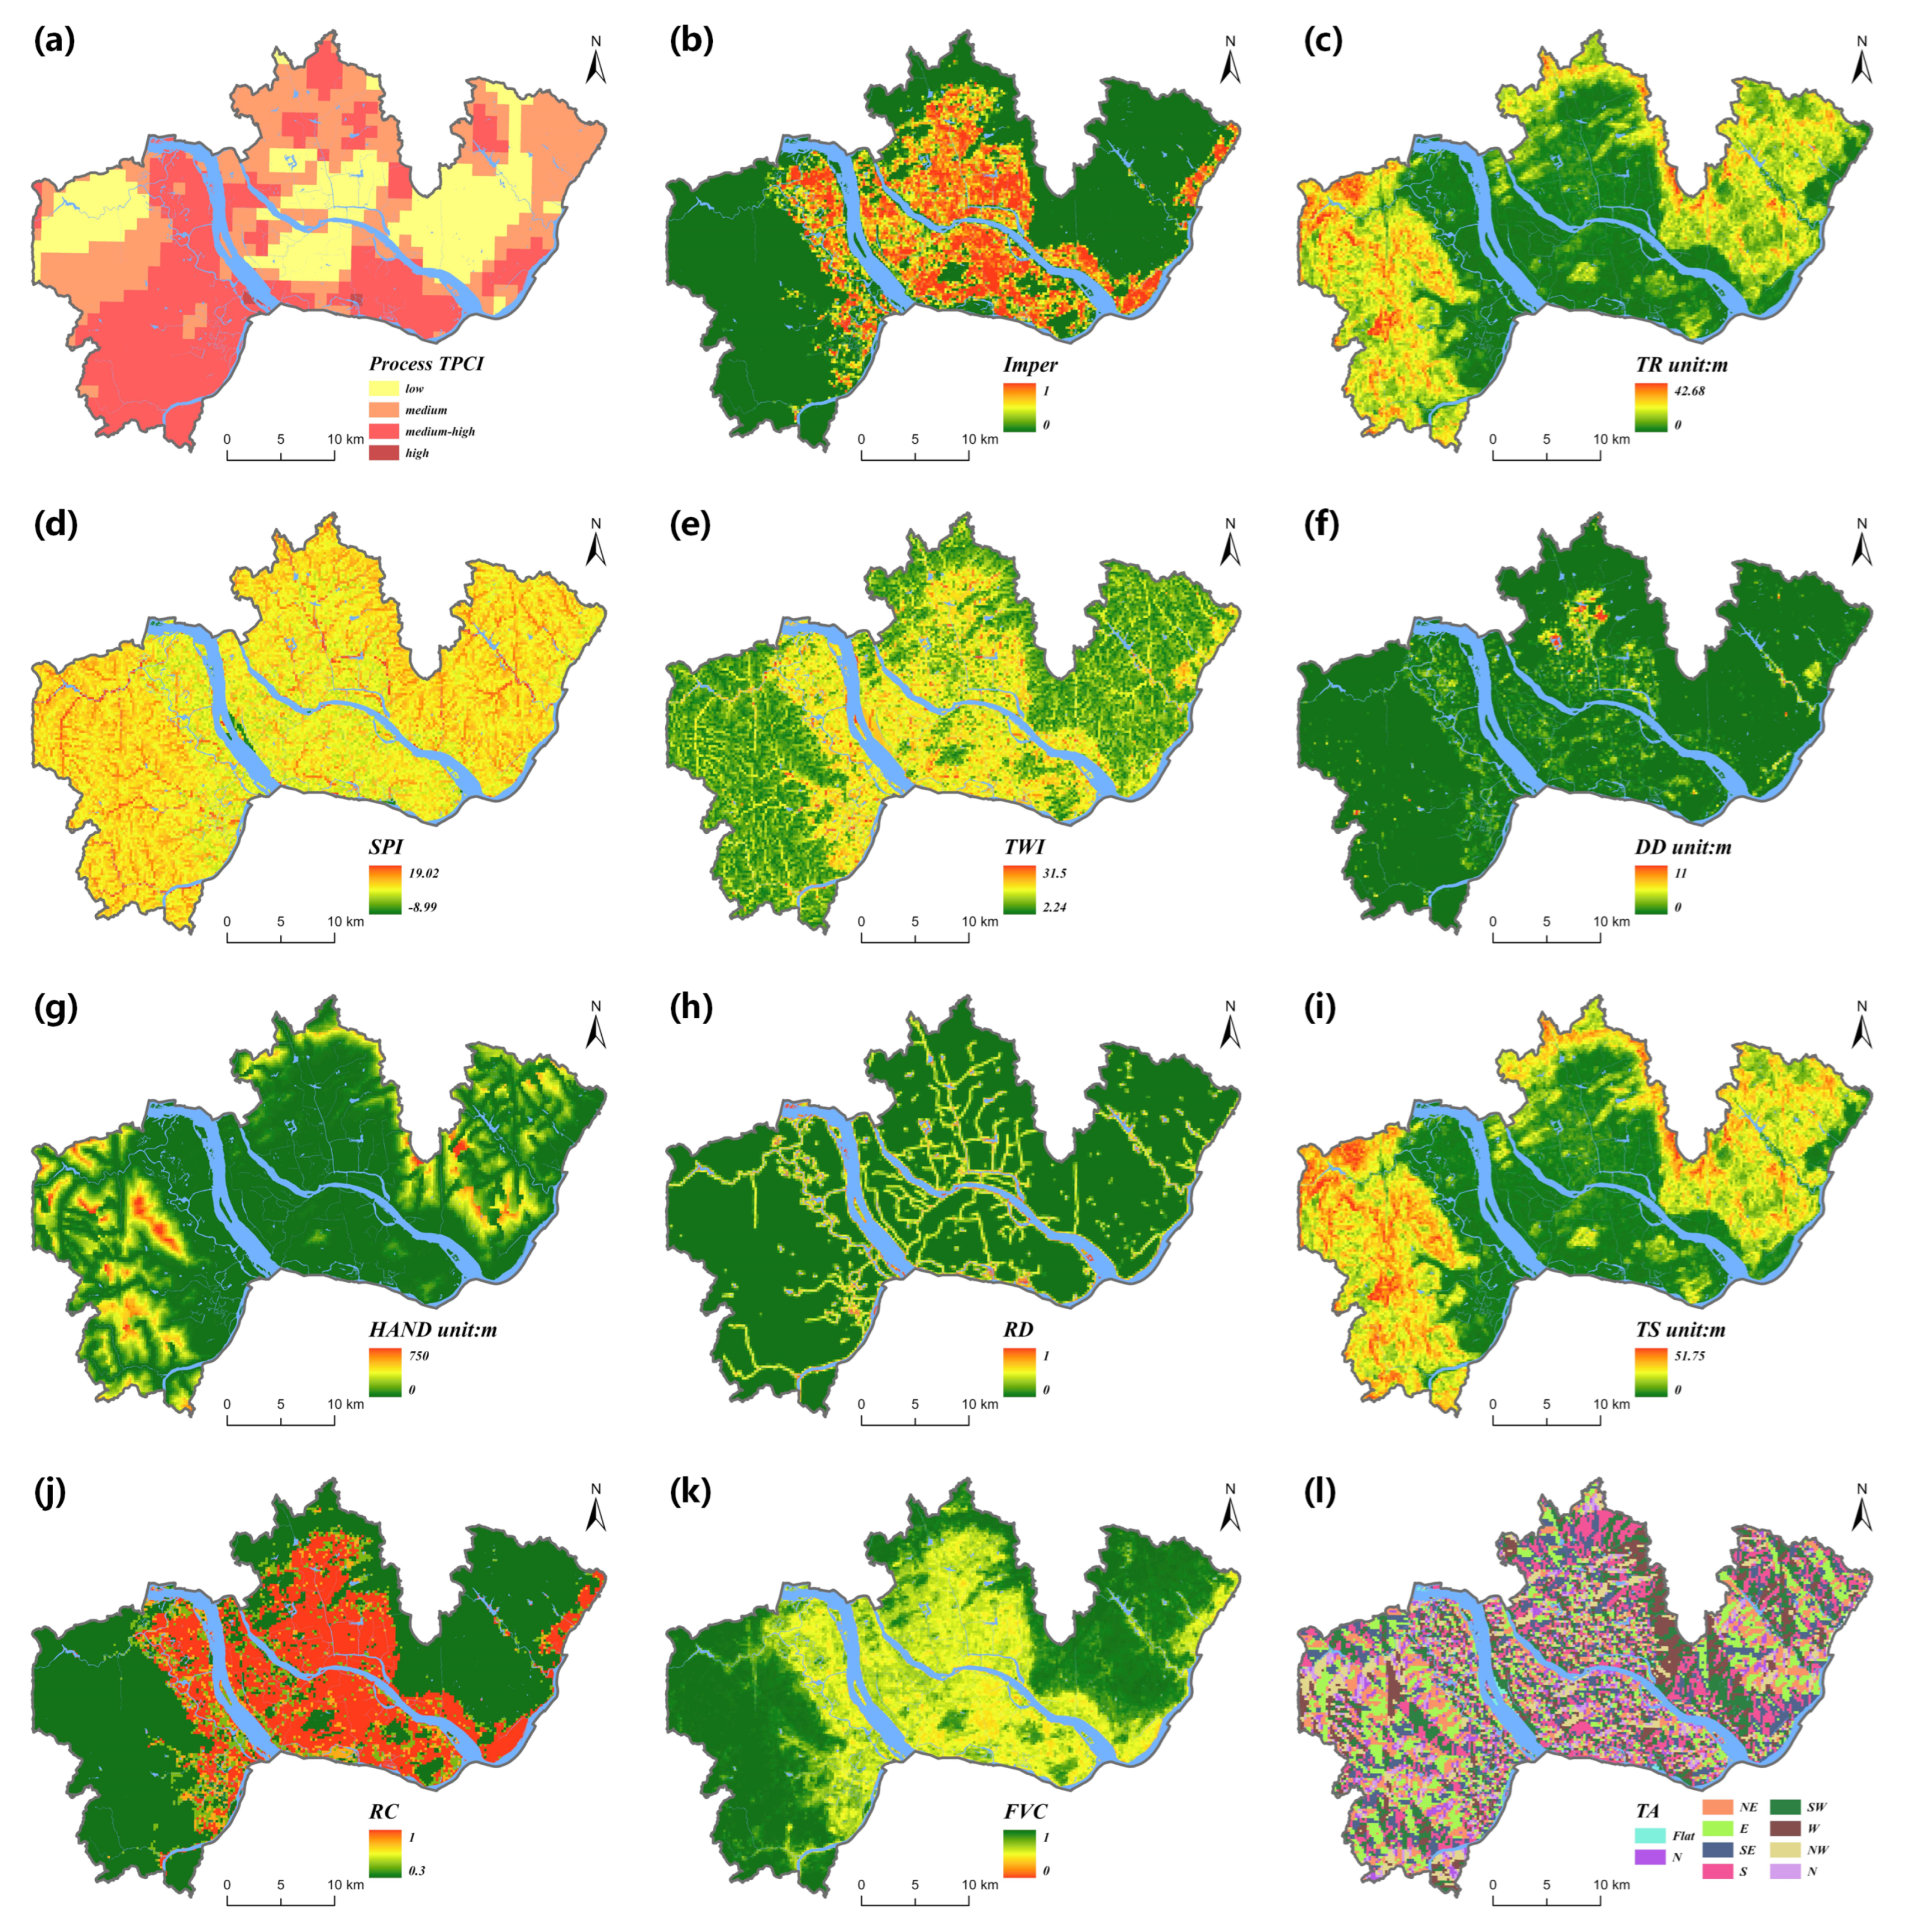
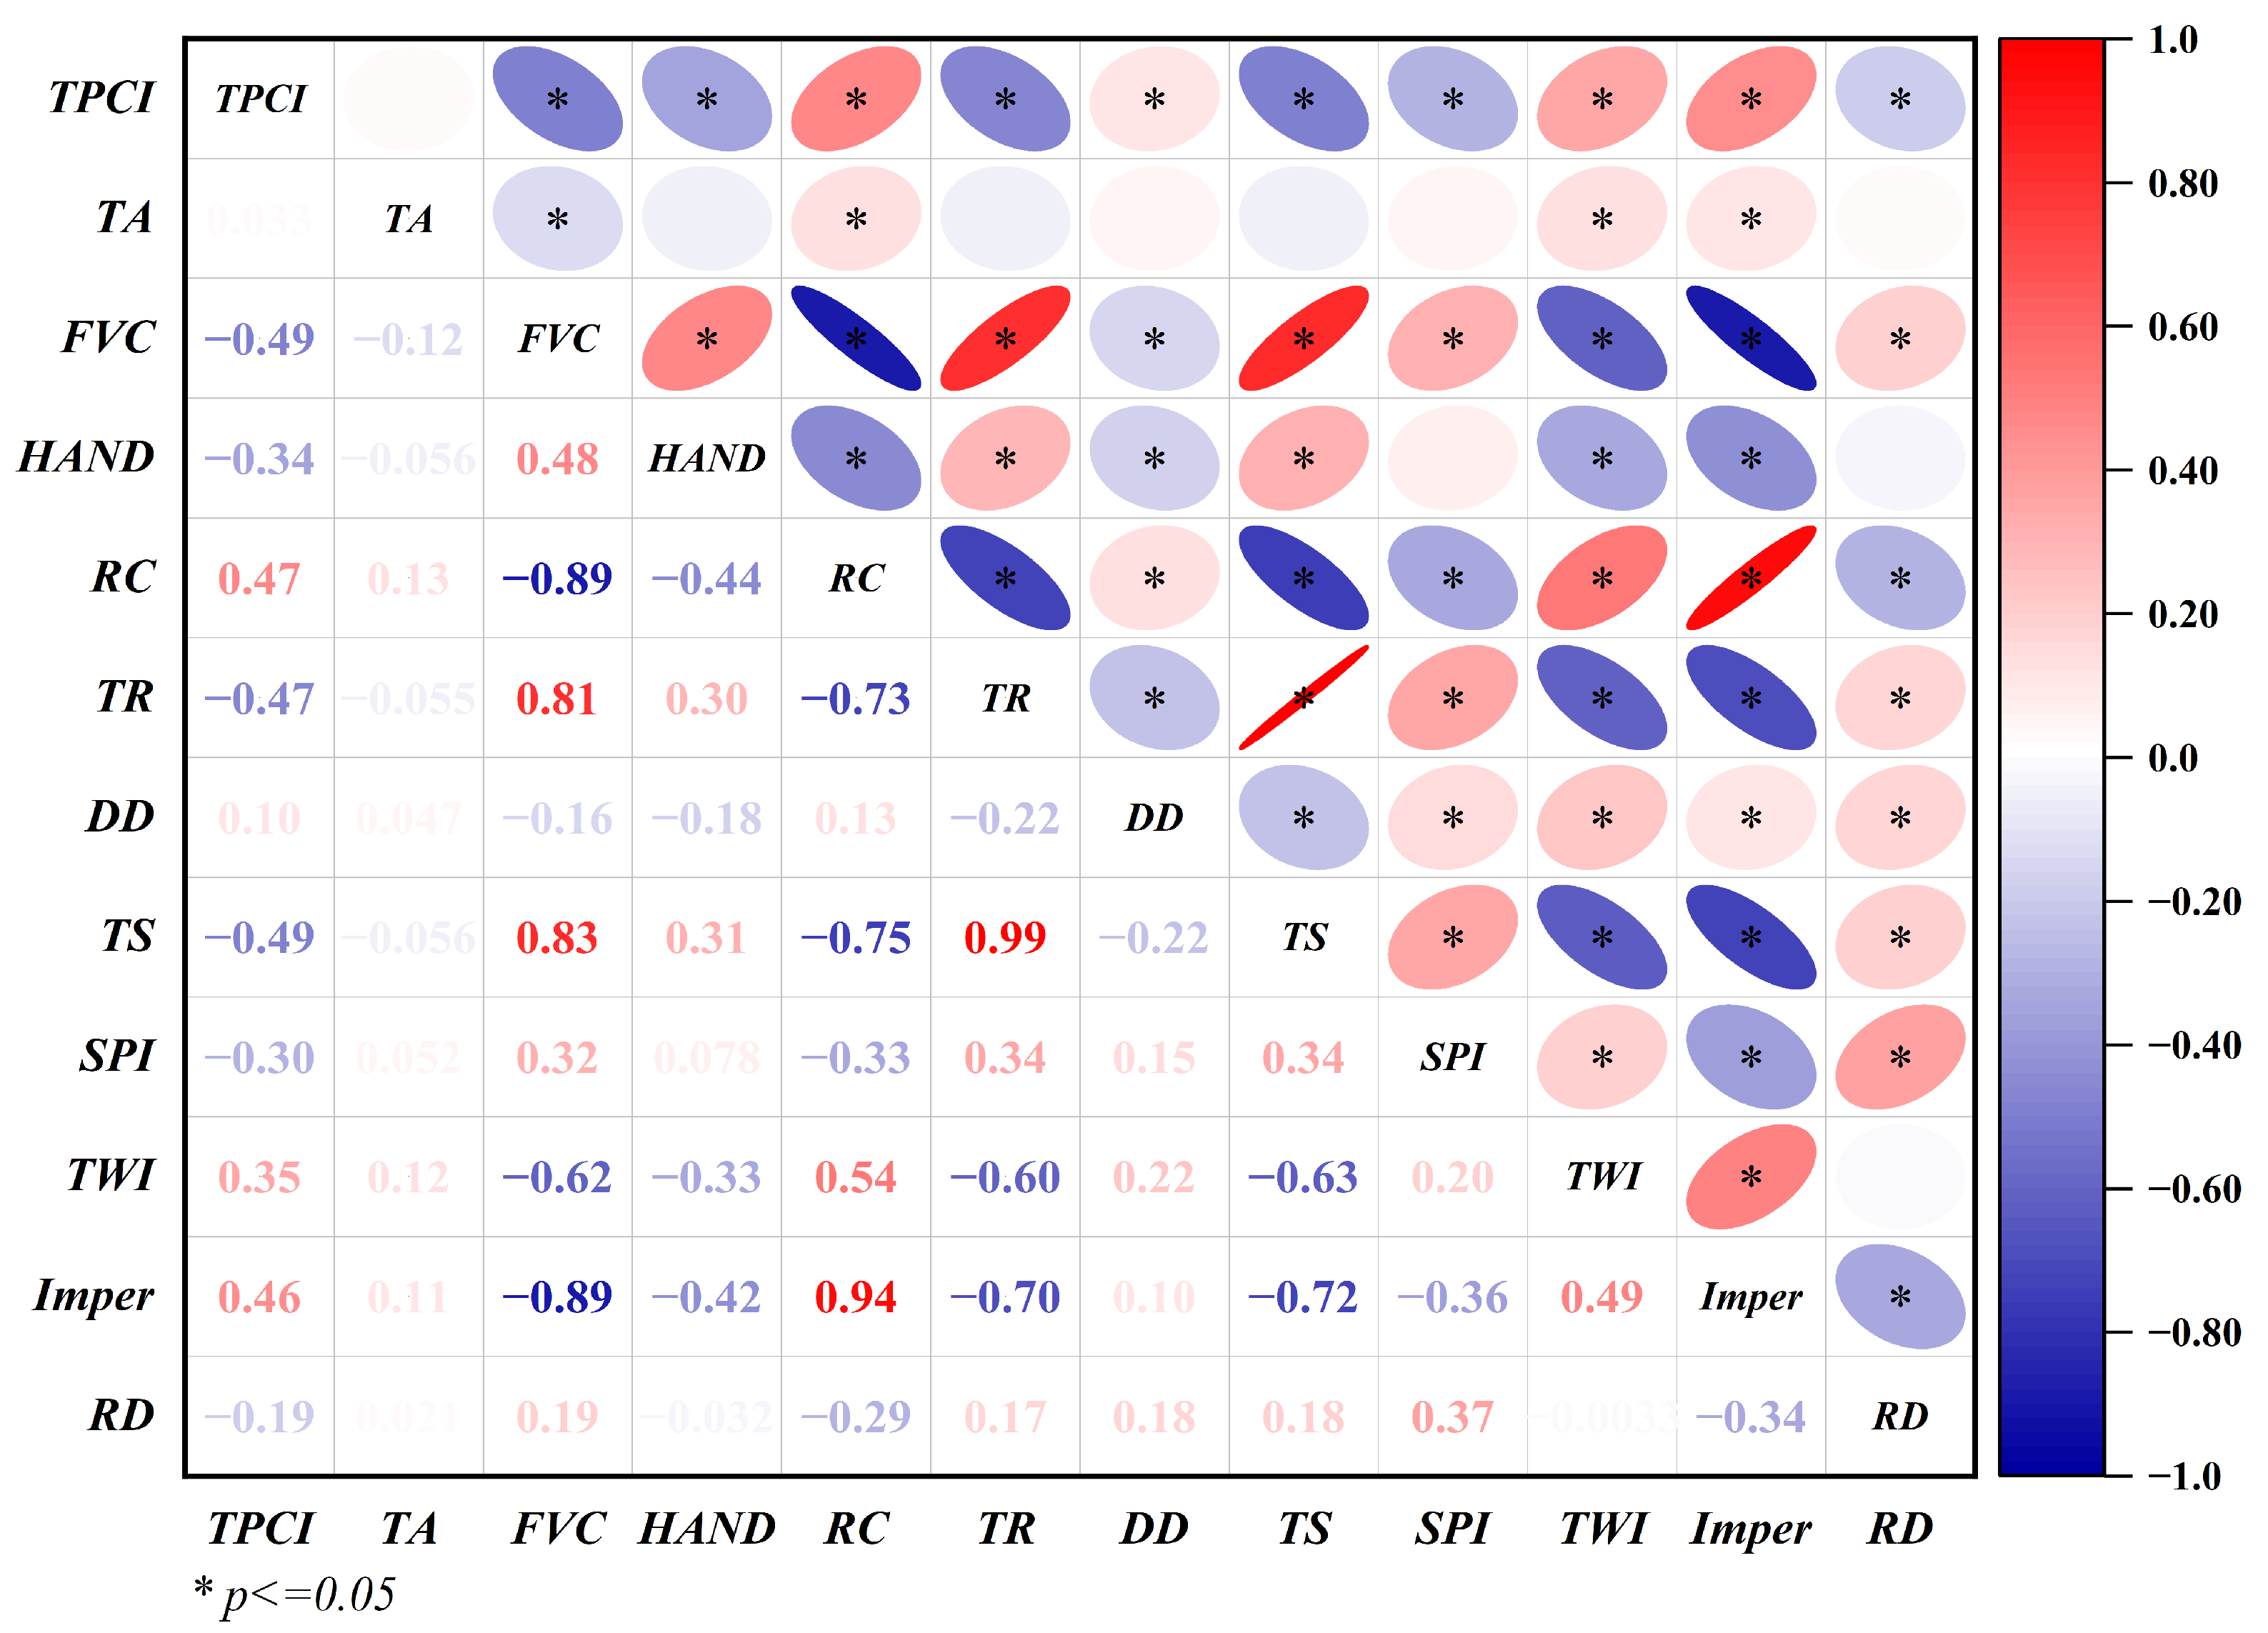
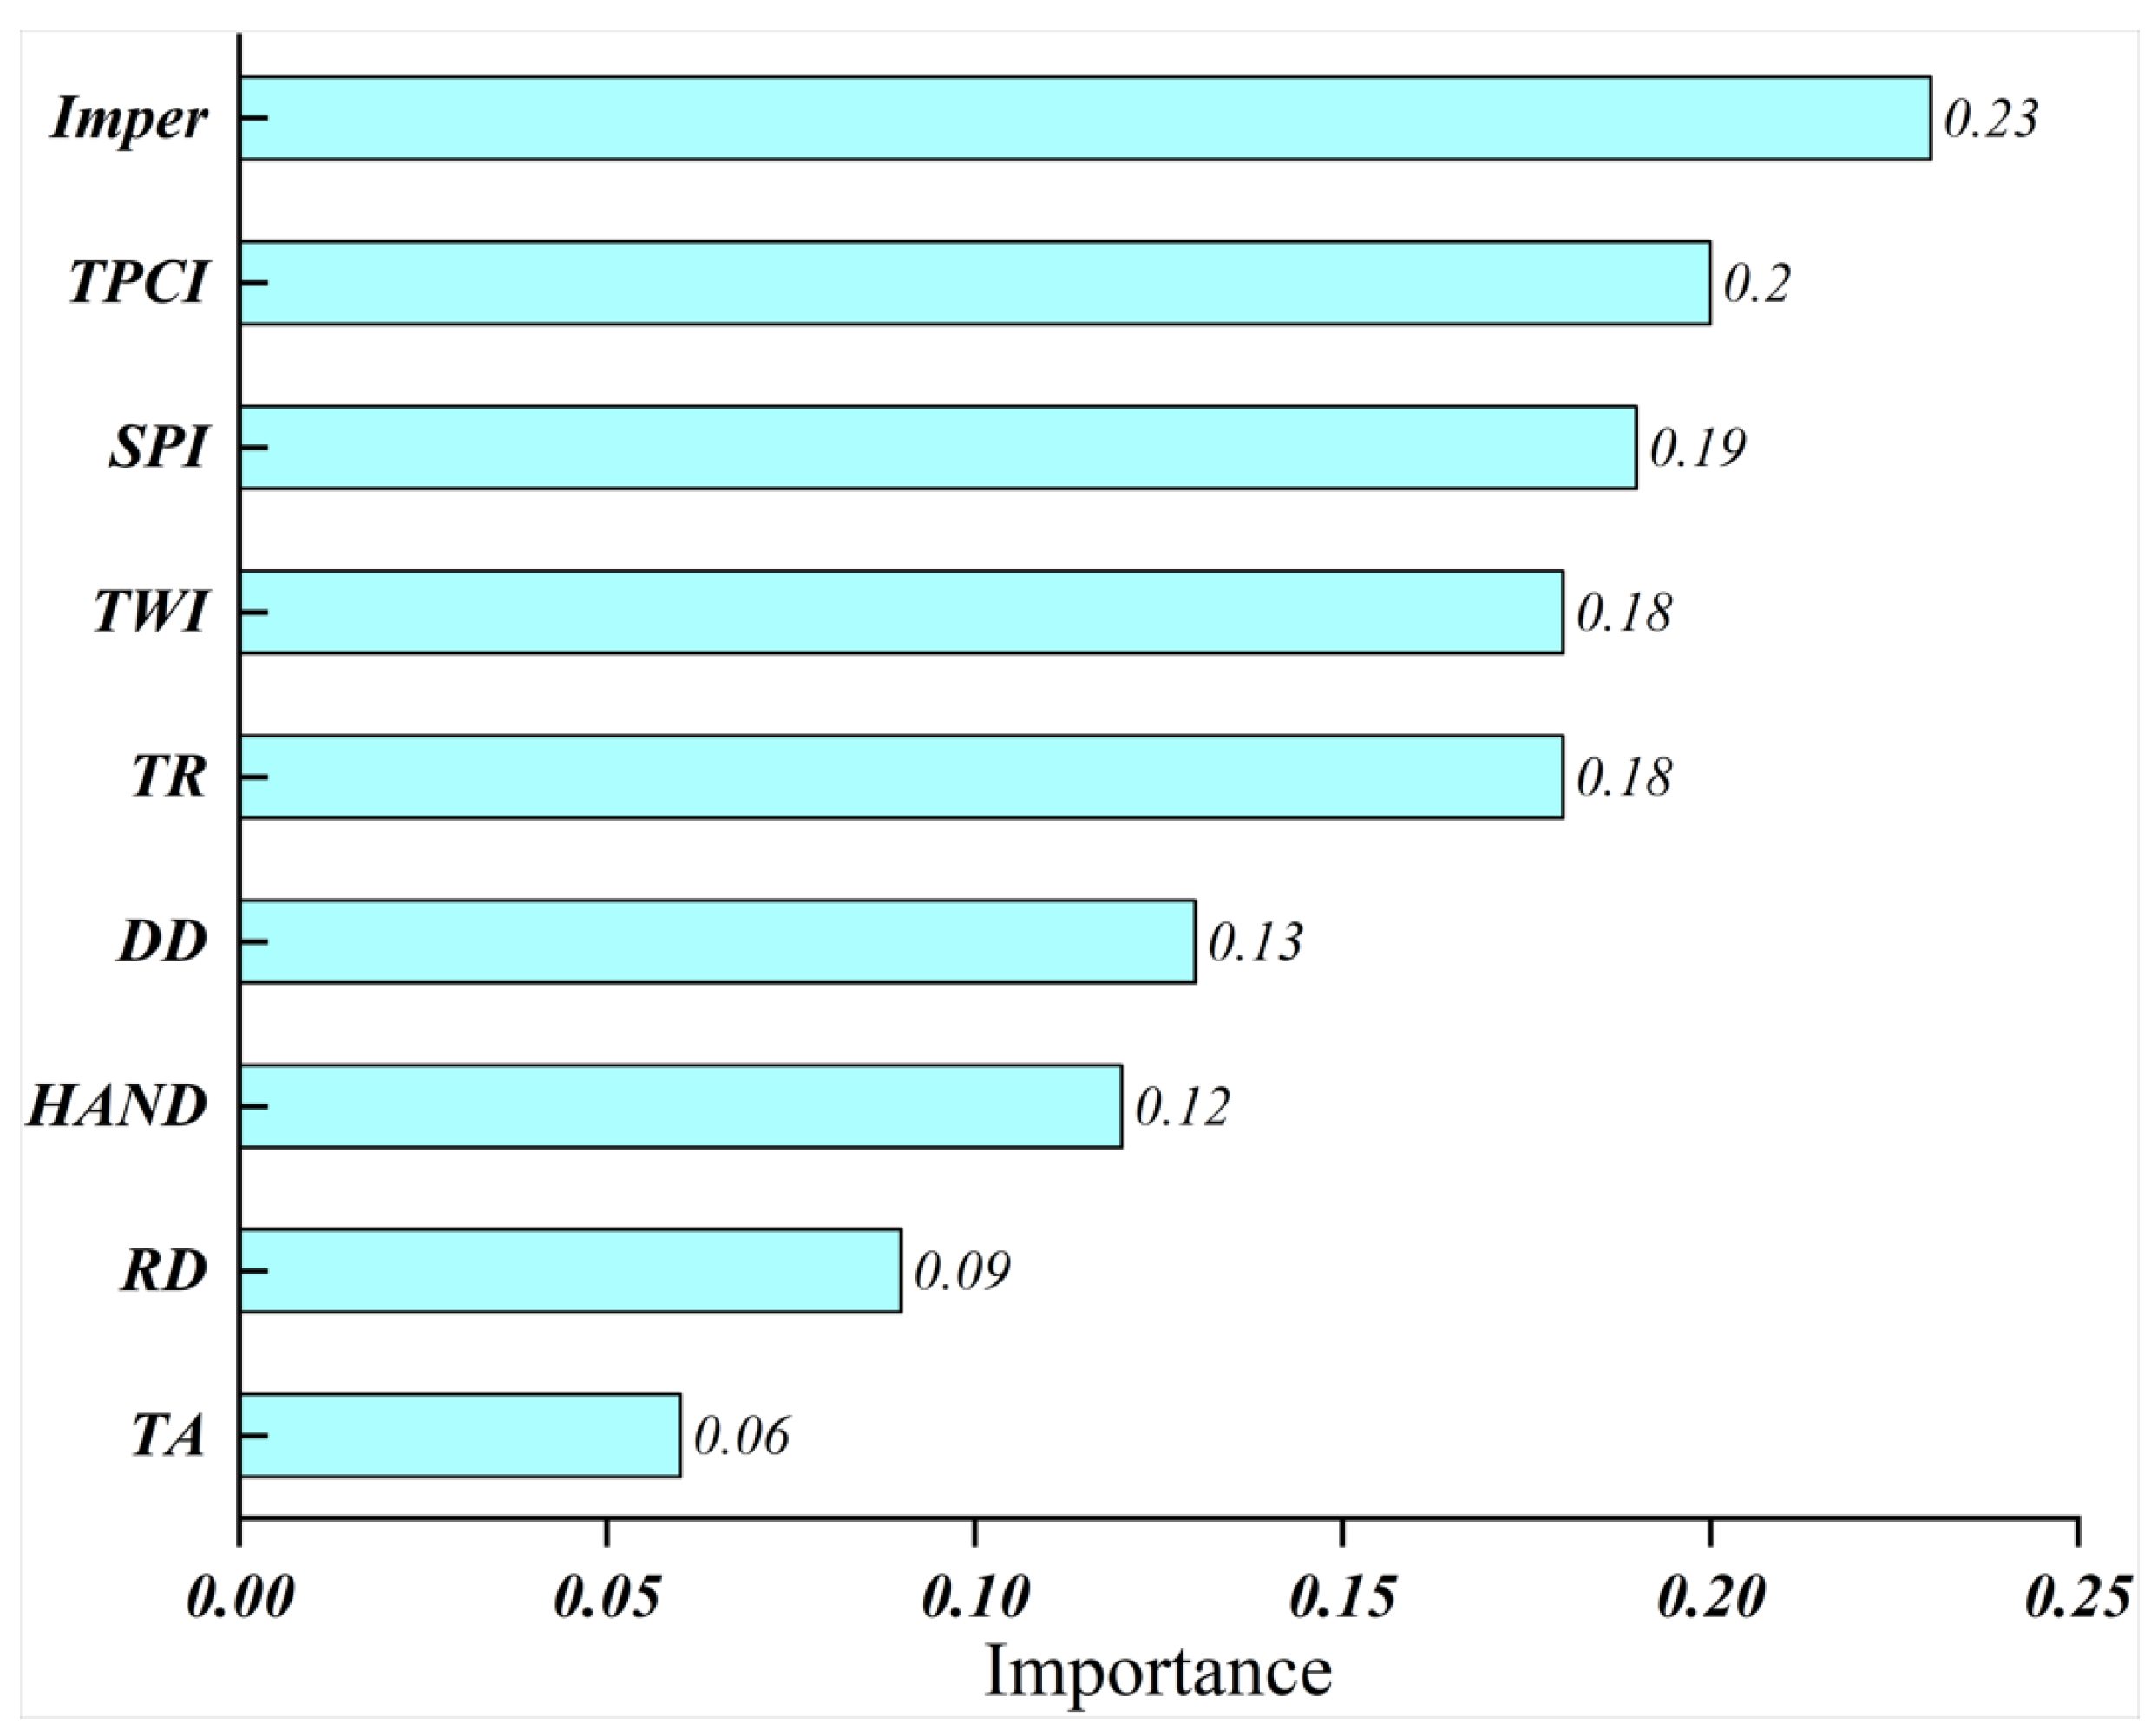
  • A total of 23 initial assessment indices were selected from four aspects: the disaster-causing factor, disaster-pregnant environment, disaster-bearing body, and disaster prevention and reduction capacity. Non-flooded samples were obtained based on the similarity of the flooded area’s geographical environmental features, and the random forest algorithm was used to analyse the importance of the initial indices. Based on the results of the importance analysis, four indices, namely, TS, RC, FVC, and TA, were discarded. Consequently, the urban flood risk assessment index system was constructed using the remaining 19 indices, which not only reduced data noise, but also provided a relatively objective way of screening assessment indices.
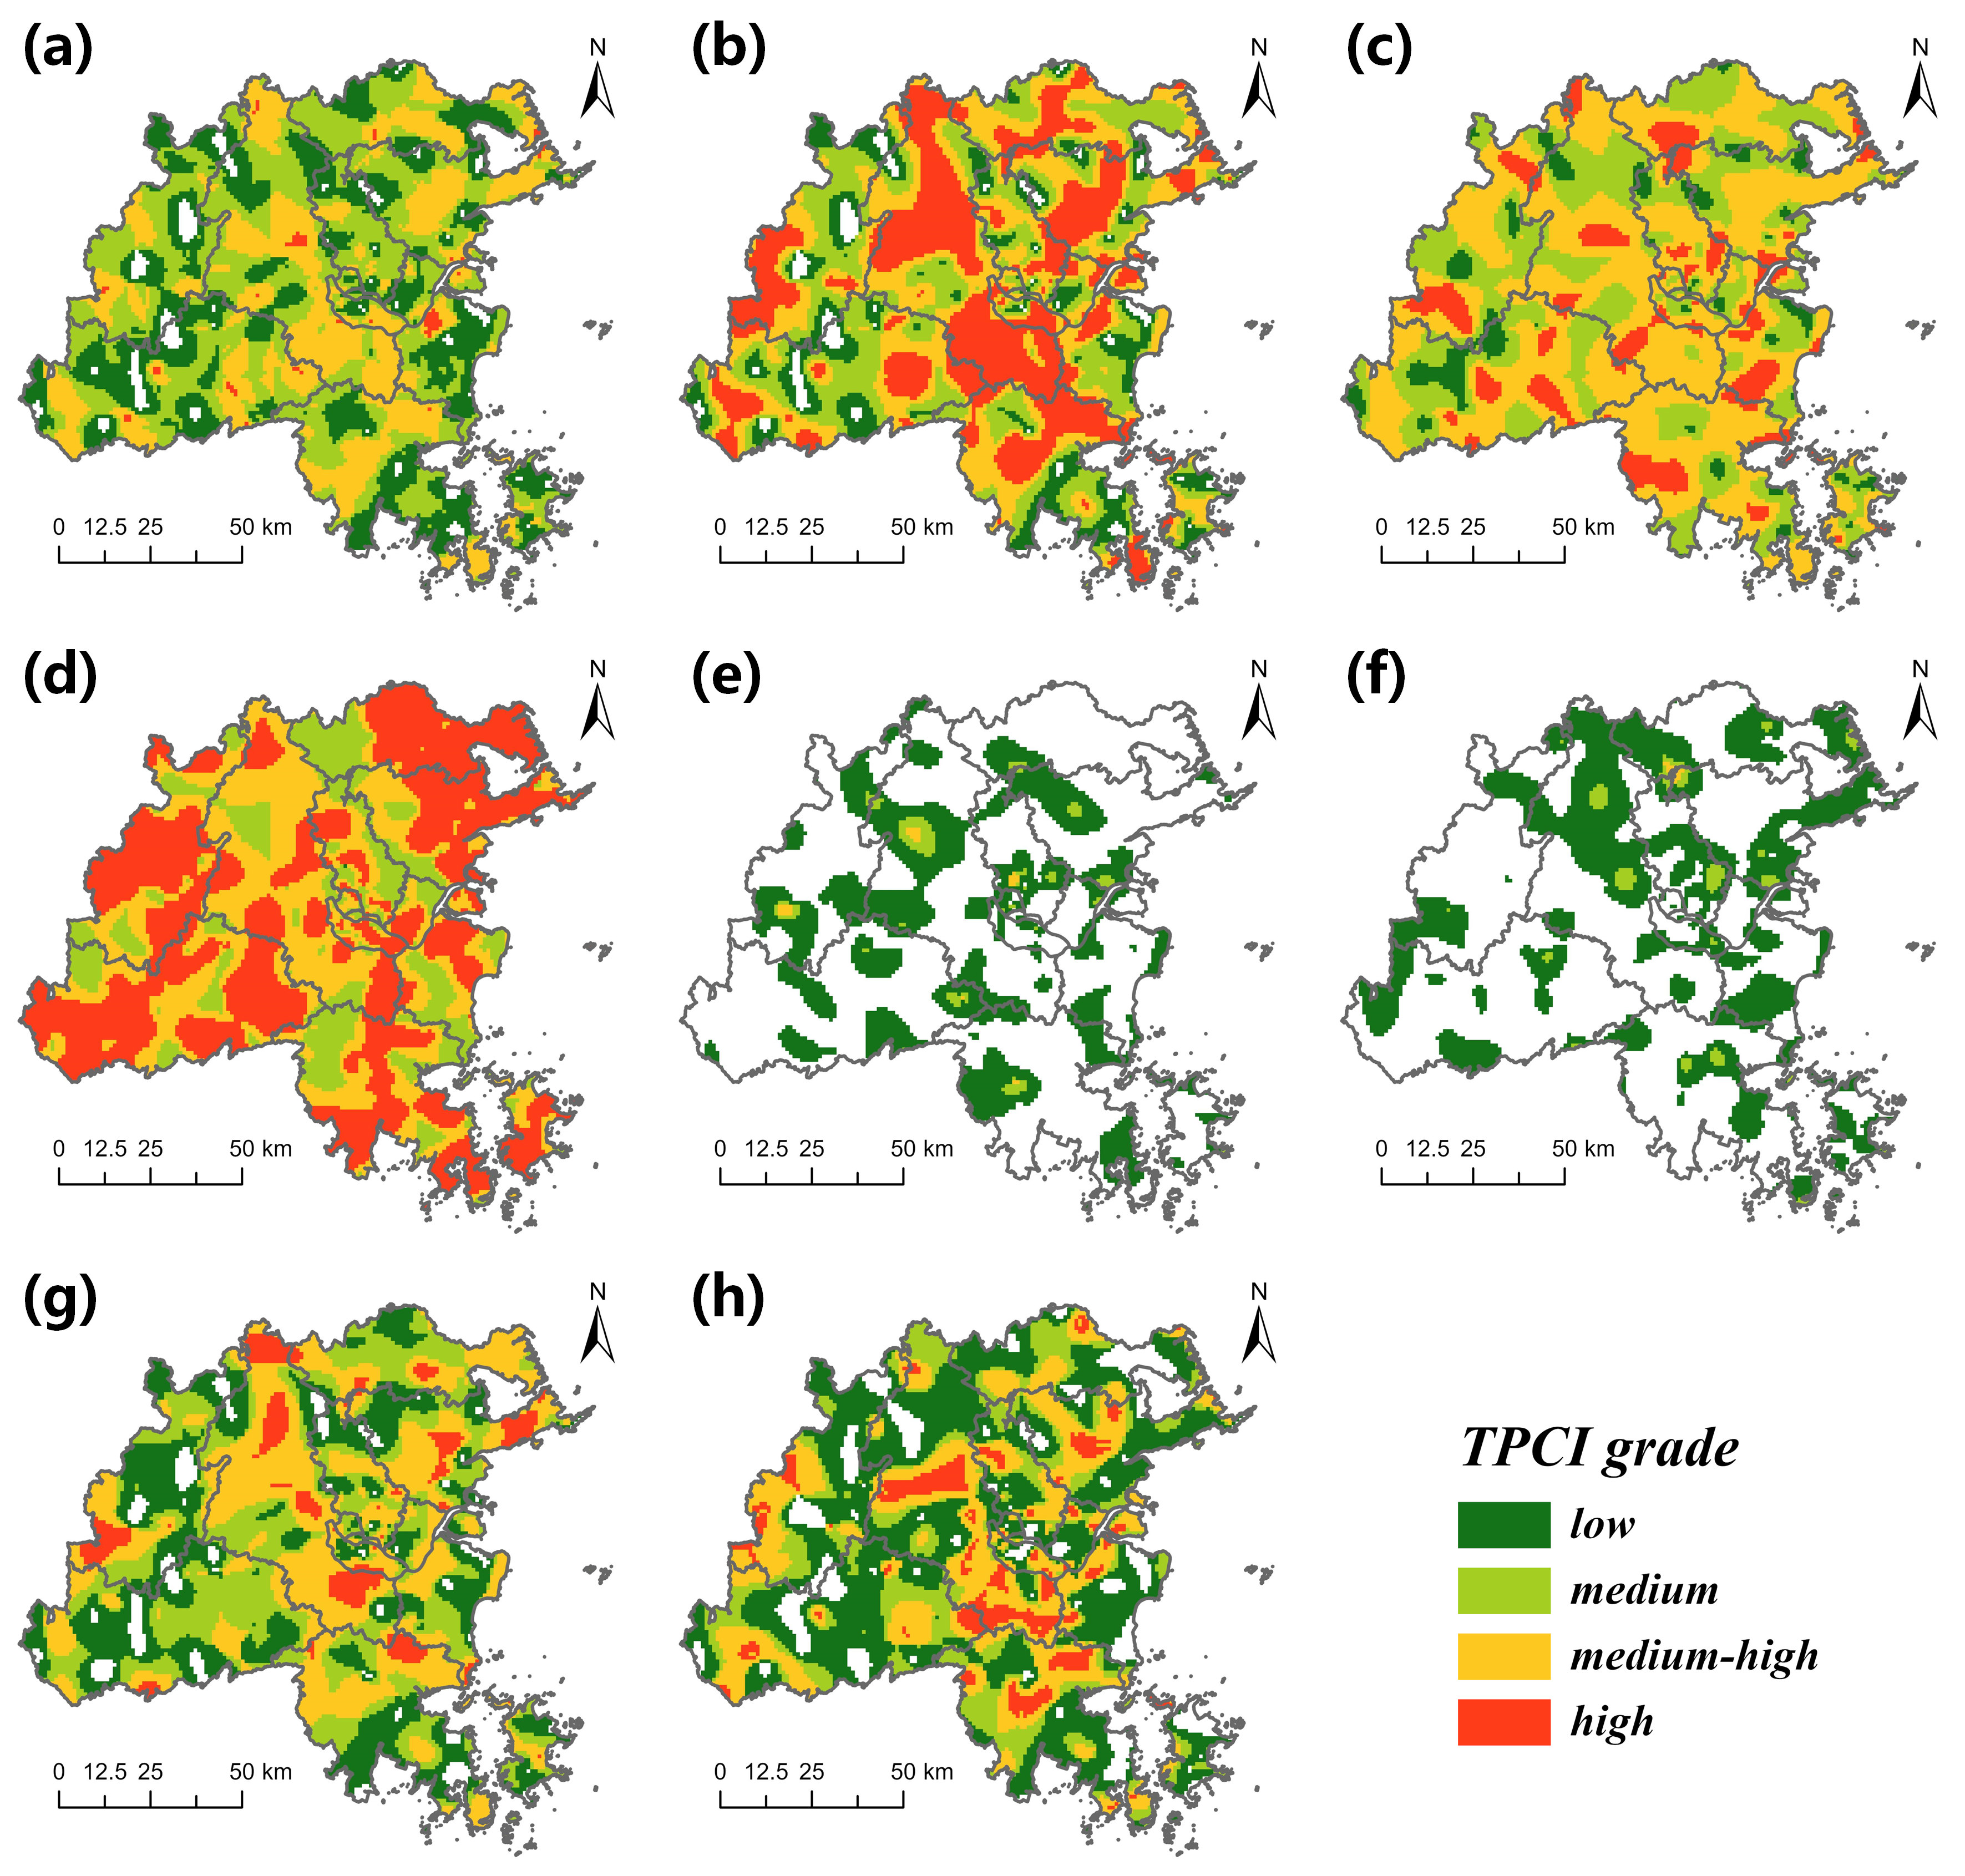
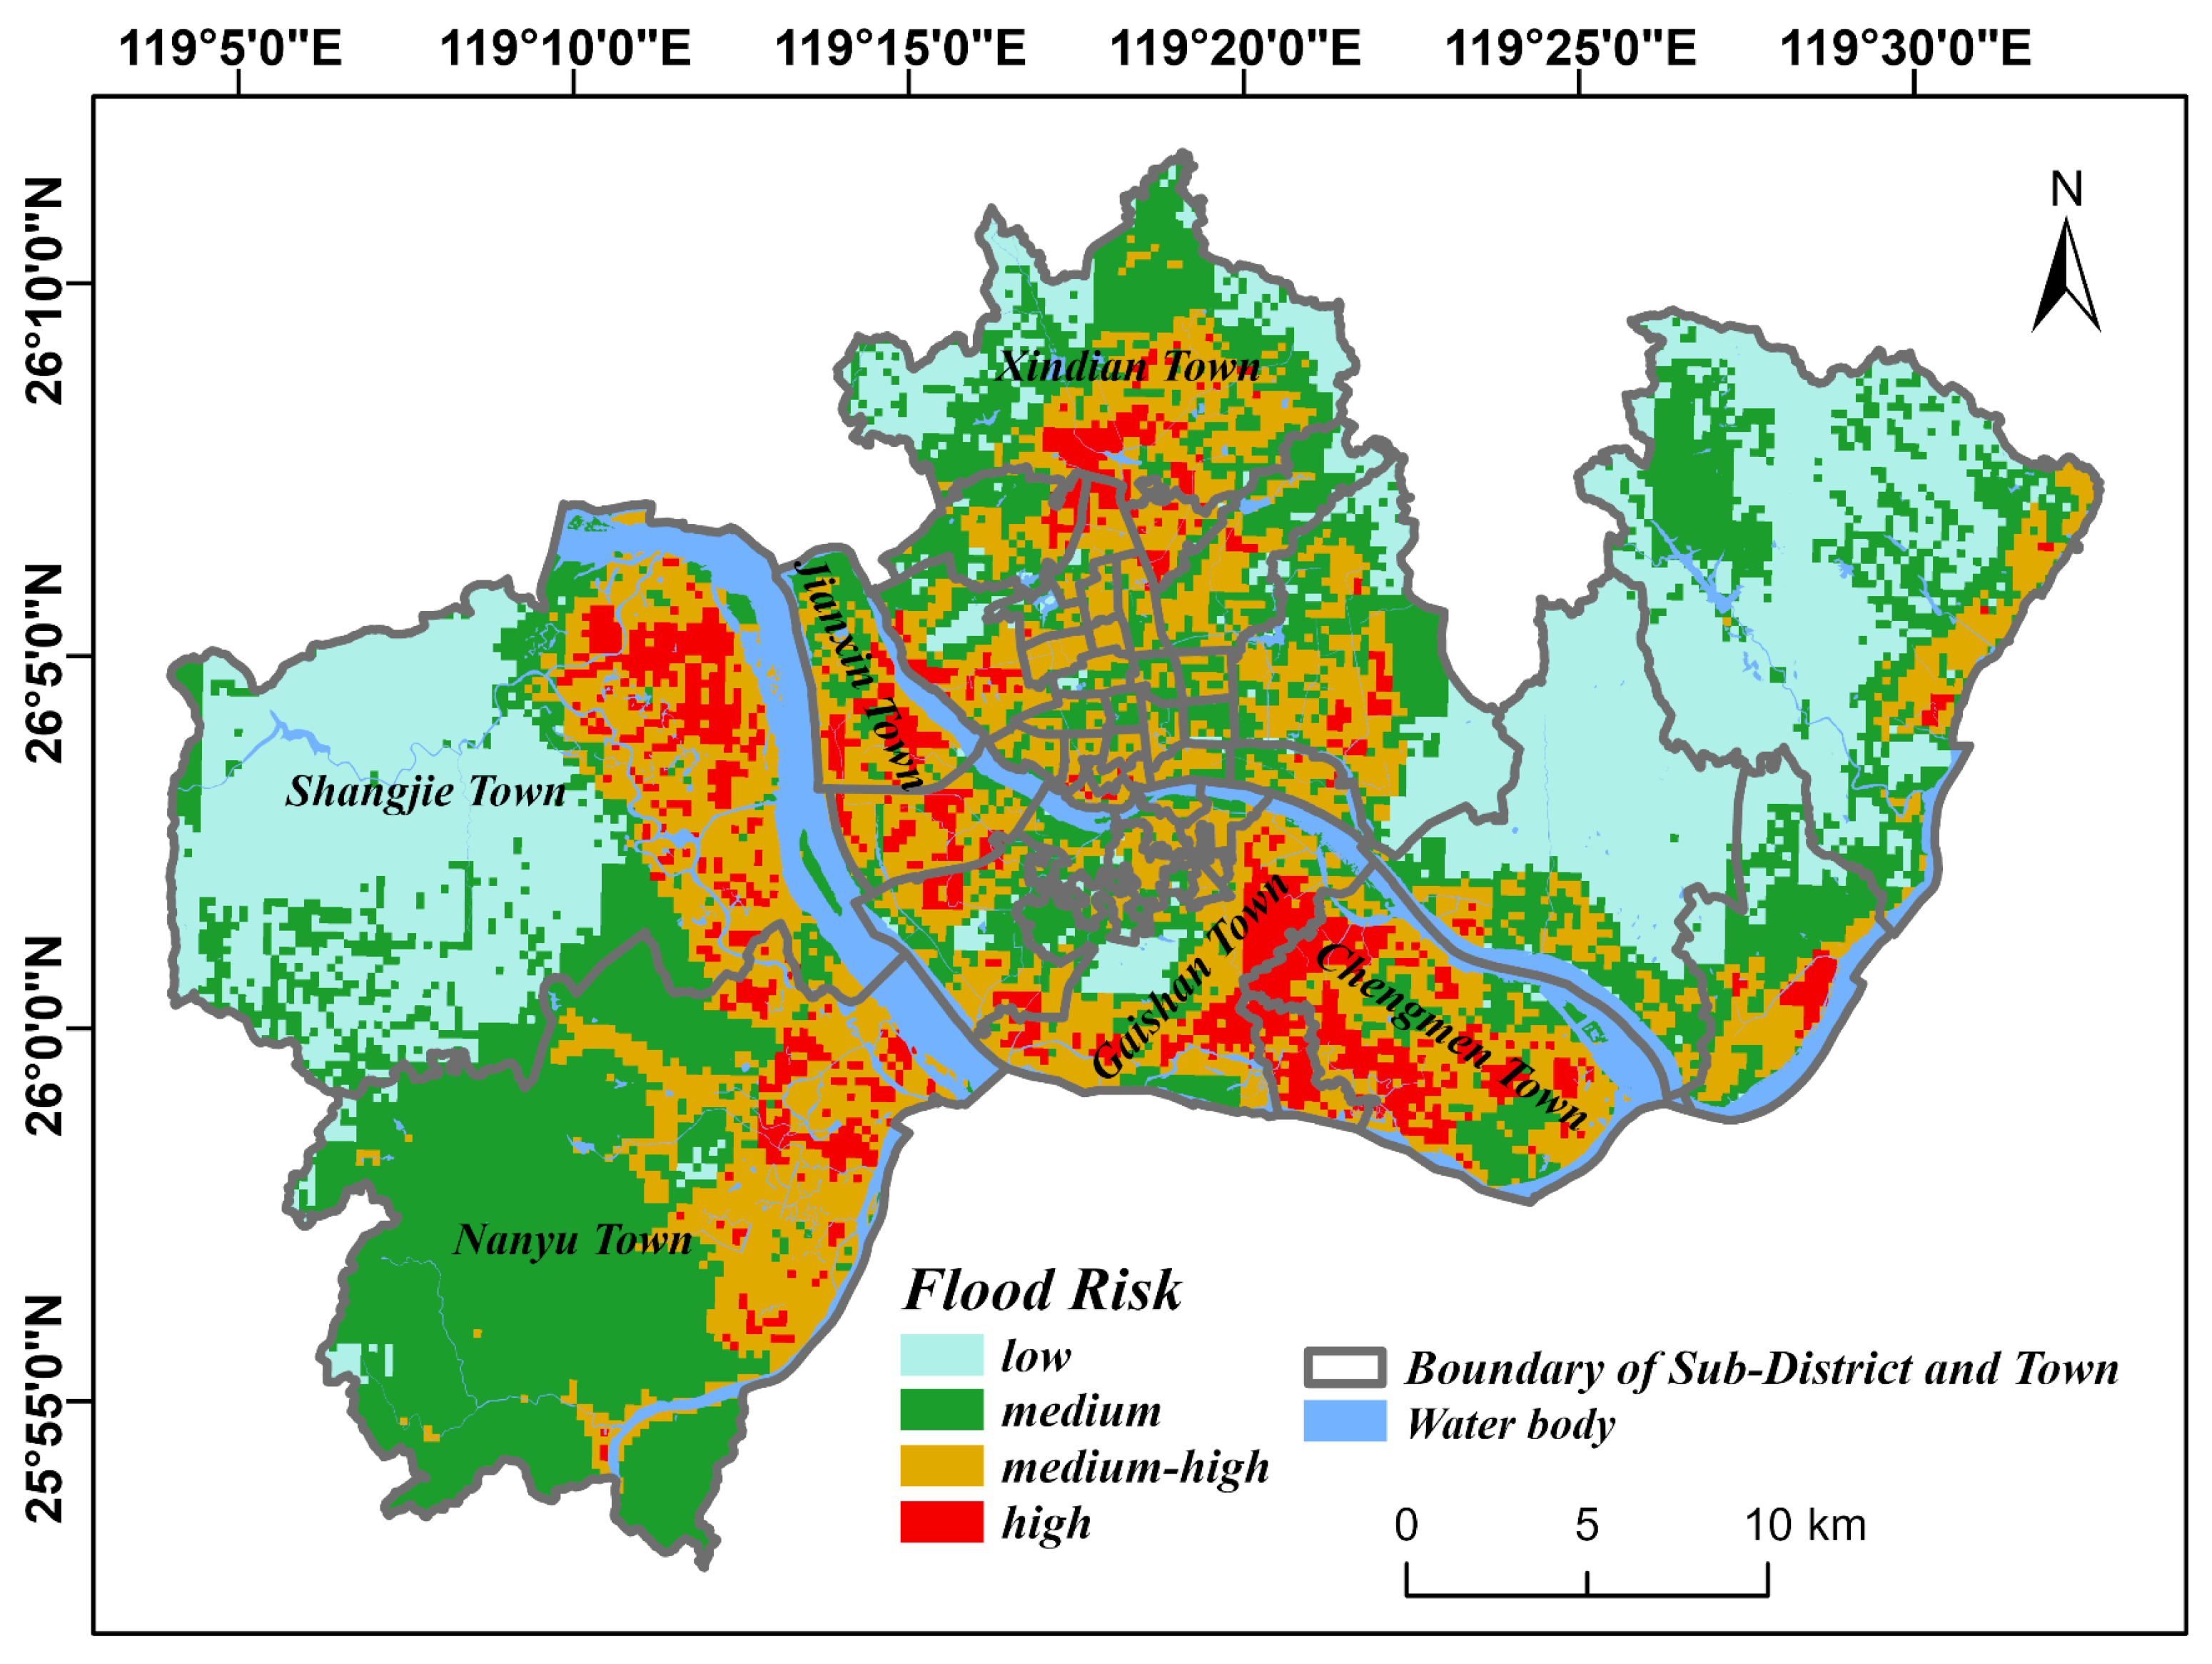
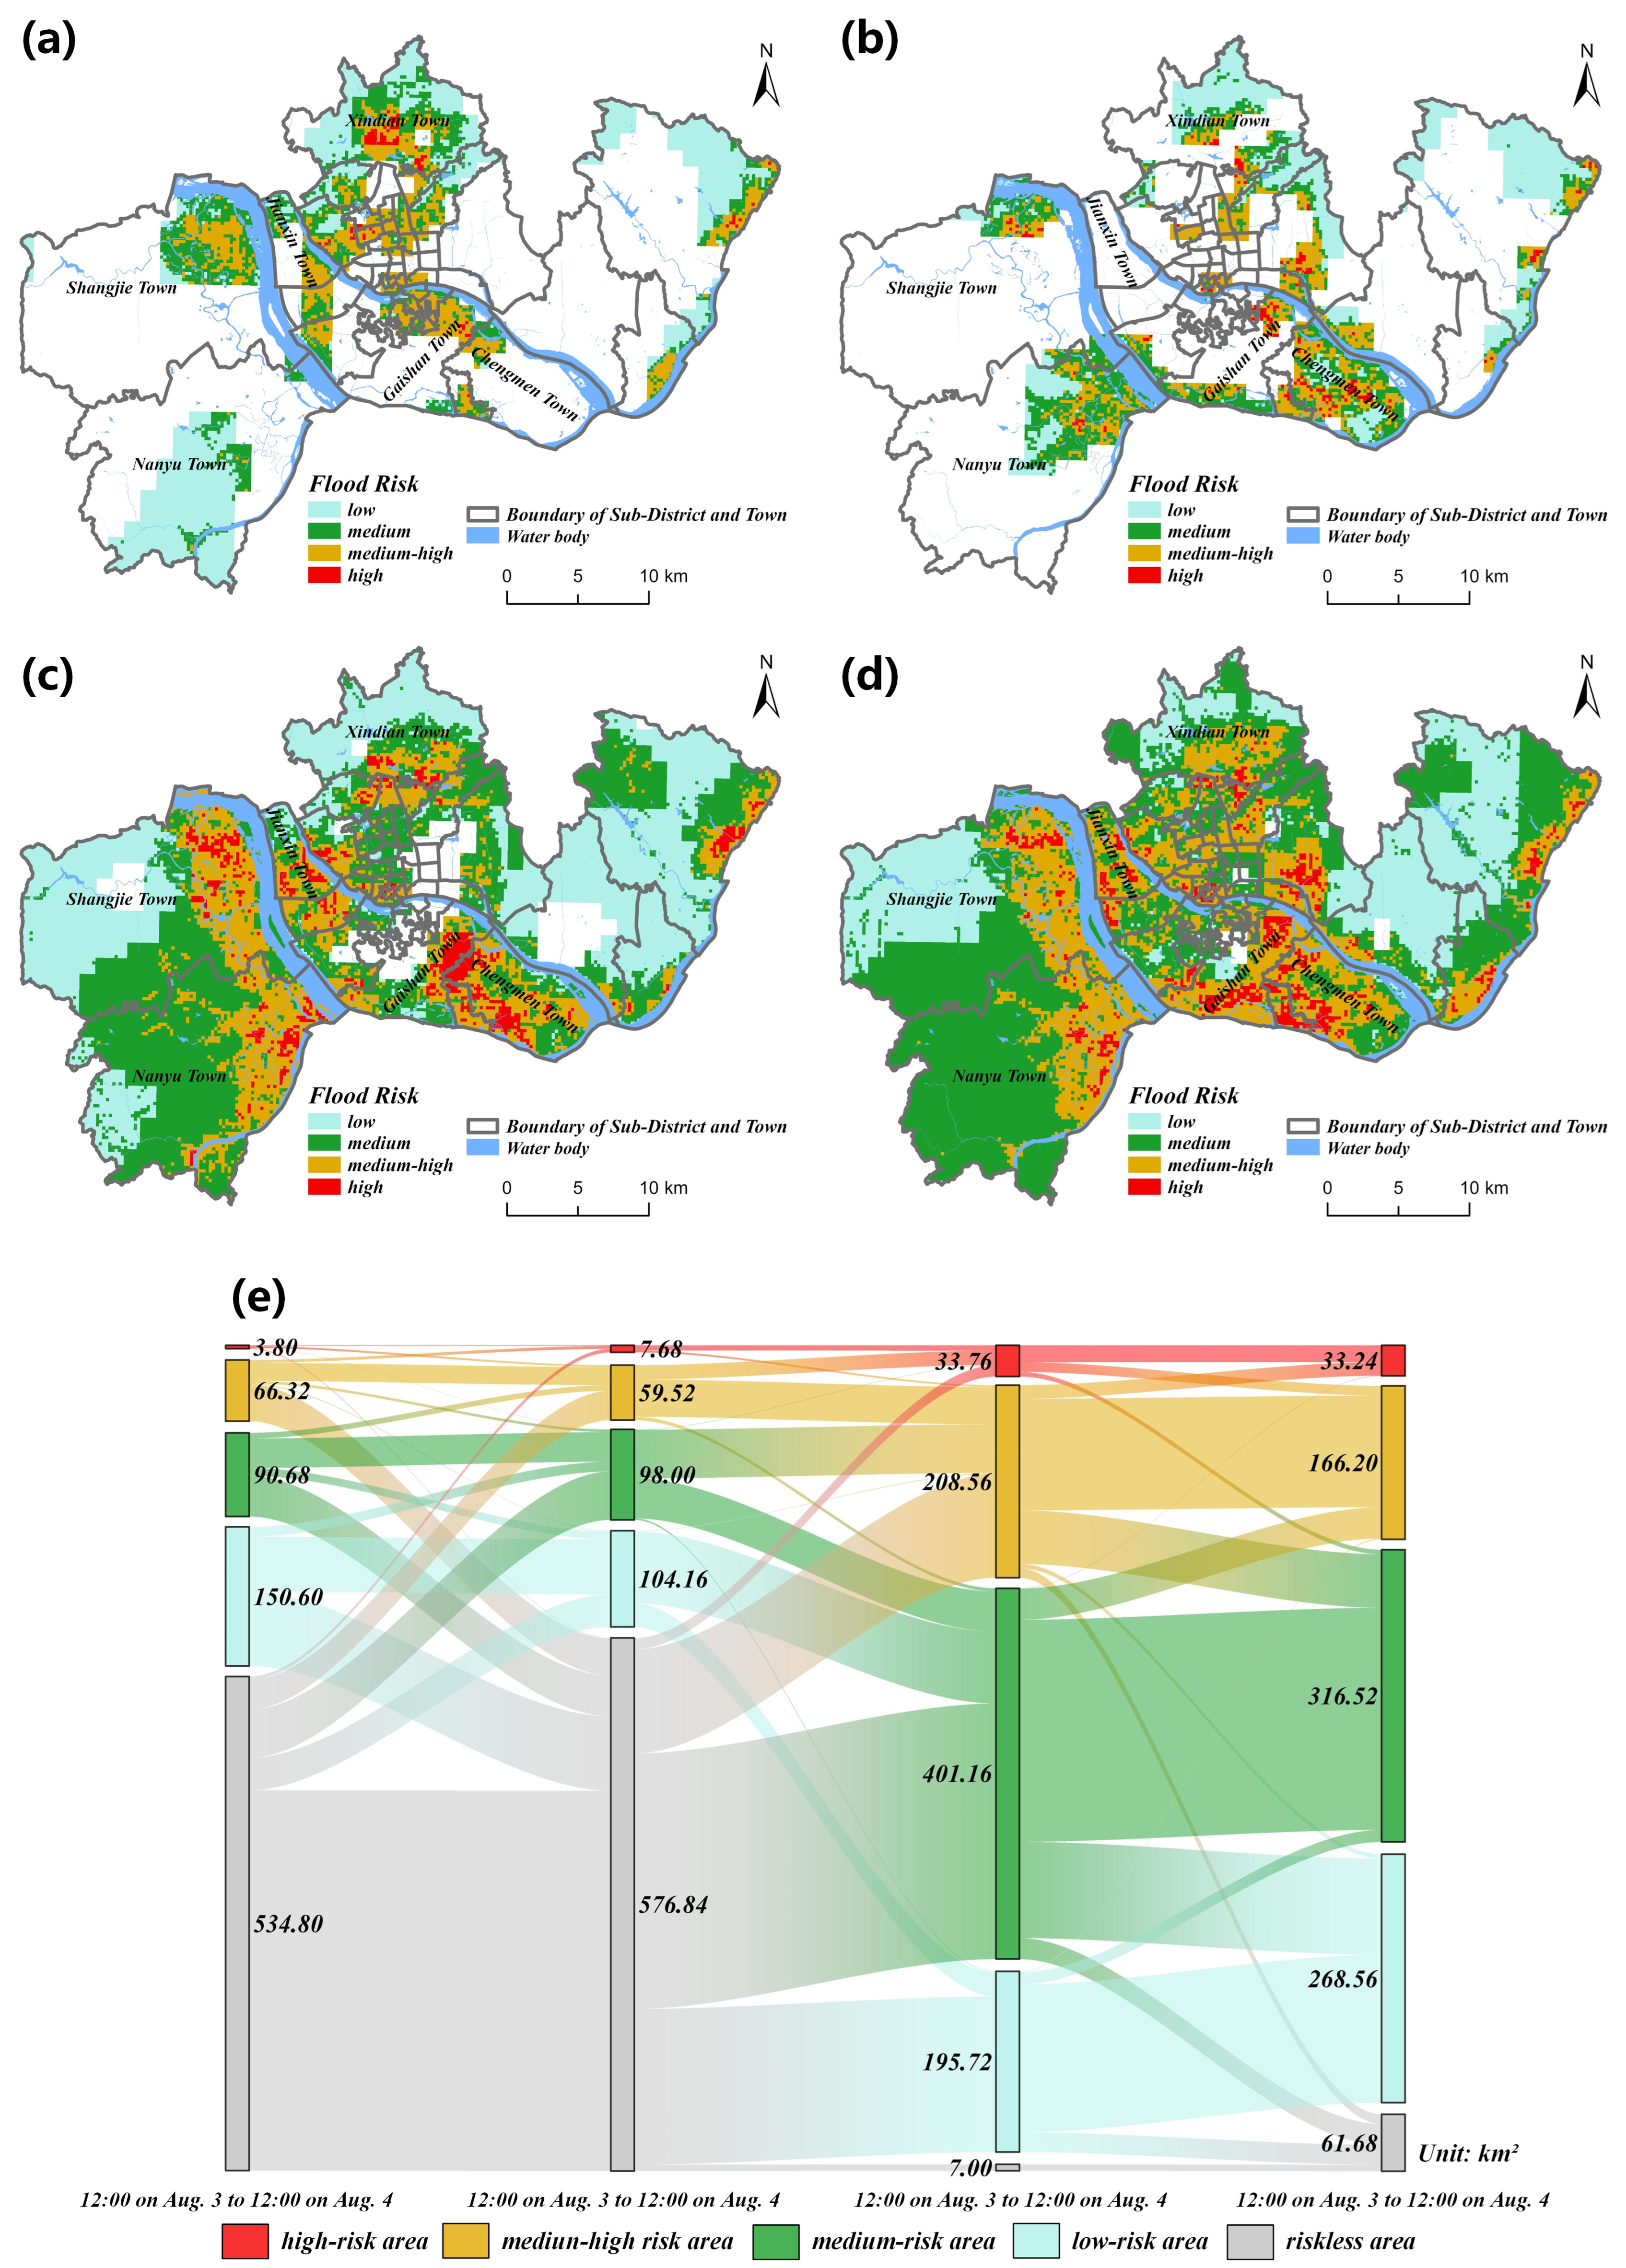
  • By employing the hierarchical analysis process and the RF importance results of the initial indices, the flood disaster risk was quantitatively calculated at both a process time scale and a 24 h time scale based on the TPCI results. At the process time scale, the flood disaster high-risk areas, medium–high-risk areas, medium-risk areas, and low-risk areas accounted for 7.08%, 26.47%, 38.19%, and 28.26% of the total study area, respectively. The areas of medium–high-risk and above were mainly distributed in the southeastern and northwestern parts of Changshan District, northern Minhou County, north–central Jin’an District, and northeastern Gulou District. The flood risk results at the 24 h time scale better reflected the spatial and temporal variability of the disaster risk during typhoon rainfall than the results at the process scale. The extreme rainfall period lagged the landfall of Typhoon “Lupit,” resulting in a sharp increase in the proportion of the area at medium–high-risk and above at a 24 h time scale from 8.29% to 23.57% before the typhoon’s landfall. The high-risk areas after the typhoon’s landfall were mainly located in the towns of Shangjie, Nanyu, and Gaishan, which had a high degree of coincidence with the actual disaster situation and were more relevant to the geographical characteristics of the study area.

8. Recommendations

However, there are still some limitations to this study: (i) To address the limitations of this study and further improve the understanding of flood risk in urban areas, future research could explore additional factors influencing flooding beyond the 23 basic indices used in this study. These factors could include aspects such as soil characteristics, land use, and drainage systems, which may have significant impacts on flood risk, but were not fully considered in this study. (ii) Moreover, the accuracy of the data used in this study could be further improved. While spatial interpolation was used to process some of the data, this technique may have introduced some inaccuracies. Future research could consider using higher-quality gridded data or even collecting new data through field surveys to enhance the accuracy of the input data. (iii) Another potential area for future research is to expand the study to other regions with different geographical and meteorological conditions to examine the generalizability of the findings. This could involve conducting comparative analyses between different regions to better understand the regional differences in flood risk and identify specific factors that contribute to these differences.

Author Contributions

Conceptualization, X.Q. and L.G.; Data curation, X.Q., Y.W. and T.L.; Formal analysis, X.Q., Y.W. and L.G.; Methodology, X.Q. and L.G.; Writing—Original draft, X.Q.; Writing—Review and Editing, X.Q. and L.G.; Visualization, X.Q. and Y.W.; Supervision, L.G.; Project administration, L.G.; Funding acquisition, L.G. All authors have read and agreed to the published version of the manuscript.

Funding

This research was funded by the National Natural Science Foundation of China (Grant No. 42271030) and Fujian Provincial Funds for Distinguished Young Scientists (Grant No. 2022J06018).

Data Availability Statement

The data presented in this study are available from Fujian Provincial Disaster Reduction Center or from http://27.156.118.74:18800/web/html/index.html?module=yqxx, accessed on 20 June 2022, or from http://zygh.fuzhou.gov.cn/, accessed on 20 June 2022.

Conflicts of Interest

The authors declare no conflict of interest.

Appendix A

Table A1. OSAT parameters setting for Typhoon “Lupit” precipitation separation.
Maximum Wind Speed near Typhoon Centre * (m/s)D0 (km)D1 (km)
<17.2300800
≥17.25001100
* Minimum distance of typhoon centre from the Chinese coastline < 300 km.
Figure A1. Disaster-causing factors: (a) TPCI of process; disaster-pregnant environment: (b) impermeability (Imper); (c) topographic relief (TR); (d) stream power index (SPI); (e) topographic wetness index (TWI); (f) depression depth (DD); (g) height above nearest drainage (HAND); (h) river density (RD); (i) topographic slope (TS); (j) runoff coefficient (RC); (k) vegetation coverage (FVC); (l) topographic aspect (TA); disaster-bearing body: (m) population density (PD); (n) GDP density (GD); (o) road network density (RND); (p) the number of key places within 500 m (NKP); disaster prevention and reduction capacity: (q) the number of fire brigades within 3 km (NFB); (r) transfer road network density (TRD); (s) material reserve ratio per 10,000 people (MRT); (t) the capacity of emergency shelters within 500 m (CES); (u) meteorological and hydrological station density (DMHS); (v) funding ratio per 10,000 people (FR); (w) the proportion of health technicians per 10,000 people (PHT).
Remotesensing 15 03116 g0a1aRemotesensing 15 03116 g0a1b
Figure A2. Pearson correlation coefficients of disaster-causing factor and disaster-pregnant environment indices using the sample set.
Remotesensing 15 03116 g0a2
Figure A3. Importance of disaster-causing factor and disaster-pregnant environment indices in the RF model using the sample set.
Remotesensing 15 03116 g0a3
Figure A4. The process line for the typhoon and non-typhoon total precipitation.
Remotesensing 15 03116 g0a4
Figure A5. Accumulated precipitation during the typhoon process obtained by meteorological station data interpolation.
Remotesensing 15 03116 g0a5

References

  1. Yin, J.; Yin, Z.; Xu, S. Composite Risk Assessment of Typhoon-Induced Disaster for China’s Coastal Area. Nat. Hazards 2013, 69, 1423–1434. [Google Scholar] [CrossRef]
  2. Xu, W.; Zhang, M.; Hu, Z.; Guan, X.; Jiang, L.; Bao, R.; Wei, Y.; Ma, M.; Wei, J.; Gao, L. Spatial and Temporal Heterogeneity of Tropical Cyclone Precipitation over China from 1959 to 2018. Front. Environ. Sci. 2022, 10, 1689. [Google Scholar] [CrossRef]
  3. Chien, F.-C.; Kuo, H.-C. On the Extreme Rainfall of Typhoon Morakot (2009). J. Geophys. Res. Atmos. 2011, 116. [Google Scholar] [CrossRef] [Green Version]
  4. Zhou, J.; Sun, M.; Xiang, J.; Guan, J.; Du, H.; Zhou, L. Forecasting the Western Pacific Subtropical High Index during Typhoon Activity Using a Hybrid Deep Learning Model. Acta Oceanol. Sin. 2022, 41, 101–108. [Google Scholar] [CrossRef]
  5. Yumul, G.P.; Servando, N.T.; Suerte, L.O.; Magarzo, M.Y.; Juguan, L.V.V.; Dimalanta, C.B. Tropical Cyclone–Southwest Monsoon Interaction and the 2008 Floods and Landslides in Panay Island, Central Philippines: Meteorological and Geological Factors. Nat. Hazards 2012, 62, 827–840. [Google Scholar] [CrossRef]
  6. Pan, T.-Y.; Yang, Y.-T.; Kuo, H.-C.; Tan, Y.-C.; Lai, J.-S.; Chang, T.-J.; Lee, C.-S.; Hsu, K.H. Improvement of Watershed Flood Forecasting by Typhoon Rainfall Climate Model with an ANN-Based Southwest Monsoon Rainfall Enhancement. J. Hydrol. 2013, 506, 90–100. [Google Scholar] [CrossRef]
  7. Guhathakurta, P.; Rajeevan, M.; Sikka, D.R.; Tyagi, A. Observed Changes in Southwest Monsoon Rainfall over India during 1901–2011: Trend in Southwest Monsoon Rainfall over India. Int. J. Climatol 2015, 35, 1881–1898. [Google Scholar] [CrossRef]
  8. Brand, S.; Blelloch, J.W. Changes in the Characteristics of Typhoons Crossing the Island of Taiwan. Mon. Weather. Rev. 1974, 102, 708–713. [Google Scholar] [CrossRef]
  9. Yeh, T.-C.; Elsberry, R.L. Interaction of Typhoons with the Taiwan Orography. Part I: Upstream Track Deflections. Mon. Weather. Rev. 1993, 121, 3193–3212. [Google Scholar] [CrossRef]
  10. Yeh, T.-C.; Elsberry, R.L. Interaction of Typhoons with the Taiwan Orography. Part II: Continuous and Discontinuous Tracks across the Island. Mon. Weather. Rev. 1993, 121, 3213–3233. [Google Scholar] [CrossRef]
  11. Wang, C.; Wu, J.; Buren, J.; Guo, E.; Liang, H. Modeling the Inter-Regional Economic Consequences of Sequential Typhoon Disasters in China. J. Clean. Prod. 2021, 298, 126740. [Google Scholar] [CrossRef]
  12. Yin, J.; Gu, H.; Liang, X.; Yu, M.; Sun, J.; Xie, Y.; Li, F.; Wu, C. A Possible Dynamic Mechanism for Rapid Production of the Extreme Hourly Rainfall in Zhengzhou City on 20 July 2021. J. Meteorol. Res. 2022, 36, 6–25. [Google Scholar] [CrossRef]
  13. Zhao, X.; Li, H.; Qi, Y. Are Chinese Cities Prepared to Manage the Risks of Extreme Weather Events? Evidence from the 2021.07.20 Zhengzhou Flood in Henan Province. SSRN J. 2022, 20. [Google Scholar] [CrossRef]
  14. Guo, X.; Cheng, J.; Yin, C.; Li, Q.; Chen, R.; Fang, J. The Extraordinary Zhengzhou Flood of 7/20, 2021: How Extreme Weather and Human Response Compounding to the Disaster. Cities 2023, 134, 104168. [Google Scholar] [CrossRef]
  15. Sivapalan, M.; Savenije, H.H.G.; Blöschl, G. Socio-Hydrology: A New Science of People and Water. Hydrol. Process. 2012, 26, 1270–1276. [Google Scholar] [CrossRef]
  16. Madani, K.; Shafiee-Jood, M. Socio-Hydrology: A New Understanding to Unite or a New Science to Divide? Water 2020, 12, 1941. [Google Scholar] [CrossRef]
  17. Witkowski, K. The Development of the Use of Water Energy in the Mountain Catchment from a Sociohydrological Perspective. Energies 2022, 15, 7770. [Google Scholar] [CrossRef]
  18. Zhu, W.; Cao, Z.; Luo, P.; Tang, Z.; Zhang, Y.; Hu, M.; He, B. Urban Flood-Related Remote Sensing: Research Trends, Gaps and Opportunities. Remote Sens. 2022, 14, 5505. [Google Scholar] [CrossRef]
  19. Luo, P.; Luo, M.; Li, F.; Qi, X.; Huo, A.; Wang, Z.; He, B.; Takara, K.; Nover, D.; Wang, Y. Urban Flood Numerical Simulation: Research, Methods and Future Perspectives. Environ. Model. Softw. 2022, 156, 105478. [Google Scholar] [CrossRef]
  20. Titley, H.A.; Cloke, H.L.; Harrigan, S.; Pappenberger, F.; Prudhomme, C.; Robbins, J.C.; Stephens, E.M.; Zsoter, E. Key Factors Influencing the Severity of Fluvial Flood Hazard from Tropical Cyclones. J. Hydrometeorol. 2021, 22, 1801–1817. [Google Scholar] [CrossRef]
  21. Wang, Y.; Zhang, X.; Tang, Q.; Mu, M.; Zhang, C.; Lv, A.; Jia, S. Assessing Flood Risk in Baiyangdian Lake Area in a Changing Climate Using an Integrated Hydrological-Hydrodynamic Modelling. Hydrol. Sci. J. 2019, 64, 2006–2014. [Google Scholar] [CrossRef]
  22. Tew, Y.L.; Tan, M.L.; Juneng, L.; Chun, K.P.; bin Hassan, M.H.; bin Osman, S.; Samat, N.; Chang, C.K.; Kabir, M.H. Rapid Extreme Tropical Precipitation and Flood Inundation Mapping Framework (RETRACE): Initial Testing for the 2021–2022 Malaysia Flood. IJGI 2022, 11, 378. [Google Scholar] [CrossRef]
  23. Wang, Z.; Lai, C.; Chen, X.; Yang, B.; Zhao, S.; Bai, X. Flood Hazard Risk Assessment Model Based on Random Forest. J. Hydrol. 2015, 527, 1130–1141. [Google Scholar] [CrossRef]
  24. Richardson, D.; Neal, R.; Dankers, R.; Mylne, K.; Cowling, R.; Clements, H.; Millard, J. Linking Weather Patterns to Regional Extreme Precipitation for Highlighting Potential Flood Events in Medium- to Long-range Forecasts. Meteorol. Appl. 2020, 27, e1931. [Google Scholar] [CrossRef]
  25. Yin, D.; Xue, Z.G.; Bao, D.; RafieeiNasab, A.; Huang, Y.; Morales, M.; Warner, J.C. Understanding the Role of Initial Soil Moisture and Precipitation Magnitude in Flood Forecast Using a Hydrometeorological Modelling System. Hydrol. Process. 2022, 36, e14710. [Google Scholar] [CrossRef]
  26. Chan, S.C.; Kendon, E.J.; Fowler, H.J.; Blenkinsop, S.; Roberts, N.M.; Ferro, C.A.T. The Value of High-Resolution Met Office Regional Climate Models in the Simulation of Multihourly Precipitation Extremes. J. Clim. 2014, 27, 6155–6174. [Google Scholar] [CrossRef] [Green Version]
  27. Arnaud, P.; Cantet, P.; Aubert, Y. Relevance of an At-Site Flood Frequency Analysis Method for Extreme Events Based on Stochastic Simulation of Hourly Rainfall. Hydrol. Sci. J. 2016, 61, 36–49. [Google Scholar] [CrossRef] [Green Version]
  28. Ramos Filho, G.M.; Coelho, V.H.R.; Freitas, E.d.S.; Xuan, Y.; Almeida, C.d.N. An Improved Rainfall-Threshold Approach for Robust Prediction and Warning of Flood and Flash Flood Hazards. Nat. Hazards 2021, 105, 2409–2429. [Google Scholar] [CrossRef]
  29. Sharma, A.; Wasko, C.; Lettenmaier, D.P. If Precipitation Extremes Are Increasing, Why Aren’t Floods? Water Resour. Res. 2018, 54, 8545–8551. [Google Scholar] [CrossRef]
  30. Hettiarachchi, S.; Wasko, C.; Sharma, A. Can Antecedent Moisture Conditions Modulate the Increase in Flood Risk Due to Climate Change in Urban Catchments? J. Hydrol. 2019, 571, 11–20. [Google Scholar] [CrossRef]
  31. He, S.; Wang, Z.; Wang, D.; Liao, W.; Wu, X.; Lai, C. Spatiotemporal Variability of Event-Based Rainstorm: The Perspective of Rainfall Pattern and Concentration. Int. J. Climatol. 2022, 42, 6258–6276. [Google Scholar] [CrossRef]
  32. Zhang, M.; Xu, M.; Wang, Z.; Lai, C. Assessment of the Vulnerability of Road Networks to Urban Waterlogging Based on a Coupled Hydrodynamic Model. J. Hydrol. 2021, 603, 127105. [Google Scholar] [CrossRef]
  33. Braud, I.; Crochet, P.; Creutin, J.D. Climatological Identification of the Non-Stationarities of Intermittent Precipitation Fields; Soares, A., Ed.; Springer: Dordrecht, The Netherlands, 1993; Volume 5, pp. 589–600. [Google Scholar]
  34. Schleiss, M. A New Discrete Multiplicative Random Cascade Model for Downscaling Intermittent Rainfall Fields 2019. Hydrol. Earth Syst. Sci. 2020, 24, 3699–3723. [Google Scholar] [CrossRef]
  35. Hess, P.; Boers, N. Deep Learning for Improving Numerical Weather Prediction of Heavy Rainfall. J. Adv. Model. Earth Syst. 2022, 14, e2021MS002765. [Google Scholar] [CrossRef]
  36. Winters, B.A.; Angel, J.R.; Ballerine, C.; Byard, J.L.; Flegel, A.; Gambill, D.; Jenkins, E.; McConkey, S.A.; Markus, M.; Bender, B.A.; et al. Report for the Urban Flooding Awareness Act; University Library: Urbana, IL, USA, 2015. [Google Scholar]
  37. Kron, W. Keynote Lecture: Flood Risk = Hazard × Exposure × Vulnerability. Proc. Flood Def. 2002, 82–97. [Google Scholar]
  38. Chaochao, L.; Xiaotao, C.; Na, L.; Xiaohe, D.; Qian, Y.; Guangyuan, K. A Framework for Flood Risk Analysis and Benefit Assessment of Flood Control Measures in Urban Areas. Int. J. Environ. Res. Public Health 2016, 13, 787. [Google Scholar]
  39. Wu, Z.; Xue, W.; Xu, H.; Yan, D.; Wang, H.; Qi, W. Urban Flood Risk Assessment in Zhengzhou, China, Based on a D-Number-Improved Analytic Hierarchy Process and a Self-Organizing Map Algorithm. Remote Sens. 2022, 14, 4777. [Google Scholar] [CrossRef]
  40. Wang, S.; Luo, P.; Xu, C.; Zhu, W.; Cao, Z.; Ly, S. Reconstruction of Historical Land Use and Urban Flood Simulation in Xi’an, Shannxi, China. Remote Sens. 2022, 14, 6067. [Google Scholar] [CrossRef]
  41. Zhang, H.; Zhang, J.; Han, J. The Assessment and Regionalization of Flood/Waterlogging Disaster Risk in Middle and Lower Reaches of Liao River of Northeast China. In Proceedings of the Fifth Annual IIASA-DPRI Forum on Integrated Disaster Risk Management, Beijing, China, 14–18 September 2005. [Google Scholar]
  42. Duan, C.; Zhang, J.; Chen, Y.; Lang, Q.; Zhang, Y.; Wu, C.; Zhang, Z. Comprehensive Risk Assessment of Urban Waterlogging Disaster Based on MCDA-GIS Integration: The Case Study of Changchun, China. Remote Sens. 2022, 14, 3101. [Google Scholar] [CrossRef]
  43. Costache, R.; Pham, Q.B.; Avand, M.; Thuy Linh, N.T.; Vojtek, M.; Vojteková, J.; Lee, S.; Khoi, D.N.; Thao Nhi, P.T.; Dung, T.D. Novel Hybrid Models between Bivariate Statistics, Artificial Neural Networks and Boosting Algorithms for Flood Susceptibility Assessment. J. Environ. Manag. 2020, 265, 110485. [Google Scholar] [CrossRef]
  44. Du, W.; Gong, Y.; Chen, N. PSO-WELLSVM: An Integrated Method and Its Application in Urban Waterlogging Susceptibility Assessment in the Central Wuhan, China. Comput. Geosci. 2022, 161, 105079. [Google Scholar] [CrossRef]
  45. Arora, A.; Arabameri, A.; Pandey, M.; Siddiqui, M.A.; Shukla, U.K.; Bui, D.T.; Mishra, V.N.; Bhardwaj, A. Optimization of State-of-the-Art Fuzzy-Metaheuristic ANFIS-Based Machine Learning Models for Flood Susceptibility Prediction Mapping in the Middle Ganga Plain, India. Sci. Total Environ. 2021, 750, 141565. [Google Scholar] [CrossRef] [PubMed]
  46. Fang, L.; Huang, J.; Cai, J.; Nitivattananon, V. Hybrid Approach for Flood Susceptibility Assessment in a Flood-Prone Mountainous Catchment in China. J. Hydrol. 2022, 612, 128091. [Google Scholar] [CrossRef]
  47. Moghadas, M.; Asadzadeh, A.; Vafeidis, A.; Fekete, A.; Kötter, T. A Multi-Criteria Approach for Assessing Urban Flood Resilience in Tehran, Iran. Int. J. Disaster Risk Reduct. 2019, 35, 101069. [Google Scholar] [CrossRef]
  48. Bertilsson, L.; Wiklund, K.; de Moura Tebaldi, I.; Rezende, O.M.; Veról, A.P.; Miguez, M.G. Urban Flood Resilience—A Multi-Criteria Index to Integrate Flood Resilience into Urban Planning. J. Hydrol. 2019, 573, 970–982. [Google Scholar] [CrossRef]
  49. Clerici, A.; Perego, S.; Tellini, C.; Vescovi, P. A Procedure for Landslide Susceptibility Zonation by the Conditional Analysis Method. Geomorphology 2002, 48, 349–364. [Google Scholar] [CrossRef]
  50. Qi, F.; Zhu, A.-X. Knowledge Discovery from Soil Maps Using Inductive Learning. Int. J. Geogr. Inf. Sci. 2003, 17, 771–795. [Google Scholar] [CrossRef]
  51. Zhu, A.-X.; Zhang, G.; Wang, W.; Xiao, W.; Huang, Z.-P.; Dunzhu, G.-S.; Ren, G.; Qin, C.-Z.; Yang, L.; Pei, T.; et al. A Citizen Data-Based Approach to Predictive Mapping of Spatial Variation of Natural Phenomena. Int. J. Geogr. Inf. Sci. 2015, 29, 1864–1886. [Google Scholar] [CrossRef]
  52. Shi, P. Theory on Disaster Science and Disaster Dynamics. J. Nat. Disasters 2002, 11, 1–9. [Google Scholar]
  53. Shi, P. Theory and Practice on Disaster System Research in a Fourth Time. J. Nat. Disasters 2005, 14, 1–7. [Google Scholar]
  54. Sørensen, R.; Zinko, U.; Seibert, J. On the Calculation of the Topographic Wetness Index: Evaluation of Different Methods Based on Field Observations. Hydrol. Earth Syst. Sci. 2006, 10, 101–112. [Google Scholar] [CrossRef] [Green Version]
  55. Florinsky, I.V. Chapter 9—Influence of Topography on Soil Properties. In Digital Terrain Analysis in Soil Science and Geology, 2nd ed.; Florinsky, I.V., Ed.; Academic Press: Cambridge, MA, USA, 2016; pp. 265–270. ISBN 978-0-12-804632-6. [Google Scholar]
  56. Rennó, C.D.; Nobre, A.D.; Cuartas, L.A.; Soares, J.V.; Hodnett, M.G.; Tomasella, J.; Waterloo, M.J. HAND, a New Terrain Descriptor Using SRTM-DEM: Mapping Terra-Firme Rainforest Environments in Amazonia. Remote Sens. Environ. 2008, 112, 3469–3481. [Google Scholar] [CrossRef]
  57. Ren, F.; Gleason, B.; Easterling, D. A Numerical Technique for Partitioning Cyclone Tropical Precipitation. J. Trop. Meteorol. 2001, 17, 308–313. [Google Scholar]
  58. Wang, Y.; Ren, F.; Wang, W.X.; Li, W.; Shao, D. The Study on the Objective Technique for Partitioning Tropical Cyclone Precipitation in China. Meteorol. Mon. 2006, 6–10. [Google Scholar]
  59. Ren, F.; Wang, Y.; Wang, X.; Li, W. Estimating Tropical Cyclone Precipitation from Station Observations. Adv. Atmos. Sci. 2007, 24, 700–711. [Google Scholar] [CrossRef]
  60. Wang, L.; Wang, X.; Wang, W. Research and application of comprehensive intensity evaluation method for regional rainfall process in China. J. Nat. Disasters 2015, 24, 186–194. [Google Scholar] [CrossRef]
  61. Wang, X.; LÜ, Z.; Wang, L.; Jiang, W.; Ma, G. Simplified Assessment Method and Application Research of Rainstorm Disaster Risk and Impact—Using Jing-Jin-Ji “7.21” Heavy Rain as an Example. Meteorol. Mon. 2016, 42, 213–220. [Google Scholar]
  62. Guan, X.; Pan, N.; Huang, D.; Wang, Q.; Li, L. A study of typhoon extreme precipitation forecast in Fujian based on precipitation extreme forecast index. Acta Meteorol. Sin. 2021, 79, 414–427. [Google Scholar] [CrossRef]
  63. Breiman, L. Random Forests. Mach. Learn. 2001, 45, 5–32. [Google Scholar] [CrossRef] [Green Version]
  64. Saaty, T.L. How to Make a Decision: The Analytic Hierarchy Process. Interfaces 1994, 24, 19–43. [Google Scholar] [CrossRef] [Green Version]
  65. Xing, Y.; Chen, H.; Liang, Q.; Ma, X. Improving the Performance of City-Scale Hydrodynamic Flood Modelling through a GIS-Based DEM Correction Method. Nat. Hazards 2022, 112, 2313–2335. [Google Scholar] [CrossRef]
  66. Ye, C.; Xu, Z.; Lei, X.; Liao, W.; Ding, X.; Liang, Y. Assessment of Urban Flood Risk Based on Data-Driven Models: A Case Study in Fuzhou City, China. Int. J. Disaster Risk Reduct. 2022, 82, 103318. [Google Scholar] [CrossRef]
  67. Lei, X.; Gao, L.; Ma, M.; Wei, J.; Xu, L.; Wang, L.; Lin, H. Does Non-Stationarity of Extreme Precipitation Exist in the Poyang Lake Basin of China? J. Hydrol. Reg. Stud. 2021, 37, 100920. [Google Scholar] [CrossRef]
Figure 1. Location and overview of the study area: (a) the location of Fuzhou in eastern Fujian Province, China, and the track of Typhoon “Lupit” (2109); (b) the FAA location in the entire area of Fuzhou (RAA) and the meteorological station distribution in the RAA; (c) the remote sensing image map of the FAA.
Remotesensing 15 03116 g001
Figure 2. Workflow of the study.
Remotesensing 15 03116 g002
Figure 3. (a) The distribution map of the value of geographical similarity of flood disaster in FAA and (b) the frequency histogram of the value of geographical similarity of the flood grids.
Remotesensing 15 03116 g003
Figure 4. Final individual indicators’ weight obtained from the AHP.
Remotesensing 15 03116 g004
Figure 5. (a) T P C I p r o c e s s ; (b) R I on the process time scale; (c) T I on the process time scale; (d) C I on the process time scale; (e) T P C I 24 h from 12:00 on the 3rd to 12:00 on the 4th; (f) T P C I 24 h from 12:00 on the 4th to 12:00 on the 5th; (g) T P C I 24 h from 12:00 on the 5th to 12:00 on the 6th; (h) T P C I 24 h from 12:00 on the 6th to 12:00 on the 7th.
Remotesensing 15 03116 g005
Figure 6. (a) Temporal distribution of designed hyetographs with a 24 h precipitation of 72 mm; (b) Temporal distribution of designed hyetographs with a 24 h precipitation of 192 mm; (c) Temporal distribution of S1 (Nanyu Town Meteorological Station); (d) Temporal distribution of S2 (Shangjie Town Meteorological Station); (e) Temporal distribution of S3 (Fujian Provincial Sports Center Meteorological Station); (f) Temporal distribution of S4 (Gaishan Town Meteorological Station).
Remotesensing 15 03116 g006
Figure 7. Spatial distribution of typhoon process flood disaster risk in the FAA.
Remotesensing 15 03116 g007
Figure 8. Spatial distribution of every 24 h flood disaster risk in FAA: from 12:00 on the 3rd to 12:00 on the 4th (a); from 12:00 on the 4th to 12:00 on the 5th (b); from 12:00 on the 5th to 12:00 on the 6th (c); from 12:00 on the 6th to 12:00 on the 7th (d); flood disaster risk transition matrix (e).
Remotesensing 15 03116 g008
Figure 9. (a) Radar diagram of normalized average values of the indices at different risk grades at the typhoon process time scale; (b) Radar diagram of normalized average values of the indices at different risk grades at the 24 h time scale; (c) Radar diagram of normalized average values of the indices at different risk grades around meteorological stations S1–S4.
Remotesensing 15 03116 g009
Table 1. Statistical table of data.
Data NameData TypeData DetailsSource
Hourly precipitationAttribute data1–10 August 2021Fujian Provincial Meteorological Bureau
Typhoon trackAttribute data2–15 August 2021https://tcdata.typhoon.org.cn, accessed on 15 June 2022
Digital elevation modelAlOS DEM12.5 mhttps://search.asf.alaska.edu/#/?dataset=ALOS, accessed on 15 June 2022
Remote sensing dataRaster data30 mhttps://developers.google.cn/earth-engine/datasets/catalog/landsat, accessed on 15 June 2022
Land cover dataRaster data10 mhttps://developers.google.cn/earth-engine/datasets/catalog/ESA_WorldCover_v100, accessed on 15 June 2022
Building distributionRaster data100 mhttps://ghsl.jrc.ec.europa.eu/download.php?ds=bu, accessed on 15 June 2022
Road distributionRoad network shapefile2021https://amap.com/, accessed on 20 June 2022
GDP statistical dataAttribute data2021Fuzhou Statistical Yearbook
PopulationAttribute data2021Fuzhou Statistical Yearbook
Hydrological stations distributionAttribute data2021http://27.156.118.74:18800/web/html/index.html?module=yqxx, accessed on 20 June 2022
Key sites distributionPoint of interest2021Fujian Provincial Disaster Reduction Center
Administrative village dataAttribute data2021Fujian Provincial Disaster Reduction Center
Fire brigade distributionPoint of interest2021https://amap.com/, accessed on 20 June 2022
Hospitals distributionPoint of interest2021Fujian Provincial Disaster Reduction Center
Emergency shelters distributionAttribute data2021Fujian Provincial Disaster Reduction Center
Flood disaster distributionAttribute data3–8 August 2021http://zygh.fuzhou.gov.cn/, accessed on 20 June 2022, and news media coverage
Table 2. Division standards of RI, TI, and CI.
ValuesProcess as TP, 24-h as Sub-TP24-h as TP, 6-h as Sub-TPC of Sub-TP
R of Sub-TPTR of Sub-TPT
1[50, 75)2[20, 30)1[0, 10)
2[75, 100)3[30, 40)2[10, 20)
3[100, 125)4[40, 50)3[20, 25)
4≥125≥5≥504≥25
Table 3. Ranges of indices grades.
Criterion NameIndex NameLow-GradeMedium-GradeMedium–High-GradeHigh-Grade
Disaster-causing factorTPCI1–1617–3233–4849–64
Disaster-pregnant environmentImper<0.25[0.25, 0.5)[0.5, 0.75)≥0.75
TR≥10 m[5 m, 10 m)[3 m, 5 m)<3 m
SPI<2≥6[2, 4)[4, 6)
TWI<8[8, 12)[12, 16)≥16
DD<1 m[1 m, 2 m)[2 m, 3 m)≥3 m
HAND≥10 m[5 m, 10 m)[3 m, 5 m)<3 m
RD<0.25[0.25, 0.5)[0.5, 0.75)≥0.75
Disaster-bearing bodyPD<1[1, 400)[400, 800)≥800
GD<0.01[0.01, 0.25)[0.25, 0.5)≥0.5
RND<0.01[0.01, 0.5)[0.5, 0.75)≥0.75
NKP<1[1, 6)[6, 11)≥11
Disaster prevention and reduction capacityNFB≥7[4, 7)[1, 4)<1
TRD≥0.2[0.1, 0.2)[0.01, 0.1)<0.01
MRT≥100[50, 100)[1, 50)<1
CES≥2000[1000, 2000)[1, 1000)<1
DMHS≥3[2, 3)[1, 2)<1
PHT≥100[50, 100)[1, 50)<1
FR≥100[50, 100)[1, 50)<1
Table 4. Description of the designed hyetographs and their TPCI values.
Rainfall EventRainfall Amount of 24-hDescription of Temporal DistributionCalculation Process of TPCI
Event172 mmUnimodal rainfall with early peak and maximum rainfall within a 6 h timeframe accounting for 80% of the 24 h total amount.R/RI = 37.8 mm/2
TI = 1
C/CI = 69.69/4
TPCI = 8
Event272 mmUnimodal rainfall with late peak and maximum rainfall within a 6 h timeframe accounting for 80% of the 24 h total amount.R/RI = 37.8 mm/2
TI = 1
C/CI = 69.69/4
TPCI = 8
Event372 mmBimodal rainfall with early and late peaks, both the early maximum and the late one within a 6 h timeframe account for 40% of the 24 h total amountR/RI = 22.8 mm/1
TI = 2
C/CI = 62.30/4
TPCI = 8
Event472 mmUniform rainfallR/RI = 18 mm/0
TI = 0
C/CI = 17.13/2
TPCI = 0
Event5192 mmUnimodal rainfall with early peak and maximum rainfall within a 6 h timeframe accounting for 80% of the 24 h total amount.R/RI = 100.8 mm/3
TI = 1
C/CI = 52.55/4
TPCI = 12
Event6192 mmUnimodal rainfall with late peak and maximum rainfall within a 6 h timeframe accounting for 80% of the 24 h total amount.R/RI = 100.8 mm/3
TI = 1
C/CI = 52.55/4
TPCI = 12
Event7192 mmBimodal rainfall with early and late peaks, both the early maximum and the late one within a 6 h timeframe account for 40% of the 24 h total amountR/RI = 60.8 mm/1
TI = 2
C/CI = 59.79/4
TPCI = 8
Event8192 mmUniform rainfallR/RI = 48 mm/1
TI = 4
C/CI = 17.71/2
TPCI = 8
Table 5. TPCI grade verification in flooded areas.
Calculation Period for TPCIUnidentified *Low *Medium *Medium-High *High *Total *
12:00 on the 3rd–12:00 on the 4th0.031.1710.360.35-11.91
12:00 on the 4th–12:00 on the 5th0.1221.383.500.13-25.13
12:00 on the 5th–12:00 on the 6th-32.5412.1237.355.7487.75
12:00 on the 6th–12:00 on the 7th0.1017.1425.1238.964.0385.25
Typhoon process2.4810.4731.1345.9-89.98
* Area unit: km2.
Disclaimer/Publisher’s Note: The statements, opinions and data contained in all publications are solely those of the individual author(s) and contributor(s) and not of MDPI and/or the editor(s). MDPI and/or the editor(s) disclaim responsibility for any injury to people or property resulting from any ideas, methods, instructions or products referred to in the content.

