Article

Cropland Data Extraction in Mekong Delta Based on Time Series Sentinel-1 Dual-Polarized Data

1
Key Laboratory of Digital Earth Science, Aerospace Information Research Institute, Chinese Academy of Sciences, Beijing 100094, China
2
International Research Center of Big Data for Sustainable Development Goals, Beijing 100049, China
3
College of Resources and Environment, University of Chinese Academy of Sciences, Beijing 100049, China
*
Author to whom correspondence should be addressed.
Remote Sens. 2023, 15(12), 3050; https://doi.org/10.3390/rs15123050
Submission received: 4 May 2023 / Revised: 6 June 2023 / Accepted: 8 June 2023 / Published: 10 June 2023

Abstract

:
In recent years, synthetic aperture radar (SAR) has been a widely used data source in the remote sensing field due to its ability to work all day and in all weather conditions. Among SAR satellites, Sentinel-1 is frequently used to monitor large-scale ground objects. The Mekong Delta is a major agricultural region in Southeast Asia, so monitoring its cropland is of great importance. However, it is a challenge to distinguish cropland from other ground objects, such as aquaculture and wetland, in this region. To address this problem, the study proposes a statistical feature combination from the Sentinel-1 dual-polarimetric (dual-pol) data time series based on the m/χ decomposition method. Then the feature combination is put into the proposed Omni-dimensional Dynamic Convolution Residual Segmentation Model (ODCRS Model) of high fitting speed and classification accuracy to realize the cropland extraction of the Mekong Delta region. Experiments show that the ODCRS model achieves an overall accuracy of 93.85%, a MIoU of 88.04%, and a MPA of 93.70%. The extraction results show that our method can effectively distinguish cropland from aquaculture areas and wetlands.

1. Introduction

Food security and agricultural sustainability need urgent and concerted actions from governments in developed and developing countries alike [1], in which the sustainable development of agriculture plays a crucial role [2]. The Mekong Delta in Vietnam is an important agricultural area for food security around the world [3]. However, the region is threatened by climate change in many ways, such as drought [4], flood [5], sea level rise [6], salinization [7], etc. In addition, growing human interventions, including land use changes and hydropower dam expansion, altered the hydrology and ecology of the Delta [8], further changing the agricultural land area. Therefore, it is of great significance to monitor the cropland in the Mekong Delta region.
During the process of using remote sensing technology to extract cropland, the diversity of the cropland’s spatial types and crop types, as well as the changes in crop growth stages over time, lead to the complex spectral and textural features of cropland, causing misclassification between cropland and other ground objects, especially other vegetation [9]. Therefore, using time series data to extract cropland is a common solution. Currently, most research on extracting cropland information still focuses on optical data, including data from MODIS [10], Landsat satellite series [11], Gaofen optical satellite series [12], Sentinel-2 [13], etc. Due to the ability of synthetic aperture radar (SAR) to operate all day and in all weather conditions, it can compensate for the vulnerability of optical images to weather and atmospheric conditions. Therefore, some researchers have used SAR data as a supplement to optical data to monitor cropland. He et al. [14] combined time series Sentinel-1VH/VV polarized Ground Range Detected (GRD) data and Sentinel-2data for monitoring cropland abandonment in hilly areas. Ku et al. [15] used Gaofen-3 VH images to segment the initial water body to assist in extracting flooded cropland. Qiu et al. [16] used the time series Sentinel-1 VV polarization data to calculate the indicator to separate herbaceous plants and Sentinel-2 data to further distinguish between grass and crops to achieve national-scale cropland extraction. Although these methods with multi-band optical data as the main data source performed well, they required a great amount of data, resulting in a huge amount of calculation before classification. When using deep learning methods with higher accuracy than traditional methods for classification, the huge amount of data will also increase the difficulty of model training. In addition, SAR data used in current methods only utilizes the backscatter coefficients of a single or multiple polarization, which means only the amplitude information of ground objects is used and the phase information is ignored.
The cropland extraction task is essentially a binary classification problem of ground objects. The classification algorithms applied to cropland extraction mainly include traditional machine learning methods, including clustering [17], support vector machine [18], random forest [19], decision tree [20], and the classification models in the rapidly developing area of deep learning in recent years. For example, to reduce information loss in downsampling, Li et al. [21] used a fully convolutional neural network combined with contextual feature representation (HRNet CFR) to extract cropland directly from high-resolution optical data. Xu et al. [22] improved the skip connection in UNet and its loss function (HRUNet) to preserve details, especially the edge details of cropland. Li et al. [23] designed a compact graph convolutional neural network (GCNN) for Sentinel-2 time series multi-band optical data to acquire high-resolution cropland maps from low-resolution data sources while greatly reducing the number of model parameters. To conclude, when conducting ground object segmentation with deep learning methods, the similar features exhibited by different ground objects pose a huge challenge to the feature learning ability of deep learning networks, leading to issues such as insufficient segmentation accuracy and missing details. Thus, many studies have strived to improve the lack of details in the results and improve classification accuracy simultaneously in different ways. As mentioned in this passage, HRNet CFR adopts a fully convolutional structure to reduce detail loss; HRUNet uses a complex skip connection structure to preserve edge information, resulting in an increase in model size and training difficulty; while GCNN uses an adaptive down sampling strategy to simplify the model and computational complexity at the cost of information loss.
Specifically, in the Mekong Delta region, the main cropland extraction map is derived from the WorldCover product of the European Space Agency (ESA). However, this product divides a large area of aquaculture areas in the middle of the Mekong Delta into permanent water bodies and cropland; specifically, the ridges of inland aquaculture pools are wrongly divided into cropland, resulting in a large number of scattered misclassified areas in the map. Similarly, misclassification happens in the southern wetland area as well.
Therefore, to monitor the Mekong Delta region, our research considers the use of Sentinel-1 dual-pol data with both large coverage and relatively high resolution as the main data source to reduce the amount of calculation and the difficulty of model training. Then, in order to capture the changes in the ground object scattering mechanism in different growth stages of vegetation better, the m/χ dual-pol SAR data decomposition method is used to obtain the decomposition components containing both the scattering amplitude and phase information of the ground objects [24]. In this way, it is possible to use a small amount of data to distinguish between cropland and non-cropland, especially mangroves (wetland), aquaculture areas, and other ground objects containing mixed pixels of water and vegetation.
In response to the issue of insufficient segmentation accuracy and missing details when using deep learning methods to extract cropland, the solution of this paper is to adopt a down/up sampling as an encoding/decoding structure that can extract multi-level features, with a residual network introduced as the backbone network to compensate for the information loss in down sampling [25]. Even with a certain amount of information loss, the residual network can still distinguish the differences between features well due to its sensitivity to feature changes, ensuring the model’s recognition performance on details; then the omni-dimensional dynamic convolution module containing four types of attention is introduced to replace regular static convolution [26], further reducing the interference of redundant information in model training and simplifying and accelerating the model training.
In this paper, in order to extract cropland in the Mekong Delta area, the following contributions are made:
  • A temporal statistical feature including amplitude and phase information simultaneously, the temporal mean value of the three components calculated from m/χ decomposition and filtered by the Savitzky–Golay filter ( V S G R m e a n ,   V S G G m e a n ,   V S G B m e a n ) , is extracted to effectively distinguish cropland from other ground objects;
  • In response to the difficulty in distinguishing similar ground objects and the insufficient description of land details in the task of extracting cropland, a new segmentation model, ODCRS, is designed based on omni-dimensional dynamic convolution (ODConv). Compared with conventional convolutional networks, the convolutional layer of ODCRS includes four complementary attention mechanisms for convolutional kernels (location-wise, channel-wise, filter-wise, and kernel-wise), which provides assurance for capturing rich contextual information and significantly enhances the network’s feature extraction ability. Thus, it can effectively distinguish easily confused ground objects such as cropland and aquaculture areas and wetlands and maintain edge details of features.
The remainder of this paper is organized as follows. Section 2 provides a detailed introduction to the study site and the data used in experiment, and introduces the specific implementation method. Section 3 will present the experimental results. A discussion of our work in this study is carried out in Section 4. Finally, Section 5 concludes the paper.

2. Materials and Methods

2.1. Study SITE

The study site, Mekong Delta, is located in southern Vietnam, between 8.56°–11.03°N and 104.44°–106.84°E, including 13 provinces: Long An, Tien Giang, Ben Tre, Tra Vinh, Vinh Long, Dong Thap, An Giang, Kien Giang, Can Tho City, Hau Giang, Soc Giang, Bac Lieu, and Ca Mau, shown in Figure 1a. The delta covers an area of about 39,000 km2, with abundant water resources and biodiversity. It is well known for its rice production and fisheries. The two seasons, the wet and the dry, in the Mekong Delta region are well defined, from May to November as the wet season and December to April as the dry season. The mean annual rainfall in the Mekong Delta region is approximately 1800 mm, and 90% of this falls in the wet season [27]. The main ground object types in the region include cropland, permanent water (including aquaculture areas), mangroves (wetland), tree cover, grassland, and built-up.

2.2. Experiment Data and Sample Data

The Sentinel-1A satellite launched by ESA in 2014 is a commonly used free data source for large-scale land cover monitoring. Due to the significant impact of precipitation on the terrain and landforms in the region, data from the rainy season is chosen to reduce the interference of precipitation on cropland extraction [28]. 54 scenes of Sentinel-1A VH/VV dual polarization single look complex (SLC) data in interferometric wide swath (IW) mode were selected; details are shown in Table 1 and Figure 1b.
The auxiliary data mainly includes the ESA WorldCover product from 2020 [29] and optical data from the Google Earth platform, which were used for sample set making and accuracy evaluation in the research.
During sample preparation, the sample areas were chosen according to the optical image with reference to the ESA WorldCover product. The middle and upper parts of the Mekong Delta area, covering the cropland and other four kinds of ground objects (built-up, water area, tree cover, grasslands), and the southernmost mangroves (wetland) area, have been used as the training sample area. A total of 1498 pieces of 256 × 256-sized slices were finally obtained and divided into training and validation sets at a ratio of 0.7. The feature size of the training set is 1048 × 3 × 256 × 256, and the label size is 1048 × 1 × 256 × 256. For the validation set, the feature size is 450 × 3 × 256 × 256, and the label size is 450 × 1 × 256 × 256.

2.3. Methods

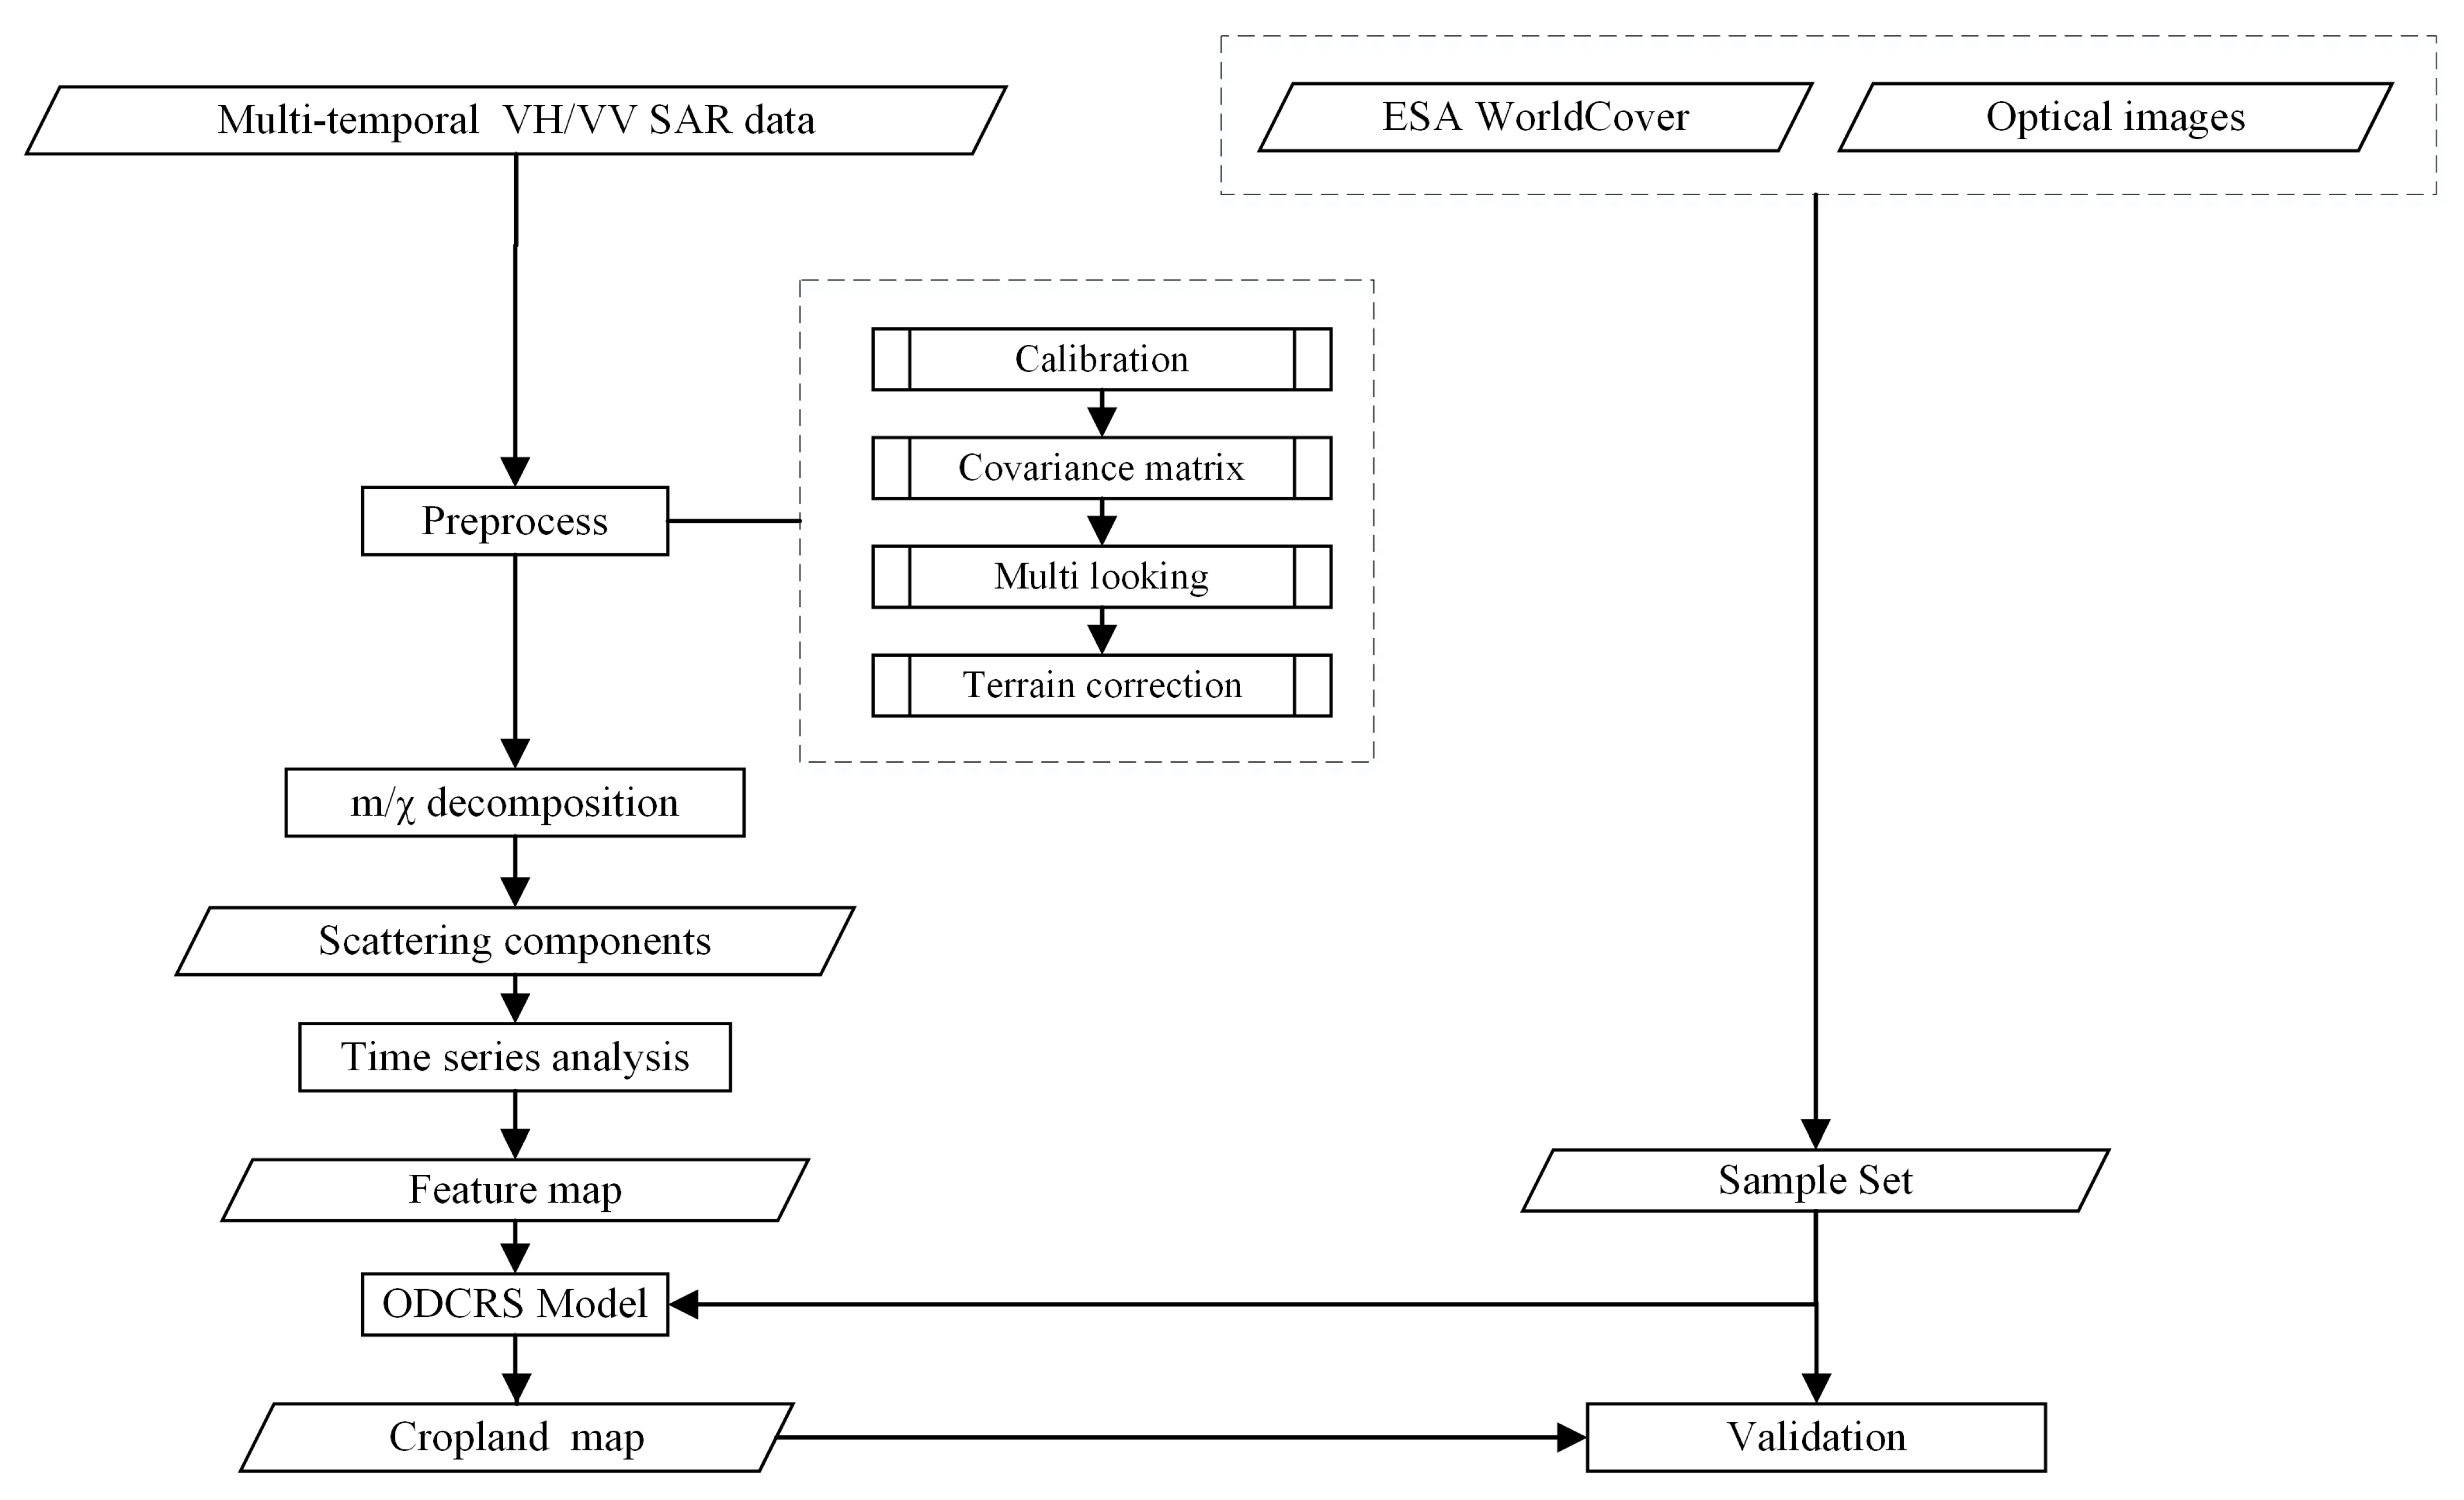
In view of the complex types of cropland in the Mekong Delta region and the overlap of cropland and non-cropland scattering characteristics, especially the overlap with the aquaculture areas in the southern part of the Mekong Delta, a cropland extraction method is proposed based on the temporal statistic feature of dual-pol SAR decomposition and omni-dimensional dynamic convolution residual segmentation model. Firstly, the Sentinel-1 VH/VV dual-pol SAR data of 18 phases in the Mekong Delta from May to November 2020 is preprocessed with Snap. The covariance matrix is calculated from the SLC data after calibration. Then, after multi-look processing and terrain correction, 54 scenes of two-dimensional covariance matrix (C2 matrix) images in the WGS84 coordinate system are obtained. Then the classic m/χ decomposition is applied to obtain scattering features. With the analysis of time series on different ground objects, separable features are selected as input for classification. Finally, the ODCRS model is used for semantic segmentation to generate the final cropland extraction map. The flowchart is shown in Figure 2.

2.3.1. Temporal Features Analysis and Extraction

To extract temporal features that could distinguish cropland from other ground objects, the decomposition method for SAR data is considered. Due to its ability to extract dominating scattering mechanisms from distributed targets [30], the m/χ decomposition is widely used in monitoring agricultural targets, such as analyzing and monitoring the characteristics of crop growth stages (rice, cotton, sugarcane, etc.) [31], production estimation [32], forest biomass estimation [33], crop growth parameter estimation (vegetation moisture content (VWC), leaf area index (LAI), height, and dry biomass) [34], etc.
Raney [24] proposed the m/χ decomposition method based on the Stokes vectors, a classic representation of polarized SAR data. The equation to obtain the Stokes vector from the covariance matrix is:
g = [ g 0 g 1 g 2 g 3 ] = [ C 11 + C 22 C 11 C 22 2 R ( C 12 ) 2 I ( C 12 ) ]
In the equation, g stands for the Stokes vector, and C i j stands for the components in the covariance matrix. From the Stokes vector, the degree of polarization   m , the relative phase δ , and the sign of rotation of the polarization ellipse and its ellipticity χ are calculated:
m = g 1 2 + g 2 2 + g 3 2 g 0
δ = atan ( g 3 g 2 )
sin 2 χ = g 3 m g 0
Then, the three-component obtained from the decomposition are:
[ V R V G V B ] = [ g 0 m 1 + s i n 2 χ 2 g 0 ( 1 m ) g 0 m 1 s i n 2 χ 2 ]
In this scheme, red corresponds to double-bounce, green represents the randomly polarized constituent, and blue indicates single-bounce (and Bragg) backscattering.
Then the time series feature analysis is conducted on the 18 phases of the feature map calculated from m/χ decomposition.
With reference to the auxiliary data, three scattered Regions of Interest (ROIs) of six ground objects are selected evenly within the region to analyze their temporal scattering mechanisms. The size of each ROI is 10 × 10 pixels. The time series curves of the intensity of the polarimetric scattering components of different ground objects are shown in Figure 3.
It can be seen from the box chart in Figure 3c that outliers appear in all ground object types except cropland in the three components. The distribution of cropland in each component overlaps with other land objects, making it harder to classify cropland from other ground objects. In order to reduce the outliers in the figure and further improve the separability of features, temporal filtering is considered to smooth the curves.
The Savitzky–Golay filter (commonly referred to as the S–G filter) is a filtering method based on local polynomial least squares fitting in the time domain [36]. Its biggest advantage is that it can ensure the shape and width of the signal remain unchanged while filtering out noise. Therefore, it is widely used in data stream smoothing and denoising and has also been applied in the processing of the SAR data time series [37].
The filtered curves are shown in Figure 4. It is more intuitive to see the time series characteristics of the scattering components of ground objects.
It can be seen that the outliers of the filtered time series curve decrease, and the distinction between cropland and other features is more intuitive and discernible. The mean values of cropland, built-up areas, and water bodies can be distinguished in all three components. Wetlands (mangroves) in different regions exhibit characteristics similar to those of trees, grasslands, or water bodies. Therefore, only distinguishing between cropland, trees, and grasslands needs to be considered. Specifically, the difference between trees’ mean values of the three scattering components is the smallest, while the mean value of the volume scattering in cropland is smaller than that of even scattering and odd scattering. The temporal mean value of the volume scattering component in grassland is generally higher than that in cropland.
Therefore, based on the above analysis and the visual interpretation of the pseudo-color image of the statistic characteristics (maximum, minimum, mean, variance of each polarization component, etc.) combination, the final feature combination that can clearly distinguish cropland from non-cropland is: the temporal mean value of the even scattering component V R m e a n , the temporal mean value of the random polarization component (volume scattering component)   V G m e a n , and the temporal mean value of the odd scattering (surface scattering component) V B m e a n . The three-channel pseudo-color image before and after filtering are shown in Figure 5.
Overall, most of the cropland areas in the pseudo-color map show a purple hue, with a small portion showing a light green hue. Comparison with the results of Ghosh et al. [38] and the optical images revealed that this difference is caused by the different growth stages of three-season rice and double-season rice. Three-season rice shows a light green hue on the map. Although the hue is similar to other ground objects, it can be distinguished by the overall intensity, as demonstrated by subsequent segmentation experiments. The aquaculture areas prone to misclassification are green in color, with intensity varying between water bodies and wetlands. The specific representation of each ground object in the pseudo-color map is shown in Figure 6.
It can be seen that the majority of the building area is green, with a small portion being purple red, with the highest brightness; the trees present a uniform light green color; the water body is uniformly dark green with the lowest brightness; wetlands exhibit a green tone consistent with vegetation distribution; grassland has a uniform green tone, with a higher green component than trees; the aquaculture area as a whole presents a green tone, consisting of lower brightness water bodies and higher brightness ridges, with very fine plots of land; the first type of cropland (mainly three-season rice) is a mixture of light green and purple tones, while the second type (mainly double-season rice) is a mixture of deep purple and dark green. The specific color tone is determined by the planting distribution of the crops, and the differences between the two types are caused by different growth stages of the crops.

2.3.2. ODCRS Model

In response to the similarity between the first cropland type (mainly three-season rice) and aquaculture areas and wetlands, which is prone to misclassification, and the insufficient description of land details when extracting cropland, the omni-dimensional dynamic convolution residual segmentation model (ODCRS model) is proposed. ODCRS is based on the encoding and decoding structures and uses omni-dimensional dynamic convolution and residual structures to improve feature extraction capabilities. The specific structure of the ODCRS model is shown in Figure 7.
The ODCRS model continues the classic encoding and decoding architecture of semantic segmentation networks, with 5-layer encoders and 4-layer decoders as the basic structure. The connection between encoder/decoder layers is achieved through down-/up-sampling.
The encoder is responsible for extracting features of different depths and dimensions, consisting of residual omni-dimensional dynamic convolution modules (RODConv) of different sizes. RODConv block utilizes a multidimensional attention mechanism through parallel strategies to learn complementary attention along the four dimensions of kernel space (location-wise, channel-wise, filter-wise, and kernel-wise) [26], effectively suppressing activation in irrelevant regions and enhancing the network’s ability to fit complex features. In addition, it can reduce redundant information in skip connections, balance the loss of detail features, and reduce information redundancy, thereby improving the efficiency and performance of feature extraction, reducing the training difficulty of each layer of the network, and greatly improving the model training speed and classification accuracy. Additionally, the experiment found that adding a dropout layer after the deepest down-sampling can effectively prevent overfitting.
The decoder is responsible for fusing abstract features extracted by the encoder at different scales and decoding them layer by layer into the final classification result. The decoder adopts the classic CBR module (Convolution + Batch Normalization + ReLU) as the basic structure, receiving the input of the previous network and corresponding encoder layers, achieving the fusion of high-level and low-level features, reducing the loss of spatial fine information caused by down sampling during encoding, and outputting refined cropland area segmentation results.
The input of the ODCRS model is a slice of a three-channel pseudo-color map with a size of 3 × 256 × 256. The number of output channels is the number of classifications. Since it is a binary classification task, the output size is 2 × 256 × 256 in this study. The detailed output size of each layer of encoder/decoder is given in Table 2.

2.3.3. Model Accuracy Evaluation

As we know, U-Net is a classic semantic segmentation model that adopts an encoding-decoding structure and is widely used to monitor cropland areas [39,40]. Residual U-Net (ResU-Net) also introduces residual networks into the encoding-decoding structure [41]. Therefore, U-Net and ResU-Net are chosen to compare the performance with the proposed ODCRS models using the filtered three-channel pseudo-color map ( V S G R m e a n ,   V S G G m e a n ,   V S G B m e a n ) as segmentation inputs on the validation set.
During the experiment, the models were built on the Pytorch framework (1.13.1 version) in Python 3.9.16. The optimized loss function is the cross-entropy function, optimized by the Adam optimizer.

3. Experimental Results

In this section, experiments conducted to verify the validity of the proposed features and model are presented. First, the training and extraction results of the features before and after filtering are presented to show the effect of the S–G filter on the model training and cropland extraction. Then the accuracy evaluation and analysis of the ODCRS model is conducted, comparing it to U-Net and ResU-Net. Finally, the extraction results of the proposed method and the ESA WorldCover product are compared and analyzed.

3.1. Effect of Pre- and Post-Filtering Features on Extraction Results

Table 3 presents the accuracy of the validation set of the time series statistical features before ( V R m e a n ,   V G m e a n ,   V B m e a n ) and after ( V S G R m e a n ,   V S G G m e a n ,   V S G B m e a n ) filtering on the ODCRS model. In the case of only 30 epochs of training, the accuracy of the pre-smoothing feature is 93.02%, MIoU is 86.47%, and MPA is 92.68%; after smoothing, the accuracy is 93.27%, MIoU is 86.99%, and MPA is 93.09% (if the number of training rounds increases to 100, each index has an increase of more than 1%). The number of 30 training rounds is relatively optimal for the segmentation effect, so the model output of 30 training rounds is selected as the final result. It can be seen that after filtering, the accuracy, MIoU, and MPA of the validation set have been improved by 0.25%, 0.52%, and 0.41%, respectively, indicating that the S–G filter has a certain positive effect on model accuracy.
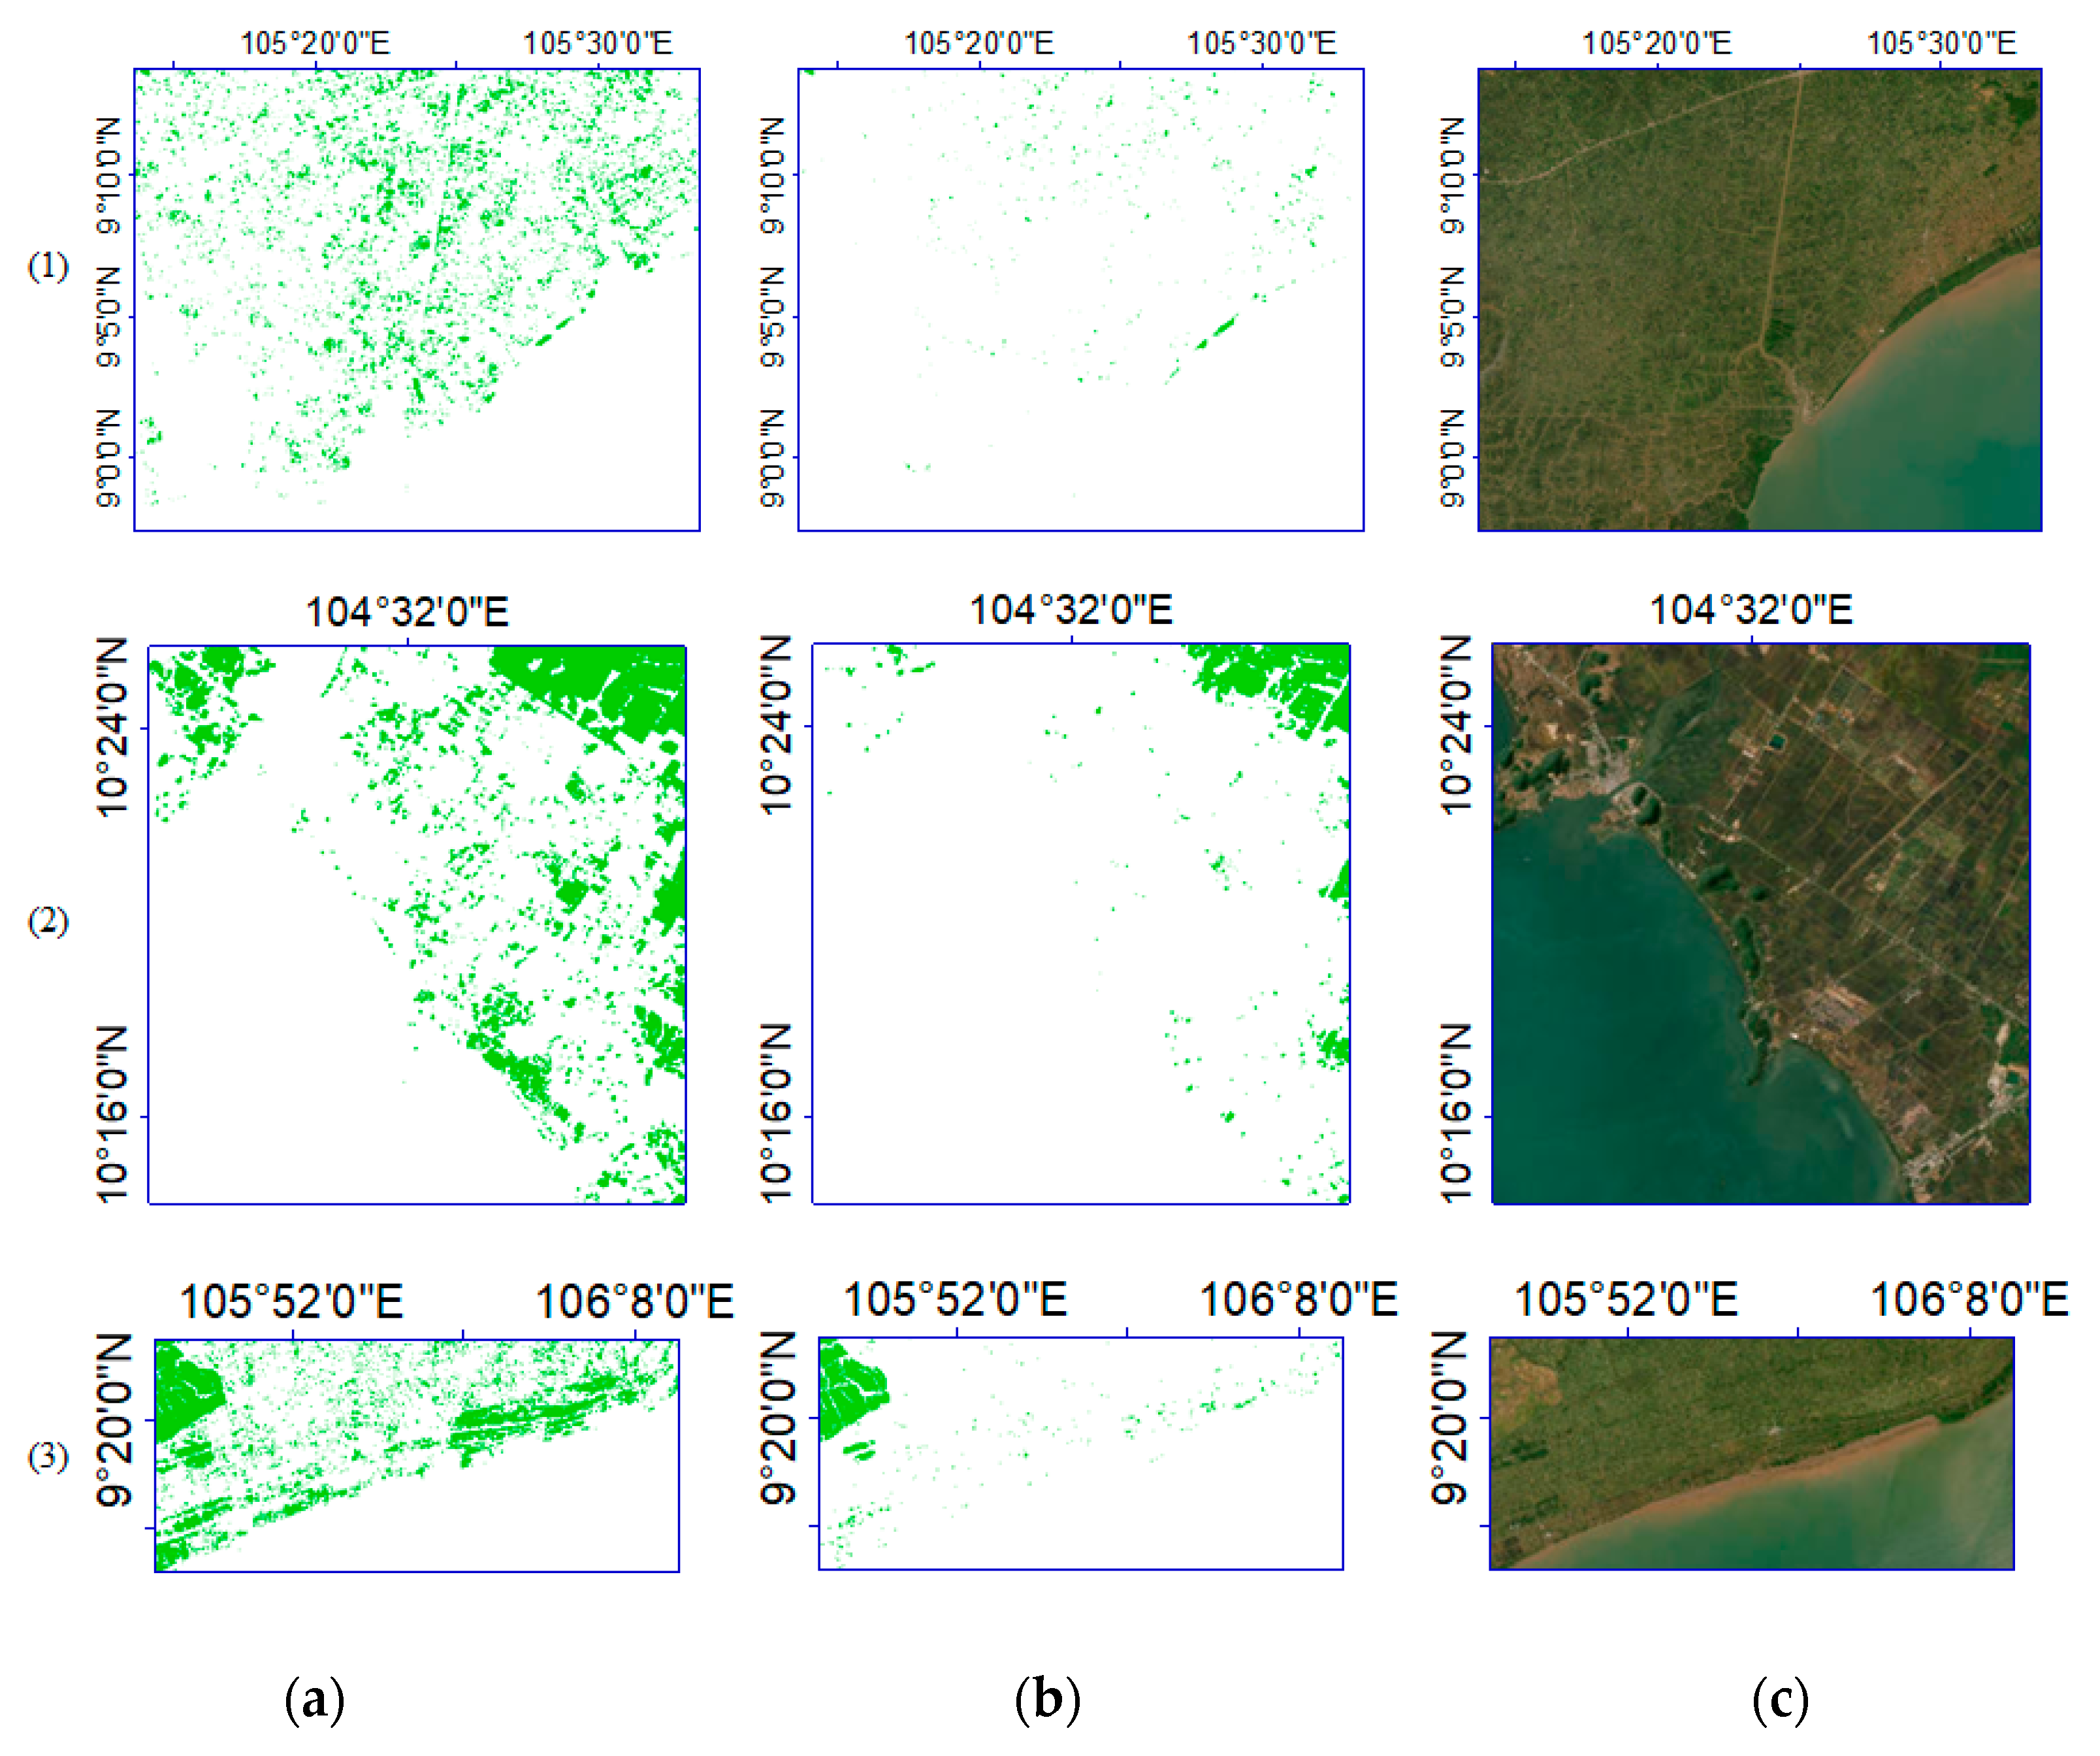
Figure 8 presents the extraction results of the features before and after filtering, and Figure 9 is an enlarged view of the red boxes in Figure 8. It can be seen from the proposed features that cropland areas are effectively extracted with or without S–G filtering. The results in Figure 9 show that the filtered features can largely reduce the misclassification from other ground objects (e.g., aquaculture areas to cropland).

3.2. Model Accuracy Evaluation Results

This section presents the accuracy evaluation by comparing the proposed model with U-Net and ResU-Net. The mean intersection over union (MIoU) variation curves on the training and validation sets are shown in Figure 10.
After 40 epochs of training, the loss of the U-Net model on the training and validation sets begins to converge; ResU-Net converges after 20 epochs, while the ODCRS model proposed in this paper converges after 10 epochs of training. The training rounds with an average intersection to union ratio (MIoU) of 80% for the three models are 30, 5, and 10, respectively. It can be seen that ODCRS outperforms U-Net to a great extent. Although the MIoU curve of the ODCRS model reaches 80% slower than ResU-Net, it surpasses ResU-Net after 10 epochs, indicating that the ODCRS model has an extremely fast feature fitting speed and could reach higher precision.
Table 4 gives the precision of the U-Net, ResU-Net, and ODCRS models on the validation set, including MIoU and mean pixel accuracy (MPA), two indicators specifically used for average semantic segmentation. After 50 rounds of training, U-Net achieved an accuracy of 91.71%, MIoU of 84.23%, and MPA of 91.51%; ResU-Net achieved an accuracy of 93.72%, MIoU of 87.80%, and MPA of 93.57%; and ODCRS achieved an accuracy of 93.85%, MIoU of 88.04%, and MPA of 93.70%. This shows that the performance of the ODCRS model proposed in this paper is better than U-Net and ResU-Net in all indicators, demonstrating the excellent feature-fitting ability of the ODCRS model.

3.3. Analysis of Extraction Results

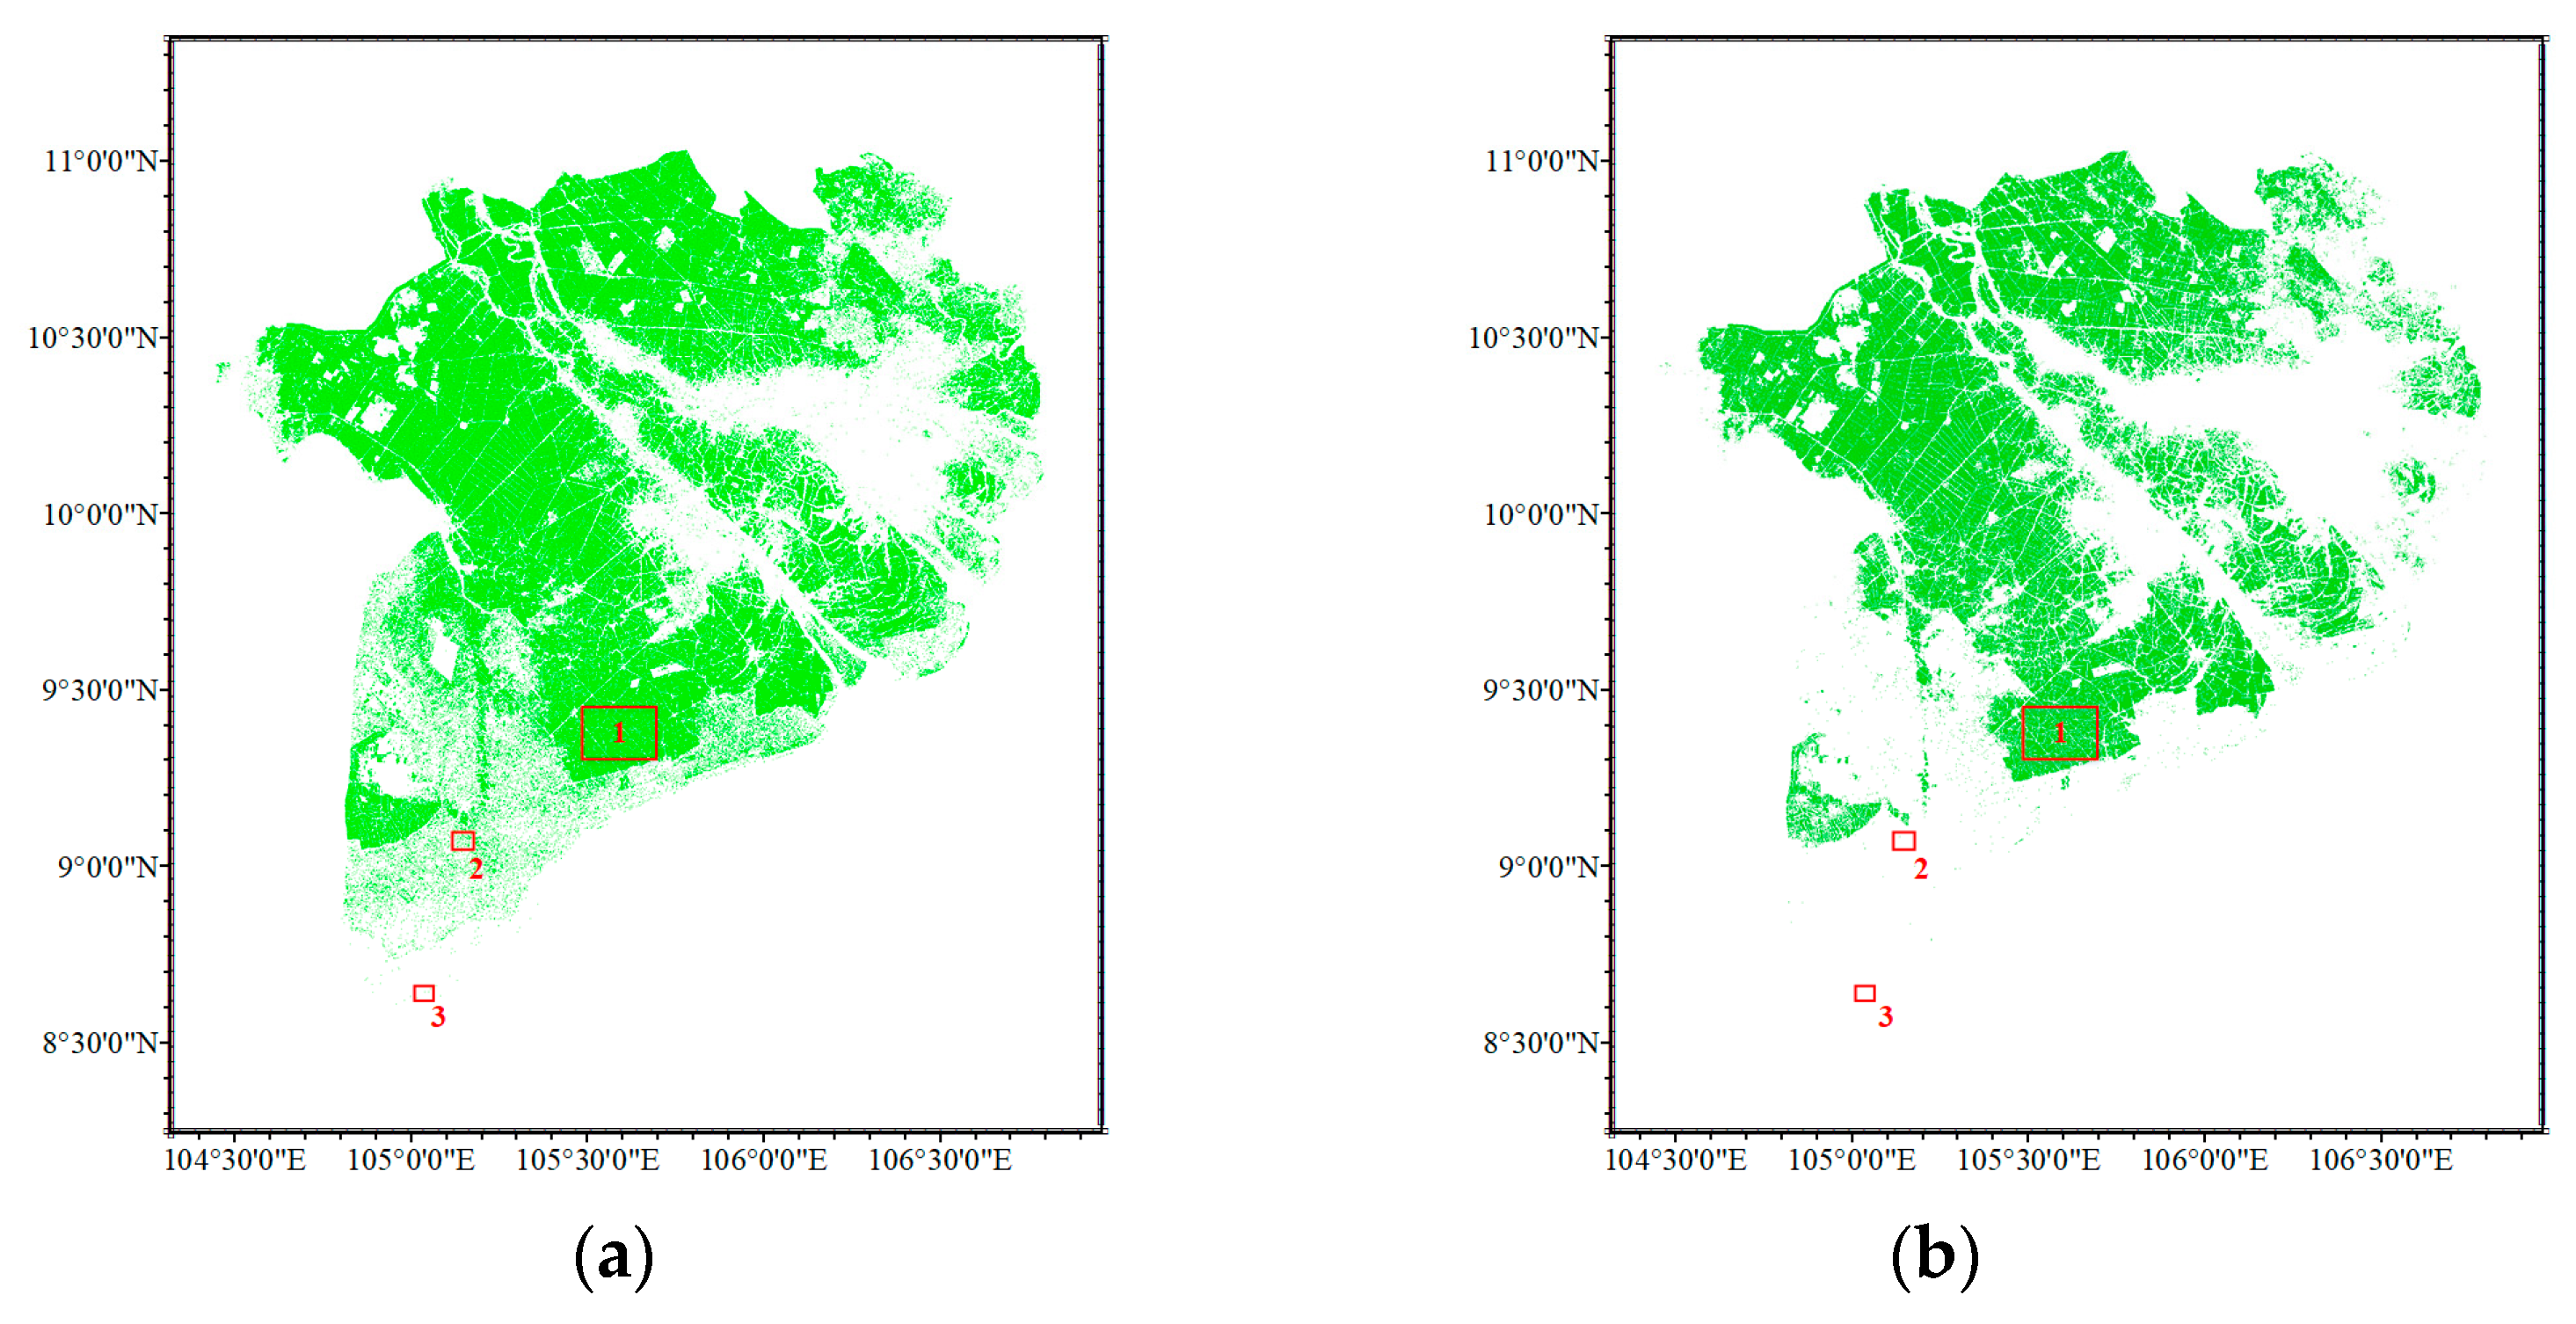
In this section, the result of this paper will be compared with the current cropland extraction result, the ESA WorldCover product, to show the effectiveness of the proposed method. From the comparison in Section 3.1, it is obvious that cropland extracted from features ( V S G R m e a n ,   V S G G m e a n ,   V S G B m e a n ) of the filtered polarimetric decomposition component time series has better accuracy, and therefore, it is chosen as the final cropland extraction map in this paper, and its comparison with the cropland layer in the ESA WorldCover product is shown in Figure 11.
As can be seen from Figure 11, the distribution of cropland in the two maps maintains a good correlation. In the southern region, including the aquaculture area in the middle and lower parts and the wetland area at the southernmost end, the result of this study significantly reduced the scattered points.
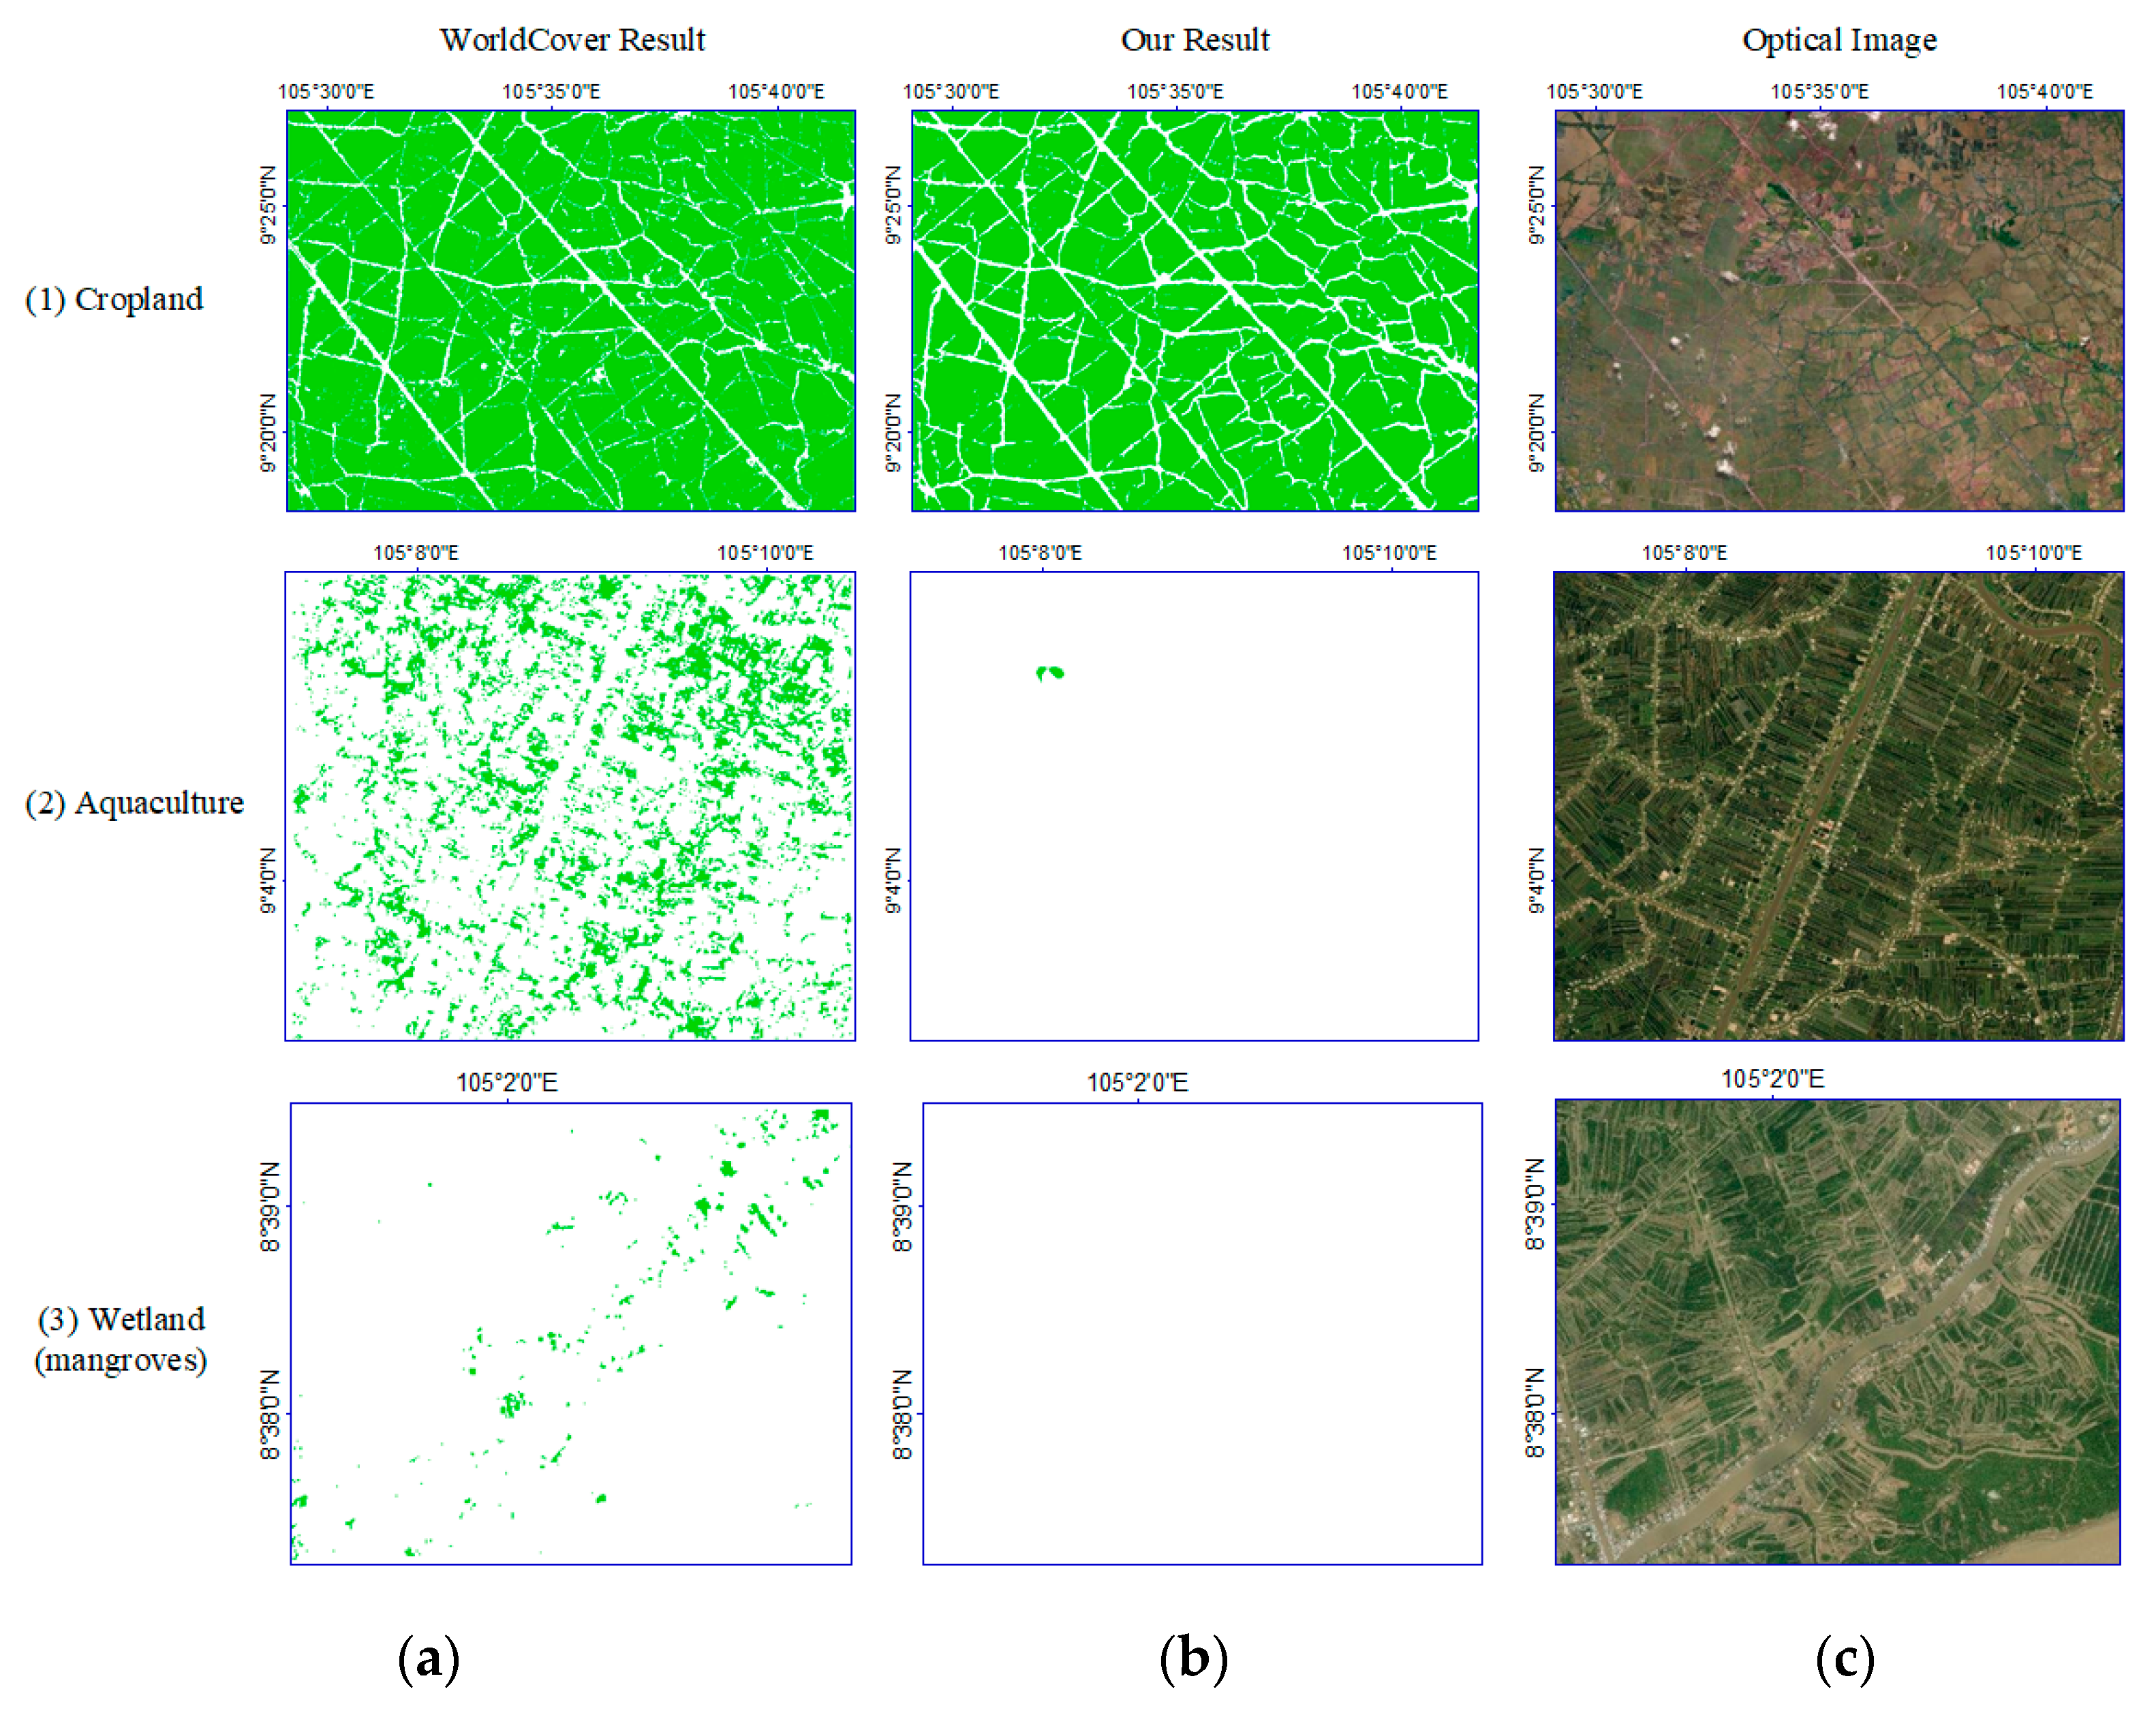
A more detailed comparison of typical regions is shown in Figure 12. It can be seen that in the cropland area, the extraction result in this study has a clearer contour and better regional connectivity, indicating that the proposed method captures details very well. While in aquaculture and wetland (mangrove) areas, there are only a few points misclassified as cropland in the extraction result of this study, suggesting that the proposed method is effective in distinguishing cropland from aquaculture and wetland. These indicate that the proposed method can effectively extract cropland from all ground objects with high accuracy and very few false alarms.

4. Discussion

In this study, the temporal features of typical ground objects in the Mekong Delta region based on the m/χ decomposition method of dual-pol SAR data time series were analyzed. It was found that the feature ( V S G R m e a n ,   V S G G m e a n ,   V S G B m e a n ) can effectively distinguish cropland from other ground objects. The impact of the Savitzky–Golay filter on time series characteristics and the segmentation effect are also analyzed. The experiment result shows that the application of the S–G filter also improves the extraction performance by reducing misclassification in wetland areas.
From Section 3.2, it can be seen that the proposed semantic segmentation model, ODCRS, outperforms U-Net and ResU-Net in all indicators, reaching an accuracy of 93.85%, MIoU of 88.04%, and MPA of 93.70%, which is 2.14%, 3.81%, and 2.23% higher than that of U-Net and 0.13%, 0.24%, and 0.23% higher than that of ResU-Net. The analysis in Section 3.3 shows that the proposed method is efficient in distinguishing cropland, aquaculture areas, and wetland and effective in capturing details. Although the proposed method performs well in accomplishing the task of extracting cropland in the Mekong Delta, some improvements could be made. The dual-polarization decomposition method used in this study is the m/χ method, and experiments can be conducted to understand the effectiveness of other decomposition methods of dual-band SAR data for extracting temporal features of cropland extraction, such as dual-polarization H−α decomposition [42]. Furthermore, during the experiment, it was found that if you replace the traditional convolution block in the decoder with an ODConv block, the training speed decreases. It is worthy of experiments to find out the reason behind it and find a proper way to put ODConv blocks into decoders to obtain better performance.

5. Conclusions

In view of the complexity of cropland types in the Mekong Delta region and the difficulty in distinguishing cropland from aquaculture areas and wetlands, this study designed a combination of features ( V S G R m e a n ,   V S G G m e a n ,   V S G B m e a n ) suitable for cropland extraction based on the analysis of the time series calculated from the m/χ decomposition of dual-pol Sentinel-1 SAR data and the Savitzky–Golay filter and proposed the semantic segmentation model ODCRS model to quickly and accurately fit the high-level and low-level features of the image, reaching an overall accuracy of 93.85%. The cropland extraction map of the Mekong Delta region in 2020 is finally obtained with the proposed feature combination and model. By comparing with ESA’s WorldCover product and optical images, it can be seen that the proposed method greatly reduces the misclassification of aquaculture and wetland areas into cropland and significantly reduces the number of scattered areas misclassified in the extraction results.
In the future, it is planned to address the problem of arable extraction in complex environments using alternative decomposition methods that better capture the scattering mechanisms of ground objects and improve computational efficiency.

Author Contributions

Conceptualization, methodology, software, J.J. and H.Z.; validation, formal analysis, H.Z.; investigation, J.J. and L.X.; resources, data curation, C.W. and J.G.; writing—original draft preparation, J.J. and H.Z.; writing—review and editing, H.Z., J.G. and C.S.; visualization, C.S. and J.G.; supervision, project administration, H.Z. and C.W. All authors have read and agreed to the published version of the manuscript.

Funding

This research was funded by the National Natural Science Foundation of China under Grants 41971395, 41930110 and 42001278.

Data Availability Statement

The authors do not have permission to share data.

Acknowledgments

The authors would like to thank ESA and EU Copernicus Program for providing the Sentinel-1 SAR data and the WorldCover product. We sincerely thank the anonymous reviewers for their critical comments and suggestions for improving the manuscript.

Conflicts of Interest

The authors declare no conflict of interest.

Abbreviations and Acronyms

SARSynthetic aperture radar
Dual-polDual-polarimetric
ODCRS ModelOmni-dimensional Dynamic Convolution Residual Segmentation Model
MIoUMean intersection over union
MPAMean pixel accuracy
ESAEuropean Space Agency
GRDGround Range Detected
SLCSingle Look Complex
C2 matrixTwo-dimensional covariance matrix
ROIRegion of interest
S–G filterSavitzky–Golay filter

References

  1. Vu, H.T.D.; Tran, D.D.; Schenk, A.; Nguyen, C.P.; Vu, H.L.; Oberle, P.; Trinh, V.C.; Nestmann, F. Land use change in the Vietnamese Mekong Delta: New evidence from remote sensing. Sci. Total Environ. 2021, 813, 151918. [Google Scholar] [CrossRef]
  2. Angulo-Mosquera, L.S.; Alvarado-Alvarado, A.A.; Rivas-Arrieta, M.J.; Cattaneo, C.R.; Rene, E.R.; García-Depraect, O. Production of solid biofuels from organic waste in developing countries: A review from sustainability and economic feasibility perspectives. Sci. Total Environ. 2021, 795, 148816. [Google Scholar] [CrossRef]
  3. Lilao, B.; Karlyn, E. Food Security and Vulnerability in the Lower Mekong River Basin. 2012, pp. 6–9. Available online: http://www.jstor.org/stable/wateresoimpa.14.6.000 (accessed on 10 January 2023).
  4. Park, E.; Loc, H.H.; Van Binh, D.; Kantoush, S. The worst 2020 saline water intrusion disaster of the past century in the Mekong Delta: Impacts, causes, and management implications. Ambio 2022, 51, 691–699. [Google Scholar] [CrossRef]
  5. Triet, N.V.K.; Dung, N.V.; Hoang, L.P.; Le Duy, N.; Tran, D.D.; Anh, T.T.; Kummu, M.; Merz, B.; Apel, H. Future projections of flood dynamics in the Vietnamese Mekong Delta. Sci. Total Environ. 2020, 742, 140596. [Google Scholar] [CrossRef]
  6. Jiang, Z.; Raghavan, S.V.; Hur, J.; Sun, Y.; Liong, S.-Y.; Nguyen, V.Q.; Dang, T.V.P. Future changes in rice yields over the Mekong River Delta due to climate change—Alarming or alerting? Theor. Appl. Clim. 2018, 137, 545–555. [Google Scholar] [CrossRef]
  7. Le, H.-M.; Ludwig, M. The Salinization of Agricultural Hubs: Impacts and Adjustments to Intensifying Saltwater Intrusion in the Mekong Delta. 2022. Available online: http://hdl.handle.net/10419/264102 (accessed on 3 June 2023).
  8. Tiwari, A.D.; Pokhrel, Y.; Kramer, D.; Akhter, T.; Tang, Q.; Liu, J.; Qi, J.; Loc, H.H.; Lakshmi, V. A synthesis of hydroclimatic, ecological, and socioeconomic data for transdisciplinary research in the Mekong. Sci. Data 2023, 10, 1–26. [Google Scholar] [CrossRef]
  9. Belgiu, M.; Csillik, O. Sentinel-2 cropland mapping using pixel-based and object-based time-weighted dynamic time warping analysis. Remote Sens. Environ. 2018, 204, 509–523. [Google Scholar] [CrossRef]
  10. Chen, X.; Gu, X.; Liu, P.; Wang, D.; Mumtaz, F.; Shi, S.; Liu, Q.; Zhan, Y. Impacts of inter-annual cropland changes on land surface temperature based on multi-time series thermal infrared images. Infrared Phys. Technol. 2022, 122, 104081. [Google Scholar]
  11. Wang, Q.; Guo, P.; Dong, S.; Liu, Y.; Pan, Y.; Li, C. Extraction of Cropland Spatial Distribution Information Using Multi-Seasonal Fractal Features: A Case Study of Black Soil in Lishu County, China. Agriculture 2023, 13, 486. [Google Scholar] [CrossRef]
  12. Lu, R.; Wang, N.; Zhang, Y.; Lin, Y.; Wu, W.; Shi, Z. Extraction of Agricultural Fields via DASFNet with Dual Attention Mechanism and Multi-scale Feature Fusion in South Xinjiang, China. Remote Sens. 2022, 14, 2253. [Google Scholar] [CrossRef]
  13. Tulczyjew, L.; Kawulok, M.; Longepe, N.; Le Saux, B.; Nalepa, J. Graph Neural Networks Extract High-Resolution Cultivated Land Maps From Sentinel-2 Image Series. IEEE Geosci. Remote Sens. Lett. 2022, 19, 1–5. [Google Scholar] [CrossRef]
  14. He, S.; Shao, H.; Xian, W.; Yin, Z.; You, M.; Zhong, J.; Qi, J. Monitoring Cropland Abandonment in Hilly Areas with Sentinel-1 and Sentinel-2 Timeseries. Remote Sens. 2022, 14, 3806. [Google Scholar] [CrossRef]
  15. Ku, M.; Jiang, H.; Li, D.; Wang, C. Flooded cropland mapping based on GF-3 and Mapbox imagery using semantic segmentation: A case study of Typhoon Siamba in western Guangdong in July 2022. SPIE 2023, 12552, 300–306. [Google Scholar] [CrossRef]
  16. Qiu, B.; Lin, D.; Chen, C.; Yang, P.; Tang, Z.; Jin, Z.; Ye, Z.; Zhu, X.; Duan, M.; Huang, H.; et al. From cropland to cropped field: A robust algorithm for national-scale mapping by fusing time series of Sentinel-1 and Sentinel-2. Int. J. Appl. Earth Obs. Geoinf. 2022, 113, 103006. [Google Scholar] [CrossRef]
  17. Yao, C.; Zhang, J. A method for segmentation and extraction of cultivated land plots from high-resolution remote sensing images. In Proceedings of the Second International Conference on Optics and Image Processing (ICOIP 2022), Taian, China, 20–22 May 2022; Volume 12328. [Google Scholar]
  18. He, S.; Shao, H.; Xian, W.; Zhang, S.; Zhong, J.; Qi, J. Extraction of Abandoned Land in Hilly Areas Based on the Spatio-Time series Fusion of Multi-Source Remote Sensing Images. Remote Sens. 2021, 13, 3956. [Google Scholar] [CrossRef]
  19. Zhang, S.; Zhang, H.; Gu, X.; Liu, J.; Yin, Z.; Sun, Q.; Wei, Z.; Pan, Y. Monitoring the Spatio-Time series Changes of Non-Cultivated Land via Long-Time Series Remote Sensing Images in Xinghua. IEEE Access 2022, 10, 84518–84534. [Google Scholar] [CrossRef]
  20. Wen, C.; Lu, M.; Bi, Y.; Zhang, S.; Xue, B.; Zhang, M.; Zhou, Q.; Wu, W. An Object-Based Genetic Programming Approach for Cropland Field Extraction. Remote Sens. 2022, 14, 1275. [Google Scholar] [CrossRef]
  21. Li, Z.; Chen, S.; Meng, X.; Zhu, R.; Lu, J.; Cao, L.; Lu, P. Full Convolution Neural Network Combined with Contextual Feature Representation for Cropland Extraction from High-Resolution Remote Sensing Images. Remote Sens. 2022, 14, 2157. [Google Scholar] [CrossRef]
  22. Xu, W.; Deng, X.; Guo, S.; Chen, J.; Sun, L.; Zheng, X.; Xiong, Y.; Shen, Y.; Wang, X. High-Resolution U-Net: Preserving Image Details for Cultivated Land Extraction. Sensors 2020, 20, 4064. [Google Scholar] [CrossRef]
  23. Li, G.; He, T.; Zhang, M.; Wu, C. Spatiotime series variations in the eco-health condition of China’s long-term stable cultivated land using Google Earth Engine from 2001 to 2019. Appl. Geogr. 2022, 149, 102819. [Google Scholar] [CrossRef]
  24. Raney, R.K.; Cahill, J.T.; Patterson, G.W.; Bussey, D.B.J. The m-chi decomposition of hybrid dual-polarimetric radar data with application to lunar craters. J. Geophys. Res. Planets 2012, 117. [Google Scholar] [CrossRef]
  25. He, K.; Zhang, X.; Ren, S.; Sun, J. Deep residual learning for image recognition. In Proceedings of the IEEE Conference on Computer Vision and Pattern Recognition, Las Vegas, NV, USA, 27–30 June 2016. [Google Scholar]
  26. Li, C.; Zhou, A.; Yao, A. Omni-dimensional dynamic convolution. arXiv 2022, arXiv:2209.07947. [Google Scholar]
  27. Nguyen, T.T.H.; De Bie, C.A.J.M.; Ali, A.; Smaling, E.M.A.; Chu, T.H. Mapping the irrigated rice cropping patterns of the Mekong delta, Vietnam, through hyper-temporal SPOT NDVI image analysis. Int. J. Remote Sens. 2012, 33, 415–434. [Google Scholar] [CrossRef]
  28. Ngo, K.D.; Lechner, A.M.; Vu, T.T. Land cover mapping of the Mekong Delta to support natural resource management with multi-time series Sentinel-1A synthetic aperture radar imagery. Remote Sens. Appl. Soc. Environ. 2020, 17, 100272. [Google Scholar]
  29. Zanaga, D.; Van De Kerchove, R.; De Keersmaecker, W.; Souverijns, N.; Brockmann, C.; Quast, R.; Wevers, J.; Grosu, A.; Paccini, A.; Vergnaud, S. ESA WorldCover 10 m 2020 v100. 2021. Available online: https://zenodo.org/record/5571936 (accessed on 3 January 2023).
  30. McNairn, H.; Shang, J.; Jiao, X.; Champagne, C. The Contribution of ALOS PALSAR Multipolarization and Polarimetric Data to Crop Classification. IEEE Trans. Geosci. Remote Sens. 2009, 47, 3981–3992. [Google Scholar] [CrossRef] [Green Version]
  31. Kumar, V.; Mandal, D.; Bhattacharya, A.; Rao, Y. Crop characterization using an improved scattering power decomposition technique for compact polarimetric SAR data. Int. J. Appl. Earth Obs. Geoinf. 2020, 88, 102052. [Google Scholar] [CrossRef]
  32. Hosseini, M.; Becker-Reshef, I.; Sahajpal, R.; Lafluf, P.; Leale, G.; Puricelli, E.; Skakun, S.; McNairn, H. Soybean Yield Forecast Using Dual-Polarimetric C-Band Synthetic Aperture Radar. ISPRS Ann. Photogramm. Remote Sens. Spat. Inf. Sci. 2022, 3, 405–410. [Google Scholar] [CrossRef]
  33. Tomar, K.S.; Kumar, S.; Tolpekin, V.A. Evaluation of Hybrid Polarimetric Decomposition Techniques for Forest Biomass Estimation. IEEE J. Sel. Top. Appl. Earth Obs. Remote Sens. 2019, 12, 3712–3718. [Google Scholar] [CrossRef]
  34. Wang, H.; Magagi, R.; Goïta, K.; Duguay, Y.; Trudel, M.; Muhuri, A. Retrieval performances of different crop growth descriptors from full- and compact-polarimetric SAR decompositions. Remote Sens. Environ. 2023, 285, 113381. [Google Scholar] [CrossRef]
  35. Rousseeuw, P.J.; Croux, C. Explicit scale estimators with high breakdown point. L1-Stat. Anal. Relat. Methods 1992, 1, 77–92. [Google Scholar]
  36. Savitzky, A.; Golay, M.J.E. Smoothing and Differentiation of Data by Simplified Least Squares Procedures. Anal. Chem. 1964, 36, 1627–1639. [Google Scholar] [CrossRef]
  37. Crisóstomo de Castro Filho, H.; Abílio de Carvalho, O., Jr.; Ferreira de Carvalho, O.L.; Pozzobon de Bem, P.; dos Santos de Moura, R.; Olino de Albuquerque, A.; Silva, C.R.; Ferreira, P.H.G.; Guimare, R.F.; Gomes, R.A.T. Rice crop detection using LSTM, Bi-LSTM, and machine learning models from Sentinel-1 time series. Remote Sens. 2020, 12, 2655. [Google Scholar] [CrossRef]
  38. Ghosh, S.; Wellington, M.; Holmatov, B. Mekong River Delta Crop Mapping Using a Machine Learning Approach; CGIAR Initiative on LowEmission Food Systems (Mitigate+); International Water Management Institute (IWMI): Colombo, Sri Lanka, 2022; 11p. [Google Scholar]
  39. Ge, S.; Zhang, J.; Pan, Y.; Yang, Z.; Zhu, S. Transferable deep learning model based on the phenological matching principle for mapping crop extent. Int. J. Appl. Earth Obs. Geoinf. 2021, 102, 102451. [Google Scholar] [CrossRef]
  40. Sun, C.; Zhang, H.; Xu, L.; Ge, J.; Jiang, J.; Zuo, L.; Wang, C. Twenty-meter annual paddy rice area map for mainland Southeast Asia using Sentinel-1 synthetic-aperture-radar data. Earth Syst. Sci. Data 2023, 15, 1501–1520. [Google Scholar] [CrossRef]
  41. Xiao, X.; Lian, S.; Luo, Z.; Li, S. Weighted res-unet for high-quality retina vessel segmentation. In Proceedings of the 2018 9th International Conference on Information Technology in Medicine and Education (ITME), Hangzhou, China, 19–21 October 2018. [Google Scholar]
  42. Cloude, S. Polarisation: Applications in Remote Sensing; Oxford University: New York, NY, USA, 2009. [Google Scholar]
Figure 1. (a) Study site: Mekong Delta in Vietnam; (b) the data frames used.
Remotesensing 15 03050 g001
Figure 2. Flow chart of the proposed cropland extraction method.
Remotesensing 15 03050 g002
Figure 3. Time series curve and statistical characteristics (box chart) of ground objects’ polarimetric components (a) VR: double-bounce (b) VG: randomly polarized constituent (c) VB: single-bounce. IQR, the interquartile range, is a measure of variability, which is achieved by dividing the dataset into quartiles [35]. Quartile divides a hierarchical dataset into four equal parts: Q1 (the first quartile), Q2 (the second quartile), and Q3 (the third quartile). IQR is defined as Q3 − Q1, and data outside Q3 + 1.5 × IQR or Q1 − 1.5 × IQR are considered outliers.
Remotesensing 15 03050 g003
Figure 4. Filtered time series curves and statistical characteristics (box chart) of ground objects’ polarimetric components by S-G filter (a) VSG − R: filtered double-bounce (b) VSG − G: filtered randomly polarized constituent (c) VSG − B: filtered single-bounce.
Remotesensing 15 03050 g004aRemotesensing 15 03050 g004b
Figure 5. The three-channel pseudo-color image in the Mekong Delta (a) before filtering ( V R m e a n ,   V G m e a n ,   V B m e a n ) and (b) after filtering ( V S G R m e a n ,   V S G G m e a n ,   V S G B m e a n ) .
Remotesensing 15 03050 g005
Figure 6. Comparison of pseudo-color maps and optical images of typical ground objects. (a) Pseudo-color map before filtering; (b) pseudo-color map after filtering; (c) the corresponding optical images from Google Earth (20 May 2020).
Remotesensing 15 03050 g006
Figure 7. ODCRS model structure: (a) the whole model; (b) the RODConv block; (c) the ODConv block.
Remotesensing 15 03050 g007
Figure 8. Cropland extraction results before filtering (a) and after filtering (b).
Remotesensing 15 03050 g008
Figure 9. An enlarged view of the red boxes in Figure 8: (a) Before filtering (b) After filtering (c) The corresponding optical images from Google Earth.
Remotesensing 15 03050 g009
Figure 10. MIoU curves of different models: (a) U-Net, (b) ResU-Net, and (c) ODCRS model.
Remotesensing 15 03050 g010
Figure 11. (a) ESA WorldCover cropland map; (b) the cropland map obtained using proposed features: ( V S G R m e a n ,   V S G G m e a n ,   V S G B m e a n ) and the ODCRS model.
Remotesensing 15 03050 g011
Figure 12. An enlarged view of the red boxes in Figure 11: (a) WorldCover cropland map; (b) our results; (c) the corresponding optical images from Google Earth.
Remotesensing 15 03050 g012
Table 1. Information on Sentinel-1 data used.
Orbit-Frame26–2326–28128–29
Number Date
18 May 20208 May 20203 May 2020
220 May 202020 May 202015 May 2020
31 June 20201 June 202027 May 2020
413 June 202013 June 20208 June 2020
525 June 202025 June 202020 June 2020
67 July 20207 July 20202 July 2020
719 July 202019 July 202014 July 2020
831 July 202031 July 202026 July 2020
912 August 202012 August 20207 August 2020
1024 August 202024 August 202019 August 2020
115 September 20205 September 202031 August 2020
1217 September 202017 September 202012 September 2020
1329 September 202029 September 202024 September 2020
1411 October 202011 October 20206 October 2020
1523 October 202023 October 202018 October 2020
164 November 20204 November 202030 October 2020
1716 November 202016 November 202011 November 2020
1828 November 202028 November 202023 November 2020
Table 2. Output size of the encoding and decoding layers of the ODCRS model.
LayerEncoder (C × H × W)Decoder (C × H × W)
Layer164 × 128 × 12864 × 128 × 128
Layer2256 × 64 × 64128 × 64 × 64
Layer3512 × 32 × 32256 × 32 × 32
Layer41024 × 16 × 16512 × 16 × 16
Layer52048 × 8 × 8
Table 3. Accuracy of feature combinations before and after filtering on the validation set.
FeatureEpochAccuracyMIoUMPA
( V R m e a n , V G m e a n ,   V B m e a n ) 3093.02%86.47%92.68%
( V S G R m e a n , V S G G m e a n ,   V S G B m e a n ) 3093.27%86.99%93.09%
Table 4. Precision of different models.
ModelEpochAccuracyMIoUMPA
UNet5091.71%84.23%91.57%
ResU-Net5093.72%87.80%93.57%
ODCRS5093.85%88.04%93.70%
Disclaimer/Publisher’s Note: The statements, opinions and data contained in all publications are solely those of the individual author(s) and contributor(s) and not of MDPI and/or the editor(s). MDPI and/or the editor(s) disclaim responsibility for any injury to people or property resulting from any ideas, methods, instructions or products referred to in the content.