Technical Note

Modified Auto-Focusing Algorithm for High Squint Diving SAR Imaging Based on the Back-Projection Algorithm with Spectrum Alignment and Truncation

School of Electronics and Information Engineering, Beihang University, Beijing 100191, China
*
Author to whom correspondence should be addressed.
Remote Sens. 2023, 15(12), 2976; https://doi.org/10.3390/rs15122976
Submission received: 17 April 2023 / Revised: 3 June 2023 / Accepted: 6 June 2023 / Published: 7 June 2023

Abstract

:
The study focuses on addressing the image defocusing issue caused by motion errors in highly squinted Synthetic Aperture Radar (SAR). The traditional auto-focusing algorithm, Phase Gradient Autofocus (PGA), is not effective in this mode due to difficulties in estimating the phase gradient accurately from strong point targets. Two main reasons contribute to this problem. Firstly, the direction of the energy-distributed lines in the Point Spread Function (PSF) does not align with the image’s azimuth direction in highly squinted mode. Secondly, the wavenumber spectrum of high squint SAR images obtained using the Back-Projection Algorithm (BPA) varies spatially, causing aliasing in the azimuth spectrum of all targets. In this paper, a new auto-focusing method is proposed for highly squinted SAR imaging. The modifications to the BP imaging grids have been implemented to address the first problem, while a novel wavenumber spectrum shifting and truncation method is proposed to accurately extract the phase gradient and tackle the spatial variation issue. The feasibility of the proposed algorithm is verified through simulations with point targets and processing of real data. The evaluation of the image shows an average improvement of four times in PSLR (Peak-Sidelobe-to-Noise Ratio).

1. Introduction

The high squint diving synthetic aperture radar (SAR) mode has the advantage of wide-area observation and can achieve multiple revisits of the interest area. The flexibility of observation geometry makes the application of squint mode SAR imaging technology more extensive. However, the high squint diving mode has always been a challenging problem since the range and azimuth coupling of the echo is severe, which brings many difficulties to imaging. Although various algorithms have been proposed to solve the coupling problem [1,2,3,4,5,6,7,8,9,10], the complicated implementation of the phase filters limits their applications. In contrast, time-domain algorithms have garnered increasing attention in high squint SAR mode when compared to frequency domain algorithms [11,12,13,14]. The Back-Projection Algorithm (BPA) [15,16,17,18] is particularly suitable for general SAR imaging geometries, enabling high-resolution imaging capabilities. However, in practical applications, it is difficult for the radar platforms to move along an ideal trajectory. Phase error introduced by motion error beyond the measurement capabilities of inertial measurement units (IMU) may cause defocus of the high resolution image, leading to difficulties in target recognition and image interpretation [19,20,21].
Several autofocusing algorithms have been developed to improve image quality. The Map Drift Algorithm [22], the Phase Difference Algorithm [23], and the Reflectivity Displacement Method (RDM) [24] are only suitable for low-order phase error estimation. High-order phase error correction usually requires human operation in the image postprocessing. Furthermore, all the aforementioned algorithms need strong point targets in the scene. The phase gradient autofocus (PGA) is proposed as a phase correction method using only the defocused complex SAR images without requiring isolated points, and it suits both the lower- and higher-order phase error [25,26,27]. However, the SAR image obtained by using the BP algorithm in the high squint diving mode cannot be directly used as input to PGA due to the following two reasons. The first is that in the case of high squint mode, for a given range bin, the energy will spread out in different range bins, and, thus, with the classical PGA, it is hard to extract the complete energy of the strong point targets. The second is that the wavenumber spectrum of the BP image spatially varies [28,29,30], resulting in the azimuth spectrum of all targets aliasing. The phase gradient estimation function does not work well because the energy interferes between targets. These two limitations of the PGA have motivated us to undertake in this article.
In this article, a modified auto-focusing algorithm for high squint diving SAR imaging based on the BP algorithm with spectrum alignment and truncation is presented for the high squint SAR mode. The method focuses on the problem of the platform’s motion error introduced image defocusing using BPA for high squint SAR. First, the image grids of the algorithm are established and the coarse focusing image is obtained by the BP algorithm. Second, applying the idea of the wavenumber spectrum shifting in [28], the spectrum center of all targets is aligned. Finally, by analyzing the relationship between the wavenumber support region of the targets and the wavenumber observation bandwidth, the spectrum truncation is applied after spectrum alignment to avoid the interference of the energy outside the spectrum on phase gradient estimation. Compared to the existing auto-focusing algorithms, the new one achieves the best results in terms of PSLR, and ISLR, even with some papers, already achieves better sidelobe suppression [31]. To summarize, the main contribution of this paper is shown as follows:
  • The imaging grids for the BP algorithm are modified to utilize the full energy for azimuth domain processing and ensure the PGA can extract the whole energy of the targets.
  • To accurately estimate the phase gradient, wavenumber spectrum shifting to align the spectrum center of targets and spectrum truncation to avoid the extra phase noise from outside the target’s bandwidth are both proposed.
  • The length of spectrum truncation after wavenumber center alignment is first given in this paper for general SAR auto-focusing algorithms.
This article is organized as follows. Section 2 introduces the problem formulation. Section 3 derives the proposed method. The presented method is evaluated in Section 4 through point targets simulation and real data processing. Section 5 discusses the computational load of the proposed method and the classical auto-focusing method. Lastly, Section 6 provides the summary.

2. Problem Formulation

In general, thanks to the robustness to different geometry, the BP algorithm is always selected for SAR processing in high squint mode. The subsequent process will be PGA to compensate the phase error introduced by motion error and improve the auto-focusing imaging quality. However, the classical PGA cannot be implemented directly after obtaining the coarse image from BP. Several problems need to be addressed.
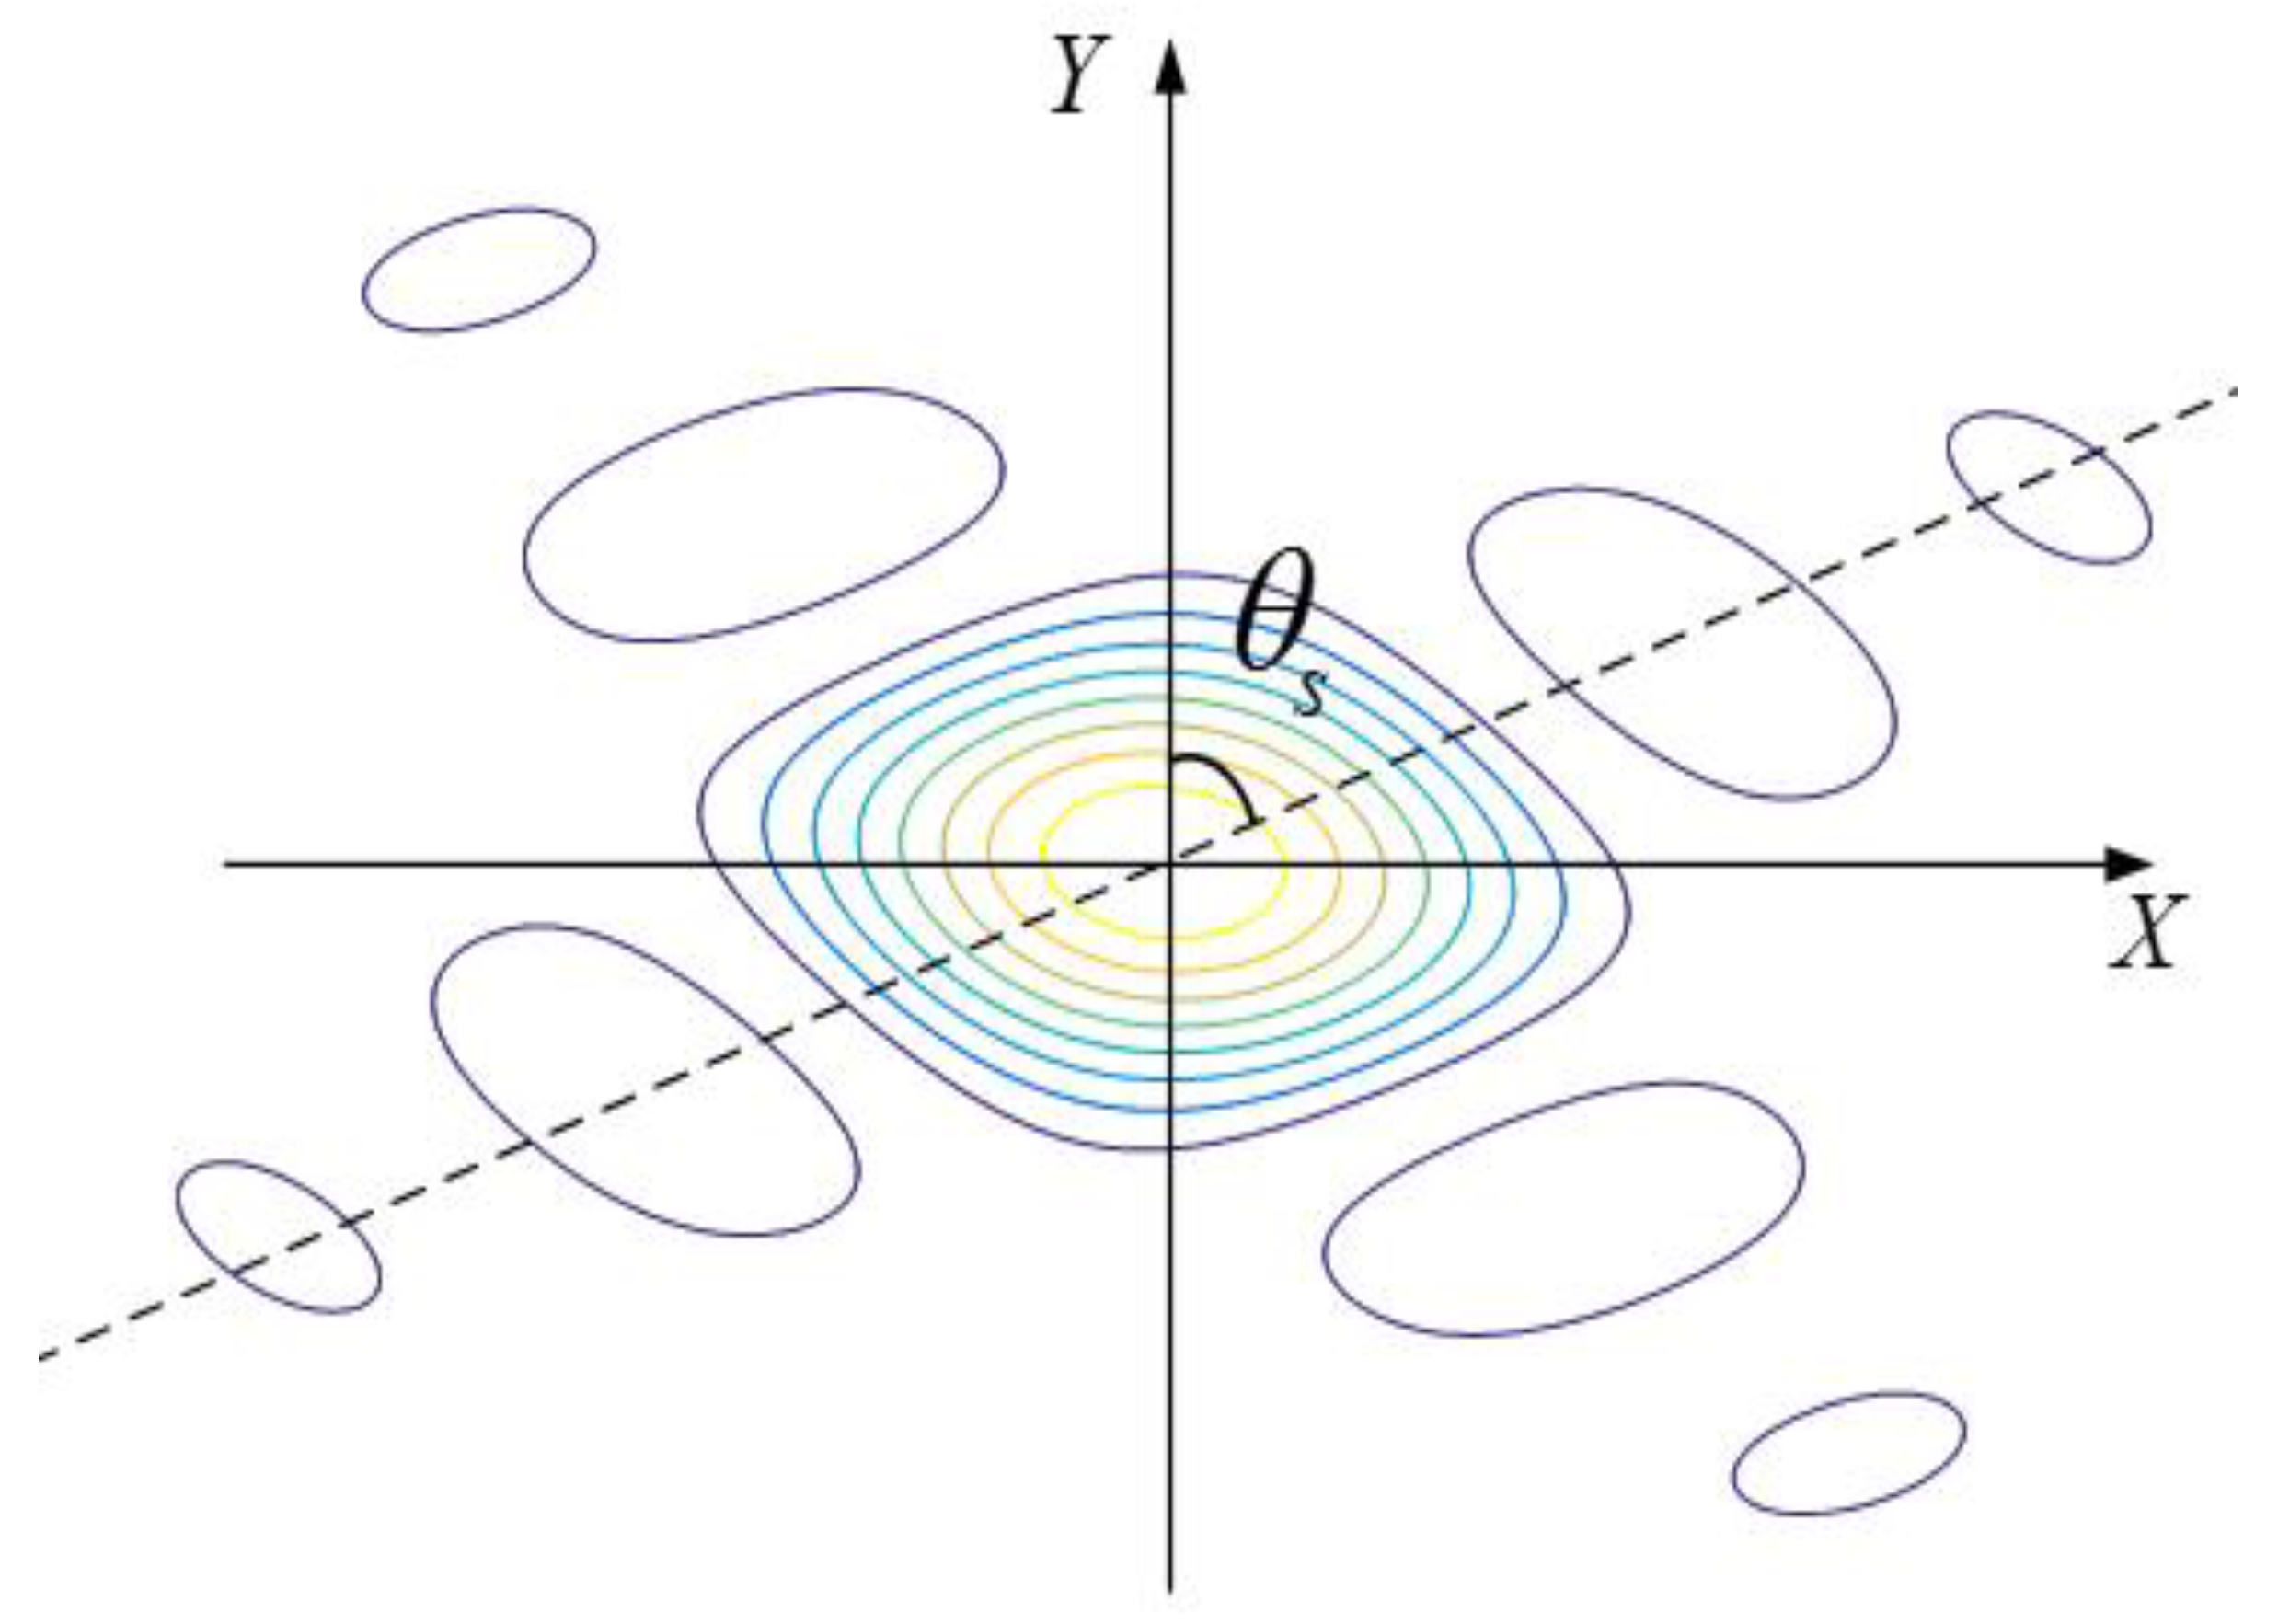
The data collection geometry with high squint diving SAR is depicted in Figure 1. The sensor flights along line AC in the YOZ plane with velocity V 0 . The targets are distributed in the XOY plane. Furthermore, φ and θ denotes the incident angle and the squint angle of the radar line-of-sight, respectively, and θ s is the projection angle of the squint angle on the XOY plane. In general, the imaging grids of BP will be the same direction as the XY direction shown in the black dashed line in Figure 1.
PGA estimates the phase gradient along the azimuth dimension. Only when the azimuth sidelobe is parallel to the azimuth direction of the image can the phase gradient estimation be obtained more accurately. An example is shown in Figure 2 using BPA for high squint SAR. It can be seen that the direction of the PSF is affected by the squint angle [32,33,34,35,36], which means that the classical PGA is hard to extract the complete azimuth energy of the strong point targets and, hence, the phase gradient estimation function does not work. The new imaging grids, which are shown as the grey grids in Figure 1, are required for PGA estimation on the BP images.
On the grey grids, a modified coordinate o -u v z is constructed, where the u -axis is the direction of oo . The position of the radar under the new coordinate is T u η , T v η , T z η , and the new coordinate of target P is u 0 , v 0 , 0 .
The radar echo of target P in wavenumber domain along u - and v -directions are [28]:
K u η = K R T u η u 0 R η ; u 0 , v 0 K v η = K R T v η v 0 R η ; u 0 , v 0
where K R denotes the radial wavenumber, K R = 4 π f c + f r / c , f c denotes the carrier frequency, c is the speed of light, and f r denotes the frequency in the range direction. R η ; u 0 , v 0 represents the range between the target and the radar platform:
R η ; u 0 , v 0 = T u η u 0 2 + T v η v 0 2 + T z η 2 .
Inspecting (1), the center of the wavenumber spectrum K u c , K v c can be deduced as:
K u c = K R c T u η i u i R η i ; u i , v i K v c = K R c T v η i v i R η i ; u i , v i
where K R c is the central wavenumber in the range direction and η i is the azimuth center time. u i , v i are the coordinates of the imaging grids.
The center of the wavenumber spectrum will change with respect to the target’s position according to (3), as illustrated in Figure 3a. The classical PGA transforms the complex SAR images into the azimuth frequency domain to estimate the phase gradient. However, when the BP image is used as input to PGA, the spatial variation in the wavenumber spectrum may lead to spectrum aliasing and the inaccurate estimation of the phase error.
In summary, the PSF problem using BP needs to be addressed by new imaging grids based on the given geometry in this section; also, the spatial variation in the wavenumber spectrum will cause spectrum aliasing. As a result, the classical PGA algorithm cannot be implemented directly on the BP imaging for high squint SAR.

3. Derivation of the Proposed Method

To solve the aforementioned problems, the auto-focusing method is proposed here. The proposed method applies the idea of the spectrum alignment in [25] to eliminate the spatial variability of the spectrum first, and, then, by analyzing the relationship between the bandwidth of the target wavenumber and wavenumber observation bandwidth, the wavenumber spectrum truncation is used to estimate the phase error. Figure 4 shows the flowchart of this method. The wavenumber center alignment and wavenumber spectrum truncation is proposed into a current processing pipeline for the high squint SAR mode to enhance image results, particularly in terms of the sidelobe performances. The inclusion of wavenumber center alignment and wavenumber spectrum truncation is crucial, especially in the presence of additional motion errors in high squint mode. Additionally, this paper presents, for the first time, the determination of the optimal length for spectrum truncation after wavenumber center alignment in general SAR auto-focusing algorithms. The spatial center alignment and the wavenumber spectrum truncation are detailed in the following subsections.

3.1. Spectrum Center Shifting

The spectrum center shifting is applied to move the spectrum center of all targets to the center of the wavenumber domain, thereby avoiding spectral aliasing caused by the wavenumber spatial variation, which is convenient for the wavenumber spectrum truncation.
The imaging result using BP algorithm is shown as:
I u i , v i = s τ , η exp j 4 π λ R η ; u i , v i d η = sin c 2 B c R η ; u Q , v Q R η ; u i , v i exp j 4 π λ R η ; u Q , v Q R η ; u i , v i d η
where s τ , η represents the signal after range compression. R η ; u Q , v Q is the range between the radar platform and the scene center. R η ; u i , v i denotes the distance from the radar platform to the imaging grids. B denotes the bandwidth.
The spectrum center shifting is described as:
I S u i , v i = I u i , v i exp j φ u i , v i
where φ u i , v i is a phase compensation function.
The partial derivatives of φ u i , v i at u i and v i are K u c and K v c , respectively. By integrating the partial derivative, φ u i , v i can be calculated, which yields [28]:
φ u i , v i = K R c T u η i u i 2 + T v η i v i 2 + T z η i 2
After spectrum center shifting, the wavenumber region is shown in Figure 3b. The size of the azimuth wavenumber region is obviously diminished, and the wavenumber center of all targets is unified.

3.2. Wavenumber Spectrum Truncation

To avoid the interference of the energy outside the spectrum on phase gradient estimation, it is necessary to apply spectrum truncation after spectrum alignment. Therefore, the relationship between the bandwidth of the target wavenumber and wavenumber observation bandwidth along the azimuth direction is analyzed.
In (4), considering a point target 0 , Δ v , 0 where the azimuth coordinate is very close to the scene center 0 , 0 , 0 , the imaging result yields:
I 0 , Δ v = r e c t η T a exp j 4 π λ R η ; 0 , 0 R η ; 0 , Δ v d η
where T a is synthetic aperture integration time. R η ; 0 , 0 and R η ; 0 , Δ v are described as:
R η ; 0 , 0 = T u η 2 + T v η 2 + T z η 2
and
R η ; 0 , Δ v = T u η 2 + T v η Δ v 2 + T z η 2 .
Performing Taylor expansion at Δ v , (9) can be expressed as:
R η ; 0 , Δ v T u η 2 + T v η 2 + T z η 2 T v η Δ v T u η 2 + T v η 2 + T z η 2
Substituting (10) into (7), the imaging result of the point target at 0 , Δ v , 0 is shown as:
I 0 , Δ v = r e c t η T a exp j 4 π Δ v λ T v η T u η 2 + T v η 2 + T z η 2 d η
By performing first order Taylor expansion, T v η T u η 2 + T v η 2 + T z η 2 can be transformed into:
T v η T u η 2 + T v η 2 + T z η 2 a 0 + a 1 η
where a 0 and a 1 denote the constant and the first order Taylor coefficients, respectively.
Thus, (11) can be recorded as:
I 0 , Δ v = T a exp j 4 π a 0 Δ v λ sin c 2 a 1 T a Δ v λ
By performing azimuth Fourier transform, the wavenumber spectrum along v i direction yields the following:
I 0 , K v = I 0 , Δ v exp j K v Δ v d Δ y = λ 2 a 1 r e c t K v + 4 π a 0 λ 4 π a 1 T a λ
where 4 π a 1 T a λ is the wavenumber bandwidth of the target. The wavenumber observation bandwidth is 2 π d v , in which d v is the azimuth pixel spacing of the imaging grids.
After conducting azimuth inverse fast Fourier transform on the truncated wavenumber spectrum, the classical PGA, which contains center shifting, windowing, estimation of the phase gradient, and iterative compensation, is applied. Then, the image can be focused well.

4. Simulation and Real Data Processing

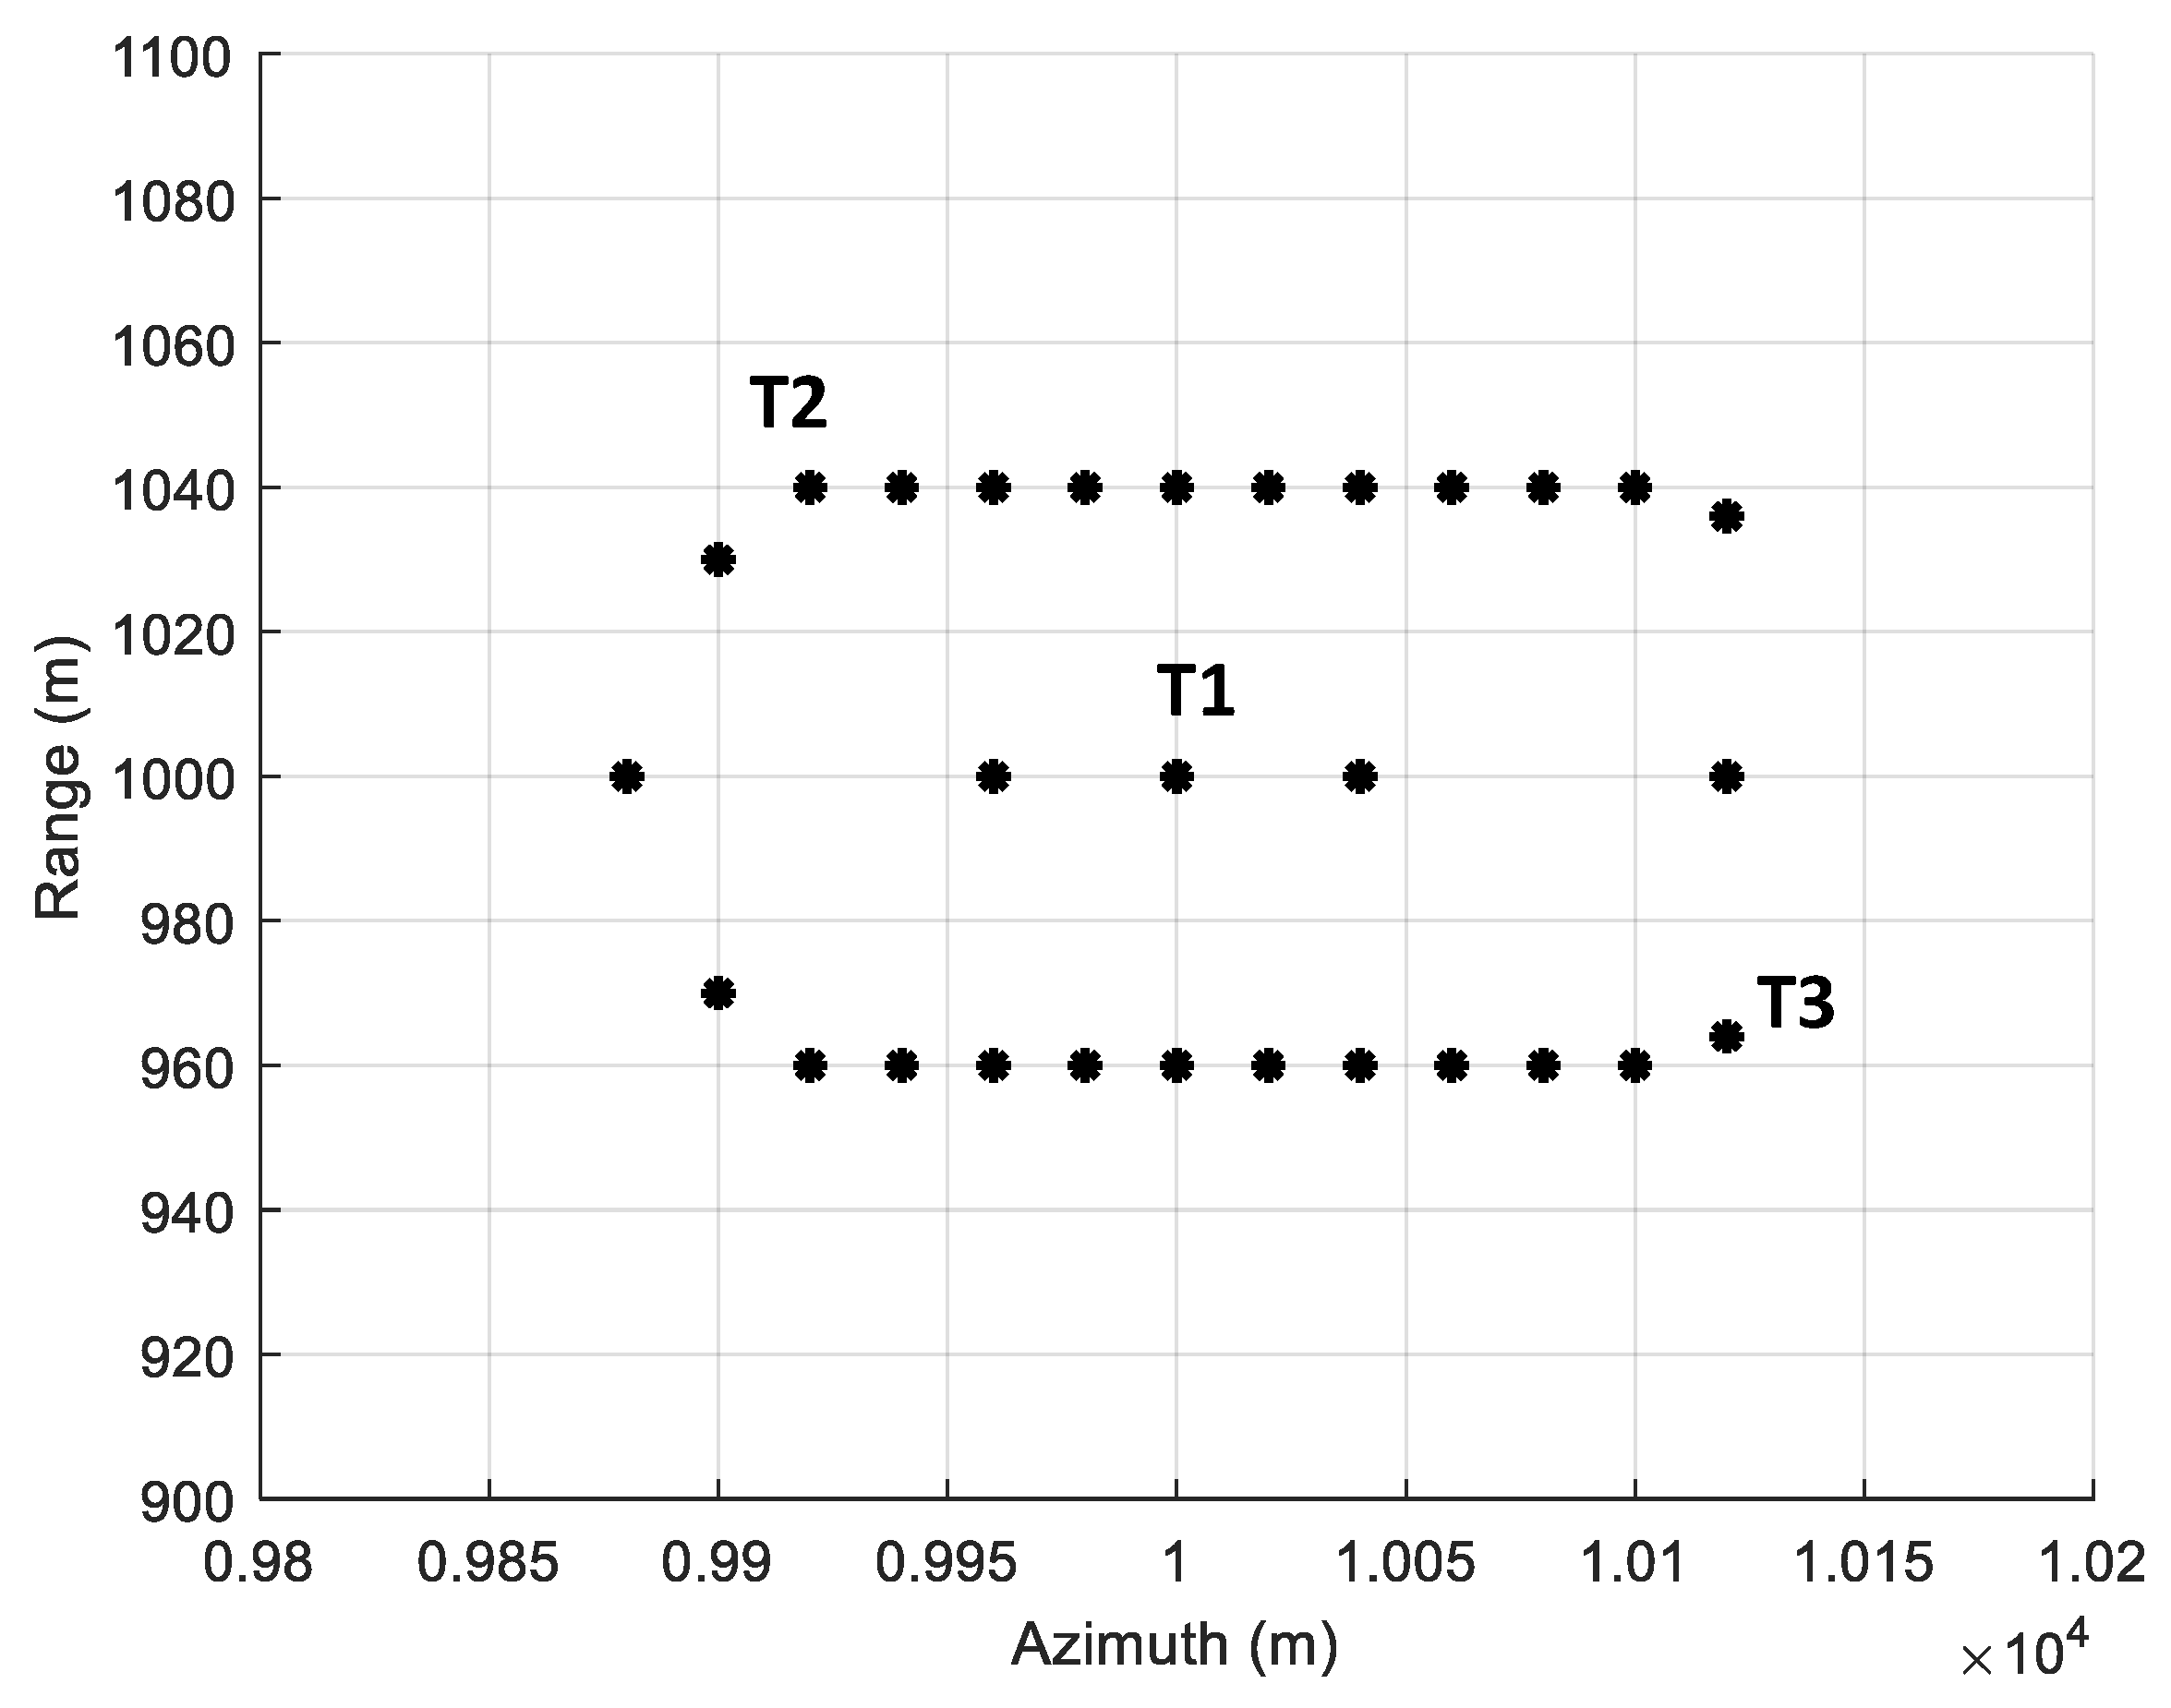
To give a clearly comparison in terms of the performance, the evaluations regarding the influence of the PSF, the influence of the wavenumber spectrum shifting and truncation, the auto-focusing quality under different motion errors, the processing results of the simulated scenarios, and the real dataset are all performed and given here. Moreover, the results with and without the new imaging grids are compared as well. The simulation parameters are listed in Table 1. The range resolution is set to be 1.59 m and the azimuth resolution is 2.30 m. The simulation geometry of the targets is given in Figure 5.

4.1. The Influence of the PSF

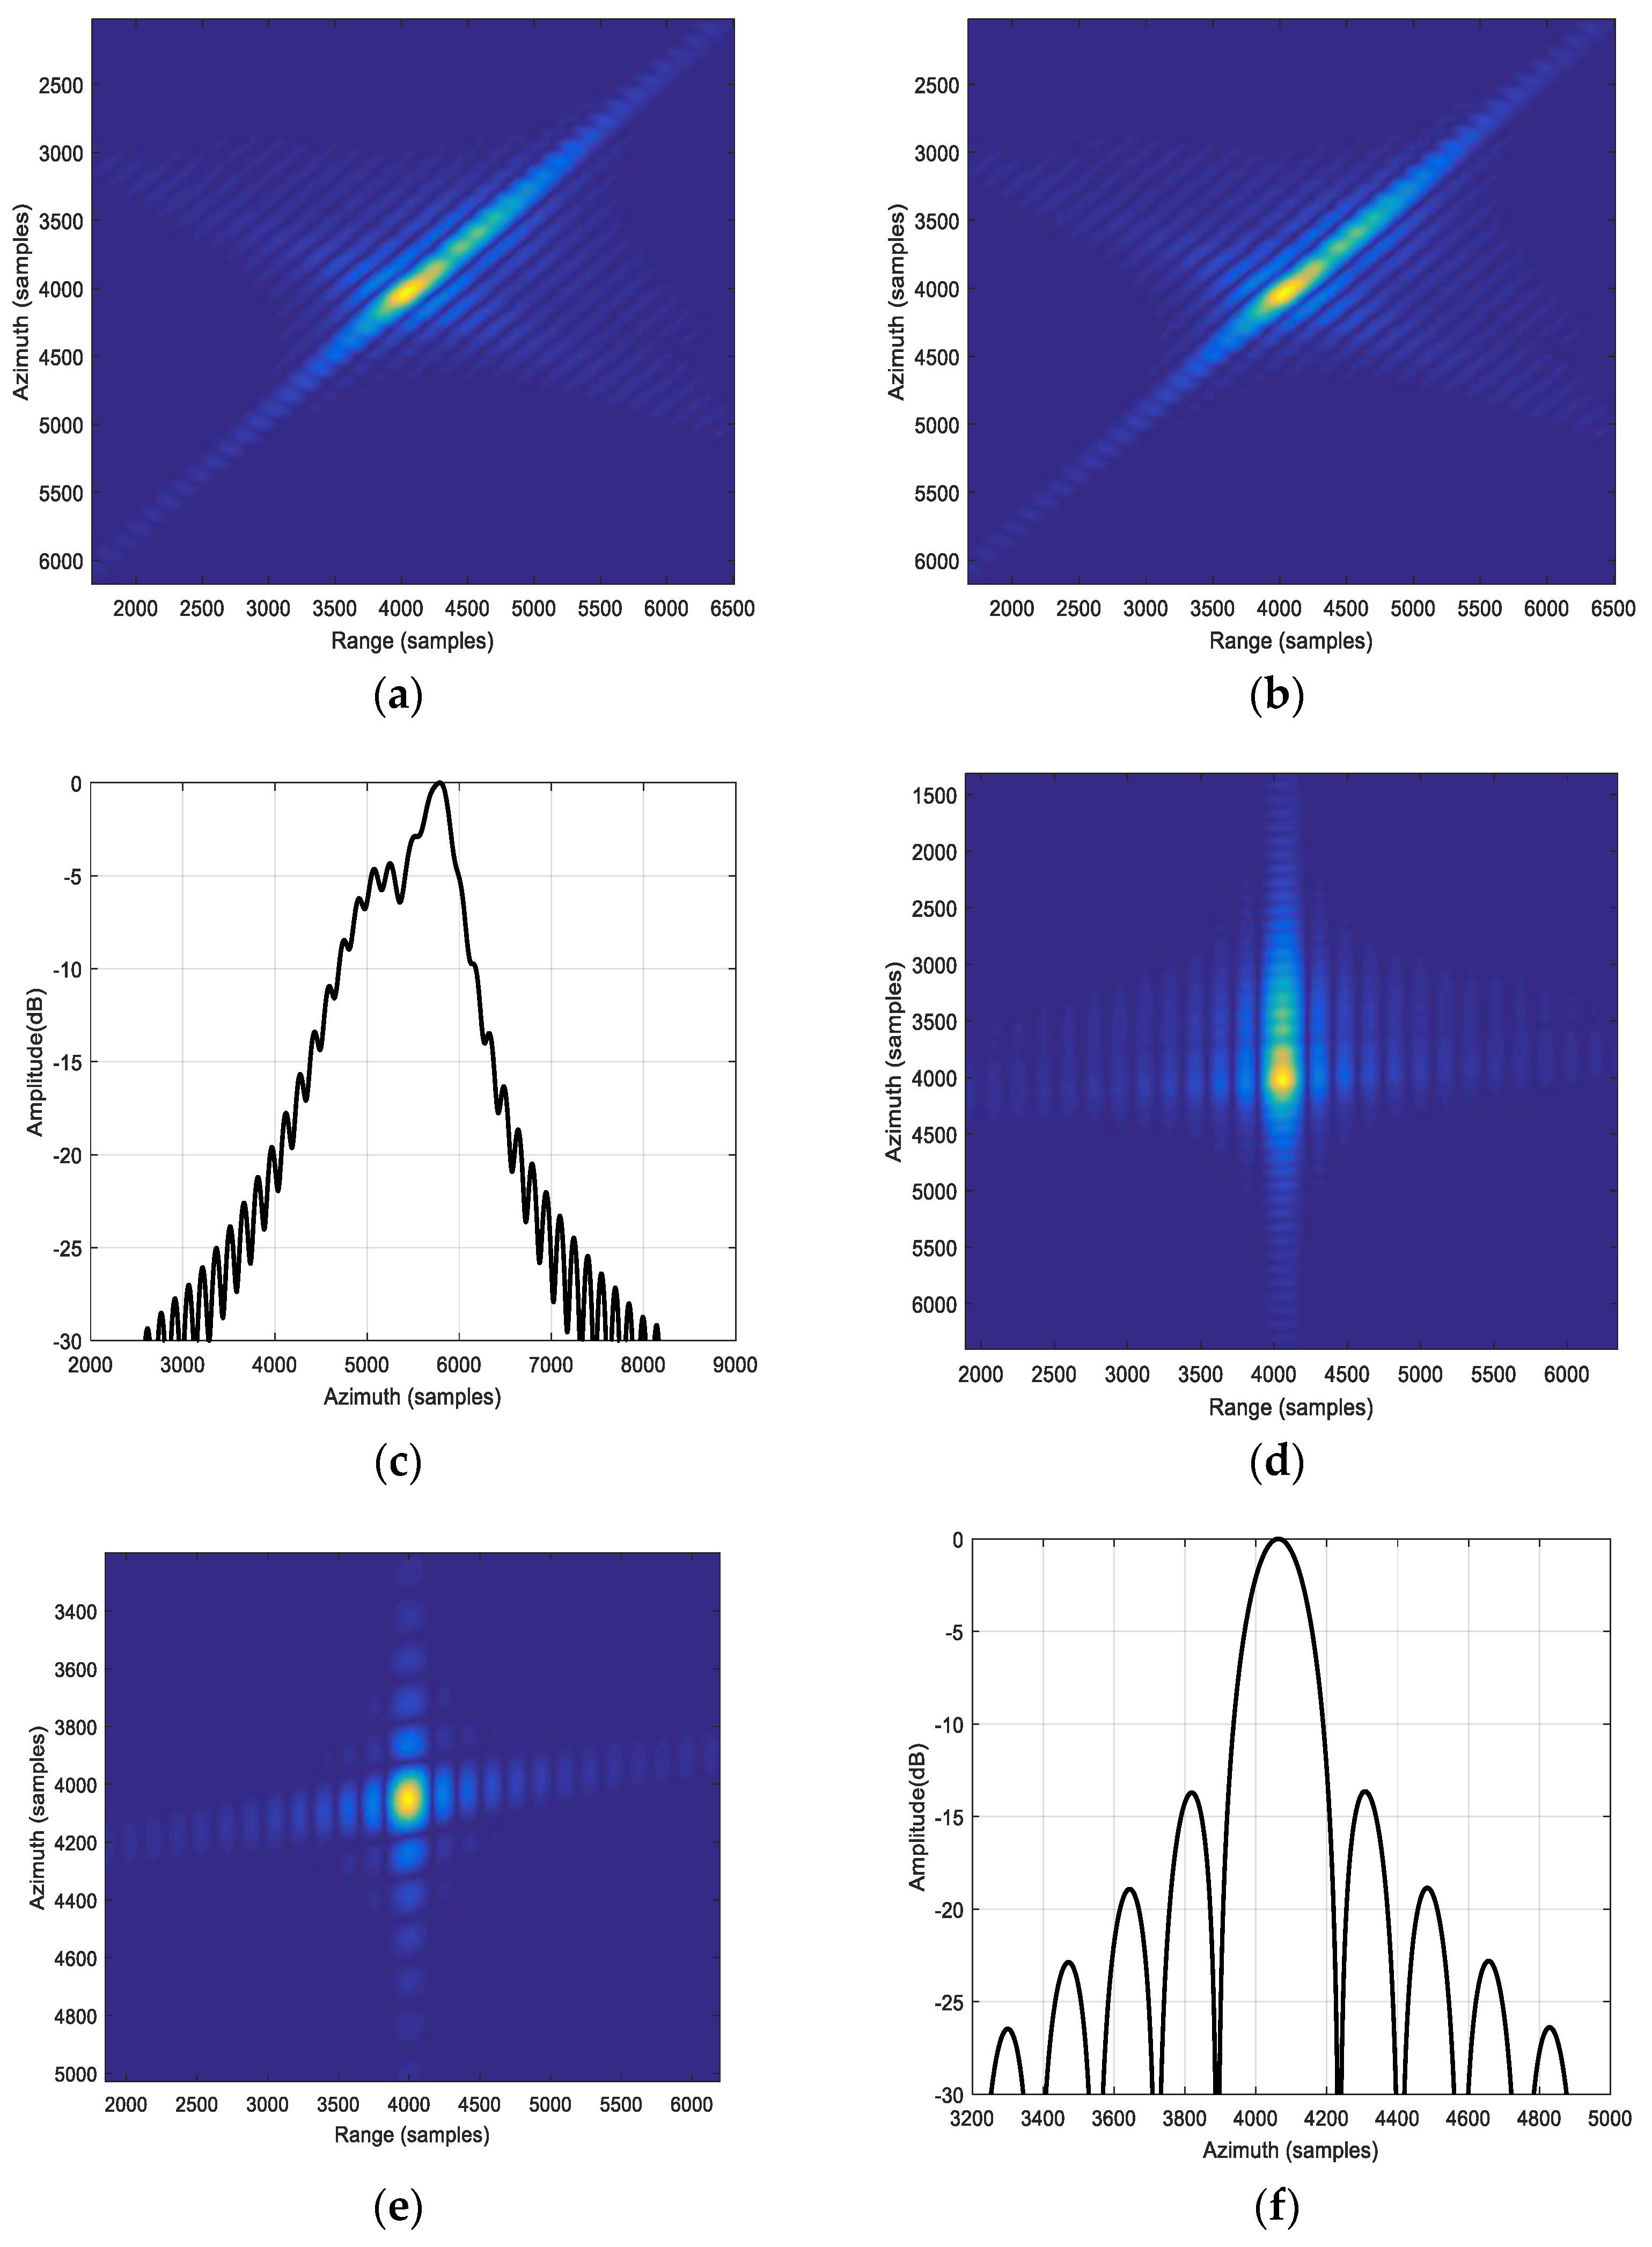
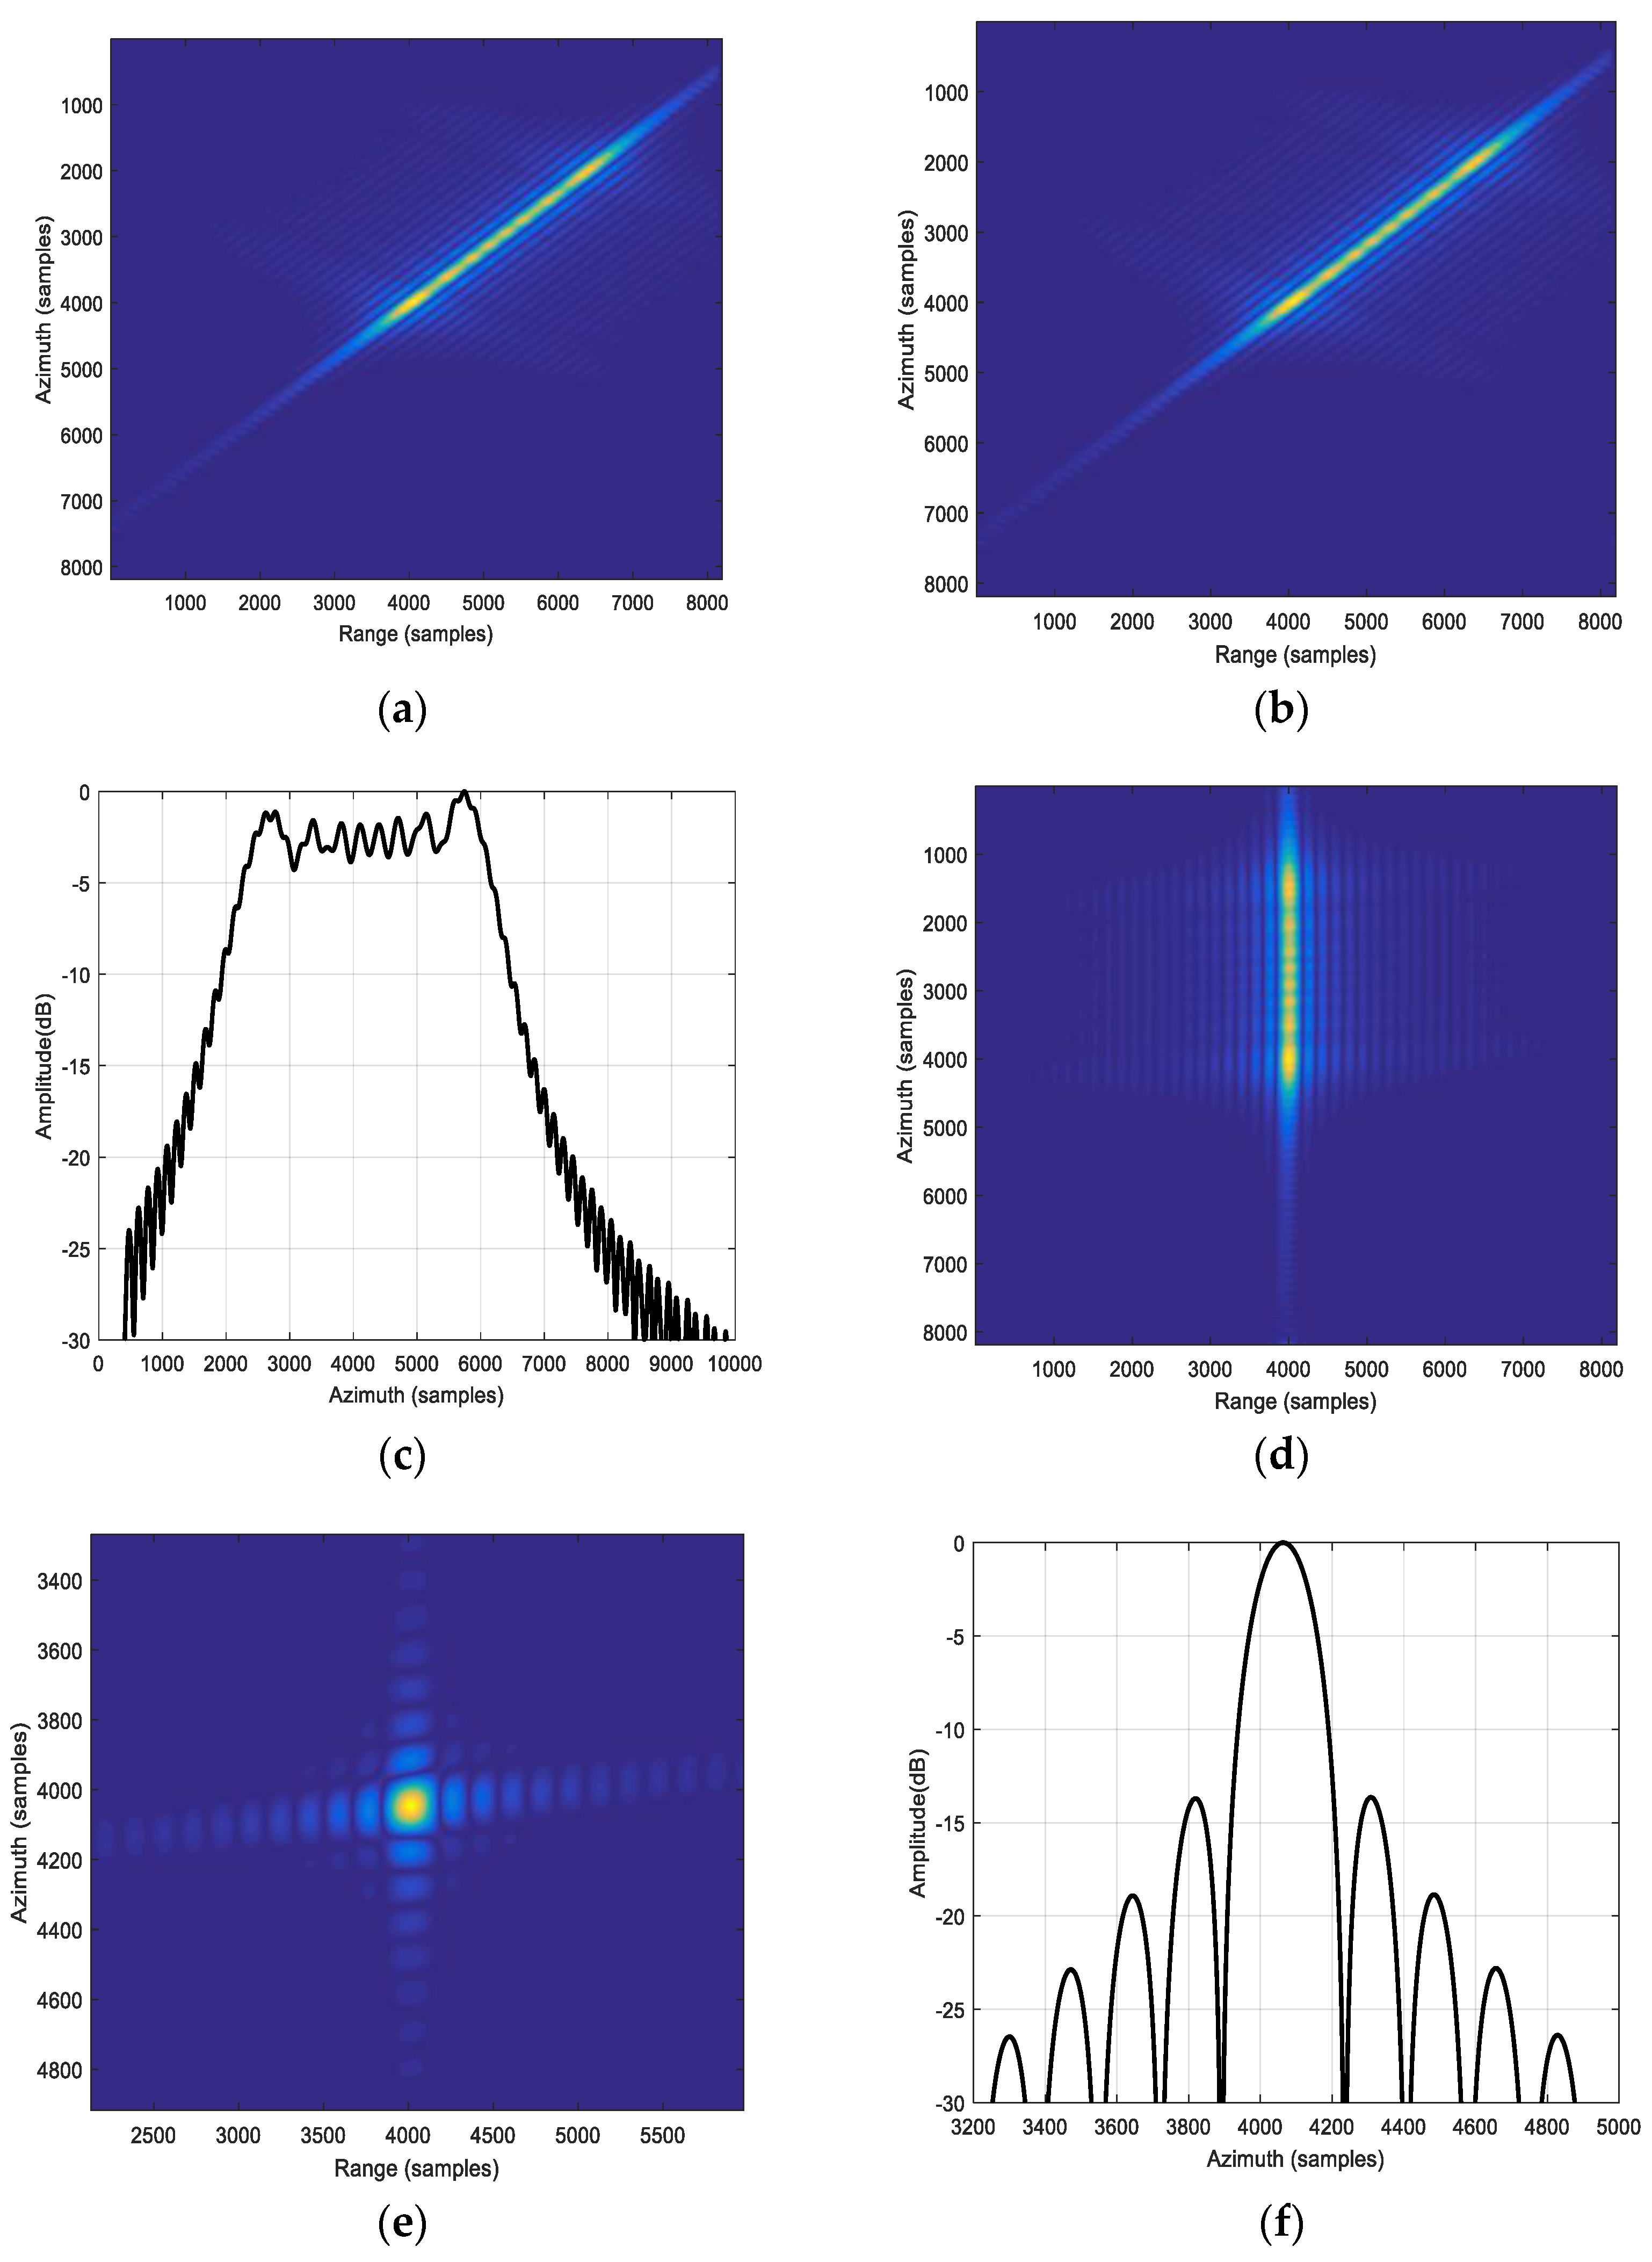
The PSF and the azimuth profiles of point T1 are shown in Figure 6a–c. It should be noted that the motion error is set as (0, 0, 2 sin 0.2 η). The comparison result of the PSF obtained by the rotating coordinate and the azimuth profiles is shown in Figure 6d–f. Clearly, if neglecting the impact of the PSF direction for the sidelobe tilt of the image obtained by the BP algorithm, PGA will not use the complete energy in the azimuth direction to estimate the phase gradient, resulting in the poor focusing performance shown in Figure 6c. After establishing the rotating imaging grids and imaging in the new coordinate, the azimuth sidelobe of the point target is parallel to the azimuth direction of the image. Thus, the phase gradient estimation function can work well, resulting in a significant improvement in imaging quality. The PSF and the azimuth profiles of point T2 are shown in Figure 7. Through the results in Figure 6 and Figure 7, the influence of the PSF and the effectiveness of the new rotating coordinate can be verified.

4.2. The Influence of the Wavenumber Spectrum Shifting and Truncation

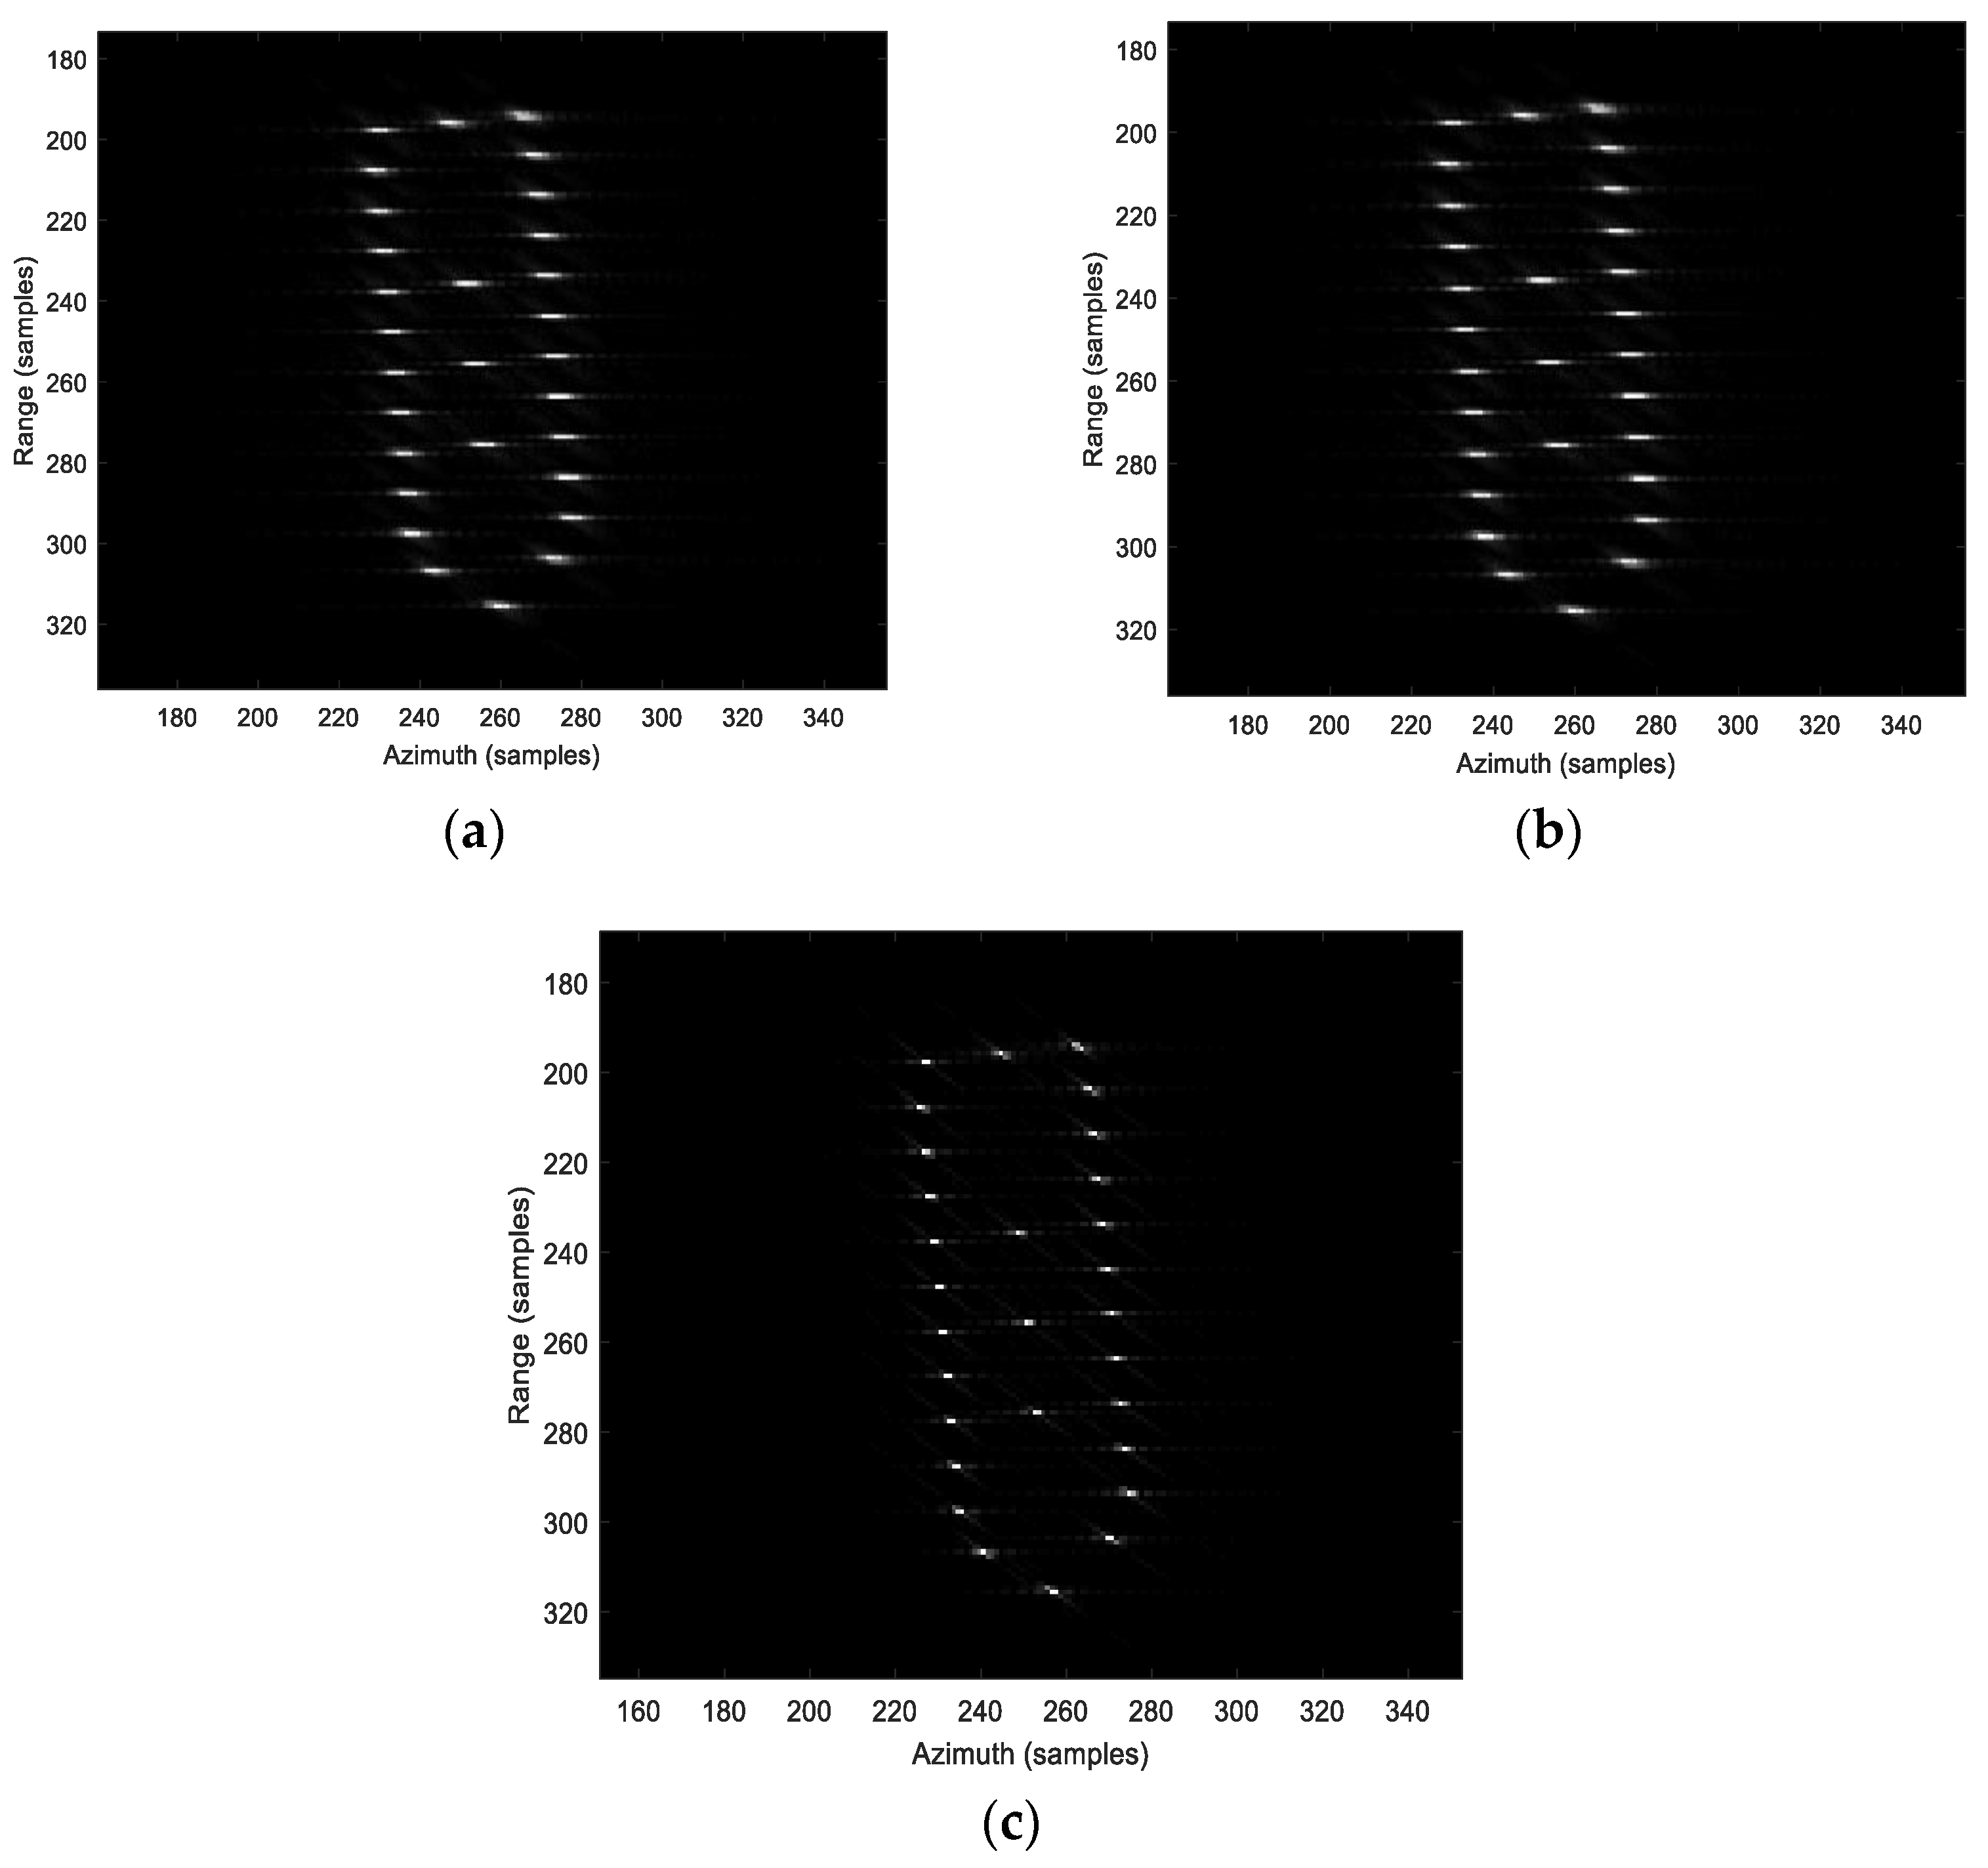
Figure 8a shows the coarse image obtained by the BP algorithm. The simulation of point target using the classical PGA and the proposed method with the same parameters as Section 4.1 are conducted for comparison in Figure 8b,c. The BP image is defocused, and there is no improvement in image quality when the classical PGA is used. It is due to the inaccurate phase error estimation that is caused by the wavenumber spectrum aliasing of the BP image and the extra phase noise from outside the target’s bandwidth. When the proposed method is utilized, the imaging result can be focused well. Figure 9 shows the wavenumber support region of the BP image and the azimuth wavenumber spectrum after shifting. It can be seen that the wavenumber spectrum of all targets has been moved to the center of the image, which is in accordance with the theoretical analysis.
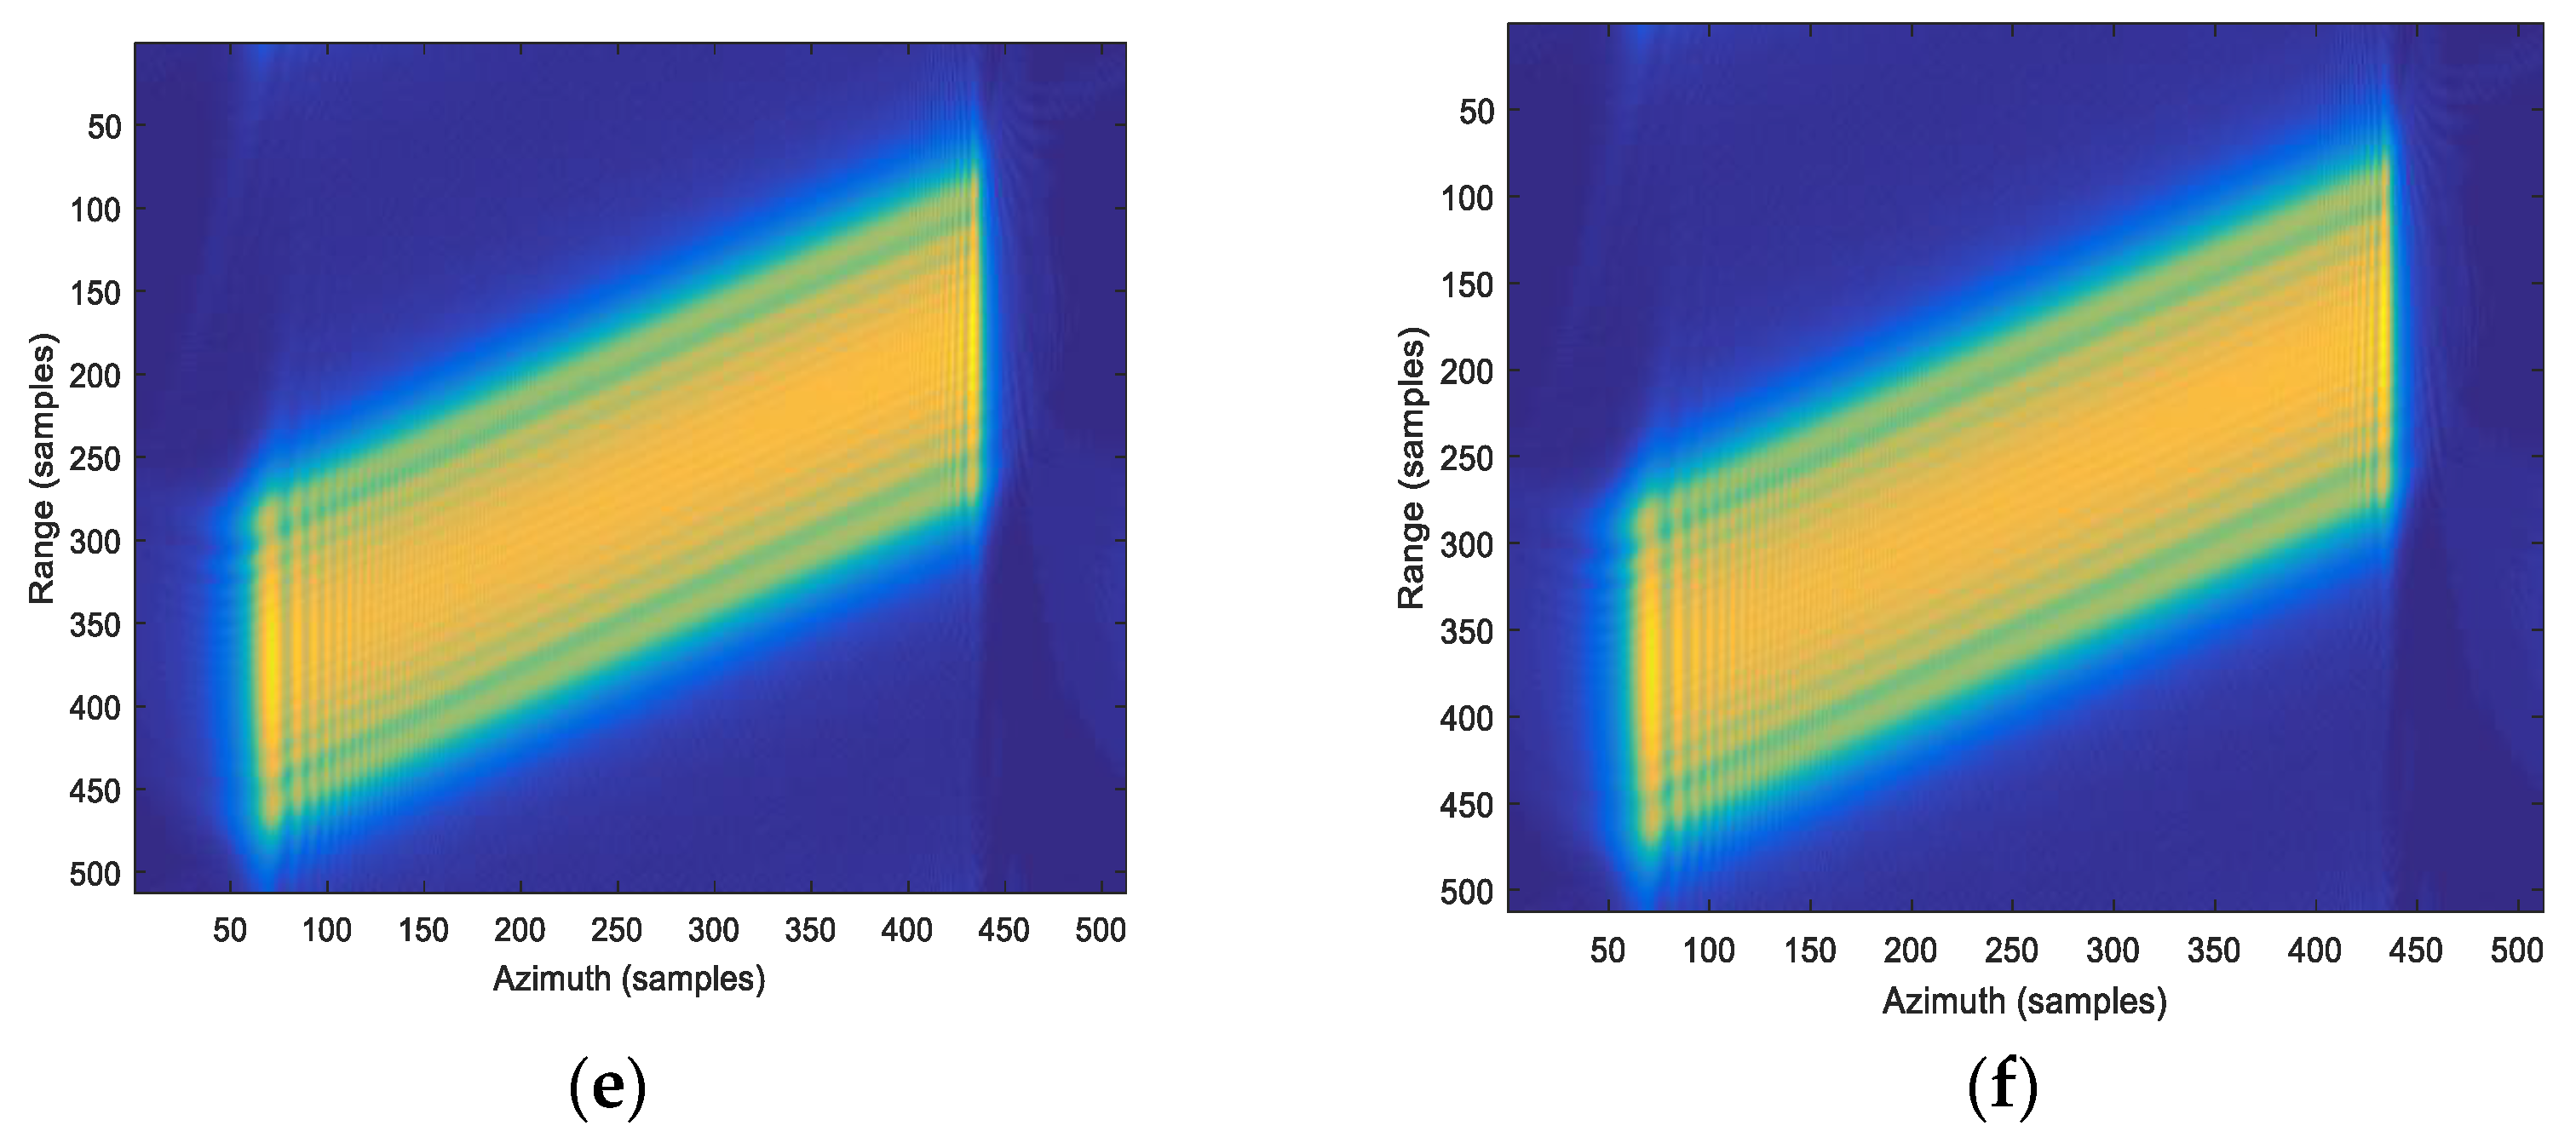
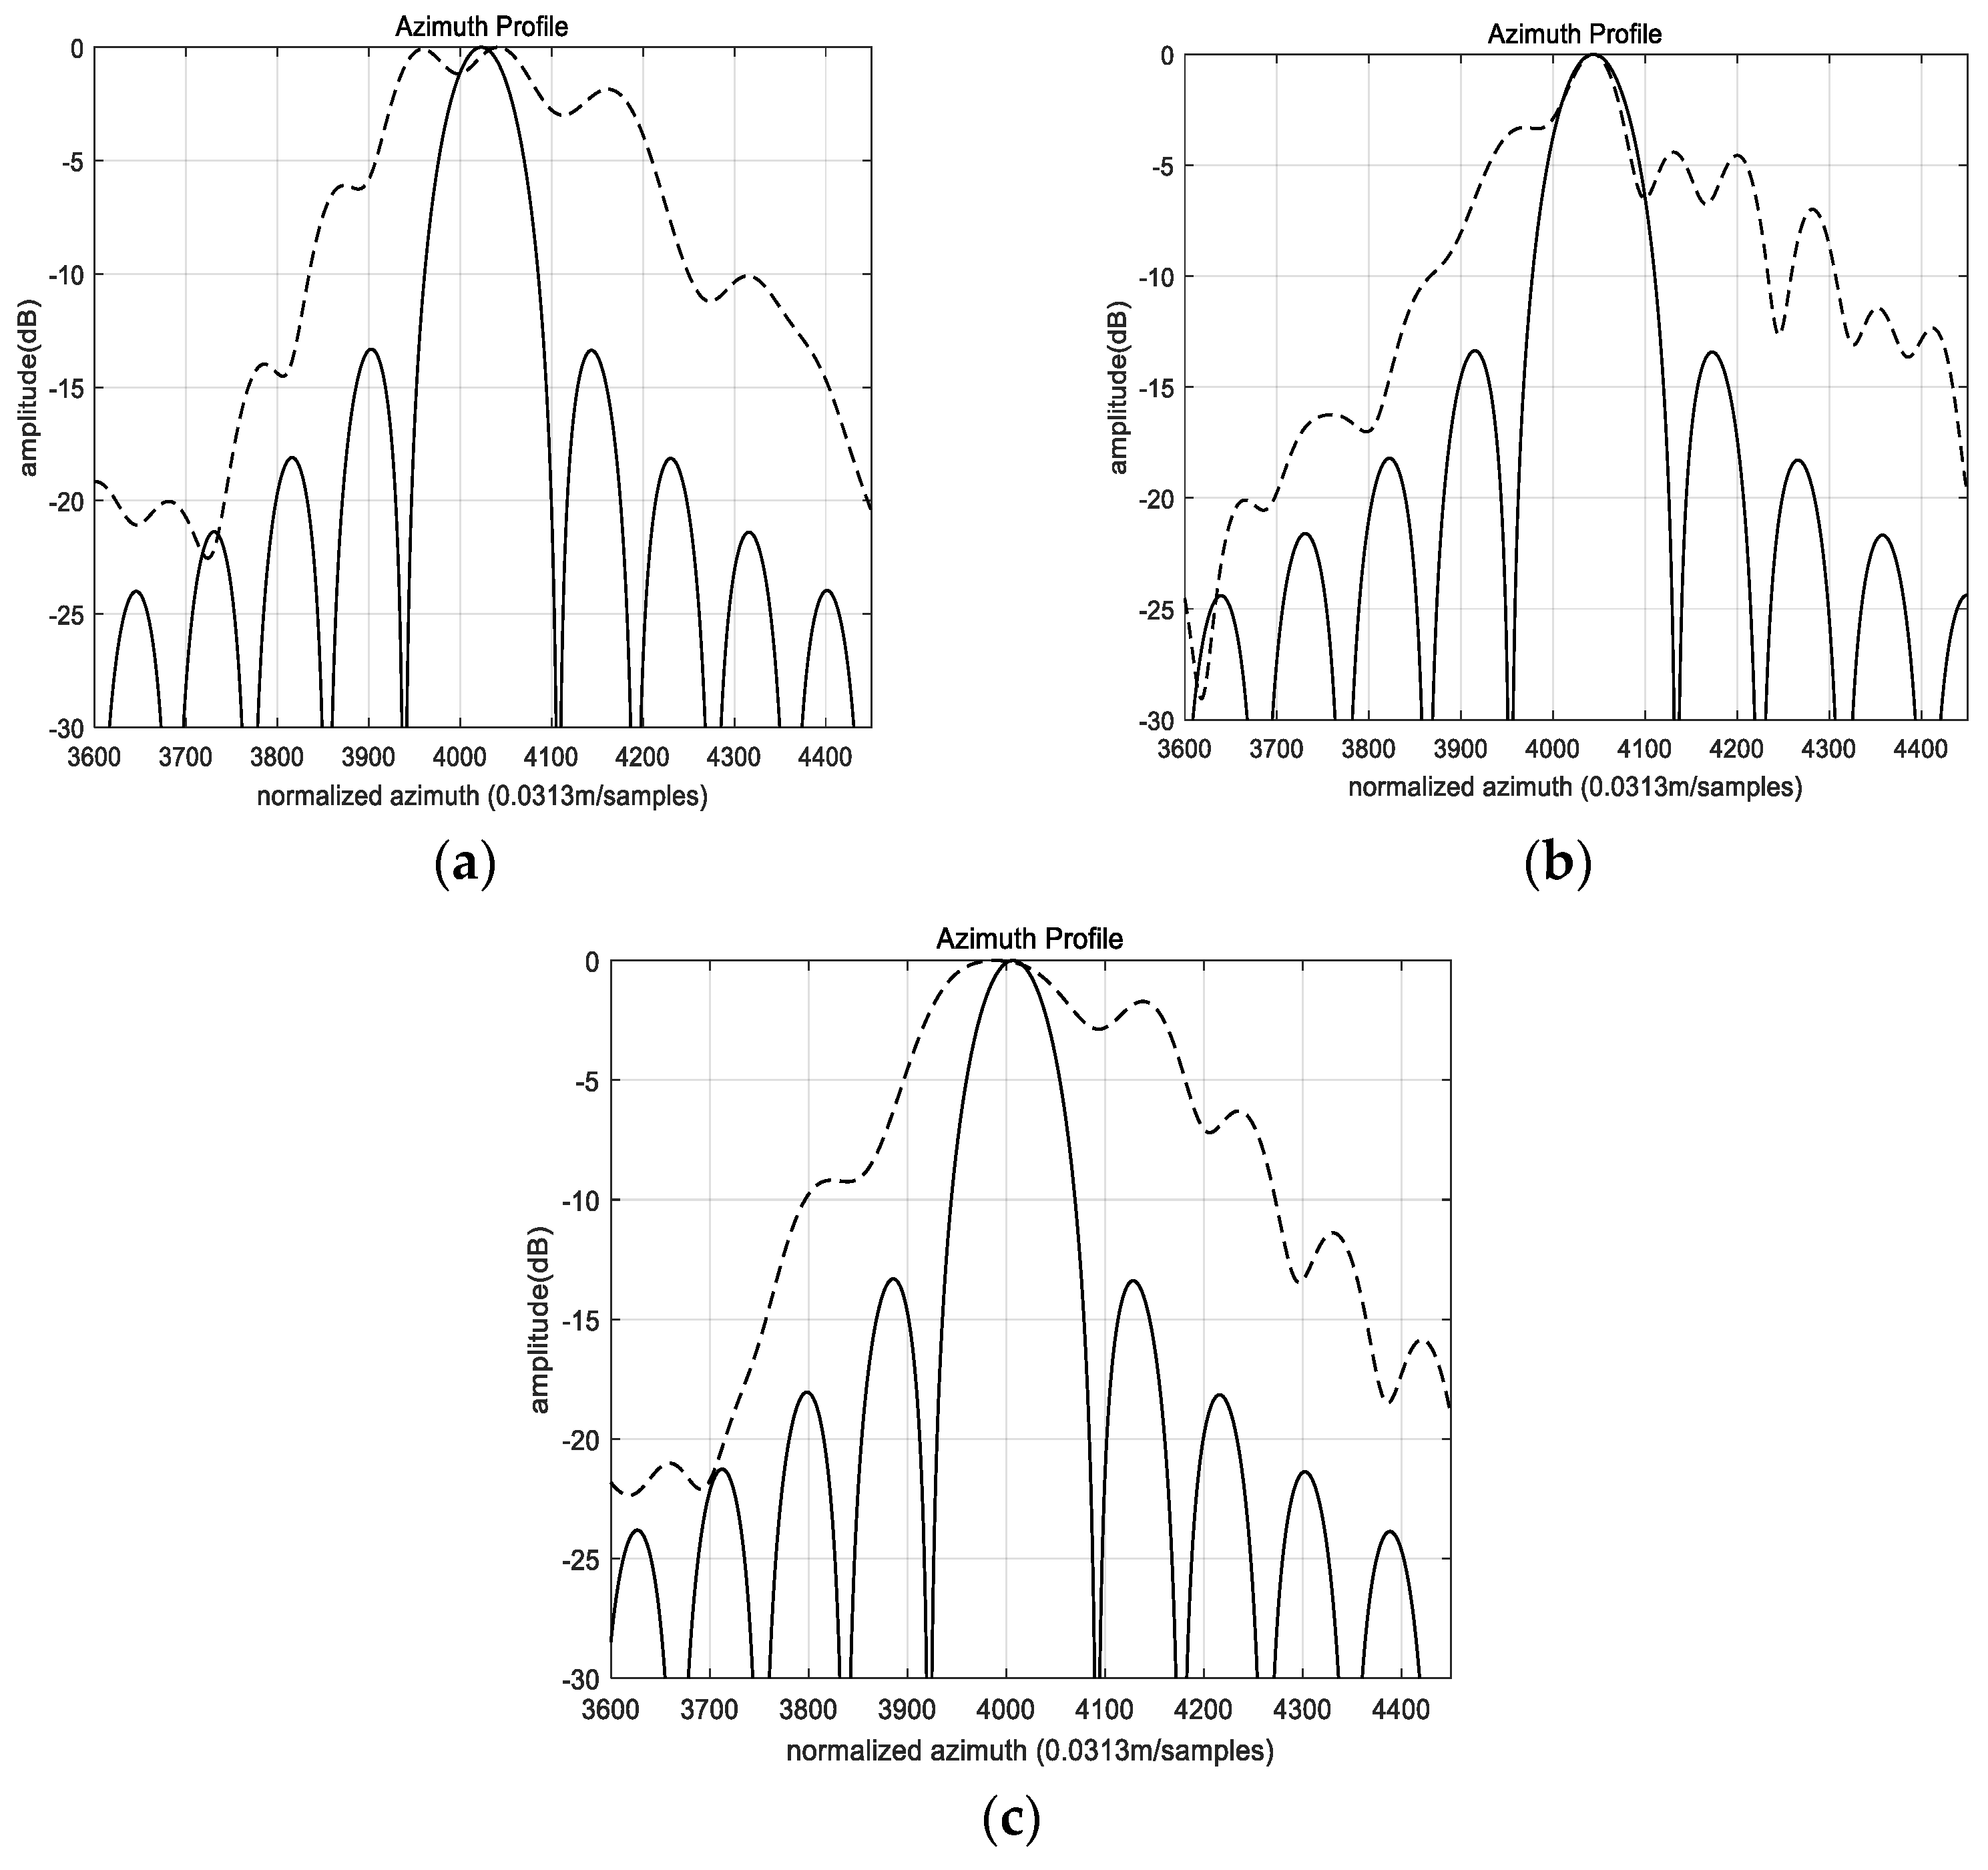
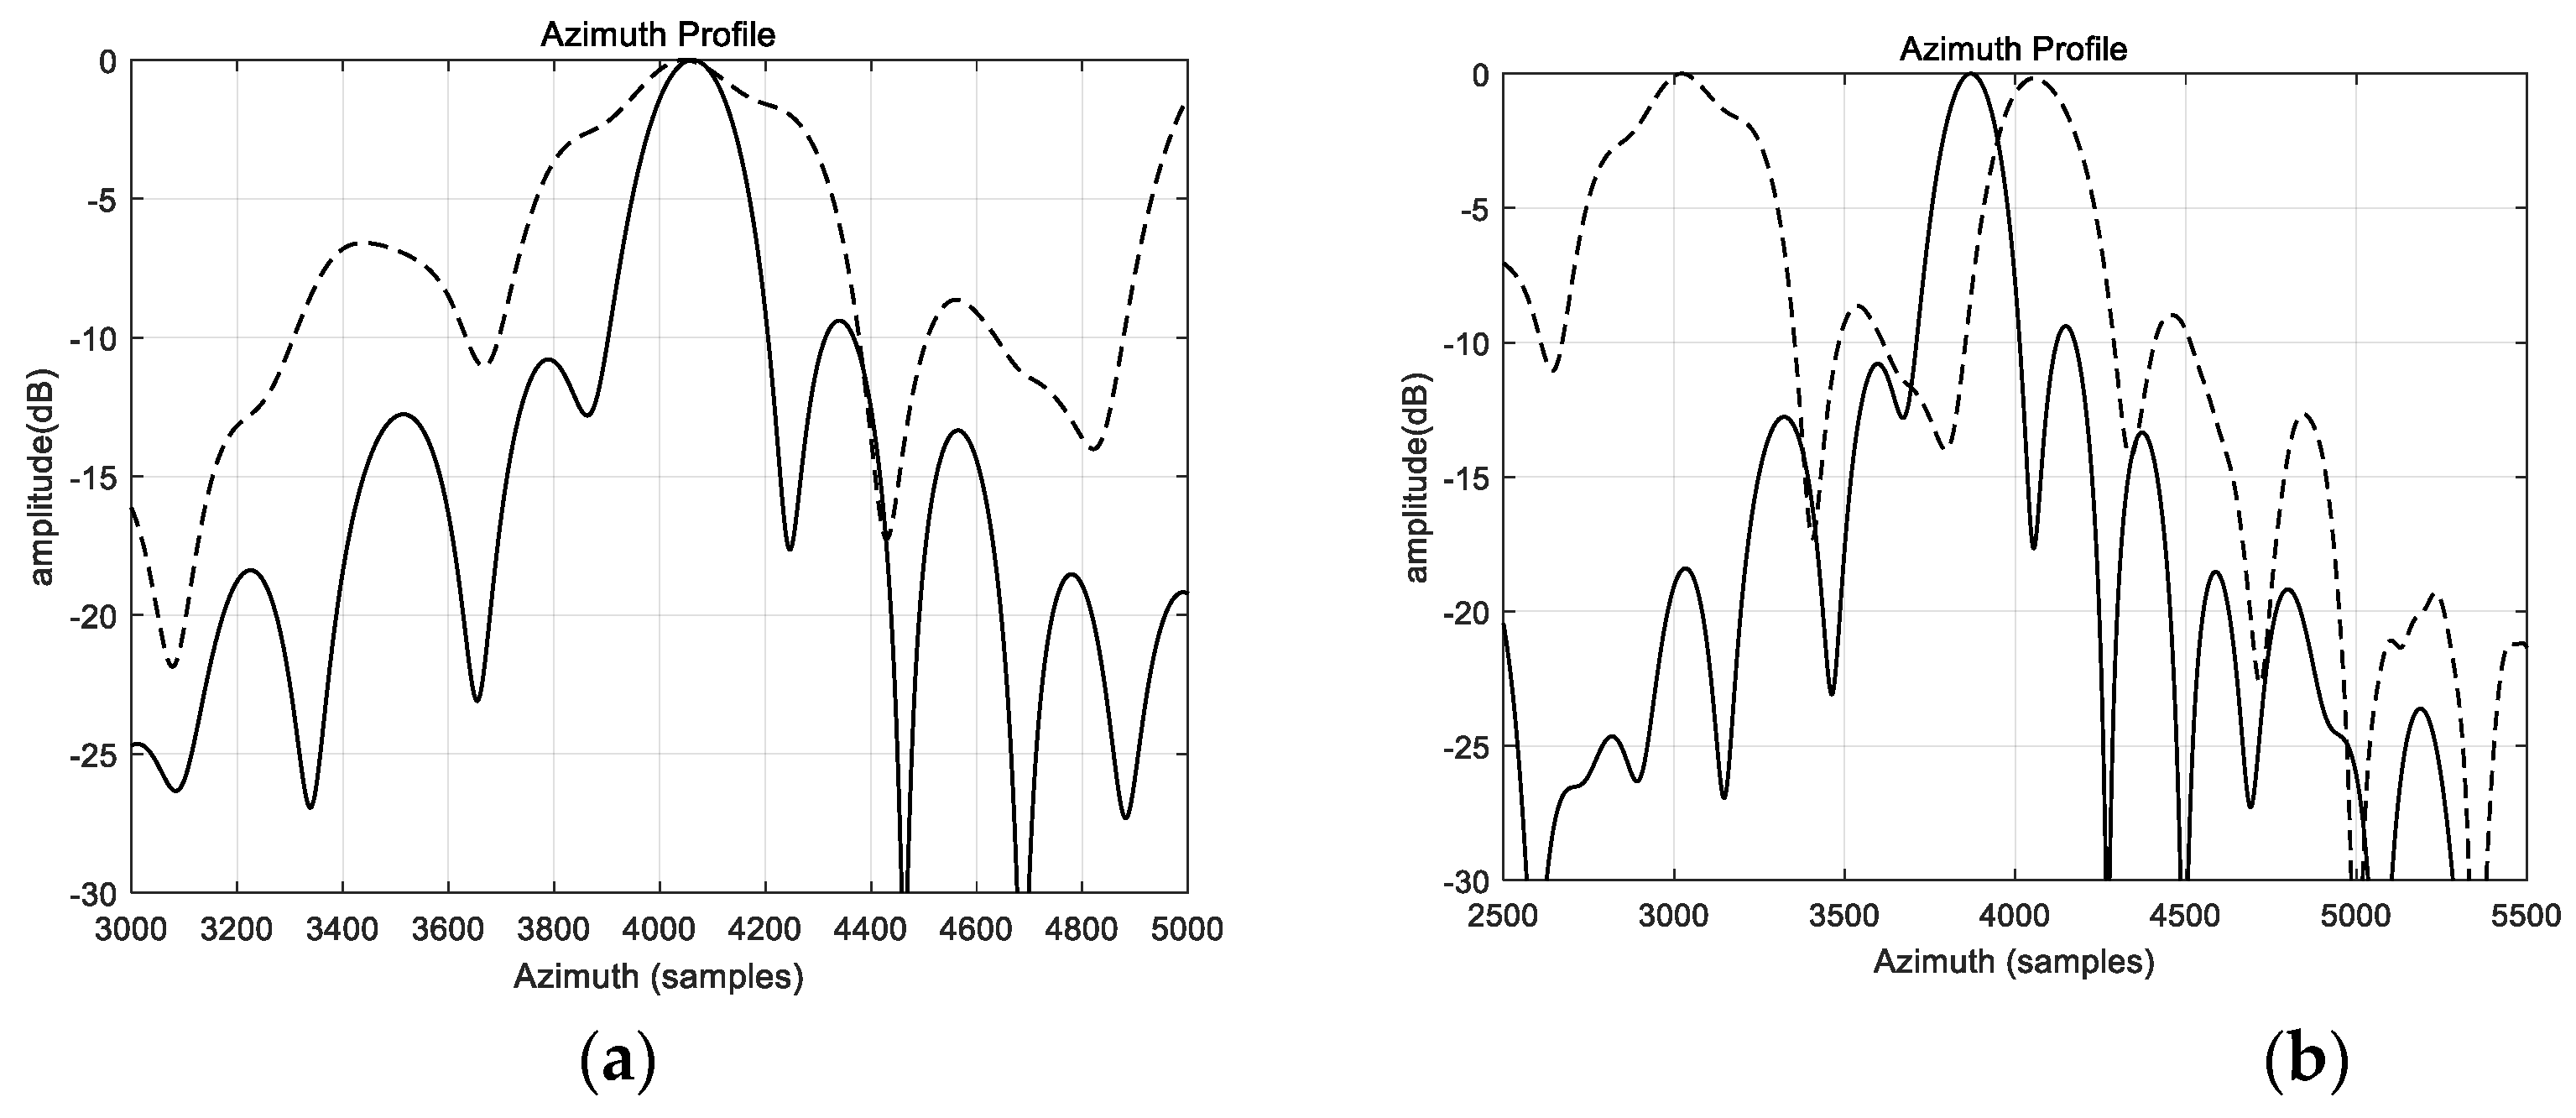
To further illustrate the influence of the wavenumber spectrum shifting, Figure 10 presents the two-dimensional spectrums of the BP image and the proposed method of points T1, T2, and T3. As can be seen, the spectrum range in the azimuth direction is reduced. The two-dimensional spectrums are also moved to the image center due to the phase multiplication in Equation (6). The azimuth profiles of the imaging results using the classical PGA and the proposed method are shown in Figure 11. It can be seen that the sidelobes obtained by the classical PGA are raised due to the residual phase error, while the proposed method could exhibit an ideal performance. Table 2 shows the peak to sidelobe ratio (PSLR), integrated sidelobe ratio (ISLR), and azimuth resolution (Azi Res). The indexes indicate that a better image is produced due to the wavenumber center alignment and wavenumber spectrum truncation. The point targets simulations confirm that the influence of the PSF, the wavenumber center alignment, and the spectrum truncation should be concerned when the extra motion error for trajectory exists in the high squint mode. It is worth noting that the performance of auto-focusing algorithms can be influenced by various factors, including the targets’ positions within the scene (i.e., central or edge), target movements, and motion errors of the SAR platform. However, in the case of the simulated 260 m × 80 m ship target scene, the proposed method demonstrated consistent performance across different target positions. Notably, the differences in performance, particularly in terms of sidelobe levels and azimuth resolution, were minimal between the central target (T1) and the edge targets (T2 and T3), as evident from Table 2 and Figure 11.
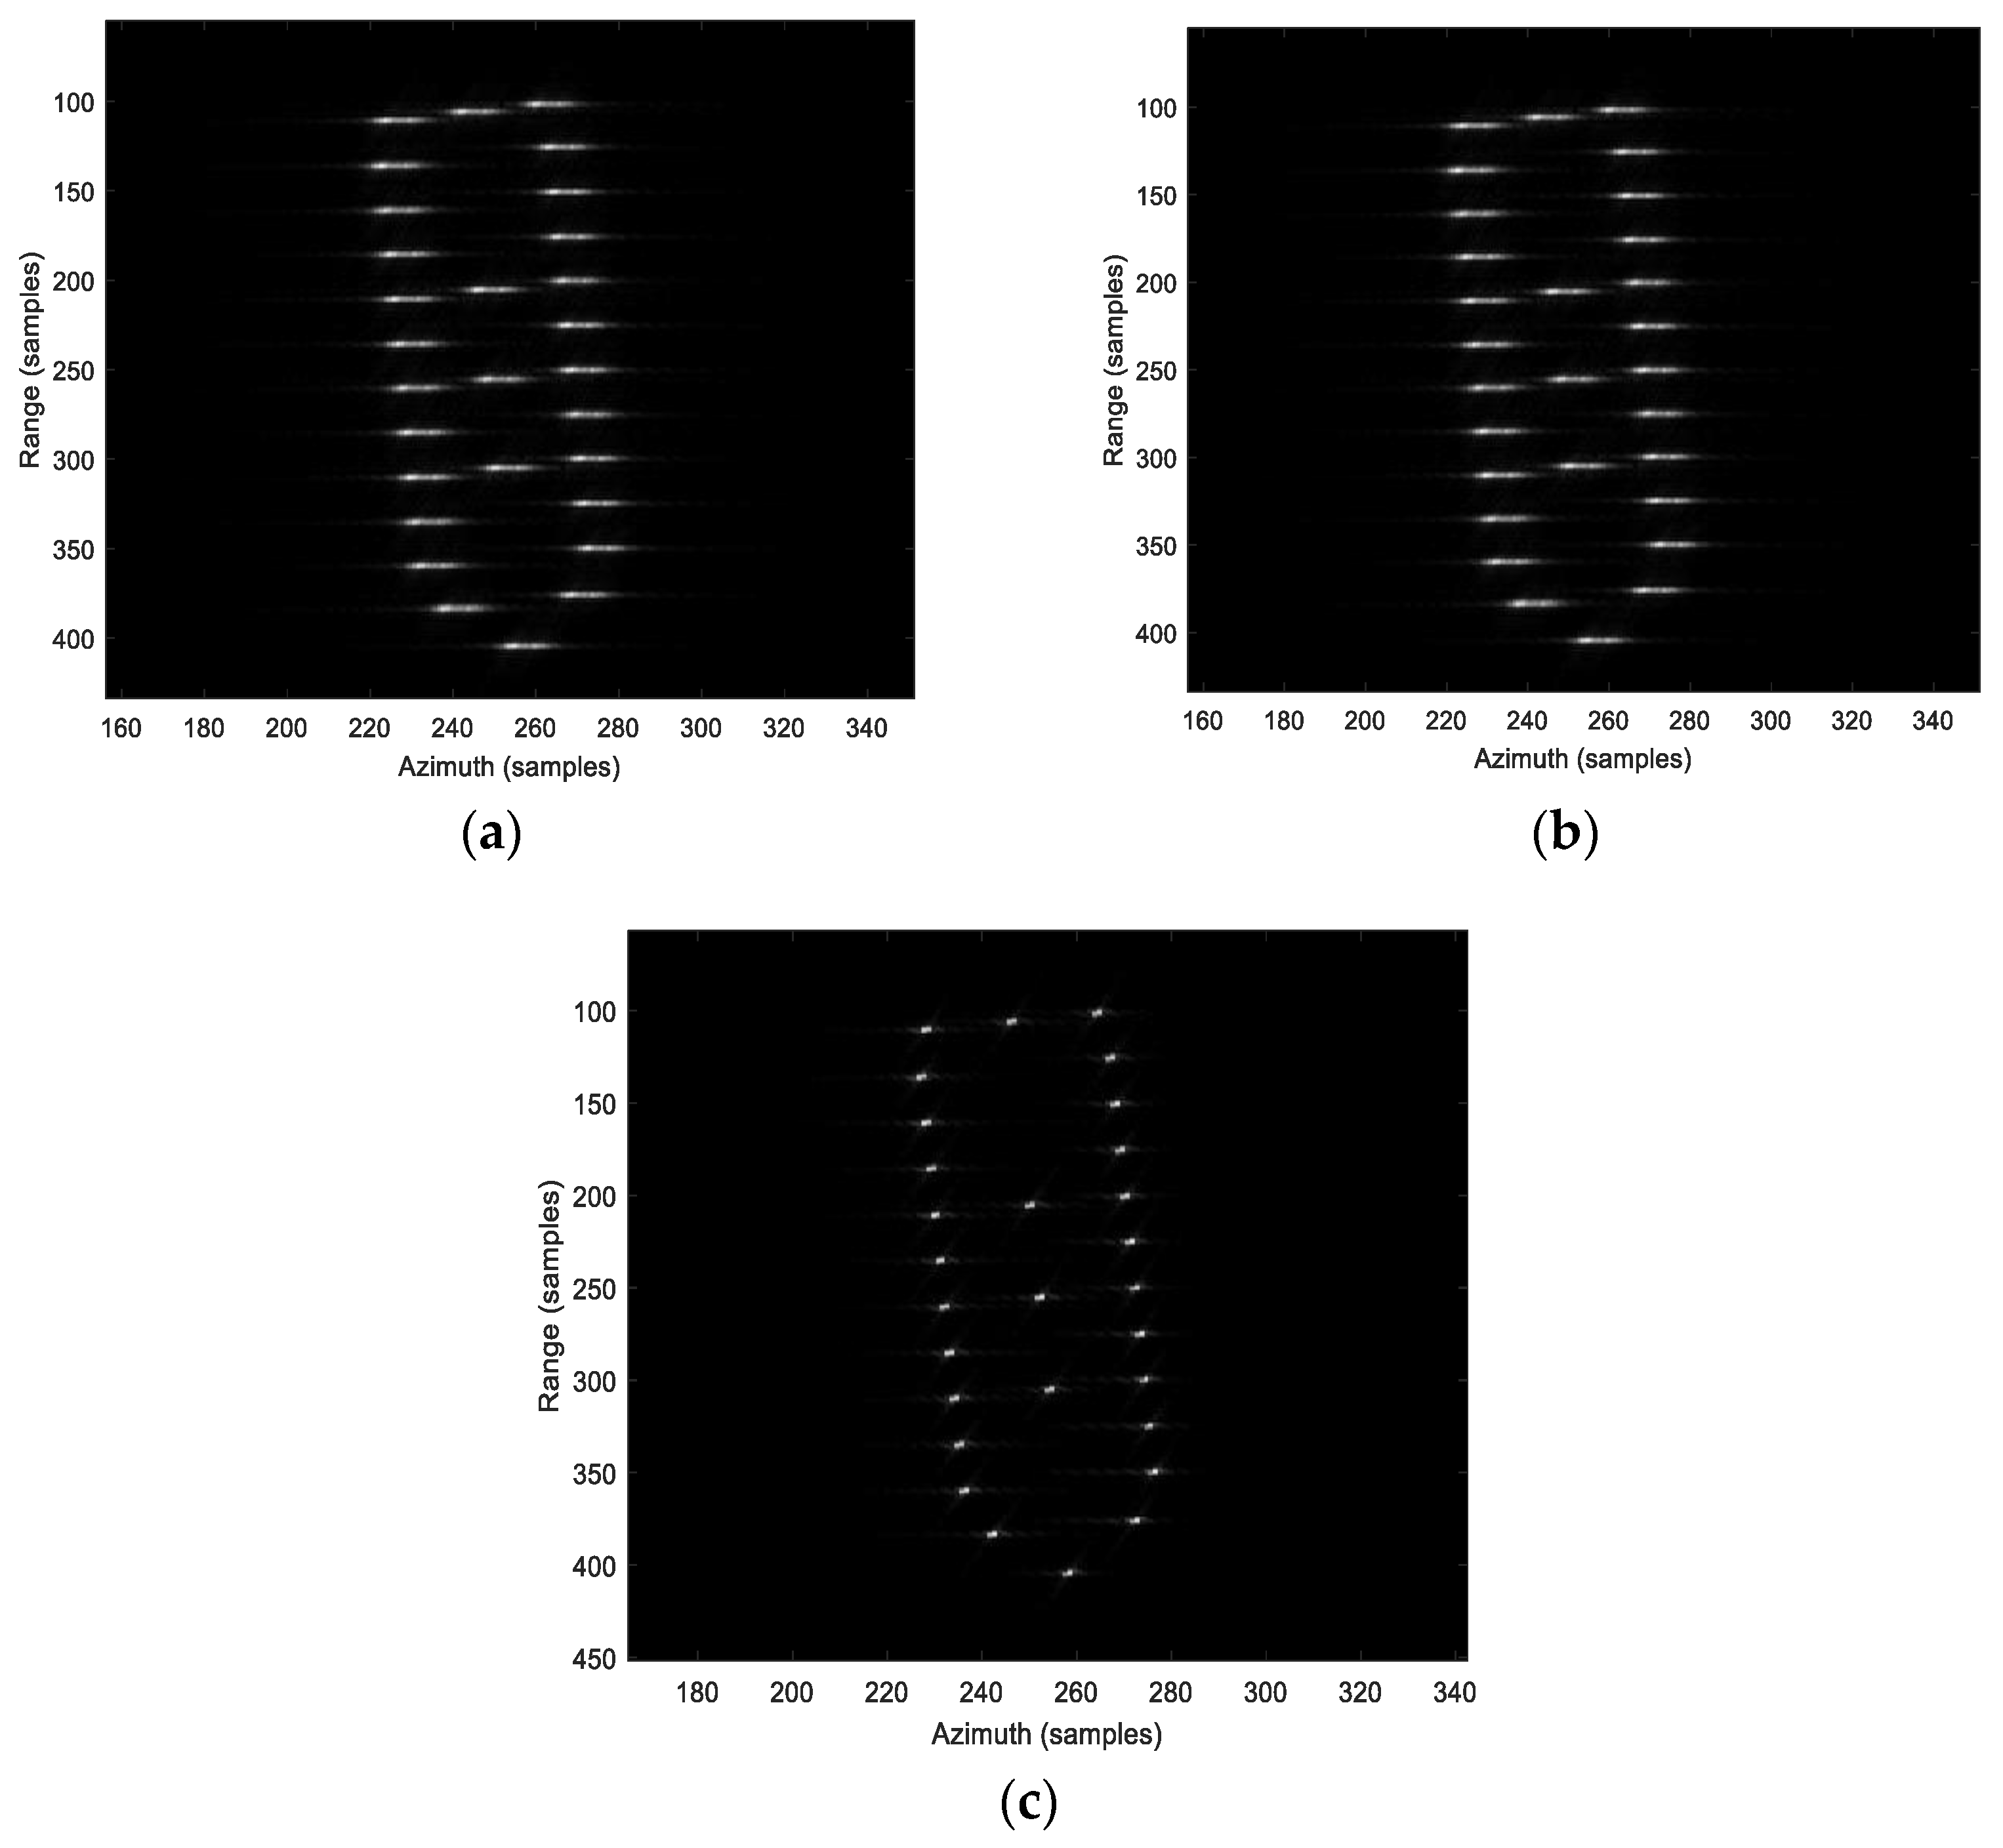
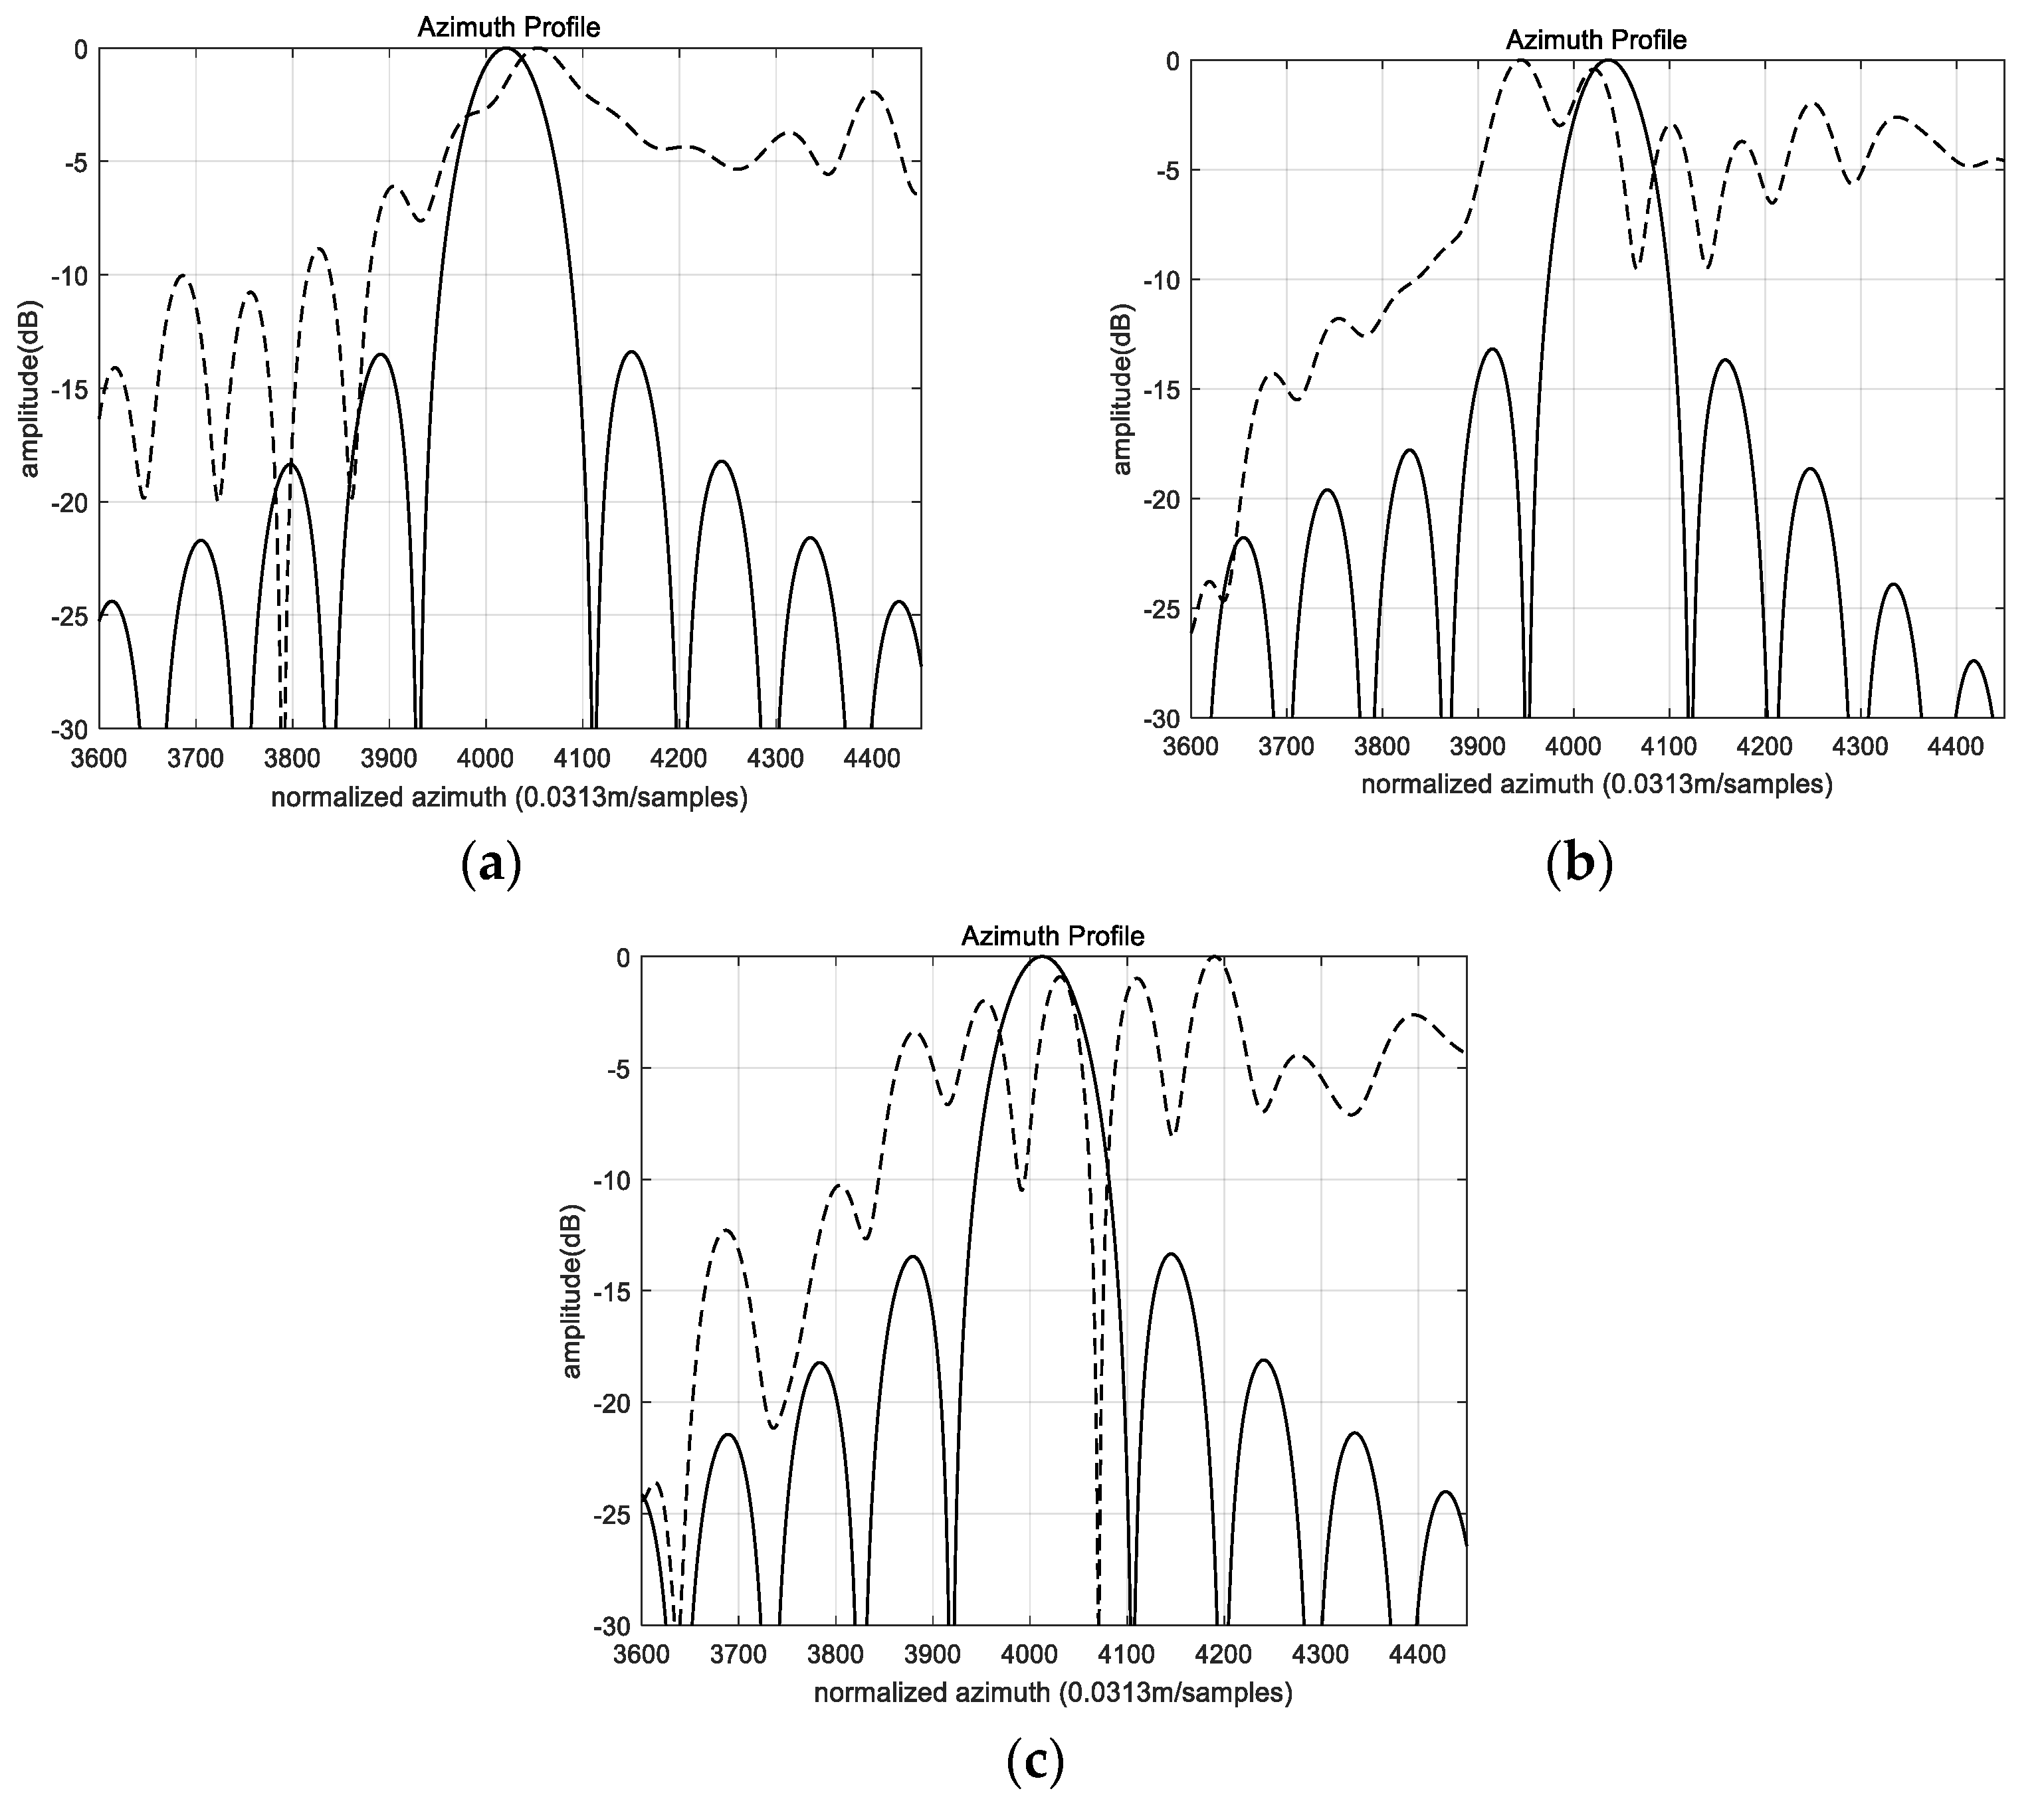
To test the performance of the proposed method under the different motion errors, a case where the motion error is set as (0, 0, 10 sin 0.2 η) m as shown in Figure 12 and Figure 13. Compared with the previous simulation under motion error (0, 0, 2 sin 0.2 η), a degradation in image quality as expected can be seen from the coarse image Figure 12a and the image by classical PGA Figure 12b, while the proposed method provides a decent focusing performance in Figure 12c. Moreover, the azimuth profiles of different selected targets focus well for their mainlobes and sidelobes achieve acceptable levels as shown in Figure 13, proving the effectiveness of the proposed method under high motion errors.
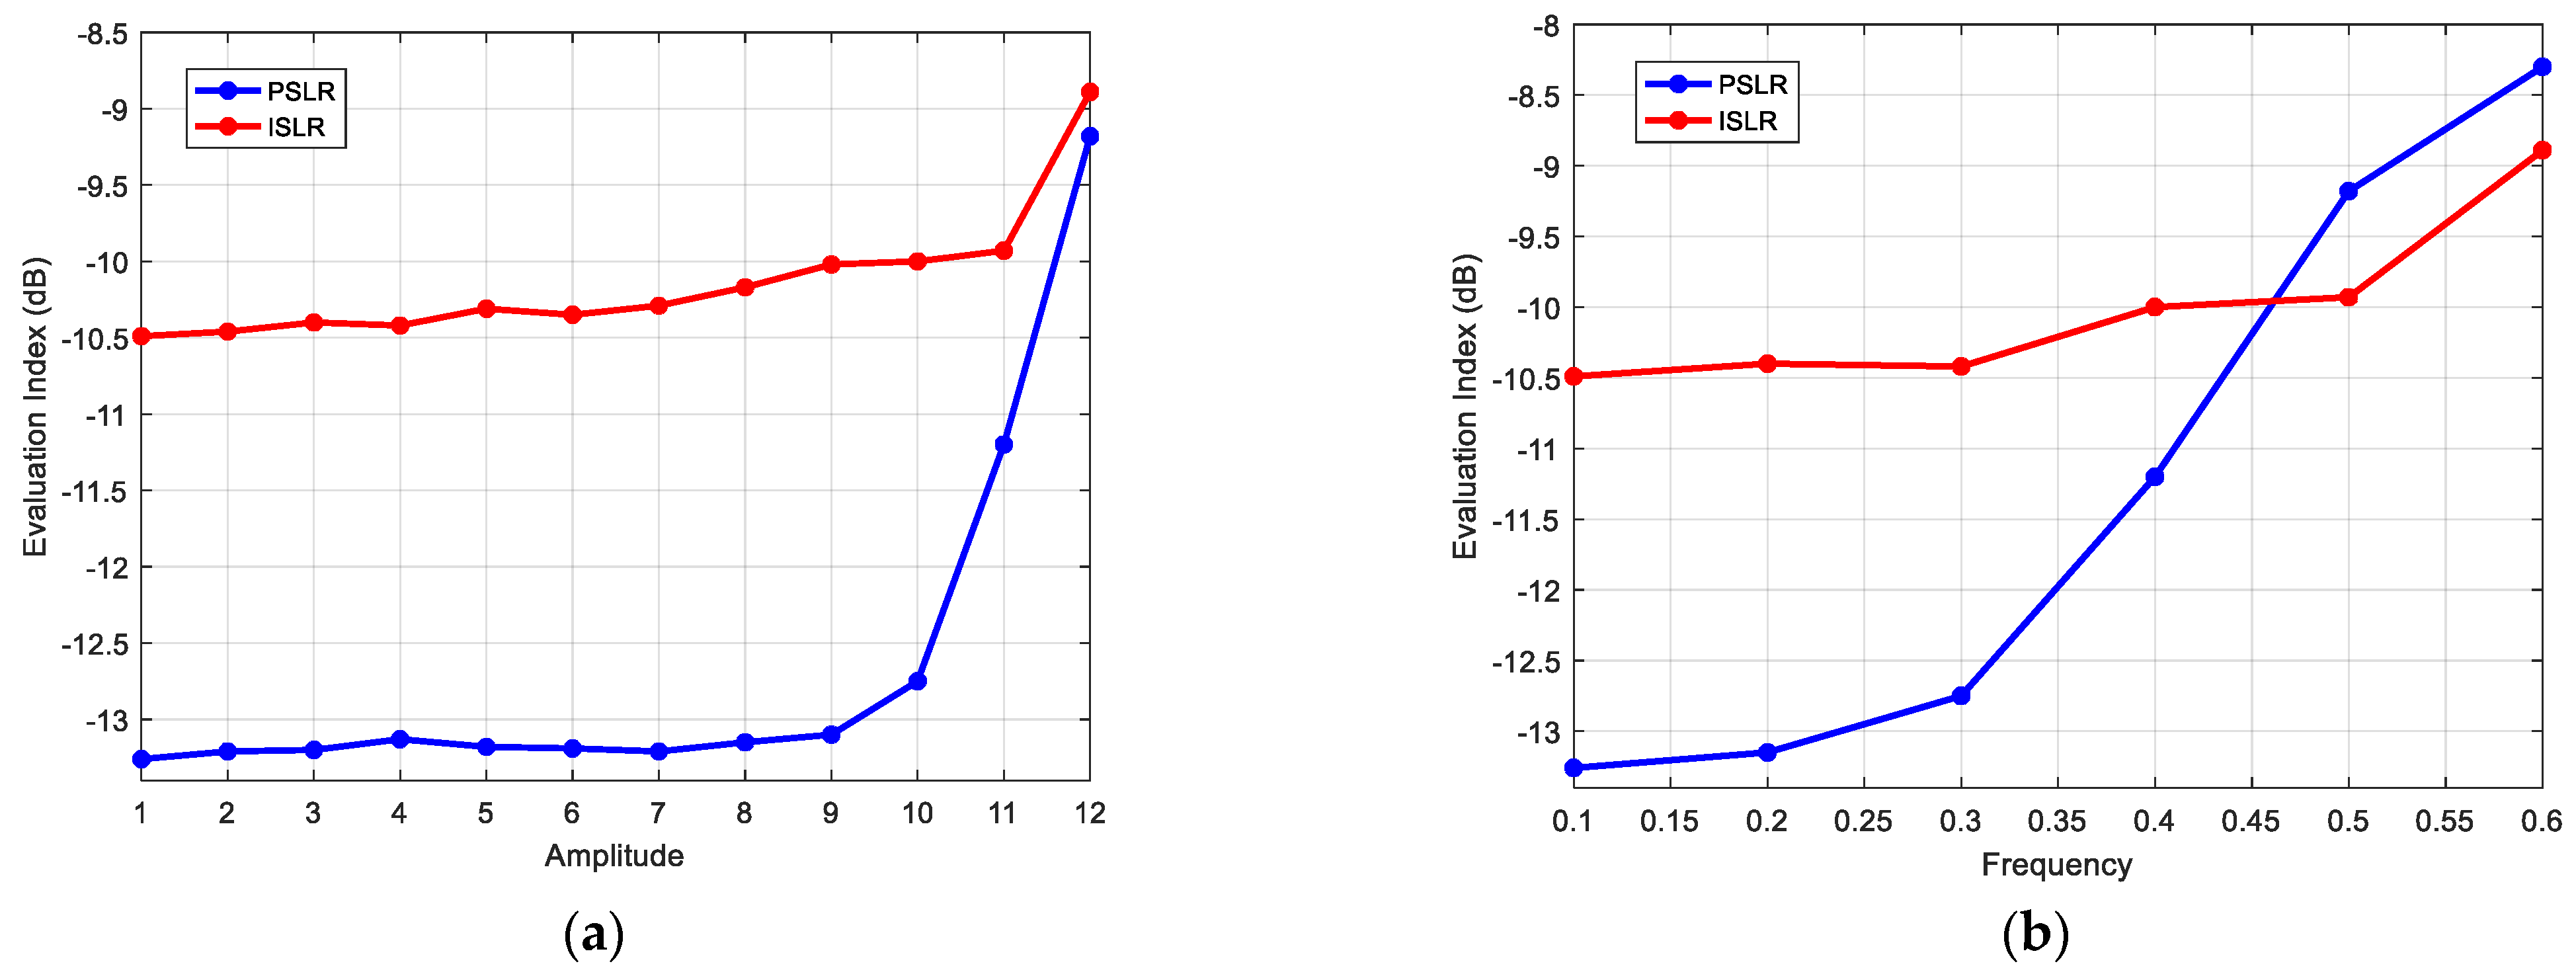
To evaluate the limitations of the proposed method, the PSLR and ISLR of point T2 in the previous simulation were selected. The function of the PSLR and ISLR with variable, the amplitude, and the frequency of the motion error, were all drawn in Figure 14. The performance drops when increasing the amplitude and the frequency as expected, but the algorithm still helps the focusing of the imaging. To provide a well-focused image, the maximum amplitude of the motion error was suggested as below 10 and the maximum frequency was below 0.3.

4.3. Real Data Experiment

In order to further evaluate the superiority of the proposed algorithm, two airborne spotlight SAR datasets are selected for further processing. Operating in the Ku-band at high squint mode, the echo data were obtained by an airborne SAR system and achieving resolution of 5 × 5 m (range × azimuth) and an area of 1.5 × 2 km. The speed of the plane is 60 m/s. Pulse repetition frequency was set as 4400 Hz. The distance between the scene center and the flying track was 50 km with a height of 2 km. The scene for the first set of experiments was natural scenes of villages and farmland. The scene illuminated by the second set of experiments was the corner reflectors.
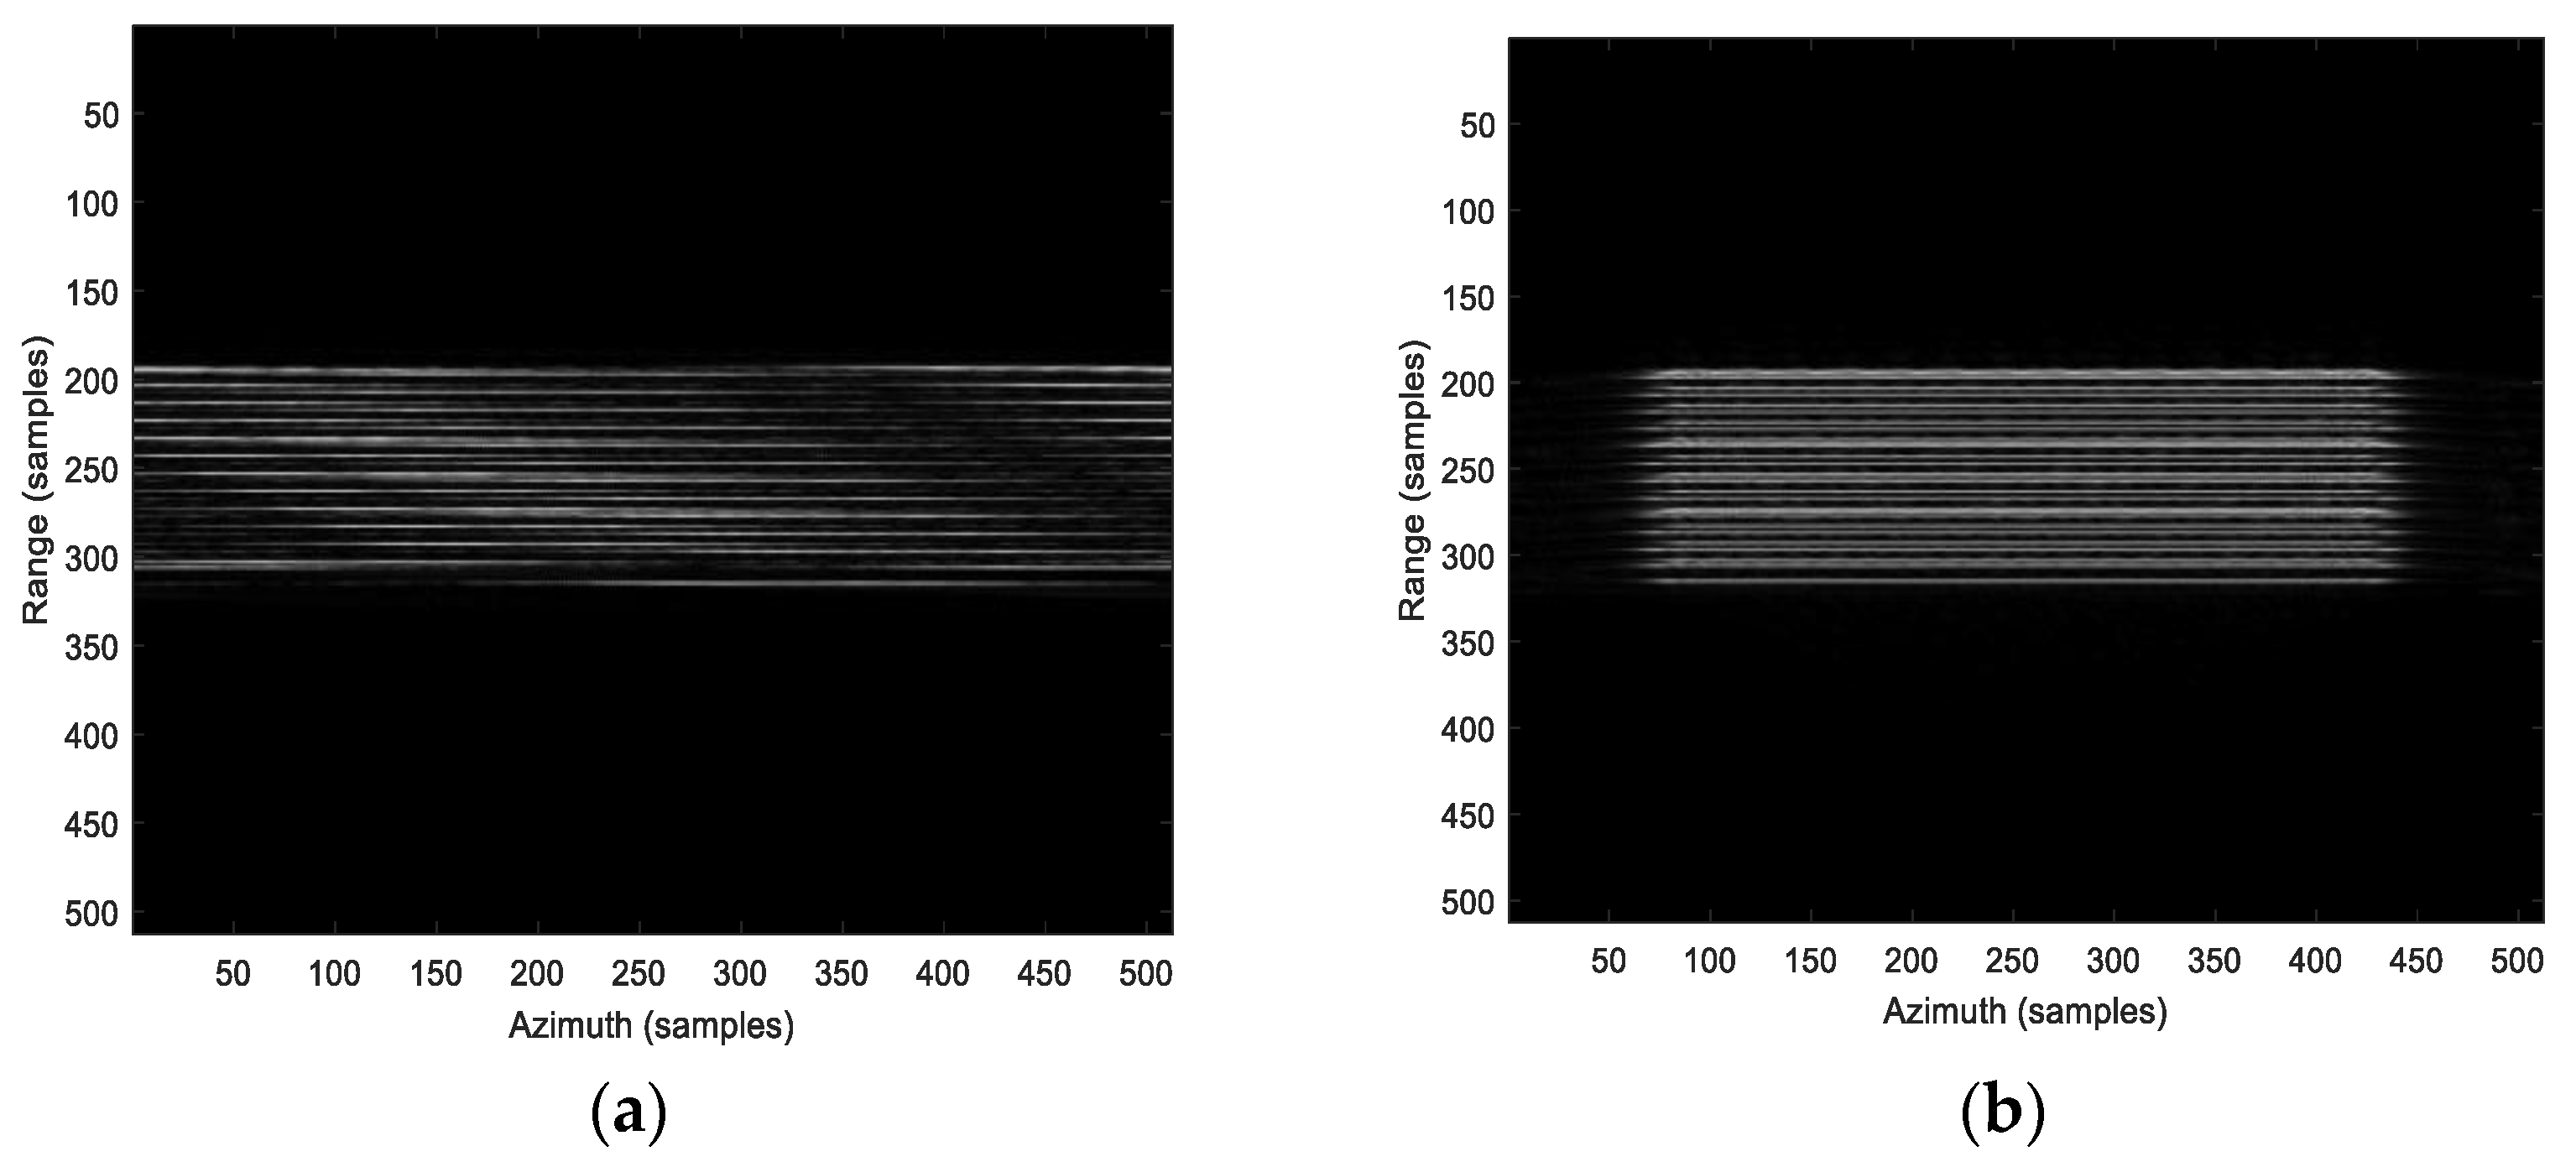
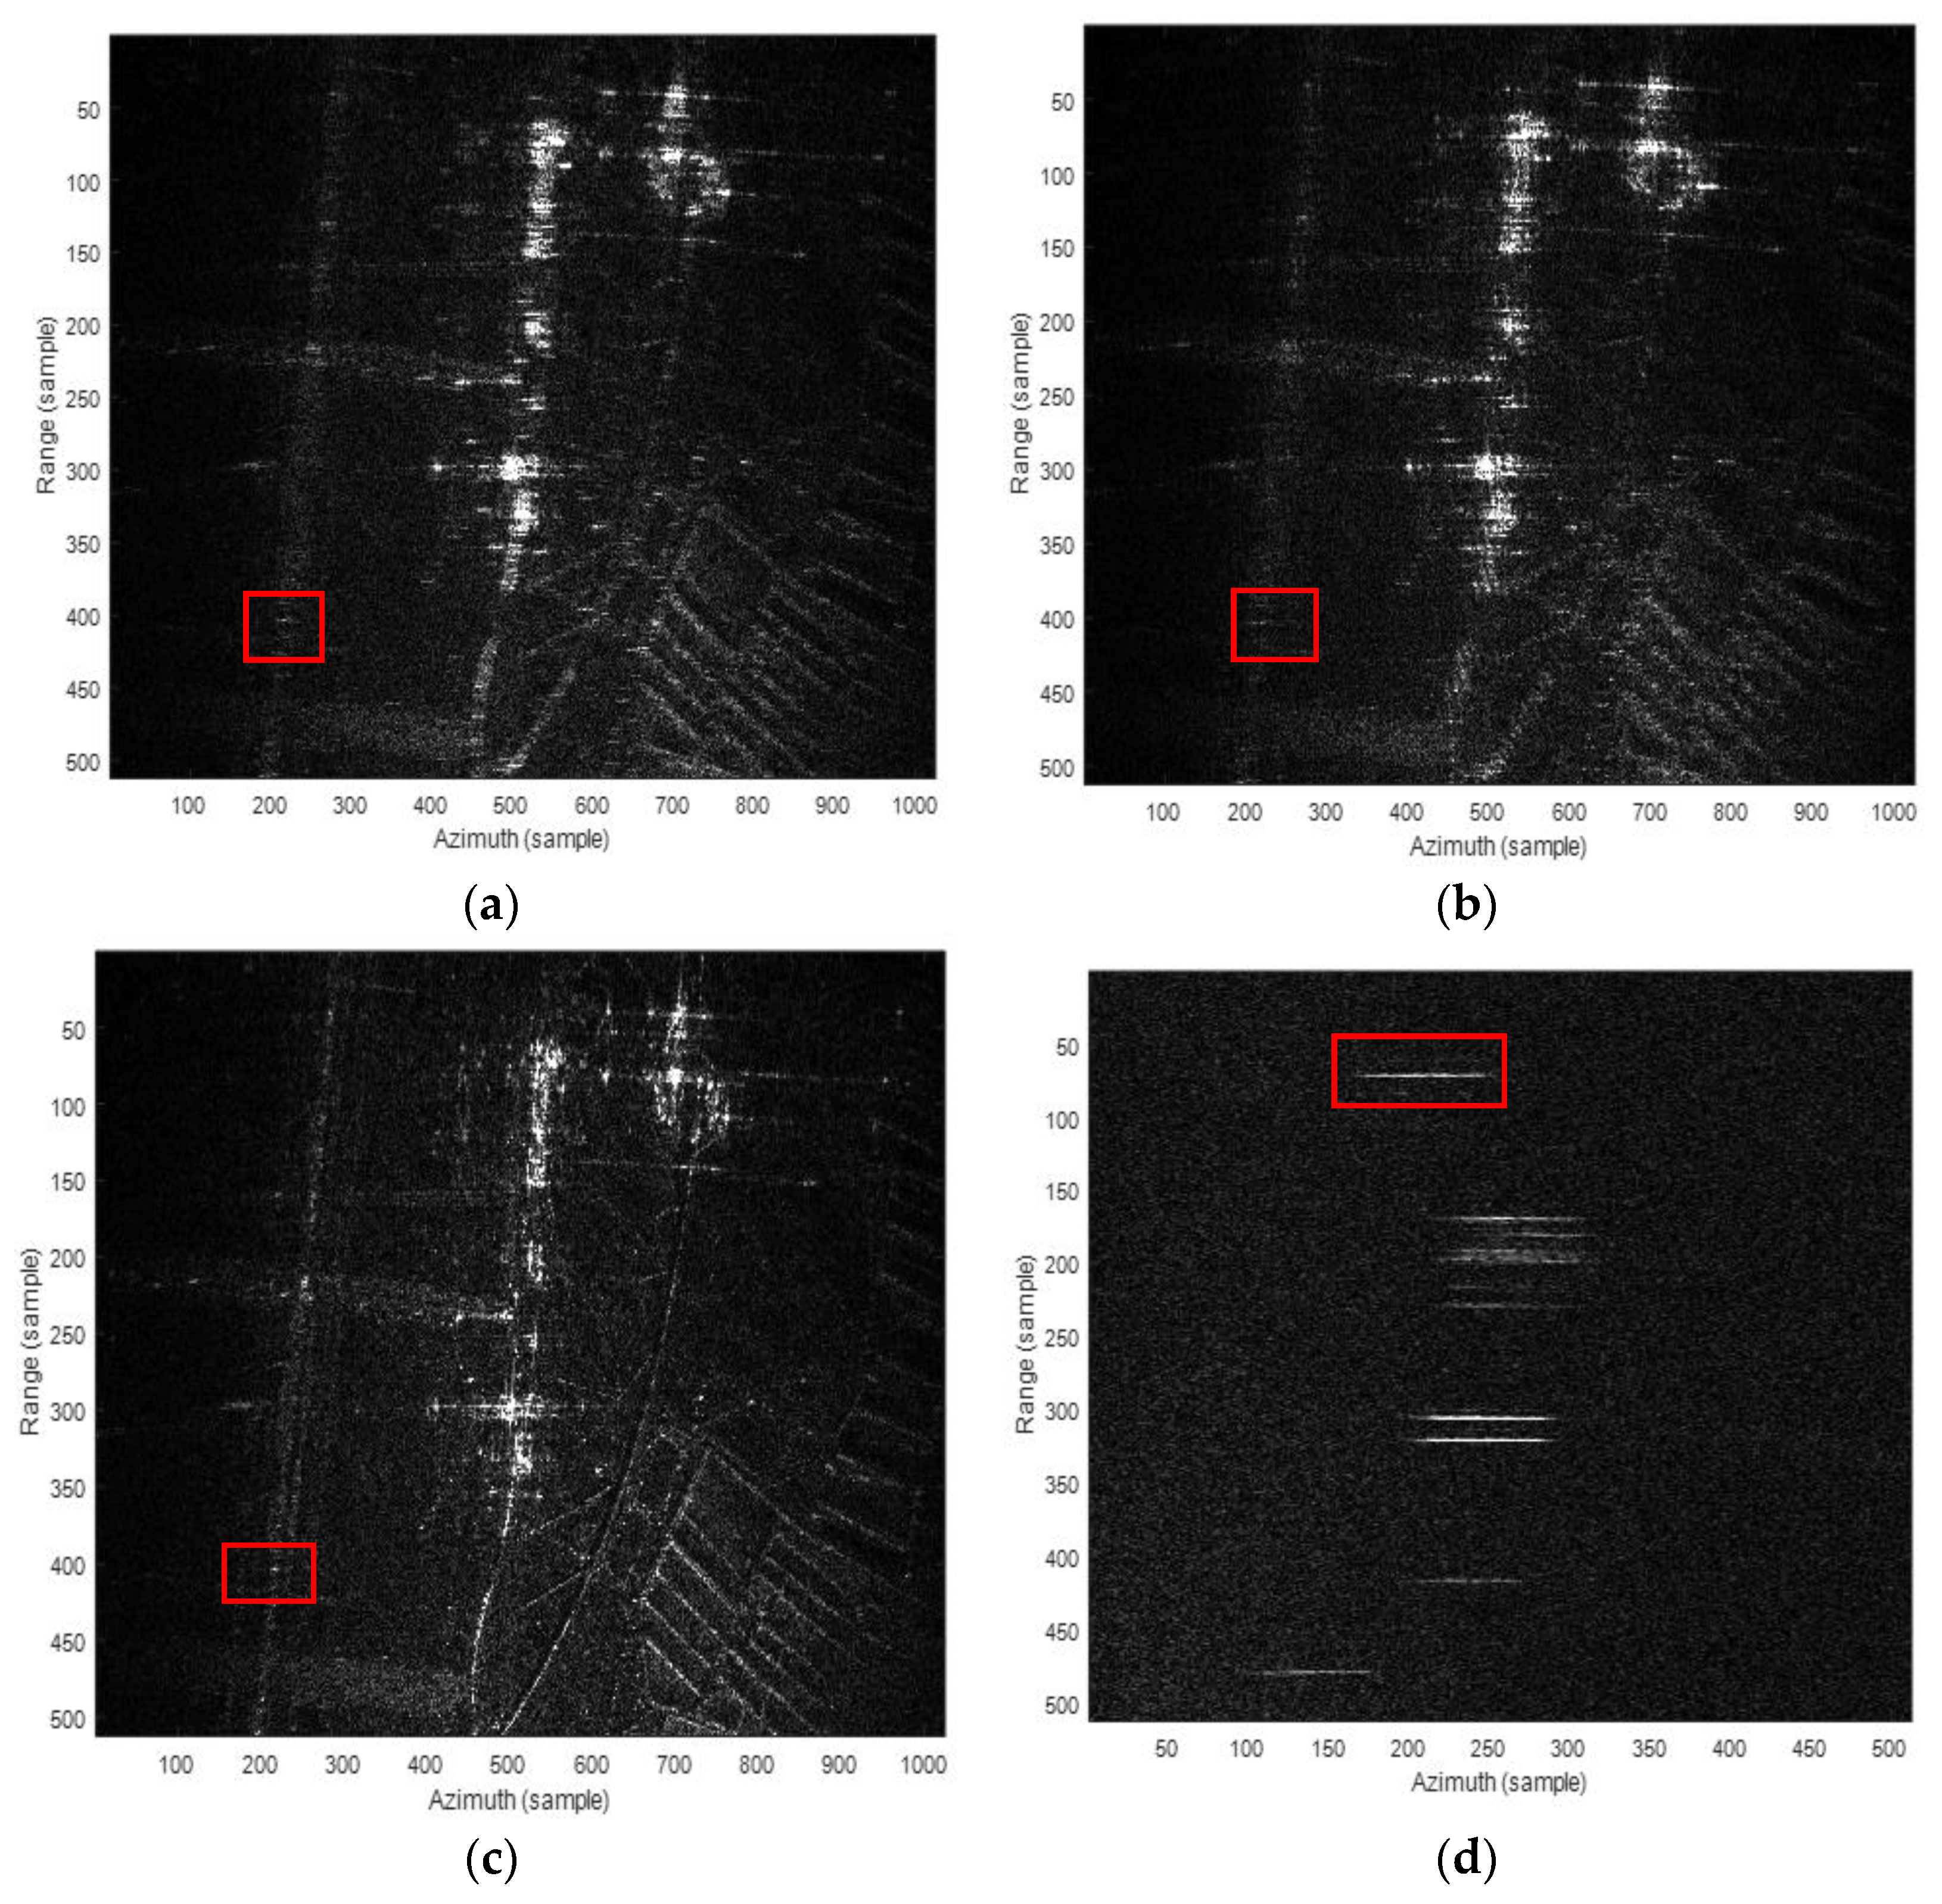
Figure 15 illustrates the SAR images constructed by the BP algorithm, the classical PGA, and the proposed method. The two rows correspond to the different sets of real data experiments. The three columns correspond to the results processed by the BP algorithm, the classical PGA, and the proposed method, respectively. The result obtained by the BP algorithm is defocused because of the motion error of the radar platform. When the classical PGA is used, the image remains defocused, while the image quality is significantly improved when the proposed auto-focusing imaging method is used. The azimuth profiles of the reflector in the red rectangle are shown in Figure 16. The sidelobes of the image using the proposed method are better than that using PGA.

5. Discussion

This paper proposes a novel auto-focusing algorithm for high squint SAR mode. The computational load is analyzed and discussed here. The proposed auto-focusing method is compared with the reference method using the classical PGA without the wavenumber center shifting and spectrum truncation.
For the reference method, the computational load of the BP algorithm includes N a times N r points’ FFT operations, N a times MN r points’ FFT operations, N a N r times multiplication, N a N x N y times multiplication, and N a N x N y times addition. The PGA requires N x N y times multiplication, 2N y times N x points’ FFT operations, and N times iterative correction. Therefore, the computational load of the reference algorithm is:
C 1 = 5 N a N r log 2 N r + 5 M N a N r log 2 M N r + 6 N a N r + 8 N a N x N y + N 10 N x N y log 2 N x + 6 N x N y
where N a and N r represent the sample point numbers in the azimuth direction and the range direction, respectively. M is the interpolation kernel length. N x and N y are the imaging grid numbers in the azimuth and range directions. N denotes the iterations.
Compared to the reference method, the proposed algorithm introduces additional processing, including N x N y times multiplication and 2 N r times N a points’ FFT operations. The computational load of the proposed method is:
C 2 = 5 N a N r log 2 N r + 5 M N a N r log 2 M N r + 6 N a N r + 8 N a N x N y + N 10 N x N y log 2 N x + 6 N x N y + 6 N x N y + 10 N r N a log 2 N a
Considering N r = 1024, N a = 1024, N x = 512, N y = 512, N = 10 and M = 16. The ratio C 2 / C 1 = 1.0284. The computational load increases by 2.8%, and the proposed method achieves better image quality with a slight increase in the computational load according to the simulation and the real data processing results in Section 4.
Compared with the state-of-the-art algorithms, the wavenumber center alignment and wavenumber spectrum truncation was proposed and added into the existing processing pipeline for the high squint SAR mode, resulting in improved image quality, specifically in terms of sidelobe performance. Furthermore, this paper presents the determination of the optimal length for spectrum truncation after wavenumber center alignment in general SAR auto-focusing algorithms for the first time.

6. Conclusions

In this study, a modified auto-focusing algorithm based on the BP algorithm with spectrum alignment and truncation specifically designed for high squint diving SAR is proposed. The proposed algorithm addresses various challenges associated with high squint SAR imaging. Firstly, the modified imaging grids are employed to tackle the issue of the energy distributed line’s direction in the PSF for high squint SAR. Secondly, the proposed algorithm shifts the azimuth spectrum to align its center, thus compensating for inaccuracies in phase gradient estimation. Additionally, the spectrum is truncated to further refine the phase gradient estimation. The performance of the proposed method is evaluated through simulations using point targets and real data processing. The results demonstrate a significant improvement of four times in terms of Peak-Sidelobe-to-Noise Ratio (PSLR) compared to conventional methods. It is worth noting that the proposed method has the potential to serve as an alternative for other SAR systems, ensuring high-quality imaging. Future work will focus on a general auto-focusing algorithm for other systems.

Author Contributions

Conceptualization, A.G. and M.Y.; methodology, A.G.; software, A.G.; validation, A.G., M.Y. and C.X.; formal analysis, M.Y.; investigation, A.G.; resources, B.S.; data curation, B.S.; writing—original draft preparation, A.G.; writing—review and editing, A.G., B.S. and J.L.; visualization, A.G.; supervision, B.S. and J.L.; project administration, B.S. and J.L.; funding acquisition, B.S. and J.L. All authors have read and agreed to the published version of the manuscript.

Funding

This work was supported by the National Natural Science Foundation of China (NSFC) under Grant 62071022 and Grant U2241202.

Data Availability Statement

All data included in this study are available upon request by contact with the corresponding author.

Acknowledgments

The authors appreciate the anonymous referees for good suggestions in improving the paper quality.

Conflicts of Interest

The authors declare no conflict of interest.

References

  1. Zeng, T.; Li, Y.; Ding, Z.; Long, T.; Yao, D.; Sun, Y. Subaperture Approach Based on Azimuth-Dependent Range Cell Migration Correction and Azimuth Focusing Parameter Equalization for Maneuvering High-Squint-Mode SAR. IEEE Trans. Geosci. Remote Sens. 2015, 53, 6718–6734. [Google Scholar] [CrossRef]
  2. Li, Z.; Xing, M.; Liang, Y.; Gao, Y.; Chen, J.; Huai, Y.; Zeng, L.; Sun, G.-C.; Bao, Z. A Frequency-Domain Imaging Algorithm for Highly Squinted SAR Mounted on Maneuvering Platforms with Nonlinear Trajectory. IEEE Trans. Geosci. Remote Sens. 2016, 54, 4023–4038. [Google Scholar] [CrossRef]
  3. Li, Z.; Liang, Y.; Xing, M.; Huai, Y.; Gao, Y.; Zeng, L.; Bao, Z. An Improved Range Model and Omega-K-Based Imaging Algorithm for High-Squint SAR with Curved Trajectory and Constant Acceleration. IEEE Geosci. Remote Sens. Lett. 2016, 13, 656–660. [Google Scholar] [CrossRef]
  4. Wang, P.; Liu, W.; Chen, J.; Niu, M.; Yang, W. A High-Order Imaging Algorithm for High-Resolution Spaceborne SAR Based on a Modified Equivalent Squint Range Model. IEEE Trans. Geosci. Remote Sens. 2015, 53, 1225–1235. [Google Scholar] [CrossRef] [Green Version]
  5. Li, Z.; Liang, Y.; Xing, M.; Huai, Y.; Zeng, L.; Bao, Z. Focusing of Highly Squinted SAR Data with Frequency Nonlinear Chirp Scaling. IEEE Geosci. Remote Sens. Lett. 2016, 13, 23–27. [Google Scholar] [CrossRef]
  6. Tang, S.; Zhang, L.; Guo, P.; Liu, G.; Sun, G.-C. Acceleration Model Analyses and Imaging Algorithm for Highly Squinted Airborne Spotlight-Mode SAR with Maneuvers. IEEE J. Sel. Top. Appl. Earth Obs. Remote Sens. 2015, 8, 1120–1131. [Google Scholar] [CrossRef]
  7. Li, Z.; Xing, M.; Xing, W.; Liang, Y.; Gao, Y.; Dai, B.; Hu, L.; Bao, Z. A Modified Equivalent Range Model and Wavenumber-Domain Imaging Approach for High-Resolution-High-Squint SAR with Curved Trajectory. IEEE Trans. Geosci. Remote Sens. 2017, 55, 3721–3734. [Google Scholar] [CrossRef]
  8. Liang, Y.; Huai, Y.; Ding, J.; Wang, H.; Xing, M. A Modified Algorithm for HS-SAR Small-Aperture Data Imaging. IEEE Trans. Geosci. Remote Sens. 2016, 54, 3710–3721. [Google Scholar] [CrossRef]
  9. Zeng, L.; Liang, Y.; Xing, M.; Huai, Y.; Li, Z. A Novel Motion Compensation Approach for Airborne Spotlight SAR of High-Resolution and High-Squint Mode. IEEE Geosci. Remote Sens. Lett. 2016, 13, 429–433. [Google Scholar] [CrossRef]
  10. Xi, Z.; Duan, C.; Zuo, W.; Li, C.; Huo, T.; Li, D.; Wen, H. Focus Improvement of Spaceborne-Missile Bistatic SAR Data Using the Modified NLCS Algorithm Based on the Method of Series Reversion. Remote Sens. 2022, 14, 5770. [Google Scholar] [CrossRef]
  11. Yeo, T.S.; Tan, N.L.; Zhang, C.B.; Lu, Y.H. A new subaperture approach to high squint SAR processing. IEEE Trans. Geosci. Remote Sens. 2001, 39, 954–968. [Google Scholar] [CrossRef]
  12. Wu, Y.; Sun, G.-C.; Xia, X.-G.; Xing, M.; Yang, J.; Bao, Z. An Azimuth Frequency Non-Linear Chirp Scaling (FNCS) Algorithm for TOPS SAR Imaging with High Squint Angle. IEEE J. Sel. Top. Appl. Earth Obs. Remote Sens. 2014, 7, 213–221. [Google Scholar] [CrossRef]
  13. Bie, B.; Quan, Y.; Xu, K.; Sun, G.; Xing, M. High Speed Maneuvering Platform Squint TOPS SAR Imaging Based on Local Polar Coordinate and Angular Division. Remote Sens. 2021, 13, 3329. [Google Scholar] [CrossRef]
  14. Guo, Z.; Fu, Z.; Chang, J.; Wu, L.; Li, N. A Novel High-Squint Spotlight SAR Raw Data Simulation Scheme in 2-D Frequency Domain. Remote Sens. 2022, 14, 651. [Google Scholar] [CrossRef]
  15. Feng, D.; An, D.; Huang, X. An Extended Fast Factorized Back Projection Algorithm for Missile-Borne Bistatic Forward-Looking SAR Imaging. IEEE Trans. Aerosp. Electron. Syst. 2018, 54, 2724–2734. [Google Scholar] [CrossRef]
  16. Xie, H.; Shi, S.; Mao, J.; An, D.; Li, F.; Zhou, Z.; Wang, G. Fast Time-domain Imaging Method for Bistatic Circular SAR. J. Phys. Conf. Ser. 2018, 960, 012021. [Google Scholar] [CrossRef] [Green Version]
  17. Zhou, S.; Yang, L.; Zhao, L.; Wang, Y.; Zhang, C. An Improved Fast Time-Domain Algorithm for Bistatic Forward-Looking Sar Imaging. In Proceedings of the IGARSS 2019—2019 IEEE International Geoscience and Remote Sensing Symposium, Yokohama, Japan, 28 July–2 August 2019; pp. 2587–2590. [Google Scholar]
  18. Hu, X.; Xie, H.; Zhang, L.; Hu, J.; He, J.; Yi, S.; Jiang, H.; Xie, K. Fast Factorized Back projection Algorithm in Orthogonal Elliptical Coordinate System for Ocean Scenes Imaging Using Geosynchronous Spaceborne–Airborne VHF UWB Bistatic SAR. Remote Sens. 2023, 15, 2215. [Google Scholar] [CrossRef]
  19. Brown, W.D.; Ghiglia, D.C. Some methods for reducing propagation-induced phase errors in coherent imaging systems I Formalism. J. Opt. Soc. Am. A 1988, 5, 924–941. [Google Scholar] [CrossRef]
  20. Marechal, N. High frequency phase errors in sar imagery and implications for autofocus. In Proceedings of the International Geoscience and Remote Sensing Symposium, Lincoln, NE, USA, 31–31 May 1996. [Google Scholar]
  21. Yang, L.; Zhang, F.; Sun, Y.; Chen, L.; Li, Z.; Wang, D. Motion Error Estimation and Compensation of Airborne Array Flexible SAR Based on Multi-Channel Interferometric Phase. Remote Sens. 2023, 15, 680. [Google Scholar] [CrossRef]
  22. Samczynski, P.; Kulpa, K.S. Coherent MapDrift Technique. IEEE Trans. Geosci. Remote Sens. 2010, 48, 1505–1517. [Google Scholar] [CrossRef]
  23. Ye, W.; Yeo, T.S.; Bao, Z. Weighted least-squares estimation of phase errors for SAR/ISAR autofocus. IEEE Trans. Geosci. Remote Sens. 1999, 37, 2487–2494. [Google Scholar] [CrossRef] [Green Version]
  24. Li, G.; Xu, J.; Peng, Y.; Xia, X.-G. Improved RDM for SAR autofocus processing. In Proceedings of the 2007 1st Asian and Pacific Conference on Synthetic Aperture Radar, Huangshan, China, 5–9 November 2007; pp. 401–403. [Google Scholar]
  25. Eichel, P.H.; Ghiglia, D.C.; Jakowatz, C.V. Speckle processing method for synthetic-aperture-radar phase correction. Opt. Lett. 1989, 14, 1–3. [Google Scholar] [CrossRef]
  26. Wahl, D.; Eichel, P.; Ghiglia, D.; Jakowatz, C. Phase gradient autofocus-a robust tool for high resolution SAR phase correction. IEEE Trans. Aerosp. Electron. Syst. 1994, 30, 827–835. [Google Scholar] [CrossRef] [Green Version]
  27. Warner, D.W.; Ghiglia, D.C.; Fitzgerrell, A.; Beaver, J. Two-dimensional phase gradient autofocus. In Image Reconstruction from Incomplete Data; SPIE: Bellingham, WA, USA, 2000; Volume 4123, pp. 162–173. [Google Scholar] [CrossRef]
  28. Chen, X.; Sun, G.-C.; Xing, M.; Li, B.; Yang, J.; Bao, Z. Ground Cartesian Back-Projection Algorithm for High Squint Diving TOPS SAR Imaging. IEEE Trans. Geosci. Remote Sens. 2021, 59, 5812–5827. [Google Scholar] [CrossRef]
  29. Dong, Q.; Sun, G.-C.; Yang, Z.; Guo, L.; Xing, M. Cartesian Factorized Backprojection Algorithm for High-Resolution Spotlight SAR Imaging. IEEE Sens. J. 2018, 18, 1160–1168. [Google Scholar] [CrossRef]
  30. Guo, Y.; Yu, Z.; Li, J.; Li, C. Focusing Multistatic GEO SAR with Two Stationary Receivers Using Spectrum Alignment and Extrapolation. IEEE Geosci. Remote Sens. Lett. 2021, 19, 4018805. [Google Scholar] [CrossRef]
  31. Yuan, S.; Yu, Z.; Li, C.; Wang, S. A Novel SAR Sidelobe Suppression Method Based on CNN. IEEE Geosci. Remote Sens. Lett. 2020, 18, 132–136. [Google Scholar] [CrossRef]
  32. Davidson, G.W.; Cumming, I. Signal properties of spaceborne squint-mode SAR. IEEE Trans. Geosci. Remote Sens. 1997, 35, 611–617. [Google Scholar] [CrossRef] [Green Version]
  33. Beard, G.S. Performance Factors for Airborne Short-Dwell Squinted Radar Sensors. Ph.D. Thesis, University College London, London, UK, 2011. [Google Scholar]
  34. Zhang, Q.; Yin, W.; Ding, Z.; Zeng, T.; Long, T. An Optimal Resolution Steering Method for Geosynchronous Orbit SAR. IEEE Geosci. Remote Sens. Lett. 2014, 11, 1732–1736. [Google Scholar] [CrossRef]
  35. Ding, Z.; Yin, W.; Zeng, T.; Long, T. Radar Parameter Design for Geosynchronous SAR in Squint Mode and Elliptical Orbit. IEEE J. Sel. Top. Appl. Earth Obs. Remote Sens. 2016, 9, 2720–2732. [Google Scholar] [CrossRef]
  36. Zeng, T.; Cherniakov, M.; Long, T. Generalized approach to resolution analysis in BSAR. IEEE Trans. Aerosp. Electron. Syst. 2005, 41, 461–474. [Google Scholar] [CrossRef]
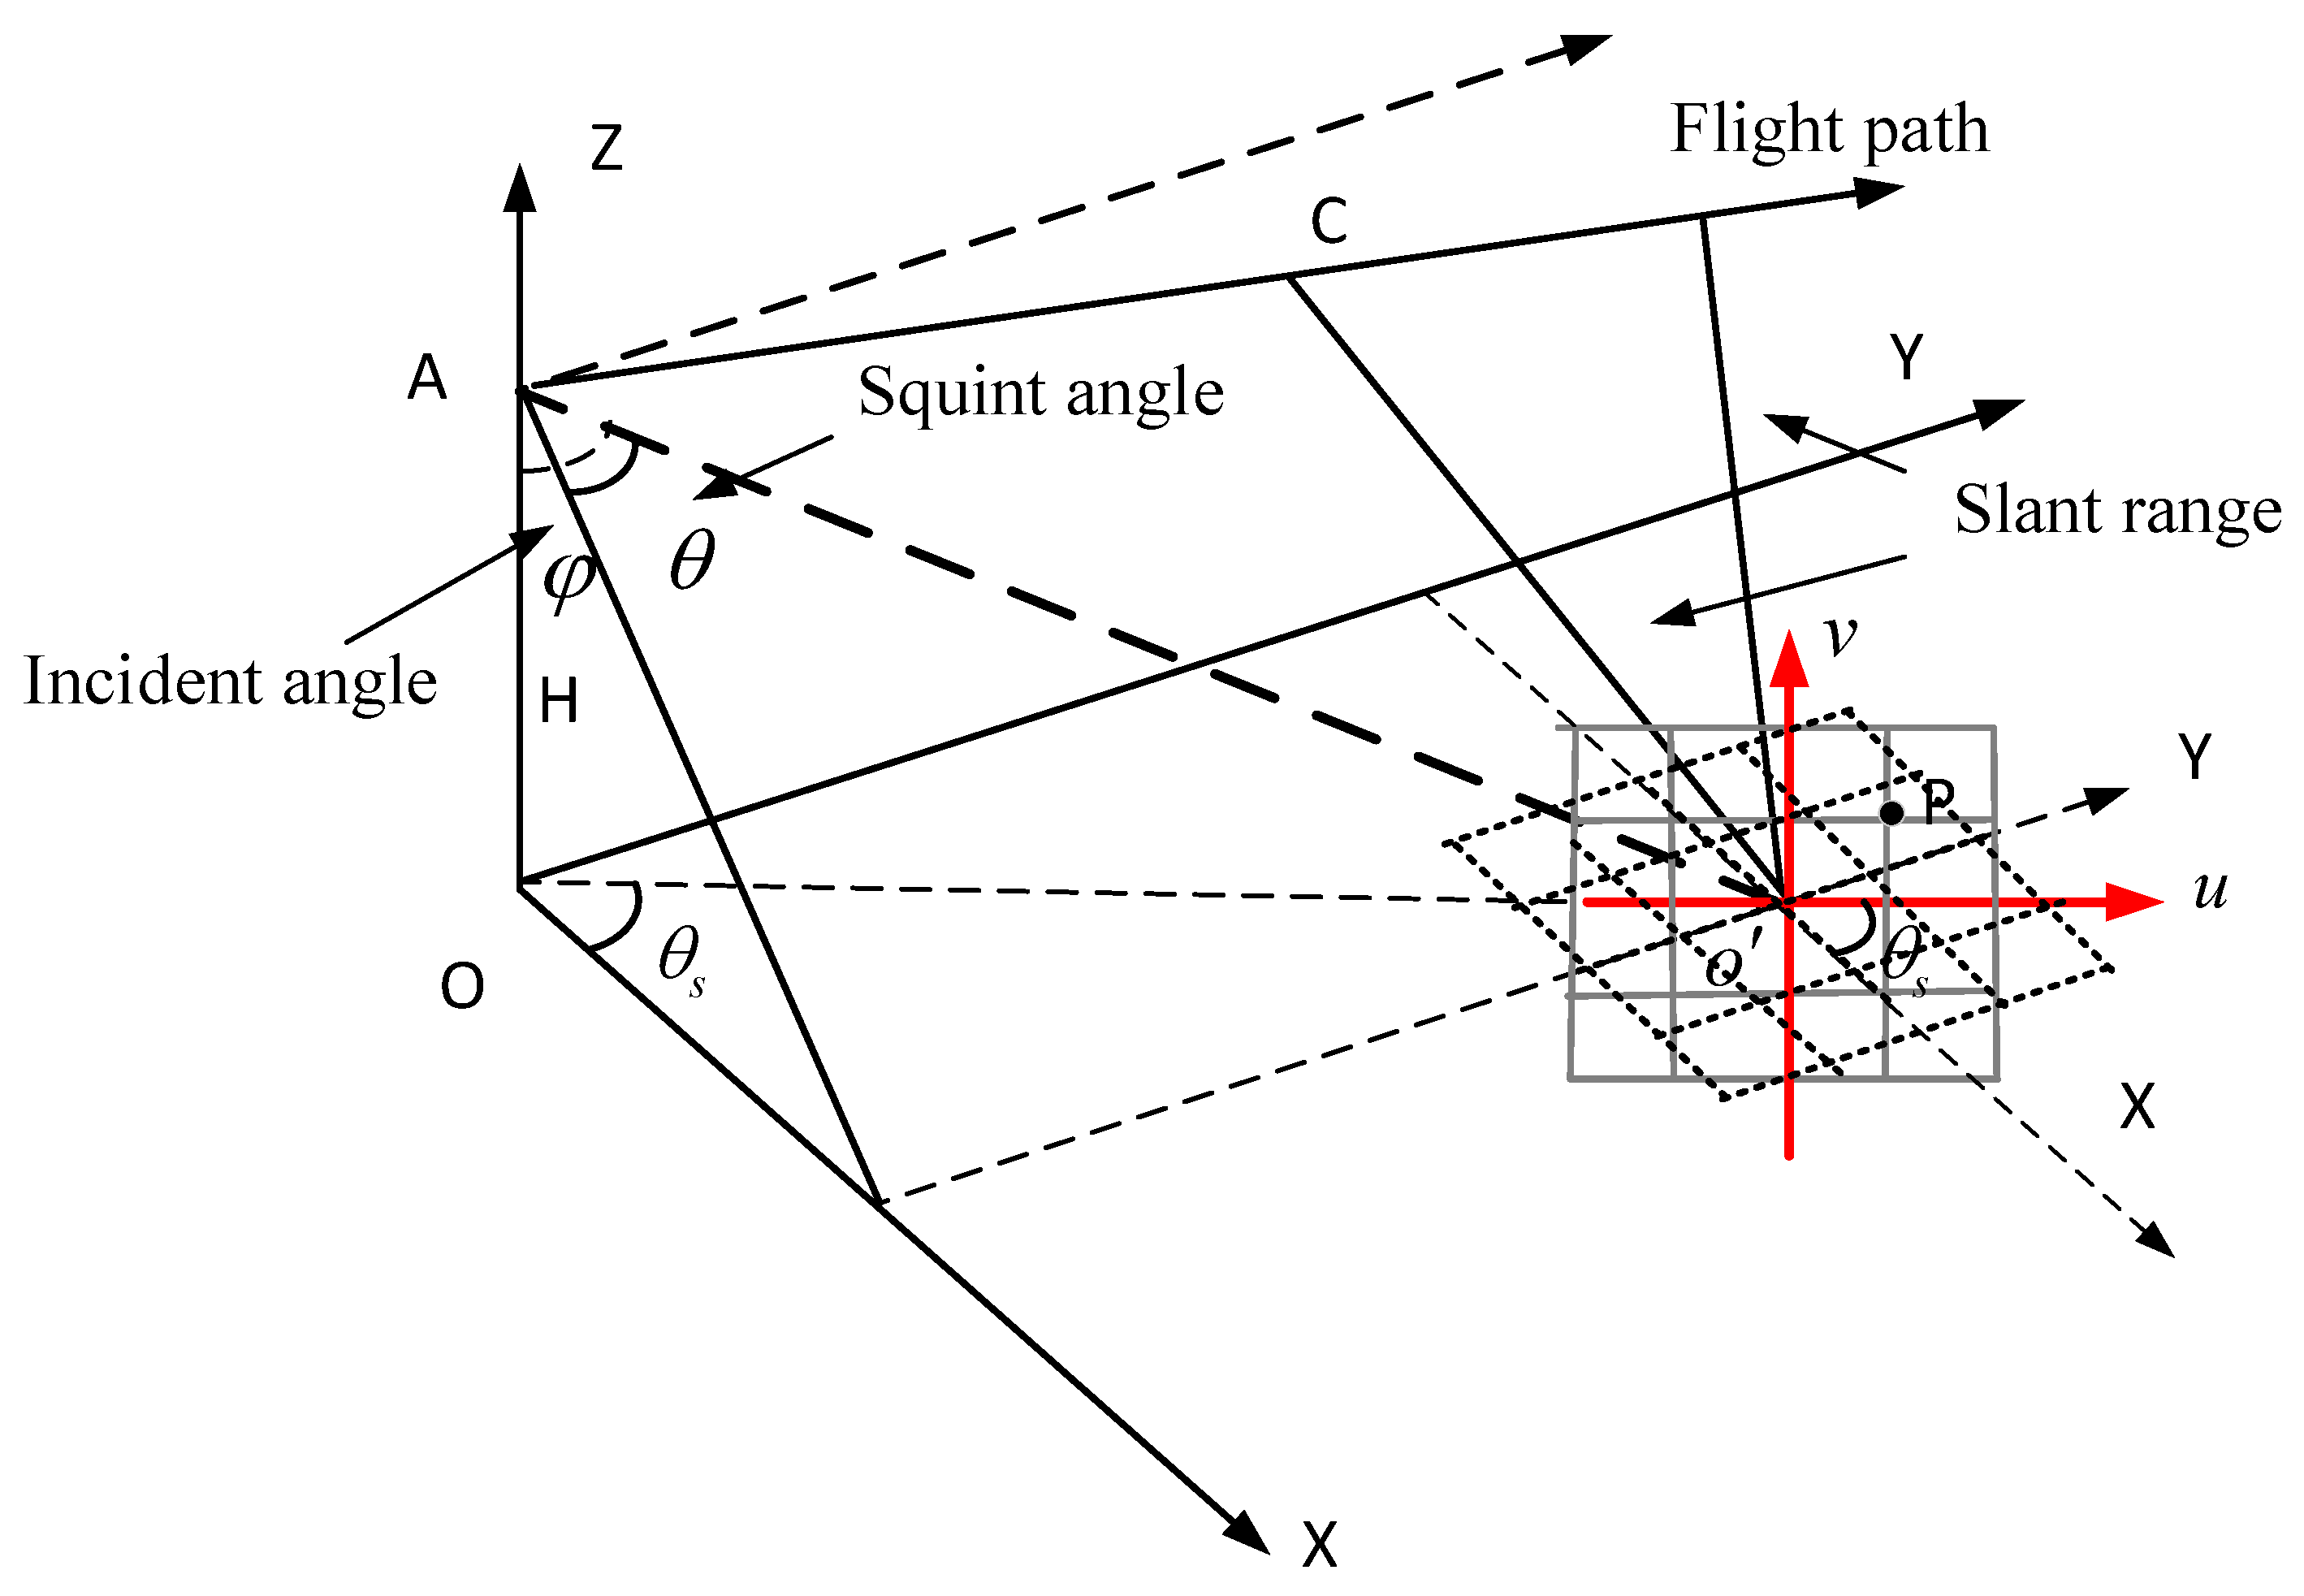
Figure 1. Geometry of high squint diving SAR.
Remotesensing 15 02976 g001
Figure 2. The PSF in high squint mode.
Remotesensing 15 02976 g002
Figure 3. Illustration of the wavenumber spectrum. (a) Wavenumber spectrum of the BP algorithm, (b) spectrum center alignment, and (c) spectrum truncation.
Remotesensing 15 02976 g003
Figure 4. The flowchart of the proposed method, where the wavenumber alignment is implemented before azimuth FFT following with the wavenumber spectrum truncation in the processing chain.
Remotesensing 15 02976 g004
Figure 5. Simulated scene (point target array).
Remotesensing 15 02976 g005
Figure 6. The PSF and the azimuth profiles of point T1. The PSF of point T1 processed by (a) the BP algorithm and (b) the classical PGA. (c) The azimuth profile processed by the classical PGA. The PSF of point T1 processed by (d) the BP algorithm using the new imaging grids and (e) the proposed method using the new imaging grids. (f) The azimuth profile processed by the proposed method using the new imaging grids.
Remotesensing 15 02976 g006
Figure 7. The PSF and the azimuth profiles of point T2. The PSF of point T2 processed by (a) the BP algorithm and (b) the classical PGA. (c) The azimuth profile processed by the classical PGA. The PSF of point T2 processed by (d) the BP algorithm using the new imaging grids and (e) the proposed method using the new imaging grids. (f) The azimuth profile processed by the proposed method using the new imaging grids.
Remotesensing 15 02976 g007
Figure 8. Coarse imaging result and the auto-focusing result. (a) The coarse imaging result obtained by the BP algorithm. (b) The auto-focusing result processed by the classical PGA. (c) The auto-focusing result processed by the proposed method.
Remotesensing 15 02976 g008
Figure 9. Wavenumber spectrum. (a) The azimuth spectrum of BP image. (b) The azimuth spectrum after shifting.
Remotesensing 15 02976 g009
Figure 10. Two-dimensional spectrums of BP image and the proposed method. The spectrums of BP image of (a) T1, (b) T2 and (c) T3. The spectrums after wavenumber center alignment of (d) T1, (e) T2 and (f) T3.
Remotesensing 15 02976 g010aRemotesensing 15 02976 g010b
Figure 11. Azimuth profiles processed by the classical PGA and the proposed method. Solid line indicates the image profile processed by the proposed method, while dashed line indicates the image profile processed by the classical PGA with same simulation settings. The azimuth profiles of (a) T1, (b) T2, and (c) T3.
Remotesensing 15 02976 g011
Figure 12. Coarse imaging result and the auto-focusing result when the motion error is (0, 0, 10sin0.2η). (a) The coarse imaging result obtained by the BP algorithm. (b) The auto-focusing result processed by the classical PGA. (c) The auto-focusing result processed by the proposed method.
Remotesensing 15 02976 g012
Figure 13. Azimuth profiles processed by the classical PGA and the proposed method when the motion error is (0, 0, 10sin0.2η). Solid line indicates the image profile processed by the proposed method, while dashed line indicates the image profile processed by the classical PGA. The azimuth profiles of (a) T1, (b) T2, and (c) T3.
Remotesensing 15 02976 g013
Figure 14. The function about PSLR and ISLR of point T2. (a) The evaluation indices change with respect to the amplitude when frequency equals to 0.2. (b) The evaluation indices change with respect to the frequency when amplitude equals to 10.
Remotesensing 15 02976 g014
Figure 15. Imaging results of the real data experiments. The red boxes denote the selected reflectors for evaluation. The first real dataset processed by (a) the BPA, (b) the classical PGA, and (c) the proposed method. The second real dataset processed by (d) the BPA, (e) the classical PGA, and (f) the proposed method.
Remotesensing 15 02976 g015aRemotesensing 15 02976 g015b
Figure 16. Evaluation results of the real data experiments processed by the classical PGA and the proposed method. (a) The first real dataset. (b) The second real dataset.
Remotesensing 15 02976 g016
Table 1. Simulation Parameters.
ParametersValue
Wavelength0.02 m
Bandwidth90 MHz
Pulse duration3 μs
Sampling frequency108 MHz
Pulse repetition frequency300 Hz
Altitude4000 m
Squint angle68°
Velocity(0, 100, −20) m/s
Table 2. Azimuth profiles inspection for point targets.
TargetThe Classical PGAThe Proposed Method
PSLR (dB)ISLR (dB)PSLR (dB)ISLR (dB)Azi Res (m)
T1−2.73−5.43−13.16−9.712.32
T2−3.21−5.19−13.26−9.982.38
T3−2.68−6.21−13.13−9.752.35
Disclaimer/Publisher’s Note: The statements, opinions and data contained in all publications are solely those of the individual author(s) and contributor(s) and not of MDPI and/or the editor(s). MDPI and/or the editor(s) disclaim responsibility for any injury to people or property resulting from any ideas, methods, instructions or products referred to in the content.