Communication

Analysis and Validation of the Aerosol Optical Depth of MODIS Products in Gansu Province, Northwest China

1
Gansu Meteorological Information and Technology Support Center, Gansu Meteorological Bureau, Lanzhou 730020, China
2
Land-Atmosphere Interaction and Its Climatic Effects Group, State Key Laboratory of Tibetan Plateau Earth System, Environment and Resources (TPESRE), Institute of Tibetan Plateau Research, Chinese Academy of Sciences, Beijing 100101, China
3
College of Atmospheric Science, Lanzhou University, Lanzhou 730000, China
4
National Observation and Research Station for Qomolongma Special Atmospheric Processes and Environmental Changes, Shigatse 858200, China
5
China-Pakistan Joint Research Center on Earth Sciences, Chinese Academy of Sciences, Islamabad 45320, Pakistan
6
Research Institute of Petroleum Exploration & Development-Northwest, PetroChina, Lanzhou 730020, China
*
Author to whom correspondence should be addressed.
Remote Sens. 2023, 15(12), 2972; https://doi.org/10.3390/rs15122972
Submission received: 12 May 2023 / Revised: 3 June 2023 / Accepted: 5 June 2023 / Published: 7 June 2023

Abstract

:
The accurate determination of aerosol optical depth (AOD) is of great importance for climate change research and environmental monitoring. To understand the applicability of the MODIS aerosol product inversion algorithm in Gansu Province, this work uses ground-based solar photometer AOD observation data to validate the MODIS C6 version of the AOD product. Additionally, the retrieval accuracy of MODIS C6 Deep Blue (DB) algorithm AOD products and Deep Blue and Dark Target Fusion (DB–DT combined) algorithm AOD products for Gansu Province when setting different spatial sampling windows is compared and analyzed. Meanwhile, the monitoring effects of these two AOD algorithms in typical polluted atmospheric conditions in Gansu Province are compared. The results show that (1) the correlation between the MODIS AOD products of the two algorithms and the ground-based observation data decreases with an increasing spatial sampling window size. When the spatial sampling window of the two algorithms is set at 30 km × 30 km, it is more representative of the AOD value in Gansu Province, thus reflecting local characteristics. (2) When the spatial sampling window is set at 30 km × 30 km, the inversion effect of the DB algorithm AOD is better than that of the DB–DT combined algorithm AOD on different underlying surfaces. (3) The seasonal variability in the inversion accuracy of the DB algorithm AOD is less than that of the DB–DT combined algorithm, and it has inversion advantages in spring, autumn and winter, while the DB–DT combined algorithm outperforms the DB algorithm only in winter. The inversion effect of the two algorithms on AOD is influenced by the spatial sampling window setting. (4) Both the DB algorithm AOD and the DB–DT combined algorithm AOD can monitor the distribution of AOD in the central and western regions of Gansu, especially for high values of AOD under polluted atmospheric conditions, which represents a good monitoring effect. However, the two algorithms perform poorly in monitoring the southeast region of Gansu, while there is a discontinuous AOD distribution in the northwest region of Gansu. Overall, the MODIS DB algorithm AOD product has higher applicability in Gansu Province. This work provides a good reference for local air pollution and climate prediction.

1. Introduction

Atmospheric aerosols are large quantities of liquid or solid particles suspended in the air. Aerosols affect the global climate and atmospheric environment through three mechanisms: (1) aerosol particles reduce the amount of energy reaching the ground by absorbing and scattering solar radiation; (2) aerosol particles can act as condensation nuclei for clouds and affect the water vapor cycle; and (3) aerosols can change the atmospheric chemical processes and thus affect the concentration and distribution of greenhouse gases [1,2,3]. Regarding these mechanisms, aerosol particles change the radiation balance of the land–atmosphere system through scattering, absorbing solar shortwave radiation and absorbing terrestrial longwave radiation, which is called the direct radiation effect; they also change the radiation balance of the Earth–air system by affecting cloud microphysical properties, optical properties, the life cycle, sedimentation efficiency and radiation properties, which is called the indirect radiation effect [4,5,6,7,8,9,10,11]. Thus, atmospheric aerosols play an important role in the Earth’s radiation balance and in climate change. In addition, aerosols have important effects on the concentration and distribution of greenhouse gases and on the water cycle by affecting physical and chemical processes in the atmosphere, which in turn may lead to environmental and public health problems [12,13,14,15].
The aerosol optical depth (AOD) is defined as the integral of the extinction coefficient of a medium in the vertical direction. It is an important factor for measuring aerosols and is often used to characterize the atmospheric turbidity or total aerosol content, which effectively reflects the regional air pollution level [16,17]. The vertical integration of the aerosol optical properties in the AOD can also reflect the aerosol concentration and the impact of aerosols on the Earth’s radiation. The ability to characterize atmospheric aerosol conditions and evaluate atmospheric pollution makes AOD an important reference index in the study of the radiative climate effects of atmospheric aerosols, so the study of the atmospheric aerosol optical thickness has received much attention from domestic and international academics [18,19,20].
Currently, ground-based observations and satellite remote sensing are two important methods for the long-term observation of aerosol properties [21,22]. To observe the atmospheric aerosol variability, NASA has established a global ground-based solar photometer observation network (AERONET) for the long-term observation of aerosol characteristics, and China has also established a ground-based aerosol observation network (CARSNET) [23,24]. Although the accuracy of ground-based aerosol observations is high, the sparse distribution of stations has led to an inability to determine the spatial distribution characteristics of the whole country, e.g., CARSNET currently has only approximately 40 stations in mainland China. At present, there are only three long-term AOD observation stations in Gansu, and they are basically distributed in the Hexi Corridor, and cannot meet the assessment needs for atmospheric environmental pollution and the study of the effects of atmospheric aerosol radiation on the climate across the province. Since 2000, the MODIS (Moderate Resolution Imaging Spectroradiometer) that is on board the US EOS series satellites has been carrying out the MODIS aerosol optical thickness inversion operation, which provides the possibility of performing atmospheric aerosol monitoring on a large scale via remote sensing [25]. In recent decades, the application of satellite remote sensing inversion to determine aerosol optical parameters has increased. Among the parameters, the MODIS global aerosol observation products have been widely used in aerosol research because of their high spatial coverage, temporal resolution (near continuous day-by-day time points) and accurate inversion algorithms.
Much work has been performed at both the national and international levels to verify the applicability of MODIS aerosol products [26,27,28,29]. Adeyewa studied the spectral dependence of aerosol optical thickness in different regions and found that the applicability of Angstrom approximation depends on the aerosol properties and source area [30]. Li et al. [31,32,33] studied the adaptability of MODIS AOD products in the central-eastern region of China, the Sichuan Basin, and Hong Kong, and demonstrated that the products have good applicability in these regions, providing a basis for regional climate change and air quality studies in these regions. Sayer et al. [34] evaluated the inversion accuracy of three MODIS aerosol products using 111 stations of the AERONET observation network, while Che et al. [35,36] used ground-based observations from CARSNET to compare and analyze the MODIS C6 product. Xie et al. [24] compared CARSNET data with the MOD04_L2 products and found that the dark target method is more suitable for areas with high vegetation cover, while the deep blue method is more suitable for deserts and large cities with extremely complex ground surfaces. Zhang et al. [37] used MODIS data from the Terra and Aqua satellites to analyze the seasonal and interannual trends of global maritime AOD over the last decade. Han et al. [38] demonstrated that the satellite remote sensing of the atmospheric aerosol optical thickness can be an effective means to monitor the ground-level distribution of particulate pollutants after being revised for both vertical and humidity effects.
The dark target algorithm of MODIS C6 AOD products is optimally applicable in densely vegetated areas, the dark blue algorithm is suitable for bright surface areas such as deserts and cities, and the dark blue–dark target fusion algorithm combines the advantages and disadvantages of the DT algorithm and the DB algorithm [39,40,41]. However, the current validation of regional MODIS C6 aerosol products in China is mainly focused on the eastern and mid-China regions, and there are fewer validation studies for the northwestern region due to the lack of observational data. Meanwhile, the topography of Gansu Province is complex, and there are fewer comprehensive evaluations for AOD product algorithms. We urgently need more studies on the applicability of MODIS AOD products in Northwest China. On that basis, this paper will present an analysis of the inversion accuracy of MODIS C6 AOD products (deep blue algorithm and deep blue–dark target fusion algorithm) at different spatial sampling windows by comparing the ground-based sun photometer AOD observation data; this is performed via wavelength matching and space–time matching from the perspective of validating aerosol optical thickness algorithm products and an analysis of the monitoring effects of these two algorithms for AOD products in typical processes under polluted atmospheric conditions in Gansu Province. This work explores the applicability of each MODIS AOD product algorithm for Gansu Province in order to provide a reference for the use of MODIS aerosol products in this Province, which is deep in the inland area of Northwest China.

2. Materials and Methods
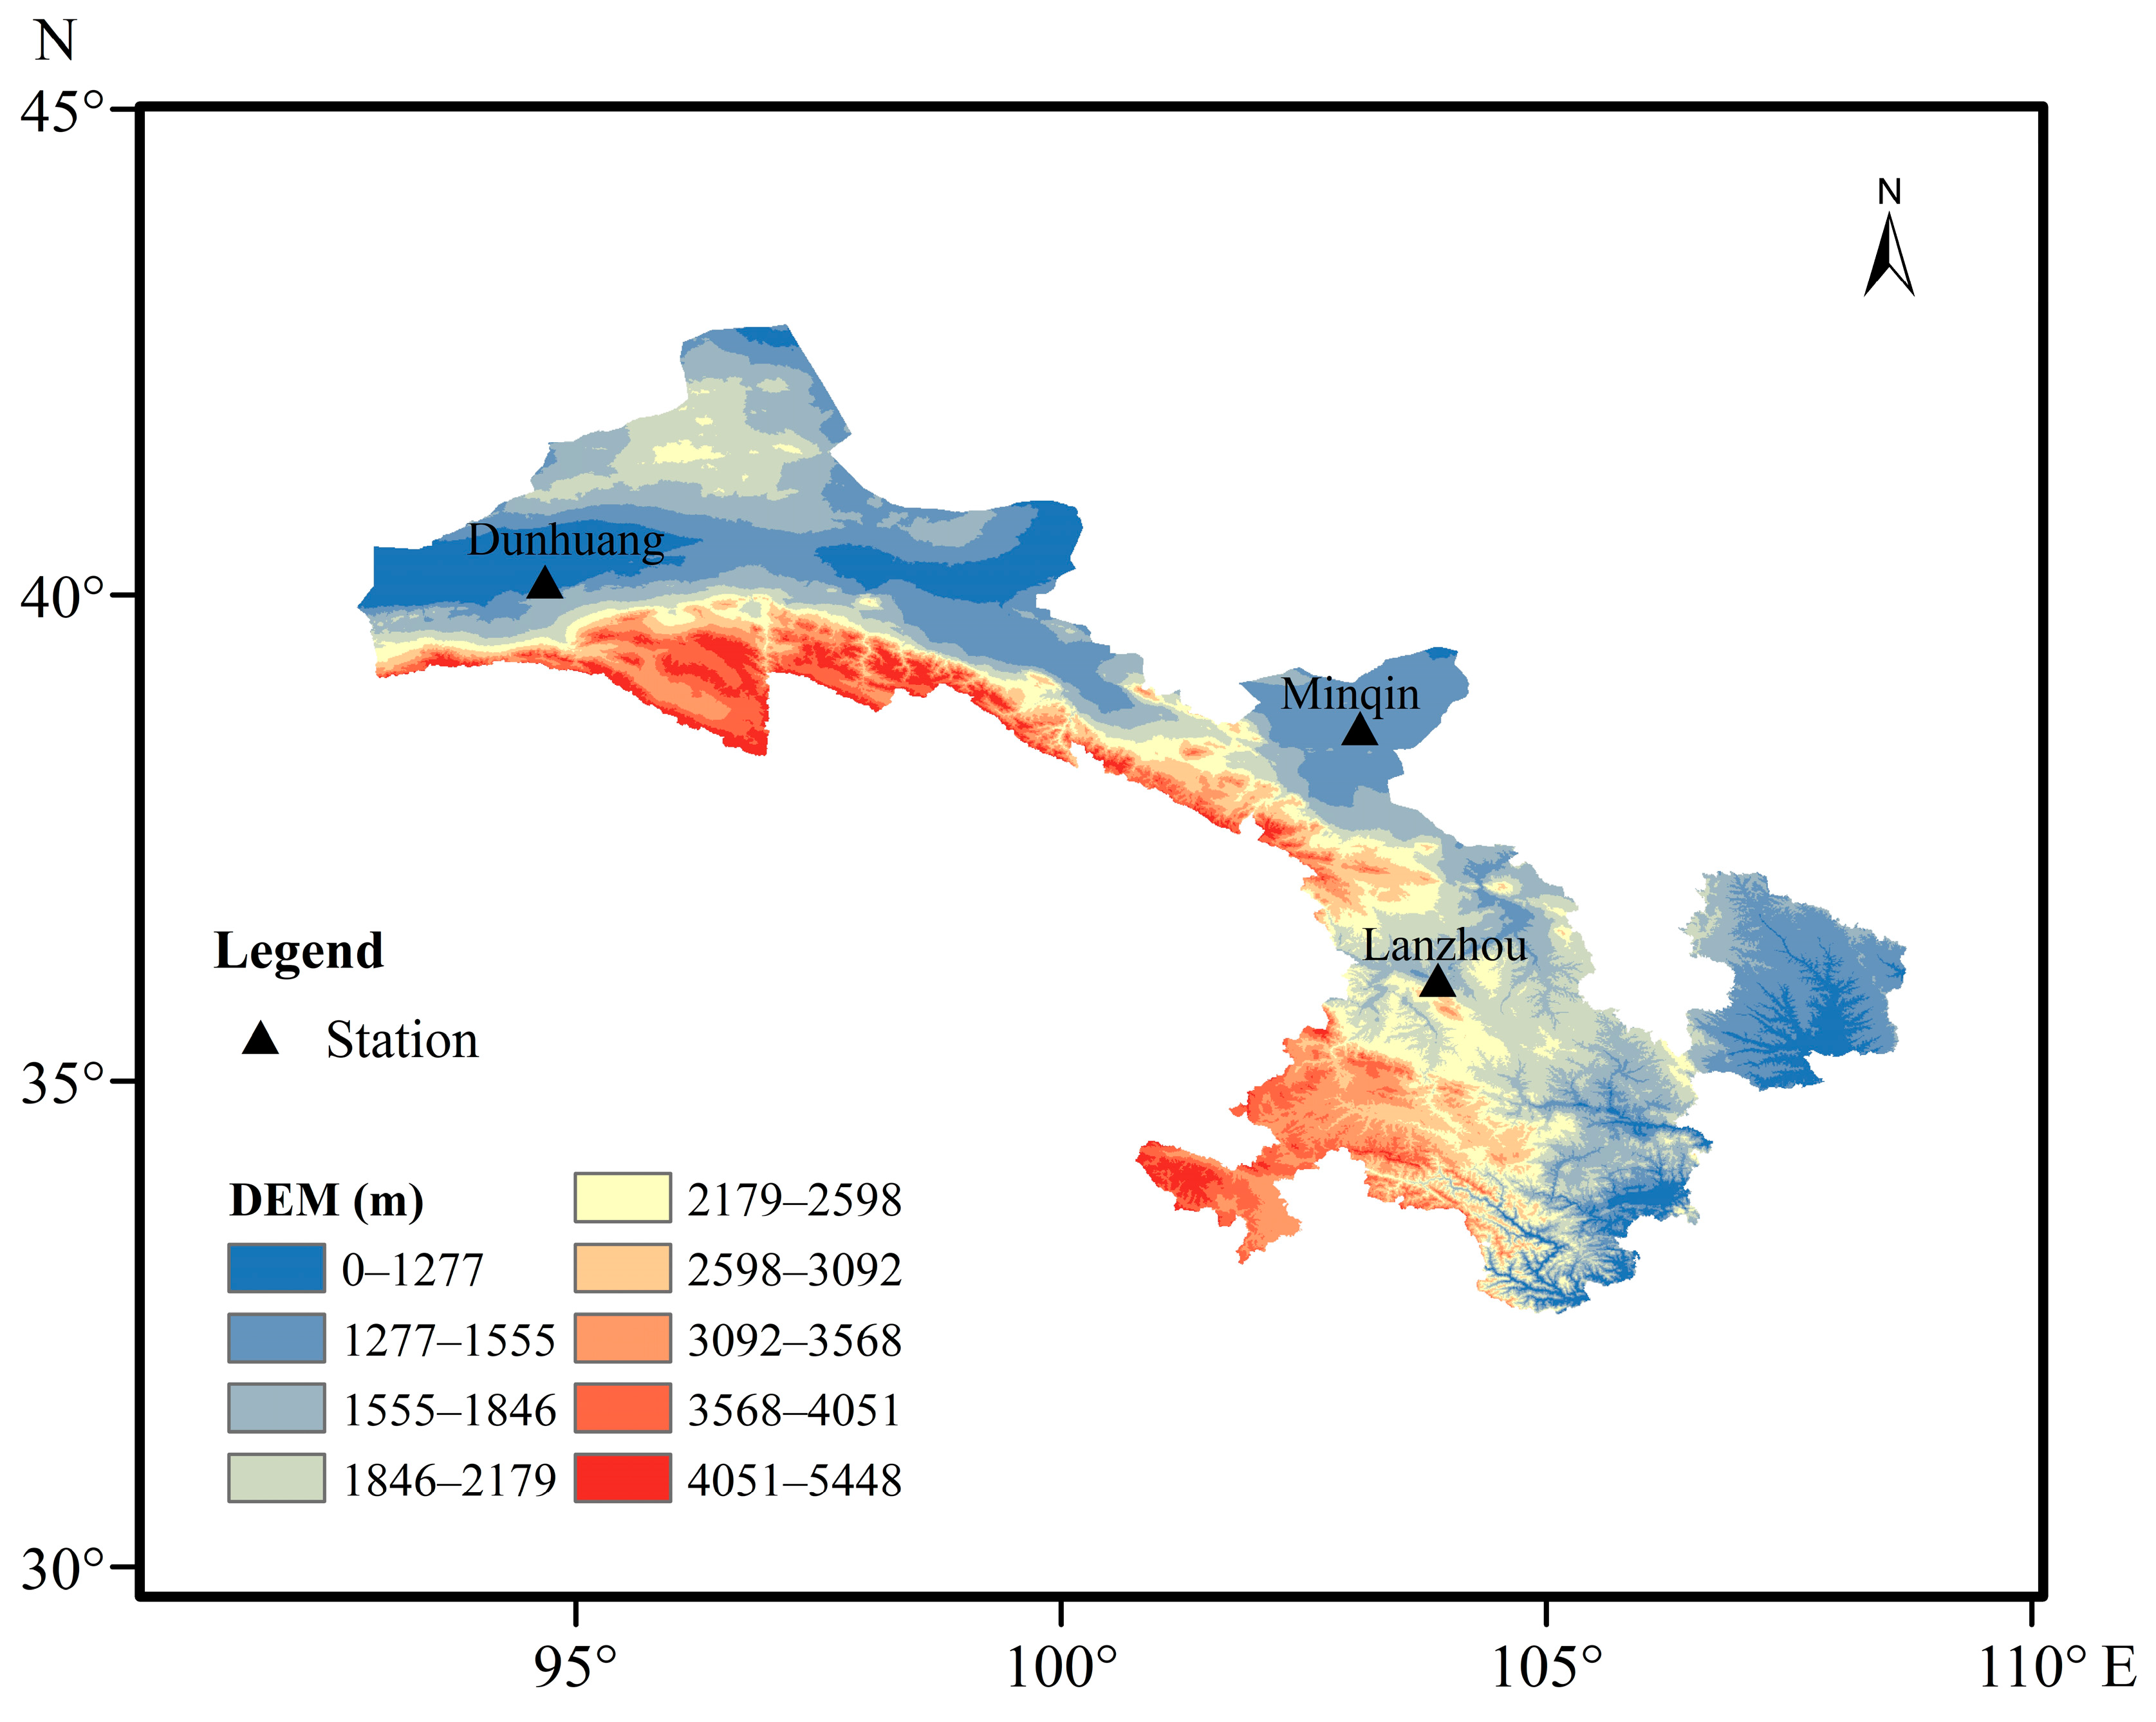
2.1. Study Area

Gansu Province (32°–43° N, 90°–110° E) is located in Northwest China, at the intersection of the Loess Plateau, Qinghai–Tibet Plateau and Inner Mongolia Plateau, with a narrow topography and complex and diverse landscapes. The province is surrounded by mountains, which slope from southwest to northeast. As shown in Figure 1, the observation sites used in this study are the three stations of the CE-318 automatic tracking and scanning sun photometer in the Gansu area, which are all above 1100 m in elevation. The city of Lanzhou, with the Yellow River running through the city, is situated in a canyon and the basin between the beads of the river valley; the Dunhuang landscape is desert, dominated by the Gobi, with oasis terrain accounting only for 4.5% of the total area; Minqin, with low hills, plains, deserts, the Gobi region and other staggered areas of distribution, is a sensitive area in terms of climate change and ecologically fragile environmental areas [42]. Information on the latitude, longitude and altitude of the in situ observation sites is shown in Table 1.

2.2. Data

2.2.1. In Situ Observation Data

The Model CE-318 sun photometer is an automatic tracking and scanning sun photometer, manufactured by the French company CIMEL, that records atmospheric aerosol optical properties by measuring solar radiation and sky radiation at different wavelengths. The instrument has three sky radiation scanning modes, equal-zenith angle scanning, main-plane scanning and polarization plane scanning; eight spectral channels in visible and near-infrared wavelengths (1020 nm, 870 nm, 670 nm, 440 nm, 936 nm and three polarization channels at 870 nm). The sun photometer information in this study was obtained from the Gansu Meteorological Information and Technical Equipment Security Center, and the observation period was from April 2018 to December 2019, with an average observation interval of 15 min. The total amount of raw data is 550,000 items, and the number of data used in this paper is over 130,000 items. The measured values of direct solar radiation from each channel that were obtained by using the CE-318 sun photometer can be used to determine the inversion of atmospheric optical thickness, aerosol parameters, properties of water vapor, ozone and other components.

2.2.2. MODIS Data

MODIS aerosol data are a Level 2 aerosol data product released by NASA that can be used to determine the optical properties of atmospheric aerosols in global oceanic and terrestrial environments and are widely used in atmospheric science [43]. The MODIS data product in this study is MOD04_L2 of the MODIS C6 dataset, with a spatial resolution of 10 km. The dataset used in this paper includes the deep blue (DB) dataset and the fusion algorithm (abbreviated as DB–DT combined) dataset based on the DB algorithm and the dark target (DT) algorithm.

2.3. Methods

2.3.1. Wavelength Matching

The CE-318-type sun photometer AOD product contains AOD data from channels at 1020 nm, 870 nm, 670 nm, 440 nm, 936 nm and 3 polarization channels at 870 nm, while MODIS only contains AOD products in the 660 nm, 550 nm and 470 nm bands; the inconsistency between the satellite AOD products and the AOD bands of ground-based observations results in the two AOD products of satellite and ground-based observations not being directly comparable. Therefore, wavelength interpolation is performed on the ground-based observed AOD data to obtain an AOD that is consistent with the band of the satellite product.
According to the theory of Ångström [44], assuming that the atmosphere is quasi-stationary during the ground-based observation time period, the aerosol optical thickness and wavelength satisfy the Ångström relationship:
τ λ = β λ α
where τ λ is the AOD value of the wavelength λ that is sought, α denotes the Ångström wavelength index, and β denotes the Ångström turbidity coefficient. Using Equation (1), the AOD value of the desired wavelength λ is further derived as
τ λ = τ a ( λ ) ( λ λ a ) a α
where λ a denotes the known wavelength, τ a ( λ ) denotes the AOD value of the known band, and a α denotes the Ångström wavelength index in the ground-based product. The ground-based observed AOD value of 440 nm can be interpolated to the 550 nm band with Equation (2), and can be compared with the satellite AOD product.

2.3.2. Space-Time Matching

The MODIS Terra transits the observation area once a day, with the MOD04_L2 spatial resolution being 10 km, while the CE-318 sun photometer is only deployed at fixed stations, and multiple observations are made in a day with an average observation frequency of 15 min. Thus, it is difficult to match the satellite data and ground-based observation data in space and time. To better evaluate the accuracy and applicability of the satellite data, the following spatiotemporal matching scheme is designed and presented in this paper: for ground-based observations, AOD values are statistically averaged over a certain time range centered on the satellite transit time, and for satellite AOD data, they are statistically averaged over a certain spatial region centered on ground-based observation sites. Many scholars have studied the selection of spatial and temporal regions [45,46], and Ichoku et al. [45] concluded that the variation in the spatial sampling window of MODIS aerosol products from 30 km to 90 km has little effect on the window mean and standard deviation. Considering the complex and variable topography and weather in Gansu Province, this paper tests various schemes in spatial window sampling, i.e., 30 km × 30 km, 50 km × 50 km, 70 km × 70 km, 90 km × 90 km, and 30 min, before and after satellite transit as the time window.

2.3.3. Verification Method

After band matching and space–time matching between the ground-based observation data and MODIS AOD products, linear regression analysis is used to compare and verify the applicability of satellite data in Gansu Province for the DB algorithm and DB–DT combined algorithm, where the correlation coefficient (R) is used to evaluate the degree of correlation between satellite data and ground-based observation data, and the root mean square error (RMSE) is used to evaluate the data variability between satellite data and ground-based observation data. When the slope is closer to 1, the intercept is closer to 0, R tends to 1, and the RMSE value is smaller, which indicates that the ground-based observations fit better with the satellite data.

3. Results

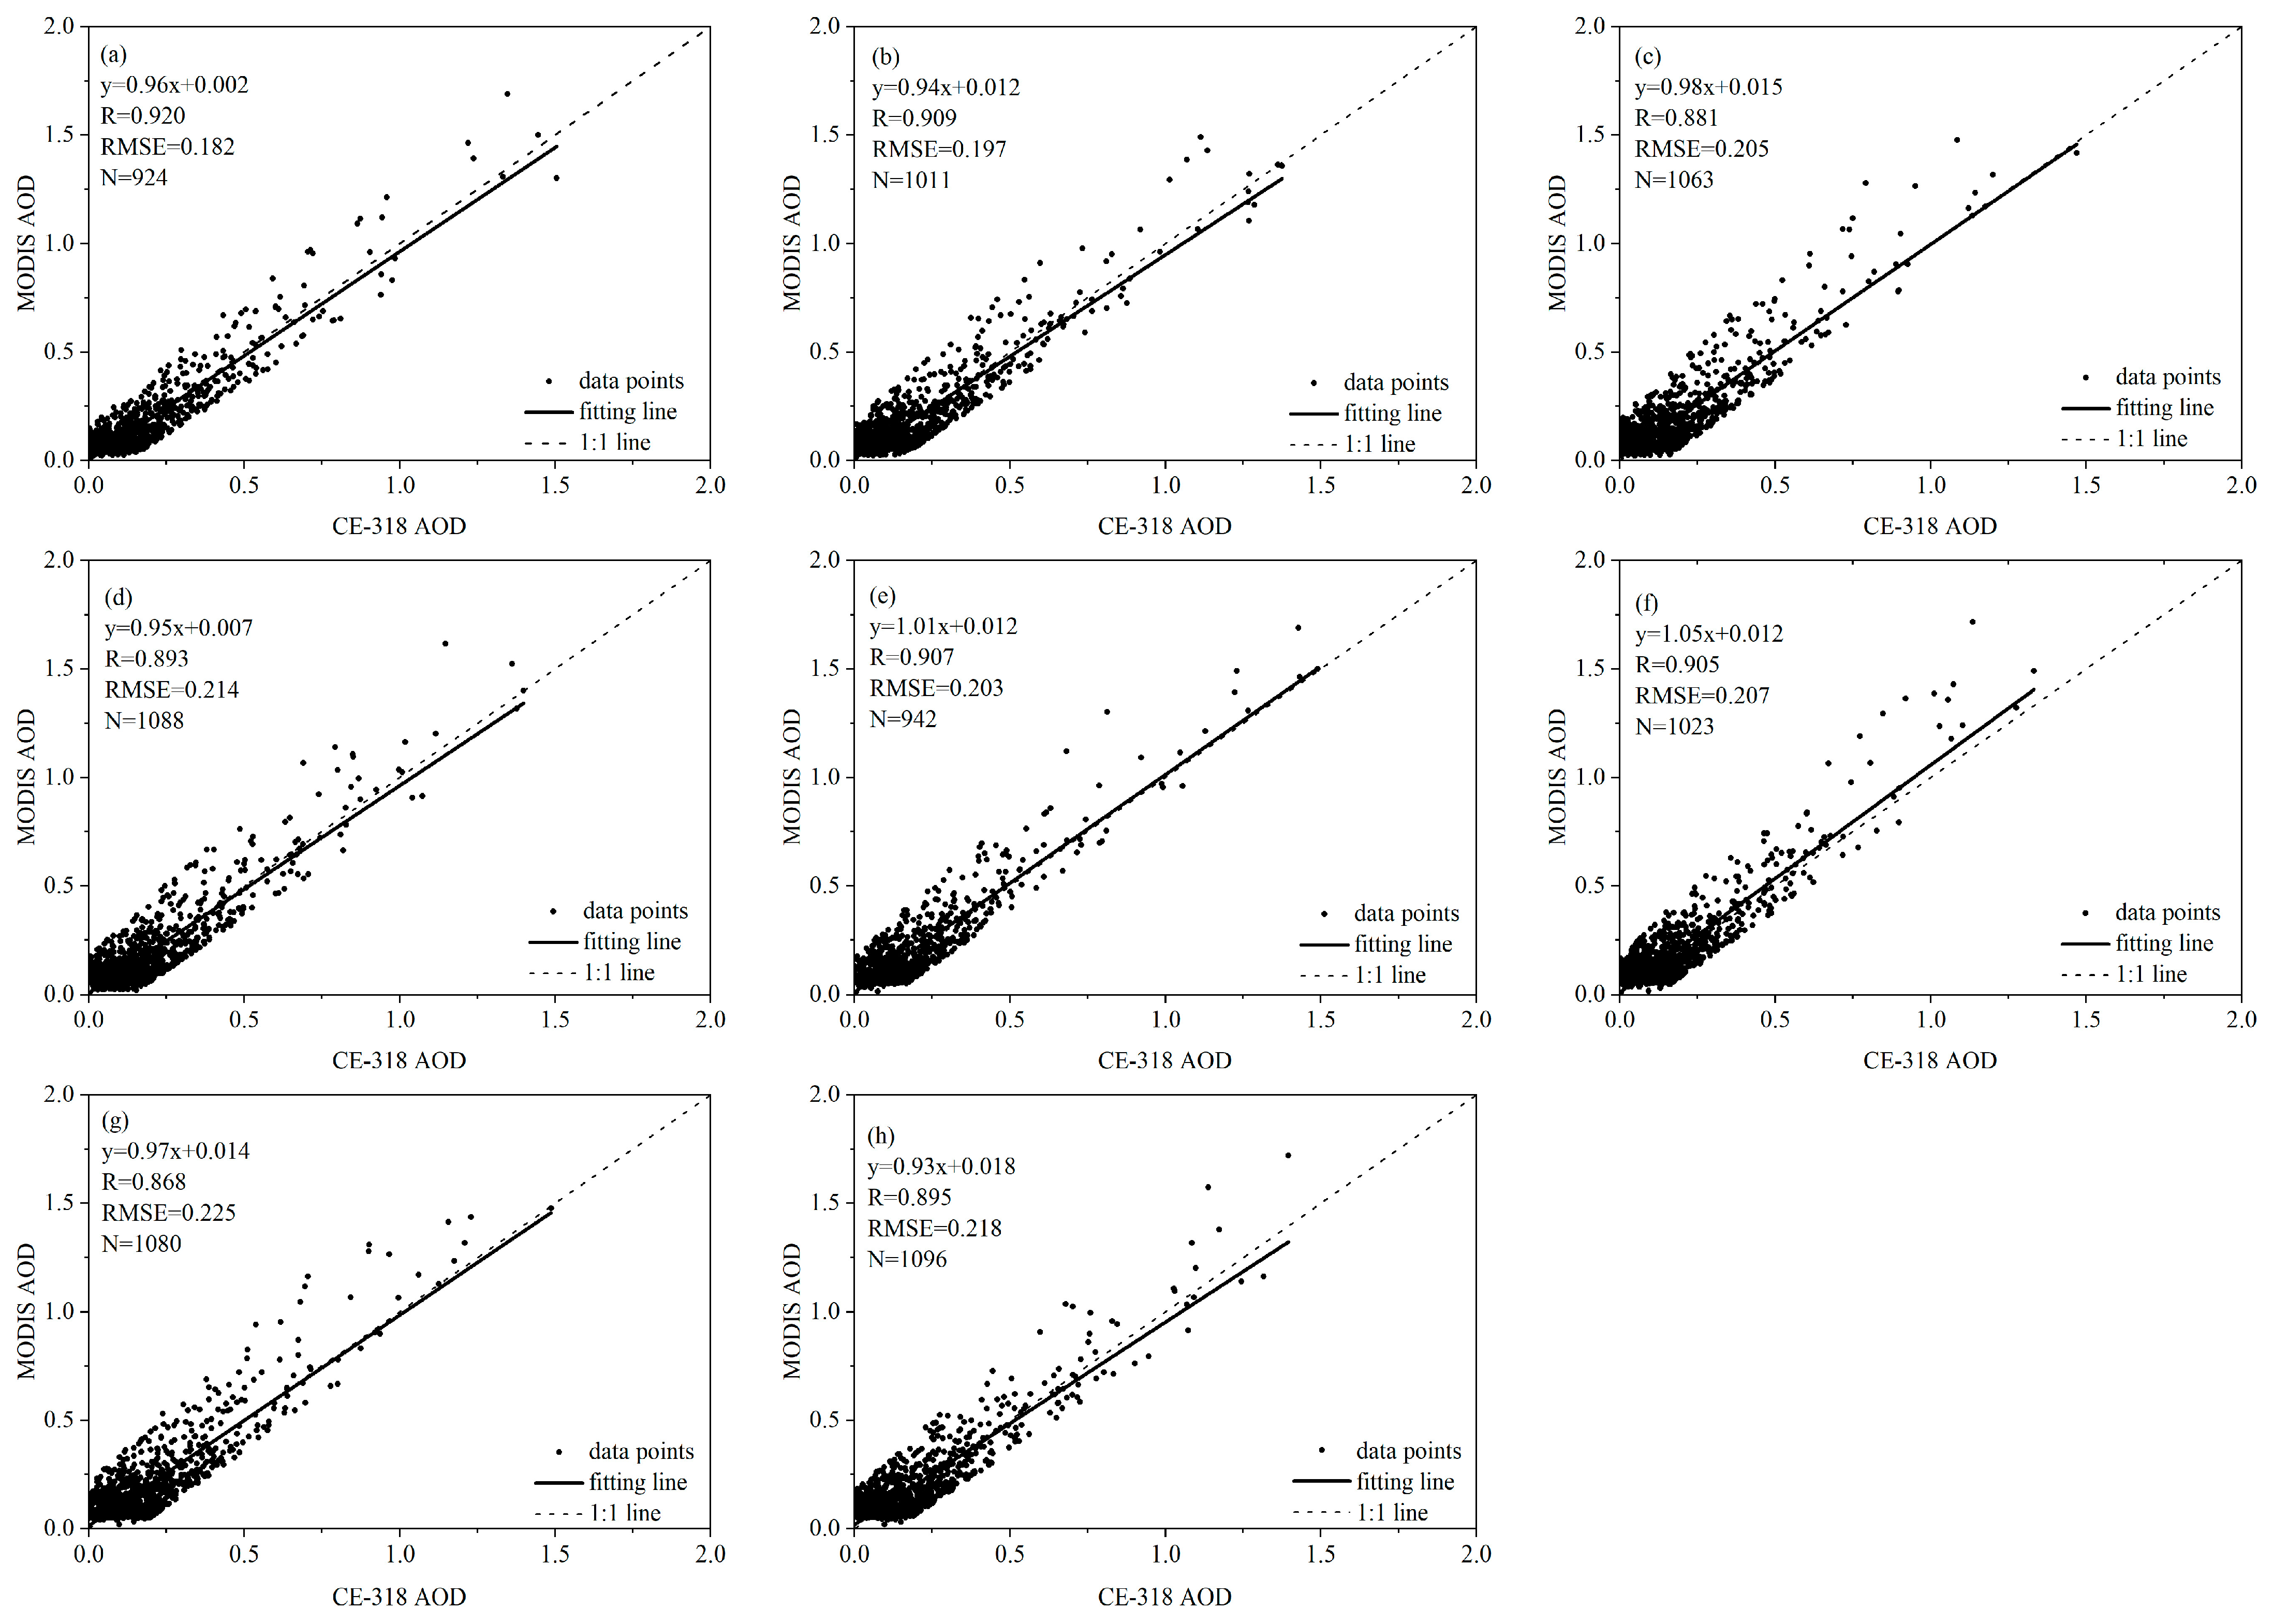
3.1. Overall Validation Analysis

Figure 2 shows the scatter comparison of the AOD that was obtained with four spatial sampling window schemes against the ground-based observed AOD for the DB algorithm and DB–DT combined algorithm, with matching data from the three sites mentioned above. From this figure, we can see that the MOD04_L2 AOD products of the C6 dataset are in good agreement with the ground-based observations, and the correlation coefficients of the different spatial sampling window schemes corresponding to the two algorithms are all above 0.86 and as high as 0.92, with RMSEs of no more than 0.23 and standard deviations of no greater than 0.2. The slopes in the linear fit parameters are all approximately 1, and the intercepts all tend to be close to 0, which indicates that the MOD04_L2 AOD products of the C6 dataset not only correlate well with the ground-based observations, but also have little data variability with the observed values. Similarly, it can be seen from Figure 2 that the correlation coefficient between the MOD04_L2 AOD products and ground-based observations decreases as the spatial sampling window increases, regardless of the DB algorithm or DB–DT combined algorithm, but the correlation coefficient increases slightly when the sampling window increases from 70 km × 70 km to 90 km × 90 km. The RMSE can be controlled at below 0.2 when the sampling window is within 50 km × 50 km. Meanwhile, the matching data volume of the MODIS AOD and the ground-based observation AOD increases with the increase in the sampling window size, and the matching data volume of the DB–DT combined algorithm AOD is slightly higher than that of the DB algorithm AOD.
Overall, the spatial sampling windows of both algorithms are more representative of the AOD values in Gansu when a window of 30 km × 30 km is selected, thus reflecting the local characteristics. The AOD inversion accuracy of the DB algorithm dataset is better than that of the DB–DT combined algorithm dataset overall, which is mainly due to the dynamic database of surface reflectance established in the DB algorithm and the improved aerosol model [47,48,49]. The highest inversion accuracy is the DB algorithm AOD with the sampling window set at 30 km × 30 km (R = 0.920, RMSE = 0.182), and the lowest inversion accuracy is the DB–DT combined algorithm AOD with the sampling window is set at 70 km × 70 km (R = 0.868, RMSE = 0.225).

3.2. Validation Analysis of Different Underlying Surfaces

Stations with different underlying surfaces were selected to verify the performance of the DB algorithm AOD and DB–DT combined algorithm AOD when different spatial windows were used. Table 2 gives the comparison of the AOD inversion accuracy with four spatial collection windows for the Lanzhou station in the urban surface of the river valley, the Dunhuang station in the Gobi desert surface and the Minqin station in the ecologically fragile area. As seen from Table 2, the two algorithms have higher AOD accuracy using the four windows of inversion, with the correlation coefficient R reaching over 0.83 and the RMSE below 0.21. For the Lanzhou station, the DB algorithm AOD has the highest inversion accuracy (R = 0.929, RMSE = 0.179) when using a 30 km × 30 km spatial window, and the DB–DT combined algorithm AOD has the lowest inversion accuracy (R = 0.832, RMSE = 0.200) when using a 90 km × 90 km spatial window. Overall, the inversion performance of the DB algorithm AOD at Lanzhou station is better than that of the DB–DT combined algorithm AOD, and the best inversion accuracy for the DB–DT combined algorithm AOD is when the sampling window is set at 30 km × 30 km (R = 0.884, RMSE = 0.193). When the DB algorithm has a spatial sampling window of 30 km × 30 km, the AOD inversion accuracy at the Dunhuang station is the highest (R = 0.929, RMSE = 0.171), and the AOD inversion accuracy of the DB algorithm is the lowest when the 90 km × 90 km spatial window is used (R = 0.883, RMSE = 0.180). For the Minqin station, the best inversion accuracy (R = 0.933, RMSE = 0.182) is achieved when the DB algorithm AOD adopts a spatial window of 30 km × 30 km, and the worst inversion accuracy (R = 0.877, RMSE = 0.205) is achieved when the DB–DT combined algorithm AOD adopts a spatial window of 70 km × 70 km. It is worth noting that both algorithms in the AOD inversion for the Minqin station with the 90 km × 90 km spatial window and the DB–DT combined algorithm in the AOD inversion for the Dunhuang station with the 90 km × 90 km spatial window perform better, with correlation coefficients R exceeding 0.90 and RMSEs below 0.191.
From the above analysis, it can be seen that the DB algorithm AOD spatial sampling window set at 30 km × 30 km not only performs well in the whole Gansu area, but also achieves satisfactory results in the independent verification of different underlying surfaces. This indicates that the establishment of a dynamic surface reflectance database, the determination of surface type and the application of the normalized vegetation index in the DB algorithm have a more obvious influence on the AOD inversion effect, while the spatial sampling window has a direct effect on the inversion performance.

3.3. Validation Analysis for Different Seasons

In this study, March-May is classified as spring, June-August as summer, September-November as autumn, and December-February as winter, according to which Table 3 presents the comparison of the inversion accuracy of the two algorithms with the four spatial sampling windows in different seasons. Table 3 shows that the inversion accuracy of the DB algorithm and DB–DT combined algorithm is the worst in summer (R between 0.683–0.868 and RMSE between 0.195–0.277) regardless of which spatial sampling window is selected, which is probably because there is more water vapor in Gansu in summer, which affects the effect of AOD revision in the satellite products. A 30 km sampling window in spring (R = 0.938, RMSE = 0.161) and the DB–DT combined algorithm with the spatial sampling window set at 30 km × 30 km in winter (R = 0.945, RMSE = 0.153) have the best inversion effect, and conversely, the two algorithms corresponding to the 70 km × 70 km spatial sampling window have the worst inversion accuracy. Overall, the inversion accuracy of both algorithms is the best when the sampling window is 30 km × 30 km, and the DB algorithm has the inversion advantage in spring, autumn and winter, while the DB–DT combined algorithm has a better inversion effect than the DB algorithm only in winter. The AOD inversion accuracy of the DB algorithm in Gansu is less influenced by the season, while the AOD inversion effect of both algorithms is more influenced by the setting of the spatial sampling window.

3.4. Comparison of MODIS Product Images during Typical Polluted Atmospheric Conditions

From 16 to 22 March 2021, Gansu Province suffered strong dusty weather with the greatest intensity and the widest impact in 10 years. In this study, we selected the severely polluted day of 19 March as typical polluted atmospheric conditions for the MODIS product image comparison, and Figure 3 shows the distribution of the MOD04 AOD product DB algorithm and the DB–DT combined algorithm dataset in Gansu Province on that date. It can be seen from Figure 3 that both algorithms can reflect the distribution of AOD values in the northwestern and central regions of Gansu, and high AOD value areas (AOD values greater than 2.5) were monitored in the Hexi Corridor and central region, which coincide with the severely polluted atmospheric conditions in the Hexi Corridor and central region on 19 March. Unfortunately, both the DB algorithm of the MODIS C6 dataset and the AOD products of the DB–DT combined algorithm showed poor monitoring results in the southeastern region of Gansu, and there were also discontinuities in the AOD values in the northwestern region of Gansu. This is consistent with the findings of Tang et al. [49], where the DB algorithm AOD for MODIS C6 and the DB–DT combined algorithm AOD were significantly better than other products for monitoring in the northern and western regions of China.
From the above analysis, it can be seen that both the MOD04 AOD product DB algorithm and the DB–DT combined algorithm dataset can reflect the monitoring effect of AOD values in the middle and west parts of Gansu Province, with the monitoring of high values of AOD in the process of polluted atmospheric conditions presenting a relatively excellent effect. However, both algorithms come with the phenomenon of missing measurements for AOD monitoring in Gansu, mainly in the southeastern part of the province, while the phenomenon of the discontinuous distribution of AOD values also exists in the northwestern part of the province.

4. Discussion

We found that previous validation of regional MODIS C6 aerosol products in China is mainly focused on the eastern and mid-China regions [5,11], and there are fewer validation studies for the northwestern region due to the lack of observational data. Meanwhile, the topography of Gansu Province is complex, and there are fewer comprehensive evaluations for AOD product algorithms. We urgently need more studies on the applicability of MODIS AOD products in Northwest China.
Our study stressed comparing the retrieval accuracy of MODIS C6 DB algorithm AOD products and DB–DT combined algorithm AOD products for Gansu Province when setting different spatial sampling windows, and found that the inversion effect of the two algorithms on AOD is influenced by the spatial sampling window setting. This is different from other research, which uses only one spatial sampling window [13]. Additionally, we also found that both the DB algorithm AOD and the DB–DT combined algorithm AOD can monitor the distribution of AOD in the central and western regions of Gansu, especially for high values of AOD under polluted atmospheric conditions, which represents a good monitoring effect. It is noteworthy that the two algorithms perform poorly in monitoring the southeast region of Gansu, while there is a discontinuous AOD distribution in the northwest region of Gansu. Therefore, the validation of other satellite data in Gansu Province should attract more research attention.

5. Conclusions

In this study, ground-based solar photometer AOD observations from the Lanzhou, Dunhuang and Minqin stations in Gansu Province were used to verify the accuracy of MODIS C6 AOD products, and dusty weather occurring in Gansu Province was selected for analysis. The following conclusions were drawn:
(1)
The spatial sampling windows of the DB algorithm and the DB–DT combined algorithm of MODIS C6 AOD are more representative of the AOD values in Gansu Province when set at 30 km × 30 km, and the inversion accuracy of the DB algorithm dataset for AOD in this region is better than that of the DB–DT combined algorithm dataset on the whole. The inversion accuracy is highest when the spatial sampling window of the DB algorithm AOD is set at 30 km × 30 km, and the lowest inversion accuracy is with the DB–DT combined algorithm AOD with the sampling window set at 70 km × 70 km. The dynamic database of surface reflectance and the improved cloud pollution image element procedure established in the DB algorithm greatly improve the DB algorithm AOD inversion accuracy.
(2)
In the comparison of the inversion effect of different sub-surfaces, the MODIS C6 DB algorithm AOD product still maintains high inversion accuracy, especially when the spatial sampling window is set at 30 km × 30 km. The DB algorithm is almost unaffected by the surface differences in inversion accuracy.
(3)
From the seasonal analysis, it can be seen that the DB algorithm has less seasonal variability in the AOD inversion accuracy in Gansu and has inversion advantages in spring, autumn and winter, while the DB–DT combined algorithm has a better inversion effect than the DB algorithm only in winter. The inversion effect of both algorithms on AOD is influenced by the spatial sampling window setting.
(4)
From the distribution of MODIS AOD product images during typical polluted atmospheric conditions, we can see that both the DB algorithm AOD of MODIS C6 and the DB–DT combined algorithm AOD can monitor the distribution characteristics of AOD in northwest and central Gansu, but the monitoring effect in southeast Gansu is poor; meanwhile, there is a discontinuity of AOD distribution in northwest Gansu.

Author Contributions

Methodology, F.H.; Software, F.H., C.F.; Data Analysis, F.H., S.W., X.K.; Writing—original draft, F.H., H.L.; Writing—review and editing, F.H., W.M.; Funding acquisition, F.H., W.M. All authors have read and agreed to the published version of the manuscript.

Funding

This research was funded by the Science and Technology Program (Innovation Base and Talent Program) Projects of Gansu Province (No. 21JR7RA714) and the National Natural Science Foundation of China (41830650, U2242208).

Data Availability Statement

Not applicable.

Acknowledgments

We are grateful to the anonymous reviewers and editors for appraising our manuscript and offering instructive comments. We appreciate the free use of NASA’s Earth Observing System Data and Information System (EOSDIS).

Conflicts of Interest

The authors declare no conflict of interest.

References

  1. King, M.D.; Kaufman, Y.J.; Menzel, W.P.; Tanre, D. Remote sensing of cloud, aerosol, and water vapor properties from the Moderate Resolution Imaging Spectrometer (MODIS). IEEE Trans. Geosci. Remote Sens. 1992, 30, 2–27. [Google Scholar] [CrossRef] [Green Version]
  2. King, M.; Kaufman, Y.; Nakajima, T. Remote sensing of tropospheric aerosols from space: Past, present and future. Bull. Am. Meteorol. Soc. 1999, 80, 2229–2259. [Google Scholar] [CrossRef]
  3. Luo, Y.F.; Zhou, X.J.; Li, W.L. Advances in the study of atmosphere aerosol radiative forcing and climate change. Adv. Earth Sci. 1998, 13, 572–581. [Google Scholar]
  4. Kaiser, D.P.; Qian, Y. Decreasing trends in sunshine duration over China for 1954–1998: Indication of increased haze pollution. Geophys. Res. Lett. 2002, 29, 38–1–38–4. [Google Scholar] [CrossRef]
  5. Zheng, X.B.; Kang, W.M.; Zhao, T.L.; Luo, Y.X.; Duan, C.C.; Chen, J. Long-term trends in sunshine duration over Yunnan-Guizhou Plateau in Southwest China for 1961–2005. Geophys. Res. Lett. 2008, 35, L15707. [Google Scholar] [CrossRef]
  6. Ramanathan, V.; Li, F.; Ramana, M.V.; Praveen, P.S.; Kim, D.; Corrigan, C.E.; Nguyen, H.; Stone, E.A.; Schauer, J.J.; Carmichael, G.R. Atmospheric brown clouds: Hemispherical and regional variations in long-range transport, absorption, and radiative forcing. J. Geophys. Res.-Atmos. 2007, 112, D22S21. [Google Scholar] [CrossRef]
  7. Wild, M.; Trüssel, B.; Ohmura, A.; Charles, N.L.; Gert, K.L.; Ellsworth, G.D.; Tsvetkov, A. Global dimming and brightening: An update beyond 2000. J. Geophys. Res. 2009, 114, D10. [Google Scholar] [CrossRef] [Green Version]
  8. Stanhill, G. A perspective on global warming, dimming, and brightening. EOS Trans. Am. Geophys. Union 2007, 88, 58. [Google Scholar] [CrossRef]
  9. Wang, K.C.; Dickinson, R.E.; Liang, S.L. Clear sky visibility has decreased over land globally from 1973 to 2007. Science 2009, 323, 1468–1470. [Google Scholar] [CrossRef] [PubMed]
  10. Li, Z.Q.; Niu, F.; Fan, J.; Liu, Y.; Ding, Y. Long-term impacts of aerosols on the vertical development of clouds and precipitation. Nat. Geosci. 2011, 12, 888–894. [Google Scholar] [CrossRef]
  11. Shi, R.; Wang, T.J.; Shu, L.; Zhuang, B.; Jiang, Z.; Liao, J.; Yin, C. The Spatial and Temporal Characteristics of Aerosol-Cloud-Precipitation Interactions during summer in East Asia. Chin. J. Atmos. Sci. 2015, 39, 12–22. [Google Scholar]
  12. Gui, K.; Che, H.Z.; Chen, Q.; Zeng, Z.; Zheng, Y.; Long, Q.; Sun, T.; Liu, X.; Wang, Y.; Liao, T. Water vapor variation and the effect of aerosols in China. Atmos. Environ. 2017, 165, 322–335. [Google Scholar] [CrossRef]
  13. Jiang, J.; Liu, J.; Jiao, D.; Zha, Y.; Cao, S. Evaluation of MODIS DT, DB, and MAIAC Aerosol Products over Different Land Cover Types in the Yangtze River Delta of China. Remote Sens. 2023, 15, 275. [Google Scholar] [CrossRef]
  14. Tie, X.X.; Wu, D.; Brasseur, G. Lung cancer mortality and exposure to atmospheric aerosol particles in Guangzhou, China. Atmos. Environ. 2009, 43, 2375–2377. [Google Scholar] [CrossRef]
  15. Schäfer, K.; Thomas, W.; Peters, A.; Ries, L.; Cyrys, J. Influences of the 2010 Eyjafjallajökull volcanic plume on air quality in the northern Alpine region. Atmos. Chem. Phys. 2011, 11, 8555–8575. [Google Scholar] [CrossRef] [Green Version]
  16. Liu, H.; Gao, X.M.; Xie, Z.Y.; Li, T.; Zhang, W. Spatio-temporal characteristics of aerosol optical depth over Beijing-Tianjin-Hebei-Shanxi-Shandong region during 2000–2013. Acta Sci. Circumstantiae 2015, 35, 1506–1511. [Google Scholar]
  17. Zhao, X.F.; Ye, H. Monitoring the changes of urban heat island seasonal dynamics in the process of urbanization by remote sensing. Ecol. Environ. Sci. 2009, 18, 1817–1821. [Google Scholar]
  18. Twomey, S.A. The Influence of Pollution on the Shortwave Albedo of Clouds. Atmos. Sci. 1977, 34, 1149–1152. [Google Scholar] [CrossRef]
  19. Cofala, J.; Amann, M.; Gyarfas, F.; Schoepp, W.; Boudri, J.C.; Hordijk, L.; Kroeze, C.; Li, J.; Dai, L.; Panwar, T.S. Cost-effective control of SO2 emissions in Asia. J. Environ. Manag. 2004, 72, 149–161. [Google Scholar] [CrossRef]
  20. Rosenfeld, D.; Dai, J.; Yu, X.; Yao, Z.; Xu, X.; Yang, X.; Du, C. Inverse relations between amounts of air pollution and orographic precipitation. Science 2007, 315, 1396–1398. [Google Scholar] [CrossRef] [Green Version]
  21. Holben, B.N.; Eck, T.F.; Slutsker, I.; Tanré, D.; Buis, J.P.; Setzer, A.; Vermote, E.; Reagan, J.A.; Kaufman, Y.J.; Nakajima, T. AERONET-A Federated Instrument Network and Data Archive for Aerosol Characterization. Remote Sens. Environ. 1998, 66, 1–16. [Google Scholar] [CrossRef]
  22. Che, H.; Zhang, X.Y.; Xia, X.; Goloub, P.; Holben, B.; Zhao, H.; Wang, Y.; Zhang, X.C.; Wang, H.; Blarel, L.; et al. Ground-based aerosol climatology of China: Aerosol optical depths from the China aerosol remote sensing network (CARSNET) 2002–2013. Atmos. Chem. Phys. 2015, 15, 7619–7652. [Google Scholar] [CrossRef] [Green Version]
  23. He, Q.; Li, C.; Tang, X.; Li, H.; Geng, F.; Wu, Y. Validation of MODIS derived aerosol optical depth over the Yangtze River Delta in China. Remote Sens. Environ. 2014, 8, 1649–1661. [Google Scholar] [CrossRef]
  24. Xie, Y.; Zhang, Y.; Xiong, X.X.; Qu, J.J.; Che, H. Validation of MODIS aerosol optical depth product over China using CARSNET measurements. Atmos. Environ. 2011, 45, 5970–5978. [Google Scholar] [CrossRef]
  25. Luo, Y.X.; Chen, J.; Zheng, X.B.; Zhao, T.L. Climatology of aerosol optical depth over China from recent 10 years of MODIS remote sensing data. Ecol. Environ. Sci. 2012, 21, 876–883. [Google Scholar] [CrossRef]
  26. Remer, L.A.; Kaufman, Y.J.; Tanré, D. The MODIS Aerosol Algorithm, Products, and Validation. J. Atmos. Sci. 2005, 62, 947–973. [Google Scholar] [CrossRef] [Green Version]
  27. Ichoku, C.; Remer, L.A.; ECK, T.F. Quantitative evaluation and intercomparison of morning and afternoon Moderate Resolution Imaging Spectroradiometer (MODIS) aerosol measurements from Terra and Aqua. J. Geophys. Res. 2005, 10, 454–459. [Google Scholar]
  28. Levy, R.C.; Leptoukh, G.G.; Kazhn, R.; Zubko, V.; Remer, L.A. A Critical Look at Deriving Monthly Aerosol Optical Depth from Satellite Data. IEEE Trans. Geosci. Remote Sens. 2009, 47, 2942–2956. [Google Scholar] [CrossRef]
  29. Kim, S.W.; Yoon, S.C.; Kim, J.; Kim, S.Y. Seasonal and monthly variations of columnar aerosol optical properties over East Asia determined from multi-year MODIS, LIDAR and AERONET Sun/Sky radiometer measurements. Atmos. Environ. 2007, 41, 1634–1651. [Google Scholar] [CrossRef]
  30. Adeyewa, Z.D.; Balogun, E.E. Wavelength dependence of aerosol optical depth and the fit of the Angstrom law. Theor. Appl. Climatol. 2003, 74, 105–122. [Google Scholar] [CrossRef]
  31. Li, C.C.; Mao, J.T.; Kai-Hon Lau, A. Characteristics of Aerosol Optical Depth Distributions over Sichuan Basin Derived from MODIS Data. J. Appl. Meteorol. Sci. 2003, 14, 1–7. [Google Scholar]
  32. Li, C.C.; Mao, J.T.; Kai-Hon Lau, A. Remote Sensing of High Spatial Resolution Aerosol Optical Depth with MODIS Data over Hong Kong. Chin. J. Atmos. Sci. 2005, 29, 335–342. [Google Scholar]
  33. Guan, J.X.; Li, C.C. Spatial Distributions and Changes of Aerosol Optical Depth over Eastern and Central China. Acta Sci. Nat. Univ. Pekin. 2010, 46, 185–191. [Google Scholar]
  34. Sayer, A.M.; Munchak, L.A.; Hsu, N.C.; Levy, R.C.; Bettenhausen, C.; Jeong, M.J. MODIS Collection 6 aerosol products: Comparison between Aqua’s e-Deep Blue, Dark Target, and “merged” data sets, and usage recommendations. J. Geophys. Res. Atmos. 2015, 119, 13965–13989. [Google Scholar] [CrossRef]
  35. Che, H.Z.; Qi, B.; Zhao, H.; Xia, X.; Philippe, G.; Oleg, D.; Victor, E.; Emilio, C.A.; Luc, B.; Wu, Y. Aerosol optical properties and instantaneous radiative forcing based on high temporospatial resolution CARSNET ground-based measurements over eastern China. Atmos. Chem. Phys. 2017, 18, 1–42. [Google Scholar]
  36. Levy, R.C.; Mattoo, S.; Munchak, L.A.; Remer, L.A.; Hsu, N.C. The Collection 6 MODIS aerosol products over land and ocean. Atmos. Meas. Tech. 2013, 6, 2989–3034. [Google Scholar] [CrossRef] [Green Version]
  37. Zhang, J.; Reid, J.S. A decadal regional and global trend analysis of the aerosol optical depth using a data-assimilation grade over-water MODIS and Level2 MISR aerosol products. Atmos. Chem. Phys. 2010, 10, 10949–10963. [Google Scholar] [CrossRef] [Green Version]
  38. Han, D.W.; Liu, W.Q.; Zhang, Y.J.; Lu, Y.H.; Liu, J.G.; Zhao, N.J.; Han, D.W.; Liu, W.Q.; Zhang, J.; Lu, Y.H. Influence of temperature and relative humidity upon aerosol mass concentrations vertical distributions. J. Grad. Sch. Chin. Acad. Sci. 2007, 24, 619–624. [Google Scholar]
  39. Wei, J.; Li, Z.; Peng, Y.; Sun, L. MODIS Collection 6.1aerosol optical depth products over land and ocean: Validation and comparison. Atmos. Environ. 2019, 201, 428–440. [Google Scholar] [CrossRef]
  40. Li, Z.B.; Wang, N.; Zhang, Z.L.; Wang, T.T.; Tao, J.H.; Wang, P.; Ma, S.L.; Xu, B.B.; Fan, M. Validation and analysis of MODIS aerosol optical depth products over China. China Environ. Sci. 2020, 40, 4190–4202. [Google Scholar]
  41. Zhang, T.Q. Remote Sensing Based Validation of MODIS C6 Aerosol Products in Land Areas of China. Henan Sci. Technol. 2023, 42, 103–106. [Google Scholar]
  42. Jian, Y.T.; Zhang, B.; Huang, H. Regional Difference Analysis of Climate Change in Gansu Province in Recent 58 Years and Its Impact on Circulation. Plateau Meteorol. 2022, 41, 1291–1301. [Google Scholar]
  43. Ichoku, C.; Kaufman, Y.J.; Remer, L.A.; Chu, D.A.; Lau, W.K.M. Global aerosol remote sensing from MODIS. Adv. Space Res. 2004, 34, 820–827. [Google Scholar] [CrossRef]
  44. Ångström, A. The parameters of atmospheric turbidity. Tellus 1964, 16, 64–75. [Google Scholar] [CrossRef] [Green Version]
  45. Ichoku, C.; Chu, D.A.; Mattoo, S.M. A spatio-temporal approach for global validation and analysis of MODIS aerosol products. Geophys. Res. Lett. 2002, 29, MOD121–MOD124. [Google Scholar] [CrossRef] [Green Version]
  46. Gupta, P.; Remer, L.A.; Levy, R.C.; Mattoo, S. Validation of MODIS 3 km land aerosol optical depth from NASA’s EOS Terra and Aqua missions. Atmos. Meas. Tech. 2018, 11, 3145–3159. [Google Scholar] [CrossRef] [Green Version]
  47. Wang, H.B.; Zhang, L.; Jiao, S.M.; Zhang, Z.; Zhu, Y.; Zhu, C. Evaluation of the MODIS aerosol products and analysis of the retrieval errors in China. Plateau Meteorol. 2016, 35, 810–822. [Google Scholar]
  48. Wei, Y.N.; Wu, S.C.; Xu, F.F.; Wang, Z.; Tao, S.; Ma, J.J. Comparison and Analysis of Three Versions of MODIS Aerosol Product in China Region. J. Atmos. Environ. Opt. 2016, 11, 217–225. [Google Scholar]
  49. Tang, W.Y.; Bao, Y.S.; Zhang, X.Y.; Liu, H.; Zhu, L. Comparison of FY-3A/MERSI, MODIS C5.1, C6 and AERONET aerosol optical depth in China. Acta Meteorol. Sin. 2018, 76, 449–460. [Google Scholar]
Figure 1. Elevation of the study area and distribution of in situ observation site (where DEM denotes the altitude).
Remotesensing 15 02972 g001
Figure 2. Comparison of the accuracy of MODIS AOD products and ground-based observation data ((a). DB—30 km × 30 km, (b). DB—50 km × 50 km, (c). DB—70 km × 70 km, (d). DB—90 km × 90 km, (e). DB–DT combined—30 km × 30 km, (f). DB–DT combined—50 km × 50 km, (g). DB–DT combined—70 km × 70 km, (h). DB–DT combined—90 km × 90 km).
Remotesensing 15 02972 g002
Figure 3. Distribution of MOD04 AOD products in Gansu Province on 19 March 2021 ((a) Deep Blue dataset, (b) Deep Blue and Dark Target combined dataset).
Remotesensing 15 02972 g003
Table 1. Properties of the in situ observation sites.
StationsLongitude & LatitudeElevation
Lanzhou36.04° N, 103.88° E1517.2 m
Dunhuang40.14° N, 94.68° E1137.5 m
Minqin38.63° N, 103.08° E1367.5 m
Table 2. Comparison of the inversion accuracy of different underlying surfaces.
StationsSampling WindowDBDB–DT Combined
RRMSENRRMSEN
Lanzhou30 km × 30 km0.9290.1792370.8840.193254
50 km × 50 km0.8820.1832730.8580.187282
70 km × 70 km0.8370.1922860.8780.199296
90 km × 90 km0.8790.1902980.8320.200303
Dunhuang30 km × 30 km0.9290.1713640.9200.177364
50 km × 50 km0.9140.1813860.9190.178387
70 km × 70 km0.8870.1834160.8870.188418
90 km × 90 km0.8830.1804180.9060.179422
Minqin30 km × 30 km0.9330.1823230.9290.184324
50 km × 50 km0.9170.1883520.9160.198354
70 km × 70 km0.8980.1973610.8770.205366
90 km × 90 km0.9050.1913720.9210.180371
Where R is the correlation coefficient, RMSE is the root mean square error, and N denotes the amount of matched data.
Table 3. Comparison of the inversion accuracy of the AOD products of the two algorithms in different seasons.
SeasonsDB
30 km × 30 km50 km × 50 km70 km × 70 km90 km × 90 km
RRMSENRRMSENRRMSENRRMSEN
Spring0.9380.1612580.9300.1692810.9220.2062920.9250.200301
Summer0.8680.1952530.8090.1992690.7300.2262830.7710.218295
Autumn0.8460.1702390.8960.1752620.8410.1782770.8400.175279
Winter0.9170.1861740.9040.1871990.8330.2032110.8510.197213
SeasonsDB–DT Combined
30 km × 30 km50 km × 50 km70 km × 70 km90 km × 90 km
RRMSENRRMSENRRMSENRRMSEN
Spring0.8990.1902610.9010.2022800.8450.2192990.8870.200301
Summer0.8280.2752610.8040.2772810.6830.2252950.8170.271300
Autumn0.8390.1802460.8610.1852620.8190.2012770.8690.211281
Winter0.9450.1531740.9340.1722000.9060.1972090.9170.197214
Where R is the correlation coefficient, RMSE is the root mean square error, and N denotes the amount of matched data.
Disclaimer/Publisher’s Note: The statements, opinions and data contained in all publications are solely those of the individual author(s) and contributor(s) and not of MDPI and/or the editor(s). MDPI and/or the editor(s) disclaim responsibility for any injury to people or property resulting from any ideas, methods, instructions or products referred to in the content.

