Article

Quantitative Analysis of Desertification-Driving Mechanisms in the Shiyang River Basin: Examining Interactive Effects of Key Factors through the Geographic Detector Model

1
Northwest Institute of Eco-Environment and Resources, Chinese Academy of Sciences, Lanzhou 730000, China
2
Key Laboratory of Ecological Safety and Sustainable Development in Arid Lands, Lanzhou 730000, China
3
University of Chinese Academy of Sciences, Beijing 100049, China
4
Department of Geophysics and Space Science, Eötvös Loránd University, Pázmány Péter Stny. 1/C, 1117 Budapest, Hungary
*
Author to whom correspondence should be addressed.
Remote Sens. 2023, 15(12), 2960; https://doi.org/10.3390/rs15122960
Submission received: 8 April 2023 / Revised: 30 May 2023 / Accepted: 2 June 2023 / Published: 6 June 2023

Abstract

:
Desertification is a global eco-environmental hazard exacerbated by environmental and anthropogenic factors. However, comprehensive quantification of each driving factor’s relative impact poses significant challenges and remains poorly understood. The present research applied a GIS-based and geographic detector model to quantitatively analyze interactive effects between environmental and anthropogenic factors on desertification in the Shiyang River Basin. A MODIS-based aridity index was used as a dependent variable, while elevation, near-surface air temperature, precipitation, wind velocity, land cover change, soil salinity, road buffers, waterway buffers, and soil types were independent variables for the GeoDetector model. A trend analysis revealed increased aridity in the central parts of the middle reach and most parts of the Minqin oasis and a significant decrease in some regions where ecological rehabilitation projects are underway. The GeoDetector model yielded a power determinant (q) ranging from 0.004 to 0.270, revealing elevation and soil types as the region’s highest contributing factors to desertification. Precipitation, soil salinity, waterway buffer, and wind velocity contributed moderately, while near-surface air temperature, road buffer, and land cover dynamics exhibited a lower impact. In addition, the interaction between driving factors often resulted in mutual or non-linear enhancements, thus aggravating desertification impacts. The prominent linear and mutual enhancement occurred between elevation and soil salinity and between elevation and precipitation. On the other hand, the results exhibited a non-linear enhancement among diverse variables, namely, near-surface air temperature and elevation, soil types and precipitation, and land cover dynamics and soil types, as well as between wind velocity and land cover dynamics. These findings suggest that environmental factors are the primary drivers of desertification and highlight the region’s need for sustainable policy interventions.

1. Introduction

As a global environmental concern exacerbated by human activities and climate change, desertification poses significant threats to ecosystems and socio-economic growth [1,2,3,4,5,6,7,8]. It affects a quarter of the land surface, with 10 to 20% of drylands, impacting 250 million people in developing countries [9,10]. Globally, more than 12 million hectares of farmland are lost yearly due to desertification, with an approximate yearly loss of 20 million tons of crops supposedly produced by degraded lands [11]. South and East Asia, Southern Africa, the Citrum of Sahara, the Middle East, Latin America, the Caribbean, and western and southwestern parts of the United States of America are the areas most damaged by desertification [11,12,13,14]. Since the 1950s, desertification has drastically increased in China, peaking between the 1970s and early 1980s [15]. Following mitigation measures, certain regions experienced recovery while others witnessed a reversal in intensity [16,17]. Nevertheless, despite extensive efforts, the Shiyang River Basin remains under desertification risk, particularly across Minqin County [18,19,20,21,22,23].
Numerous scientific methodologies have been employed to comprehend desertification across diverse spatiotemporal scales. These approaches encompass biophysical and socio-economic data collection, statistical analysis, as well as remote sensing tools [24,25,26,27,28,29]. However, most of these studies have predominantly relied on qualitative inferences obtained through regression analysis, establishing a connection between the observed changes in desertification and climate change as well as human activity [30,31,32,33]. Although these methodologies have primarily focused on providing insights into the current state and dynamics of desertification [34,35,36,37], the quantitative analysis of each driving factor’s contribution remains unclear. It must be addressed to mitigate desertification and accelerate the implementation of target 15.3 of the Sustainable Development Goals (SDGs) by 2030.
Desertification encompasses not only vegetation loss but also an alteration in hydrological cycles and the transformation of once-habitable areas into arid or semi-arid landscapes [1]. Previous studies have predominantly utilized the normalized difference vegetation index (NDVI) as a proxy to evaluate ecosystem biomass, which is a crucial factor but does not involve the complete range of elements contributing to its assessment [38]. Conversely, the aridity index measures the dryness of a particular region by quantifying the relationship between precipitation and potential evapotranspiration, providing the overall water balance, status, and spatial heterogeneity of drought [39,40,41]. Therefore, it can capture these aspects and provides a more comprehensive assessment of desertification susceptibility of drylands [42].
Moreover, conventional statistical methodologies used to evaluate the factors influencing desertification dynamics and vegetation greening patterns, such as regression analysis and factor analysis, heavily rely on assumptions concerning the data [43,44]. However, these approaches often fail to effectively reveal the interactions among these factors due to data multicollinearity issues [45]. In contrast, the geographic detector model (GeoDetector) offers a non-linear approach that simplifies the analysis process [46]. More importantly, this approach is highly adaptable and capable of effectively handling categorical and continuous variables, as well as different data types [47]. One of its significant advantages is its ability to explicitly identify interdependencies among dependent variables without imposing constraints related to multicollinearity [48]. Therefore, the objective of this study is to conduct a quantitative assessment of environmental and anthropogenic factors, as well as their interactive impacts on desertification in the Shiyang River Basin. The findings will provide valuable scientific insights by establishing the environmental footprint of desertification mechanisms and serve as a fundamental basis for informing future policies on the sustainability of ecological restoration in the region.

2. Materials and Methods

2.1. Study Area Description

The Shiyang River Basin lies between 101°41′–104°16′E and 36°29′–39°27′N, in the east of the Hexi Corridor in Gansu Province, west of Wushaoling and north of the Qilian Mountains, covering a total area of 41,600 square kilometers [49]. High mountains in the south characterize its topography with altitudes ranging from 2000 to 5000 m. The central plain corridor area encompasses the eastern region of Longshou Mountain, extending toward the remnants of Hanmu Mountain, Hongya Mountain, and Aragua Mountain, with altitudes ranging between 1400 and 2000 m [50]. The North Basin includes the Minqin Basin, Jinchuan, and Changning Basin, ranging from 1300 to 1400 m in altitude [51]. Furthermore, the Shiyang River Basin is characterized by four distinct geomorphological units: the Qilian Mountains in the south, the Central Corridor Plain area, the Northern low mountain and hilly area, and the desert area [52]. Situated deep within the continent’s hinterland, the basin experiences a continental temperate arid climate, distinguished by intense solar radiation, ample sunshine, significant temperature variations, limited precipitation, high evaporation rates, and arid atmospheric conditions [53]. The Shiyang River Basin is traversed by several rivers, including the Dajing River, Gulang River, Huangyang River, Zamu River, and Jinta River, flowing from east to west [54], as shown in Figure 1.
The administrative division of the basin includes Gulang County, Liangzhou District, Minqin County, Tianzhu County of Wuwei City, part of Yongchang County, Jinchuan District of Jinchang City, Sunan Yugur Autonomous County, and Shandan of Zhangye City [54]. The study area is one of the Hexi corridor’s fast-growing industrial and agricultural activities [55]. According to the 2003 census, the total population of the basin is 2.2689 million, with 733,900 residing in urban areas and 1.535 million in rural areas, with an urbanization rate of 32.4% [56,57].

2.2. Model Input Parameters

This study considered the mean annual aridity index for the past 20 years as a dependent variable and indicator of ecosystem terrestrial conditions, while elevation (DEM), climate (mean annual near-surface air temperature, precipitation, and wind velocity), land cover change, soil salinity, road buffers, waterway buffers, and soil types were used as independent variables and proxies for assessing and quantifying driving factors associated with land degradation and recovery in the Shiyang River Basin. The technological roadmap for the study is illustrated in Figure 2.
Terrain analysis is fundamental for modeling environmental systems [58]. Hence, this study used DEM as a land degradation driving factor due to the topographic complexity and altitude gradient effect on the regional microclimate along the Qilian Mountains [59,60]. DEM data were acquired from Google Earth Engine (GEE), with a detailed explanation of the algorithms used for terrain data processing and visualization found in the paper published by the authors of [61]. Unfortunately, geospatial information on demographic growth, population structure, livestock, and carbon emissions is unavailable for land cover change analysis. However, alternative auxiliary variables such as hydrology, buffer roads, and waterways have been utilized to assess the anthropogenic factors contributing to land degradation. These variables serve as proxies without specific data on the factors mentioned above. During data processing, roads, buildings, and waterways in the region were vectorized based on Google Earth imagery; then, buffers were generated using the Euclidean distance function in QGIS 3.24.0. The proximity of the land to roads to urban settlements is directly proportional to the level of human impact on the land. Smaller distances to these features indicate a higher human impact.
Conversely, shorter distances to water sources indicate higher soil moisture levels and lower susceptibility to land degradation. Land cover dynamics data were also used as a proxy to analyze the climate’s impact on and established land-use policies’ contribution to the ecological status. Growing season data were obtained from Landsat 8 OLI imagery captured between May and August of each year. The resulting land cover map was produced using the China land cover classification system and the land use remote sensing mapping classification system [62].
As soil salinization poses a significant threat to the geochemical properties of soil, particularly in dryland areas [63], many studies have established the connection between soil salinization, climate change, soil fertility loss, and ecosystem degradation [64]. In this study, information regarding soil salinity content is obtained from a Landsat-based map generated using a multiple linear regression model, as described by the work in [65]. Equation (1) presented below is used to retrieve soil salinization.
EC   dS / m = 0.8963161 + 5.5292290 × B 8 + 2.7199391 × G × SWIR 1 + 2.3664955 × ( B × SWIR 1 ) + 2.7685607 × SI 5
where EC refers to electrical conductivity in dS/m (decisiemens per meter), B8 is the panchromatic band, G is the green band, SWIR1 is shortwave infrared 1, B is the blue band, and SI5 stands for salinity index 5.
Gridded mean annual precipitation, wind velocity, and near-surface air temperature with a 1 km resolution from 1990 to 2021 were generated by performing spatial interpolation on daily data obtained from China Meteorological Administration (CMA). This data covered the period from 1990 to 2021 and was downloaded from the cloud platform of the Chinese Academy of Sciences, accessible at http://www.resdc.cn (accessed on 16 February 2023). To assess soil types, 1 km resolution data were collected from the Cold and Arid Regions Science Data Center, available at http://westdc.westgis.ac.cn/ (accessed on 16 February 2023). Furthermore, median vegetation data were derived using Google Earth Engine (GEE) cloud-based tools. The downloaded dataset from GEE provides valuable information regarding vegetation patterns and dynamics during the growing season. The GeoDetector model inputs for desertification are presented in Figure 3.

2.3. Geographic Detector Model

The geographical detector model, or GeoDetector, measures stratified spatial heterogeneity (SSH), generating a spatial differentiation between intra-strata and inter-strata phenomena while elucidating the validity of their spatial partition and driving factors [46]. GeoDetector determines the SHH among data, then tests the coupling between two variables, X and Y, based on their respective SSH without assuming their linearity, and eventually explores the interaction between the two explanatory variables, Xi and Xj, in response to variable Y without any predefined form of interaction [66].
The concept based on stratified spatial heterogeneity has gained extensive application in various disciplines, including public health, environment, ecology, and forestry studies [67,68,69]. This versatile tool offers multiple applications and enables objective and accurate evaluations, as it is less susceptible to interference from human errors [70]. In recent years, researchers have increasingly focused on investigating the adverse impacts of anthropogenic and naturally induced processes on desertification, emphasizing the need for a comprehensive approach to fully comprehend the underlying drivers of desertification [6,71].
The proposed approach provides a numerical and quantitative means to distinguish between independent variables and elucidate the interactions between environmental factors. Moreover, it can conduct spatial heterogeneity analyses for variables that exhibit a negative distribution, mainly when the independent variables can be quantified. This approach can provide a comprehensive understanding of the relationships and dynamics between variables in a spatial context [72]. This involves converting variables into discrete intervals through a process known as discretization, which is accomplished using quantile and equal spacing classification methods. Discretization aims to minimize variance within each interval while maximizing variance between intervals [73]. The GeoDetector model comprises a risk, factor, ecological, and interaction detector [74]. Details about the conceptual basics of geographic detectors are illustrated in Table 1, while more information can be found in the R package, along with its manual and study case, at CRAN—Package GD (r-project.org).

2.3.1. Factor Detector

The interoperation of different factors’ impact on regional heterogeneity is based on spatial variance analysis on geographical strata following the model proposed by the authors of [75]. The association between spatial variance and a geographical detector model can be expressed using Equation (2).
q = 1 h = 1 L i = 1 N h y h 1 y ¯ h 2 i = 1 N y i x ¯ 2 = 1 h = 1 L N h σ h 2 N σ 2
q is the power determinant based on the spatial heterogeneity of the study object. L is the strata subdivisions of the study denoted by h = 1,…, L. σ2 and σ2h are the unit variances [76]. N and Nh are the study area units, with h being the strata. The q interval varies between 0 and 1, i.e., [0, 1], meaning that q = 0 if the determinant is utterly unrelated to the risk, whereas q = 1 when the determinant controls the risk.
Spatial discretization optimization aims to identify the optimum spatial scale for the spatial stratified heterogeneity analysis over different scales. This indicates that the obtained q of all explanatory variables with their respective spatial discretization parameters at various scales must be compared with that of corresponding spatial scales to investigate their relationships. Optimizing the spatial discretization and scale requires a delicate selection of discretization methods and break numbers for each continuous geographical variable. The q value specified with the factor detector determines the best parameter combination. During q value computation, a set of discretization methods and break numbers are provided for each variable [73,77]. Even though the combination is optional, spatial discretization covers almost all available options where break numbers can be integer sequences depending on observations and practical requirements. A parameter combination with the highest q is the best choice of a continuous variable for spatial discretization as it presents the variable influence in stratified spatial heterogeneity [78,79].

2.3.2. Risk Detector

The risk detector can be applied to test the significant difference among mean values of subregions classified following categorical or stratified variables [72,73]. The expression for the risk detector is given by Equation (3):
t Y ¯ η + X ¯ 1 = Y ¯ η Y ¯ k s η 2 N η + s k 2 N 1
and k are the mean values of observations within subregions and k. s η 2 and s k 2 represent sample variance, while N and Nk stand for observation number. The statistics for this factor follow Student’s distribution table; hence, the degree of freedom can be expressed using Equation (4).
d f = s η 2 N η + s k 2 N k 1 N η 1 s η 2 N η 2 + 1 N k 1 s k 2 N k 2
The Student-t distribution table can test the null hypothesis, H0, presented by Equation (5), at a 0.05 significant level.
H 0 : Y η ¯ = Y k ¯

2.3.3. Ecological Detector

An ecological detector is a robust tool employed to test the efficiency of explanatory variables by confirming whether or not one factor, X1 has a higher impact over another X2 [73], as expressed in Equation (6).
F = N u N v 1 j = 1 M u N u σ u , j 2 N v N u 1 j = 1 M v N v σ v , j 2
Nu and Nv stand for observation number. Mu and Mv are the subregion numbers, and j = 1 M u N u σ u , j 2 and j = 1 M v N v σ v , j 2 are variance sums within subregions of variables u and v. With a given significance level, the null hypothesis, H 0 = j = 1 M u N u σ u , j   2 = j = 1 M v N v σ v , j 2 , can be tested with the F-distribution table.
The systematic computation and visualization of the optimal geographical detector model can be executed in R using the GD software package. An extended presentation of the package can be found in R Documentation.

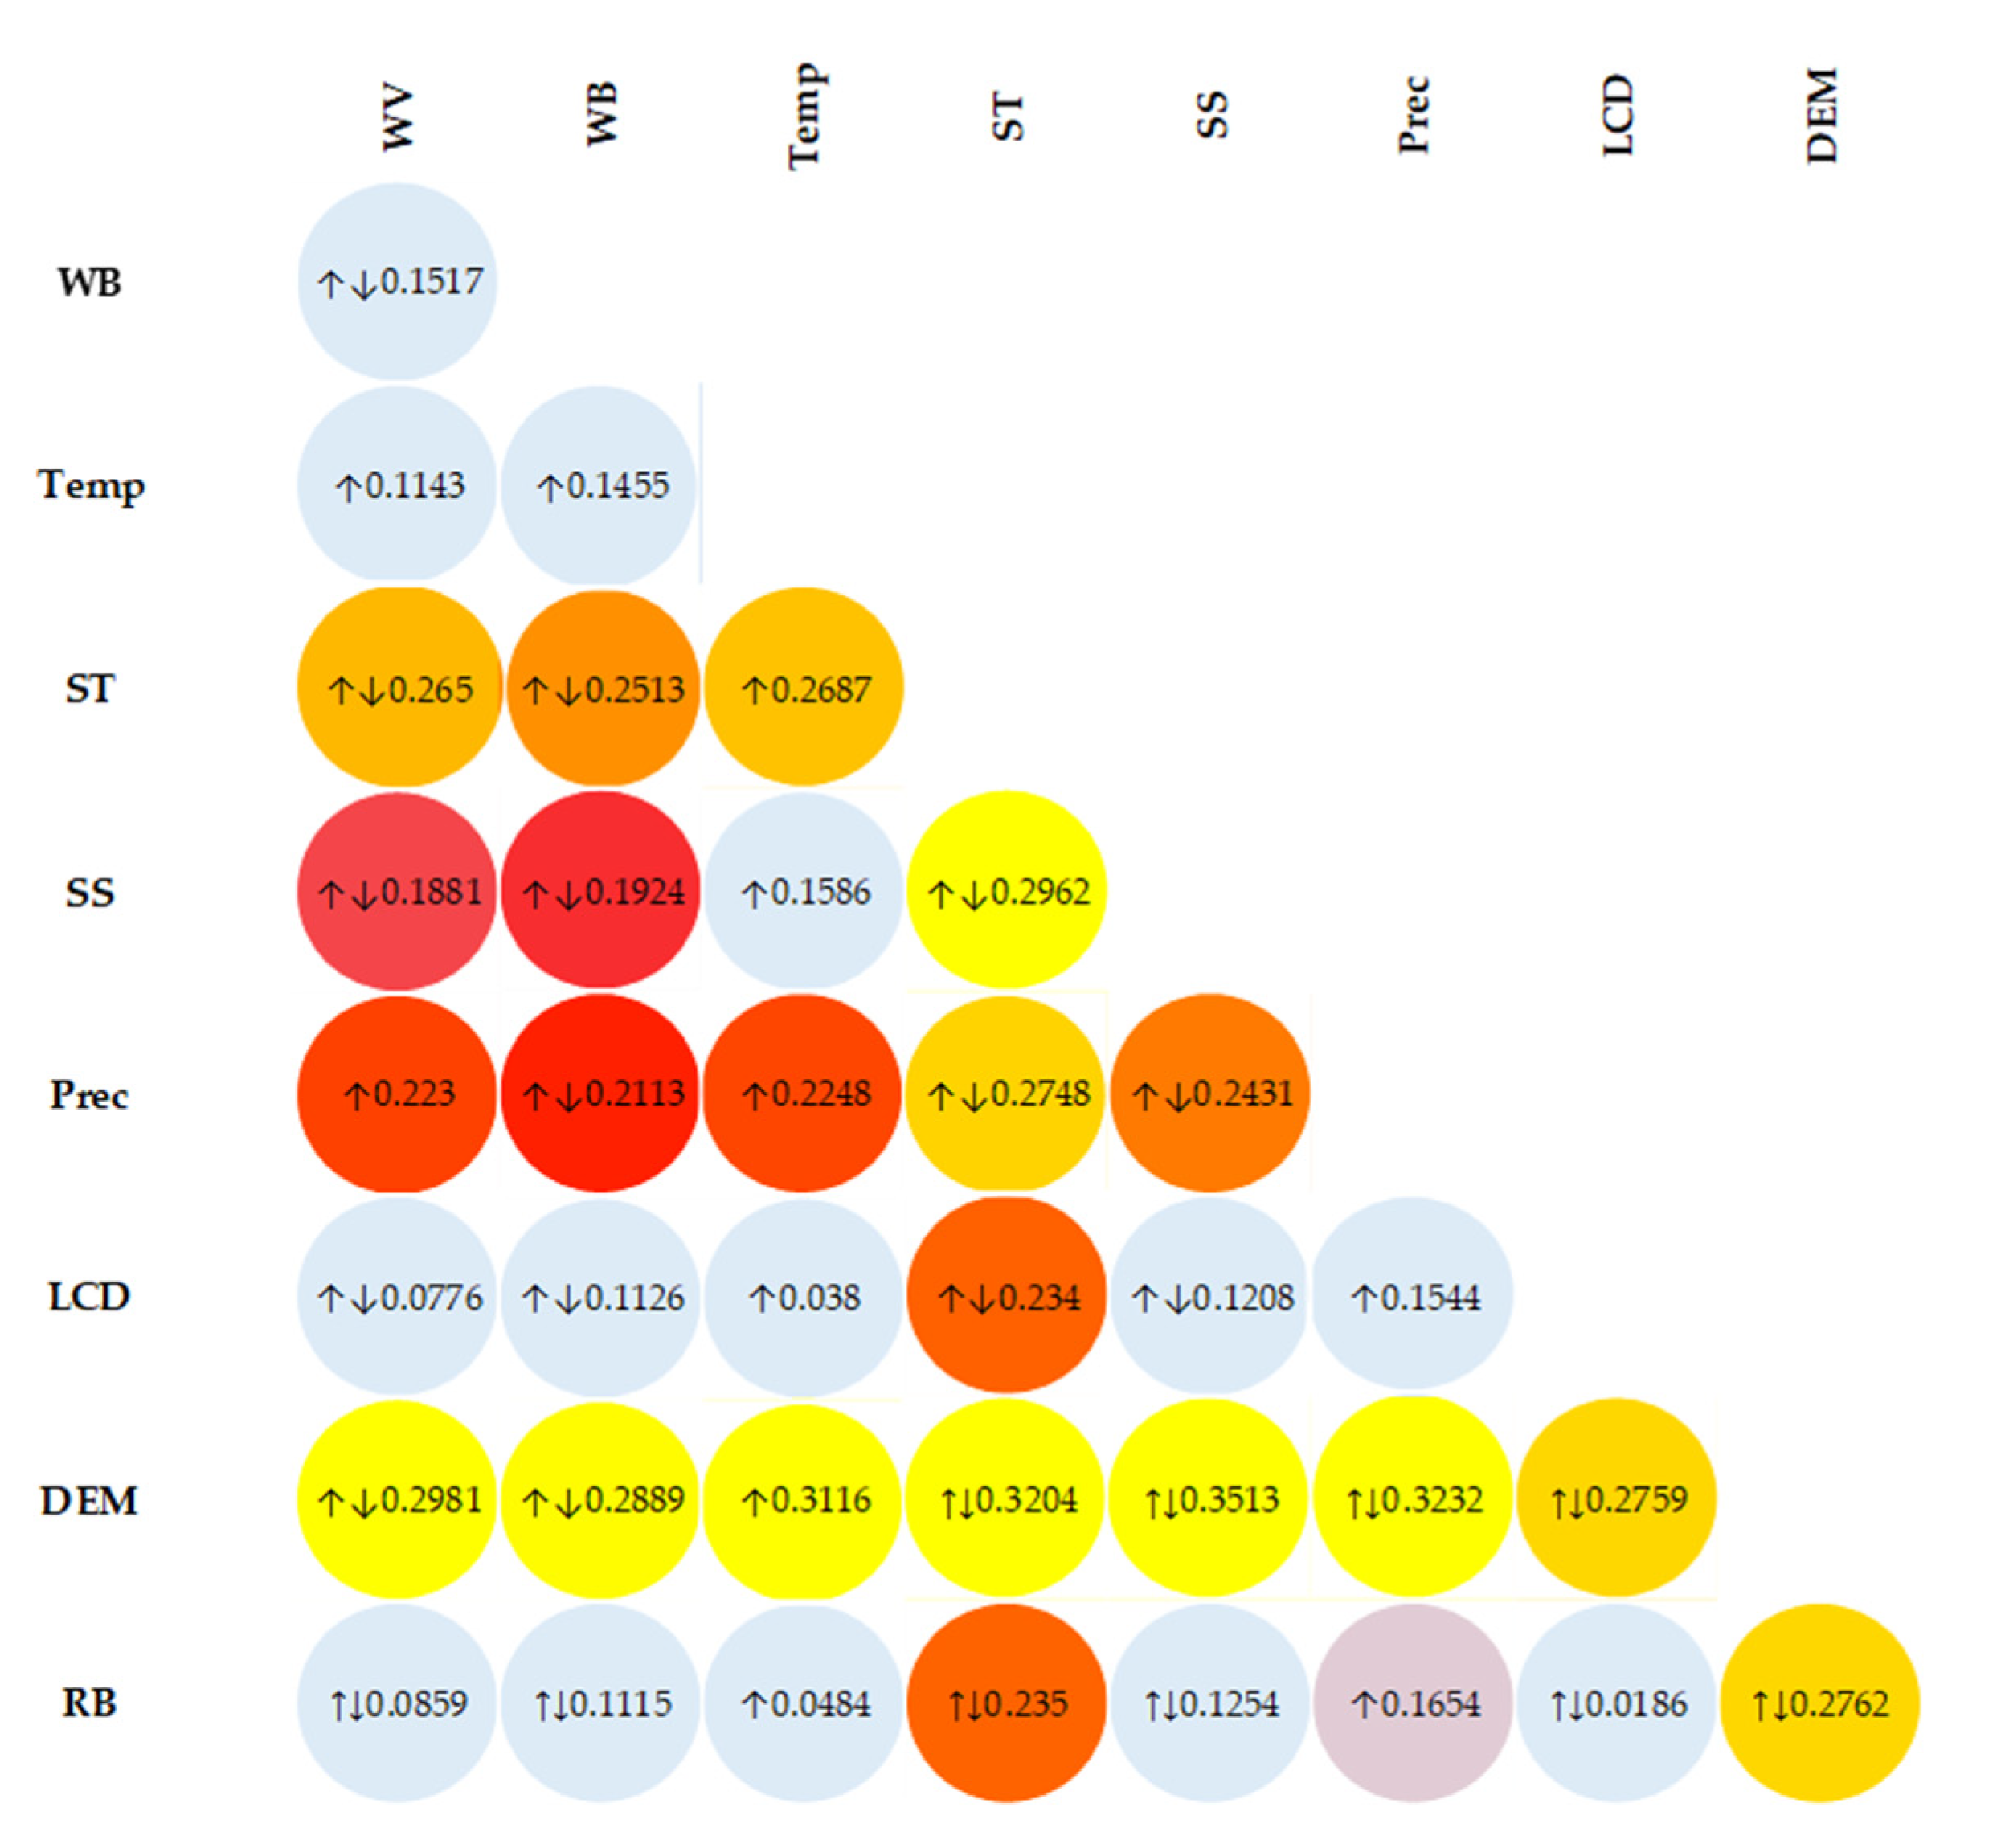
2.3.4. Interactive Factor

Multiple factors influence the spatial heterogeneity of variable Y. The interaction between any two factors can either be enhanced, weaken, or remain unchanged depending on the spatial heterogeneity of Y. These interactions play a crucial role in shaping the overall spatial patterns and dynamics of variable Y [46]. For instance, the power of the determinant of factors Xi and Xj toward Y was determined, then Xi and Xj were overlaid to form a new stratum. Figure 4 and Figure 5 demonstrate how the newly formed stratum determines the q value, representing the interaction strength between factors Xi and Xj. The assessment of the interactive influence between these two factors is provided in Table 2. For a detailed explanation of the GeoDetector software and its operational mode, please refer to the relevant documentation in [80].
Table 1. Summary of conceptual basis of geographic detectors. Adapted from [78].
Detector TypeConceptual Explanation
Factor detectorThis method uses the power determinant (q) to evaluate the impact of land cover, elevation, soil salinization, temperature, precipitation, wind velocity, water and road buffers on the spatial distribution of the mean annual aridity index for the past 20 years. Further, the F-test is performed to determine whether or not each subregion’s accumulated variance differs significantly from the variance of the whole region.
Risk detectorThis method compares the difference in the average aridity index between subregion strata. The t-test is conducted to identify whether or not the aridity index among different subregions is significantly different.
Ecological detectorThis method evaluates whether or not the impact of environmental and human factors on the aridity index is significantly different. The F-test is performed to compare the variance calculated in the subregion attributed to one triggering factor with the variance attributed to another.
Interaction detectorThis method evaluates the collective impact of two factors and determines their contributions. The process consists of seven components: enhance, enhance-bi, enhance-non-linear, weaken, weaken-uni, weaken-non-linear, and independent. Each component examines specific aspects of the interaction between the factors and provides insights into their combined and individual effects on desertification.

2.4. Satellite-Based Aridity Index

The satellite-based aridity index (SbAI) is a valuable tool for assessing aridity conditions across extensive regions using satellite data [82]. SbAI utilizes satellite-derived precipitation and land surface temperature estimates to calculate potential evapotranspiration (PET). It then compares the ratio of precipitation to PET to determine whether or not an area is experiencing arid conditions. By employing SbAI, researchers can gain insights into the aridity levels of various regions based on the satellite-based evaluation of key climatic parameters [83]. The calculation of SaBiA relies on the relationship between precipitation and PET over a specific period. PET represents the amount of water that can evaporate and transpire from the surface, considering the prevailing temperature and humidity conditions [84]. Recent studies have shown that SbAI effectively monitors drought conditions and assesses water availability in regions where ground-based meteorological data may be limited or unreliable [85].
Additionally, SbAI finds numerous applications in monitoring agricultural drought, evaluating the impact of climate change on water resources, and identifying areas at risk of desertification [86]. Its use has proved valuable for monitoring and managing water resources in a changing climate. Moreover, this method can be integrated into water management and decision support systems for disaster risk reduction [39]. In this study, Google Earth Engine (GEE) cloud services were employed to compute the normalized difference vegetation index (NDVI) and the average of daytime and nighttime land surface temperature (LST). The aridity index was then calculated by multiplying the average LST (in Celsius) by the average NDVI and dividing the result by 10. By leveraging GEE’s capabilities, the present work aims to efficiently derive the necessary variables and calculate the aridity index, facilitating a comprehensive assessment of aridity conditions. The MODIS-based calculation of the aridity index is well explained in [87], and information on the United Nations Environmental Program (UNEP) aridity index classification system is presented in Table 3 [87,88].
In addition, this study applied the time series Mann–Kendall Tau and Theil–Sen’s Slope to evaluate the time series aridity index trend analysis. The Mann–Kendall Tau test is a non-parametric statistical test used to detect trends in time series data [89]. It measures the strength and direction of monotonic trends, which consistently increase or decrease over time without reversals [90]. The test is based on comparing the ranks of the data points and calculating Kendall’s Tau statistic [91]. Theil-Sen’s slope is another non-parametric method for trend analysis in time series data. It provides a robust estimate of the trend slope by calculating the slopes’ median between all data points [92]. The main advantage of Theil-Sen’s slope is its robustness to outliers [93]. Unlike ordinary least squares regression, which is sensitive to extreme values, Theil-Sen’s method calculates the median of slopes and is less influenced by outliers [94]. This study applied both to provide valuable insights into the presence and direction of trends in time series data.

3. Results

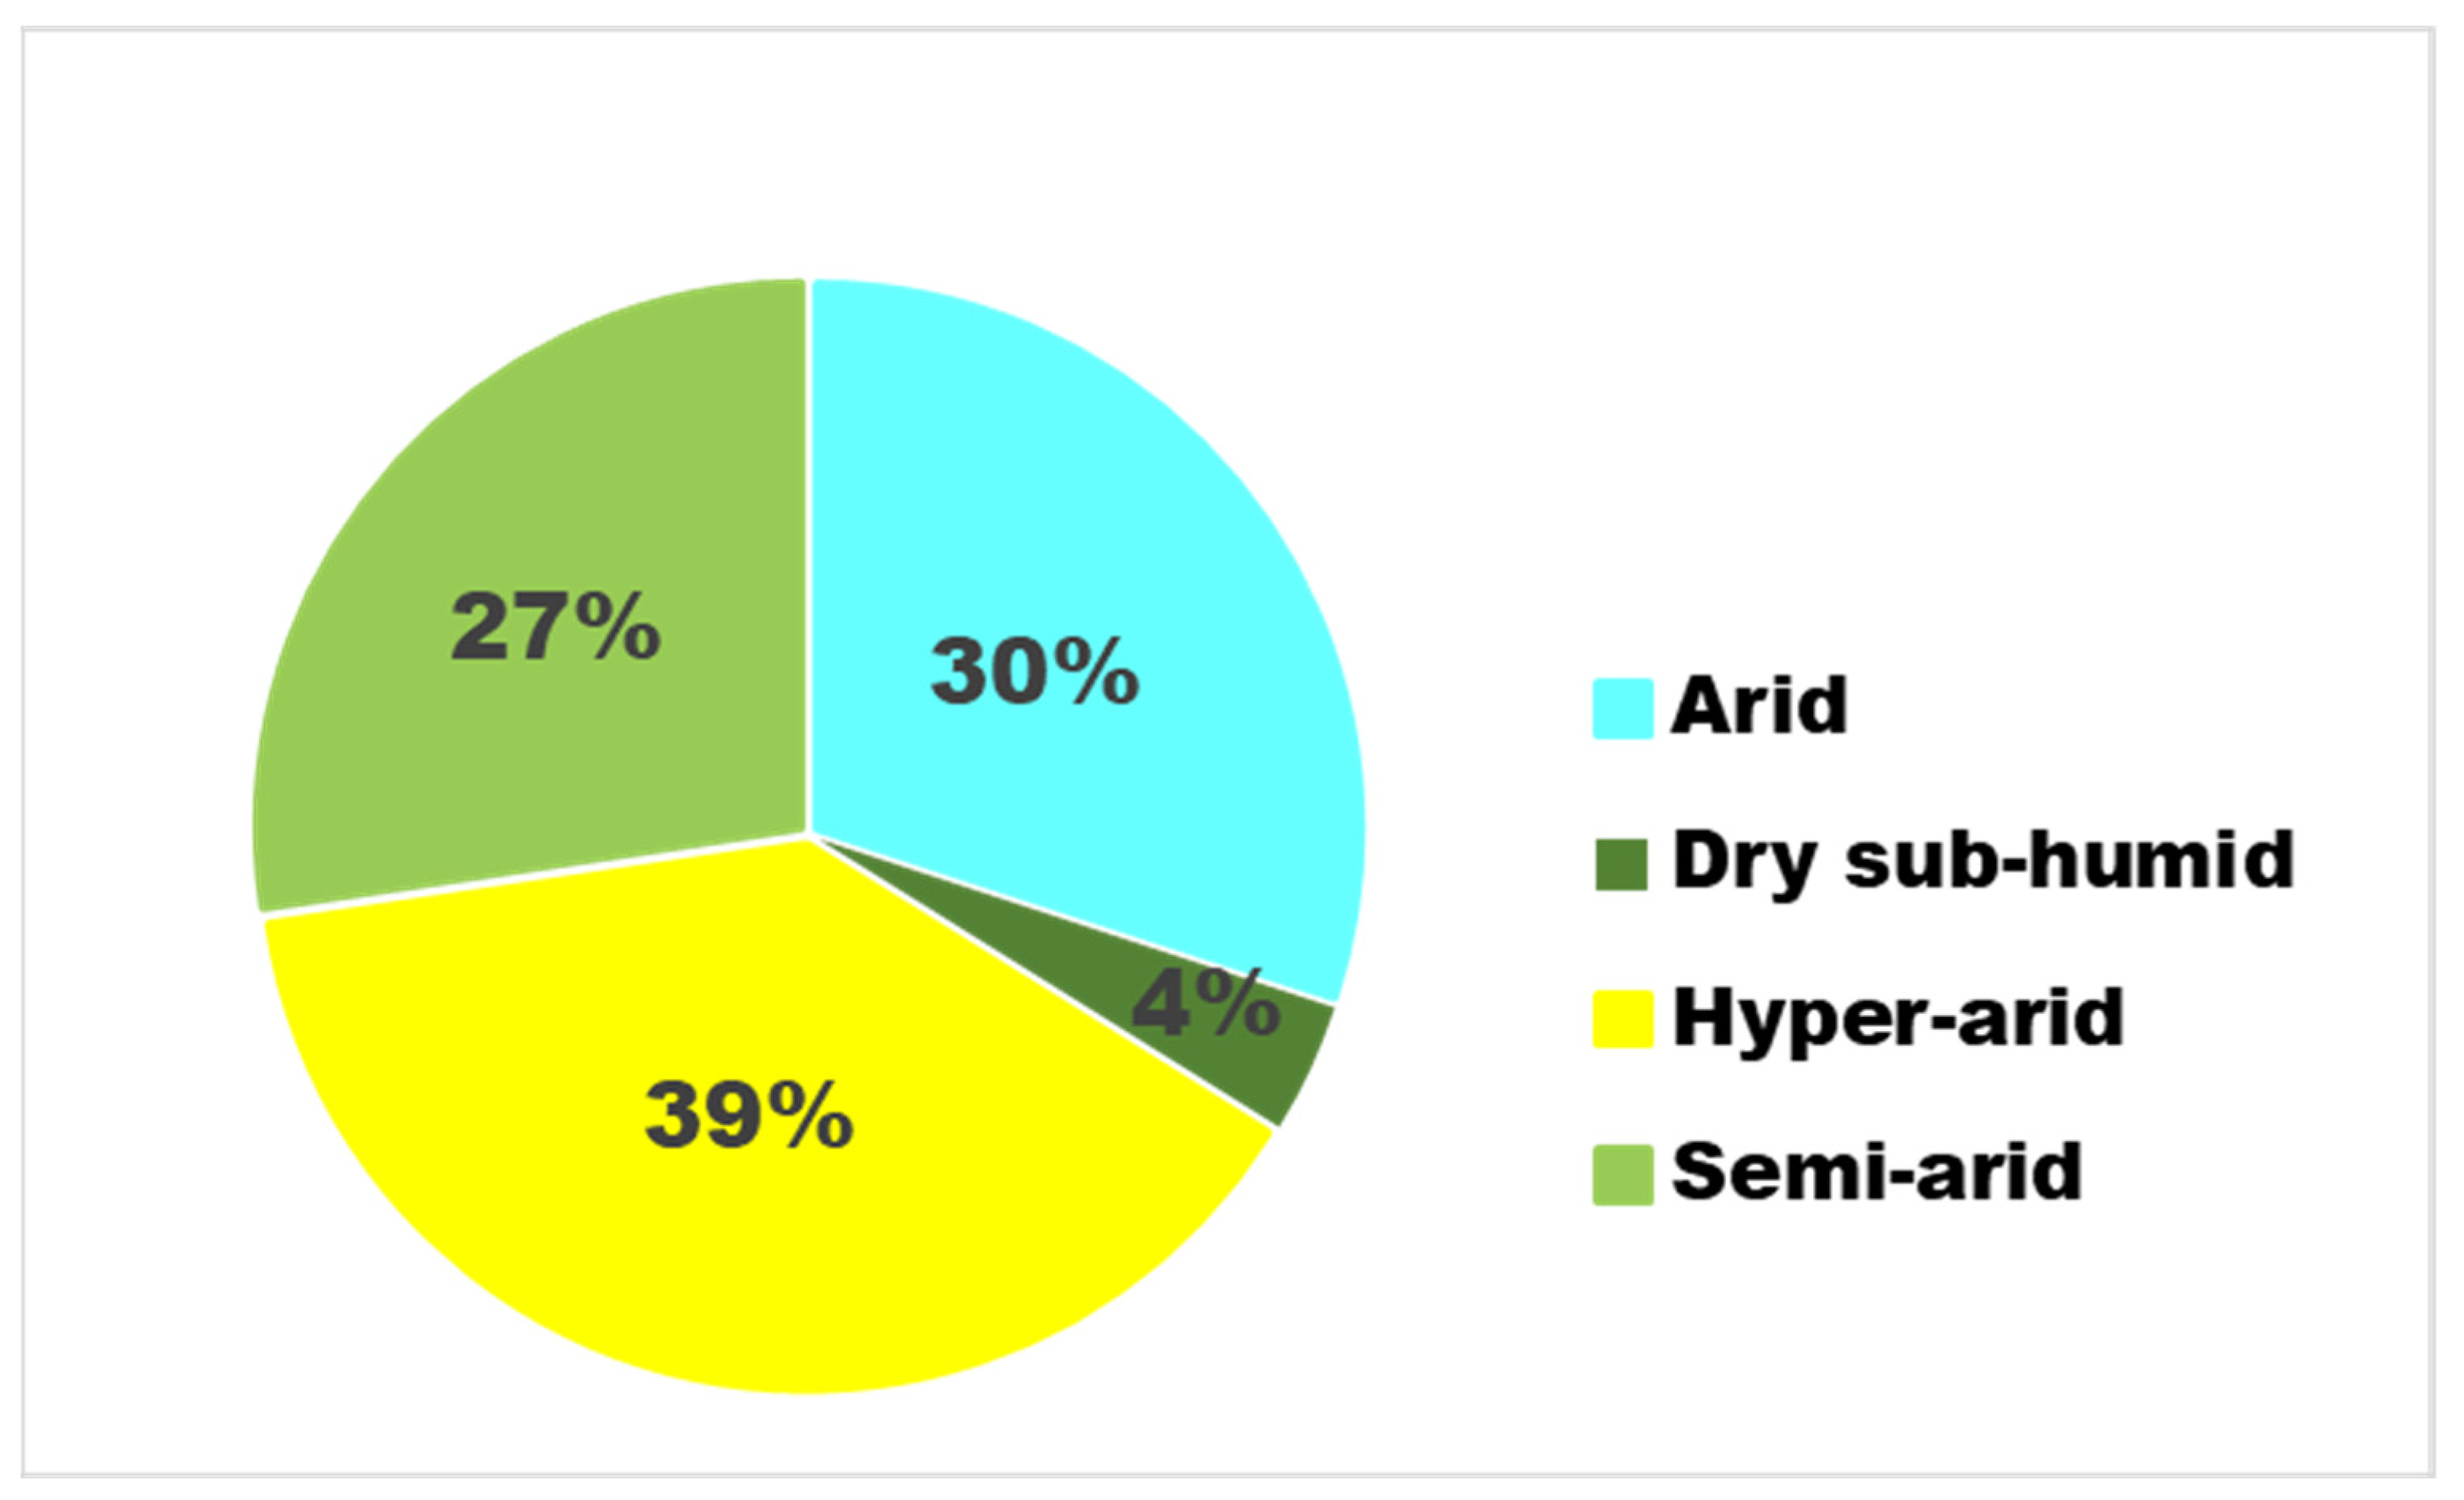
3.1. Spatial Distribution of the Aridity Index in the Shiyang River Basin

Figure 6 and Figure 7 show the spatial distribution and area percentage of aridity over the Shiyang River Basin. The results reveal the spatial heterogeneity of the aridity index, which indicates that climate patterns and conditions vary significantly across different regions. For example, hyper-arid and arid zones occupy most of the study area with a percentage of 39 and 30%. On the other hand, the semi-arid area covers farmland and a significant part of the Qilian Mountains, with a percentage of 29% of the total river basin. This region also comprises a small fraction (4%) of the sub-humid climate predominantly covered by alpine forests, sub-alpine shrubs, and meadow vegetation.

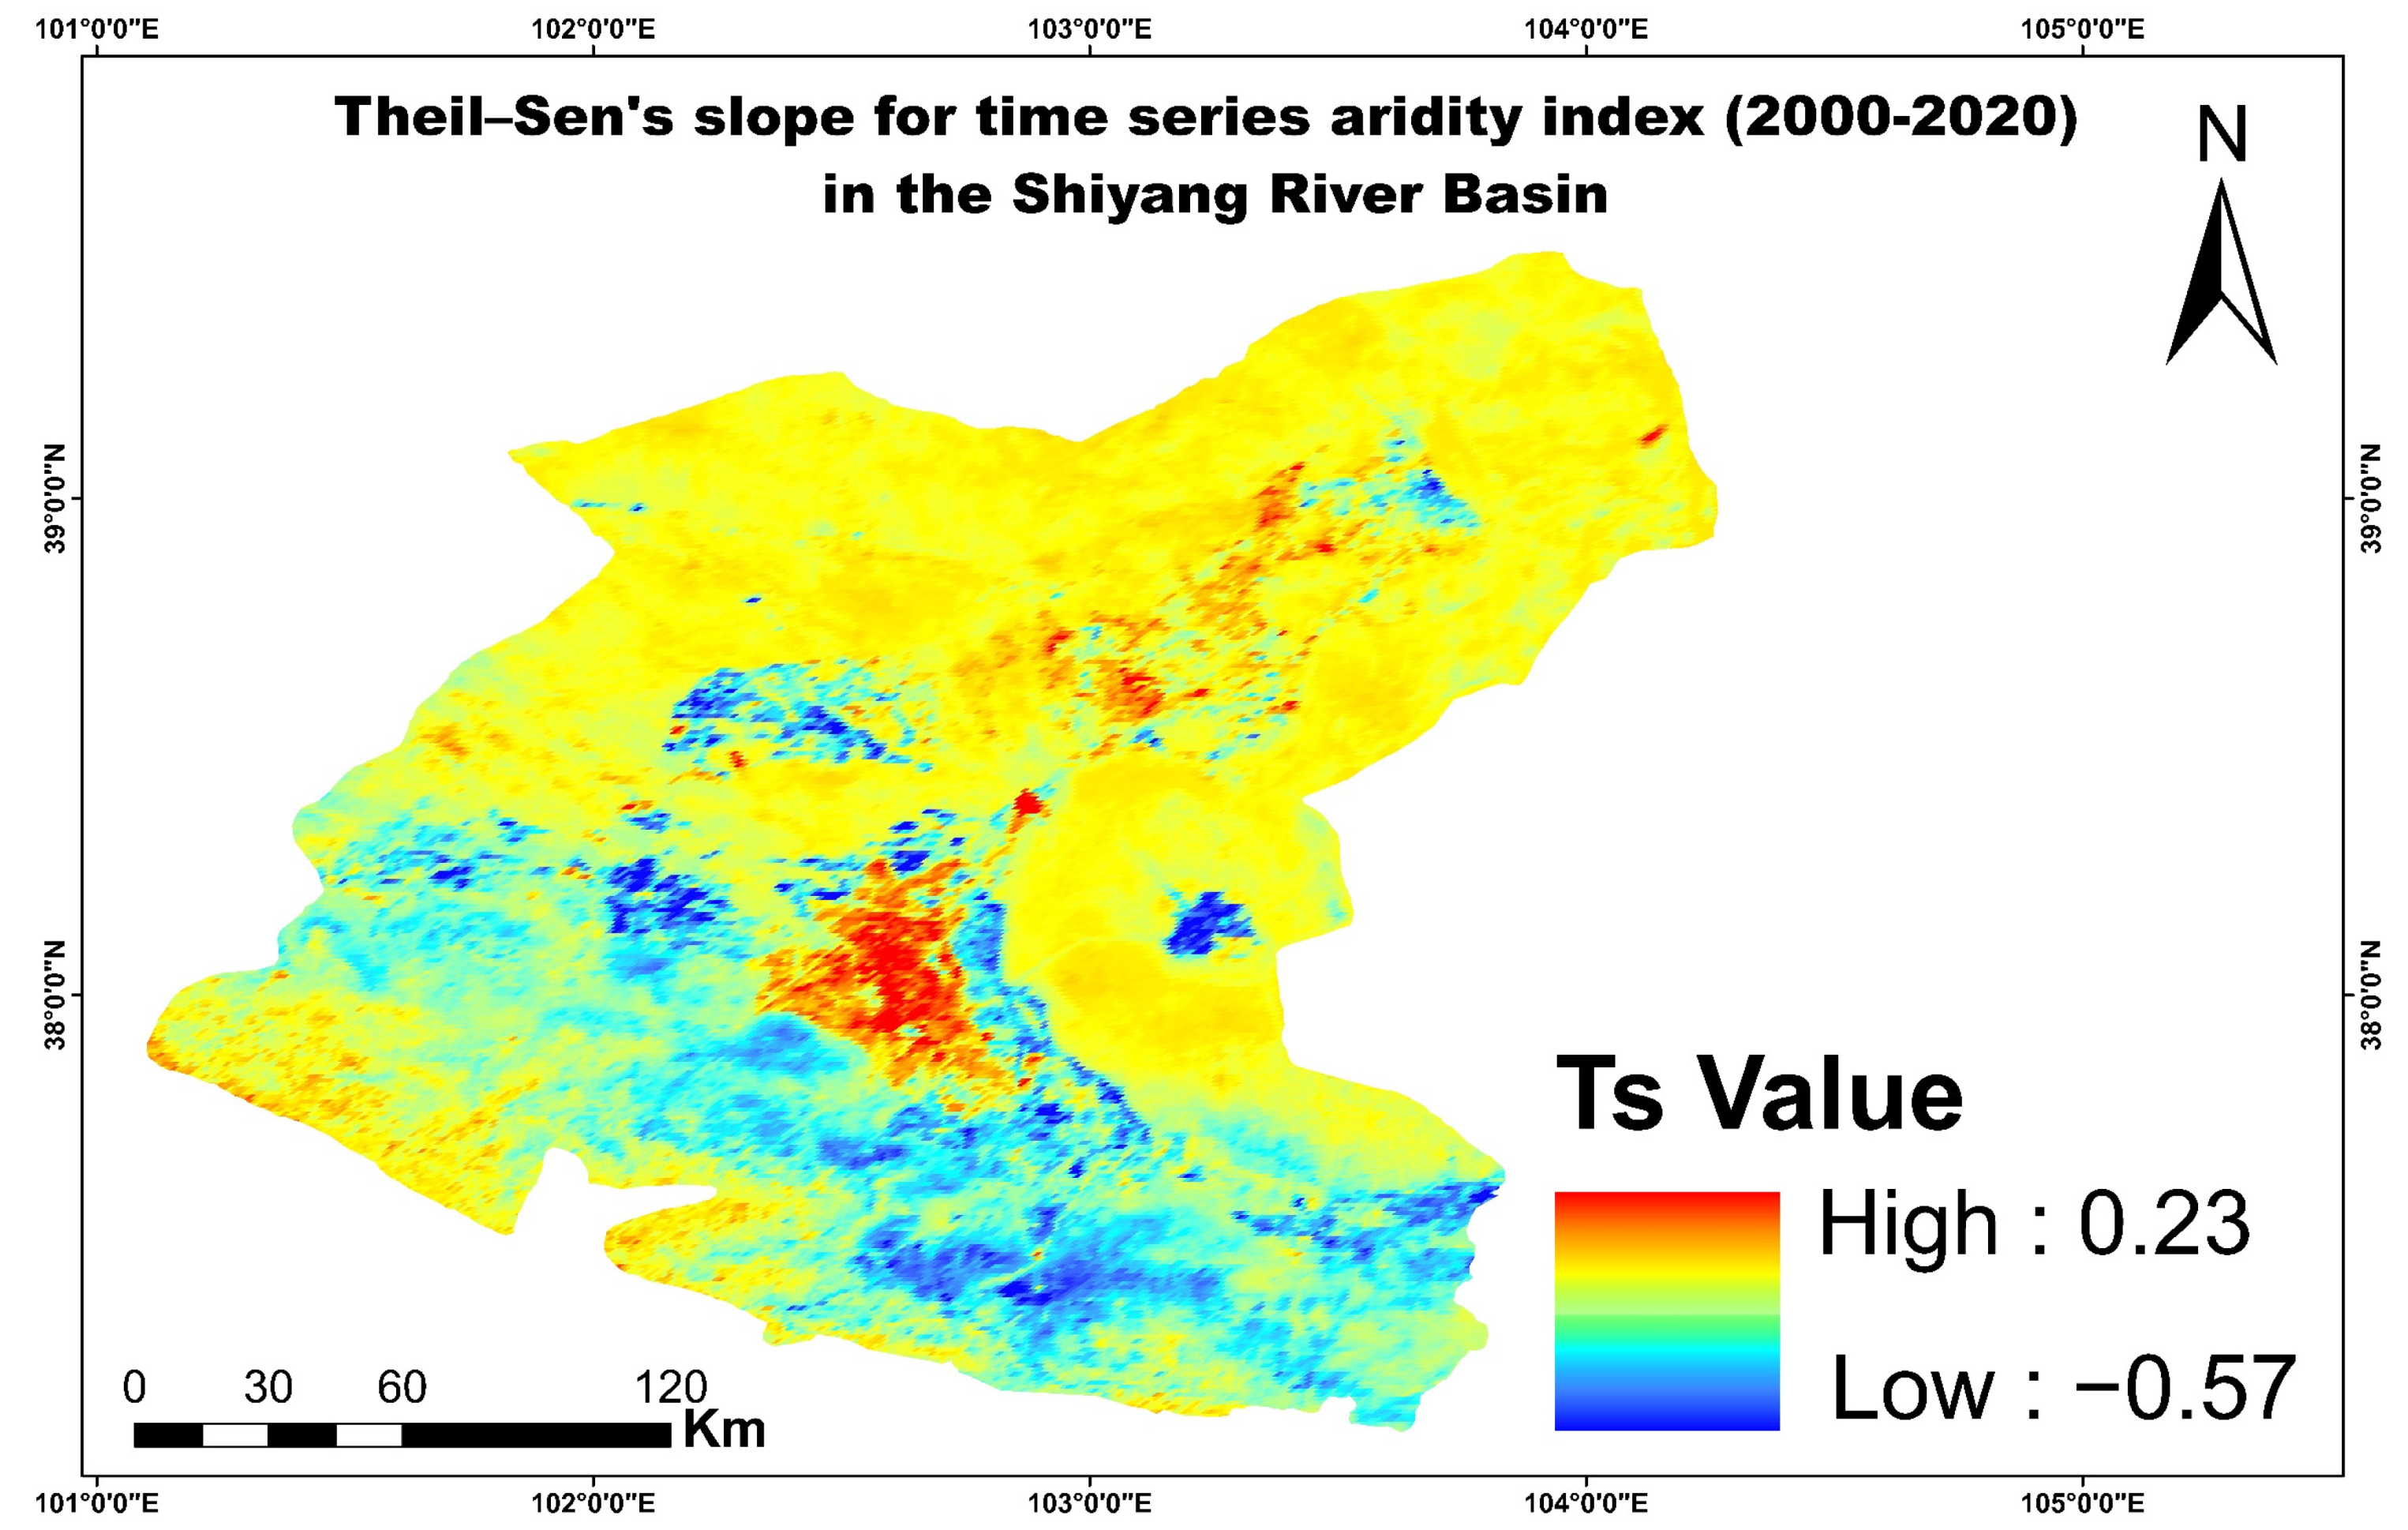
3.2. Change Trend Analysis of Aridity Level in the Shiyang River Basin

This study determined Theil–Sen’s slope and involved conducting Mann–Kendall trend analyses to assess the trend of time series aridity intensity between 2000 and 2020. The results in Figure 8 and Figure 9 show a clear trend of decreasing aridity in the eastern parts of the Qilian Mountains, the southwest, the southeast of Minqin oasis, and the vicinities of the Qintu Lake located in Minqin County. Based on field knowledge, there are ongoing ecological rehabilitation initiatives in these regions. On the other hand, the results also show a significant increase in the aridity index in Minqin County and the central parts of the middle reach, particularly in Wuwei. These findings suggest that some areas experienced a significant increase and others a decrease in aridity over the study period, which could have important implications for the local ecosystem and water resources.

3.3. Quantitative Analysis of Factors Governing the Ecological Status and Dynamics in the Shiyang River Basin

The analysis of power determinant (q) values for the driving factors, as depicted in Figure 10, revealed their respective contributions to the desertification process. The range of q-values varied between 0.004 and 0.270, indicating the significance of each factor in influencing desertification dynamics. Among the studied driving factors, elevation and soil types demonstrated the highest contributing factors, with q values of 0.270 and 0.227, respectively. These factors play a crucial role in shaping the spatial distribution and severity of desertification. Precipitation, soil salinity, buffers to the waterway, and wind velocity exhibited a moderate influence, with q values of 0.146, 0.117, 0.107, and 0.071, respectively. These factors contribute to the overall understanding of desertification patterns but to a lesser extent compared to elevation and soil types. Near-surface air temperature, road buffer, and land cover dynamics exhibited lower impact on desertification, as indicated by their lower q values of 0.028, 0.013, and 0.004, respectively.
While these factors still contribute to assessing desertification, their influence is relatively weaker compared to that of other driving factors. Furthermore, investigating the interactive effects of the driving factors revealed a mutual or non-linear enhancement of their impacts. Among these interactions, the combination of elevation and soil salinity exhibited the highest q value interaction of 0.3513, indicating a more substantial combined influence on desertification. These findings highlight the varying degrees of influence and interaction among the driving factors, emphasizing the complexity of desertification processes and the need to consider multiple factors in comprehensive assessments and management strategies.
Notably, there was a mutual enhancement between elevation and soil salinity, precipitation, soil types, and wind velocity with values of 0.3513, 0.3232, 0.3204, and 0.2981. Moreover, soil salinity displayed mutual enhancement effects with soil types, water buffers, wind velocity, and near-surface air temperature, yielding q values of 0.2962, 0.1924, 0.1881, and 0.1586, respectively. This implies that the interaction between soil salinity and these factors leads to a collective influence that exacerbates the effects of soil salinity on desertification.

3.4. Environmental Risk Detection of Desertification in the Shiyang River Basin

The observed linear correlation between waterway availability and a decrease in the aridity index in arid regions can be attributed to its positive influence in terms of enhancing soil moisture content, improving microclimatic conditions, and facilitating atmospheric circulation. Notably, there is a clear association between the spatial heterogeneity of the aridity index and the elevation gradient. Similarly, precipitation and soil salinity exhibit a similar pattern. As demonstrated in Figure 11, higher elevations experience more significant precipitation in the form of snow or rain due to orographic effects. Conversely, precipitation declines as elevation decreases, making drier conditions less favorable for vegetation growth. The gray-brown and chestnut calcareous soils in the grassland zones of the Qilian Mountains exhibit the highest susceptibility to changes in aridity, followed by chernozem, felty soil, and permafrost, which are predominantly found in meadow vegetation areas of the Qilian Mountains. Further, the temperature gradient is a significant factor influencing the distribution of aridity in the upper reaches. There is a noticeable variance in aridity patterns in permafrost and irrigated sandy soil regions. This indicates that glacier thaw had an impact on soil conditions in the upper reaches, leading to vegetation regeneration, which played a crucial role in ensuring water resource availability and ecosystem restoration in the lower reaches. On the other hand, wind velocity and road buffers do not exhibit consistent or regular patterns in relation to aridity.

3.5. Interaction between Ecosystem’s Driving Factors in the Shiyang River Basin

Figure 12 depicts an evaluation of the interaction among factors contributing to desertification in the Shiyang River Basin. Previous studies have indicated that this interaction is not a straightforward linear summation; instead, it assesses whether or not two influencing factors are independent or if they either reinforce or weaken each other. Most driving factors exhibited mutual enhancement, whereby the interactive q values surpassed those of individual factors. For instance, elevation and soil salinity, precipitation, soil types, temperature, and wind velocity displayed a mutual enhancement effect. Consequently, their respective values increased to 0.351, 0.323, 0.320, 0.311, and 0.298. Furthermore, non-linear enhancements were observed between elevation and near-surface air temperature, elevation and land cover types, soil types and near-surface air temperature, land cover and soil types, precipitation and near-surface air temperature, and precipitation and wind velocity, as well as between land cover and precipitation. Their respective values were determined to be 0.3116, 0.2759, 0.2687, 0.234, 0.2248, 0.223, and 0.1544. Certain factors mutually enhanced each other while others exhibited non-linear enhancements among the studied factors, indicating that the status and dynamics of ecological functioning in the Shiyang River Basin cannot be solely defined or justified by a single driving factor.

4. Discussion

Many studies have extensively examined the influence of natural and human-induced factors on desertification in dryland regions [31,45,95]. Previous research has applied GIS techniques to analyze the status and spatiotemporal dynamics of desertification in the Shiyang River Basin. These studies identified climatic changes, soil salinization, and the excessive exploitation of groundwater resources as the primary drivers [22,23,65,96]. Nevertheless, conducting a quantitative analysis of desertification and comprehending the relative contributions of each factor, both independently and collectively, remains an unresolved challenge. As depicted in Figure 2, this research aims to address this gap by examining and providing a scientific foundation for understanding the magnitude of each environmental or anthropogenic factor. Additionally, it investigates the interactions between these factors, focusing on their potential to either mitigate or exacerbate desertification in the region of interest.
Figure 10 provides a graphic illustration of the magnitude of each factor, with their respective q values ranked in descending order; elevation emerges as the most influential factor, followed by soil types, soil salinity, wind velocity, temperature, precipitation, waterway buffers, road buffers, and land cover dynamics. Based on Figure 11, the current work underscores the critical role played by the elevation gradient in shaping the distribution of vegetation across the Shiyang River Basin. This phenomenon is intricately linked to the region’s watershed, which can be divided into three distinct climate zones. The lower reach of the basin experiences a hyper-arid climate, the middle reach is characterized as semi-arid, and the alpine zones of the southern Qilian Mountains exhibit a semi-humid climate at higher altitudes. These findings further support existing studies that emphasize the profound influence of climate patterns and topographic features on the spatial heterogeneity of ecosystem conditions throughout the basin [97,98,99,100,101,102,103,104,105,106,107,108,109,110,111].
Moreover, the research uncovered noteworthy insights into the different subregions within the Shiyang River Basin. Upstream areas, benefiting from ample precipitation and glacier thaw, were found to have sufficient water supply, creating favorable conditions for the growth of forests and grasslands [112]. However, it was observed that while high-altitude sub-humid regions initially benefit from temperature variations, prolonged and persistent temperature increases threaten vegetation health. These findings align with the negative trends in the aridity index affecting natural vegetation in the upper reaches of the Shiyang River Basin, as illustrated in Figure 8. Similar patterns have been observed in previous studies that explore ecosystem vulnerability to climate change in the Tibet plateau [113,114,115]. Furthermore, the research highlights the impact of temperature and evaporation gradients, coupled with a decrease in rainfall, on the gradual decline in vegetation cover from upstream to the lower reaches. This process leads to barren land expansion in the basin’s lower reaches [19,116]. These findings are consistent with previous research and are supported by the results depicted in Figure 6, Figure 7, and Figure 11, providing further validation to our study.
Over the past few decades, human activities, specifically watershed management and ecological restoration projects such as sand fixation initiatives, have exerted a substantial influence on the hydrological regime and spatial distribution of vegetation in the middle and lower reaches of the region, despite the challenges posed by climate variability [111,117]. Consequently, in contrast to the upper areas of the Qilian Mountains, the greening patterns of vegetation in these regions are more dependent on human interventions rather than natural phenomena, as supported by recent research [111,118]. Significantly, this study revealed a notable trend of the aridity index reversing in areas where cropland and shrubland have undergone successful rehabilitation, as demonstrated in Figure 8. This finding underscores the effectiveness of ecosystem restoration efforts at mitigating aridity and promoting improved ecological conditions.
Nevertheless, it is crucial to note that the recovery rate of degraded soils in drylands tends to be slow, often hampered by natural factors such as soil salinization, which exacerbates desertification in arid and semi-arid zones [119,120,121,122,123]. As depicted in Figure 10 and Figure 11, soil salinization emerges as one of the primary factors influencing the ecological status in the study area, with its detrimental effects on vegetation health being directly proportional to salt accumulation in the soil. These findings are in agreement with those of with previous research, which has consistently highlighted the detrimental impact of soil salinization on environmental conditions in the Shiyang River Basin, particularly in the Minqin oasis [124,125].
The optimization of water resources in densely populated areas is challenging for scientists, communities, and policymakers, especially in arid and semi-arid regions [126]. In the Shiyang River Basin context, many studies have expressed concerns regarding the inter-relationship between population pressure and water resource scarcity, given that this region serves as the epicenter of desert expansion [57,96,127,128]. However, by analyzing road networks and waterway buffers as a proxy for population and water use in the Shiyang River Basin, the closer the distance to the waterway, the lower the land degradation risk, as shown in Figure 11.
When examining the relationship between road buffers and ecosystem disturbance in the area of interest, as shown in Figure 10 and Figure 11, no clear patterns emerge. This implies that population density and urban systems have not significantly disrupted the surrounding ecosystem in the study area. However, based on Figure 8 and Figure 9, a closer analysis of the time series aridity trend reveals a significant deterioration in the central part of the middle reach due to extensive urbanization. Additionally, the observed increase in the aridity index in Minqin County can be attributed to factors such as soil salinization, urbanization, and aeolian desertification. The current work corroborates several studies conducted in the Shiyang River Basin, particularly in Minqin County. The implication of such findings for waterways and road buffers emphasizes the role of an established ecological restoration policy. This is the irrefutable hypothesis stipulating that ecological deterioration in the region is no longer related to natural resource overexploitation. Figure 10 provides further insight, showing that despite the significant role played by existing land restoration and watershed management efforts in the Shiyang River Basin, desertification remains persistent, indicating ongoing challenges. These results support previous studies that have underscored the gradual stability and recovery of the ecosystem in the Shiyang River Basin over the past few decades, despite the adversities posed by climate change, aeolian erosion, anthropogenic activities, and soil salinization [111,129].
The linear and mutual enhancement among explanatory variables demonstrates the uniformity of pattern change relative to ecological status, while a non-linear enhancement status indicates uncertainties in providing a longstanding view that may rate a specific relationship between variables [46]. However, previous studies have shown that this relationship does not necessarily imply a linear summation or strict interdependence [130,131,132]. This study revealed that some factors enhanced each other and others had a non-linear enhancement among the studied driving factors, implying that a single factor cannot define the status and dynamics of ecological functioning in the Shiyang River Basin. Figure 11 and Figure 12 illustrate the interaction results between driving factors. Notably, linear and mutual enhancements were found between elevation and soil salinity, elevation and precipitation, and elevation and soil types. Additionally, a mutual enhancement between soil salinity and soil types was observed. In contrast, non-linear enhancements were identified between elevation and near-surface air temperature, elevation and land cover, soil types and near-surface air temperature, land cover and soil types, precipitation and near-surface air temperature, precipitation and wind velocity, and land cover and precipitation. This further proves that environmental factors are the primary drivers for ecosystem disturbance in the Shiyang River Basin.
These findings shed light on the status and dynamics of land degradation and recovery in the Shiyang River Basin, emphasizing the fundamental role of effective land management, rational water allocation, and conservation measures in reversing land degradation and maintaining a sustainable ecosystem against climate change impacts and water resource scarcity. By integrating human and environmental factors, this research provides compelling scientific evidence of the effectiveness of established policies at combating desertification and achieving Sustainable Development Goal 15.3. However, it is essential to acknowledge certain limitations. Firstly, including population data is crucial for understanding land use practices and gaining insights into the demographic and socioeconomic factors influencing the region [12]. Secondly, the management practices related to livestock have a significant impact on the current ecosystem status, and therefore, incorporating relevant data on livestock is essential for a comprehensive and realistic analysis [133]. Thirdly, carbon footprint data help address climate change and may help our study provide robust solutions for better sustainable practices, energy efficiency, renewable energy sources, and promoting a low-carbon lifestyle [134]. Future studies should consider incorporating these additional data sources to further improve the model’s performance and enhance the representativeness of our analysis. This would enable a more comprehensive understanding of the complex dynamics at play and support the development of more effective and sustainable strategies for the region of interest.

5. Conclusions and Prospects

In this study, the assessment of desertification intensity, spatial heterogeneity, and trends across the Shiyang River Basin was conducted using the MODIS-based aridity index. The GeoDetector tool was employed to quantitatively analyze the contribution of each driving force of desertification. The research integrated the mean annual aridity index over the past 20 years as the dependent variable while considering multiple environmental and human factors as independent variables. By employing this comprehensive approach, a thorough understanding of the interplay between various factors and their impact on desertification dynamics in the Shiyang River Basin was achieved.
The findings showed a significant reversal in desertification intensity and substantial rehabilitation across a significant portion of the middle and lower reach areas in the Shiyang River Basin. The key factors contributing to desertification status and spatial heterogeneity were elevation, soil types, soil salinity, and precipitation. These factors played a crucial role in shaping the patterns of desertification within the region. Furthermore, this research revealed that some environmental factors boosted each other. In contrast, other factors displayed non-linear enhancements when interacting with other driving factors. This indicates that a single parameter alone cannot fully define or capture the complex status and dynamics of ecological functioning in the region of interest. The multifaceted interplay between various driving factors must be considered to comprehensively understand desertification processes and their implications in the Shiyang River Basin. The results highlight the fundamental role of the established ecosystem rehabilitation policies toward successful desertification control and reaching land degradation neutrality as planned. Further, this work promotes the implementation of an advanced eco-environmental protection system to address long-term natural factors that obstruct ongoing ecosystem restoration efforts, such as soil salinization and aeolian erosion, with particular emphasis on oasis areas. This study can serve as a timeless foundation for assessing the environmental footprint of desertification status and informing future policies on ecological restoration across the region.
While the established geographical detector tool is a robust and reliable approach to the quantitative evaluation of drivers and mechanisms of desertification, its performance could be further enhanced with the inclusion of additional data. By expanding the scope of data inputs, a more comprehensive understanding of the driving forces behind desertification can be achieved, leading to more effective and targeted strategies for desertification control and mitigation. It is worth noting that variables such as population density, livestock, and carbon footprint could provide valuable insights into the complex dynamics of desertification processes. Therefore, it is recommended that future studies consider incorporating these data to strengthen the model and improve its accuracy and comprehensiveness.

Author Contributions

Conceptualization: T.W.; statistical analysis: M.N.; writing—original manuscript: M.N. and G.S.; revision of manuscript: G.S. and J.L.; funding acquisition: T.W. All authors have read and agreed to the published version of the manuscript.

Funding

This research was funded by The Ministry of Science and Technology of the People’s Republic of China through The Second Tibetan Plateau Scientific Expedition and Research Program (STEP), grant number 2019QZKK0305, and Science and Technology Department of Ningxia, grant number 2020BBF02003.

Data Availability Statement

Data will be made available upon request.

Conflicts of Interest

The authors declare that they have no known competing financial interests or personal relationships that could have appeared to influence the work reported in this paper.

References

  1. Kassas, M. Desertification: A general review. J. Arid. Environ. 1995, 30, 115–128. [Google Scholar] [CrossRef]
  2. Chen, Y.; Tang, H. Desertification in North China: Background, Anthropogenic impact and Failures in combating it. Land Degrad. Develop. 2005, 16, 367–376. [Google Scholar] [CrossRef]
  3. Feng, Q.; Ma, H.; Jiang, X. What Has Caused Desertification in China? Sci. Rep. 2015, 5, 1–8. [Google Scholar] [CrossRef] [Green Version]
  4. Pacheco, F.A.L.; Fernandes, L.F.S.; Junior, R.F.V.; Valera, C.A.; Pissarra, T.C.T. Land degradation: Multiple environmental consequences and routes to neutrality. Curr. Opin. Environ. Sci. Health 2018, 5, 79–86. [Google Scholar] [CrossRef]
  5. Barbut, M.; Alexander, S. Land Degradation as a Security Threat Amplifier: The New Global Frontline. In Land Restoration: Reclaiming Landscapes for a Sustainable Future; Academic Press: Cambridge, MA, USA, 2016; pp. 3–12. [Google Scholar]
  6. Geist, H.J.; Lambin, E.F. Dynamic Causal Patterns of Desertification. BioScience 2004, 54, 817–829. [Google Scholar] [CrossRef] [Green Version]
  7. Wang, F.; Pan, X.; Wang, D.; Shen, C.; Lu, Q. Combating desertification in China: Past, present and future. Land Use Policy 2010, 31, 313–331. [Google Scholar] [CrossRef]
  8. Yue, Y.; Geng, L.; Li, M. The impact of climate change on aeolian desertification: A case of the agro-pastoral ecotone in northern China. Sci. Total Environ. 2013, 859, 160126. [Google Scholar] [CrossRef]
  9. Huang, J.; Zhang, G.; Zhang, Y.; Guan, X.; Yun, W. Global desertification vulnerability to climate change and human activities. Land Degrad. Dev. 2020, 31, 1380–1391. [Google Scholar] [CrossRef]
  10. Sterk, G.; Stoorvogel, J.J. Desertification–Scientific Versus Political Realities. Land 2020, 9, 156. [Google Scholar] [CrossRef]
  11. Neary, D.G. Wildfire contribution to desertification at local, regional, and global scale. In Desertification; Squires, V.R., Ariapour, A., Eds.; Nova Science Publishers, Inc.: New York, NY, USA, 2018; pp. 200–222. Available online: https://www.fs.usda.gov/rm/pubs_journals/2018/rmrs_2018_neary_d002.pdf (accessed on 7 April 2023).
  12. Reynolds, J.F.; Smith, D.M.S.; Lambin, E.F.; Turnel, B.L.; Mortimore, M.; Batterbury, S.P.J. Global Desertification: Building a Science for Dryland Development. Science 2007, 316, 5826. [Google Scholar] [CrossRef] [Green Version]
  13. Nickayin, S.S.; Coluzzi, R.; Marucci, A.; Bianchini, L.; Salvati, L.; Cudlin, P.; Imbreda, V. Desertification risk fuels spatial polarization in ‘affected’ and ‘unaffected’ landscapes in Italy. Sci. Rep. 2022, 12, 1–11. [Google Scholar] [CrossRef] [PubMed]
  14. Ziadat, F.M.; Zdruli, P.; Christensen, S.; Caon, L.; Monem, A.; Fetsi, T. An Overview of Land Degradation and Sustainable Land Management in the Near East and North Africa. Sustain. Agric. Res. 2022, 11, 11–24. [Google Scholar] [CrossRef]
  15. Wang, X.; Chen, F.; Hasi, E.; Li, J. Desertification in China: An assessment. Earth-Sci. Rev. 2008, 88, 188–206. [Google Scholar] [CrossRef]
  16. Wang, X.; Ge, Q.; Geng, X.; Wang, Z.; Gao, L.; Bryan, B.A.; Chen, S.; Su, Y.; Cai, D.; Ye, J.; et al. Unintended consequences of combating desertification in China. Nat. Commun. 2023, 14, 1139. [Google Scholar] [CrossRef]
  17. Zhang, Z.; Huisingh, D. Combating desertification in China: Monitoring, control, management and revegetation. J. Clean. Prod. 2018, 182, 765–775. [Google Scholar] [CrossRef]
  18. Fang, Y.; Wang, X.; Cheng, Y.; Wang, Z. Oasis Change Characteristics and Influencing Factors in the Shiyang River Basin, China. Sustainability 2022, 14, 14354. [Google Scholar] [CrossRef]
  19. Zhang, Y.; Zhu, G.; Ma, H.; Yang, J.; Pan, H.; Guo, H.; Wan, Q.; Yong, L. Effects of Ecological Water Conveyance on the Hydrochemistry of a Terminal Lake in an Inland River: A Case Study of Qingtu Lake in the Shiyang River Basin. Water 2019, 11, 1673. [Google Scholar] [CrossRef] [Green Version]
  20. Wang, Q.; Shi, J.; Chen, G.; Xue, L. Environmental effects induced by human activities in arid Shiyang River basin, Gansu province, northwest China. Environ. Geol. 2002, 43, 219–227. [Google Scholar] [CrossRef]
  21. Kang, S.; Su, X.; Tong, L.; Yang, X.; Yukuo, A. The impacts of human activities on the water-land environment of the Shiyang River basin, an arid region in northwest China. Hydrol. Sci. J. 2004, 49, 412–427. [Google Scholar] [CrossRef]
  22. Ngabire, M.; Wang, T.; Xue, X.; Liao, J.; Sahbeni, G.; Huang, C.; Xiang, S.; Duan, H. Synergic effects of land-use management systems towards the reclamation of Aeolian Desertified Land in the Shiyang River Basin. Ecol. Indic. 2022, 139, 108882. [Google Scholar] [CrossRef]
  23. Liao, J.; Wang, T.; Ma, S. Mapping the dynamic degree of aeolian desertification in the Shiyang River Basin from 1975 to 2010. Sci. Cold Arid. Reg. 2020, 12, 144–153. [Google Scholar]
  24. Schwilch, G.; Bestelmeyer, B.; Bunning, S.; Critchley, W.; Herrick, J.; Kellner, K.; Liniger, H.P.; Nachtergaele, F.; Ritsema, C.J.; Schuster, B.; et al. Experience in monitoring and assessment of sustainable land management. Land Degrad. Dev. 2011, 22, 214–225. [Google Scholar] [CrossRef]
  25. Vu, Q.M.; Le, Q.B.; Frossard, E.; Vlek, P.L.G. Socio-economic and Biophysical Determinants of Land Degradation in Vietnam: An Integrated Causal Analysis at The National Level. Land Use Policy 2014, 36, 605–617. [Google Scholar] [CrossRef]
  26. Marin, A.M.P.; Vendruscolo, J.; Salazar, J.R.Z.; Queiroz, H.A.A.; Magalhães, D.L.; Menezes, R.S.C.; Fernandez, I.M. Monitoring Desertification Using a Small Set of Biophysical Indicators in the Brazilian Semiarid Region. Sustainability 2022, 14, 9735. [Google Scholar] [CrossRef]
  27. Cerretelli, S.; Poggio, L.; Gimona, A.; Yakob, G.; SBoke, S.; Habte, M.; Coull, M.; Peressotti, A.; Black, H. Spatial assessment of land degradation through key ecosystem services: The role of globally available data. Sci. Total. Environ. 2018, 628–629, 539–555. [Google Scholar] [CrossRef]
  28. Ramsy, M.; Gad, A.; Abdelsalam, H.; Siwailam, M. A dynamic simulation model of desertification in Egypt. Egypt. J. Remote. Sens. Space Sci. 2010, 13, 101–111. [Google Scholar] [CrossRef] [Green Version]
  29. Pulleman, M.; Creamer, R.; Hamer, U.; Helder, J.; Pelosi, C.; Peres, G.; Rutgers, M. Soil biodiversity, biological indicators and soil ecosystem services—An overview of European approaches. Curr. Opin. Environ. Sustain. 2012, 4, 529–538. [Google Scholar] [CrossRef]
  30. Han, X.; Jia, G.; Yang, G.; Wang, N.; Liu, F.; Chen, H.; Guo, X. Spatiotemporal dynamic evolution and driving factors of desertification in the Mu Us Sandy Land in 30 years. Sci. Rep. 2020, 10, 21734. [Google Scholar] [CrossRef]
  31. Burrell, A.L.; Evans, J.P.; De Kauwe, M.G. Anthropogenic climate change has driven over 5 million km2 of drylands towards desertification. Nat. Commun. 2020, 11, 3853. [Google Scholar] [CrossRef]
  32. Fan, Z.; Li, S.; Fang, H. Explicitly Identifying the Desertification Change in CMREC Area Based on Multisource Remote Data. Remote Sens. 2020, 12, 3170. [Google Scholar] [CrossRef]
  33. Hien, L.T.T.; Gobin, A.; Huong, P.T.T. Spatial indicators for desertification in southeast Vietnam. Earth Syst. Sci. 2019, 19, 2325–2337. [Google Scholar] [CrossRef] [Green Version]
  34. Guo, Q.; Fu, B.; Shi, P.; Thomas, C.; Zhang, J.; Xu, H. Satellite Monitoring the Spatial-Temporal Dynamics of Desertification in Response to Climate Change and Human Activities across the Ordos Plateau, China. Remote Sens. 2017, 9, 525. [Google Scholar] [CrossRef] [Green Version]
  35. Zhang, J.; Guan, Q.; Du, Q.; Ni, F.; Mi, J.; Luo, H.; Shao, W. Spatial and temporal dynamics of desertification and its driving mechanism in Hexi region. Land Degrad. Dev. 2022, 33, 3539–3556. [Google Scholar] [CrossRef]
  36. Zhou, W.; Sun, Z.; Li, J.; Gang, C.; Zhang, C. Desertification dynamic and the relative roles of climate change and human activities in desertification in the Heihe River Basin based on NPP. J. Arid. Land 2013, 5, 465–479. [Google Scholar] [CrossRef] [Green Version]
  37. Meng, X.; Gao, X.; Li, S.; Li, S.; Lei, J. Monitoring desertification in Mongolia based on Landsat images and Google Earth Engine from 1990 to 2020. Ecol. Indic. 2021, 129, 107908. [Google Scholar] [CrossRef]
  38. Higginbottom, T.P.; Symeonakis, E. Assessing Land Degradation and Desertification UsingVegetation Index Data: Current Frameworksand Future Directions. Remote Sens. 2014, 5, 9552–9575. [Google Scholar] [CrossRef] [Green Version]
  39. Yao, L.; Lu, J.; Jiang, H.; Liu, T.; Qin, J.; Zhou, C. Satellite-derived aridity index reveals China’s drying in recent two decades. iScience 2023, 26, 106185. [Google Scholar] [CrossRef]
  40. Zhou, J.; Jiang, T.; Wang, Y.; Su, B.; Tao, H.; Qin, J.; Zhai, J. Spatiotemporal variations of aridity index over the Belt and Road region under the 1.5 °C and 2.0 °C warming scenarios. J. Geogr. Sci. 2020, 30, 37–52. [Google Scholar] [CrossRef] [Green Version]
  41. Li, Y.; Yu, W.; Wang, K.; Ma, X. Comparison of the aridity index and its drivers in eight climatic regions in China in recent years and in future projections. Int. J. Climatol. 2019, 39, 5256–5272. [Google Scholar] [CrossRef]
  42. Bohr, L.; Lyra, G.B.; Oliera-Júnior, J.F.; Zeri, M.; Zeri, G.C. Desertification susceptibility over Rio de Janeiro, Brazil, based on aridity indices and geoprocessing. Int. J. Climatol. 2021, 41, E2600–E2614. [Google Scholar] [CrossRef]
  43. Adams, M.P.; Smith, P.L. A systematic approach to model the influence of the type and density of vegetation cover on urban heat using remote sensing. Landsc. Urban. Plan. 2014, 132, 47–54. [Google Scholar] [CrossRef]
  44. Yang, L.; Shen, F.; Cai, Y.; Yi, F.; Zhou, C. Quantifying influences of natural and anthropogenic factors on vegetation changes using structural equation modeling: A case study in Jiangsu Province, China. J. Clean. Prod. 2021, 280, 124330. [Google Scholar] [CrossRef]
  45. Li, S.; Li, X.; Gong, J.; Dang, D.; Dou, H.; Lyu, X. Quantitative Analysis of Natural and Anthropogenic Factors Influencing Vegetation NDVI Changes in Temperate Drylands from a Spatial Stratified Heterogeneity Perspective: A Case Study of Inner Mongolia Grasslands, China. Remote Sens. 2022, 14, 3320. [Google Scholar] [CrossRef]
  46. Wang, J.; Xu, C. Geodetector: Principle and prospective. Acta Geogr. Sin. 2017, 72, 116–134. [Google Scholar] [CrossRef]
  47. Zhang, S.; Zhou, Y.; Yu, Y.; Li, F.; Zhang, R.; Li, W. Using the Geodetector Method to Characterize the Spatiotemporal Dynamics of Vegetation and Its Interaction with Environmental Factors in the Qinba Mountains, China. Remote Sens. 2022, 14, 5794. [Google Scholar] [CrossRef]
  48. Ren, D.; Caio, A. Analysis of the heterogeneity of landscape risk evolution and driving factors based on a combined GeoDa and Geodetector model. Ecol. Indic. 2022, 144, 109568. [Google Scholar] [CrossRef]
  49. Wang, B.; Gao, X. Temporal and spatial variations of water resources constraint intensity on urbanization in the Shiyang River Basin, China. Environ. Dev. Sustain. 2021, 23, 10038–10055. [Google Scholar] [CrossRef]
  50. Zhu, G.; Wan, Q.; TYong, L.; Zhang, Z.; Guo, H.; Zhang, Y.; Sun, Z.; Zhang, Z.; Ma, H. Dissolved organic carbon transport in the Qilian mountainous areas of China. Hydrol. Process. 2020, 34, 4985–4995. [Google Scholar] [CrossRef]
  51. Hu, L.; Wang, Z.; Tian, W.; Zhao, J. Coupled surface water-groundwater model and its application in the arid Shiyang River basin, China. Hydrol. Process. Int. J. 2009, 23, 2033–2044. [Google Scholar] [CrossRef]
  52. Wang, Z.; Shi, P.; Zhang, X.; Tong, H.; Zhang, W.; Liu, Y. Research on Landscape Pattern Construction and Ecological Restoration of Jiuquan City Based on Ecological Security Evaluation. Sustainability 2021, 13, 5732. [Google Scholar] [CrossRef]
  53. Wang, H.; Zhang, M.; Zhu, H.; Dang, X.; Ynang, Z.; Yin, L. Hydro-climatic trends in the last 50 years in the lower reach of the Shiyang RiverBasin, NW China. Catena 2012, 95, 33–41. [Google Scholar] [CrossRef]
  54. Wang, Z.; Ficklin, D.L.; Zhang, Y.; Zhang, M. Impact of climate change on streamflow in the arid Shiyang River Basin of northwest China. Hydrol. Process. 2011, 26, 2733–2744. [Google Scholar] [CrossRef]
  55. Zhang, Y.; Jiang, J.; Shen, B.; Shen, Q.; Yang, D.; Tian, F.; Tang, L.; Liu, Z. Study on Countermeasures for Water Resources Shortage and Changes of Ecological Environment in Shiyang River Basin; IAHS-AISH Publication: Wallingford, UK, 2008. [Google Scholar]
  56. Bao, C.; Fang, C. Water resources constraint force on urbanization in water deficient regions: A case study of the Hexi Corridor, arid area of NW China. Ecol. Econ. 2007, 62, 508–517. [Google Scholar] [CrossRef]
  57. Chen, M.; Wang, P.; Chen, L. Population Distribution Evolution Characteristics and Shift Growth Analysis in Shiyang River Basin. J. Geosci. 2014, 5, 1395–1403. [Google Scholar] [CrossRef] [Green Version]
  58. Deng, X.; Wilson, J.P.; Gallant, J.C. Terrain Analysis. In The Handbook of Geographic Information Science; Wilson, J.P., Fotheringham, A.S., Eds.; Blackwell Publishing: Oxford, UK, 2007. [Google Scholar] [CrossRef]
  59. Guan, Q.; Yang, L.; Pan, N.; Lin, J.; Xu, C.; Wang, F.; Liu, Z. Greening and Browning of the Hexi Corridor in Northwest China: Spatial Patterns and Responses to Climatic Variability and Anthropogenic Drivers. Remote Sens. 2018, 10, 1270. [Google Scholar] [CrossRef] [Green Version]
  60. Jiang, Y.; Du, W.; Chen, J.; Wang, C.; Wang, J.; Sun, W.; Chai, X.; Ma, L.; Xu, Z. Climatic and Topographical Effects on the Spatiotemporal Variations of Vegetation in Hexi Corridor, Northwestern China. Diversity 2022, 14, 370. [Google Scholar] [CrossRef]
  61. Safanelli, J.L.; Poppiel, R.R.; Ruiz, L.F.C.; Bonfatti, B.R.; Mello, F.A.M.; Rizzo, R.; Demattê, J.A.M. Terrain Analysis in Google Earth Engine: A Method Adapted for High-Performance Global-Scale Analysis. ISPRS Int. J. Geo-Inf. 2020, 9, 400. [Google Scholar] [CrossRef]
  62. Zhang, L.; Wu, B.; Xi, X.; Xing, Q. Classification system of China land cover for carbon budget. Acta Ecol. Sin. 2014, 34, 7158–7166. [Google Scholar] [CrossRef] [Green Version]
  63. Stavi, I.; Thevs, N.; Priori, S. Soil Salinity and Sodicity in Drylands: A Review of Causes, Effects, Monitoring, and Restoration Measures. Front. Environ. Sci. 2021, 9. [Google Scholar] [CrossRef]
  64. Hassani, A.; Azapagic, A.; Shokri, N. Global predictions of primary soil salinization under changing climate in the 21st century. Nat. Commun. 2021, 12, 1–17. [Google Scholar] [CrossRef]
  65. Ngabire, M.; Wang, T.; Xue, X.; Liao, J.; Ghada, S.; Huang, C.; Duan, H.; Song, X. Soil salinization mapping across different sandy land-cover types in the Shiyang River Basin: A remote sensing and multiple linear regression approach. Remote Sens. Appl. Soc. Environ. 2022, 28, 100847. [Google Scholar] [CrossRef]
  66. Zhang, X.; Zhao, Y. Identification of the driving factors’ influences on regional energy-related carbon emissions in China based on geographical detector method. Environ. Sci. Pollut. Res. 2018, 25, 9626–9635. [Google Scholar] [CrossRef]
  67. Escobedo, F.J.; Nowak, D.J. Spatial heterogeneity and air pollution removal by an urban forest. Landsc. Urban. Plan. 2009, 90, 102–110. [Google Scholar] [CrossRef]
  68. Xu, Y.; Li, P.; Pan, J.; Zhang, Y.; Dang, X.; Cao, X.; Cui, J.; Yang, Z. Eco-Environmental Effects and Spatial Heterogeneity of “Production-Ecology-Living” Land Use Transformation: A Case Study for Ningxia, China. Sustainability 2022, 14, 9659. [Google Scholar] [CrossRef]
  69. Yin, H.; Chen, C.; Dong, Q.; Zhang, P.; Chen, Q.; Zhu, L. Analysis of Spatial Heterogeneity and Influencing Factors of Ecological Environment Quality in China’s North-South Transitional Zone. Int. J. Environ. Res. Public Health 2022, 19, 2236. [Google Scholar] [CrossRef] [PubMed]
  70. Wang, H.; Qin, F.; Xu, C.; Li, B.; Guo, L.; Wang, Z. Evaluating the suitability of urban development land with a Geodetector. Ecol. Indic. 2021, 123, 107339. [Google Scholar] [CrossRef]
  71. Liang, X.; Li, P.; Wang, J.; Chan, F.K.; Togtokh, C.; Ochir, A.; Davaasuren, D. Research Progress of Desertification and Its Prevention in Mongolia. Sustainability 2021, 13, 6861. [Google Scholar] [CrossRef]
  72. Zhang, Z.; Song, Y.; Wu, P. Robust geographical detector. Int. J. Appl. Earth Obs. Geoinf. 2022, 109. [Google Scholar] [CrossRef]
  73. Song, Y.; Wang, J.; Ge, Y.; Xu, C. An optimal parameters-based geographical detector model enhances geographic characteristics of explanatory variables for spatial heterogeneity analysis: Cases with different types of spatial data. GIsci Remote Sens. 2020, 57, 593–610. [Google Scholar] [CrossRef]
  74. Wang, F.; Li, X.; Christakos, G.; Liao, Y.; Zhang, T.; Gu, X. Geographical Detectors-Based Health Risk Assessment and its Application in the Neural Tube Defects Study of the Heshun Region, China. Int. J. Geogr. Inf. Sci. 2010, 24, 107–127. [Google Scholar] [CrossRef]
  75. Wang, T.; Watson, J. Scenario analysis of China’s emissions pathways in the 21st century for low carbon transition. Energy Policy 2010, 38, 3537–3546. [Google Scholar] [CrossRef]
  76. Ding, Y.; Zhang, M.; Qian, X.; Li, C.; Chen, S.; Wang, W. Using the geographical detector technique to explore the impact of socioeconomic factors on PM2.5 concentrations in China. J. Clean. Prod. 2019, 211, 1480–1490. [Google Scholar] [CrossRef]
  77. Cao, F.; Ge, Y.; Wang, J. Optimal discretization for geographical detectors-based risk assessment. GIsci Remote Sens. 2013, 50, 78–92. [Google Scholar] [CrossRef]
  78. Wu, R.; Zhang, J.; Bao, Y.; Zhang, F. Geographical Detector Model for Influencing Factors of Industrial Sector Carbon Dioxide Emissions in Inner Mongolia, China. Sustainability 2016, 8, 149. [Google Scholar] [CrossRef] [Green Version]
  79. Jia, W.; Wang, M.; Zhou, C.; Yang, Q. Analysis of the spatial association of geographical detector-based landslides and environmental factors in the southeastern Tibetan Plateau, China. PLoS ONE 2021, 16, e0251776. [Google Scholar] [CrossRef]
  80. Wang, J.; Hu, Y. Environmental health risk detection with GeogDetector. Environ. Model. Softw. 2012, 33, 114–115. [Google Scholar] [CrossRef]
  81. Han, J.; Wang, J.; Chen, L.; Xiang, J.; Ling, Z.; Li, Q.; Wang, E. Driving factors of desertification in Qaidam Basin, China: An 18-year analysis using the geographic detector model. Ecol. Indic. 2021, 124, 107404. [Google Scholar] [CrossRef]
  82. Kimura, R.; Moriyama, M. Recent Trends of Annual Aridity Indices and Classification of Arid Regions with Satellite-Based Aridity Indices. Remote Sens. Earth Syst. Sci. 2019, 2, 88–95. [Google Scholar] [CrossRef]
  83. Kimura, R.; Moriyama, M. Use of a Satellite-Based Aridity Index to Monitor Decreased Soil Water Content and Grass Growth in Grasslands of North-East Asia. Remote Sens. 2020, 12, 3556. [Google Scholar] [CrossRef]
  84. Kirkham, M.B. Potential Evapotranspiration. In Principles of Soil and Plant Water Relations, 2nd ed; Academic Press: Cambridge, MA, USA, 2014; pp. 501–514. [Google Scholar] [CrossRef]
  85. Niu, K.; Qiu, J.; Cai, S.; Zhang, W.; Mu, X.; Park, E.; Yang, X. Use of a MODIS Satellite-Based Aridity Index to Monitor Drought Conditions in the Pearl River Basin from 2001 to 2021. ISPRS Int. J. Geo-Inf. 2022, 11, 541. [Google Scholar] [CrossRef]
  86. Kimura, R.; Moriyama, M. Determination by MODIS satellite-based methods of recent global trends in land surface aridity and degradation. J. Agric. Meteorol. 2019, 75, 153–159. [Google Scholar] [CrossRef] [Green Version]
  87. Kimura, R.; Moriyama, M. Use of A MODIS Satellite-Based Aridity Index to Monitor Drought Conditions in Mongolia from 2001 to 2013. Remote Sens. 2021, 13, 2561. [Google Scholar] [CrossRef]
  88. Stefanidis, K.; Kostara, A.; Papastergiadou, E. Implications of Human Activities, Land Use Changes and Climate Variability in Mediterranean Lakes of Greece. Water 2016, 8, 483. [Google Scholar] [CrossRef]
  89. Hamed, K.H.; Ramachandra, R.A. A modified Mann-Kendall trend test for autocorrelated data. J. Hydrol. 1998, 204, 182–196. [Google Scholar] [CrossRef]
  90. Gabriel, C.B. The modified Mann-Kendall test: On the performance of three variance correction approaches. Agrometeorology 2013, 72, 416–425. [Google Scholar] [CrossRef] [Green Version]
  91. Lamchin, M.; Lee, W.K.; Seong, W.J.; Sonam, W.W.; Lim, C.; Song, C.; Sung, M. Corrigendum to “Mann-Kendall Monotonic Trend Test and Correlation Analysis using Spatio-temporal Dataset: The case of Asia using vegetation greenness and climate factors”. MethodsX 2019, 6, 1379–1383. [Google Scholar] [CrossRef]
  92. Theil, H. A Rank-Invariant Method of Linear and Polynomial Regression Analysis. In Theil’s Contributions to Economics and Econometrics. Advanced Studies in Theoretical and Applied Econometrics; Raj, B., Koerts, J., Eds.; Springer: Dordrecht, The Netherlands, 1992. [Google Scholar] [CrossRef]
  93. Akritas, M.G.; Murphy, S.A.; La Valley, M. The Theil-Sen Estimator with Doubly Censored Data and Applications to Astronomy. J. Am. Stat. Assoc. 1995, 90, 170–177. [Google Scholar] [CrossRef]
  94. Fernandes, R.; Leblanc, S.G. Parametric (modified least squares) and non-parametric (Theil–Sen) linear regressions for predicting biophysical parameters in the presence of measurement errors. Remote Sens. Environ. 2005, 95, 303–316. [Google Scholar] [CrossRef]
  95. Reynolds, J.F.; Maestre, F.T.; Kemp, P.R.; Smith, D.M.S.; Lambin, E. Natural and Human Dimensions of Land Degradation in Drylands: Causes and Consequences. In Terrestrial Ecosystems in a Changing World. Global Change; Canadell, J.G., Pataki, D.E., Pitelka, L.F., Eds.; Springer: Berlin/Heidelberg, Germany, 2007; pp. 247–257. [Google Scholar] [CrossRef]
  96. Hu, X.; Jin, Y.; Ji, L.; Zeng, J.; Cui, Y.; Song, Z.; Sun, D.; Cheng, G. Land use/cover change and its eco-environment effects in Shiyang River Basin. In Proceedings of the 4th International Conference on Water Resource and Environment (WRE 2018), Kaohsiung City, Taiwan, 17–21 July 2018. [Google Scholar]
  97. Lancaster, N. Response of Aeolian Processes and Landforms to Climate Change and Variability. In Treatise on Geomorphology, 2nd ed.; Academic Press: Cambridge, MA, USA, 2022; Volume 9, pp. 318–339. [Google Scholar]
  98. Zhang, F.; Wang, C.; Wang, Z. Response of Natural Vegetation to Climate in Dryland Ecosystems: A Comparative Study between Xinjiang and Arizona. Remote Sens. 2020, 12, 3567. [Google Scholar] [CrossRef]
  99. Mayaud, J.R.; Webb, N.P. Vegetation in Drylands: Effects on Wind Flow and Aeolian Sediment Transport. Land 2017, 6, 64. [Google Scholar] [CrossRef] [Green Version]
  100. Lancaster, N. Response of eolian geomorphic systems to minor climate change: Examples from the southern Californian deserts. Geomorphology 1997, 19, 333–347. [Google Scholar] [CrossRef]
  101. Alvarez, L.J.; Epstein, H.E.; Li, J.; Okin, G.S. Aeolian process effects on vegetation communities in an arid grassland ecosystem. Ecol. Evol. 2012, 2, 809–821. [Google Scholar] [CrossRef] [PubMed]
  102. Heindel, R.C.; Culler, L.E.; Virginia, R.A. Rates and processes of aeolian soil erosion in West Greenland. Holocene 2017, 27, 1281–1290. [Google Scholar] [CrossRef] [Green Version]
  103. Catto, N.R.; Bachhuber, F.W. Aeolian Geomorphic Response to Climate Change: An Example from the Estancia Valley, Central New Mexico, USA. In Linking Climate Change to Land Surface Change; McLaren, S.J., Kniveton, D.R., Eds.; Springer: Dordrecht, The Netherlands, 2000; Volume 6. [Google Scholar]
  104. Dousari, A.A.; Ramadan, A.; Qattan, A.A.; Arteeqi, S.A.; Dashti, H.; Ahmed, M.; Dousari, N.A.; Hashash, N.A.; Othman, A. Cost and effect of native vegetation change on aeolian sand, dust, microclimate and sustainable energy in Kuwait. J. Taibah Univ. Sci. 2020, 14, 628–639. [Google Scholar] [CrossRef]
  105. Edwards, B.L.; Webb, N.P.; Brown, D.P.; Elias, E.; Peck, D.E.; Pierson, F.B.; Williams, C.J.; Herrick, J.E. Climate change impacts on wind and water erosion on US rangelands. J. Soil Water Conserv. 2019, 74, 405–418. [Google Scholar] [CrossRef] [Green Version]
  106. Zhao, C.; Li, X.; Zhou, X.; Zhao, K.; Yang, Q. Holocene Vegetation Succession and Response to Climate Change on the South Bank of the Heilongjiang-Amur River, Mohe County, Northeast China. Adv. Meteorol. 2016, 2450697, 1–11. [Google Scholar] [CrossRef] [Green Version]
  107. Singh, G.; Tomar, U.K.; Singh, B.; Sharma, S. A Manual for Dryland Afforestation and Management; Scientific Publishers—AFARI: Jodhpur, India, 2017. [Google Scholar]
  108. Wu, J.; Kurosaki, Y.; Du, C. Evaluation of Climatic and Anthropogenic Impacts on Dust Erodibility: A Case Study in Xilingol Grassland, China. Sustainability 2020, 12, 629. [Google Scholar] [CrossRef] [Green Version]
  109. Ishizuka, M.; Mikami, M.; Yamada, Y.; Zeng, F. Threshold Friction Velocities of Saltation Sand Particles for Different Soil Moisture Conditions in the Taklimakan Desert. SOLA 2009, 5, 184–187. [Google Scholar] [CrossRef] [Green Version]
  110. Su, X.; Singh, V.P.; Niu, J.; Hao, L. Spatiotemporal trends of aridity index in Shiyang River basin of northwest China. Stoch. Environ. Res. Risk Assess. 2015, 29, 1571–1582. [Google Scholar] [CrossRef]
  111. Zhu, Q.; Li, Y. Environmental Restoration in the Shiyang River Basin, China: Conservation, Reallocation and More Efficient Use of Water. Aquat. Procedia 2014, 2, 24–34. [Google Scholar] [CrossRef]
  112. Shao, Y.; Dong, Z.; Meng, J.; Wu, S.; Zhu, S.; Zhang, Q.; Zheng, Z. Analysis of Runoff Variation and Future Trends in a Changing Environment: Case Study for Shiyanghe River Basin, Northwest China. Sustainability 2023, 15, 2173. [Google Scholar] [CrossRef]
  113. Sun, L.; Li, H.; Wang, J.; Chen, Y.; Xiong, N.; Wang, Z.; Wang, J.; Xu, J. Impacts of Climate Change and Human Activities on NDVI in the Qinghai-Tibet Plateau. Remote Sens. 2023, 15, 587. [Google Scholar] [CrossRef]
  114. Li, X.; Zhang, K.; Li, X. Responses of vegetation growth to climate change over the Tibetan Plateau from 1982 to 2018. Environ. Res. Commun. 2022, 4, 045007. [Google Scholar] [CrossRef]
  115. Zhang, Q.; Yuan, R.; Singh, V.P.; Xu, C.; Fan, K.; Shen, Z.; Wang, G.; Zhao, J. Dynamic vulnerability of ecological systems to climate changes across the Qinghai-Tibet Plateau, China. Ecol. Indic. 2022, 134, 108483. [Google Scholar] [CrossRef]
  116. Xu, C.D.; Wang, R.R.; Ding, L.Y.; Wen, Q.Y. Study on the Climate Change of Shiyang River Basin in Chinese Arid Inland Area. CEt 2015, 46, 769–774. [Google Scholar] [CrossRef]
  117. Zhang, C.; Li, Y. Verification of watershed vegetation restoration policies, arid China. Sci. Rep. 2016, 6, 30740. [Google Scholar] [CrossRef] [PubMed] [Green Version]
  118. Tang, Z.; Ma, J.; Peng, H.; Wang, S.; Wei, J. Spatiotemporal changes of vegetation and their responsesto temperature and precipitation in upper Shiyang river basin. Adv. Space Res. 2017, 60, 969–979. [Google Scholar] [CrossRef]
  119. Dregne, H.E. Physics of desertification. In Desertification of Arid Lands; El-Baz, F., Hassan, M.H.A., Eds.; Springer: Dordrecht, The Netherlands, 1986. [Google Scholar] [CrossRef]
  120. Lin, N.F.; Tang, J. Geological environment and causes for desertification in arid-semiarid regions in China. Env. Geol. 2002, 41, 806–815. [Google Scholar] [CrossRef]
  121. Chen, N.; Guo, C.; Li, Z.; Liu, L. The grassland degradation problems of the Minqin oasis, in the lower reaches of the Shiyang River Basin. Acta Pratacult. Sin. 2010, 19, 62–71. [Google Scholar]
  122. Li, B. Soil Salinization. In Desertification and Its Control in China; Springer: Berlin/Heidelberg, Germany, 2010. [Google Scholar] [CrossRef]
  123. Wang, Y.; Qin, D. Influence of climate change and human activity on water resources in arid region of Northwest China: An overview. Adv. Clim. Chang. Res. 2017, 8, 268–278. [Google Scholar] [CrossRef]
  124. Yang, J.; Zhao, J.; Zhu, G.; Wang, Y.; Ma, X.; Wang, J.; Guo, H.; Zhang, Y. Soil salinization in the oasis areas of downstream inland rivers —Case Study: Minqin oasis. Math. Probl. Eng. 2020, 537, 69–78. [Google Scholar] [CrossRef]
  125. Li, F.; Zhu, G.; Guo, C. Shiyang River ecosystem problems and countermeasures Int. J. Agric. Sci. 2013, 4, 72–78. [Google Scholar] [CrossRef] [Green Version]
  126. Castellini, M.; Di Prima, S.; Stewart, R.; Biddocu, M.; Rahmati, M.; Alagna, V. Advances in Ecohydrology for Water Resources Optimization in Arid and Semi-Arid Areas. Water 2022, 14, 1830. [Google Scholar] [CrossRef]
  127. Wei, W.; Shi, P.; Zhao, J.; Wang, X.; Wang, X. Environmental Suitability Evaluation for Human Settlements in Arid Inland River Basin-A Case Study on the Shiyang River Basin. Adv. Mat. Res. 2012, 518–523, 4874–4884. [Google Scholar] [CrossRef]
  128. Kang, S.; Su, X.; Tong, L.; Zhang, J.; Zhang, L. A warning from an ancient oasis: Intensive human activities are leading to potential ecological and social catastrophe. Int. J. Sustain. Dev. 2010, 15, 440–447. [Google Scholar] [CrossRef]
  129. Jun, Z.; Ming, L.; Qiang, C.; Min, W.; Xin, P. Impacts of changing conditions on the ecological environment of the Shiyang River Basin, China. Water Supply 2022, 22, 5689. [Google Scholar] [CrossRef]
  130. Du, Z.; Xu, X.; Zhang, H.; Wu, Z.; Liu, Y. Geographical Detector-Based Identification of the Impact of Major Determinants on Aeolian Desertification Risk. PLoS ONE 2016, 11, e0151331. [Google Scholar] [CrossRef]
  131. Xu, C.; Li, Y.; Wang, J.; Xiao, G. Spatial-temporal detection of risk factors for bacillary dysentery in Beijing, Tianjin and Hebei, China. BMC Public Health 2017, 17, 743. [Google Scholar] [CrossRef] [Green Version]
  132. Yue, H.; Hu, T. Geographical Detector-Based Spatial Modeling of the COVID-19 Mortality Rate in the Continental United States. Int. J. Environ. Res. Public Health 2021, 18, 6832. [Google Scholar] [CrossRef]
  133. Weber, K.; Horst, S. Desertification and livestock grazing: The roles of sedentarization, mobility and rest. Pastoralism 2011, 1, 19. [Google Scholar] [CrossRef] [Green Version]
  134. Qi, F.; Wei, L.; Liu, Y.; Zhang, Y. Impact of desertification and global warming on soil carbon in northern China. J. Geophys. Res. Atmos. 2004, 109. [Google Scholar] [CrossRef] [Green Version]
Figure 1. The geographic location of the study area: Shiyang River Basin.
Remotesensing 15 02960 g001
Figure 2. Technological roadmap for the study.
Remotesensing 15 02960 g002
Figure 3. Model inputs: (A) temperature, (B) precipitation, (C) wind velocity, (D) land cover change, (E) soil salinization, (F) soil types, (G) buffer to waterways, (H) buffer to roads, (I) elevation, and (J) 20-year mean annual aridity index.
Remotesensing 15 02960 g003
Figure 4. The basic concept of GeoDetector; the strata of Y were formed by laying Y over X; the q interval varies in the [0, 1] interval, and q reflects the influence of X on the spatial heterogeneity of Y. The larger q is, the more significant the impact of X is. Adapted from [66].
Remotesensing 15 02960 g004
Figure 5. Detection of interaction between different factors: Adapted from [66].
Remotesensing 15 02960 g005
Figure 6. Spatial distribution of aridity index levels in the Shiyang River basin.
Remotesensing 15 02960 g006
Figure 7. Percentage of aridity classes in the Shiyang River Basin.
Remotesensing 15 02960 g007
Figure 8. Theil–Sen’s slope for the time series annual aridity index in the Shiyang River Basin between 2000 and 2020.
Remotesensing 15 02960 g008
Figure 9. Mann–Kendall Tau values for the time series aridity index trend (2000–2020).
Remotesensing 15 02960 g009
Figure 10. Geographical detector-based explanatory variables of driving factors of desertification in the Shiyang River Basin; contribution of a single variable to aridity index changes investigated using factor detector.Note: Temp: Temperature, Prec: Precipitation, WV: Wind velocity, ST: Soil Type, SS: Soil Salinity, DEM: Digital Elevation Model, WB: Water Buffers, RB: Road Buffers, and LCD: Land Cover Dynamics.
Remotesensing 15 02960 g010
Figure 11. Influence of factors’ different strata on the magnitude of the aridity index (L: low, M: moderate, Sev: severe, ES: extremely severe, A. Sandy soil: aeolian sandy soil, GB soil: gray-brown soil, GD soil: gray desert soil, Irr soil: irrigated desert soil, Temp: Temperature, Prec: Precipitation, WV: Wind velocity, ST: Soil Type, SS: Soil Salinity, DEM: Digital Elevation Model, WB: Water Buffers, RB: Road Buffers, and LCD: Land Cover Dynamics. Red color indicates maximum change while Blue color indicates minimum change occurrence at a given strata of environmental factor.
Remotesensing 15 02960 g011
Figure 12. Correlation matrix for interaction detector obtained from GeoDetector-based explanatory variables. Note: bivariate-enhanced (↑↓) and nonlinear-enhanced (↑) relationship between the two factors. The colors were used to distinguish the intensity of q values.
Remotesensing 15 02960 g012
Table 2. Interaction relationship between two variables and their impact categories, with Min(q(Xi), q(Xj)) being the minimum of q(Xi) and q(Xj), and Max(q(Xi); q (Xj)) is the maximum of q(Xi) and q(Xj). Reprinted from [81].
Demonstration of Interaction RelationshipFactor Interaction Type
q (Xi ∩ Xj) < Min (q (Xi), q (Xj))The factors are weakened and non-linear.
Min (q (Xi), q (Xj)) < q (Xi ∩ Xj) < Max (q (Xi)), q (Xj))The factors are weakened and univariate.
q (Xi ∩ Xj) > Max (q(Xi), q (Xj))The factors are enhanced & bivariate
q (Xi ∩ Xj) = q (Xi) + q (Xj)The factors are independent.
q (XiXj) > q (Xi) + q (Xj)The factors are enhanced and non-linear.
Table 3. Classification system of aridity index.
Climate TypeAridity Index RangeSaBiA
Hyper-arid<0.05SbAI > 0.025
Arid0.05–0.200.022 ≤ SbAI ≤ 0.025
Semi-arid02–0.50.017 ≤ SbAI < 0.022
Dry sub-humid0.5–0.750.015 ≤ SbAI < 0.017
Humid>0.75<0.017
Disclaimer/Publisher’s Note: The statements, opinions and data contained in all publications are solely those of the individual author(s) and contributor(s) and not of MDPI and/or the editor(s). MDPI and/or the editor(s) disclaim responsibility for any injury to people or property resulting from any ideas, methods, instructions or products referred to in the content.

