Article

Combining Radiative Transfer Model and Regression Algorithms for Estimating Aboveground Biomass of Grassland in West Ujimqin, China

1
College of Geodesy and Geomatics, Shandong University of Science and Technology, 579 Qianwangang Road, Qingdao 266590, China
2
Key Laboratory of Ocean Geomatics, Ministry of Natural Resources, 579 Qianwangang Road, Qingdao 266590, China
*
Author to whom correspondence should be addressed.
Remote Sens. 2023, 15(11), 2918; https://doi.org/10.3390/rs15112918
Submission received: 15 April 2023 / Revised: 25 May 2023 / Accepted: 29 May 2023 / Published: 3 June 2023
(This article belongs to the Section Remote Sensing in Agriculture and Vegetation)

Abstract

:
Grassland aboveground biomass (AGB) is a crucial indicator when studying the carbon sink of grassland ecosystems. The exploration of the grassland AGB inversion method with viable reproducibility is significant for promoting the practicability and efficiency of grassland quantitative monitoring. Therefore, this study provides a novel retrieval method for grassland AGB by coupling the PROSAIL (PROSPECT + SAIL) model and the random forest (RF) model on the basis of the lookup-table (LUT) method. These sensitive spectral characteristics were optimized to significantly correlate with AGB (ranging from 0.41 to 0.68, p < 0.001). Four methods were coupled with the PROSAIL model to estimate grassland AGB in the West Ujimqin grassland, including the LUT method, partial least square (PLSR), RF and support vector machine (SVM) models. The ill-posed inverse problem of the PROSAIL model was alleviated using the MODIS products-based algorithm. Inversion results using sensitive spectral characteristics showed that the PROSAIL + RF model offered the best performance (R2 = 0.70, RMSE = 21.65 g/m2 and RMESr = 27.62%), followed by the LUT-based method, which was higher than the PROSAIL + PLSR model. Relatively speaking, the PROSAIL + SVM model was more challenging in this study. The proposed method exhibited strong robustness and universality for AGB estimation in large-scale grassland without field measurements.

1. Introduction

Grassland ecosystems, as one of the largest ecosystems in the world, are an important part of natural ecosystems, playing a significant role in maintaining ecological balance, producing fodder crops and providing carbon sink functions [1,2]. Aboveground biomass (AGB), referring to the total dry weight of plants per unit area, is the key to our proper understanding of the interactions between the biosphere and atmosphere [3]. Thus, the accurate estimation and dynamic inspection of grassland AGB can evaluate the carrying capacity of grassland for livestock, comprehensively understand the process and influencing factors of global climate change, and help managers develop policies for the rational utilization of grassland to achieve sustainable development [4,5]. Although field measurements are the most accurate at obtaining grassland AGB, they are laborious, time-consuming, expensive and damaging to grasslands in large-scale areas [6,7]. Remote sensing has been widely used to effectively estimate grassland AGB owing to its large-scale earth observation image with high spatiotemporal resolution [8,9].
AGB inversion can be performed based on diverse types of remote sensing data, including active sensor data, optical data and multisource data [10]. Wang et al. [11] demonstrated the potential of airborne light detection and ranging (LiDAR) for retrieving AGB in the Hulunber grassland ecosystem in China. Schlund and Davidson [12] combined L-band and P-band SAR (Synthetic Aperture Radar) to estimate the boreal forest AGB. Jin et al. [13] used MODIS-based various vegetation indices to estimate AGB in temperate grasslands in Northern China. The accuracy of this model based on field data and MODIS data was greater than 73%. Lu et al. [14] offered a detailed description and generalization about the main features of the above data types. As an active remote sensing technology, LiDAR can offer detailed three-dimensional structural information on vegetation and has demonstrated significant potential for estimating vegetation’s structural attributes, such as vegetation AGB, height and volume [15,16]. However, compared with satellite images with frequent and wall-to-wall coverage, it is not impractical for airborne LiDAR data in multitemporal and large-area applications due to its high costs [17]. Other active sensor SAR data have shown great advantages in estimating vegetation AGB by using the intensity, polarization and phase information of radar waves. Furthermore, compared with optical satellite data, SAR data have very low requirements for weather conditions during their satellite transit [8,18]. Therefore, many researchers have explored the application and performance of SAR data in AGB mapping [19,20]. However, the application of SAR data is constrained because of their high sensitivity to factors of the underlying surface, such as topographic relief, soil moisture and vegetation coverage, which may greatly reduce the accuracy of AGB mapping [21,22].
The methods of estimating grassland AGB using optical satellite data are dominantly empirical methods, including parametric and nonparametric methods. These parametric methods assume that there are explicit functional relationships between response variables (i.e., biomass) and predictors (i.e., potential variables from optical data). They can be basically grouped into linear and nonlinear models [23,24]. Although parametric approaches are simple and easy to operate, it is difficult for them to capture complex relationships. By contrast, nonparametric methods, such as artificial neural networks (ANN), random forest (RF) and support vector machines (SVM), are capable of exploring complicated nonlinear relationships [25,26,27,28]. Moreover, they have superiority when dealing with high-dimensional issues associated with large numbers of predictors [28]. However, their dependence on a large number of field-measured data restricts their versatility [29]. Hence, these empirical algorithms are generally limited to a certain time and area and have poor transferability.
The vegetation optical radiative transfer model (RTM) is based on accurate physical information that contains detailed relationships between vegetation parameters reflecting canopy characteristics and canopy spectra [30]. The RTM-based method provides advantages of transferability, parameter variability, and robustness compared with empirical statistical methods [31]. The inversion method using optical satellite images and RTM has broad applications in estimating vegetation biochemical and biophysical attributes, such as chlorophyll, leaf area index (LAI) and leaf water content [32,33,34,35]. Grassland AGB can be expressed as the product of LAI and leaf dry matter content (DMC) (AGB = DMC × LAI) [18], and DMC and LAI can be inversely calculated by the PROSAIL (PROSPECT + SAIL) RTM model. Based on the above definition, some studies have carried out the inversion of grassland AGB. Quan et al. [18] inversed LAI and DMC to estimate grassland AGB using the PROSAIL model and spectral data from Landsat-8 imagery. The statistical relationship between the measured equivalent water thickness (EWT) and DMC was adopted to filter unrealistic parameter combinations to minimize the RTM ill-posed problem and achieved good accuracy (R2 = 0.64, RMSE = 42.67 g/m2). He et al. [31] retrieved grassland AGB in the Zoige Plateau of China based on the PROSAIL model with the MODIS product (RMSE = 60.06 g/m2 and R-RMSE = 18.1%).
A new method that couples RTM and regression models have been proposed for retrieving vegetation biochemical parameters owing to the complexity of RTM [36,37]. In this method, a simulated dataset derived from the RTM model becomes the primary data source and is regarded as the training data of the regression models for performing the prediction of vegetation attributes. This methodology can clarify the relationship between the vegetation parameters and spectral information while acquiring a high inversion accuracy by effectively combining the advantages of these two methods. This algorithm has shown unique advantages in some studies for estimating the biochemical parameters of vegetation [38,39]. However, few studies have investigated the use of this inversion technique when coupling RTM and regression models for mapping grassland AGB.
Therefore, in order to explore the grassland AGB estimation method with high accuracy and viable universality based on the combination of RTM and regression models, the specific objectives of this study were as follows: (1) perform PROSAIL model forward modeling to establish the simulated multispectral reflectance dataset of the grassland, (2) determine the sensitive bands and optimize the spectral indices based on the simulated dataset, which can be used as the predictors of subsequent inversion, and (3) compare the performance of the PROSAIL model separately when coupled with different regression algorithms (partial least square (PLSR), RF, and SVM) and that of the lookup-table (LUT) method for grassland AGB estimation using the AGB measurements.

2. Materials and Methods

2.1. Study Area

The study area was the West Ujimqin grassland, situated on the east of Xilin Gol League, Inner Mongolia Autonomous Region, China (43°57′–45°23′N, 116°21′–119°31′E) with a total area of approximately 22,500 km2 (Figure 1). The elevation of the West Ujimqin grassland ranges from 835 m to 1957 m. This area has a temperate continental climate with an annual average temperature of approximately 1 °C. The annual mean precipitation varies between 345 mm and 350 mm and is mostly concentrated in July and August. The study area is abundant in grass species, including Artemisia frigida, Artemisia halodendron, Caragana microphylla Lam, Carex spp. and Leymus chinensis.

2.2. Datasets

2.2.1. Field Data Collection

The field measurements were carried out in the study area from 5 to 18 July 2015. Around the central location of the study region, sample plots were randomly selected according to subjective evaluations and distributed as evenly as possible. Forty-six 30 × 30 m plots were determined. Five subplots (1 × 1 m) were separately set at the center; four corners of each plot, and five pictures were taken in each of them. In each subplot, a GPS was used for positioning, and then destructive sampling was conducted for the aboveground grass by cutting all the grass. After removing the soil, gravel and other sundries adhering to the samples, they then were put into sealed plastic bags and transported to the laboratory, dried to a constant weight at 65 °C, and finally weighed to obtain the AGB. The AGB of each sample plot was expressed by the average value of the AGB of the five subplots.

2.2.2. Satellite Images Acquisition and Preprocessing

During the field measurements, the multispectral data observed in the study area were from Landsat-8 OLI (Operational Land Imager) products, which were obtained from the United States Geological Survey (USGS) (http://glovis.usgs.gov/ (accessed on 12 March 2022)). A total of two 185 × 185 km Landsat-8 OLI scenes were obtained to fully cover the study area. Only images with less than 10% cloud were selected as remote sensing data (5 July 2015 and 12 July 2015). The images were processed using the ENVI 5.3 software. Radiometric calibration was performed to obtain the top of the atmosphere radiance transformed from the digital number (DN). The FLAASH tool was subsequently used to perform atmospheric correction to convert the radiance value into surface reflectance [40]. Additionally, the FMASK algorithm was operated to detect and mask clouds and cloud shadows in the image. Finally, the two tiles were mosaicked together into one image, which was then clipped according to the spatial extent of the study area.

2.3. Methods

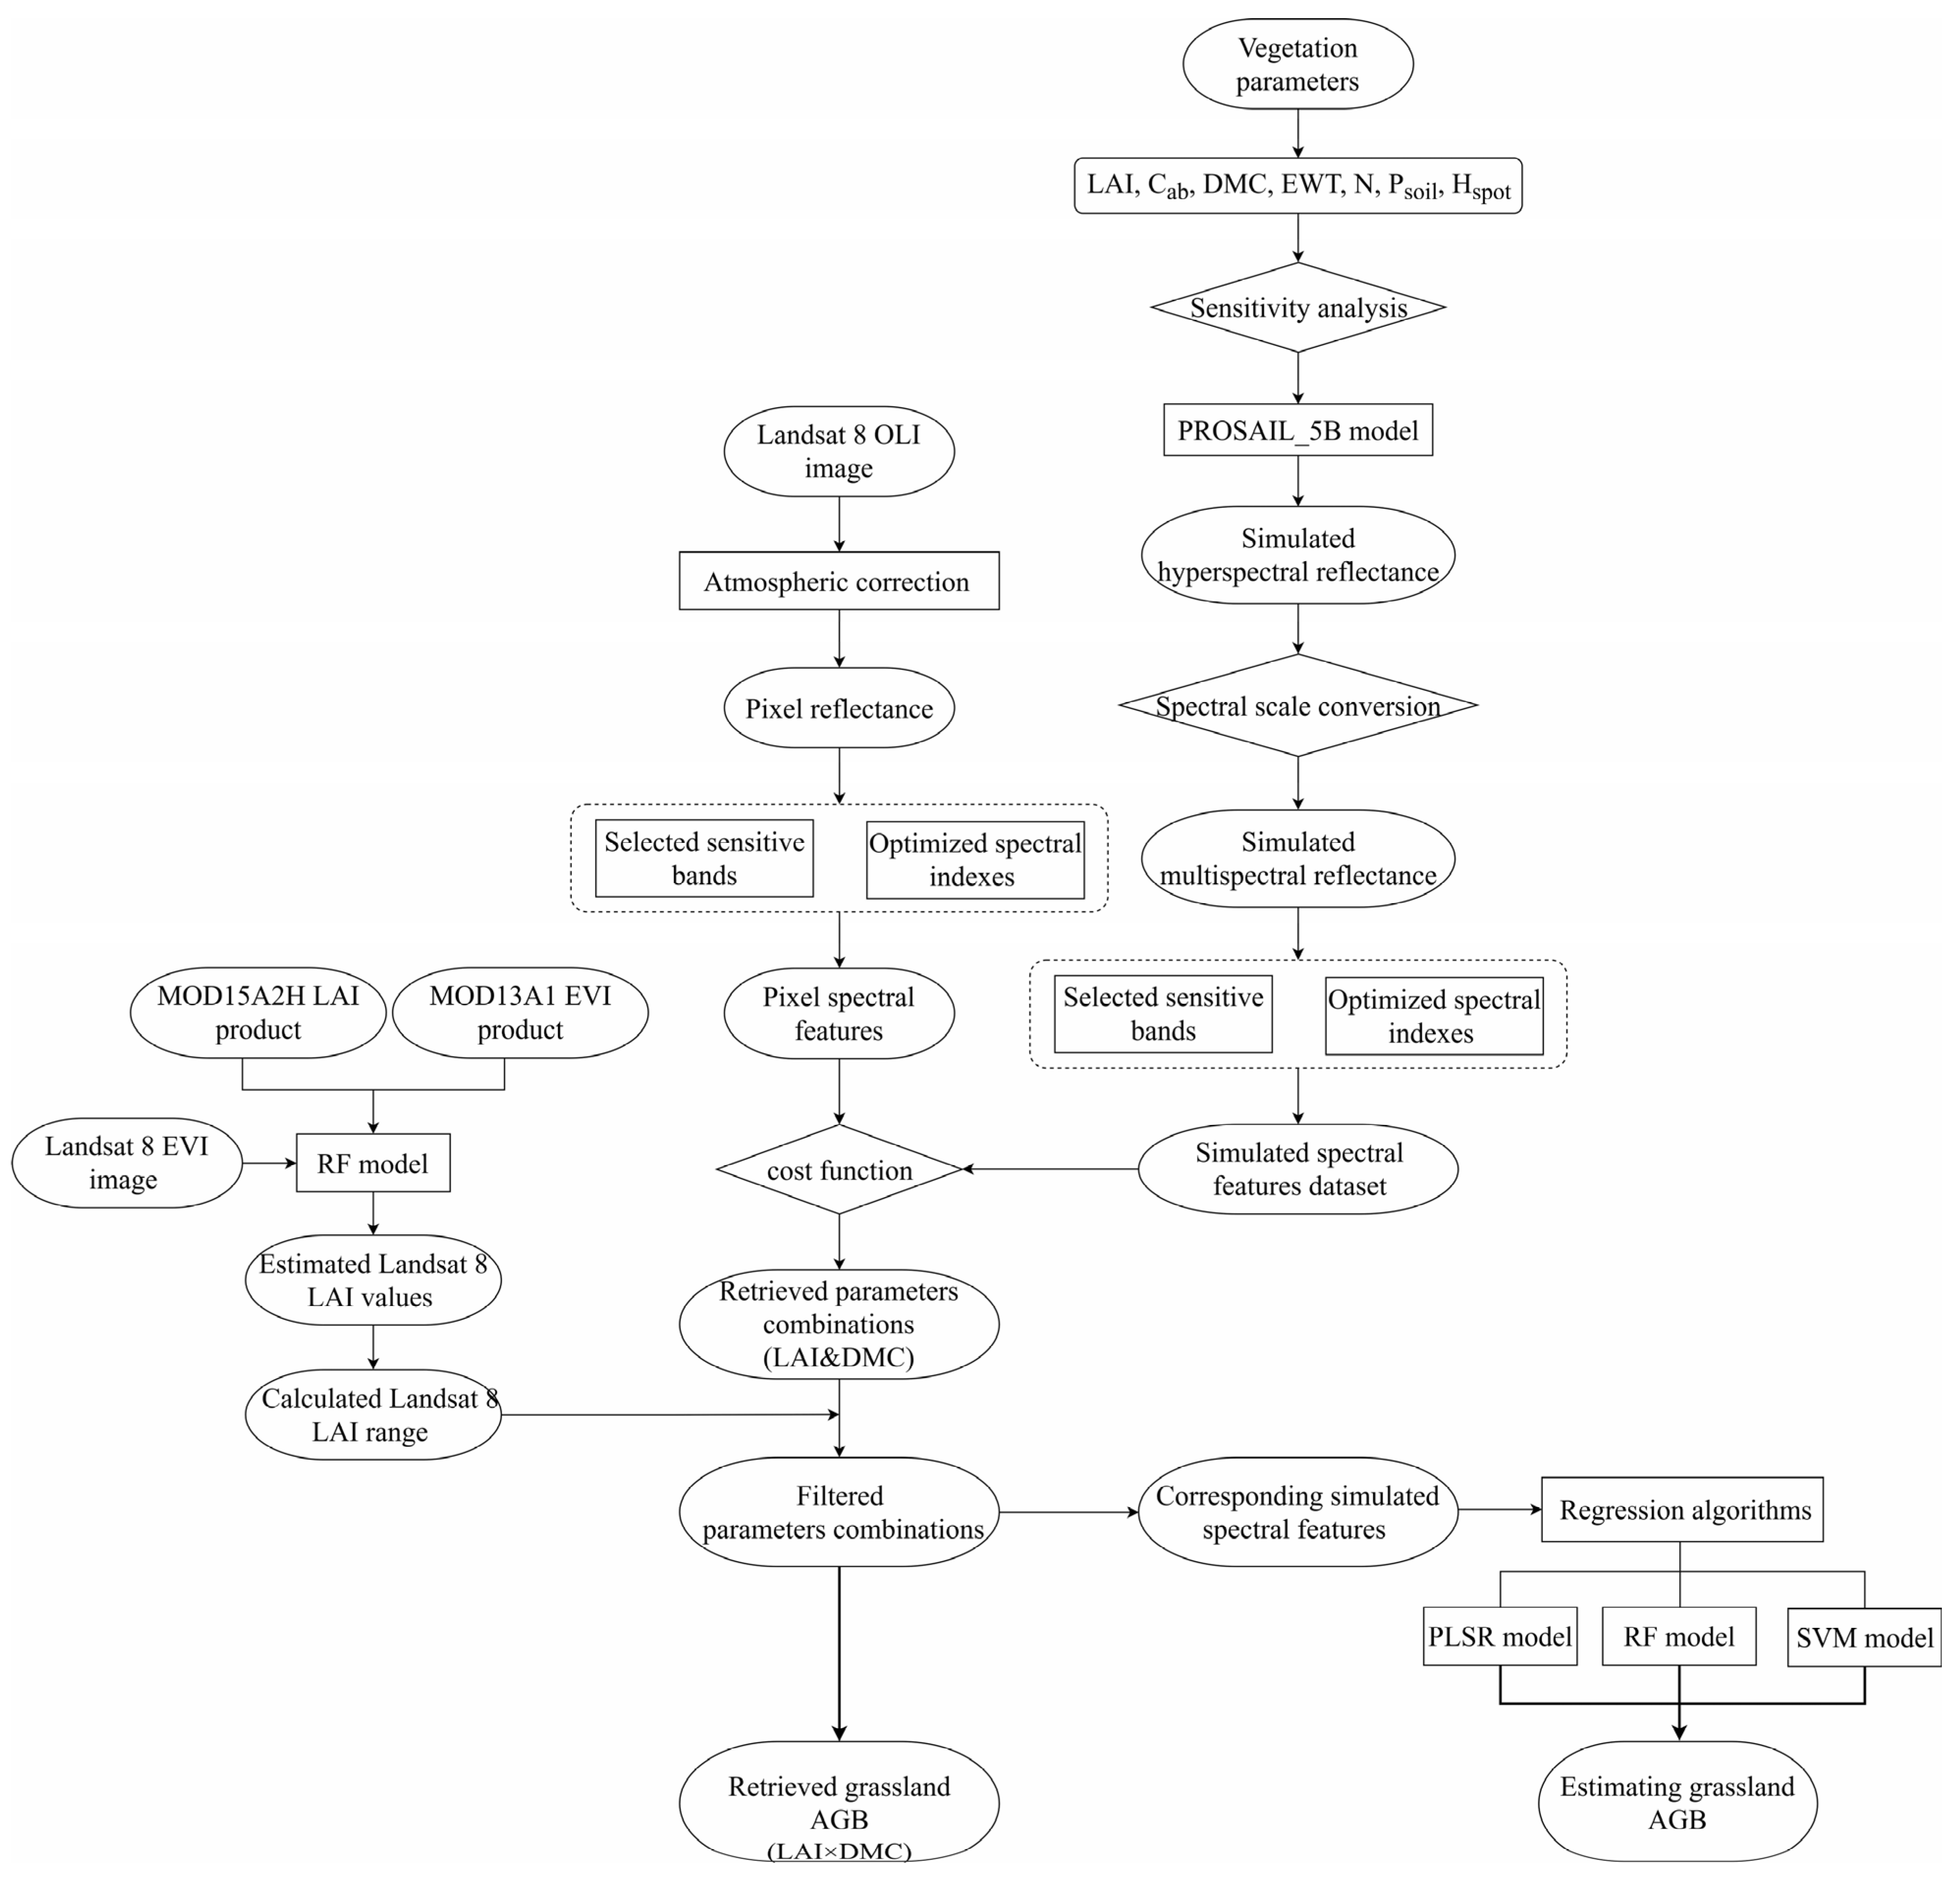
A schematic representation of the methodology in this study is given in Figure 2. The global sensitivity analysis for the input parameters in the PROSAIL_5B model was first performed to recalibrate their values. On this basis, a simulated canopy reflectance dataset was established (Section 2.3.1). The simulated canopy spectra were converted to the pixel spectra of Landsat-8 OLI, and the subsequent analyses were implemented using simulated multispectral data (Section 2.3.1). The sensitive spectral bands and indices were selected and optimized according to the correlation analysis (Section 2.3.1). The LUT-based method was utilized to invert grassland AGB based on the observed and simulated spectral characteristics (Section 2.3.2). Finally, three different prediction models (PLSR, RF and SVM) were used on the basis of the LUT method to estimate grassland AGB (Section 2.3.3).

2.3.1. Construction of the Simulated Canopy Spectral Dataset

  • PROSAIL model
The PROSAIL model [41], coupled with the PROSPECT model [42] and the SAIL model [43], calculated the vegetation canopy reflectance in the whole spectral direction. In this study, the version of PROSAIL_5B resulting from a combination of PROSPECT_5B and 4SAIL was adopted [44]. In the PROSPECT_5B leaf optical properties model, the leaf reflectance and transmittance were calculated as a function of six parameters (Equation (1)) [45]. Then, these two parameters were input into the 4SAIL canopy reflectance model to simulate the canopy spectral (Equation (2)) [46]:
( ρ l , τ l ) = P R O S P E C T _ 5 B ( N , C a b , C c a r , C b r o w n , D M C , E W T )
ρ c = 4 S A I L ( L A I , ρ l , π l , L I D F a , L I D F b , H s p o t , P s o i l , θ v , θ s , θ z )
where ρ 1 is the leaf reflectance, τ 1 is the leaf transmittance and ρ c is canopy reflectance. The full names, symbols and units of all parameters required for the model are given in Table 1.
The PROSAIL model requires the involvement of many parameters. To reduce the amount of computation in the forward process, improve the inversion speed and ensure the accuracy of the simulation simultaneously, in this study, fixed values were set for some parameters based on the previous literature or field surveys, including the Leaf inclination distribution function (LIDF), leaf brown pigment (Cbrown), carotenoid content (Car) and geometric characteristics. The LIDF was determined by the average leaf slope (LIDFa) and the bimodality of the distribution (LIDFb). Six leaf inclination modes could be obtained according to the different combinations of the two parameters. LIDF does typically not influence the canopy reflectance; hence, it was fixed in a spherical mode (LIDFa = −0.35, LIDFb = −0.15) based on the field measurements of this study. The Cbrown was fixed to 0 since field sampling was conducted during the grass growth stage. Car was set at 8 μg/cm2 (the default value in the PROSAIL model) because its impact on LAI and DMC was negligible [18]. The geometric characteristics described by θs, θv, and θz were determined according to the Landsat-8 metadata information. The ranges of other parameters (LAI, N, Cab, DMC, EWT, Psoil and Hspot) were obtained from the literature and MOD15A2H product (Table 1). Their settings were recalibrated by sensitivity analysis (see Section 3.1) owing to the lack of measured data: the step size of the sensitive parameters was identified, and the values of the less sensitive parameters were fixed.
  • Sensitivity analysis
Global sensitivity analysis (GSA) was conducted to study the influences of the input parameters (LAI, N, Cab, DMC, EWT, Psoil and Hspot) and the interactions between different parameters on simulated canopy reflectance. The Sobol method is a global sensitivity analysis that applies the Monte Carlo algorithm for sampling, which is capable of obtaining the first-order, second-order and higher-order sensitivity of parameters based on the model decomposition [51]. In this study, the first-order sensitivity indices and total sensitivity indices were calculated, where the former represented the contribution of individual parameters to the model outputs, and the latter reflected the interactive influence among parameters [45]. To prevent the influence of insufficient samples and uneven distribution on the sensitivity analysis, 5000 samples were randomly generated by the Monte Carlo algorithm; then, the Sobol method was used for parameter sensitivity calculation.
  • Spectral scale conversion
According to different measurement scales, spectral data could be classified into three types: material spectrum, end element spectrum and pixel spectrum [52]. On the basis of our research’s purpose, it was necessary to convert the spectral scales. In this study, the simulated canopy reflectance in the study area was transformed into the pixel reflectance of Landsat-8 OLI. The simulated Landsat-8 OLI reflectance was derived with Equation (3) [53]:
R = λ 1 λ 2 R S R λ R P R O S A I L d λ λ 1 λ 2 R S R λ d λ
where R P R O S A I L is the simulated hyperspectral reflectance of the PROSAIL model and λ 1 and λ 2 are the band wavelength limits. R S R λ is the spectral response of the Landsat-8 OLI sensor (Figure 3).
  • Spectral indices
The vegetation indices could reduce the effects of interference factors such as the atmosphere, terrain, shadow and soil background with the purpose of highlighting vegetation information [54,55]. Therefore, RVI (ratio vegetation index) and NDVI (normalized difference vegetation index), which are widely used, were selected in this study. To enhance the performance of these two-band spectral indices and find the indicators that are significantly related to AGB, the band combination was changed from the original fixed red and near-infrared (NIR) band to all the possible two bands from simulated multispectral reflectance. Two types of spectral indices, RSI (ratio spectral index) and NDSI (normalized difference spectral index) [39], were considered. The calculation formulas were as follows (Equations (4) and (5)) [56]:
R S I = ρ i / ρ j
N D S I = ( ρ i ρ j ) / ( ρ i + ρ j )
where ρ is the spectral reflectance, and the subscripts i and j refer to the bands of Landsat-8 OLI ( i j ).

2.3.2. LUT-Based Method

The LUT method is a widely used inversion methodology of vegetation biophysical and biochemical parameters. It is a traversal optimization algorithm that effectively avoids the problem of local minima by directly comparing the simulated spectra with the remote-sensing image spectra [57]. During this inversion, a cost function was required to search for the optimal match between the optical image and simulated spectral features to identify the parameter combinations per pixel. RRMSE (relative root mean squared error) was used as the cost function (Equation (6)) [31]:
R R M S E = 1 n i = 1 n ( R i O L I R i L U T R i O L I ) 2
where n is the dimension of the spectral feature vector used. R i LUT and R i OLI are the simulated and observed spectral features (Landsat 8 OLI-based variables), respectively.
Due to the ill-posed problem during the inversion process, the parameter combination (DMC and LAI) corresponding to spectral features in the LUT that yielded the minimum RRMSE was not always the best solution [58]. Therefore, to alleviate this problem, we investigated the use of the multiple solutions method, which considers the best 50 to 500 LUT entries (a step size of 50) as the retrieved parameter combinations. However, there may still be some unrealistic combinations in the retrieved parameter combinations obtained by the LUT-based method because of the ill-posed problem. Following the study of Quan et al. [18], which obtained good accuracy by estimating grassland AGB when LAI was constrained at a range to filter unrealistic combinations using MODIS products. The MOD15A2H product is an 8-day comprehensive dataset with 500 m spatial resolution [59]. The accuracy that the LAI value provides has been evaluated by [60,61,62]. In this study, therefore, the LAI range of the Landsat-8 image was estimated based on MOD15A2H and MOD13A1 products. MOD15A2H and MOD13A1 products (spatial resolution: 500 m) in the study area during the field measurements were downloaded from the USGS. LAI and EVI within the vegetation coverage in the study area were first extracted from these two products to yield a dataset consisting of 10,947 entries, of which 70% were used as the training set and the rest as a testing set. LAI and EVI within the vegetation coverage in the study area were first extracted from these two products to yield a dataset consisting of 10,947 entries, of which 70% were used as the training set and the rest as a testing set. Additionally, the model between LAI and EVI was trained by the RF algorithm, where LAI was the response variable, and EVI was the predictor. The trained model had R2 with 0.89 and RMSE with 0.32. Then, the EVI value for each pixel (spatial resolution: 30 m) was derived with the bands of Landsat-8 OLI (Equation (7)):
EVI = 2.5 × ρ NIR ρ red ρ NIR + 6 × ρ red 7.5 × ρ blue + 1
where ρ NIR , ρ red and ρ blue are the NIR band, the red band and the blue band, respectively. The calculated EVI values were input into the trained RF model to estimate the corresponding LAI values of Landsat-8 OLI (spatial resolution: 30 m). Finally, an LAI range was calculated by the estimated LAI value per pixel (0.8 × LAI, 1.2 × LAI) [18], and the combinations placed out of this range were removed from the retrieved parameter combinations. The average value of AGB (LAI × DMC) obtained from the remaining combinations was taken as the estimated AGB value of the pixel.

2.3.3. Regression Algorithms

Three regression algorithms were used to estimate the grassland AGB. These algorithms were PLSR, RF and SVM. To prevent a large uncertainty of the prediction results caused by the unrealistic spectral features in the regressing process, the practical simulated spectral features reserved in the LUT-based method were applied to train the models.
  • PLSR
PLSR is a commonly used multivariate regression algorithm for vegetation parameter estimation [63,64]. This technique is designed to alleviate multicollinearity and noise problems in the data [65]. PLSR concentrates many collinear variables on a few independent latent variables while eliminating variables with less information [66]. It has a similar principle to principal component regression (PCR), but with the difference that PCR only considers predictors in the decomposition process [66], while PLSR iteratively decomposes the response variables and predictors simultaneously to achieve the best fitting [63,66]. In this study, PLSR was used to develop a linear model between the AGB (response variable) and spectral characteristics (predictors). To avoid the over-fitting problem, we used the leave-one-out cross-validation approach [63].
  • RF
RF is a member of ensemble machine learning regression algorithms that predict a response variable (AGB) through a set of predictors (spectral characteristics) by generating many regression trees (forest) and taking the average value of the responses predicted from all trees as the result. In the forest, each regression tree is independently built by the bootstrap samples that only reserve two-thirds of the sample data [67]. At each node, the selection of predictors is based on a randomly chosen subset instead of all the predictors, which is a key feature for improving prediction performance [67]. RF has certain anti-interference to the noise in the training dataset and robustness against nonlinearity as well as over-fitting problems [68].
The model was optimized by tuning the following parameters with the aim of minimizing the error: ntree (the number of trees generated by the RF) and mtry (the number of predictors at each node). In this study, RF was implemented using the RF package in the R programming environment.
  • SVM
Support vector regression (SVR) is a method of SVM that can solve the problem of regression fitting, which minimizes the error of all training samples from the optimal hyperplane by finding an optimal classification surface [69]. Both linear and nonlinear regression predictions could be performed using SVR. It directly conducts linear regression to solve the linear problem. However, the kernel function was required to map the training samples to a high-dimensional space when solving the nonlinear problem, and then linear regression was performed. SVR can produce a relatively better prediction accuracy with a small sample compared to other algorithms [70]. In this study, the type of kernel function was the radial basis function (RBF), and the epsilon-SVR was selected as the SVM model.

2.3.4. Model Validation

To evaluate the performance of the above methods for estimating grassland AGB, the LUT-based method and the three constructed regression models were applied to the Landsat-8 image and were assessed using field observations. The coefficient of determination (R2), the root mean square error (RMSE) and relative root mean square error (RMSEr) (different from RRMSE in the LUT-based method) were used to evaluate the relationships between the measured and estimated AGB, and the evaluation indicator formulas were as follows (Equations (8)–(10)):
R 2 = 1 ( i = 1 n ( y m e a y e s t ) 2 ( i = 1 n ( y m e a y ¯ m e a ) 2
R M S E = ( i = 1 n ( y e s t y m e a ) 2 n
R M S E r ( % ) = i = 1 n ( y e s t y m e a ) 2 n × 100 y ¯ m e a
where y est is the estimated AGB, ymea and y ¯ mea are the measured AGB and the average value of the measured AGB, respectively. n is the number of field observations.

3. Results

3.1. Sensitivity Analysis

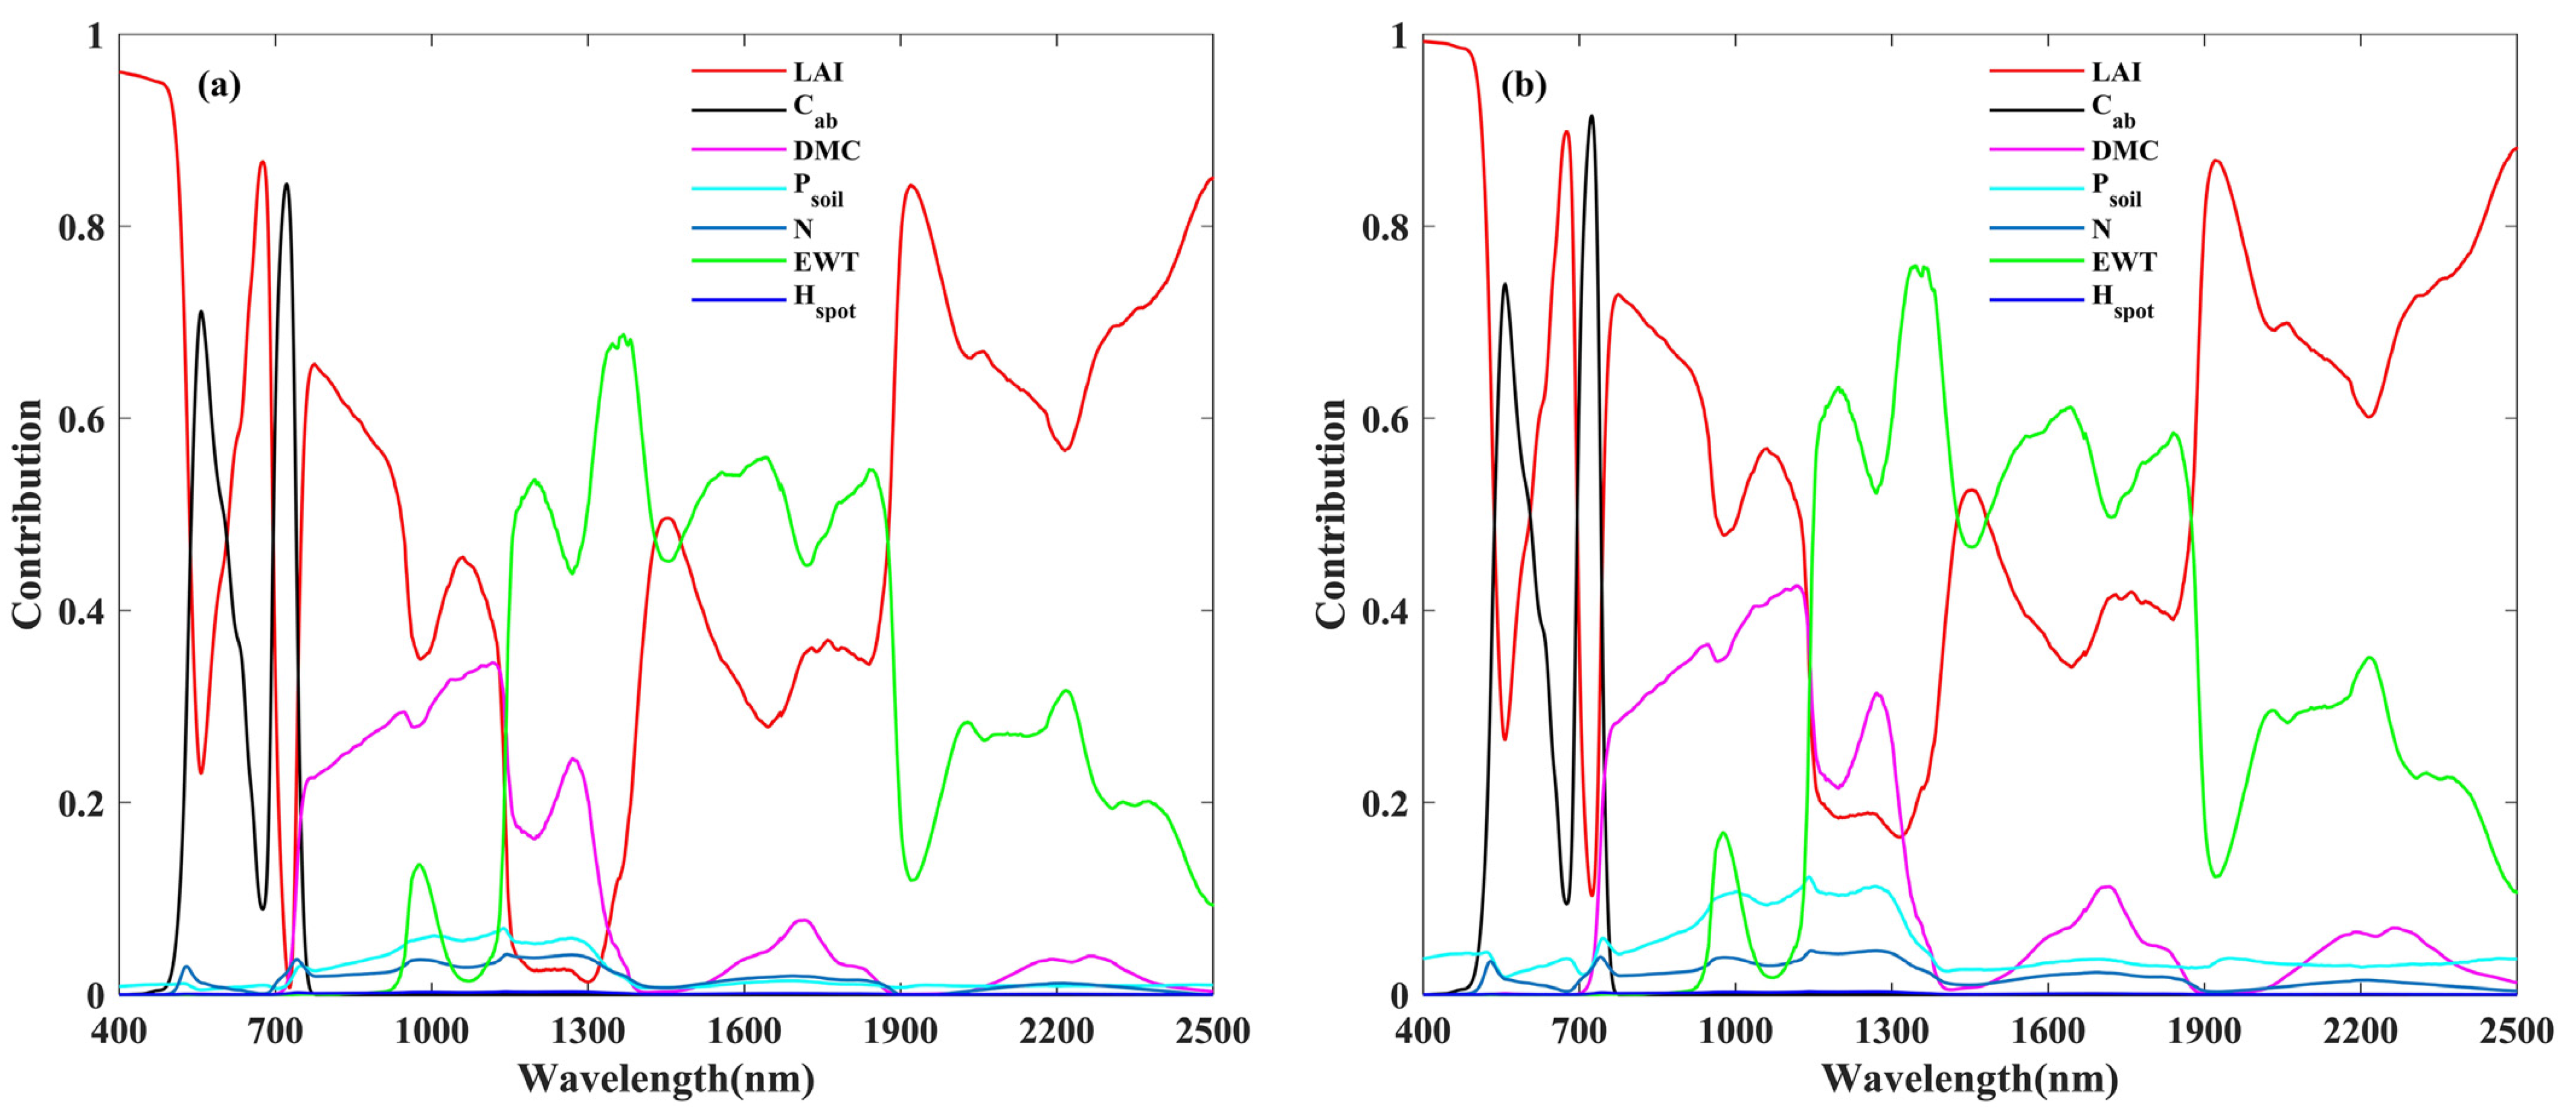
The global sensitivity curves for seven parameters (LAI, N, Cab, DMC, EWT, Psoil and Hspot) were obtained from Figure 4, including the first-order sensitivity coefficients (Figure 4a) and total sensitivity coefficients (Figure 4b). The results showed that the first-order sensitivity index of each parameter was slightly below the total sensitivity index. The sum of the Sobol first-order sensitivity contributions for these parameters was close to 100%, and the sum of the Sobol total sensitivity coefficients was marginally more than 100%, which indicated that their interactions had no evident effect on the variation of canopy reflectance.
The regions of the sensitive spectra varied significantly among the parameters (Figure 4a). The sensitivity of Cab fluctuated in the visible range (400–780 nm) and was mainly sensitive to 530–642 nm and the red range (692–744 nm) with an index above 0.3. The sensitivity of EWT had an opposite trend compared to that of Cab. Obvious changes existed in the NIR region (780–2500 nm), in which its contribution was more than 0.4 within 1149–1882 nm. As two key parameters for calculating grassland AGB, LAI was highly sensitive to 400–525 nm, 658–689 nm, 1893–1998 nm and 2329–2500 nm with a contribution above 0.7. DMC’s sensitivity index, which fluctuated continuously between 0–0.35 and was more sensitive to 753–1152 nm and 1236–1301 nm in the NIR range, with the contribution rate reaching more than 20%. The sensitivity indices of Psoil, N, and Hspot within the whole spectral range were below 0.1, indicating that they were extremely insensitive to the overall canopy reflectance (400–2500 nm).
Based on the above analysis, Cab, LAI, DMC and EWT were identified as sensitive parameters that contributed greatly to the grassland canopy reflectance; their values were set in certain step sizes: the step size of LAI and DMC was set as small as possible, and the settings of Cab and EWT were relatively large because they had less influence on the target variable (AGB). Whereas N, Psoil and Hspot were determined to be insensitive parameters, they were set as fixed values according to [31,46,50], respectively. The final calibration of the seven model parameters is shown in Table 2. As a result, the fixed value or step size of all input parameters required for the PROSAIL model was identified (Table 1 and Table 2). Additionally, the simulated spectral dataset was generated based on the PROSAIL model, containing 46,800 simulated spectral and corresponding parameter combinations.

3.2. Spectral Scale Conversion and Correlation Analysis

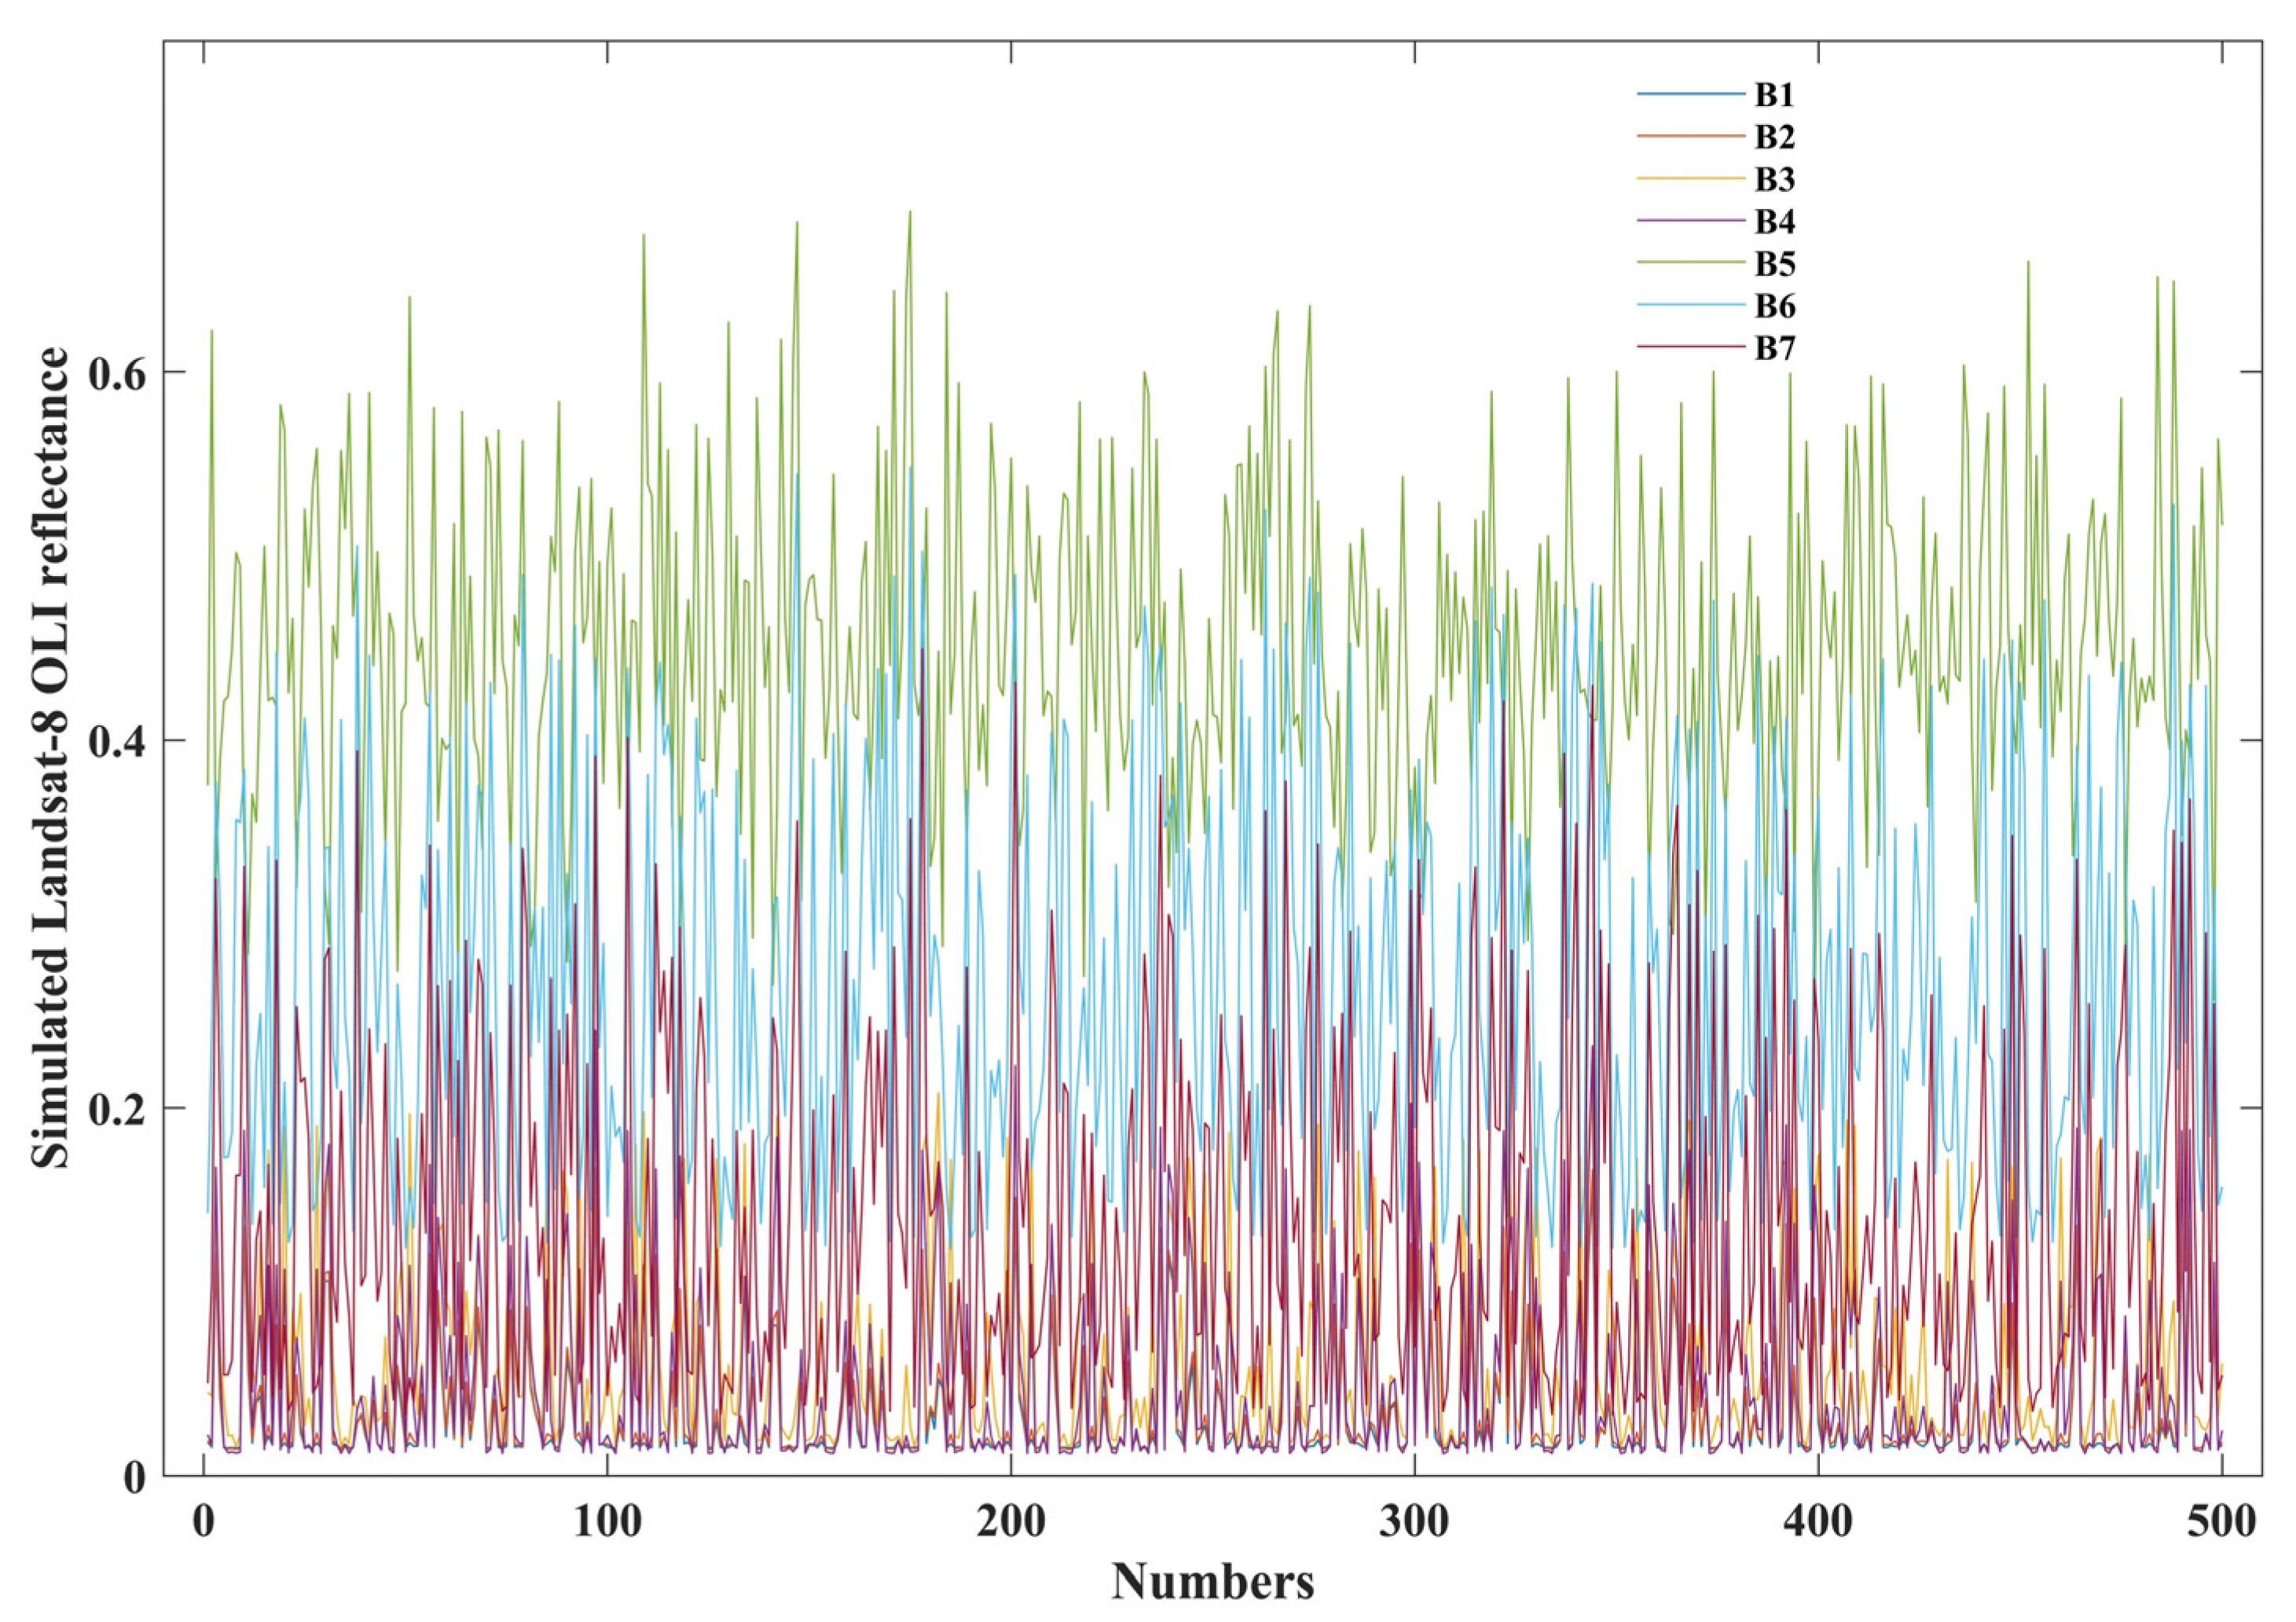
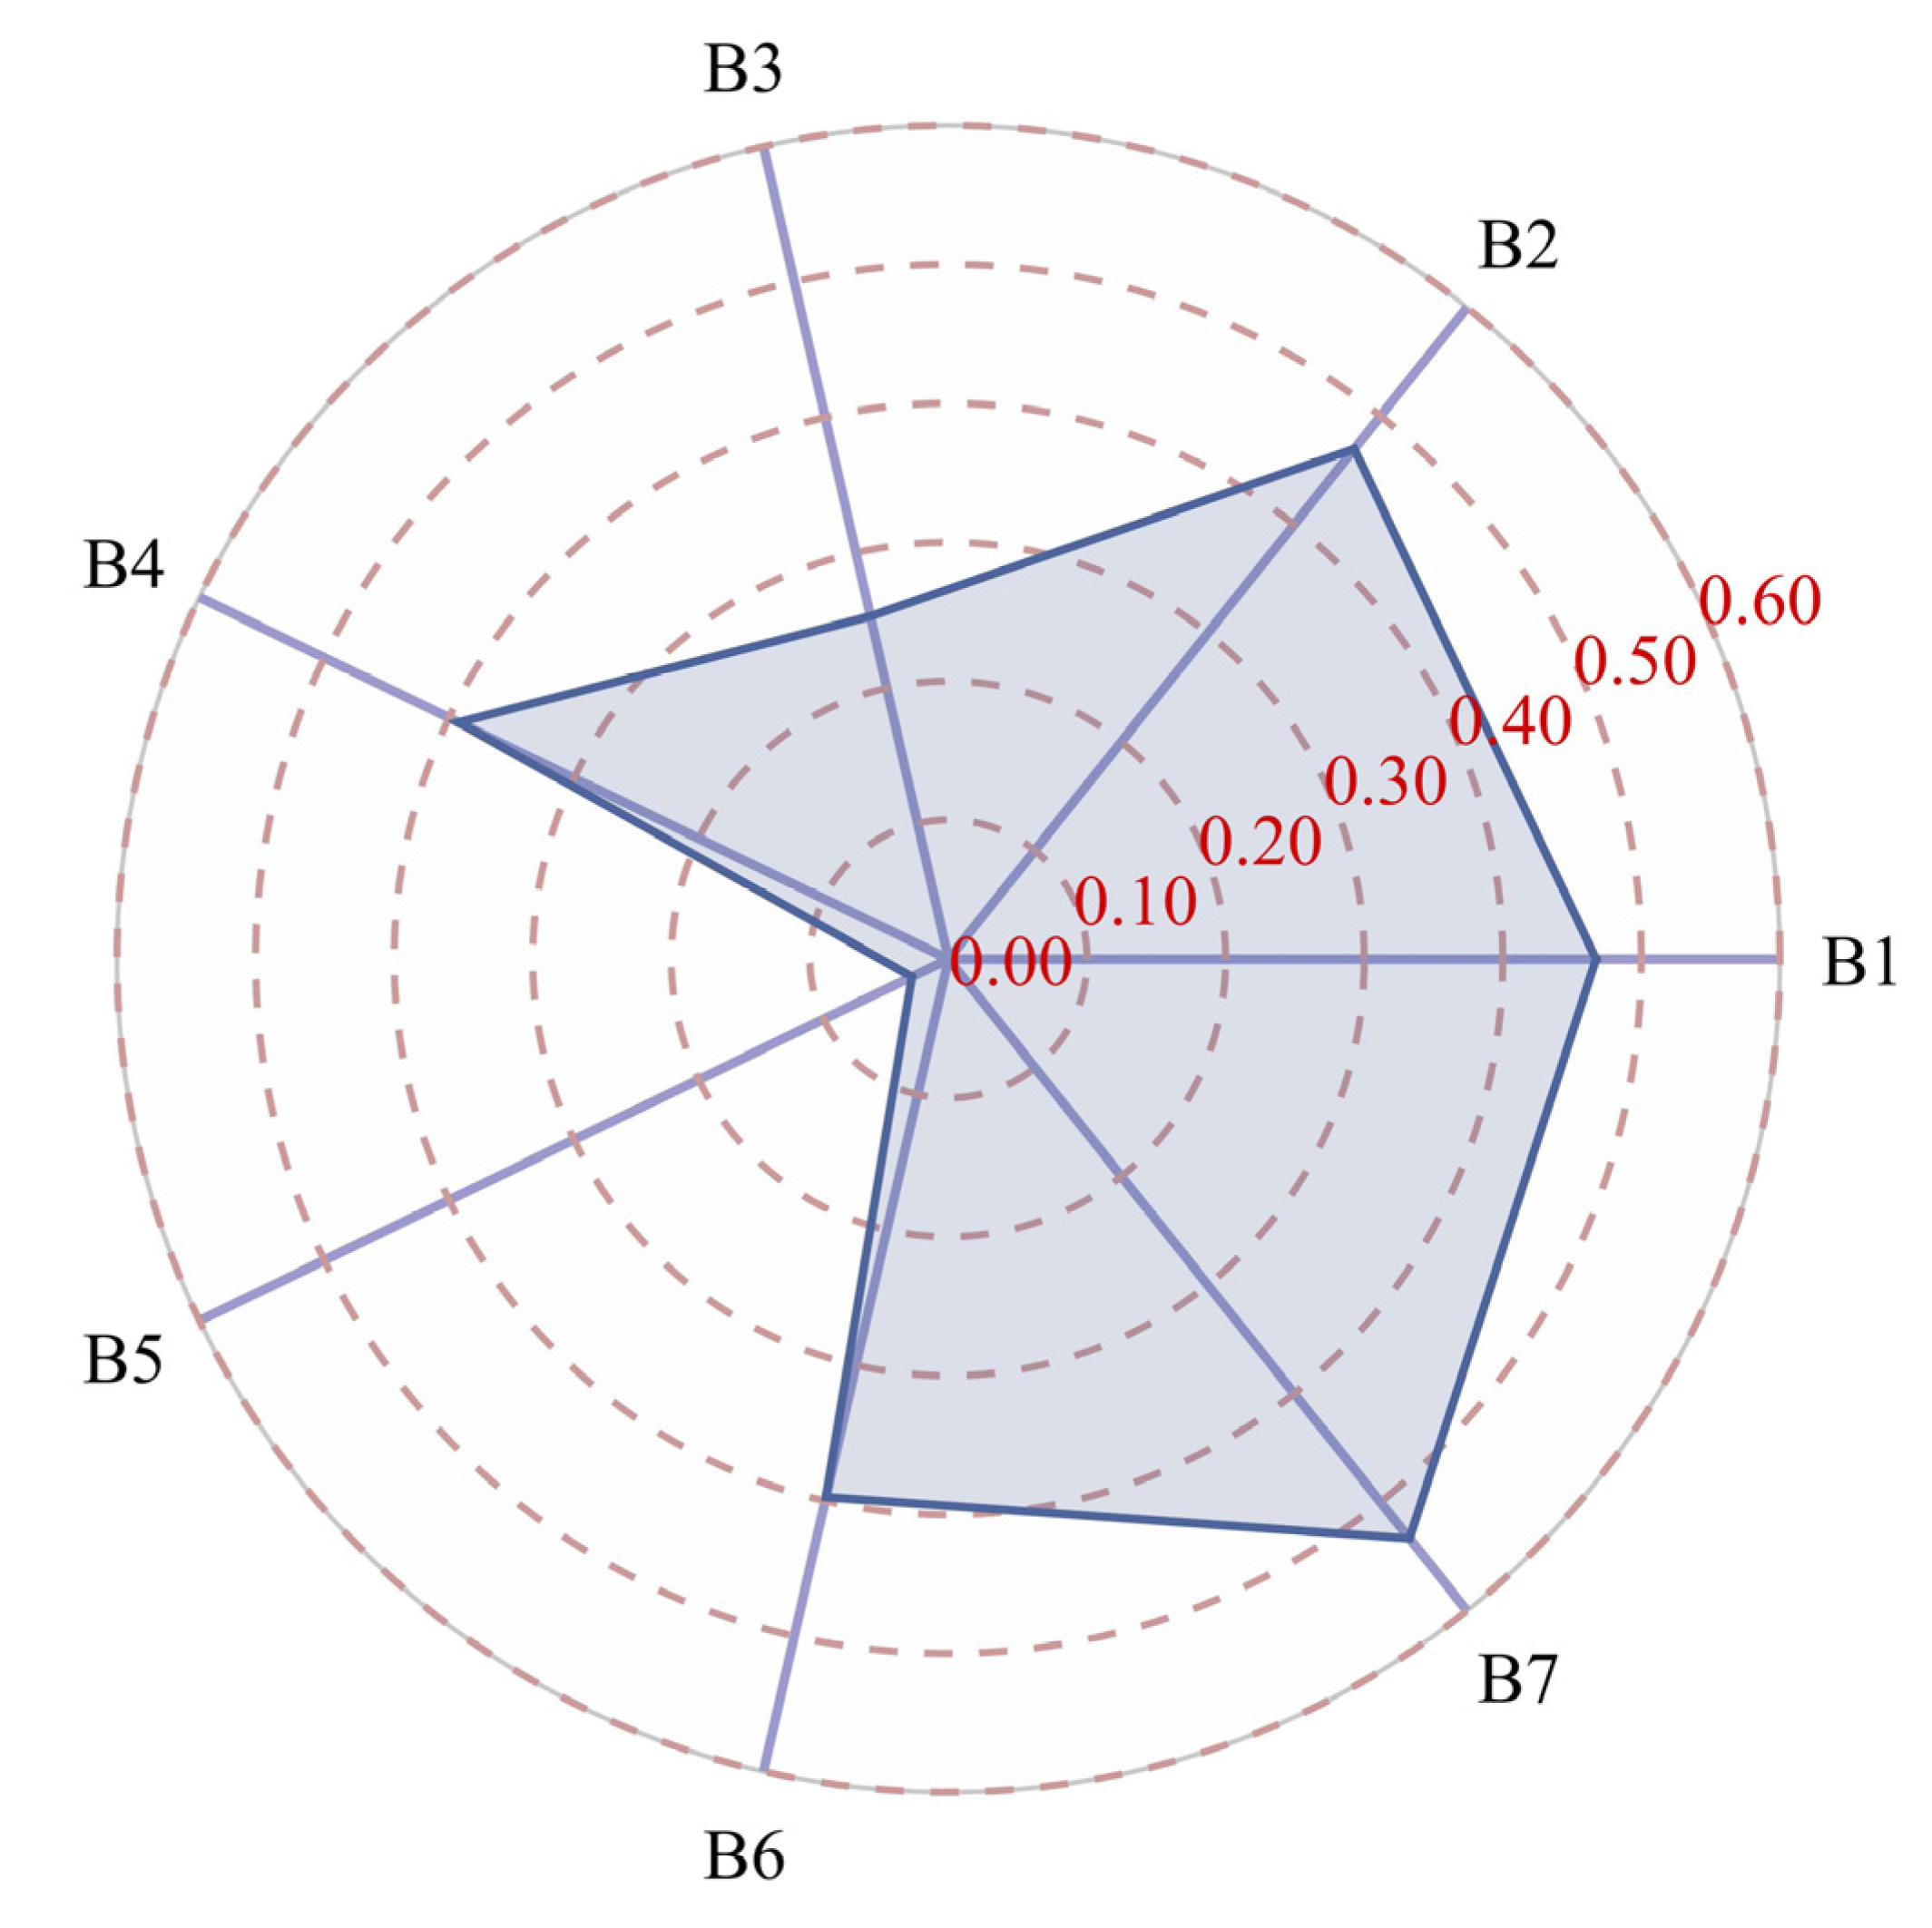
The simulated multispectral reflectance of Landsat-8 OLI (B1, B2, B3, B4, B5, B6, B7) was generated from the simulated hyperspectral reflectance based on the spectral response functions. The reflectance of seven bands in the simulated Landsat-8 OLI spectral dataset is shown in Figure 5 (500 randomly selected entries). Correlations were analyzed between the simulated spectral bands and AGB. B1, B2 and B7 revealed a high correlation with AGB among the single bands with correlation coefficients (R) that reached more than 0.45 at a p-value < 0.001 (Figure 6).
NDSI and RSI were calculated by combining the simulated reflectance of the seven bands (21 combinations in total). The correlation analysis between these spectral indices and AGB was conducted, and the correlation matrix plots presented AGB-sensitive spectral indices. As shown in Figure 7, NDSIb3, b4, NDSIb5, b6, NDSIb5, b7, NDSIb6, b7 and RSIb3, b4, RSIb5, b6, RSIb5, b7, RSIb6, b7 showed a strong correlation with AGB, and all the correlation coefficients reached more than 0.40 at p < 0.001.
In summary, the three spectral bands (B1, B2 and B7) and eight spectral indices (NDSIb3, b4, NDSIb5, b6, NDSIb5, b7, NDSIb6, b7 and RSIb3, b4, RSIb5, b6, RSIb5, b7, RSIb6, b7) that significantly correlated with AGB were chosen to establish the models for estimating AGB in this study (Table 3).

3.3. AGB Model Performance

As described in Section 3.2, the selected spectral bands and indices and corresponding grassland AGB from the simulated multispectral reflectance dataset, which was constructed based on the PROSAIL model, were used to form a new dataset to estimate AGB in the study area based on LUT-based and regression algorithms. Their estimation accuracies were validated against 46 AGB field measurements.

3.3.1. Estimation Accuracy Based on LUT-Based Method

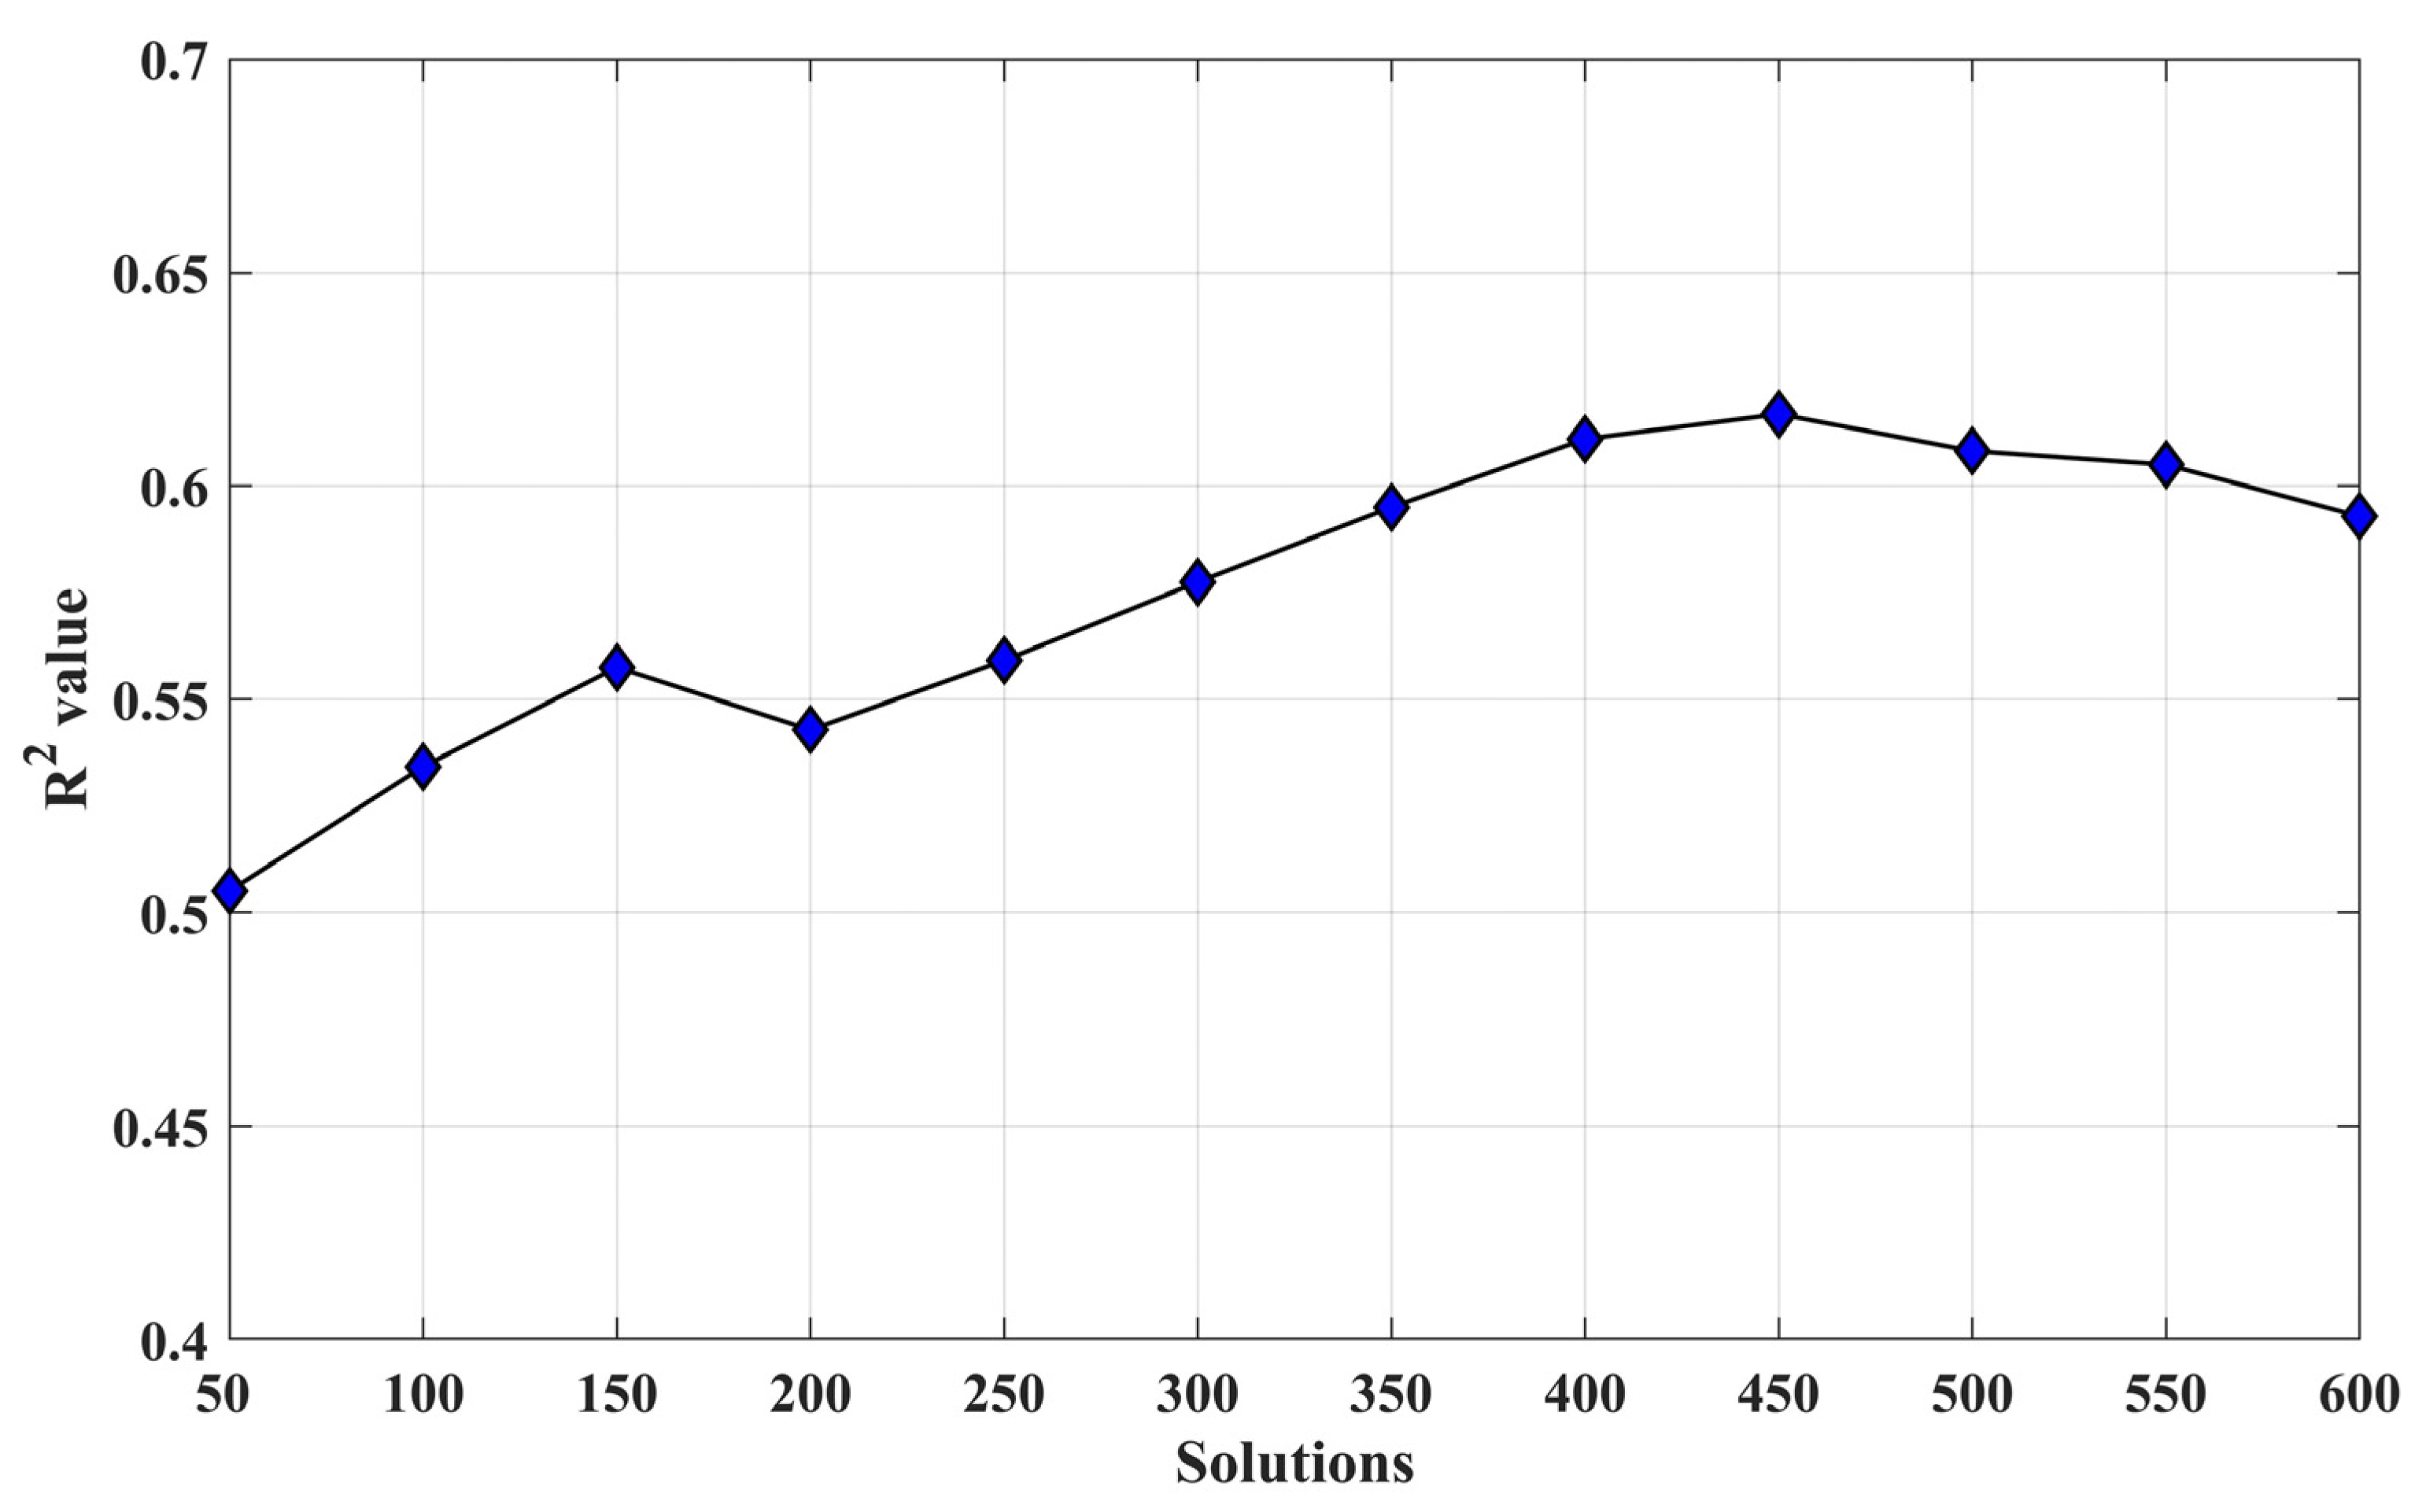
In the LUT-based method, RRMSE (Equation (6)) was used as a cost function, where the feature vector referred to the 11 spectral features listed in Table 3 (i.e., n = 11, three spectral bands and eight spectral indices). For the observed spectral characteristics per pixel, LUT was sorted in ascending order of RRMSE. We tested the best 50 to 600 LUT entries (a step size of 50) as the retrieved parameter combinations (a total of 12 multiple solutions). The accuracies of the different solutions for estimating AGB are presented in Figure 8. The results demonstrated that the first 450 solutions showed the best accuracy with R2 = 0.62, which was regarded as the best measure regarding the LUT-based method in this study.
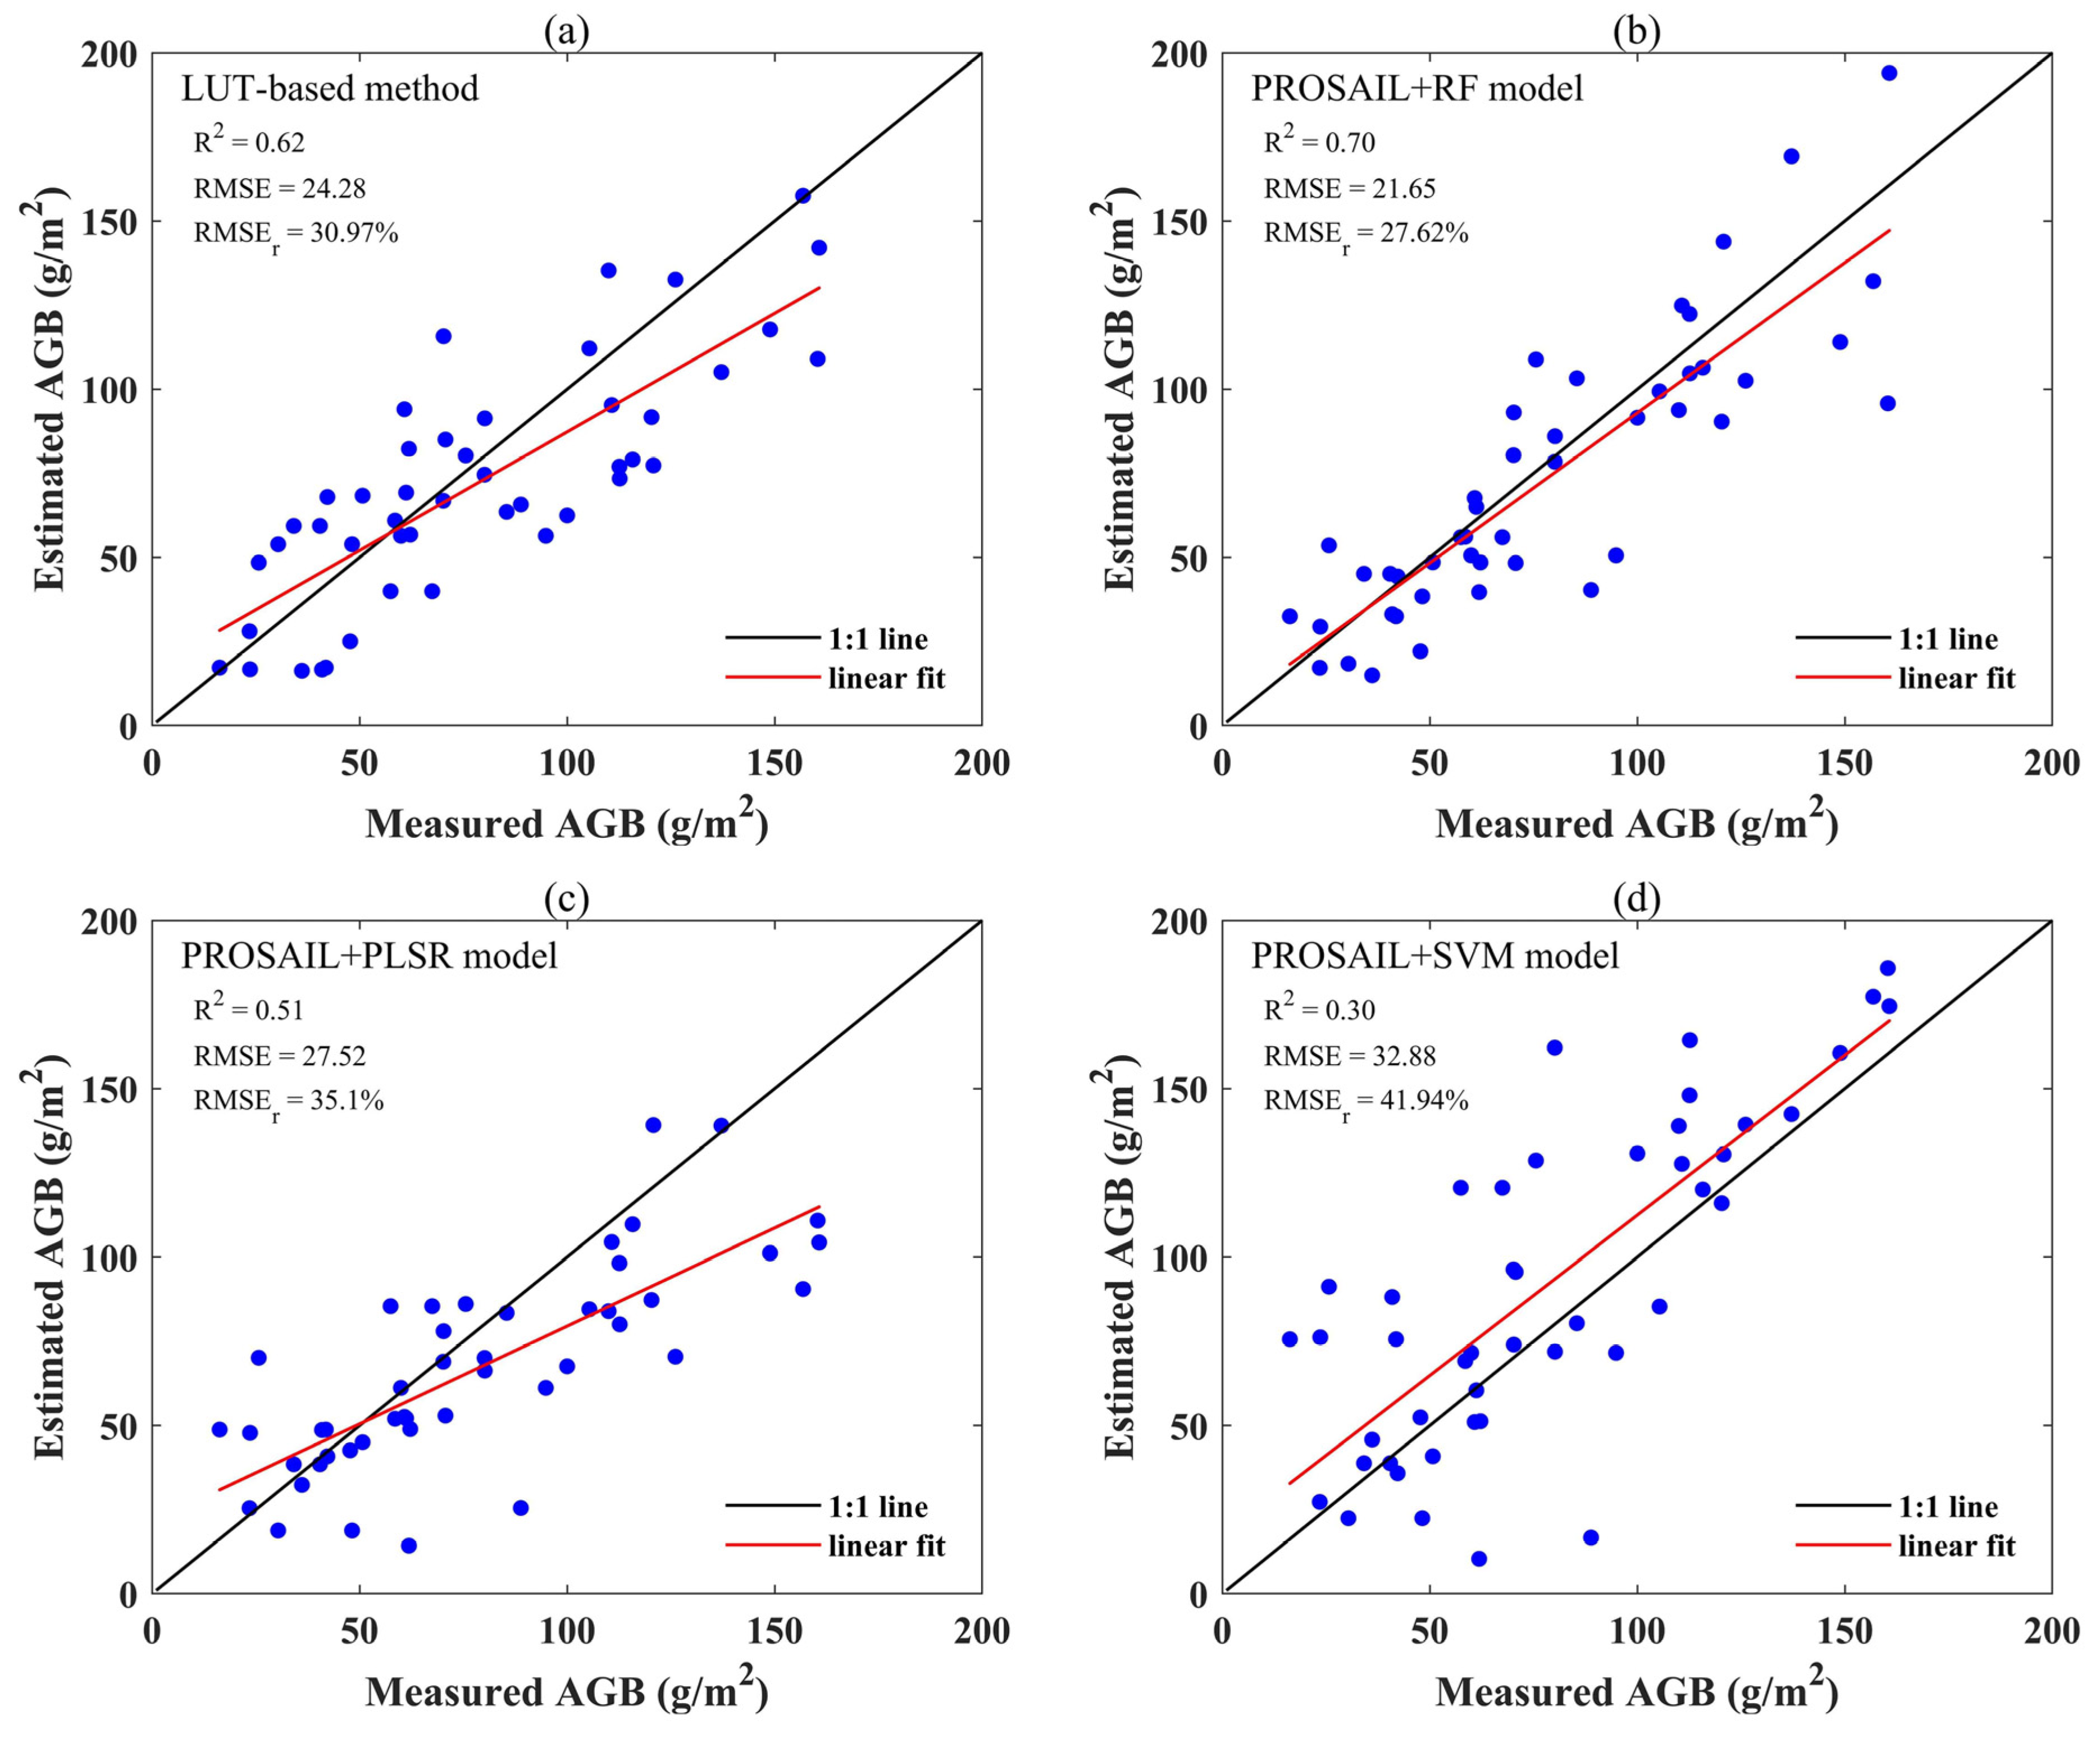
Figure 9a shows the validation accuracy based on the LUT-based method with an R2 value of 0.62, an RMSE of 24.28 g/m2 and an RMSEr of 30.97%. However, it was found that the retrieved AGB values were marginally underestimated in the range of more than approximately 100 g/m2. This was probably because the spectra of the soil used in the PROSAIL model did not exactly match the actual soil situation in this region.

3.3.2. Estimation Accuracy Based on PROSAIL and Regression Algorithms

A total of 18544 simulated spectral features and corresponding parameter combinations (spectral features are listed in Table 3) were reserved in the LUT-based method, of which 70% were used for training and 30% for testing to obtain the best estimation model. Figure 9b–d shows the accuracy results of the PROSAIL model when coupled with these regression algorithms using the 46 measured AGB values. The scatter plots of measured AGB and estimated AGB showed obvious differences among the three algorithms for estimating AGB. The top-performing method was the PROSAIL + RF model, which obtained the highest R2 (0.70) and the lowest RMSE (21.65 g/m2) and RMSEr (27.62%) compared to the other two regression models. Additionally, the accuracy of the PROSAIL + RF model was also better than that of the LUT-based method. The differences in R2 and RMSE between the PROSAIL + RF and LUT-based methods were approximately 0.08 and 2.63 g/m2, respectively. Figure 9b shows that the measured versus estimated AGB based on the PROSAIL + RF model was relatively and evenly distributed around the 1:1 line. This was followed by the PROSAIL + PLSR algorithm (R2 = 0.51, RMSE = 27.52 g/m2, RMSEr = 35.10%), which was poorer than the LUT-based method. In addition, the predicted AGB values based on the PROSAIL + PLSR model were mostly underestimated to various degrees, indicating that the saturation problem occurred (Figure 9c). The PROSAIL + SVM model performed relatively worse compared to all other algorithms (R2 = 0.30, RMSE = 32.88 g/m2, RMSEr = 41.94%). However, the saturation phenomenon was not observed for the high AGB values (Figure 9d).

3.3.3. Spatial Distribution of Grassland AGB

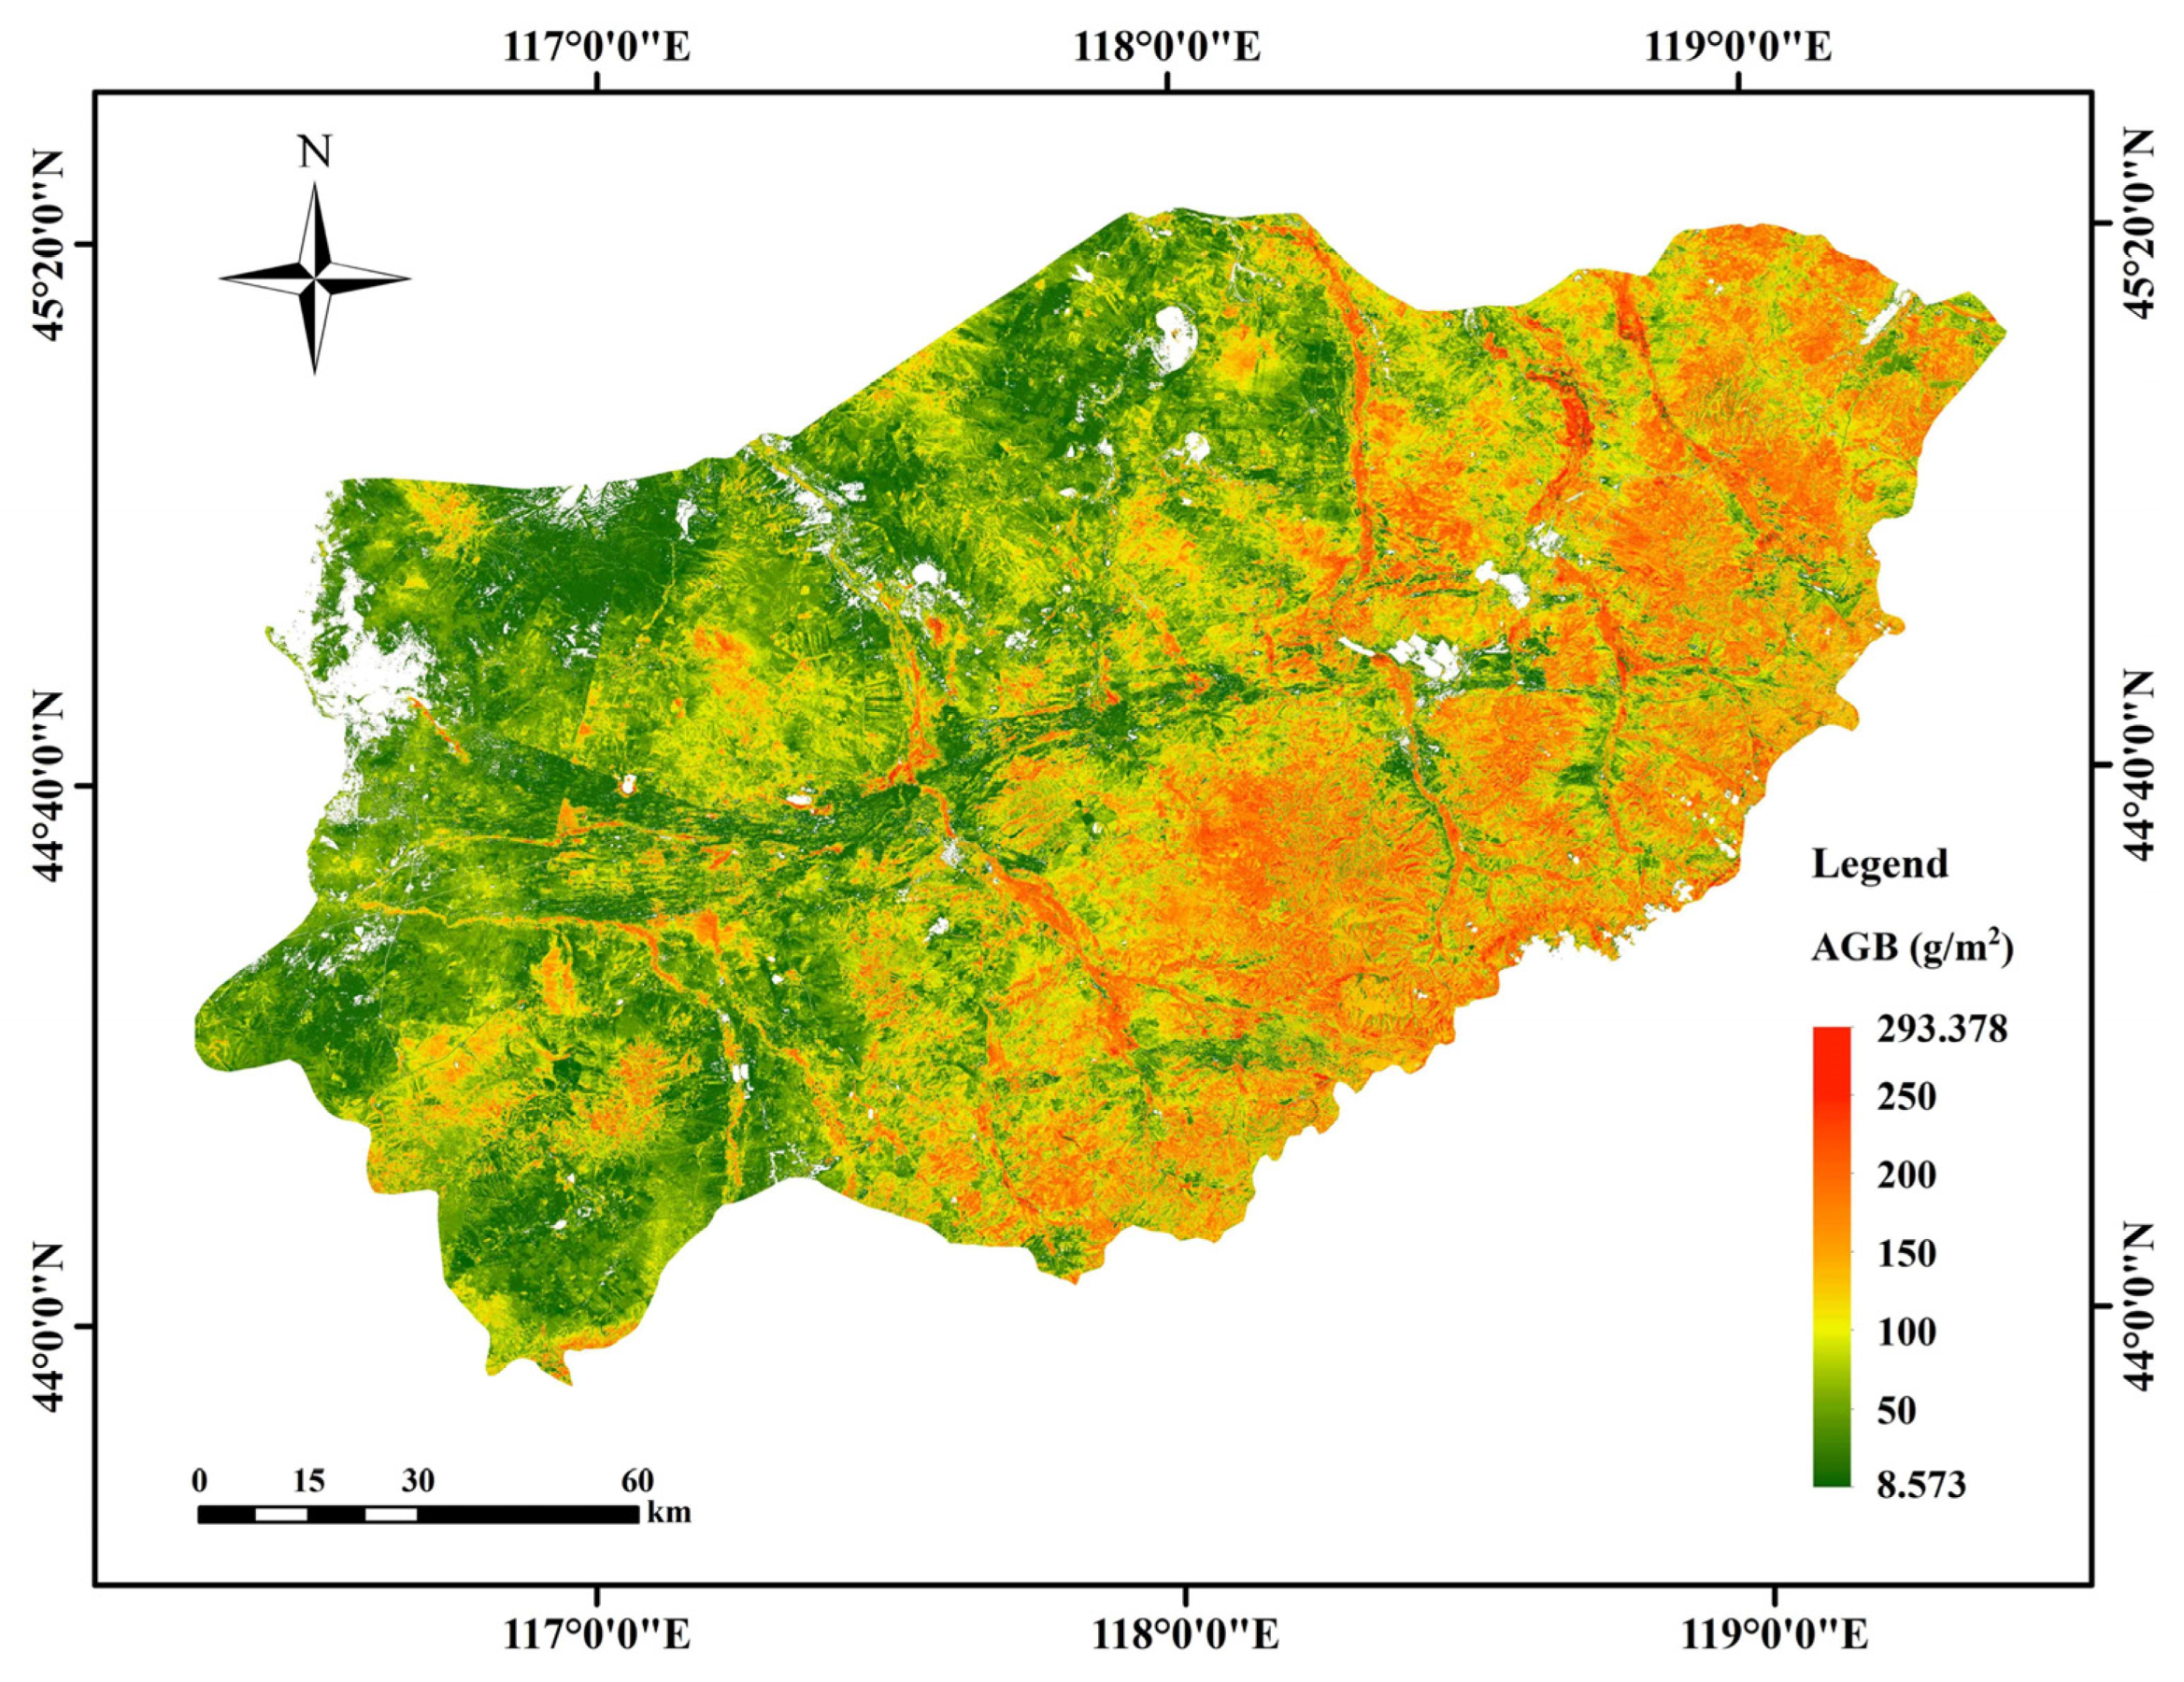
The estimation map of grassland AGB was mapped by coupling the PROSAIL model and RF algorithm on the basis of the LUT method in the study area (Figure 10). The estimated values varied from 8.573 g/m2 to 293.378 g/m2. We masked the pixels (white part of Figure 10) in non-grassland areas such as clouds, rivers and towns, which were not involved in AGB inversion. The spatial distribution of retrieved AGB had significant heterogeneity and showed the characteristic of increasing from west to east.

4. Discussion

4.1. The Simulated Dataset Based on PROSAIL Model

In this study, LAI, Cab, EWT and DMC were determined as sensitive to canopy reflectance among the PROSAIL model parameters through global sensitivity analysis, while N, Psoil and Hspot had fewer sensitivity indices within the whole spectral range. The sensitivity index is an effective indicator for measuring the impact of the input parameters on the output of a model. Sawut et al. [39] fixed DMC, Hspot, N and EWT during simulations of the Suaeda salsa canopy reflectance based on the PROSAIL model, while sensitive parameters such as Bt (Betalain content), Psoil, LAI, and Cab set to different values by means of step size. The Sentinel-2A reflectance was further simulated based on the canopy reflectance, and reliable Bt inversion results were obtained (R2 = 0.68). Jing et al. [71] fixed five insensitive parameters based on the sensitivity analysis of the PROSAIL model to reduce the complexity and instability of LAI estimation. A total of 46,800 simulated grassland canopy reflectance of our study were yielded based on different combinations of PROSAIL input parameters. To perform the inversion of AGB from the satellite images, the simulated Landsat-8 OLI reflectance dataset was further generated with spectral response functions. The simulated B1, B2 and B7 bands showed a high correlation with AGB, reaching more than 0.45 (p < 0.001). Additionally, RSI and NDSI were calculated based on simulated multispectral reflectance. The inversion accuracy based on traditional vegetation indices largely relied on the selected bands [72]. Although many vegetation indices have been studied, some bands are still seldom or never used together. In order to identify the best-performing spectral bands in the inversion of grassland AGB, therefore, it was necessary to test all the possible two-band combinations from simulated multispectral reflectance. Many studies have proved that spectral indices show great advantages in estimating vegetation biophysical and biochemical attributes [39,73,74,75]. The correlation analysis results of our study showed that the spectral indices NDSIb3,b4, NDSIb5,b6, NDSIb5,b7, NDSIb6,b7 and RSIb3,b4, RSIb5,b6, RSIb5,b7, RSIb6,b7 provided strong correlation(R > 0.4, p < 0.001). The 11 sensitive spectral features of AGB were successfully obtained (Table 3).

4.2. Dataset Optimization Based on LUT Method

Some progress has been attained in the retrieval of vegetation parameters, such as LAI, Cab and EWT, based on the RTM model [32,76,77]. However, the inversion accuracy of the traditional RTM was limited owing to the complexity of the model algorithm: the difference between the simulated and actual spectral information caused by many surface uncertainty factors and the influence of an ill-posed inversion process. Therefore, many studies have been performed to alleviate the problems encountered in the inversion of RTM. Some researchers have attempted to use prior knowledge to constrain the number and range of the input parameters and reduce the influence of ill-posed inversion problems [78]. Additionally, the ill-posed problem was also solved to some extent by using multiple solutions instead of a unique solution. Darvishzadeh et al. [57] analyzed the unique solution and multiple solutions methods separately and finally considered that the average value of the first 100 solutions was the most favorable in their study. Quan et al. [18] used MODIS products to filter out the unrealistic combinations in the LUT and obtained a good estimation result of AGB with an R2 of 0.64 and RMSE of 42.67 g/m2. Thus, for the LUT-based method in this study, the method of multiple solutions and the utilization of MODIS products to eliminate unrealistic parameter combinations was also considered, thereby achieving the optimization of the simulated dataset. The first 450 solutions were filtered and then averaged. The estimation accuracy R2 reached 0.62, and the RMSE and RMSEr were 24.28 g/m2 and 30.97%, respectively, which confirmed the effectiveness of the LUT-based method in this study.

4.3. Estimation Performance

In this study, the inversion of grassland AGB was achieved by combining the PROSAIL model with LUT using the sensitive bands and spectral indices (Table 3) as explanatory variables. Furthermore, the PROSAIL model was separately coupled to the three regression algorithms (PLSR, RF and SVM) to perform the same predictions using simulated spectral features reserved in the LUT-based method as predictors, and the accuracies of the four methods were compared. The PROSAIL + RF model showed the best performance (R2 = 0.70, RMSE = 21.65 g/m2, RMSEr = 27.62%), followed by the LUT-based method (R2 = 0.62, RMSE = 24.28 g/m2, RMSEr = 30.97%). The accuracy level of grassland AGB estimated by the PROSAIL + PLSR model (R2 = 0.51, RMSE = 27.52 g/m2, RMSEr = 35.10%) was distinctly better than the PROSAIL + SVM model (R2 = 0.30, RMSE = 32.88 g/m2, RMSEr = 41.94%) but lower than the LUT-based method. However, a saturation phenomenon occurred in the PROSAIL + PLSR, and this problem was not discovered in the other methods. The outstanding performance of the RF model could be attributed to its distinctive variable selecting and regression method promoting robustness against noise [67]. PLSR was powerful at dealing with collinearity and noisy data [65]. However, its performance was limited due to the fact that it only constructed a linear model, which could not clarify the complex relationship between the variables and AGB very well. The poor estimation performance of the SVM model was possibly caused by the deviation of the optimal hyperplane generated by SVR due to the noise in the training dataset.
The method combining the PROSAIL model with regression algorithms to estimate the grassland AGB was based on the simulated spectral dataset constructed by the RTM, which contained an explicit relationship between canopy attributes and spectral features. Traditional empirical methods using AGB field data and remote sensing features have been considerably mature for grassland AGB estimation. Liang et al. [79] established regression models between the NDVI derived from MODIS and the measured grassland AGB, with a minimum RMSE of 87.512 g/m2. Quan et al. [18] constructed PLSR models between Landsat-8 OLI multispectral data and AGB measurements and attained a good result (R2 = 0.55, RMSE = 37.79 g/m2). Compared with previous empirical methods, the proposed method, especially the RTM combined with the RF model in this study, achieved similar or even higher accuracies. This methodology is rarely applied to the estimation of grassland AGB, although similar studies have been conducted to retrieve vegetation biochemical parameters. Lü [80] constructed the PROSAIL + GBM (gradient boosting machine) model and the PROSAIL + RF model to estimate the chlorophyll content at the canopy scale and found that the latter acquired better accuracy and was less time-consuming. Sawut et al. [39] integrated the PROSAIL model with SVM to estimate Bt in Suaeda salsa at different spectral scales, and its prediction accuracy (R2) reached 0.78 at the hyperspectral scale and 0.68 at the multispectral scale. Traditional empirical methods are highly dependent on sufficient field-measured data and can only be applied at a specific time and site. By contrast, the simulated dataset based on the RTM was used by the data source to estimate grassland AGB. The measured data were only used to evaluate the accuracy of each estimation model. Thus, it was not limited by the measured data and could be applied to grassland AGB estimation across regions. Furthermore, the simulated dataset was further optimized based on MODIS products rather than used directly to make it more representative of the study area; this achieved the aim of reducing the uncertainty of the inversion result. Therefore, the method based on RTM (especially the RTM + RF model) was more reproducible and promising. The estimation results indicated that the PROSAIL + RF model with optimized spectral characteristics displayed great potential for estimating grassland AGB (R2 = 0.70, RMSE = 21.65 g/m2, RMSEr = 27.62%). It was illustrated that the coupling of the PROSAIL and the RF model could alleviate this ill-posed problem to a certain extent and successfully estimate grassland AGB. This methodology should be further investigated and validated in other grassland areas with different climate conditions and grassland types before extensive application.

5. Conclusions

In this study, a novel method of combining the PROSAIL model and regression models based on the LUT algorithm was proposed to estimate grassland AGB. To overcome this ill-posed problem, the relationship between the EVI and LAI of MODIS products was determined and was then applied to filter out the unrealistic combinations of spectral characteristics and their corresponding parameters. The filtered dataset used in the LUT-based method was applied to the other three algorithms (PLSR, RF and SVM) to estimate AGB. The main findings of this study were as follows:
(1) LAI, Cab, EWT and DMC were determined as sensitive to canopy reflectance among the PROSAIL model parameters through global sensitivity analysis.
(2) The spectral bands B1 (Coastal band), B2 (Blue band) and B7 (SWIR 2 band) and the optimized spectral indices NDSIb3, b4, NDSIb5, b6, NDSIb5, b7, NDSIb6, b7 and RSIb3, b4, RSIb5, b6, RSIb5, b7, RSIb6, b7 displayed a significant correlation with AGB (ranging from 0.41 to 0.68, p < 0.001).
(3) The results showed that the PROSAIL + RF model achieved the best prediction effect (R2 = 0.70, RMSE = 21.65 g/m2, RMSEr = 27.62%).
Therefore, the proposed method in this study demonstrated significance in monitoring the spatiotemporal distribution and changes in grassland AGB in large-scale areas. Future work should focus on extending this estimated workflow into other regions to further verify its effectiveness.

Author Contributions

Conceptualization, L.Z. and H.G.; Data curation, L.Z. and H.G.; Methodology, L.Z. and H.G.; Formal analysis, X.Z.; Writing—original draft, H.G.; Writing—review and editing, L.Z., H.G. and X.Z.; Funding acquisition, L.Z.; Project administration, L.Z.; Software, L.Z. and H.G.; Visualization, H.G. and X.Z. All authors have read and agreed to the published version of the manuscript.

Funding

This work was supported by the National Natural Science Foundation of China under Grant [42171439]; the Shandong Provincial Natural Science Foundation, China, under Grant [ZR2019QD010]; the Qingdao Science and Technology Benefit the People Demonstration and Guidance Program, China, under Grant [22-3-7-cspz-1-nsh]; the Open Research Fund Program of LIESMARS under Grant [19R07]; the Open Research Fund Program of Key Laboratory of Ocean Geomatics, Ministry of Natural Resources, China, under Grant [2021B03]; and the Introduction Plan of High-end Foreign Experts under Grant [G2021025006L].

Data Availability Statement

The measured data are available in [figshare] at [10.6084/m9.figshare.20486097]. The satellite products were downloaded from: http://glovis.usgs.gov/ (accessed on 12 March 2022). The Landsat-8 OLI spectral response functions were obtained from: https://www.nwpsaf.eu/site/software/rttov/download/coefficients/spectral-response-functions/#visir (accessed on 31 March 2022).

Acknowledgments

We are very grateful for the financial support provided by the above funds. We also would like to thank the USGS for providing Landsat 8 OLI images for free. In addition, we express our special gratitude to the editor and four anonymous reviewers for their valuable suggestions in reviewing our work.

Conflicts of Interest

No potential conflicts of interest are reported by the authors.

References

  1. Dusseux, P.; Hubert-Moy, L.; Corpetti, T.; Vertès, F. Evaluation of SPOT imagery for the estimation of grassland biomass. Int. J. Appl. Earth Obs. Geoinf. 2015, 38, 72–77. [Google Scholar] [CrossRef]
  2. Fu, X.; Tang, C.; Zhang, X.; Fu, J.; Jiang, D. An improved indicator of simulated grassland production based on MODIS NDVI and GPP data: A case study in the Sichuan province, China. Ecol. Indic. 2014, 40, 102–108. [Google Scholar] [CrossRef]
  3. Cartus, O.; Santoro, M.; Kellndorfer, J. Mapping forest aboveground biomass in the Northeastern United States with ALOS PALSAR dual-polarization L-band. Remote Sens. Environ. 2012, 124, 466–478. [Google Scholar] [CrossRef]
  4. Jia, W.X.; Liu, M.; Yang, Y.H.; He, H.L.; Zhu, X.D.; Yang, F.; Yin, C.; Xiang, W.N. Estimation and uncertainty analyses of grassland biomass in Northern China: Comparison of multiple remote sensing data sources and modeling approaches. Ecol. Indic. 2016, 60, 1031–1040. [Google Scholar] [CrossRef]
  5. Piao, S.; Fang, J.; Zhou, L.; Tan, K.; Tao, S. Changes in biomass carbon stocks in China’s grasslands between 1982 and 1999. Global Biogeochem. Cycles 2007, 21. [Google Scholar] [CrossRef] [Green Version]
  6. Xie, Y.; Sha, Z.; Yu, M.; Bai, Y.; Zhang, L. A comparison of two models with Landsat data for estimating above ground grassland biomass in Inner Mongolia, China. Ecol. Model. 2009, 220, 1810–1818. [Google Scholar] [CrossRef]
  7. Yin, G.; Li, A.; Wu, C.; Wang, J.; Xie, Q.; Zhang, Z.; Nan, X.; Jin, H.; Bian, J.; Lei, G. Seamless Upscaling of the Field-Measured Grassland Aboveground Biomass Based on Gaussian Process Regression and Gap-Filled Landsat 8 OLI Reflectance. ISPRS Int. J. Geo-Inf. 2018, 7, 242. [Google Scholar] [CrossRef] [Green Version]
  8. Barrachina, M.; Cristobal, J.; Tulla, A.F. Estimating above-ground biomass on mountain meadows and pastures through remote sensing. Int. J. Appl. Earth Obs. Geoinf. 2015, 38, 184–192. [Google Scholar] [CrossRef]
  9. Fassnacht, F.E.; Hartig, F.; Latifi, H.; Berger, C.; Hernández, J.; Corvalán, P.; Koch, B. Importance of sample size, data type and prediction method for remote sensing-based estimations of aboveground forest biomass. Remote Sens. Environ. 2014, 154, 102–114. [Google Scholar] [CrossRef]
  10. Chen, Q. Modeling aboveground tree woody biomass using national-scale allometric methods and airborne lidar. ISPRS J. Photogramm. Remote Sens. 2015, 106, 95–106. [Google Scholar] [CrossRef]
  11. Wang, D.L.; Xin, X.P.; Shao, Q.Q.; Brolly, M.; Zhu, Z.L.; Chen, J. Modeling Aboveground Biomass in Hulunber Grassland Ecosystem by Using Unmanned Aerial Vehicle Discrete Lidar. Sensors 2017, 17, 180. [Google Scholar] [CrossRef] [PubMed] [Green Version]
  12. Schlund, M.; Davidson, M.W.J. Aboveground Forest Biomass Estimation Combining L- and P-Band SAR Acquisitions. Remote Sens. 2018, 10, 1151. [Google Scholar] [CrossRef] [Green Version]
  13. Jin, Y.X.; Yang, X.C.; Qiu, J.J.; Li, J.Y.; Gao, T.; Wu, Q.; Zhao, F.; Ma, H.L.; Yu, H.D.; Xu, B. Remote Sensing-Based Biomass Estimation and Its Spatio-Temporal Variations in Temperate Grassland, Northern China. Remote Sens. 2014, 6, 1496–1513. [Google Scholar] [CrossRef] [Green Version]
  14. Lu, D.S.; Chen, Q.; Wang, G.X.; Liu, L.J.; Li, G.Y.; Moran, E. A survey of remote sensing-based aboveground biomass estimation methods in forest ecosystems. Int. J. Digit. Earth 2016, 9, 63–105. [Google Scholar] [CrossRef]
  15. Popescu, S.C.; Zhao, K.G.; Neuenschwander, A.; Lin, C.S. Satellite lidar vs. small footprint airborne lidar: Comparing the accuracy of aboveground biomass estimates and forest structure metrics at footprint level. Remote Sens. Environ. 2011, 115, 2786–2797. [Google Scholar] [CrossRef]
  16. Zolkos, S.G.; Goetz, S.J.; Dubayah, R. A meta-analysis of terrestrial aboveground biomass estimation using lidar remote sensing. Remote Sens. Environ. 2013, 128, 289–298. [Google Scholar] [CrossRef]
  17. Liu, Y.Y.; van Dijk, A.; de Jeu, R.A.M.; Canadell, J.G.; McCabe, M.F.; Evans, J.P.; Wang, G.J. Recent reversal in loss of global terrestrial biomass. Nat. Clim. Chang. 2015, 5, 470–474. [Google Scholar] [CrossRef]
  18. Quan, X.W.; He, B.B.; Yebra, M.; Yin, C.M.; Liao, Z.M.; Zhang, X.T.; Li, X. A radiative transfer model-based method for the estimation of grassland aboveground biomass. Int. J. Appl. Earth Obs. Geoinf. 2017, 54, 159–168. [Google Scholar] [CrossRef]
  19. Balzter, H.; Rowland, C.S.; Saich, P. Forest canopy height and carbon estimation at Monks Wood National Nature Reserve, UK, using dual-wavelength SAR interferometry. Remote Sens. Environ. 2007, 108, 224–239. [Google Scholar] [CrossRef]
  20. Svoray, T.; Shoshany, M. SAR-based estimation of areal aboveground biomass (AAB) of herbaceous vegetation in the semi-arid zone: A modification of the water-cloud model. Int. J. Remote Sens. 2010, 23, 4089–4100. [Google Scholar] [CrossRef]
  21. Eisfelder, C.; Kuenzer, C.; Dech, S. Derivation of biomass information for semi-arid areas using remote-sensing data. Int. J. Remote Sens. 2012, 33, 2937–2984. [Google Scholar] [CrossRef]
  22. El Hajj, M.; Baghdadi, N.; Belaud, G.; Zribi, M.; Cheviron, B.; Courault, D.; Hagolle, O.; Charron, F. Irrigated Grassland Monitoring Using a Time Series of TerraSAR-X and COSMO-SkyMed X-Band SAR Data. Remote Sens. 2014, 6, 10002–10032. [Google Scholar] [CrossRef] [Green Version]
  23. Fu, L.Y.; Liu, Q.W.; Sun, H.; Wang, Q.Y.; Li, Z.Y.; Chen, E.X.; Pang, Y.; Song, X.Y.; Wang, G.X. Development of a System of Compatible Individual Tree Diameter and Aboveground Biomass Prediction Models Using Error-In-Variable Regression and Airborne LiDAR Data. Remote Sens. 2018, 10, 325. [Google Scholar] [CrossRef] [Green Version]
  24. Kayad, A.; Rodrigues, F.A., Jr.; Naranjo, S.; Sozzi, M.; Pirotti, F.; Marinello, F.; Schulthess, U.; Defourny, P.; Gerard, B.; Weiss, M. Radiative transfer model inversion using high-resolution hyperspectral airborne imagery - Retrieving maize LAI to access biomass and grain yield. Field Crops Res. 2022, 282, 108449. [Google Scholar] [CrossRef]
  25. Jung, J.; Kim, S.; Hong, S.; Kim, K.; Kim, E.; Im, J.; Heo, J. Effects of national forest inventory plot location error on forest carbon stock estimation using k-nearest neighbor algorithm. ISPRS J. Photogramm. Remote Sens. 2013, 81, 82–92. [Google Scholar] [CrossRef]
  26. Mutanga, O.; Adam, E.; Cho, M.A. High density biomass estimation for wetland vegetation using WorldView-2 imagery and random forest regression algorithm. Int. J. Appl. Earth Obs. Geoinf. 2012, 18, 399–406. [Google Scholar] [CrossRef]
  27. Chen, Z.L.; Jia, K.; Xiao, C.C.; Wei, D.D.; Zhao, X.; Lan, J.H.; Wei, X.Q.; Yao, Y.J.; Wang, B.; Sun, Y.; et al. Leaf Area Index Estimation Algorithm for GF-5 Hyperspectral Data Based on Different Feature Selection and Machine Learning Methods. Remote Sens. 2020, 12, 2110. [Google Scholar] [CrossRef]
  28. Meng, B.P.; Liang, T.G.; Yi, S.H.; Yin, J.P.; Cui, X.; Ge, J.; Hou, M.J.; Lv, Y.Y.; Sun, Y. Modeling Alpine Grassland Above Ground Biomass Based on Remote Sensing Data and Machine Learning Algorithm: A Case Study in East of the Tibetan Plateau, China. IEEE J. Sel. Top. Appl. Earth Obs. Remote Sens. 2020, 13, 2986–2995. [Google Scholar] [CrossRef]
  29. Vamvakoulas, C.; Alexandris, S.; Argyrokastritis, I. Dry Above Ground Biomass for a Soybean Crop Using an Empirical Model in Greece. Energies 2020, 13, 201. [Google Scholar] [CrossRef] [Green Version]
  30. Yebra, M.; Chuvieco, E.; Riaño, D. Estimation of live fuel moisture content from MODIS images for fire risk assessment. Agric. For. Meteorol. 2008, 148, 523–536. [Google Scholar] [CrossRef]
  31. He, L.; Li, A.; Yin, G.; Nan, X.; Bian, J. Retrieval of Grassland Aboveground Biomass through Inversion of the PROSAIL Model with MODIS Imagery. Remote Sens. 2019, 11, 1597. [Google Scholar] [CrossRef] [Green Version]
  32. Chaabouni, S.; Kallel, A.; Houborg, R. Improving retrieval of crop biophysical properties in dryland areas using a multi-scale variational RTM inversion approach. Int. J. Appl. Earth Obs. Geoinf. 2021, 94, 102220. [Google Scholar] [CrossRef]
  33. Zhu, X.; Skidmore, A.K.; Darvishzadeh, R.; Wang, T.J. Estimation of forest leaf water content through inversion of a radiative transfer model from LiDAR and hyperspectral data. Int. J. Appl. Earth Obs. Geoinf. 2019, 74, 120–129. [Google Scholar] [CrossRef]
  34. Quan, X.W.; He, B.B.; Li, X.; Tang, Z. Estimation of Grassland Live Fuel Moisture Content from Ratio of Canopy Water Content and Foliage Dry Biomass. IEEE Geosci. Remote Sens. Lett. 2015, 12, 1903–1907. [Google Scholar] [CrossRef]
  35. Atzberger, C.; Darvishzadeh, R.; Immitzer, M.; Schlerf, M.; Skidmore, A.; le Maire, G. Comparative analysis of different retrieval methods for mapping grassland leaf area index using airborne imaging spectroscopy. Int. J. Appl. Earth Obs. Geoinf. 2015, 43, 19–31. [Google Scholar] [CrossRef] [Green Version]
  36. Wang, Z.H.; Skidmore, A.K.; Wang, T.J.; Darvishzadeh, R.; Hearne, J. Applicability of the PROSPECT model for estimating protein and cellulose plus lignin in fresh leaves. Remote Sens. Environ. 2015, 168, 205–218. [Google Scholar] [CrossRef]
  37. Zimmerman, N.; Presto, A.A.; Kumar, S.P.N.; Gu, J.; Hauryliuk, A.; Robinson, E.S.; Robinson, A.L.; Subramanian, R. A machine learning calibration model using random forests to improve sensor performance for lower-cost air quality monitoring. Atmos. Meas. Tech. 2018, 11, 291–313. [Google Scholar] [CrossRef] [Green Version]
  38. Ali, A.M.; Darvishzadeh, R.; Skidmore, A.; Gara, T.W.; Heurich, M. Machine learning methods’ performance in radiative transfer model inversion to retrieve plant traits from Sentinel-2 data of a mixed mountain forest. Int. J. Digit. Earth 2021, 14, 106–120. [Google Scholar] [CrossRef]
  39. Sawut, R.; Li, Y.; Liu, Y.; Kasim, N.; Hasan, U.; Tao, W. Retrieval of betalain contents based on the coupling of radiative transfer model and SVM model. Int. J. Appl. Earth Obs. Geoinf. 2021, 100, 102340. [Google Scholar] [CrossRef]
  40. Hishe, S.; Bewket, W.; Nyssen, J.; Lyimo, J. Analysing past land use land cover change and CA-Markov-based future modelling in the Middle Suluh Valley, Northern Ethiopia. Geocarto Int. 2019, 35, 225–255. [Google Scholar] [CrossRef]
  41. Baret, F.; Jacquemoud, S.; Guyot, G.; Leprieur, C. Modeled analysis of the biophysical nature of spectral shifts and comparison with information content of broad bands. Remote Sens. Environ. 1992, 41, 133–142. [Google Scholar] [CrossRef]
  42. Jacquemoud, S.; Baret, F. PROSPECT: A model of leaf optical properties spectra. Remote Sens. Environ. 1990, 34, 75–91. [Google Scholar] [CrossRef]
  43. Verhoef, W. Light scattering by leaf layers with application to canopy reflectance modeling: The SAIL model. Remote Sens. Environ. 1984, 16, 125–141. [Google Scholar] [CrossRef] [Green Version]
  44. Feret, J.-B.; François, C.; Asner, G.P.; Gitelson, A.A.; Martin, R.E.; Bidel, L.P.R.; Ustin, S.L.; le Maire, G.; Jacquemoud, S. PROSPECT-4 and 5: Advances in the leaf optical properties model separating photosynthetic pigments. Remote Sens. Environ. 2008, 112, 3030–3043. [Google Scholar] [CrossRef]
  45. Zhang, L.Y.; Li, X.J.; Du, H.Q.; Cui, L.; Mao, F.J.; Liu, Y.L.; Li, Y.G.; Zhu, D.E. Simulating canopy reflectance time series for typical subtropical forest by coupling PROSPECT5 and 4SAIL models. Chin. J. Appl. Ecol. 2017, 28, 2461–2469. [Google Scholar]
  46. Feilhauer, H.; Schmid, T.; Faude, U.; Sanchez-Carrillo, S.; Cirujano, S. Are remotely sensed traits suitable for ecological analysis? A case study of long-term drought effects on leaf mass per area of wetland vegetation. Ecol. Indic. 2018, 88, 232–240. [Google Scholar] [CrossRef]
  47. Xu, M.; Liu, R.; Chen, J.M.; Liu, Y.; Shang, R.; Ju, W.; Wu, C.; Huang, W. Retrieving leaf chlorophyll content using a matrix-based vegetation index combination approach. Remote Sens. Environ. 2019, 224, 60–73. [Google Scholar] [CrossRef]
  48. Liang, L.; Di, L.; Zhang, L.; Deng, M.; Qin, Z.; Zhao, S.; Lin, H. Estimation of crop LAI using hyperspectral vegetation indices and a hybrid inversion method. Remote Sens. Environ. 2015, 165, 123–134. [Google Scholar] [CrossRef]
  49. Si, Y.; Schlerf, M.; Zurita-Milla, R.; Skidmore, A.; Wang, T. Mapping spatio-temporal variation of grassland quantity and quality using MERIS data and the PROSAIL model. Remote Sens. Environ. 2012, 121, 415–425. [Google Scholar] [CrossRef]
  50. Huang, X.; Zhang, T.; Yi, G.; He, D.; Zhou, X.; Li, J.; Bie, X.; Miao, J. Dynamic Changes of NDVI in the Growing Season of the Tibetan Plateau During the Past 17 Years and Its Response to Climate Change. Int. J. Environ. Res. Public Health 2019, 16, 3452. [Google Scholar] [CrossRef] [Green Version]
  51. Sobol, I.M. Sensitivity estimates for nonlinear mathematical models. Math.model.comput.exp. 1993, 1, 112–118. [Google Scholar]
  52. Zhao, J.; Li, J.; Liu, Q.H.; Wang, H.Y.; Chen, C.; Xu, B.D.; Wu, S.L. Comparative Analysis of Chinese HJ-1 CCD, GF-1 WFV and ZY-3 MUX Sensor Data for Leaf Area Index Estimations for Maize. Remote Sens. 2018, 10, 68. [Google Scholar] [CrossRef] [Green Version]
  53. Soudani, K.; François, C.; le Maire, G.; Le Dantec, V.; Dufrêne, E. Comparative analysis of IKONOS, SPOT, and ETM+ data for leaf area index estimation in temperate coniferous and deciduous forest stands. Remote Sens. Environ. 2006, 102, 161–175. [Google Scholar] [CrossRef] [Green Version]
  54. Gonenc, A.; Ozerdem, M.S.; Acar, E.; IEEE. Comparison of NDVI and RVI Vegetation Indices Using Satellite Images. In Proceedings of the 8th International Conference on Agro-Geoinformatics (Agro-Geoinformatics), Istanbul, Turkey, 16–19 July 2019. [Google Scholar]
  55. Gu, Y.X.; Wylie, B.K.; Howard, D.M.; Phuyal, K.P.; Ji, L. NDVI saturation adjustment: A new approach for improving cropland performance estimates in the Greater Platte River Basin, USA. Ecol. Indic. 2013, 30, 1–6. [Google Scholar] [CrossRef]
  56. Rodrigues, F.A.; Blasch, G.; Defourny, P.; Ortiz-Monasterio, J.I.; Schulthess, U.; Zarco-Tejada, P.J.; Taylor, J.A.; Gerard, B. Multi-Temporal and Spectral Analysis of High-Resolution Hyperspectral Airborne Imagery for Precision Agriculture: Assessment of Wheat Grain Yield and Grain Protein Content. Remote Sens. 2018, 10, 930. [Google Scholar] [CrossRef] [PubMed] [Green Version]
  57. Darvishzadeh, R.; Skidmore, A.; Schlerf, M.; Atzberger, C. Inversion of a radiative transfer model for estimating vegetation LAI and chlorophyll in a heterogeneous grassland. Remote Sens. Environ. 2008, 112, 2592–2604. [Google Scholar] [CrossRef]
  58. Verger, A.; Baret, F.; Camacho, F. Optimal modalities for radiative transfer-neural network estimation of canopy biophysical characteristics: Evaluation over an agricultural area with CHRIS/PROBA observations. Remote Sens. Environ. 2011, 115, 415–426. [Google Scholar] [CrossRef]
  59. Yan, K.; Park, T.; Yan, G.; Chen, C.; Yang, B.; Liu, Z.; Nemani, R.R.; Knyazikhin, Y.; Myneni, R.B. Evaluation of MODIS LAI/FPAR Product Collection 6. Part 1: Consistency and Improvements. Remote Sens. 2016, 8, 359. [Google Scholar] [CrossRef] [Green Version]
  60. Yan, K.; Park, T.; Yan, G.J.; Liu, Z.; Yang, B.; Chen, C.; Nemani, R.R.; Knyazikhin, Y.; Myneni, R.B. Evaluation of MODIS LAI/FPAR Product Collection 6. Part 2: Validation and Intercomparison. Remote Sens. 2016, 8, 460. [Google Scholar] [CrossRef] [Green Version]
  61. Fu, G.; Zhang, J.; Shen, Z.X.; Shi, P.L.; He, Y.T.; Zhang, X.Z. Validation of collection of 6 MODIS/Terra and MODIS/Aqua gross primary production in an alpine meadow of the Northern Tibetan Plateau. Int. J. Remote Sens. 2017, 38, 4517–4534. [Google Scholar] [CrossRef]
  62. Brown, L.A.; Meier, C.; Morris, H.; Pastor-Guzman, J.; Bai, G.; Lerebourg, C.; Gobron, N.; Lanconelli, C.; Clerici, M.; Dash, J. Evaluation of global leaf area index and fraction of absorbed photosynthetically active radiation products over North America using Copernicus Ground Based Observations for Validation data. Remote Sens. Environ. 2020, 247, 111935. [Google Scholar] [CrossRef]
  63. Cho, M.A.; Skidmore, A.; Corsi, F.; van Wieren, S.E.; Sobhan, I. Estimation of green grass/herb biomass from airborne hyperspectral imagery using spectral indices and partial least squares regression. Int. J. Appl. Earth Obs. Geoinf. 2007, 9, 414–424. [Google Scholar] [CrossRef]
  64. Darvishzadeh, R.; Atzberger, C.; Skidmore, A.; Schlerf, M. Mapping grassland leaf area index with airborne hyperspectral imagery: A comparison study of statistical approaches and inversion of radiative transfer models. ISPRS J. Photogramm. Remote Sens. 2011, 66, 894–906. [Google Scholar] [CrossRef]
  65. Wold, S.; Sjöström, M.; Eriksson, L. PLS-regression: A basic tool of chemometrics. Chemom. Intell. Lab. Syst. 2001, 58, 109–130. [Google Scholar] [CrossRef]
  66. Geladi, P.; Kowalski, B.R. Partial least-squares regression: A tutorial. Anal. Chim. Acta 1986, 185, 1–17. [Google Scholar] [CrossRef]
  67. Breiman, L. Random Forests. Mach. Learn. 2001, 45, 5–32. [Google Scholar] [CrossRef] [Green Version]
  68. Belgiu, M.; Drăguţ, L. Random forest in remote sensing: A review of applications and future directions. ISPRS J. Photogramm. Remote Sens. 2016, 114, 24–31. [Google Scholar] [CrossRef]
  69. Vapnik, V. Statistical Learning Theory; Wiley-Interscience: Hoboken, NJ, USA, 1998. [Google Scholar]
  70. Mountrakis, G.; Im, J.; Ogole, C. Support vector machines in remote sensing: A review. ISPRS J. Photogramm. Remote Sens. 2011, 66, 247–259. [Google Scholar] [CrossRef]
  71. Jing, Z.; Jing, L.; Liu, Q. Based on PROSAIL and four scale model to estimation LAI from HJ-1B CCD2 data in Zhangye. In Proceedings of the IEEE International Geoscience & Remote Sensing Symposium, Munich, Germany, 22–27 July 2012. [Google Scholar]
  72. Rivera, J.P.; Verrelst, J.; Delegido, J.; Veroustraete, F.; Moreno, J. On the Semi-Automatic Retrieval of Biophysical Parameters Based on Spectral Index Optimization. Remote Sens. 2014, 6, 4927–4951. [Google Scholar] [CrossRef] [Green Version]
  73. Wang, Z.H.; Sun, Y.H.; Zhang, T.Y.; Ren, H.Z.; Qin, Q.M.; IEEE. Optimization of spectral indices for the estimation of leaf area index based on sentinel-2 multispectral imagery. In Proceedings of the 38th IEEE International Geoscience and Remote Sensing Symposium (IGARSS), Valencia, Spain, 22–27 July 2018; pp. 5441–5444. [Google Scholar]
  74. Yang, L.C.; Deng, S.; Zhang, Z. New spectral model for estimating leaf area index based on gene expression programming. Comput. Electr. Eng. 2020, 83, 15. [Google Scholar] [CrossRef]
  75. Jay, S.; Gorretta, N.; Morel, J.; Maupas, F.; Bendoula, R.; Rabatel, G.; Dutartre, D.; Comar, A.; Baret, F. Estimating leaf chlorophyll content in sugar beet canopies using millimeter- to centimeter-scale reflectance imagery. Remote Sens. Environ. 2017, 198, 173–186. [Google Scholar] [CrossRef]
  76. Yin, C.M.; He, B.B.; Quan, X.W.; Liao, Z.M. Chlorophyll content estimation in arid grasslands from Landsat-8 OLI data. Int. J. Remote Sens. 2016, 37, 615–632. [Google Scholar] [CrossRef]
  77. Boren, E.J.; Boschetti, L. Landsat-8 and Sentinel-2 Canopy Water Content Estimation in Croplands through Radiative Transfer Model Inversion. Remote Sens. 2020, 12, 2803. [Google Scholar] [CrossRef]
  78. Li, W.; Niu, Z.; Liang, X.; Li, Z.; Huang, N.; Gao, S.; Wang, C.; Muhammad, S. Geostatistical modeling using LiDAR-derived prior knowledge with SPOT-6 data to estimate temperate forest canopy cover and above-ground biomass via stratified random sampling. Int. J. Appl. Earth Obs. Geoinf. 2015, 41, 88–98. [Google Scholar] [CrossRef]
  79. Liang, T.; Yang, S.; Feng, Q.; Liu, B.; Zhang, R.; Huang, X.; Xie, H. Multi-factor modeling of above-ground biomass in alpine grassland: A case study in the Three-River Headwaters Region, China. Remote Sens. Environ. 2016, 186, 164–172. [Google Scholar] [CrossRef]
  80. Lü, J. Hyperspectral Remote Sensing Inversion Models of Crop Chlorophyll Content Based on Machine Learning and Radiative Transfer Models. Ph.D. Thesis, China University of Geosciences (Beijing), Beijing, China, 2012. [Google Scholar]
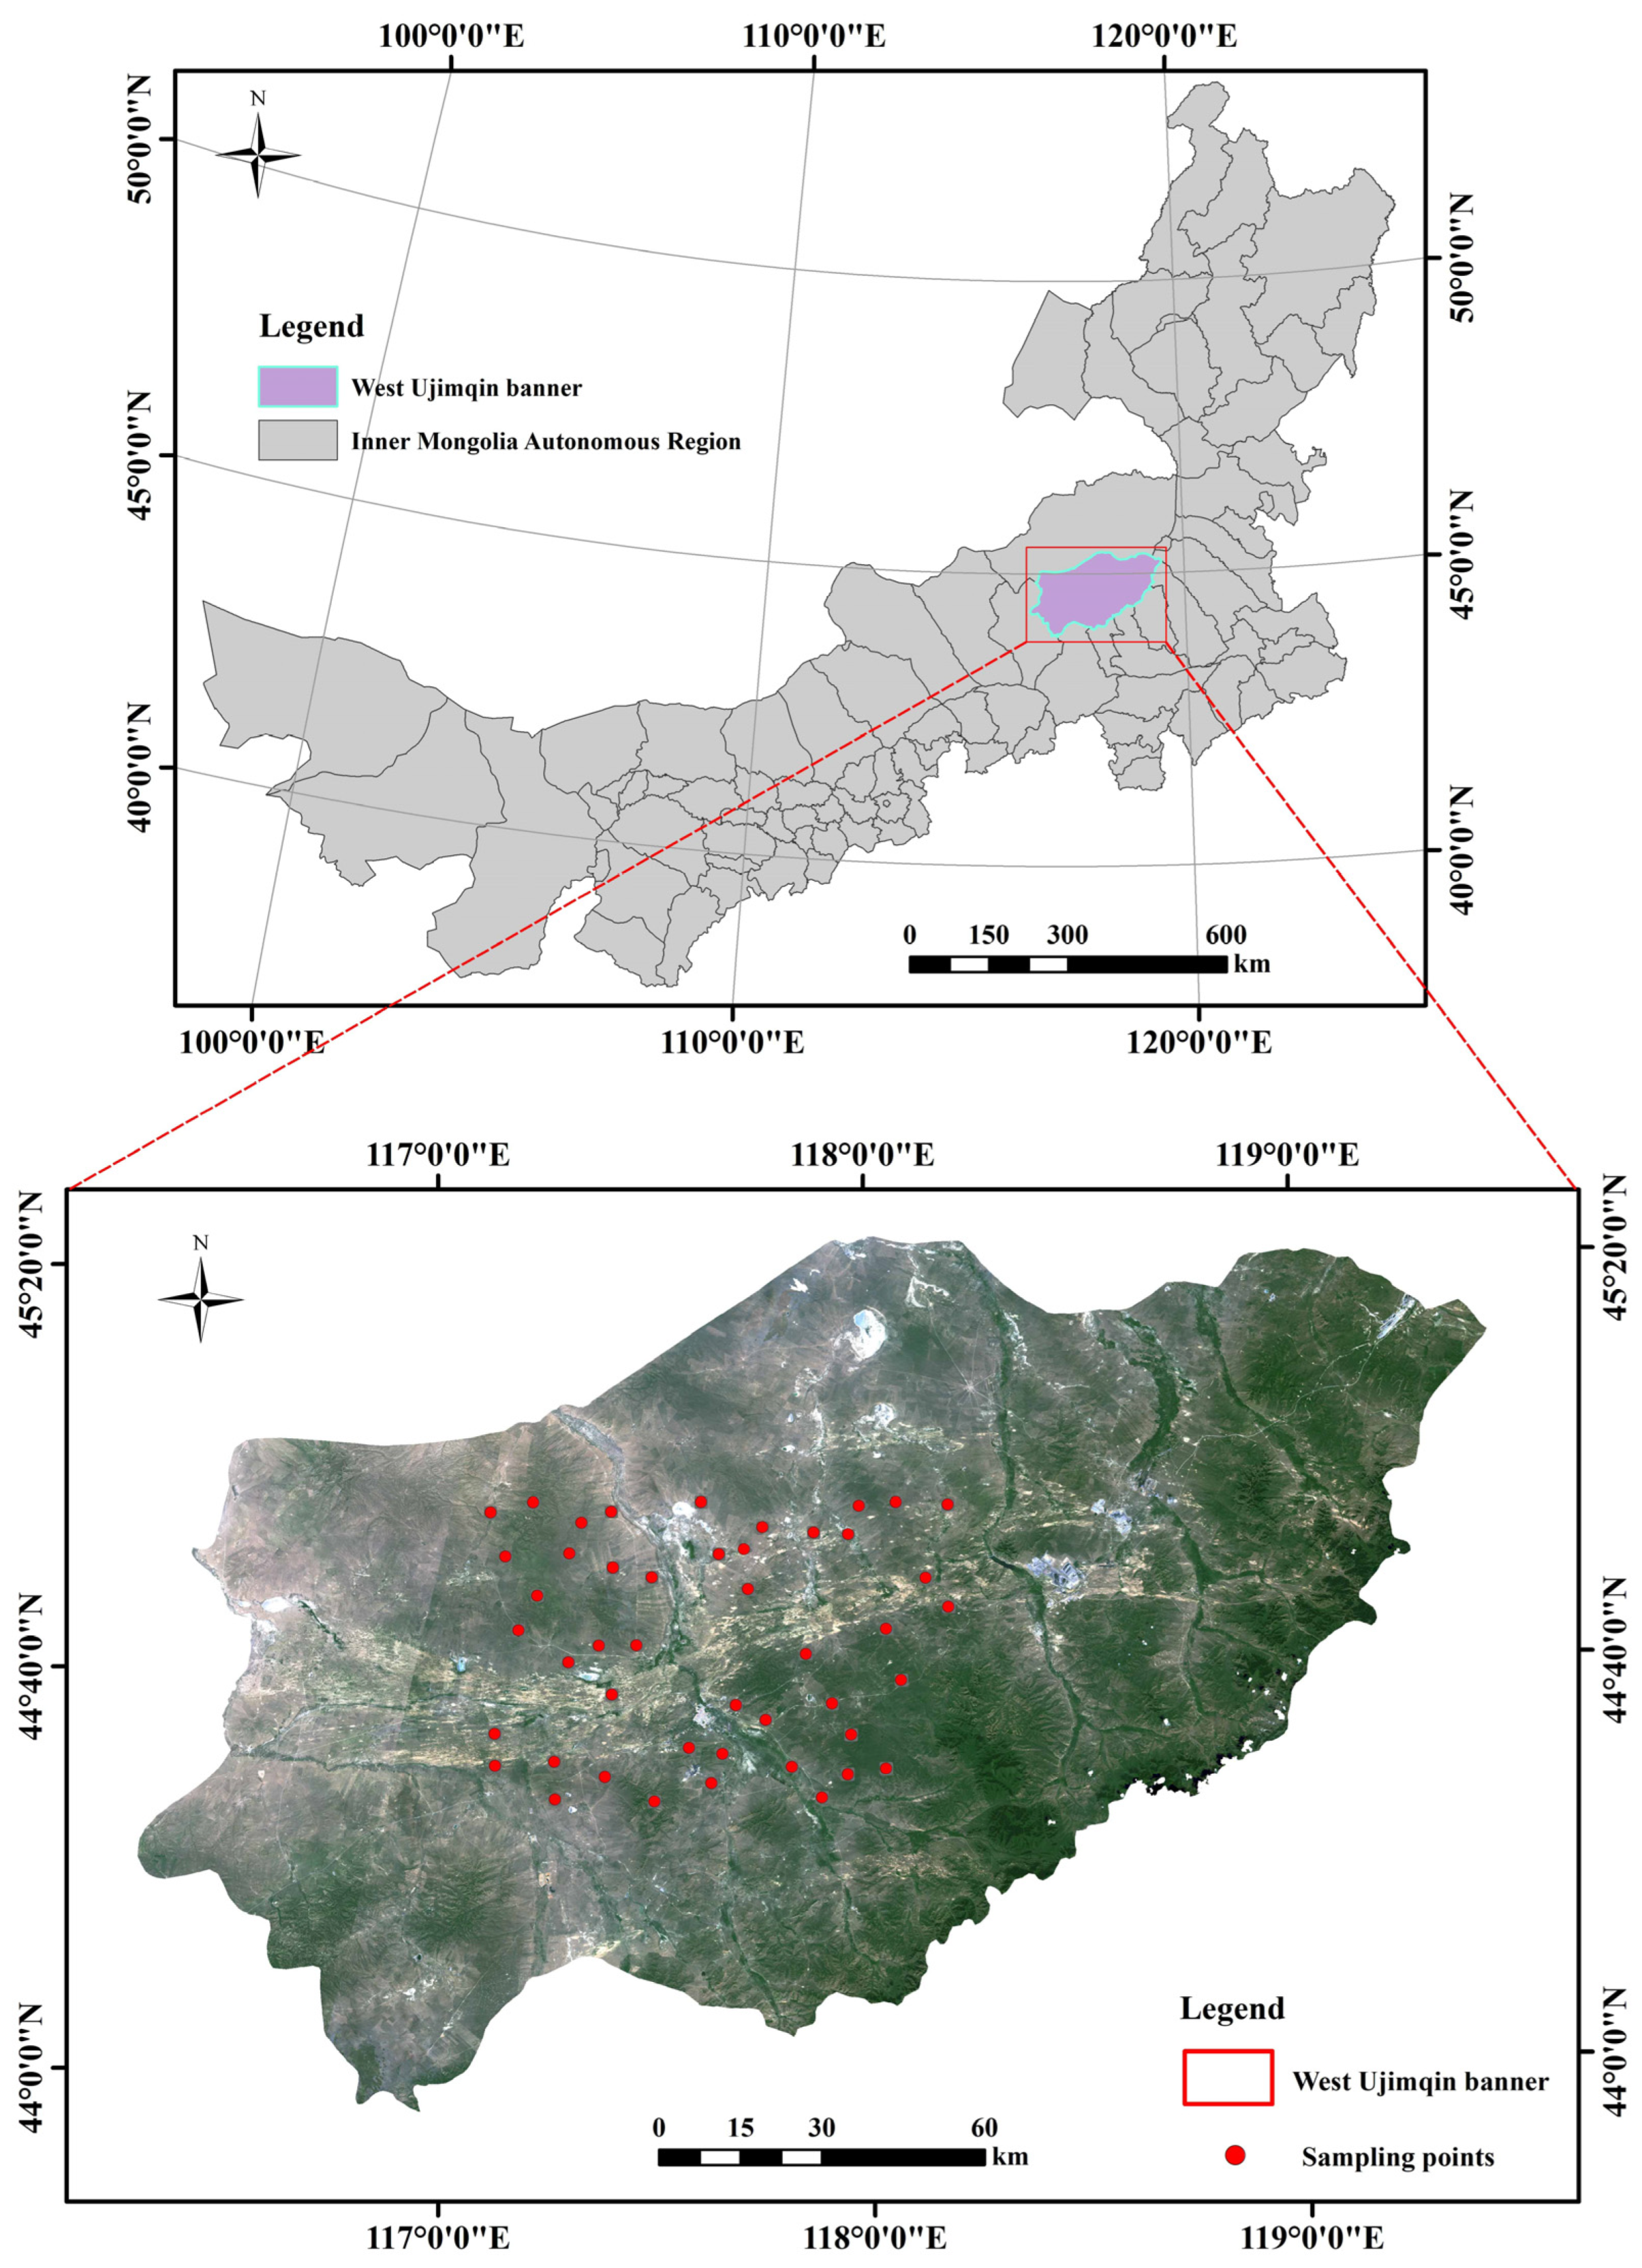
Figure 1. Geographical location map of the study region. The map of West Ujimqin banner is a true color image formed by mosaicking and clipping two Landsat-8 OLI images.
Remotesensing 15 02918 g001
Figure 2. Flowchart of the study. Rounded rectangles denote input, intermediate or output data. Diamonds and rectangles denote processing steps (methods and models). Stippled rounded rectangles (grey boxes) denote filtered spectral characteristics.
Remotesensing 15 02918 g002
Figure 3. Spectral response curves of Landsat-8 OLI.
Remotesensing 15 02918 g003
Figure 4. Results of the Sobol global sensitivity analysis: (a) First-order contributions; (b) Total order contributions.
Remotesensing 15 02918 g004
Figure 5. Simulated Landsat-8 OLI reflectance.
Remotesensing 15 02918 g005
Figure 6. R values between AGB and simulated reflectance of Landsat-8 OLI. The R values are the absolute values of the calculated correlation coefficients.
Remotesensing 15 02918 g006
Figure 7. Two-dimensional correlation matrix of AGB with RSI and NDSI calculated from simulated multispectral reflectance. (a) Correlation matrix plot between AGB and RSI (absolute values). (b) Correlation matrix plot between AGB and NDSI (absolute values).
Remotesensing 15 02918 g007
Figure 8. R2 values between the measured and estimated AGB using different solutions regarding the LUT-based method.
Remotesensing 15 02918 g008
Figure 9. Scatter plots of the measured and the estimated AGB based on four methods. (a) Result of estimated grassland AGB using the LUT-based method. (b) Result of estimated grassland AGB by PROSAIL + RF model. (c) Result of estimated grassland AGB by PROSAIL + PLSR model. (d) Result of estimated grassland AGB by PROSAIL + SVM model.
Remotesensing 15 02918 g009
Figure 10. Grassland AGB map in West Ujimqin by the PROSAIL + RF estimation based on the LUT method.
Remotesensing 15 02918 g010
Table 1. Parameters required for the PROSAIL_5B model.
ModelParameterSymbolRangeUnitSource
PROSPECT_5BLeaf structure
parameter
N1–2-Feilhauer et al. [46]
Chlorophyll contentCab5–100μg/cm2Xu et al. [47]
Equivalent water thicknessEWT0.003–0.03g/cm2Liang et al. [48]
Dry matter contentDMC0.001–0.01g/cm2Si et al. [49]
Carotenoid contentCar8μg/cm2Model default
Leaf brown pigmentCbrown0-Field survey
4SAILLeaf area indexLAI0.3–8m2∙m−2Si et al. [49] & MOD15A2H
Hot spot factorHspot0.05–0.1-He et al. [31]
Soil moisture ratioPsoil0–1-Huang et al. [50]
Leaf inclination
distribution
LIDFa−0.35-Field survey
LIDFb−0.15-Field survey
Sun zenith angleθs27.26Degree (°)Landsat-8 metadata
View zenith angleθv0Degree (°)Landsat-8 metadata
Relative azimuth angleθz0Degree (°)Landsat-8 metadata
Table 2. Recalibration of the PROSAIL_5B model parameters.
Parameter SymbolRangeStepUnit
Cab5–10010μg/cm2
LAI0.3–80.1m2·m−2
DMC0.001–0.010.001g/cm2
EWT0.003–0.030.01g/cm2
Psoil0.5fixed-
N1.25fixed-
Hspot0.075fixed-
Table 3. Correlation analysis between optimized spectral characteristics and AGB.
CharacteristicsR
Spectral bandsB1−0.47
B2−0.47
B7−0.53
Spectral indicesNDSIb3, b4−0.46
NDSIb5, b6−0.44
NDSIb5, b7−0.54
NDSIb6, b7−0.66
RSIb3, b4−0.45
RSIb5, b6−0.41
RSIb5, b7−0.54
RSIb6, b7−0.68
Disclaimer/Publisher’s Note: The statements, opinions and data contained in all publications are solely those of the individual author(s) and contributor(s) and not of MDPI and/or the editor(s). MDPI and/or the editor(s) disclaim responsibility for any injury to people or property resulting from any ideas, methods, instructions or products referred to in the content.