Abstract
This study has evaluated five years (2016–2020) of Himawari-8 (H8) Sea Surface Temperature (SST) Level 2 Pre-processed (L2P) data produced by the Australian Bureau of Meteorology (Bureau) against shipborne radiometer SST measurements obtained from the Infrared SST Autonomous Radiometer (ISAR) onboard research vessel RV Investigator. Before being used, all data sets employed in this study have gone through careful quality control, and only the most trustworthy measurements are retained. With a large matchup database (31,871 collocations in total, including 16,418 during daytime and 15,453 during night-time), it is found that the Bureau H8 SST product is of good quality, with a mean bias ± standard deviation (SD) of −0.12 °C ± 0.47 °C for the daytime and −0.04 °C ± 0.37 °C for the night-time. The performance of the H8 data under different environmental conditions, determined by the observations obtained concurrently from RV Investigator, is examined. Daytime and night-time satellite data behave slightly differently. During the daytime, a cold bias can be seen under almost all environmental conditions, including for most values of wind speed, SST, and relative humidity. On the other hand, the performance of the night-time H8 SST product is consistently more stable under most meteorological conditions with the mean bias usually close to zero.
1. Introduction
Sea surface temperature (SST) has long been recognized as an essential climate variable [1,2]. Governed by both atmospheric and oceanic processes, SST plays a significant role in the air–sea interaction, including the exchange of heat, momentum, moisture, and gases. Its variability patterns are closely related to, or used to define, critical climate phenomena on a global scale such as ENSO (El Nino-Southern Oscillation) or on a smaller basin scale such as PDO (Pacific Decadal Oscillation (PDO)) [3]. SST also functions as a thermal expression of subsurface dynamics such as fronts and eddies [4].
The Advanced Himawari Imager (AHI) onboard the Japanese geostationary satellite Himawari-8 (H8) was launched in October 2014. The AHI is an optical radiometer with an observation frequency of every 10 min for the full disk. It has 16 spectral bands from visible and infrared (IR) wavelengths, five of which (centred at 3.9, 8.6, 10.4, 11.2, and 12.4 μm) provide information for SST retrievals [5]. H8 has provided SST observations over the western Pacific and eastern Indian Ocean with a spatial resolution of 2 km at nadir and temporal resolution of 10 min since July 2015, when it became operational. Currently, there are a number of agencies operationally generating H8 SST data sets, including the Japan Aerospace Exploration Agency (JAXA) [5], the National Oceanic and Atmospheric Administration (NOAA) [6], and the Australian Bureau of Meteorology (Bureau) [7], employing different retrieval algorithms. SST retrievals from JAXA and NOAA (namely the Advanced Clear-Sky Processor for Oceans, ACSPO, products) have been validated in multiple studies against drifting and/or mooring buoys [5,6,8,9,10], or against shipborne IR radiometers [11]. The data products have shown good quality with an overall mean bias typically within ±0.2 °C and standard deviation (SD) of 0.3–0.6 °C. However, independent validation of the Bureau H8 SST products has not yet been thoroughly documented and published.
This study compares the Bureau’s latest “fv02” H8 Level 2 Pre-processed (L2P) SST products [7] against the skin temperatures obtained from the Infrared SST Autonomous Radiometer (ISAR; Ref. [12]) onboard RV Investigator. The objective of this study is twofold: in addition to the evaluation of the Bureau’s satellite SST product, we also aim to demonstrate the high quality of the ISAR skin SST observations, which can be used as a fiducial source of ‘ground truth’ for satellite IR SST retrieval validations. The rest of the paper is structured as follows: Section 2 introduces the data sets used and methods adopted; Section 3 presents the results; discussions and conclusions are provided in Section 4.
2. Data Sets and Method
2.1. Himawari-8 L2P SST Data
For this study, we use the “fv02” H8 L2P SST dataset, recently reprocessed for the period from 2015 to 2022 by the Bureau for the Integrated Marine Observing System (IMOS), and available at [13]. The L2P SST measurements are physically retrieved using the Radiative Transfer Model (RTM) RTTOV12.3 [14,15], which is based on the ESA (European Space Agency) CCI (Climate Change Initiative) SST code developed at the University of Reading [16]. Briefly, RTTOV12.3 simulates the top-of-atmosphere radiances for thermal channels including those used to retrieve SST. An atmospheric profile of temperature and water vapor, and surface properties such as pressure and temperature, from the Australian Community Climate and Earth-System Simulator-Global (ACCESS-G3 model; [17]) analysis and forecast data, are used as inputs along with brightness temperatures (BTs) for thermal channels and reflectances for solar-affected channels of H8 [15]. The physically based, probabilistic Bayesian approach is used for cloud detection to determine clear sky conditions. The incidence of both missed clouds and false detection of clouds is significantly less in the Bayesian approach than traditional approaches to cloud screening [18]. Skin SST measurements are retrieved using the optimal estimation (OE) scheme also developed at the University of Reading [19].
To regulate SST production and facilitate data use and exchange, the international Group for High-Resolution SST (GHRSST; https://www.ghrsst.org/, accessed on 20 April 2023) has requested that the Sensor-Specific Error Statistics (SSES), the estimates of expected SST bias and error SD, should be provided for each SST value (e.g., [20,21,22]). The Bureau has developed its own empirical SSES model based on in situ SSTs that was then applied to those H8 L2P files [23]. In this model, an SSES is estimated by considering the deviations in the target satellite SST pixel from drifting buoy temperatures. The deviations are quality-controlled for favourable conditions (e.g., cloud coverage, wind conditions), and then binned in six dimensions (i.e., time of day, satellite zenith angle, quality level, longitude, latitude, and age). The binning process is critically dependent on the number of available measurements for each bin. For more detail, refer to [23].
2.2. Ship Observations
Skin SST measurements, which serve as the “ground truth” in this study, are obtained from an Infrared SST Autonomous Radiometer (ISAR) model 5D onboard Australia’s Marine National Facility, RV Investigator ([24]; http://imos.org.au/facilities/shipsofopportunity/sstsensors/, accessed on 20 April 2023). As a self-calibrating instrument, the ISAR contains two blackbody reference cavities, a rotating gold mirror, and one single-channel radiometer that functions within the 9.6–11.5 µm spectral band. ISAR can measure SSTs at the same depth (~10–20 µm) as IR radiometers onboard satellites to an accuracy of ~0.1 K root-mean-square error [25], making it an excellent choice for the validation of satellite retrievals. Before and after each cruise, the ISAR instrument is calibrated against a second-generation Concerted Action for the Study of the Ocean Thermal Skin (CASOTS-II) reference blackbody [26]. For this study, we use the delayed-mode, re-calibrated ISAR data.
Also onboard RV Investigator and measuring SST at a depth of ~ 7–10 m is a SeaBird SBE38 temperature sensor (https://www.seabird.com/sbe-38-digital-oceanographic-thermometer/product?id=60762467703, accessed on 20 April 2023), located within the thermosalinograph water intake in the vessel’s drop keel [27]. The SBE38 sensor samples the water temperature every 5 s and averaged over a minute. It is calibrated on a yearly basis by the Commonwealth Scientific and Industrial Research Organisation (CSIRO) Oceanographic Calibration Facility. In this study, only those depth SSTs simultaneously obtained with ISAR skin SSTs are retained [27].
In addition to the SST data sets, several environmental variables that are measured concurrently on the ship are also included in this study. This includes wind speed, relatively humidity RH, air temperatures, and shortwave flux ([28]; https://imos.org.au/facilities/shipsofopportunity/airseaflux, accessed on 20 April 2023). The wind speed U is measured from an ultrasonic sensor at a height of ~24.5 m above the summer load line, from which the 10 m wind speed U10 is computed [29]. All ISAR, SBE38, and meteorological data are sourced from the IMOS thredds directories from the Australian Ocean Data Network [30].
2.3. Quality Control and Matchups
All datasets go through careful quality control before they are used.
For the satellite dataset, only the highest-quality-level (QL = 5) SST measurements are retained. In the Bureau H8 L2P SST dataset, the quality level is determined by the probability of cloud clearance and the sensitivity of simulated SST to real SST, and a chi-squared test is adopted to compare the size of any discrepancies between the simulated and the real SSTs [7,31]. A filter of clearness (using the probability_of_clear variable in the L2P files) being equal to 1 is applied to further eliminate any potential cloud contamination. SSES-bias-corrected SSTs are used for this study.
For ISAR data used in this study, the total expanded uncertainty for the skin SST value is calculated using the uncertainty code produced by Werenfrid Wimmer [25]. The ISAR total uncertainty is an estimate of the SST that differs from its true value by less than the stated uncertainty in 95% of cases, and can be considered as about 2 times the SD. In this study, only ISAR skin SSTs with a total uncertainty ≤0.2 °C are used. This threshold is adopted from [27]. Several tests were performed in [27] before the 0.2 °C threshold was determined to be sufficiently strict yet not discarding too many good measurements. For U10 < 10 ms−1 conditions, there is little dependency of the total uncertainty in ISAR data on wind speed, and the uncertainty is relatively stable at around 0.12 °C [27]. The effect of ship roll starts to impact the performance of the instrument as the wind strengthens. When U10 is >15 ms−1, the total uncertainty sharply increases [27]. Therefore, in addition to the total uncertainty being ≤0.2 °C, in this study, the wind condition is also confined to be under 15 ms−1 to ensure that only the most trustworthy ISAR measurements are included.
Depth SSTs from SBE38 also went through a series of quality control (QC) steps as adopted in the IMOS data processing system [28]. The QC procedure consists of checks including the physical bounds check (−2 to 40 °C), time and geolocation check, platform speed check, water temperature check, exhaust contamination check, air temperature and wind check, statistical check, and climatological bounds check [28]. Only depth SSTs that have passed all checks are retained.
Following the above QC steps, matchups between SST (H8, ISAR, and SBE38) measurements, as well as environmental conditions (wind speed, relative humidity, shortwave radiation, and air temperature) are generated for each cruise from 2016 to 2020. Due to the limited availability of high-quality, reprocessed ISAR SST data in 2021 and 2022, we do not validate the satellite SSTs in these two years in this study. The temporal window is set as ±5 min around the H8 SST observation time, and the spatial window is set to be 5 km. During the collocation process, only the best pair is retained. Here, “best pair” means that only one single match between an H8 and ISAR measurement that is closest in space and time is retained. We do not keep multiple ISAR measurements that match to a single satellite measurement, or multiple satellite measurements that match to a single ISAR measurement.
Before we obtain the final matchups, it is a known issue that for some cruises, the performance of the ISAR instrument may not be optimal, due to several reasons, some of which are not yet well understood such as issues related to mirrors or electronics. These suboptimal ISAR data may still escape the total uncertainty check, as the total expanded uncertainty estimate strongly depends on the roll of the ship [25]. Therefore, we decide to conduct a final visual QC on ISAR SSTs by comparing them with the collocated SBE38 depth temperatures for each individual cruise under night-time, well-mixed (U10 > 2 ms−1) conditions only, when the only temperature difference should be the cool skin effect [32]. In this study, daytime is determined as solar zenith angle (SZA) < 90° and night-time as SZA > 110° to avoid the twilight times. SZA is calculated as , where is the solar zenith angle in degrees, is the solar altitude angle ( = 90° − ) in degrees, is the local latitude in radians, is the current declination of the sun in radians that is determined by the number of days of the year, and h is the hour angle in the local solar time in radians (LST, determined by longitude; ). If the average night-time SST difference (ISAR minus SBE38) for a certain cruise is unrealistically large, then the whole cruise, including the daytime measurements, is considered as untrustworthy and subsequently discarded. The comparisons between ISAR skin SST and SBE38 depth SST for all cruises between 2016 and 2020 under well-mixed night-time conditions are shown in Table 1. As expected, most of the average night-time temperature differences are minor, between about −0.38 °C and 0.05 °C due to the cool skin effect [32,33,34]. However, there are five cruises standing out with extraordinarily large negative temperature differences (absolute values > 0.8 °C; red rows in Table 1). These biases are more than three times larger than the average night-time cool skin amplitude (~−0.23 °C as observed in [27]); therefore, these five cruises are deemed as of questionable quality and removed from the final collocations. This three-times-larger average night-time cool skin amplitude is believed as justifiable and it serves our purposes well in this study.

Table 1.
Comparison between ISAR skin SST and SBE38 depth SST for all cruises between 2016 and 2020 under well-mixed (U10 > 2 ms−1) night-time conditions only. Statistics include number of matchups (N), bias (ISAR-SBE38 SSTs), SD of biases, and cruise date period. Rows in red indicate the cruises to be discarded because of the abnormally large mean biases between ISAR and SBE38 SSTs.
The final data set contains 31,871 matchups, including 16,418 during daytime and 15,453 during night-time. A flowchart of the quality control measures on different data sets and the matchup process is shown in Figure 1. For the remainder of the study, all analyses are based on this database unless explicitly stated otherwise, and no wind speed filter is applied.
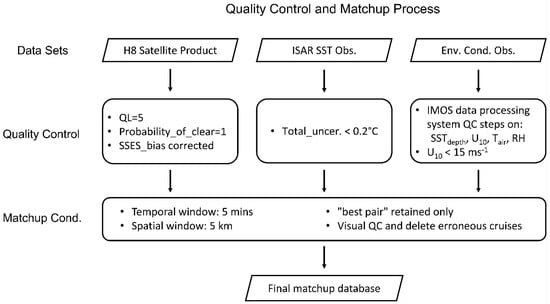
Figure 1.
Flowchart of the quality control measures on different data sets and the matchup process.
3. Results
3.1. A Diurnal Variation Case Study
A case study to evaluate the three SST datasets, i.e., Bureau H8 L2P, ISAR skin, and SBE38 depth SST measurements, is undertaken during a strong diurnal variation (DV) event that occurred on 12 October 2016 near the north-eastern Australian coast (~146°E, 18°S) [11]. Part of the motivation for this case study is to compare with the study by [11], who also studied this DV event using the same data sets, except that their H8 SST retrievals are sourced from JAXA. The time series of the SSTs for this date are shown in Figure 2. First, it is encouraging to see that the Bureau H8 SSTs follow the ISAR skin SSTs very closely for the whole day (Figure 2a). Similar to the JAXA product (Figure 2b), the Bureau H8 SSTs also capture the DV amplitude well (Figure 2a). Since both studies use the same data source for ISAR and SBE38 SSTs, their time series (red and green dots) should be theoretically identical in both panels, respectively. However, in order to retain the full data set and show the DV cycle with more detail, we do not apply any QC on the data sets for this particular case study, hence the slight differences, such as the gaps at different hours, observed in the red and green dots in the two panels, respectively. The inconsistency could also be partially due to the different availabilities of the two satellite SST data sets during collocation as their retrieval algorithms and collocation methods differ. Furthermore, it is noticed that in both panels, for LST before 10 h and after 18 h, the SBE38 depth SSTs (green dots) are usually warmer than the ISAR and H8 SSTs by a few tenths of a degree, which can be a good indicator of the cool skin effect. The largest difference between SBE38 and ISAR skin SST reaches a maximum of ~0.4–0.5 °C at around local sunrise (~5–7 LST), which is consistent with the findings in [27].
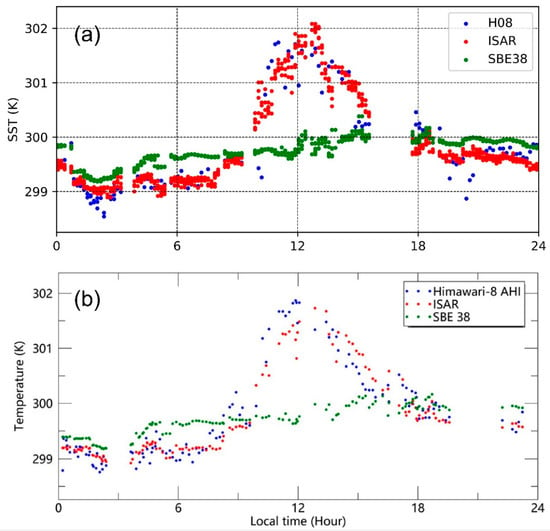
Figure 2.
A case study showing a strong DV event that occurred on 12th October 2016 over the north-eastern Australian coast (~146°E, ~18°S). The upper panel (a) is the result from this study and the lower panel (b) is from [11] (their Figure 6). Identical ISAR and SBE38 SSTs are used in both studies, but the H8 SSTs in [11] are sourced from JAXA. Note that there is no QC applied on any of the SST data sets for this case study (upper panel).
3.2. Statistics
With the confidence in the Bureau H8 L2P SST product gained from the above case study, we proceed to calculate some statistics between ISAR and H8 skin SSTs based on the matchup database. The paths for all the voyages in the quality-controlled collocation set are shown in Figure 3, for daytime and night-time separately, with the colour representing the temperature difference between H8 and ISAR SST. Note that there are a few cruises that have crossed the Southern Ocean and reached near the Antarctic coast, but these are filtered out by the relatively strict set of QC methods in this study. Most of the cruises retained are along the Australian coasts. An easy observation from Figure 3a is that there are more cold ΔTs (H8-ISAR) than warm ΔTs in the daytime, especially over the western Australian coast. In the night-time, there are more ΔTs close to zero (Figure 3b).
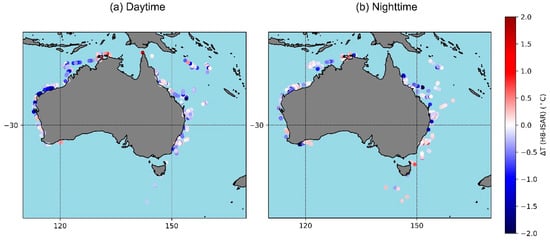
Figure 3.
Locations of the final QC’d matchups for (a) daytime and (b) night-time in this study. The colour of the dot represents the temperature difference ΔT (H8-ISAR).
Yearly and overall statistics, including the number of matchups (N), mean and median bias (satellite minus ISAR SST), SD and robust SD (RSD), and the coefficient of determination (square of correlation coefficient; R2), for daytime and night-time collocations between the H8 and ISAR SSTs are shown in Table 2. Here, an RSD is defined as the Median Absolute Difference (MAD) multiplied by 1.48. To obtain a MAD, we first calculate the median of all the ΔT (H8-ISAR) values. Then, the differences between this median and all ΔT values are calculated. Finally, we take the median of the absolute values of those differences as a MAD. For the daytime matchups, the mean and median biases are the same, being both −0.12 °C, with a SD/RSD of 0.47 °C/0.31 °C. This negative daytime mean/median bias in H8 can be seen in all the years, with the largest being −0.21 °C/−0.17 °C in 2016 and the smallest being −0.08 °C/−0.06 °C in 2019. The statistics look better in the night-time, which should be largely attributed to the adoption of the extra 3.7 µm channel in the night-time retrieval algorithm. The overall mean and median biases are −0.04 °C and 0.03 °C, respectively, much smaller than those in the daytime. Night-time SD and RSD have also seen an improvement when compared with daytime data, being 0.37 °C and 0.24 °C, respectively.

Table 2.
Statistics for daytime and night-time matchups between Bureau’s H8 SSTs and ISAR skin SSTs within each year (2016–2020) and the overall matchup database.
One year standing out from Table 2 is 2016. The daytime mean bias is the largest (−0.21 °C) of all years and the coefficient of determination is the lowest (0.95). Most interestingly, the night-time satellite data in 2016 are significantly colder than the other years (mean bias being −0.16 °C), although the median bias being −0.06 °C indicates that this could be due to cold outliers. Therefore, we examine time series of night-time ΔT (H8-ISAR) for each year and the plots are shown in Figure 4. It is easily observable that there are significantly more cold outliers (defined as ΔT < −1 °C here) in the night-time H8 data when compared with ISAR SSTs in 2016. The percentage (6.2%) is far higher than any other year. Given the relatively stable behaviours of ISAR SSTs over the years by comparing with SBE38 depth SSTs as illustrated in Table 1 (cruises that are retained), these large cold biases in night-time satellite data appear to be real signals and merit further investigation.
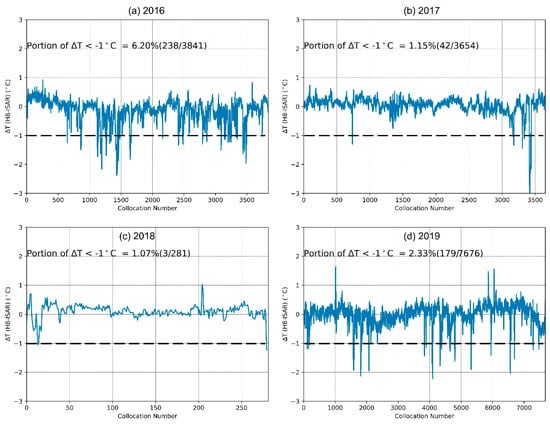
Figure 4.
Time series of night-time ΔT (H8-ISAR) for each year (panel (a) for 2016; (b) for 2017; (c) for 2018 and (d) for 2019; 2020 not shown here, as there is only 1 matchup), with the portion of cold satellite outliers (ΔT < 1 °C) indicated. The dashed black lines are reference lines at ΔT = −1 °C in each panel.
The distributions of daytime and night-time ΔTs (H8-ISAR) are shown in Figure 5. Most daytime ΔTs sit within the −0.2 °C to −0.1 °C range, corresponding to the negative mean bias (−0.12 °C), whereas the peak for the night-time ΔT distribution is seen at the 0–0.1 °C bin. As expected, daytime ΔTs have more outliers in both cold and warm tails than night-time data, hence the larger SD as observed in Table 2. There are few night-time ΔTs > 1 °C outliers but the daytime population at this warm tail is still noticeably large.
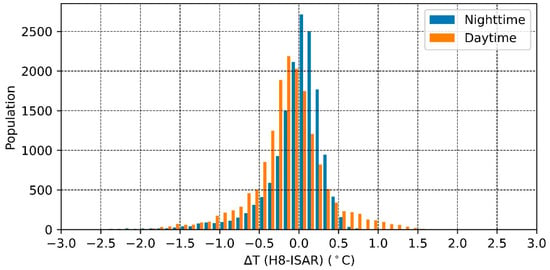
Figure 5.
Distribution of ΔTs (H8 minus ISAR SSTs) for daytime (orange; mean bias ± SD/RSD = −0.12 °C ± 0.47 °C/0.31 °C) and night-time (blue; mean bias ± SD/RSD = −0.04 °C ± 0.37 °C/0.24 °C) matchups.
Density distributions of daytime and night-time ΔTs (H8-ISAR) are further analysed against ISAR SST conditions (Figure 6). For both daytime (Figure 6a) and night-time (Figure 6b), most of the matchups are obtained under SST conditions between 15 °C and 32 °C, especially within the 25 ± 2 °C and 30 ± 2 °C ranges. More collocations for SST < 15 °C conditions are observed at night-time than in the daytime. There are significantly more warm outliers (ΔT > 1 °C) in daytime than in the night-time, as also shown in Figure 5.
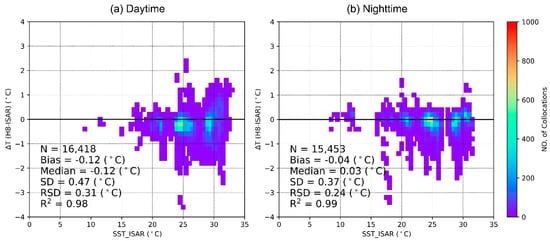
Figure 6.
Density plot of the ΔTs (H8-ISAR) distribution for (a) daytime and (b) night-time matchups against SST conditions determined by ISAR data. The colour represents the density of the matchups within each box (0.2 × 0.5 °C). The black horizontal lines at 0 °C are reference lines in both panels.
3.3. Validation under Different Environmental Conditions
The performance of the Bureau fv02 H8 L2P SST data is further evaluated under different environmental conditions, which are determined by the observations obtained simultaneously with the ISAR SSTs from RV Investigator.
3.3.1. Performance against Wind Speed
Since the AHI sensor onboard H8 samples SST at the same depth as the ISAR, in theory, we should be able to directly compare these measurements under any wind conditions without excluding calm wind conditions (i.e., U10 < 2 ms−1 in the night or <6 ms−1 in the day) to avoid DV contamination, which is commonly adopted in many satellite SST validation studies against depth SSTs. Figure 7a shows that under most wind conditions (U10 < 10 ms−1), daytime mean ΔTs are constantly below the zero line by −0.2 °C to −0.1 °C. There is no clear dependency of daytime ΔT on wind speed, which is particularly encouraging to see under calm conditions (0 < U10 < 6 ms−1) when a DV may develop. When U10 is >10 ms−1, the number of collocations reduce sharply, leading to the fluctuation in the mean biases. In Figure 7b, we see that the night-time ΔTs follow the zero line more closely throughout the wind speed range (0 < U10 < 15 ms−1), indicating the good performance of the satellite product in the night-time when compared against ISAR skin SSTs.
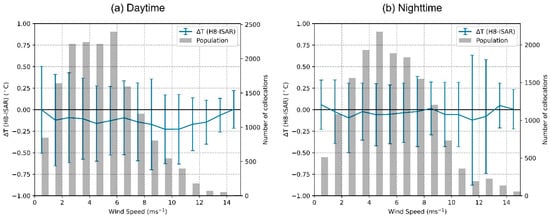
Figure 7.
Evaluation of (a) daytime and (b) night-time ΔTs (H8-ISAR) under different wind speed conditions. The blue line represents the mean bias within each 1 ms−1 wind speed bin and the error bar is the SD of the biases within that bin. The number of collocations within each bin is indicated by the grey bar.
3.3.2. Performance against SST
The dependency of ΔTs on different SST conditions is shown in Figure 8. For both daytime and night-time, as most of the collocations are obtained around Australian coasts, the temperatures colder than 18 °C are scarce, hence the jumps in biases and SDs for those bins (most obvious at night-time in Figure 8b). For warmer waters (ISAR SST > 20 °C), daytime satellite retrievals underestimate the temperatures most of the time, with a deep trough at around ~28 °C (ΔT being ~−0.35 °C). When SST exceeds 28 °C, the daytime underestimation eases and the mean bias approaches, or even slightly exceeds, 0 °C. Two large positive ΔTs are observed when SST is >32 °C. However, the collocation numbers are small and the SDs are very large (Figure 8a). In the night-time, the mean ΔTs are much closer to 0 °C and the behaviour is consistent throughout the SST range (0–33 °C) with only minor fluctuations (Figure 8b).
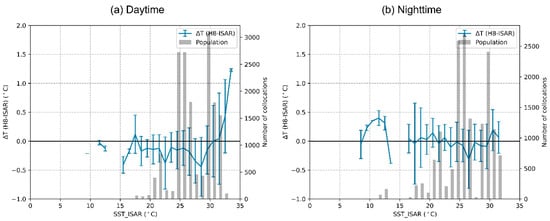
Figure 8.
Same as Figure 7 but for SST conditions (determined by ISAR) for (a) daytime and for (b) night-time.
3.3.3. Performance against Local Solar Time
Combining the daytime and night-time data together, we now validate H8 SSTs against local solar hours. In Figure 9a, most of the mean biases, ΔTs, are slightly negative (−0.05 °C to −0.20 °C) in the daytime but are much closer to 0 °C in the twilight and night-times. The underestimation of H8 SSTs exists consistently in the daytime, with a noticeable dip in mean ΔT at around −0.22 °C (Figure 9a). Given that the shortwave radiation is typically highest around 12 h LST, one is naturally intrigued to see if there is any correlation between ΔT and the shortwave flux. We plot the daytime ΔTs against solar shortwave radiation in Figure 9b. It is noticed that when the matchups are abundant (shortwave radiation < 1100 Wm−2), there is no discernible dependency of ΔT on shortwave radiation.
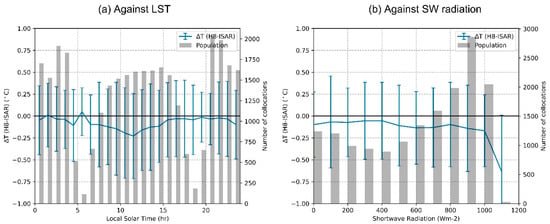
Figure 9.
Same as Figure 7 but for (a) local solar time, LST, and (b) shortwave radiation flux.
3.3.4. Performance against Relative Humidity
Water vapor existing in the atmosphere is known to pose challenges for accurate satellite SST retrieval in the IR spectrum band [35]. The dependence of ΔT on relative humidity (RH) is examined to evaluate the performance of Bureau fv02 H8 L2P SST retrievals. As shown in both panels in Figure 10, the most common RH values range from 40% to 90%, peaking at 70–75% in the daytime (Figure 10a) and at 75–80% in the night-time (Figure 10b). In the daytime, when RH is <60%, H8 tends to underestimate water temperatures by −0.25 °C to −0.05 °C. When RH is >60%, the absolute values of the negative biases decrease, with also significantly larger matchup sizes (Figure 10a). During the night, most of the mean ΔTs are very close to the zero line (Figure 10b). The jumps at both ends should again be due to the small matchup sizes.
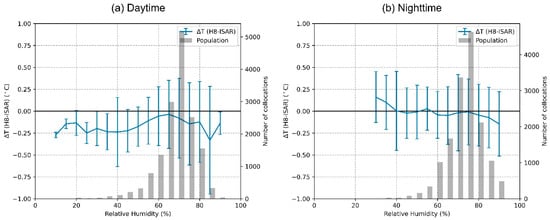
Figure 10.
Same as Figure 7 but for RH for (a) daytime and (b) night-time.
4. Discussion
The overall statistics for the Bureau H8 fv02 L2P SST product when compared against ISAR SSTs are comparable to previous studies. In this study, with 16,418 collocations, the daytime mean and median biases are both −0.12 °C, with an SD/RSD of 0.47 °C/0.31 °C. Night-time statistics are better, with a matchup size of 15,453, a mean/median bias of −0.04 °C/0.03 °C, and an SD/RSD of 0.37 °C/0.24 °C. These numbers are comparable with previous studies. For example, mixing daytime and night-time data together, Ref. [5] found a bias of −0.16 °C with a root-mean-square error of 0.59 °C when comparing JAXA H8 SSTs against drifting buoys and tropical moorings for June to September 2015. In addition, Ref. [8] validated the NOAA ACSPO H8 SSTs against tropical moorings and buoys in the Australian Great Barrier Reef region for August to October 2015, and found that H8 SST has a mean bias of 0.18 °C with a SD of 0.53 °C for both daytime and night-time data. Importantly, note that these two studies evaluate H8 data against depth in situ SSTs.
A more direct and fair comparison can be made between this study and [11], which used the same source of ISAR and SBE38 depth SSTs to validate the JAXA H8 SST data set for 2016 and 2017. With 2701 matchups (without differentiating daytime and night-time), Ref. [11] found a mean bias of 0.09 °C with a SD of 0.30 °C between H8 and ISAR SSTs. Their SD is smaller than either the daytime (SD = 0.47 °C) or night-time (SD = 0.37 °C) SDs in this study. They also validated separately daytime and night-time H8 data in a case study using ISAR data from only one cruise (IN2016_V05). To make the comparison most relevant, we conducted the same case study using also only voyage IN2016_V05 and the results are shown in Table 3. In [11], they found that, on average, daytime JAXA H8 SSTs are 0.13 °C warmer than the ISAR skin SST, and the night-time mean bias is 0.00 °C (their Table 3). Instead of an overestimation, in this study, we found an underestimation of SST in both daytime and night-time Bureau H8 SST data. This is consistent with the negative biases found in year 2016 from Table 2 and Figure 4 in this study. Their daytime SD/RSD is 0.27 °C/0.26 °C and their night-time SD/RSD is 0.25 °C/0.21 °C, all smaller than those in this study. The reasons for such differences are many. First, different satellite SST retrieval algorithms are adopted in these two agencies. Different channels are used to retrieve SST at JAXA (10.4, 11.2, and 8.6 μm) and at the Bureau (0.64, 0.86, 10.4, and 12.4 μm for daytime; 3.9, 10.4, and 12.4 μm for night-time). The RTM model versions (JAXA employing RTTOV 10.2 and the Bureau using RTTOV 12.3), NWP inputs, and cloud masking methods all differ between JAXA and the Bureau. Then, the spatial windows during collocation are different: we use a 5 km threshold but they used 0.02°. In [11], they required that all pixels within a 7 by 7 pixel window centred around a target QL = 5 satellite pixel should be of QL = 5, which is not adopted in this study. Although the QC on the ISAR SST data in both studies are the same, no cutting of higher wind conditions (U10 > 15 ms−1) was performed in [11]. In addition, the matchup sizes in these two studies are different, with our collocation sizes being significantly larger than those in [11]. The 7 by 7 pixel window in [11] would have significantly reduced matchups with cloud-affected (and therefore colder) H8 SST retrievals. Finally, there might be more cold outliers in the Bureau fv02 H8 L2P SST data set for year 2016, as seen in Figure 4, which warrants further investigation.

Table 3.
Statistics for the matchups between Bureau’s H8 SSTs and ISAR skin SSTs for cruise IN_2016_V05 only. Results from [11] (part of their Table 5) are also included here.
In addition to the above environmental conditions listed in the Results section (wind speed, SST, LST, RH), we have also examined the performance of the satellite data against air–sea temperature differences (ΔTair-sea; ISAR SSTs are used here to represent sea surface temperatures). Although it has been proven that a small ΔTair-sea affects the physical satellite SST retrieval accuracy only marginally, a large ΔTair-sea could still potentially have a significant effect, especially in coastal regions where greater extremes may exist [36,37]. However, in this study, there is no noticeable dependency of ΔT on ΔTair-sea observed as most ΔT values fall just below the 0 °C line.
5. Conclusions
Five years (2016–2020) of the Bureau of Meteorology’s physically retrieved Himawari-8 SST L2P product have been evaluated, for daytime and night-time separately, against ISAR skin SST measurements obtained from RV Investigator. The paths of the cruises are mostly along Australian coasts. After quality control on all SST (ISAR, H8, and SBE38 depth) measurements, a large matchup database is generated with the collocation number being 16,418 for the daytime and 15,453 for the night-time. A case study is carried out first, in which the Bureau H8 L2P SST product captured a strong DV event that occurred on 12 October 2016 over the north-eastern Australian coast. Statistically, for the daytime, an overall negative mean bias (−0.12 °C) is observed between the satellite and ISAR SSTs with an SD/RSD of 0.47 °C/0.31 °C. Night-time statistics are better with a mean/median bias of −0.04 °C/0.03 °C and an SD/RSD of 0.37 °C/0.24 °C. These results are comparable to previous studies. Over the study period (2016–2020), daytime H8 SST data underestimate the temperatures by more than one tenth of a degree Celsius for most of the years. On the contrary, the night-time average mean ΔT is close to 0 °C for the whole period except for 2016, when a negative mean/median bias of −0.16 °C/−0.06 °C is observed due to the abnormally large number of cold outliers (Figure 4).
When validating under different environmental conditions, daytime and night-time H8 SST data behave slightly differently. A cold bias can be seen during daytime under almost all environmental conditions, including for most values of wind speed (U10 < 15 ms−1; Figure 7a), SST (ISAR SST < 30 °C; Figure 8a), and relative humidity (Figure 10a). On the other hand, the performance of the night-time H8 SST product is more optimal under nearly all meteorological conditions, with the mean bias being usually very close to 0 °C.
Overall, this study shows that the ISAR skin SSTs produced by the Bureau and CSIRO are of good quality and can be confidently used as a fiducial source of ‘ground truth’ for satellite IR SST retrieval validations. The Bureau fv02 H8 L2P SST product displays high sensitivity to the skin temperature variation, and shows overall good performance, especially during night-time, under different environmental conditions. Nonetheless, the underestimation of SSTs in the daytime found in this product should merit further investigation. The unusually many cold outliers during night-time in year 2016 is another interesting topic for a future study. The reasons identified can potentially help to improve the retrieval process.
Author Contributions
H.B. and H.Z. contributed the main idea. H.Z. processed part of the RV Investigator ISAR and SBE 38 SST data. P.D.G. produced the satellite product. C.G. generated the matchup database. H.Z. processed the matchups and wrote the original manuscript. All authors have reviewed and improved the paper. All authors have read and agreed to the published version of the manuscript.
Funding
This research was supported by the IMOS project and Australian Bureau of Meteorology.
Data Availability Statement
The fv02 H8 L2P data are available from the National Computational Infrastructure (Bureau of Meteorology, 2022). The ISAR, SBE38, and meteorological data were collected and processed by the Australian Marine National Facility and Bureau, and sourced from the IMOS ISAR_QC Thredds directories from the Australian Ocean Data Network (http://thredds.aodn.org.au/thredds/catalog/IMOS/SOOP/SOOP-ASF/VLMJ_Investigator/meteorological_sst_observations/YYYY/ISAR_QC/catalog.html, where “YYYY” is “2016” through to “2020”, accessed on 20 April 2023).
Acknowledgments
Australia’s Integrated Marine Observing System (IMOS) is enabled by the National Collaborative Research Infrastructure Strategy (NCRIS). It is operated by a consortium of institutions as an unincorporated joint venture, with the University of Tasmania as Lead Agent. The IMOS fv02 H8 L2P SST data were processed by the Australian Bureau of Meteorology (Bureau) from Level 1 data supplied by the Japan Aerospace Exploration Agency (JAXA) from the Japan Meteorological Agency’s Himawari-8 spacecraft. We would also like to acknowledge Nicole Morgan and Janice Sisson for help in processing the ISAR data, and John Mittaz and Owen Embury for help in generating the H8 fv02 L2P SST product. We appreciate the useful comments and suggestions from two Bureau internal reviewers, Caroline Poulsen and Vincent Villani, which have improved this paper.
Conflicts of Interest
The authors declare no conflict of interest.
References
- Hollmann, R.; Merchant, C.J.; Saunders, R.; Downy, C.; Buchwitz, M.; Cazenave, A.; Chuvieco, E.; Defourny, P.; de Leeuw, G.; Forsberg, R. The ESA Climate Change Initiative: Satellite Data Records for Essential Climate Variables. Bull. Am. Meteorol. Soc. 2013, 94, 1541–1552. [Google Scholar] [CrossRef]
- Minnett, P.J.; Alvera-Azcárate, A.; Chin, T.M.; Corlett, G.K.; Gentemann, C.L.; Karagali, I.; Li, X.; Marsouin, A.; Marullo, S.; Maturi, E.; et al. Half a Century of Satellite Remote Sensing of Sea-Surface Temperature. Remote Sens. Environ. 2019, 233, 111366. [Google Scholar] [CrossRef]
- Deser, C.; Alexander, M.A.; Xie, S.-P.; Phillips, A.S. Sea Surface Temperature Variability: Patterns and Mechanisms. Ann. Rev. Mar. Sci. 2010, 2, 115–143. [Google Scholar] [CrossRef] [PubMed]
- Tandeo, P.; Chapron, B.; Ba, S.; Autret, E.; Fablet, R. Segmentation of Mesoscale Ocean Surface Dynamics Using Satellite SST and SSH Observations. IEEE Trans. Geosci. Remote Sens. 2013, 52, 4227–4235. [Google Scholar] [CrossRef]
- Kurihara, Y.; Murakami, H.; Kachi, M. Sea Surface Temperature from the New Japanese Geostationary Meteorological Himawari-8 Satellite. Geophys. Res. Lett. 2016, 43, 1234–1240. [Google Scholar] [CrossRef]
- Kramar, M.; Ignatov, A.; Petrenko, B.; Kihai, Y.; Dash, P. Near Real Time SST Retrievals from Himawari-8 at NOAA Using ACSPO System. In Proceedings of the Ocean Sensing and Monitoring VIII SPIE, Baltimore, MD, USA, 17–21 April 2016; Volume 9827, pp. 149–159. [Google Scholar]
- Govekar, P.; Mittaz, J.; Griffin, C.; Beggs, H. Himawari-8 and Multi-sensor sea surface temperature products and their applications. In Proceedings of the 22nd GHRSST Science Team Meeting, Virtual, 7–11 June 2021; Available online: https://www.foo.org.au/wp-content/uploads/2021/11/Govekar_FOO_2021.pdf (accessed on 20 April 2023).
- Ditri, A.L.; Minnett, P.J.; Liu, Y.; Kilpatrick, K.; Kumar, A. The Accuracies of Himawari-8 and MTSAT-2 Sea-Surface Temperatures in the Tropical Western Pacific Ocean. Remote Sens. 2018, 10, 212. [Google Scholar] [CrossRef]
- Park, K.-A.; Woo, H.-J.; Chung, S.-R.; Cheong, S.-H. Development of Sea Surface Temperature Retrieval Algorithms for Geostationary Satellite Data (Himawari-8/AHI). Asia-Pac. J. Atmos. Sci. 2020, 56, 187–206. [Google Scholar] [CrossRef]
- Tu, Q.; Hao, Z. Validation of Sea Surface Temperature Derived from Himawari-8 by JAXA. IEEE J. Sel. Top. Appl. Earth Obs. Remote Sens. 2020, 13, 448–459. [Google Scholar] [CrossRef]
- Yang, M.; Guan, L.; Beggs, H.; Morgan, N.; Kurihara, Y.; Kachi, M. Comparison of Himawari-8 AHI SST with Shipboard Skin SST Measurements in the Australian Region. Remote Sens. 2020, 12, 1237. [Google Scholar] [CrossRef]
- Donlon, C.; Robinson, I.S.; Wimmer, W.; Fisher, G.; Reynolds, M.; Edwards, R.; Nightingale, T.J. An Infrared Sea Surface Temperature Autonomous Radiometer (ISAR) for Deployment Aboard Volunteer Observing Ships (VOS). J. Atmos. Ocean. Technol. 2008, 25, 93–113. [Google Scholar] [CrossRef]
- Bureau of Meteorology. Version fv02 IMOS Himawari-8 Level 2 Pre-Processed (L2P) Single Scene SST Dataset. Bureau of Meteorology Satellite Sea Surface Temperature (SST) Collection (Collection). 2022. NCI Australia. Available online: https://geonetwork.nci.org.au/geonetwork/srv/eng/catalog.search#/metadata/f4670_9414_6533_6479 (accessed on 20 April 2023).
- Saunders, R.; Hocking, J.; Turner, E.; Rayer, P.; Rundle, D.; Brunel, P.; Vidot, J.; Roquet, P.; Matricardi, M.; Geer, A. An Update on the RTTOV Fast Radiative Transfer Model (Currently at Version 12). Geosci. Model Dev. 2018, 11, 2717–2737. [Google Scholar] [CrossRef]
- Hocking, J.; Rayer, P.; Rundle, D.; Saunders, R.; Matricardi, M.; Geer, A.; Brunel, P.; Vidot, J. RTTOV V12 Users Guide. Available online: https://nwp-saf.eumetsat.int/site/download/documentation/rtm/docs_rttov12/users_guide_rttov12_v1.3.pdf (accessed on 20 April 2023).
- Merchant, C.J.; Harris, A.R.; Maturi, E.; MacCallum, S. Probabilistic Physically Based Cloud Screening of Satellite Infrared Imagery for Operational Sea Surface Temperature Retrieval. Q. J. R. Meteorol. Soc. A J. Atmos. Sci. Appl. Meteorol. Phys. Oceanogr. 2005, 131, 2735–2755. [Google Scholar] [CrossRef]
- Puri, K.; Dietachmayer, G.; Steinle, P.; Dix, M.; Rikus, L.; Logan, L.; Naughton, M.; Tingwell, C.; Xiao, Y.; Barras, V. Implementation of the Initial ACCESS Numerical Weather Prediction System. Aust. Meteorol. Oceanogr. J. 2013, 63, 265–284. [Google Scholar] [CrossRef]
- Embury, O.; Merchant, C.J.; Corlett, G.K. A Reprocessing for Climate of Sea Surface Temperature from the Along-Track Scanning Radiometers: Initial Validation, Accounting for Skin and Diurnal Variability Effects. Remote Sens. Environ. 2012, 116, 62–78. [Google Scholar] [CrossRef]
- Merchant, C.J.; Le Borgne, P.; Marsouin, A.; Roquet, H. Optimal Estimation of Sea Surface Temperature from Split-Window Observations. Remote Sens. Environ. 2008, 112, 2469–2484. [Google Scholar] [CrossRef]
- Donlon, C.J.; Casey, K.S.; Robinson, I.S.; Gentemann, C.L.; Reynolds, R.W.; Barton, I.; Arino, O.; Stark, J.; Rayner, N.; LeBorgne, P.; et al. The GODAE High-Resolution Sea Surface Temperature Pilot Project. Oceanography 2009, 22, 34–45. [Google Scholar] [CrossRef]
- Petrenko, B.; Ignatov, A.; Kihai, Y.; Dash, P. Sensor-Specific Error Statistics for SST in the Advanced Clear-Sky Processor for Oceans. J. Atmos. Ocean. Technol. 2016, 33, 345–359. [Google Scholar] [CrossRef]
- Zhang, H.; Babanin, A.V.; Ignatov, A.; Petrenko, B. Initial Evaluation of the Sensor-Specific Error Statistics in the NOAA Advanced Clear-Sky Processor for Oceans SST System: Diurnal Variation Signals Captured. IEEE Geosci. Remote Sens. Lett. 2018, 15, 1642–1646. [Google Scholar] [CrossRef]
- Griffin, C.; Beggs, H.; Majewski, L. GHRSST Compliant AVHRR SST Products over the Australian Region—Version 1; Technical Report; Bureau of Meteorology: Melbourne, Australia, 2017; 151p. Available online: http://imos.org.au/fileadmin/user_upload/shared/SRS/SST/GHRSST-DOC-basic-v1.0r1.pdf (accessed on 20 April 2023).
- Beggs, H.; Morgan, N.; Sisson, J. IMOS Ship SST for Satellite SST Validation. In Proceedings of the GHRSST XVIII Science Team Meeting, Qingdao, China, 5–9 June 2017; ISSN 2014-2529. pp. 127–134. Available online: https://repository.oceanbestpractices.org/handle/11329/2074 (accessed on 20 April 2023).
- Wimmer, W.; Robinson, I.S. The ISAR Instrument Uncertainty Model. J. Atmos. Ocean. Technol. 2016, 33, 2415–2433. [Google Scholar] [CrossRef]
- Donlon, C.J.; Wimmer, W.; Robinson, I.; Fisher, G.; Ferlet, M.; Nightingale, T.; Bras, B. A Second-Generation Blackbody System for the Calibration and Verification of Seagoing Infrared Radiometers. J. Atmos. Ocean. Technol. 2014, 31, 1104–1127. [Google Scholar] [CrossRef]
- Zhang, H.; Beggs, H.; Ignatov, A.; Babanin, A.V. Nighttime Cool Skin Effect Observed from Infrared SST Autonomous Radiometer (ISAR) and Depth Temperatures. J. Atmos. Ocean. Technol. 2020, 37, 33–46. [Google Scholar] [CrossRef]
- Schulz, E.; Sisson, J.; Beggs, H. Quality Control Procedure for IMOS Real-Time Meteorological and Sea Surface Observations, and Air-Sea Fluxes from Research Vessel and Mooring Platforms; Bureau Research Report No. 059; National Library of Australia Cataloguing-in-Publication Entry: Canberra, Australia, 2021; p. 14. Available online: http://www.bom.gov.au/research/publications/researchreports/BRR-059.pdf (accessed on 20 April 2023).
- Smith, S.D. Coefficients for Sea Surface Wind Stress, Heat Flux, and Wind Profiles as a Function of Wind Speed and Temperature. J. Geophys. Res. Oceans 1988, 93, 15467–15472. [Google Scholar] [CrossRef]
- IMOS. IMOS Quality Controlled ISAR SST, SBE38 SST and Meteorological Data from RV Investigator. 2022. Available online: http://thredds.aodn.org.au/thredds/catalog/IMOS/SOOP/SOOP-ASF/VLMJ_Investigator/meteorological_sst_observations/YYYY/ISAR_QC/catalog.html (accessed on 20 April 2023).
- Merchant, C.J.; Embury, O.; Bulgin, C.E.; Block, T.; Corlett, G.K.; Fiedler, E.; Good, S.A.; Mittaz, J.; Rayner, N.A.; Berry, D. Satellite-Based Time-Series of Sea-Surface Temperature since 1981 for Climate Applications. Sci. Data 2019, 6, 223. [Google Scholar] [CrossRef]
- Donlon, C.J.; Minnett, P.J.; Gentemann, C.; Nightingale, T.J.; Barton, I.J.; Ward, B.; Murray, M.J. Toward Improved Validation of Satellite Sea Surface Skin Temperature Measurements for Climate Research. J. Clim. 2002, 15, 353–369. [Google Scholar] [CrossRef]
- Fairall, C.W.; Bradley, E.F.; Godfrey, J.S.; Wick, G.A.; Edson, J.B.; Young, G.S. Cool-Skin and Warm-Layer Effects on Sea Surface Temperature. J. Geophys. Res. C Oceans 1996, 101, 1295–1308. [Google Scholar] [CrossRef]
- Minnett, P.J.; Smith, M.; Ward, B. Measurements of the Oceanic Thermal Skin Effect. Deep Sea Res. Part II Top. Stud. Oceanogr. 2011, 58, 861–868. [Google Scholar] [CrossRef]
- Sobrino, J.A.; Li, Z.-L.; Stoll, M.P. Impact of the Atmospheric Transmittance and Total Water Vapor Content in the Algorithms for Estimating Satellite Sea Surface Temperatures. IEEE Trans. Geosci. Remote Sens. 1993, 31, 946–952. [Google Scholar] [CrossRef]
- May, D.A.; Holyer, R.J. Sensitivity of Satellite Multichannel Sea Surface Temperature Retrievals to the Air-sea Temperature Difference. J. Geophys. Res. Oceans 1993, 98, 12567–12577. [Google Scholar] [CrossRef]
- Zavody, A.M.; Mutlow, C.T.; Llewellyn-Jones, D.T. A Radiative Transfer Model for Sea Surface Temperature Retrieval for the Along-track Scanning Radiometer. J. Geophys. Res. Oceans 1995, 100, 937–952. [Google Scholar] [CrossRef]
Disclaimer/Publisher’s Note: The statements, opinions and data contained in all publications are solely those of the individual author(s) and contributor(s) and not of MDPI and/or the editor(s). MDPI and/or the editor(s) disclaim responsibility for any injury to people or property resulting from any ideas, methods, instructions or products referred to in the content. |
© 2023 by the authors. Licensee MDPI, Basel, Switzerland. This article is an open access article distributed under the terms and conditions of the Creative Commons Attribution (CC BY) license (https://creativecommons.org/licenses/by/4.0/).