Accuracy Verification of Satellite Products and Temporal and Spatial Distribution Analysis and Prediction of the CH4 Concentration in China
Abstract
1. Introduction
2. Materials and Methods
2.1. AIRS V7 CH4 Product
2.2. Ground Measurements of CH4 Concentration
2.3. Methodology
- First, it is determined whether the CH4 concentration sequence remains stable. If the sequence is stable, we can proceed to the next step. Conversely, we can obtain a stable sequence through differential processing. The augmented Dickey–Fuller unit root test method is a strict statistical test method that relies on whether a unit root exists in the time series. If the sequence is nonstationary, a unit root occurs. In the case of a stationary sequence, there is no unit root;
- In determining whether the CH4 concentration sequence is a white noise sequence, the white noise test method is also known as the pure randomness test method. When the data are purely random, the sequence provides no research significance, so it is necessary to perform a white noise test of the sequence to ensure that the data can be used for analysis. If a white noise sequence exists, then it is unsuitable for SARIMA model analysis. Conversely, we can proceed to the next step;
- The order of the model is determined by both the autocorrelation function (ACF) and partial autocorrelation function (PACF), and the minimum information criterion (the Akaike information criterion, hereinafter referred to as AIC) is used to determine the model order (p,d,q) and (P,D,Q)s;
- Modeling and residual analysis are performed;
- The trained SARIMA model is used to generate forecasts based on the time series data;
- The results are finally evaluated in terms of forecasting accuracy via the mean absolute error (MAE), mean square error (MSE), and RMSE.
3. Results
3.1. Verification of the Accuracy of AIRS Measurement Data
3.2. Spatial Variations of CH4 from AIRS over China
3.3. Interannual Variation in the CH4 Concentration in China
3.4. Seasonal Variation in the CH4 Concentration in China
3.5. Influence of Human Factors on Atmospheric CH4 Concentrations in China
3.6. SARIMA Model Prediction of the CH4 Concentration Trend
4. Conclusions
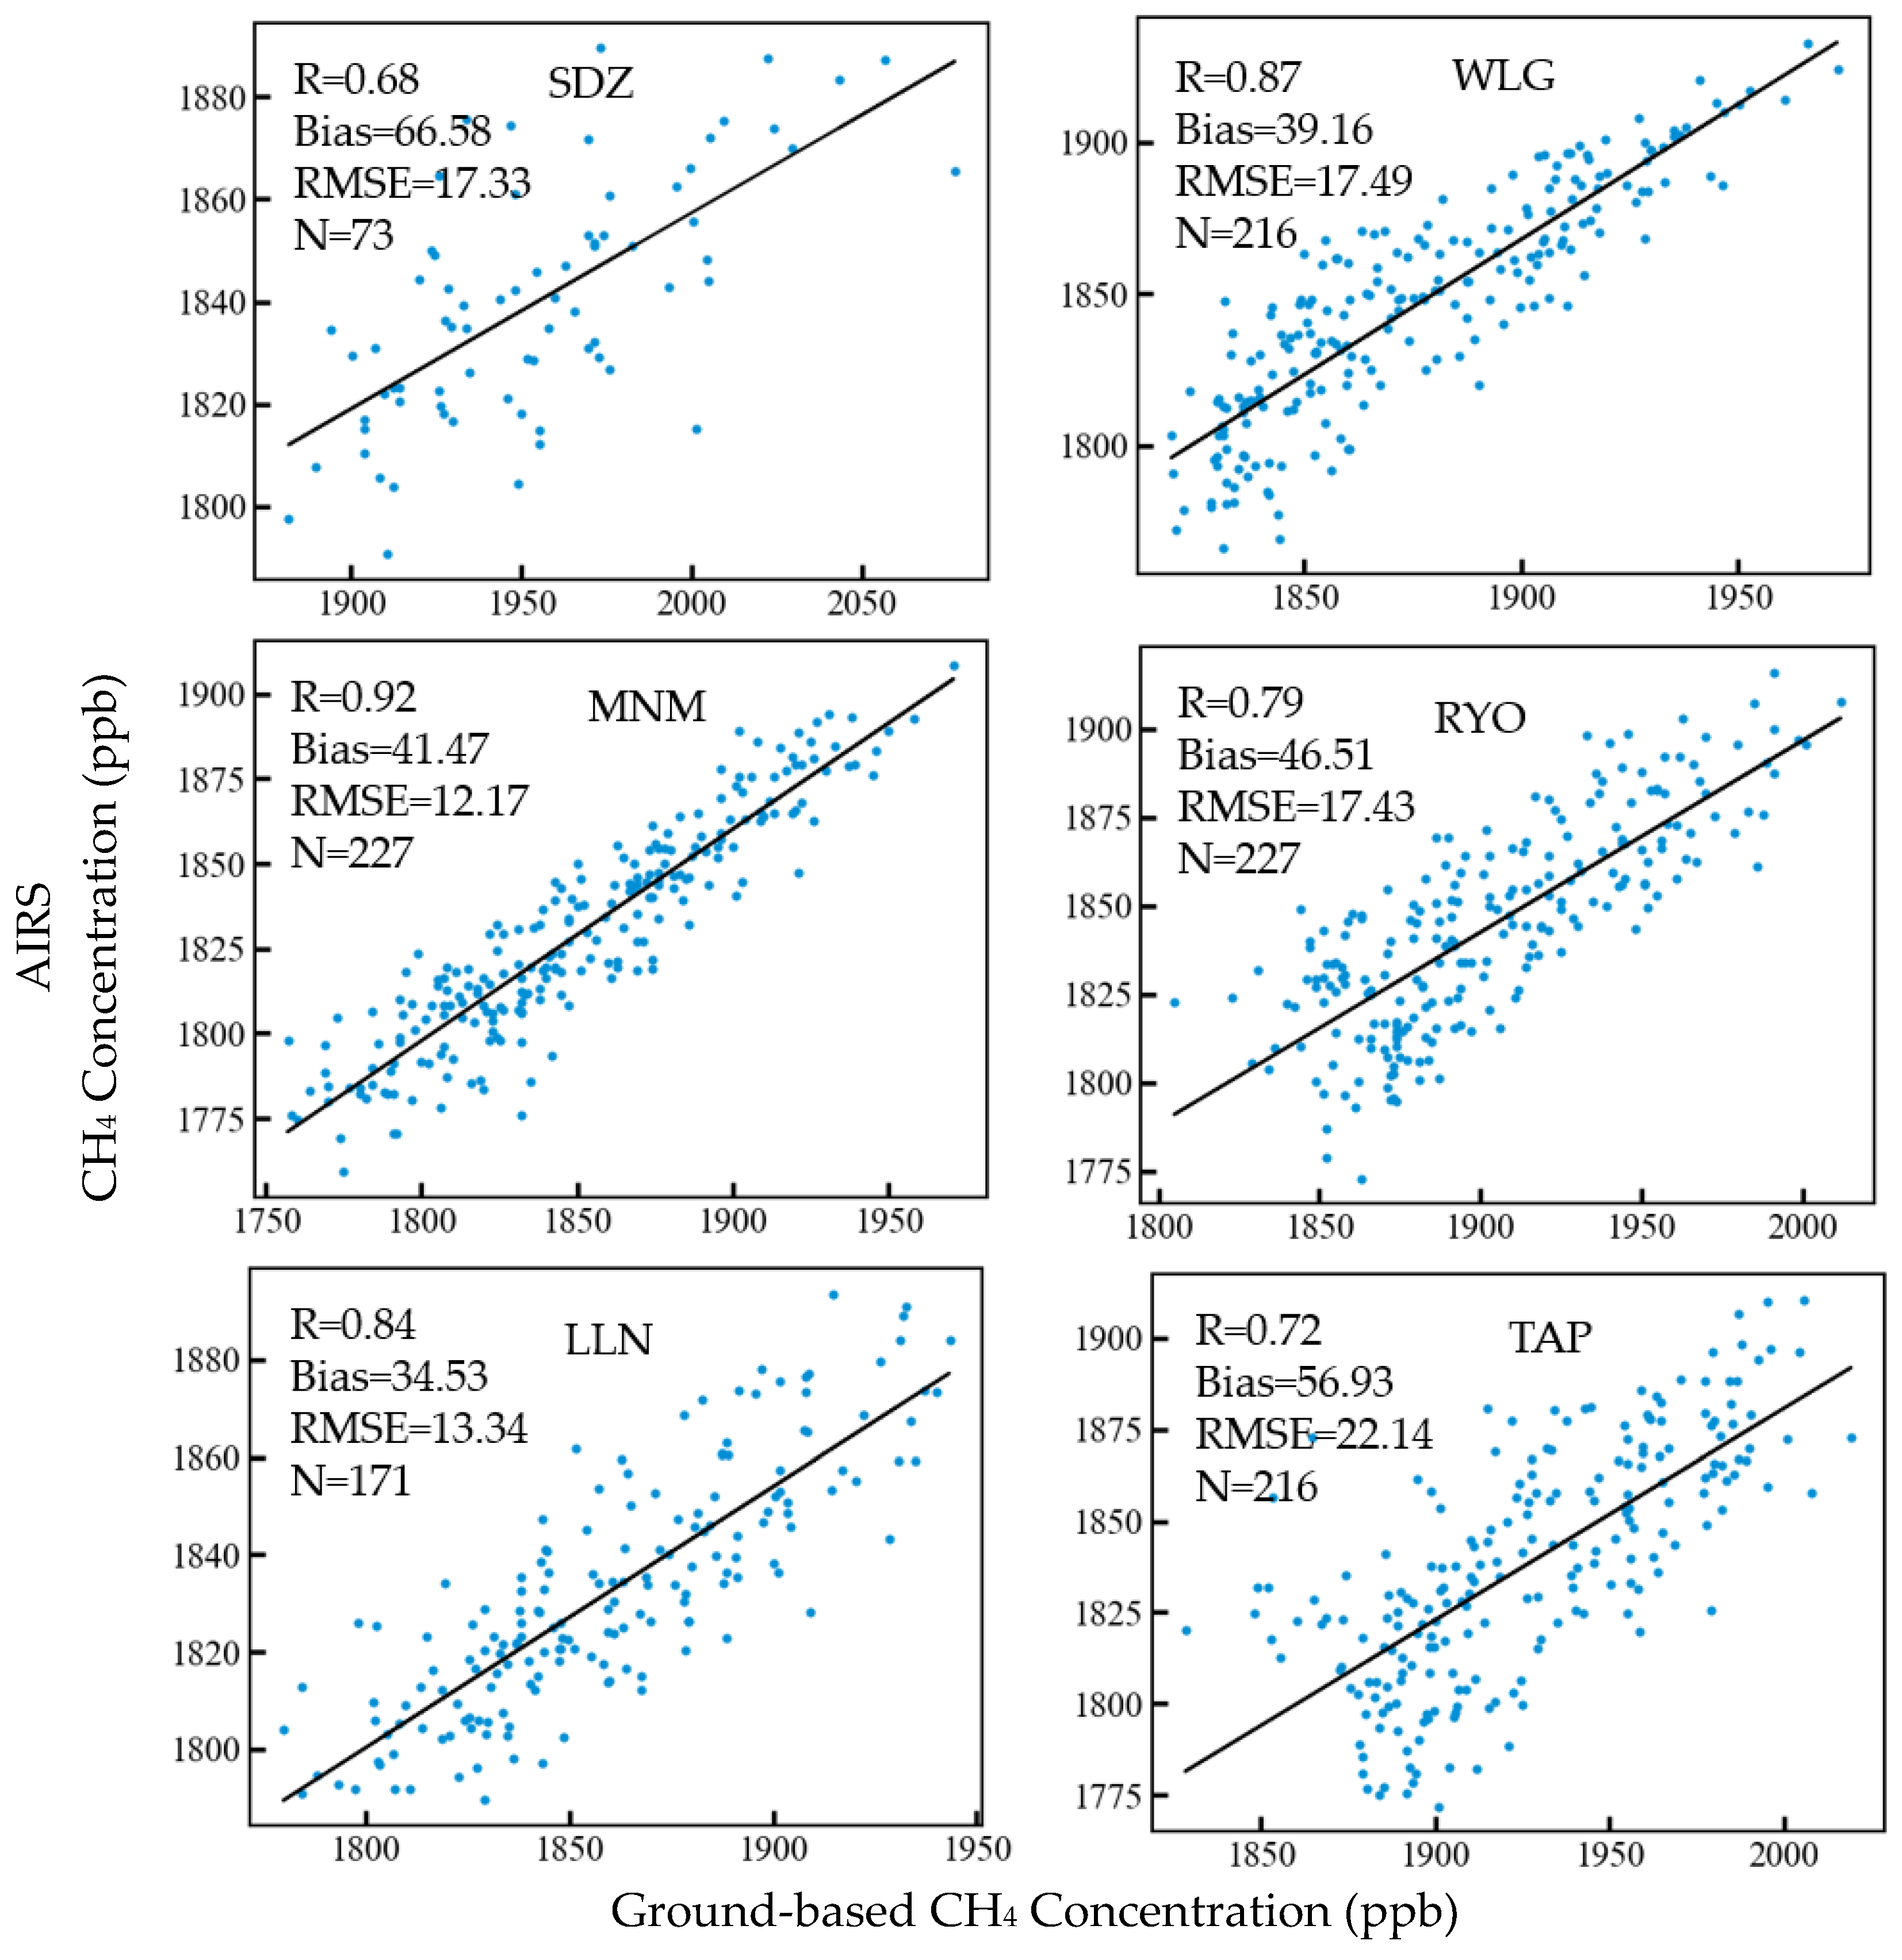
- The CH4 concentration data retrieved by the AIRS sensor and the ground observations exhibited a suitable correlation. The correlation coefficient relative to the WLG ground station was 0.87, and the correlation coefficient relative to the MNM ground station was 0.92. Therefore, the statistical p-value was less than 0.01, and the significant relationship could be used to analyze the change characteristics of the near-ground CH4 concentration in China;
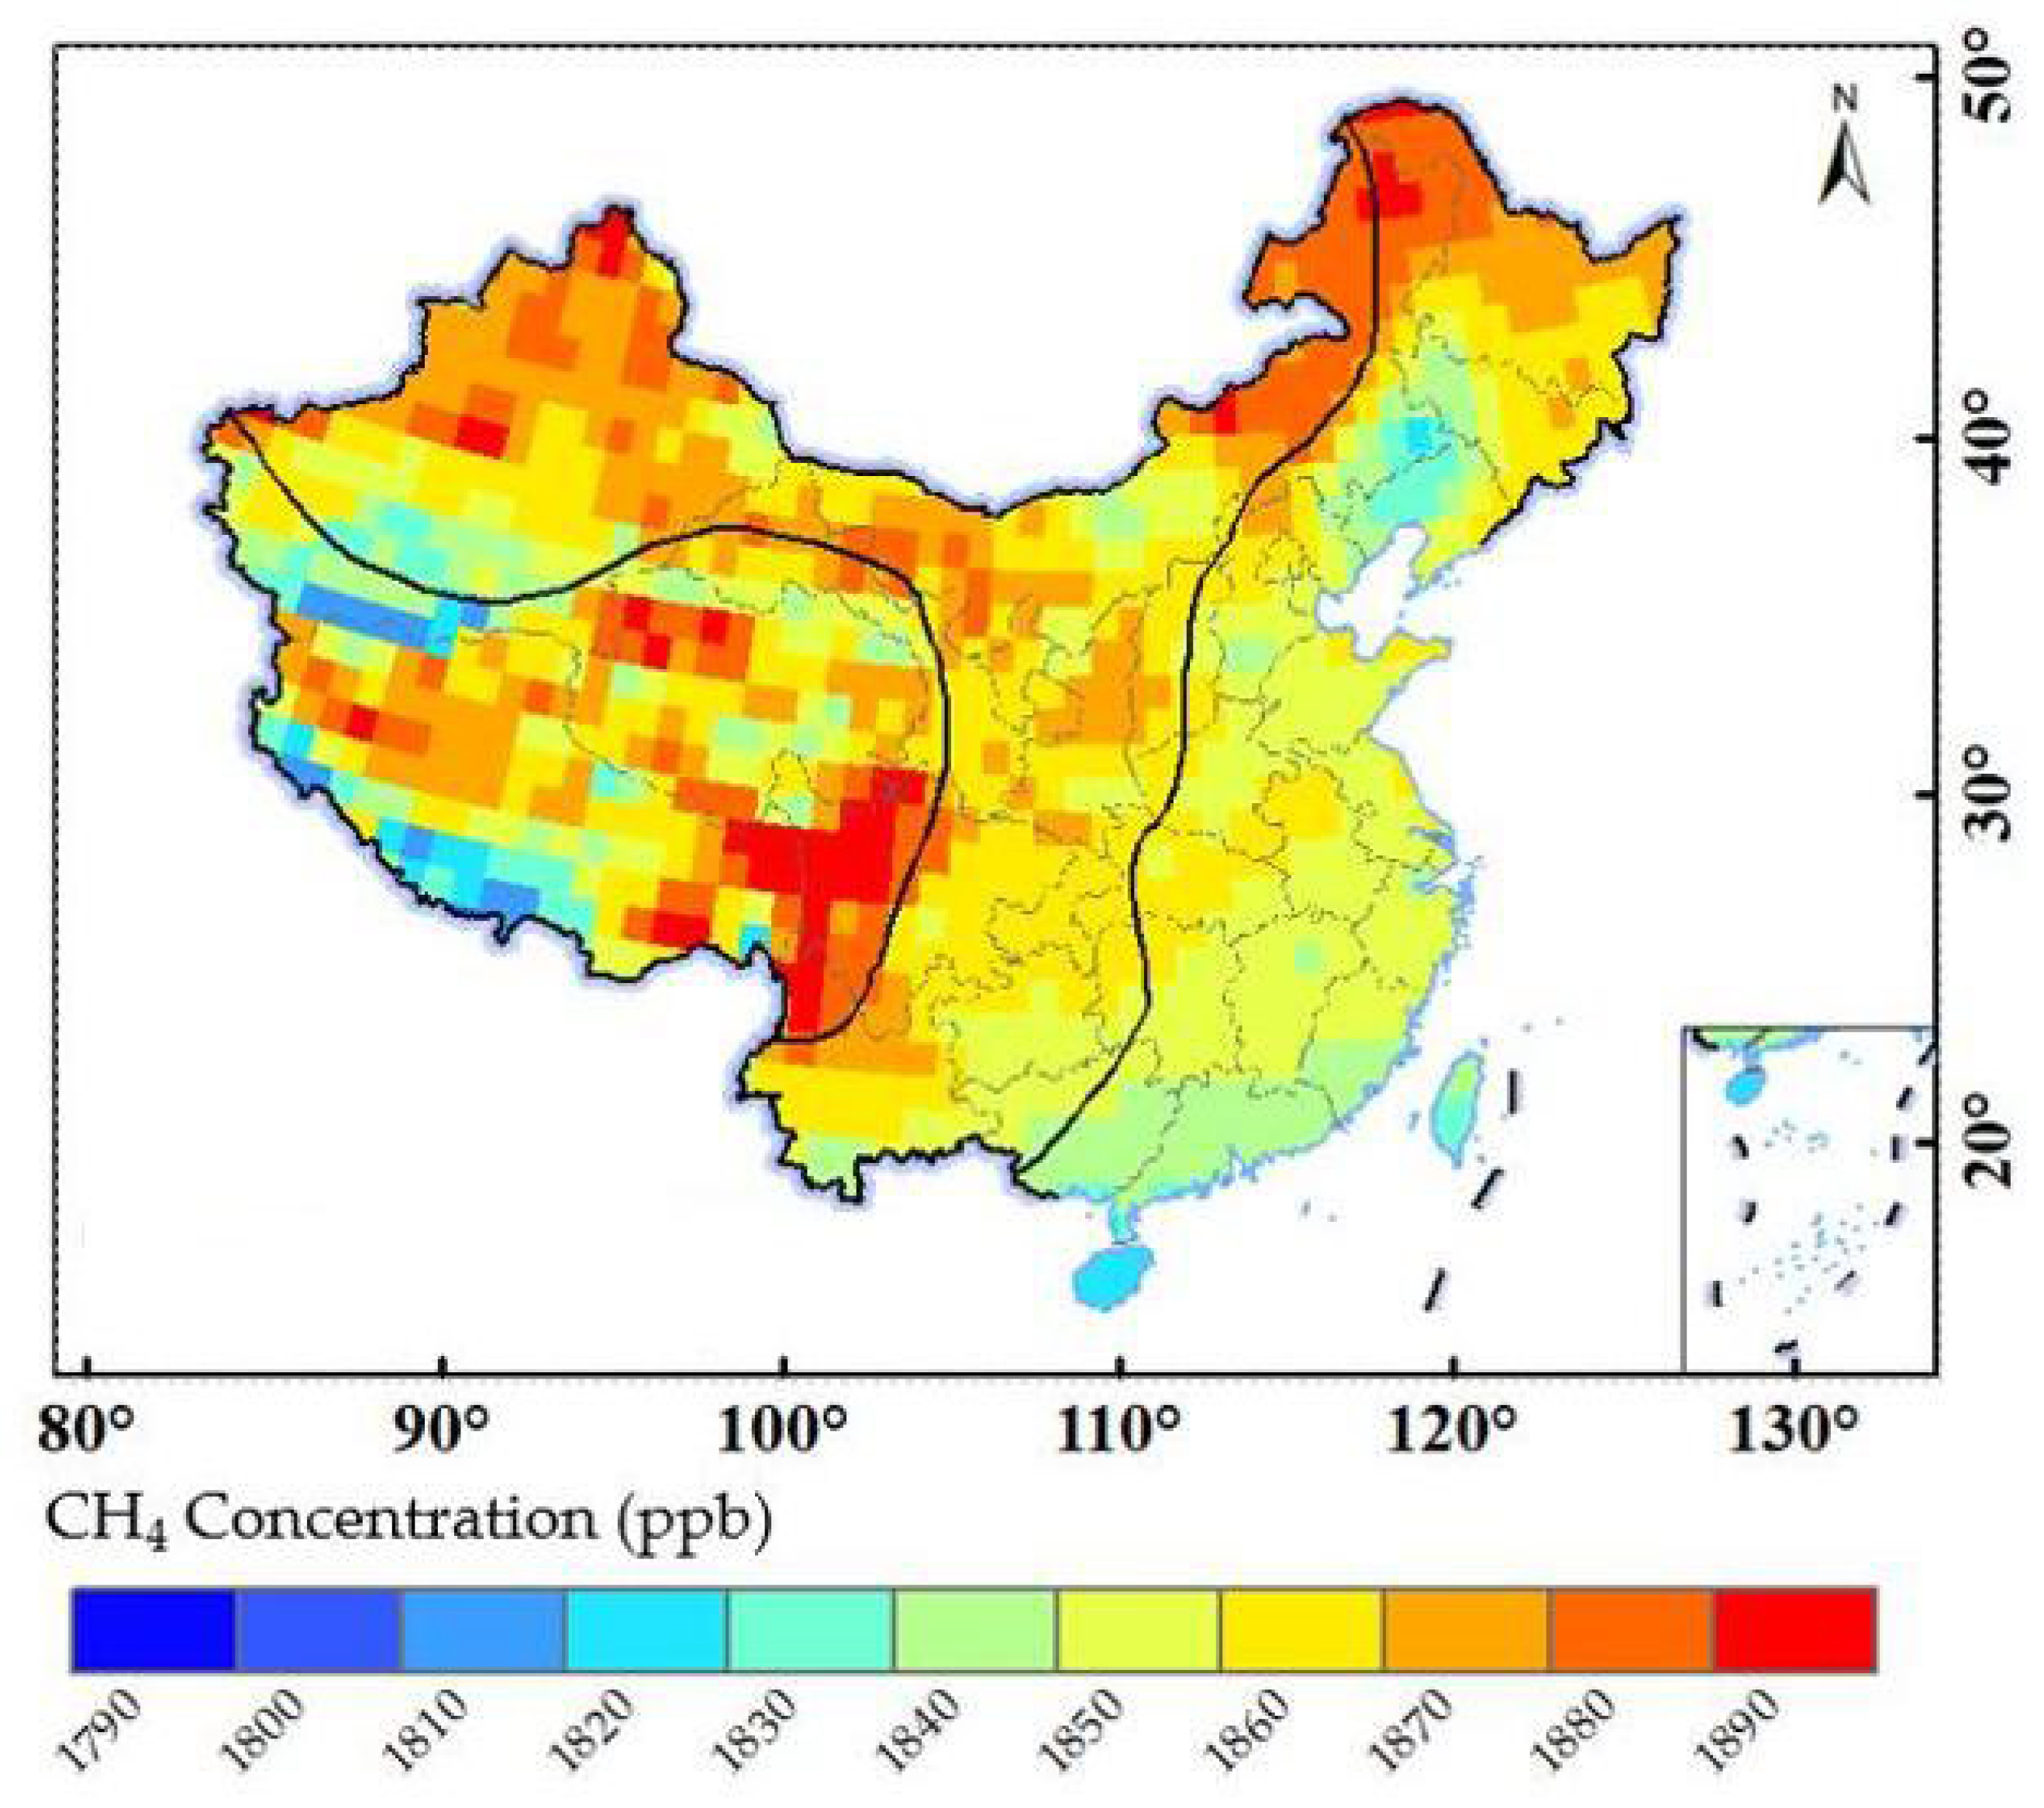
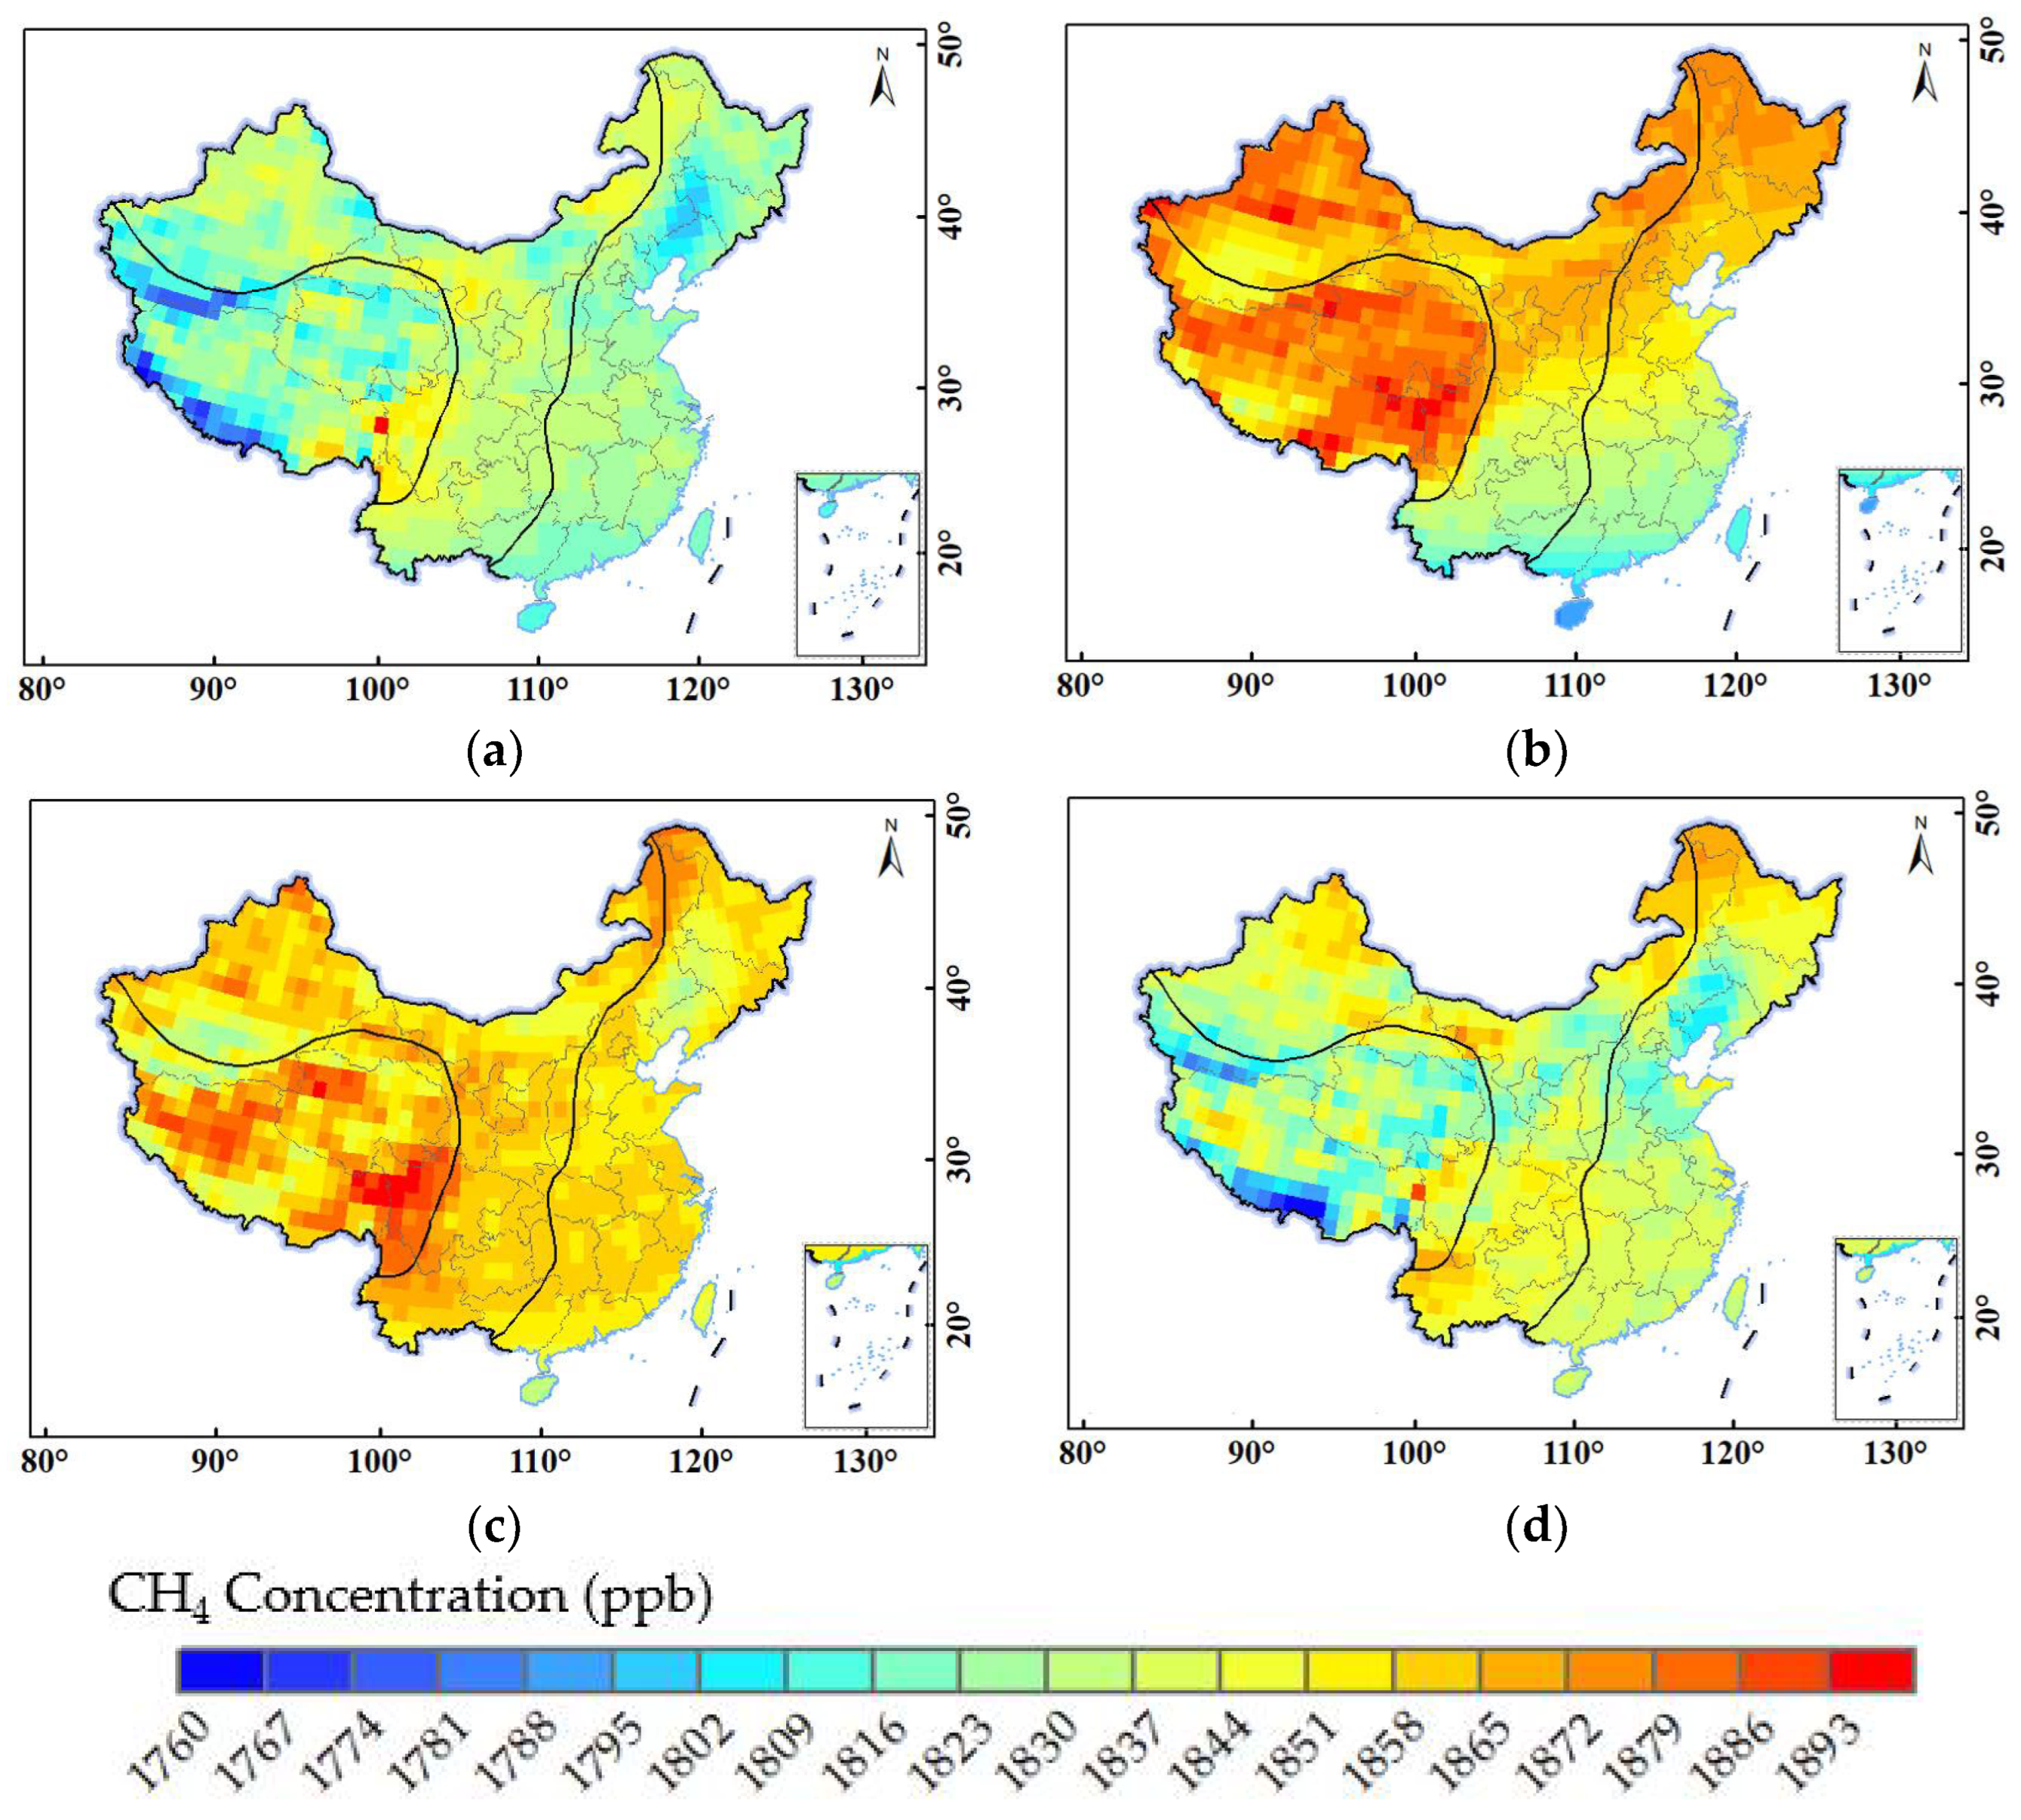
- The near-ground CH4 concentration is generally high in northern China and low in southern China. The high-value areas are mainly located in northwestern Xinjiang, northeastern Inner Mongolia, and northwestern Heilongjiang Province. The low-value areas are located in southern Xinjiang and southwestern Tibet;
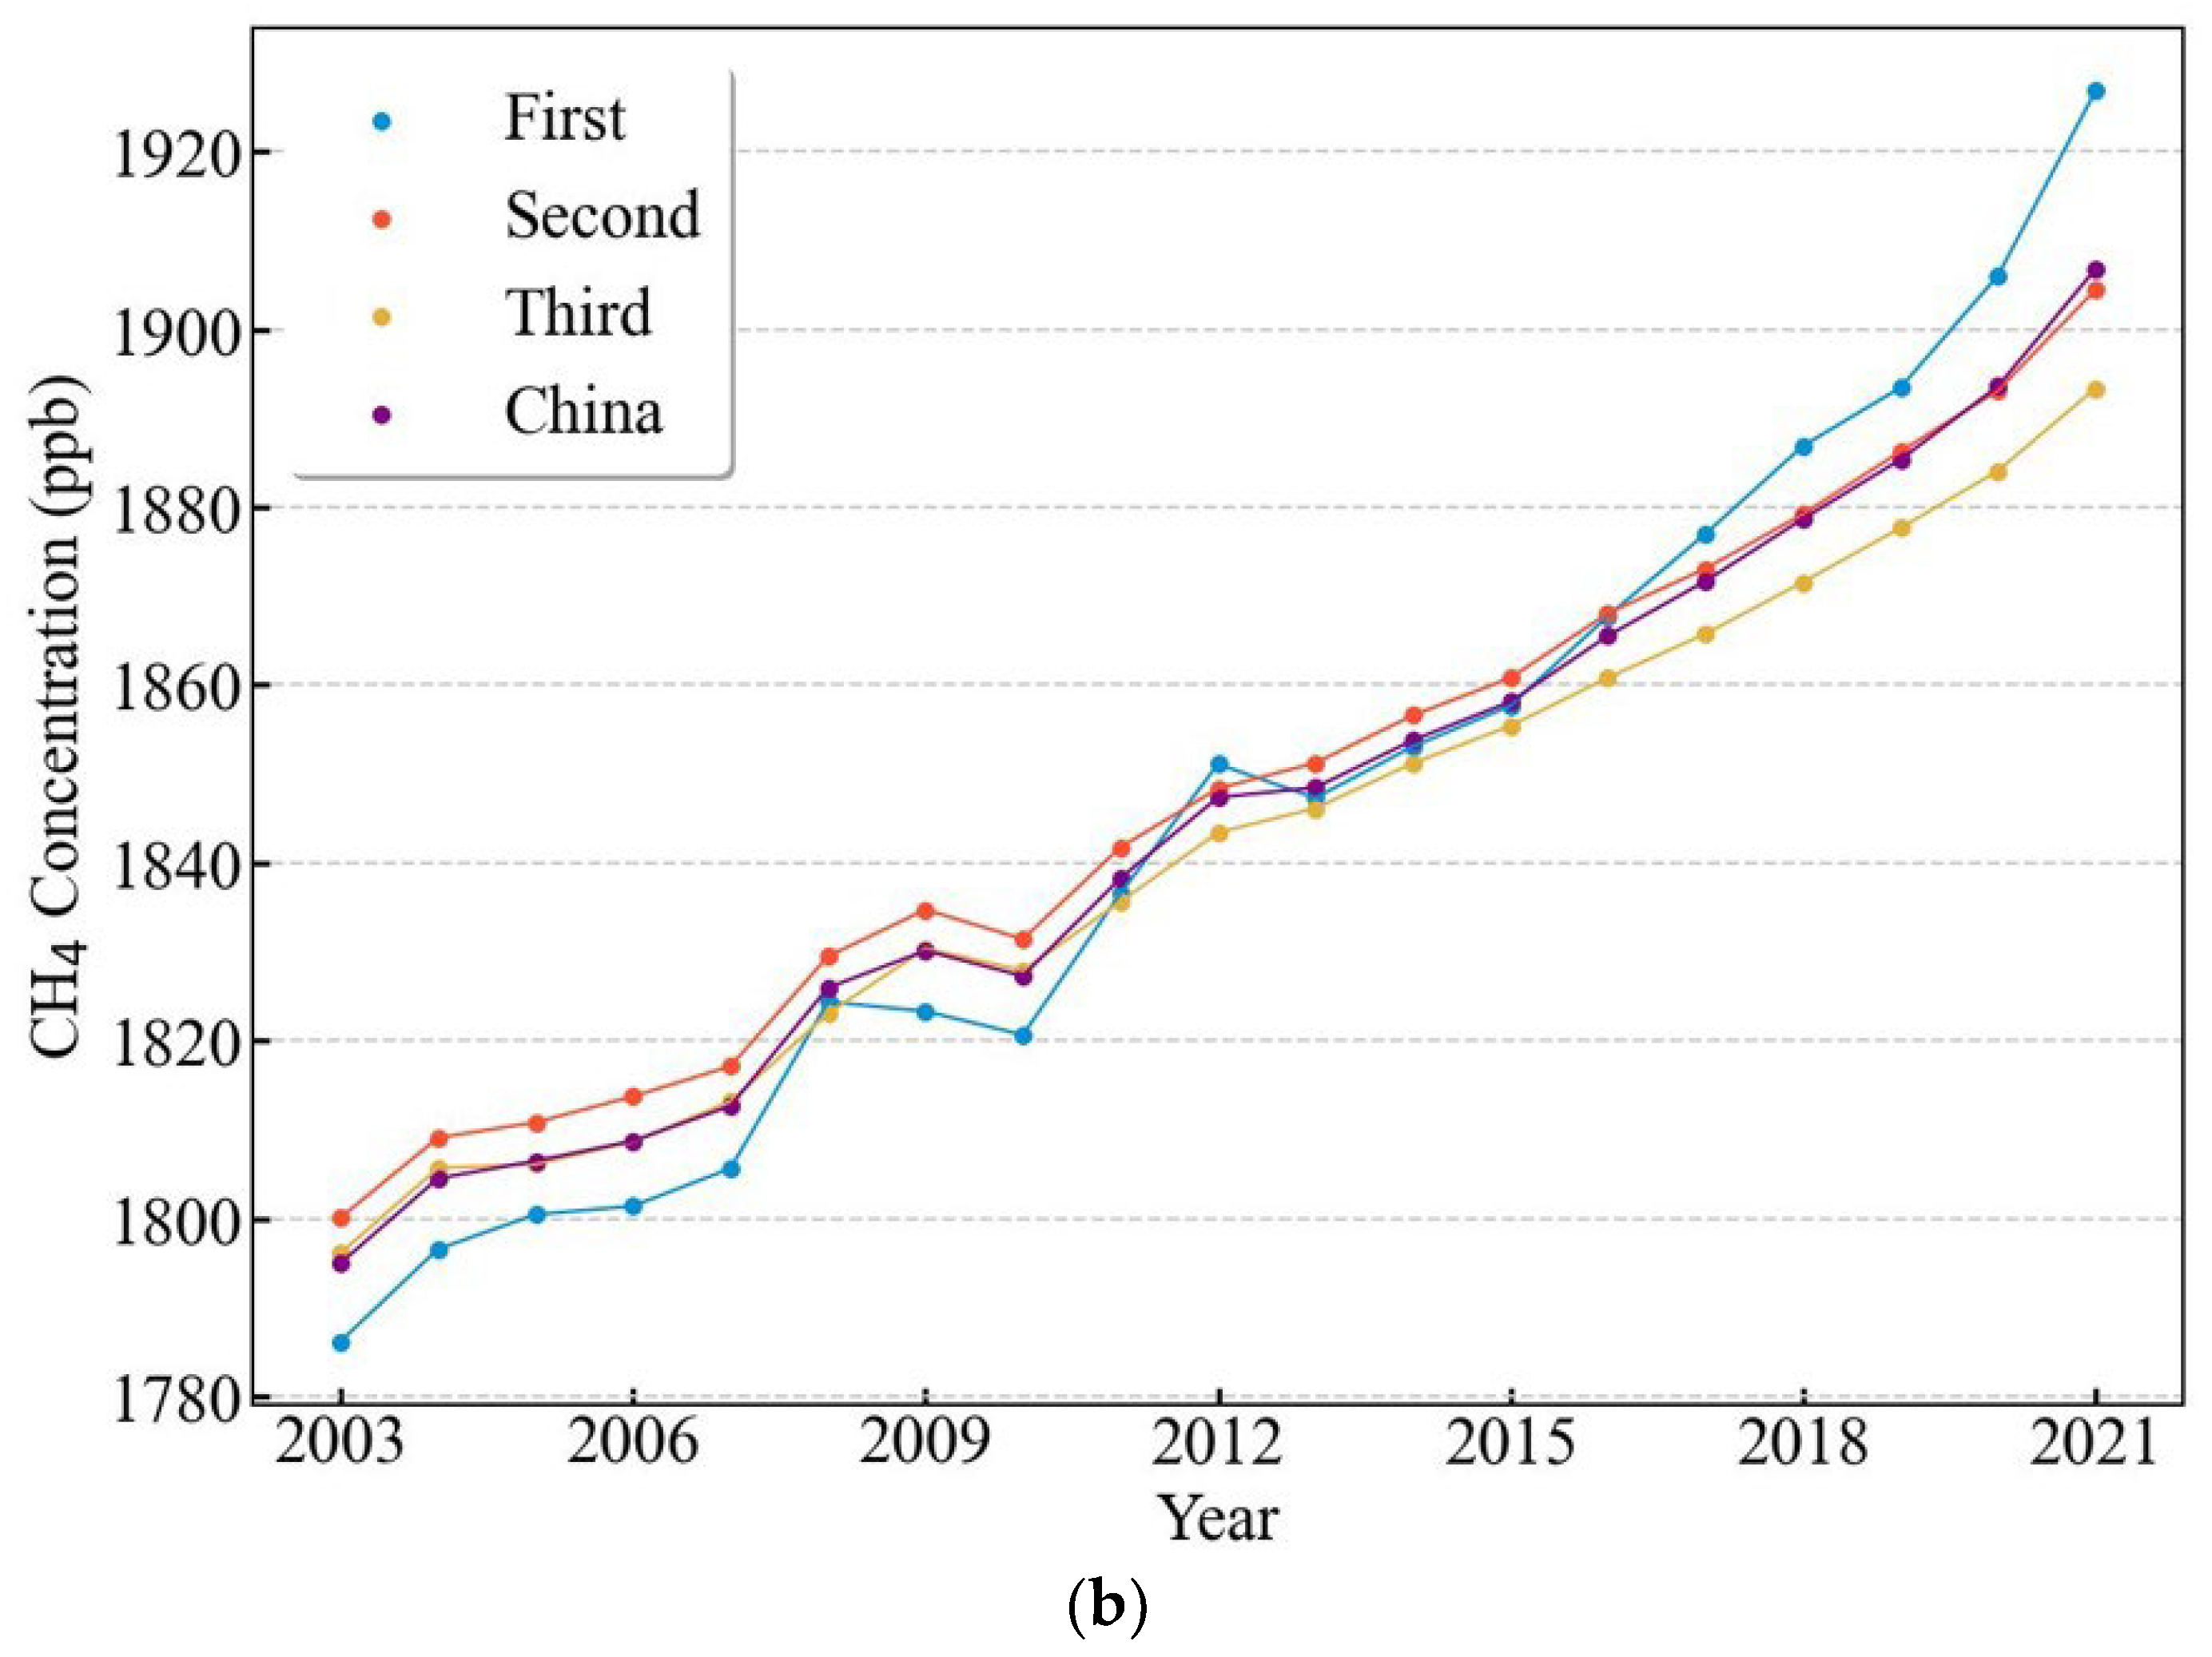
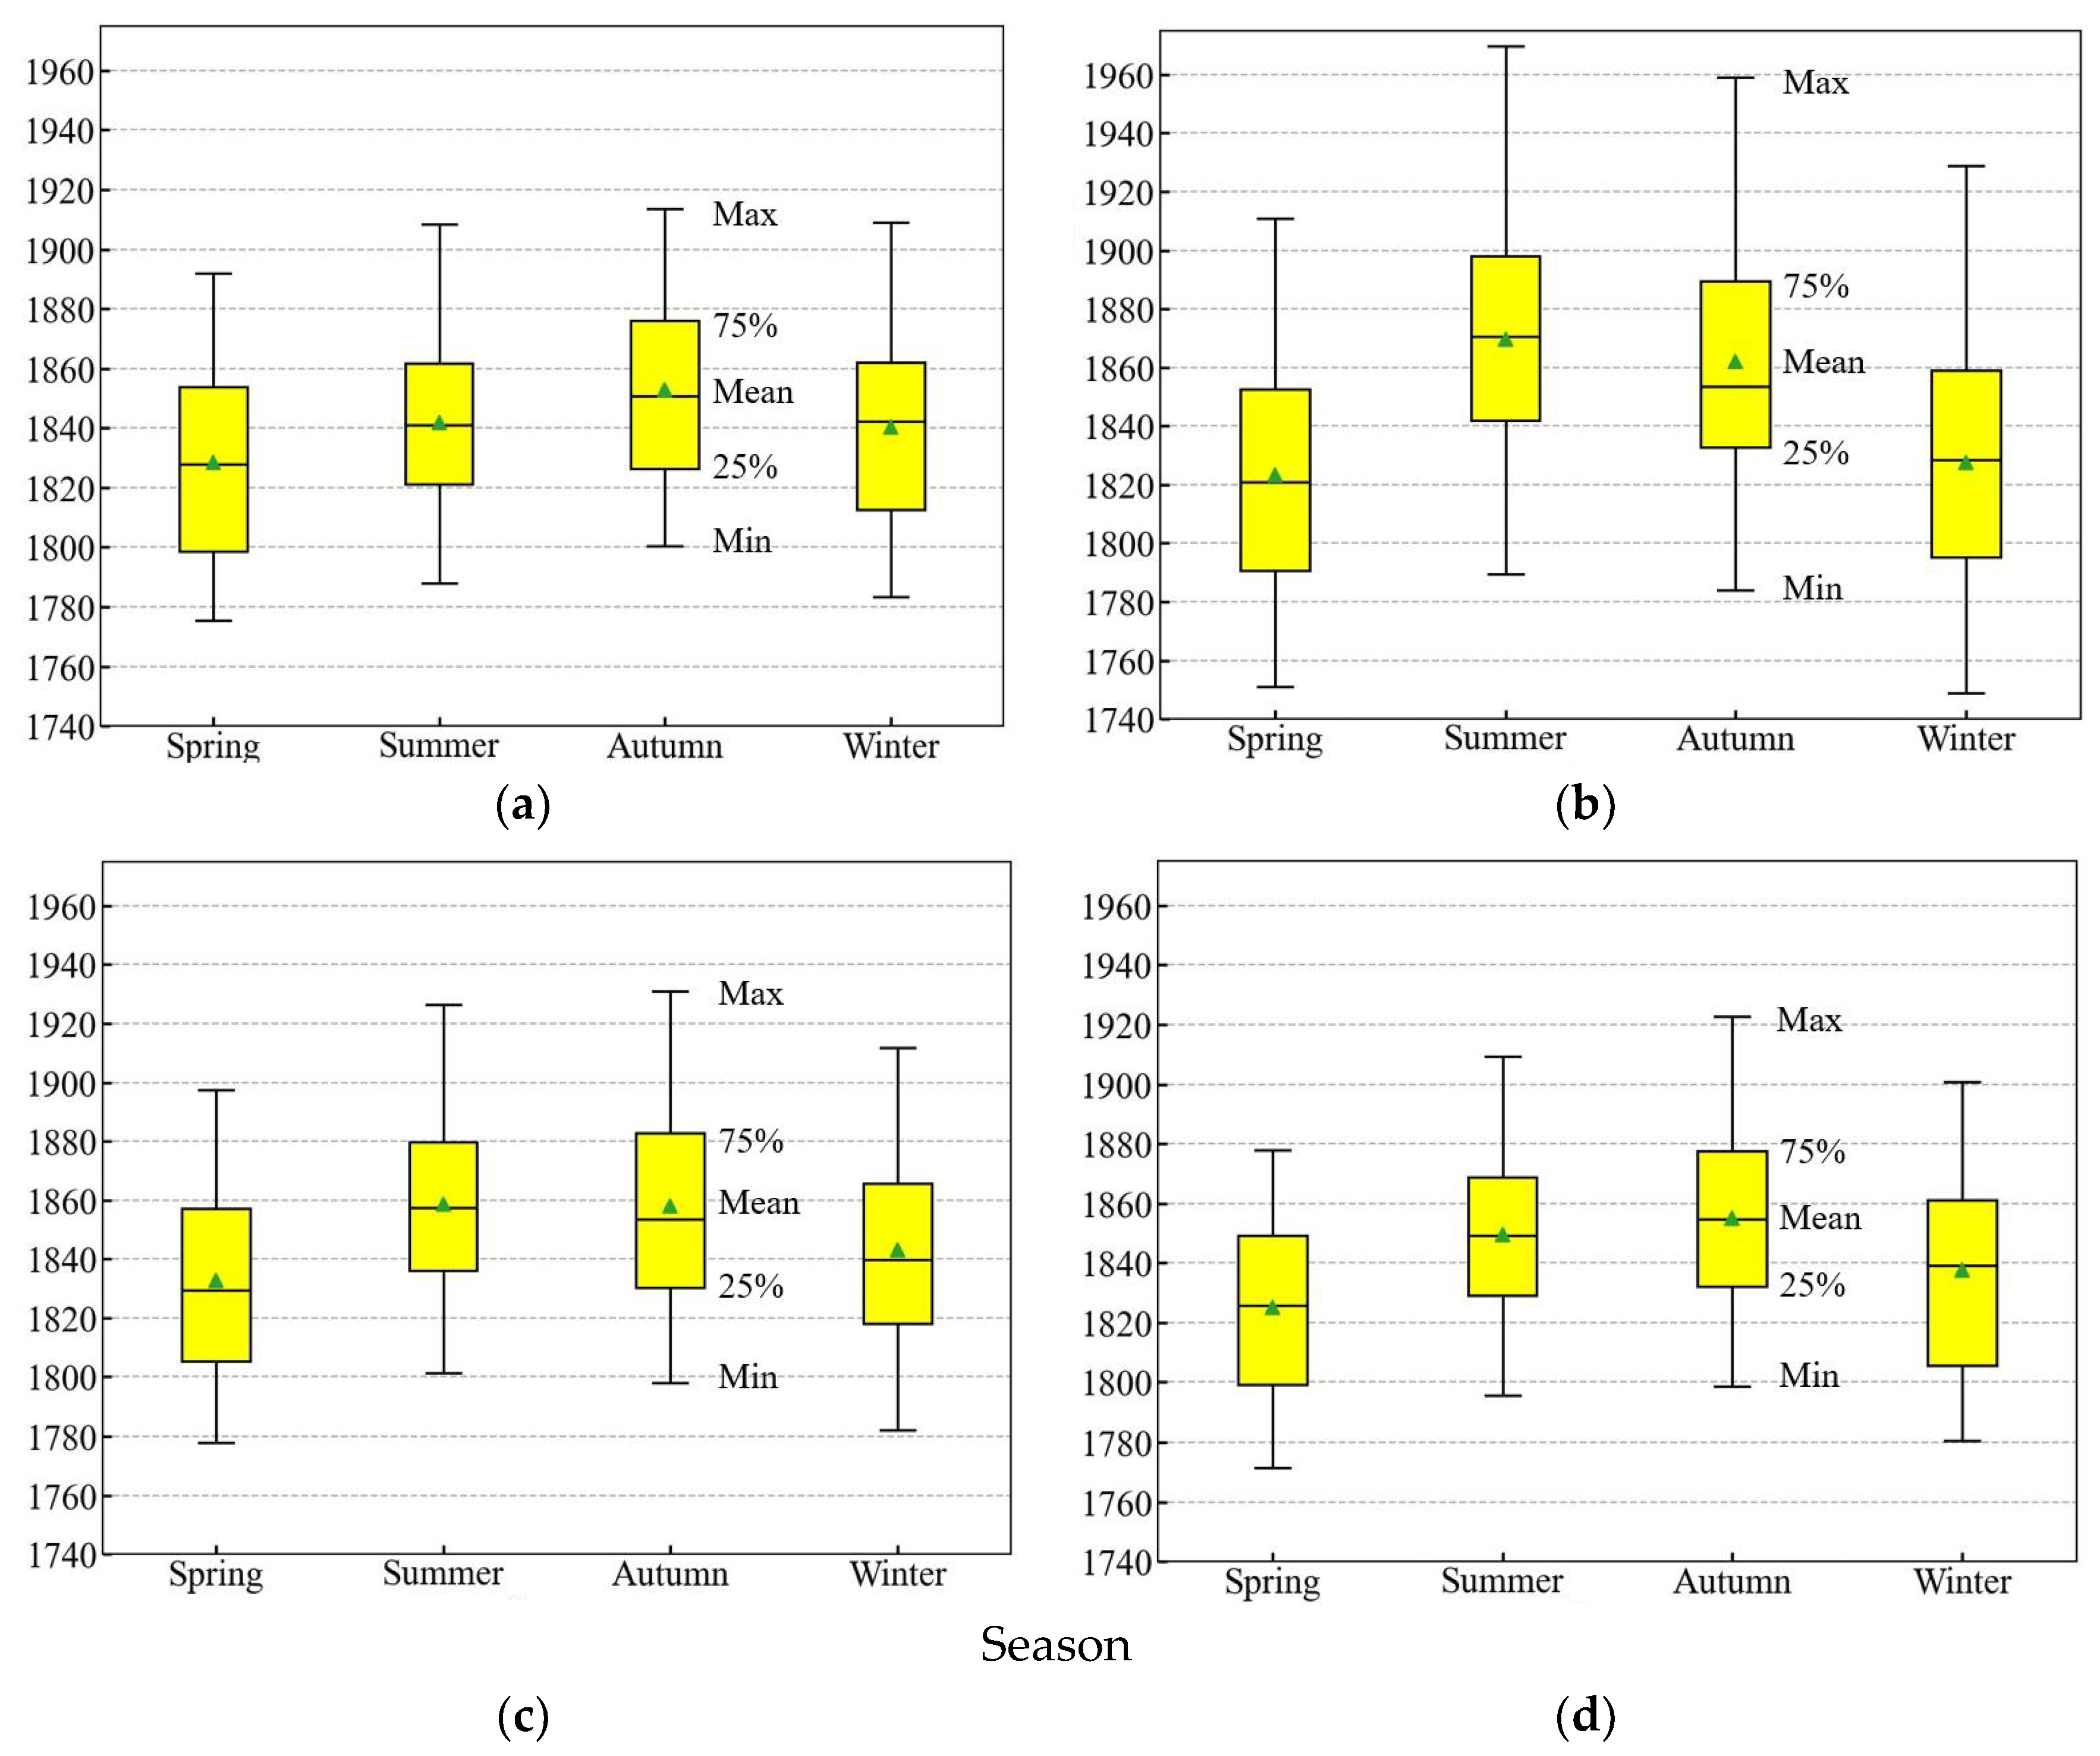
- This study investigated the temporal dynamics of CH4 concentrations in China between 2003 and 2021. The results revealed an overall increasing trend in CH4 concentration over this period. However, further analysis of the data also showed clear seasonal variations in the CH4 concentration, with the highest concentrations occurring in summer and autumn and the lowest concentrations in spring and winter. These findings provide important insights into the spatiotemporal distribution of CH4 in China and highlight the need for continued monitoring and mitigation efforts to address the potential environmental and health impacts of CH4 emissions in this region. In future research, the underlying drivers of the observed temporal trends and seasonal variations in CH4 concentration and their implications for climate change and air quality in China should be explored;
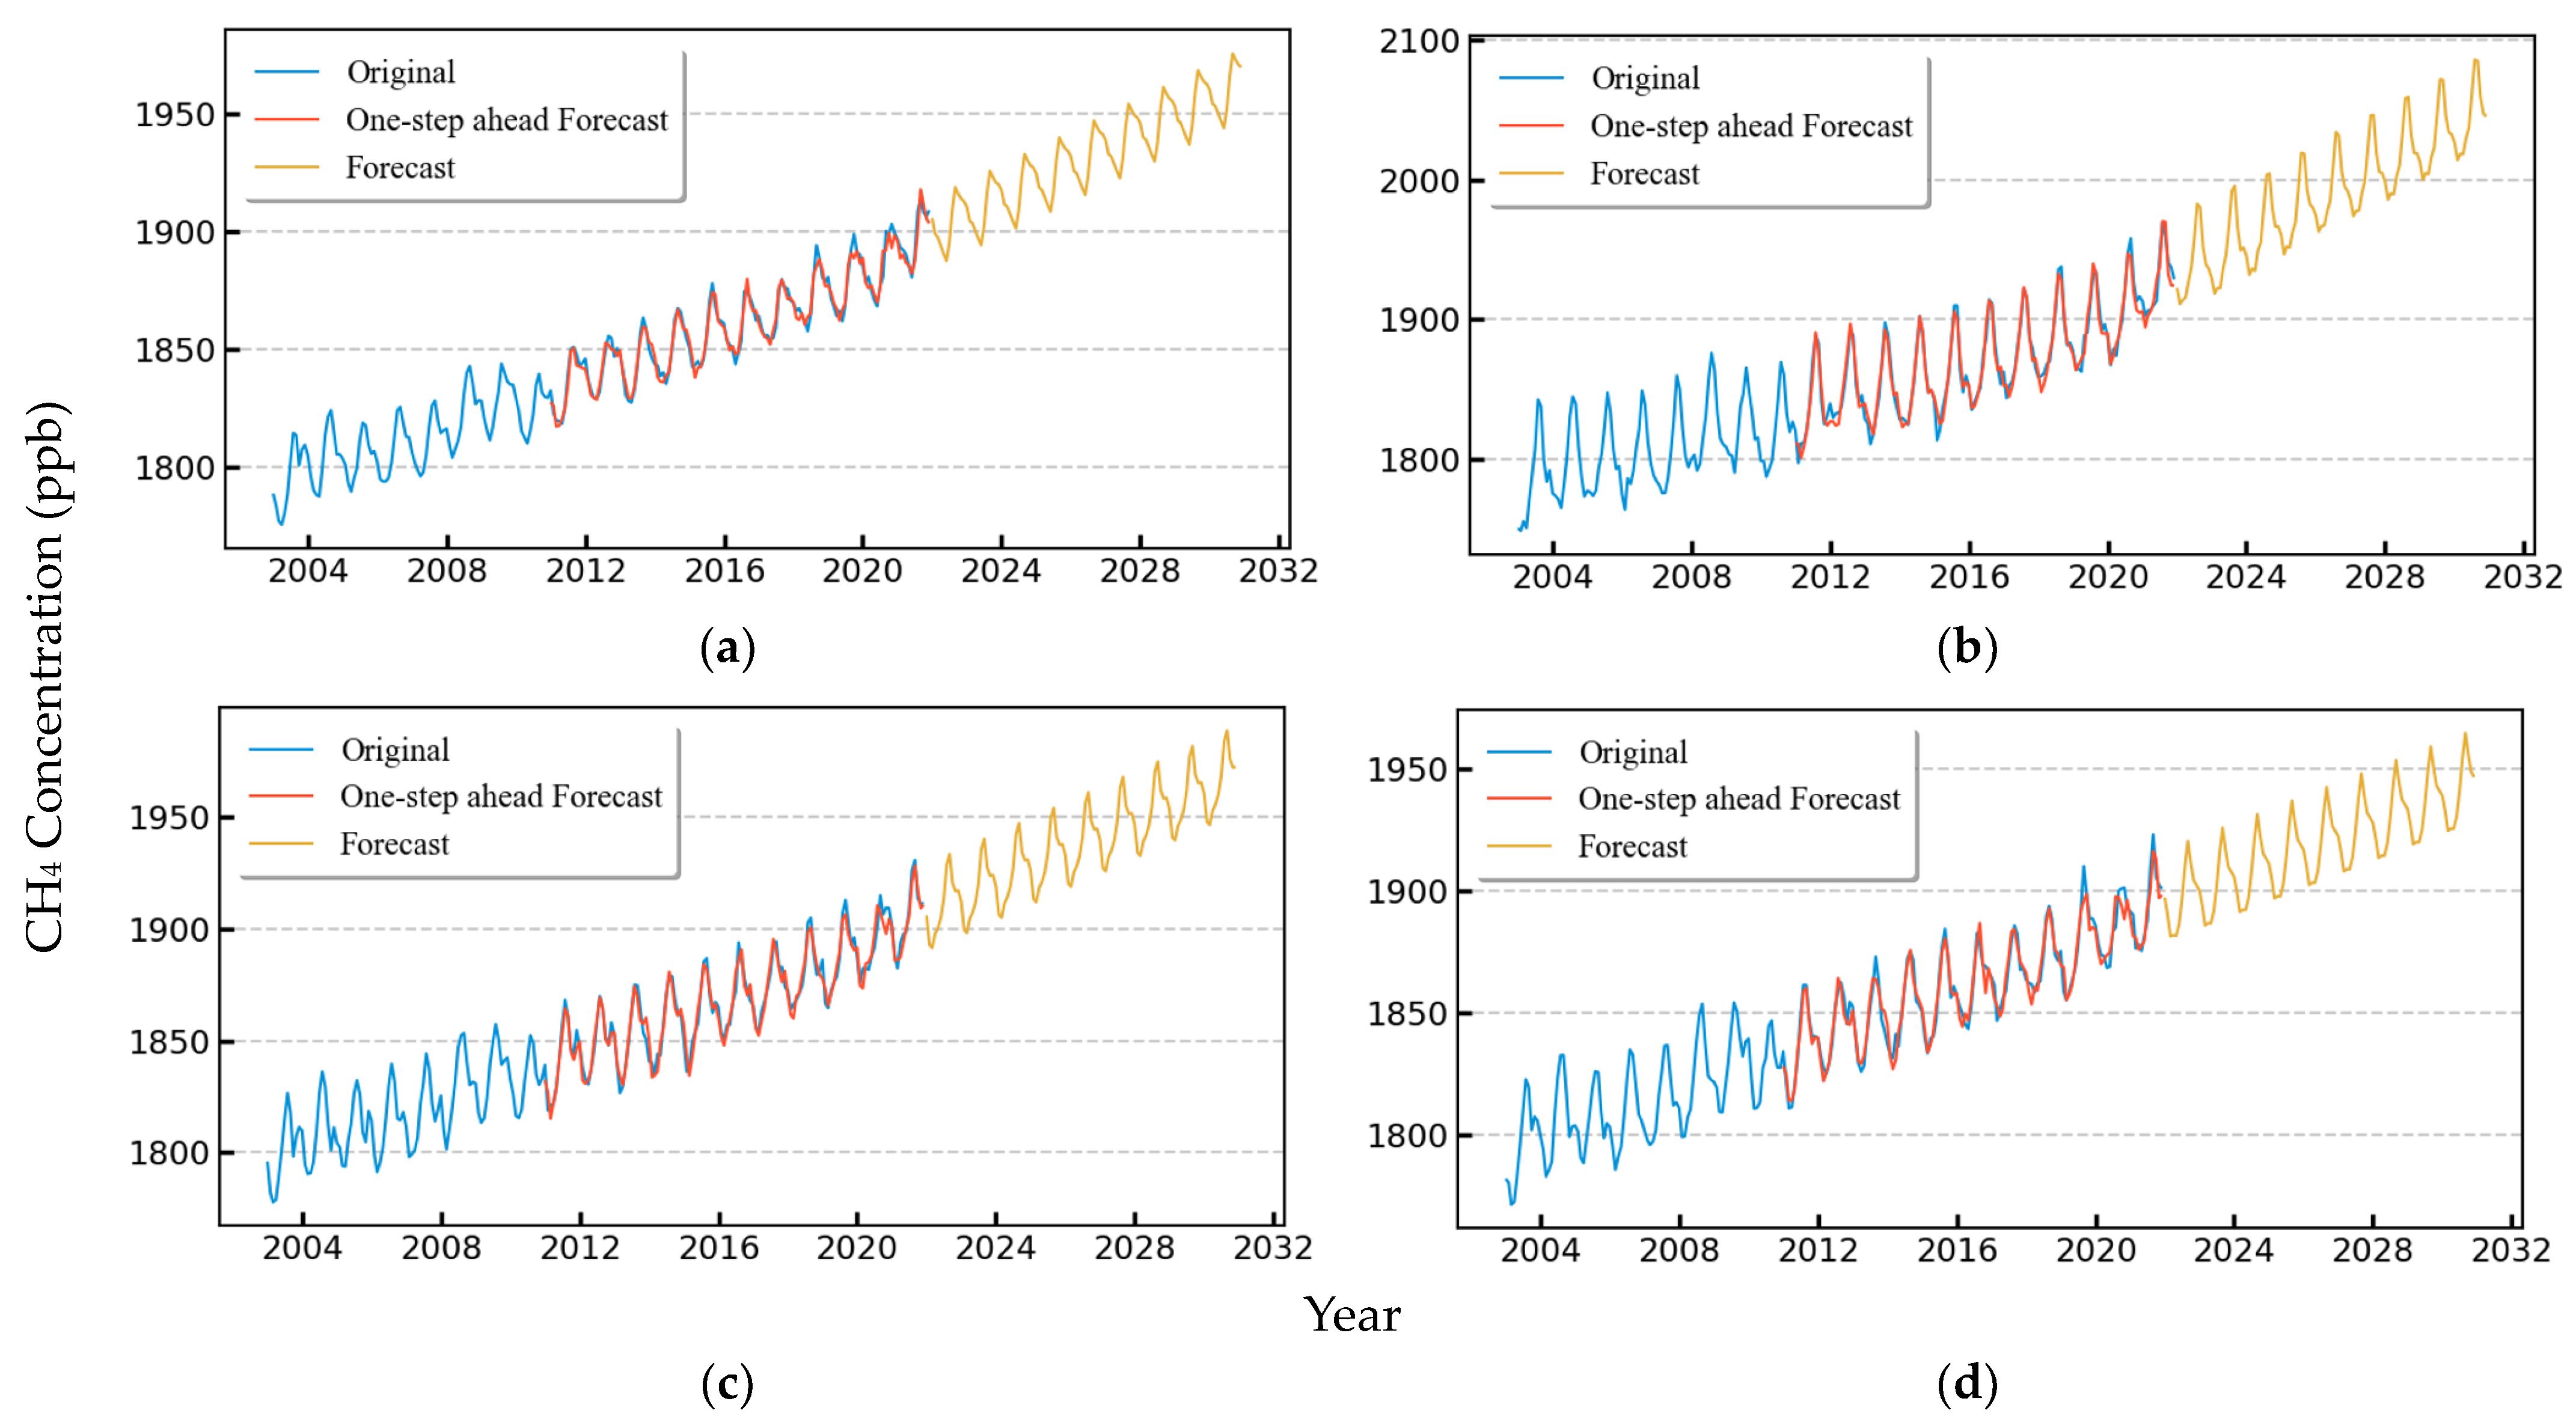
- Given the growing concern over the potential impact of CH4 concentrations on climate change and their associated environmental risks, the development of accurate prediction models is essential for the effective monitoring and mitigation of CH4 emissions. In this study, we explored the application of the SARIMA model for predicting changes in the CH4 concentration over the next decade. The results of our analysis indicated that the SARIMA model provides a robust prediction of the future trend of the CH4 concentration in China with a high degree of accuracy. Specifically, our predictions suggested that the near-surface CH4 concentration in China will continue to exhibit an increasing seasonal trend in the coming years, with a very small relative error between the predicted and actual values. These findings highlight the potential utility of the SARIMA model as a tool for monitoring and forecasting CH4 concentrations and provide important insights for policymakers and stakeholders seeking to address the environmental and health impacts of CH4 emissions in China. However, further research is needed to validate and refine the model and to explore its potential application in other regions and contexts.
Author Contributions
Funding
Data Availability Statement
Acknowledgments
Conflicts of Interest
References
- Li, L.; Lei, L.; Song, H.; Zeng, Z.; He, Z. Spatiotemporal Geostatistical Analysis and Global Mapping of CH4 Columns from GOSAT Observations. Remote Sens. 2022, 14, 654. [Google Scholar] [CrossRef]
- Liu, M.; Lei, L.; Liu, D.; Zeng, Z.-C. Geostatistical Analysis of CH4 Columns over Monsoon Asia Using Five Years of GOSAT Observations. Remote Sens. 2016, 8, 361. [Google Scholar] [CrossRef]
- Masson-Delmotte, V.; Zhai, P.; Pirani, A.; Connors, S.L.; Péan, C.; Berger, S.; Caud, N.; Chen, Y.; Goldfarb, L.; Gomis, M.I.; et al. Climate Change 2021: The Physical Science Basis. Contribution of Working Group I to the Sixth Assessment Report of the Intergovernmental Panel on Climate Change; IPCC: Geneva, Switzerland, 2021; Volume 2. [Google Scholar]
- Peng, S.; Piao, S.; Bousquet, P.; Ciais, P.; Li, B.; Lin, X.; Tao, S.; Wang, Z.; Zhang, Y.; Zhou, F. Inventory of anthropogenic methane emissions in mainland China from 1980 to 2010. Atmos. Meas. Tech. 2016, 16, 14545–14562. [Google Scholar] [CrossRef]
- Bohn, T.J.; Melton, J.R.; Ito, A.; Kleinen, T.; Spahni, R.; Stocker, B.D.; Zhang, B.; Zhu, X.; Schroeder, R.; Glagolev, M.V.; et al. WETCHIMP-WSL: Intercomparison of wetland methane emissions models over West Siberia. Biogeosciences 2015, 12, 3321–3349. [Google Scholar] [CrossRef]
- Zhang, D.; Liao, H. Advances in the research on sources and sinks of CH4 and observations and simulations of CH4 concentrations. Adv. Met. Sci. Technol. 2015, 5, 40–47. [Google Scholar]
- Saunois, M.; Bousquet, P.; Poulter, B.; Peregon, A.; Ciais, P.; Canadell, J.G.; Dlugokencky, E.J.; Etiope, G.; Bastviken, D.; Houweling, S.; et al. The global methane budget 2000–2012. Earth Syst. Sci. Data 2016, 8, 697–751. [Google Scholar] [CrossRef]
- Zhang, B.; Tian, H.; Lu, C.; Chen, G.; Pan, S.; Anderson, C.; Poulter, B. Methane emissions from global wetlands: An assessment of the uncertainty associated with various wetland extent data sets. Atmos. Environ. 2017, 165, 310–321. [Google Scholar] [CrossRef]
- Crutzen, P.J. On the role of CH 4 in atmospheric chemistry: Sources, sinks and possible reductions in anthropogenic sources. AMBIO 1995, 24, 52–55. [Google Scholar]
- Wuebbles, D.J.; Hayhoe, K. Atmospheric methane and global change. Earth-Sci. Rev. 2002, 57, 177–210. [Google Scholar] [CrossRef]
- Cao, Y.; Li, X.; Yan, H.; Kuang, S. China’s Efforts to Peak Carbon Emissions: Targets and Practice. Chin. J. Urban Environ. Stud. 2021, 9, 2150004. [Google Scholar] [CrossRef]
- Zhang, J.; Han, G.; Mao, H.; Pei, Z.; Ma, X.; Jia, W.; Gong, W. The Spatial and Temporal Distribution Patterns of XCH4 in China: New Observations from TROPOMI. Atmosphere 2022, 13, 177. [Google Scholar] [CrossRef]
- Li, S.; Ma, Z.; Xiong, X.; Christiani, D.C.; Wang, Z.; Liu, Y. Satellite and Ground Observations of Severe Air Pollution Episodes in the Winter of 2013 in Beijing, China. Aerosol Air Qual. Res. 2016, 16, 977–989. [Google Scholar] [CrossRef]
- Cai, K.; Li, S.; Zheng, F.; Yu, C.; Zhang, X.; Liu, Y.; Li, Y. Spatio-temporal Variations in NO2 and PM2.5 over the Central Plains Economic Region of China during 2005–2015 Based on Satellite Observations. Aerosol Air Qual. Res. 2018, 18, 1221–1235. [Google Scholar] [CrossRef]
- Li, S.; Chen, L.; Xiong, X.; Tao, J.; Su, L.; Han, D.; Liu, Y. Retrieval of the Haze Optical Thickness in North China Plain Using MODIS Data. IEEE Trans. Geosci. Remote Sens. 2012, 51, 2528–2540. [Google Scholar] [CrossRef]
- Yokota, T.; Yoshida, Y.; Eguchi, N.; Ota, Y.; Tanaka, T.; Watanabe, H.; Maksyutov, S. Global Concentrations of CO2 and CH4 Retrieved from GOSAT: First Preliminary Results. Sola 2009, 5, 160–163. [Google Scholar] [CrossRef]
- Bovensmann, H.; Burrows, J.P.; Buchwitz, M.; Frerick, J.; Noël, S.; Rozanov, V.V.; Chance, K.V.; Goede, A.P.H. SCIAMACHY: Mission Objectives and Measurement Modes. J. Atmos. Sci. 1999, 56, 127–150. [Google Scholar] [CrossRef]
- Worden, J.R.; Turner, A.J.; Bloom, A.; Kulawik, S.S.; Liu, J.; Lee, M.; Weidner, R.; Bowman, K.; Frankenberg, C.; Parker, R.; et al. Quantifying lower tropospheric methane concentrations using GOSAT near-IR and TES thermal IR measurements. Atmos. Meas. Tech. 2015, 8, 3433–3445. [Google Scholar] [CrossRef]
- Susskind, J.; Barnet, C.; Blaisdell, J. Determination of atmospheric and surface parameters from simulated AIRS/AMSU/HSB sounding data: Retrieval and cloud clearing methodology. Adv. Space Res. 1998, 21, 369–384. [Google Scholar] [CrossRef]
- Susskind, J.; Barnet, C.D.; Blaisdell, J.M. Retrieval of atmospheric and surface parameters from AIRS/AMSU/HSB data in the presence of clouds. IEEE Trans. Geosci. Remote Sens. 2003, 41, 390–409. [Google Scholar] [CrossRef]
- Susskind, J.; Blaisdell, J.M.; Iredell, L.; Keita, F. Improved Temperature Sounding and Quality Control Methodology Using AIRS/AMSU Data: The AIRS Science Team Version 5 Retrieval Algorithm. IEEE Trans. Geosci. Remote Sens. 2010, 49, 883–907. [Google Scholar] [CrossRef]
- Wang, H.; Li, J.; Zhang, Y.; Li, S.; Zhang, L.; Cheng, L. Analysis of space-time characteristics of near-surface methane concentration in China using AIRS products. J. Remote Sens. 2015, 19, 827–835. [Google Scholar]
- Zhang, S.; Xie, B.; Zhang, H.; Zhou, X.; Wang, Q.; Yang, D. Analysis of spatiotemporal distribution characteristics of CH4 concentration in the world and East Asia. China Environ. Sci. 2018, 38, 4401–4408. [Google Scholar]
- Wu, X.; Zhang, X.; Chuai, X.; Huang, X.; Wang, Z. Long-Term Trends of Atmospheric CH4 Concentration across China from 2002 to 2016. Remote Sens. 2019, 11, 538. [Google Scholar] [CrossRef]
- Shapi, M.K.M.; Ramli, N.A.; Awalin, L.J. Energy consumption prediction by using machine learning for smart building: Case study in Malaysia. Dev. Built Environ. 2020, 5, 100037. [Google Scholar] [CrossRef]
- Li, Y.; Wei, Y.; Dong, Z. Will China Achieve Its Ambitious Goal?—Forecasting the CO2 Emission Intensity of China towards 2030. Energies 2020, 13, 2924. [Google Scholar] [CrossRef]
- Javanmard, M.E.; Ghaderi, S. A Hybrid Model with Applying Machine Learning Algorithms and Optimization Model to Forecast Greenhouse Gas Emissions with Energy Market Data. Sustain. Cities Soc. 2022, 82, 103886. [Google Scholar] [CrossRef]
- Jang, M.; Heo, Y.; Chung, H.; Park, S. A Comparison Study of Forecasting Time Series Models for the Harmful Gas Emission. J. Korean Soc. Ind. Converg. 2021, 24, 323–331. [Google Scholar]
- Niu, D.; Wang, K.; Wu, J.; Sun, L.; Liang, Y.; Xu, X.; Yang, X. Can China achieve its 2030 carbon emissions commitment? Scenario analysis based on an improved general regression neural network. J. Clean. Prod. 2020, 243, 118558. [Google Scholar] [CrossRef]
- Pakrooh, P.; Pishbahar, E. Forecasting Air Pollution Concentrations in Iran, Using a Hybrid Model. Pollution 2019, 5, 739–747. [Google Scholar]
- Zhang, L. Spatial and temporal distribution of CH4 concentration in China based on GOSAT satellite data. J. Hubei Univ. Technol. 2018, 33, 37–39. [Google Scholar]
- Xiong, X.; Barnet, C.; Wei, J.; Maddy, E. Information-based mid-upper tropospheric methane derived from Atmospheric Infrared Sounder (AIRS) and its validation. Atmos. Chem. Phys. Discuss. 2009, 9, 16331–16360. [Google Scholar]
- Aumann, H.H.; Chahine, M.T.; Gautier, C.; Goldberg, M.D.; Kalnay, E.; McMillin, L.M.; Revercomb, H.; Rosenkranz, P.W.; Smith, W.L.; Staelin, D.H.; et al. AIRS/AMSU/HSB on the Aqua mission: Design, science objectives, data products, and processing systems. IEEE Trans. Geosci. Remote Sens. 2003, 41, 253–264. [Google Scholar] [CrossRef]
- Xiong, X.; Barnet, C.; Maddy, E.S.; Gambacorta, A.; King, T.S.; Wofsy, S.C. Mid-upper tropospheric methane retrieval from IASI and its validation. Atmos. Meas. Tech. 2013, 6, 2255–2265. [Google Scholar] [CrossRef]
- Zhou, L.X.; Zhou, X.J.; Zhang, X.C.; Wen, Y.P.; Yan, P. Progress in the study of background greenhouse gases at Waliguan observatory. Acta Meteorol. Sin. 2007, 65, 458–468. [Google Scholar]
- Jinghua, Y.; Miaomiao, H. Predicting time series of theft crimes based on LSTM network. Data Anal. Knowl. Discov. 2020, 4, 84–91. [Google Scholar]
- Jiang, C.; Zhang, S.; Zhang, C.; Li, H.; Ding, X. MODIS leaf area index time series modeling and prediction based on SARIMA-BP neural network combination method. Spectrosc. Spectr. Anal. 2017, 37, 189–193. [Google Scholar]
- Zhang, X.; Zhang, X.; Jiang, H. Accuracy comparison of monthly AIRS, GOSAT and SCIAMACHY data in monitoring atmospheric CH 4 concentration. In Proceedings of the 2013 21st International Conference on Geoinformatics, Kaifeng, China, 20–22 June 2013. [Google Scholar]
- Zhang, X.; Bai, W.; Zhang, P.; Wang, W. Spatiotemporal variations in mid-upper tropospheric methane over China from satellite observations. Chin. Sci. Bull. 2011, 56, 3321–3327. [Google Scholar] [CrossRef]
- Jiang, J.; Yang, X. Quantitative segmentation of the three gradient terrain of China based on DEM. Geomat. World 2009, 7, 8–13. [Google Scholar]
- Tang, J.H.; Xiang, W.; Bao, Z.Y.; Qiao, S.Y.; Guo, Q.H. Effect of geogenic emission of methane on the atmosphere. Geol. Sci. Technol. Inf. 2006, 25, 75–82. [Google Scholar]
- Feng, D.; Gao, X.; Yang, L.; Hui, X.; Zhou, Y. Characteristics of methane distribution in the troposphere over the Tibetan Plateau retrieved by AIRS. China Environ. Sci. 2017, 37, 2822–2830. [Google Scholar]
- Kaplan, J.O.; Folberth, G.; Hauglustaine, D. Role of methane and biogenic volatile organic compound sources in late glacial and Holocene fluctuations of atmospheric methane concentrations. Glob. Biogeochem. Cycles 2006, 20, 3137326. [Google Scholar] [CrossRef]
- Ding, W.; Cai, Z.; Wang, D. Preliminary budget of methane emissions from natural wetlands in China. Atmos. Environ. 2004, 38, 751–759. [Google Scholar] [CrossRef]
- Wan, W.; Xiao, P.; Feng, X.; Li, H.; Ma, R.; Duan, H.; Zhao, L. Monitoring lake changes of Qinghai-Tibetan Plateau over the past 30 years using satellite remote sensing data. Chin. Sci. Bull. 2014, 59, 1021–1035. [Google Scholar] [CrossRef]
- Shao, Z.; Meng, X.; Zhu, D.; Zheng, D.; Qiao, Z.; Yang, C.; Han, J.; Yu, J.; Meng, Q.; Lü, R. Characteristics of the change of major lakes on the Qinghai-Tibet Plateau in the last 25 years. Front. Earth Sci. China 2008, 2, 364–377. [Google Scholar] [CrossRef]
- Wu, Q.; Zhang, T. Recent permafrost warming on the Qinghai-Tibetan Plateau. J. Geophys. Res. Atmos. 2008, 113, D13108. [Google Scholar] [CrossRef]
- Li, P.; Cao, Y. Spatial and temporal changes of industrial carbon emissions under regional industrial transfer: The case of Pan-Yangtze River Delta. Adv. Earth Sci. 2013, 28, 939. [Google Scholar]
- Jie-Fang, D.; Chun, D. Dynamic Relation among Xinjang’s Carbon Dioxide Emission, Energy Efficiency and Industrial Structure. Resour. Ind. 2015, 17, 22. [Google Scholar]
- Yao, L.; Gao, Z. An Empirical Analysis of the Relations between Energy Consumption, Economic Growth and Carbon Emissions in Xinjiang. J. Xinjiang Univ. 2012, 3, 212–217. [Google Scholar]
- Thomas, K.L.; Benstead, J.; Davies, K.L.; Lloyd, D. Role of wetland plants in the diurnal control of CH4 and CO2 fluxes in peat. Soil Biol. Biochem. 1996, 28, 17–23. [Google Scholar] [CrossRef]
- Saarnio, S.; Silvola, J. Effects of increased CO2 and N on CH4 efflux from a boreal mire: A growth chamber experiment. Oecologia 1999, 119, 349–356. [Google Scholar] [CrossRef]
- Saarnio, S.; Alm, J.; Martikainen, P.J.; Silvola, J. Effects of raised CO2 on potential CH4 production and oxidation in, and CH4 emission from, a boreal mire. J. Ecol. 1998, 86, 261–268. [Google Scholar] [CrossRef]
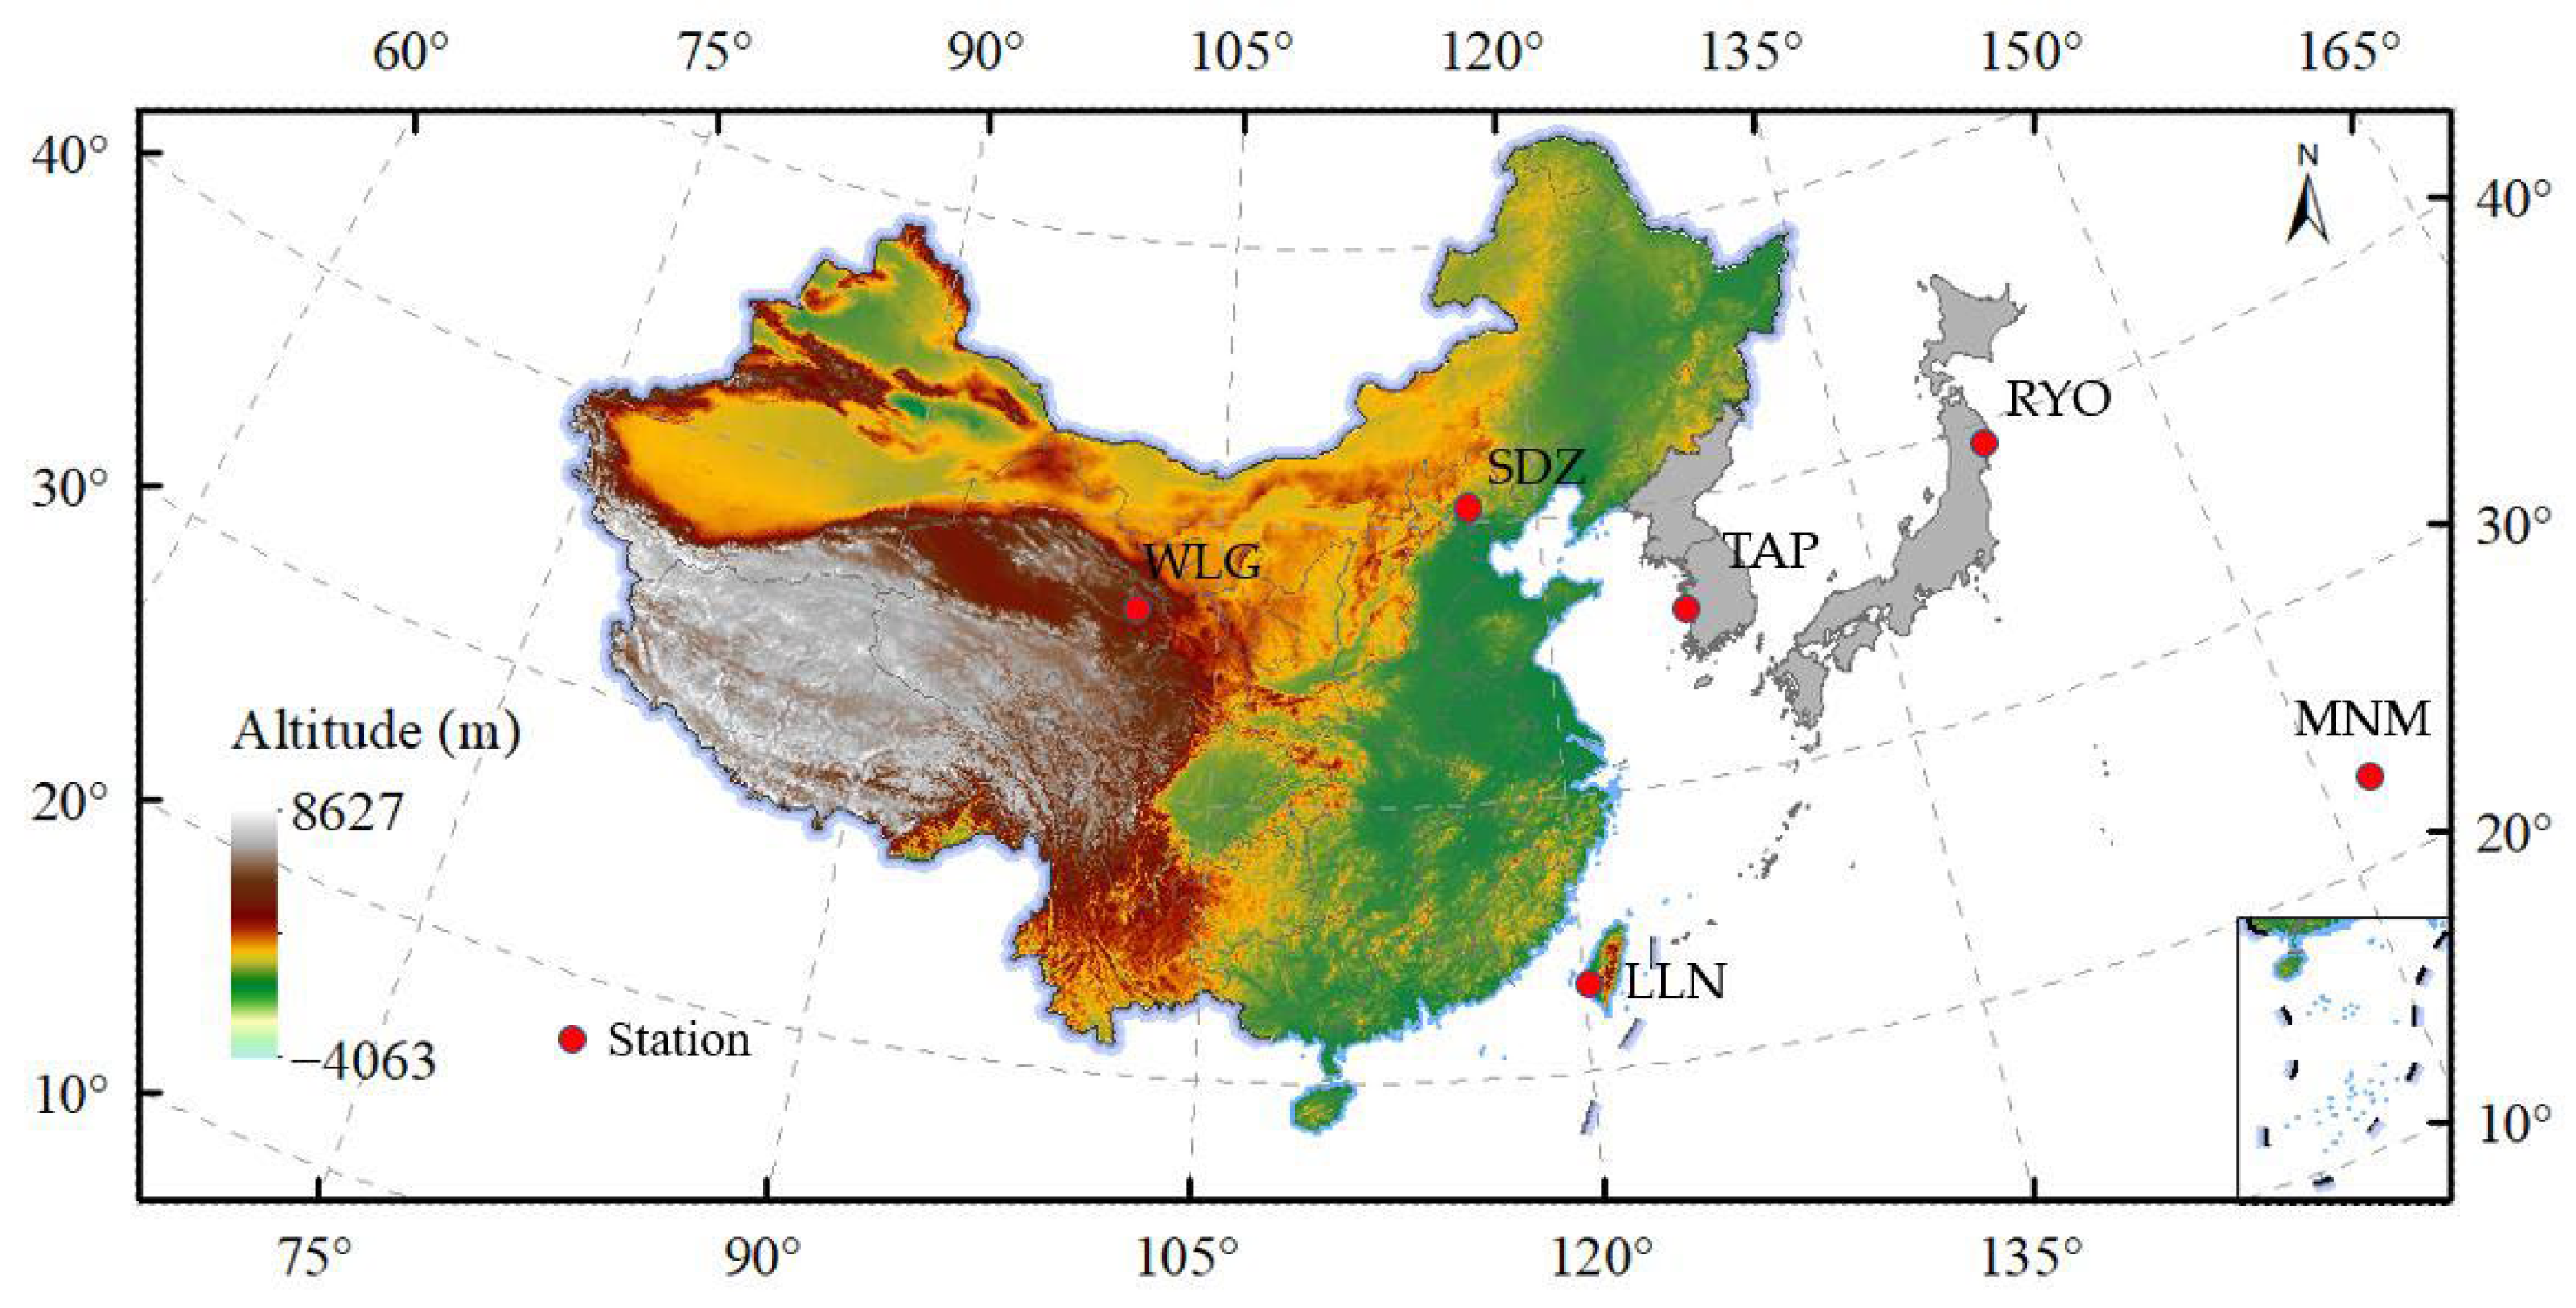


| Ground Station Location | Coordinates (°) | Time | Altitude (m) |
|---|---|---|---|
| Waliguan (WLG) | (36.28°N, 100.89°E) | 2003.01~2020.12 | 3810 |
| Shangdianzi (SDZ) | (40.65°N, 117.12°E) | 2009.09~2015.09 | 293 |
| Lulin (LLN) | (23.47°N, 120.87°E) | 2006.08~2020.12 | 2862 |
| Minamitorishima (MNM) | (24.29°N, 153.98°E) | 2003.01~2021.11 | 9 |
| Tae-ahn Peninsula (TAP) | (36.73°N, 126.13°E) | 2003.01~2020.12 | 20 |
| Ryori (RYO) | (39.03°N, 141.82°E) | 2003.01~2021.11 | 280 |
| Emission Source | R |
|---|---|
| Total emissions | 0.92 |
| Solid fuels | 0.84 |
| Rice cultivations | 0.72 |
| Wastewater treatment and discharge | 0.99 |
| Oil and natural gas | 0.96 |
| Original Sequence | Differential Sequence | |
|---|---|---|
| T statistics | 1.11 | −5.88 |
| p-value | 0.99 | 2.99 × 10⁻⁷ |
| 1% threshold | −3.46 | −3.46 |
| 5% threshold | −2.88 | −2.88 |
| 10% threshold | −2.57 | −2.57 |
| Time | Original | Forecast | Relative Error |
|---|---|---|---|
| 2020/1 | 1886.78 | 1888.67 | 0.10% |
| 2020/2 | 1873.80 | 1874.83 | 0.05% |
| 2020/3 | 1878.21 | 1871.49 | −0.36% |
| 2020/4 | 1876.64 | 1879.53 | 0.15% |
| 2020/5 | 1878.95 | 1881.83 | 0.15% |
| 2020/6 | 1883.46 | 1887.11 | 0.19% |
| 2020/7 | 1895.68 | 1897.39 | 0.09% |
| 2020/8 | 1907.40 | 1915.07 | 0.40% |
| 2020/9 | 1920.42 | 1912.67 | −0.40% |
| 2020/10 | 1909.40 | 1904.76 | −0.24% |
| 2020/11 | 1907.24 | 1897.04 | −0.53% |
| 2020/12 | 1905.06 | 1902.96 | −0.11% |
| Region | SARIMA(p,d,q)(P,D,Q)s | RMSE | MAE | MSE | R2 |
|---|---|---|---|---|---|
| China | SARIMA(1,1,1)(0,1,1)12 | 4.11 | 3.34 | 16.94 | 0.98 |
| First | SARIMA(1,1,1)(4,1,0)12 | 6.73 | 5.42 | 45.41 | 0.97 |
| Second | SARIMA(1,1,1)(2,1,0)12 | 4.41 | 3.54 | 19.49 | 0.97 |
| Third | SARIMA(1,1,1)(0,1,1)12 | 4.70 | 3.73 | 22.15 | 0.96 |
Disclaimer/Publisher’s Note: The statements, opinions and data contained in all publications are solely those of the individual author(s) and contributor(s) and not of MDPI and/or the editor(s). MDPI and/or the editor(s) disclaim responsibility for any injury to people or property resulting from any ideas, methods, instructions or products referred to in the content. |
© 2023 by the authors. Licensee MDPI, Basel, Switzerland. This article is an open access article distributed under the terms and conditions of the Creative Commons Attribution (CC BY) license (https://creativecommons.org/licenses/by/4.0/).
Share and Cite
Cai, K.; Yang, X.; Li, S.; Xiao, Y.; Qiao, B.; Liu, Y. Accuracy Verification of Satellite Products and Temporal and Spatial Distribution Analysis and Prediction of the CH4 Concentration in China. Remote Sens. 2023, 15, 2813. https://doi.org/10.3390/rs15112813
Cai K, Yang X, Li S, Xiao Y, Qiao B, Liu Y. Accuracy Verification of Satellite Products and Temporal and Spatial Distribution Analysis and Prediction of the CH4 Concentration in China. Remote Sensing. 2023; 15(11):2813. https://doi.org/10.3390/rs15112813
Chicago/Turabian StyleCai, Kun, Xuan Yang, Shenshen Li, Yizhuo Xiao, Baojun Qiao, and Yang Liu. 2023. "Accuracy Verification of Satellite Products and Temporal and Spatial Distribution Analysis and Prediction of the CH4 Concentration in China" Remote Sensing 15, no. 11: 2813. https://doi.org/10.3390/rs15112813
APA StyleCai, K., Yang, X., Li, S., Xiao, Y., Qiao, B., & Liu, Y. (2023). Accuracy Verification of Satellite Products and Temporal and Spatial Distribution Analysis and Prediction of the CH4 Concentration in China. Remote Sensing, 15(11), 2813. https://doi.org/10.3390/rs15112813


