Abstract
With advancements in computer processing power and deep learning techniques, hyperspectral imaging is continually being explored for improved sensing applications in various fields. However, the high cost associated with such imaging platforms impedes their widespread use in spite of the availability of the needed processing power. In this paper, we develop a novel theoretical framework required for an open source ultra-low-cost hyperspectral imaging platform based on the line scan method suitable for remote sensing applications. Then, we demonstrate the design and fabrication of an open source platform using consumer-grade commercial off-the-shelf components that are both affordable and easily accessible to researchers and users. At the heart of the optical system is a consumer-grade spectroscope along with a basic galvanometer mirror that is widely used in laser scanning devices. The utilized pushbroom scanning method provides a very high spectral resolution of 2.8 nm, as tested against commercial spectral sensors. Since the resolution is limited by the slit width of the spectroscope, we also provide a deconvolution method for the line scan in order to improve the monochromatic spatial resolution. Finally, we provide a cost-effective testing method for the hyperspectral imaging platform where the results validate both the spectral and spatial performances of the platform.
1. Introduction
Hyperspectral imaging (HSI) is a well-developed field and is already applied in many industries ranging from agriculture, remote sensing, food production, biology, medicine, to art and remote sensing. In such an imaging technique, each captured pixel is described by a detailed spectrum rather than the typical red/green/blue (RGB) offered by common color cameras. This extensive spectral coverage can reveal nuanced spectral details for the imaged target which typically expose plenty of information about the chemical and physical nature of the comprising materials [1,2]. The light collected by the imaging system can be through direct emission (e.g., light sources) [3], reflection (e.g., typical imaging) [4], transmission (e.g., biological slides) [1], florescence (e.g., cell imaging) [1], and Raman scattering (e.g., food monitoring [5]). Depending on the application, the collected light can cover different bands of the electromagnetic spectrum typically including the visible bands (VIS), near-infrared (NIR), and deeper infrared bands such as the short-, mid-, and long-wave infrared (SWIR, MWIR, and LWIR, respectively).
For example, HSI has multifaceted applications in remote sensing, including environmental monitoring [6], mineral exploration [7], agriculture [8], forestry [9], and urban planning [8]. The data obtained from hyperspectral imaging can be used to map and identify different land cover types, detect changes in vegetation, monitor water quality, and assess soil characteristics. Not limited to remote sensing, HSI has significant applications in biomedical research, for example, VIS and IR HSI provide an opportunity to examine clinical tissues for diagnostics or even for surgical guidance. Exposed to light, biological tissues show various light scattering and light absorption profiles that represent the structural complexity of healthy and diseased tissues that cannot be recognized by the naked eye alone [1,10]. These hyperspectral images of tissues together with advanced signal processing are explored to complement biomedical diagnostics at the micro- and macro- levels [1,11]. This is evidenced by multiple preclinical studies [12,13], and over 60 clinical trials registered at the US Registry of Clinical Trials that uses HSI for diagnostics and/or evaluating treatment strategies. HSI is also explored in pharmacology to monitor nanodelivery platforms [14] and drug quality testing [15]. In spite of all the benefits of HSI imaging, the current cost of HSI platforms is quite prohibitive for a wider adoption for experimentation and research. Consequently, having a simplified and cost-effective portable platform will enable researchers and technologists to apply spectroscopy analysis to wider fields and explore new directions in machine vision.
Given this challenge, significant progress has been made to produce lab-made HSI imaging platforms with multiple successful implementations. One example of such lab-based devices is the work in [16] which proposes a rotational scanning method instead of the typical linear scanning. In this setup, the HSI is built using specialized lab-grade components including a special Dove prism that rotates along with the slit and does not offer a hand-held option. The work in [17] employs the same rotational scanning approach, where it rotates the entire platform including the CMOS sensor using highly stable lab-grade rotational mount. A related work that proposes the use of galvo mirrors is demonstrated in [18], wherein a spectroscope is built from professional components (lenses, slit, and prism), however, the resulting resolution seems to be quite low, and the HSI platform was “unable to obtain high-quality signals”; most likely due to alignment and focusing issues, the platform was relatively compact. A family of experimental HSI platforms proposed in the literature rely on a method called computed tomography imaging spectrometry [19,20,21] which does not require the moving of opto-mechanical parts leading to significant simplification in the building process and a reduction in size. However, such a method can only reconstruct the estimated hyperspectral cube by formulating an inverse problem. Since multiple estimates can form the same projection, the spectral accuracy is not warranted. Other devices based on bandpass filtering are also increasing in popularity, for example, the work in [22] constructed a lab-based HSI platform using an acousto-optic tunable filter (AOTF) which is a promising method for portable imaging platforms; however, the cost of AOTF filters is still quite high, and has the potential to be integrated in a small imaging device. Another filtering method is based on splitting the image into multiple smaller replicas using lenslet arrays or micro lens arrays where each replica is passed through a different bandpass filter, and an example of such lab-based platforms is the work in [23], which still ends up as relatively expensive. An open source platform is presented in [24] using a simple and affordable diffraction grating design with both the design, and the software available to the public. The platform shows good HSI results; however, it is only suitable for experimental remote sensing applications where the platform should be mounted on a UAV. It is thus incapable of acquiring images while stationary as it lacks scanning mechanisms. Having an in-built scanning capability allows the HSI platform to take images while stationary, whether it is for remote sensing applications or for bench-top use-cases.
Based on the available literature, we found the opportunity to develop the fundamental framework for a slit-based line scan HSI with a simplified, practical, and reliable implementation, which is both open source and ultra-low-cost. The key novelties of the presented paper can be summarized in the following points:
- The mathematical basis for a line scan hyperspectral imaging system is developed using slit spectrograph.
- The expressions of the expected spectral and spatial bounds are presented.
- A practical framework for designing and constructing ultra-low-cost HSI platforms is provided.
- An example of an implementation of the framework with open source software and hardware design is demonstrated.
- A simple and cost-effective way to test the HSI platform using common fluorescent lamps is shown.
- A deconvolution method is applied to enhance the monochromatic estimation of the image.
Readers interested in building the platform can refer to Section 3, which explains the detailed design of the software and hardware. Section 2 develops the mathematical framework for the line-scan imaging and provides a novel method for deconvoluting line-scan images. Finally, Section 4 showcases some HSI images captured from our prototype and the achieved resolution in both spatial and spectral domains, and explains the calibration methodology.
2. Principle of Operation
In this section, we describe the theory of operation of the proposed hyperspectral imaging platform (which we dub as OpenHype for brevity), and the reasoning/trade-offs behind the different design choices. There are three main entities in the system: (i) the opto-mechanical system; (ii) the controller electronics; and (iii) the signal processing and data representation unit. For convenience, the main symbols and notations used in this paper are listed in Table 1.

Table 1.
Symbols and Parameters.
2.1. Imaging Optics
The HSI image consists of a 3D data cube, i.e., the hyperspectral cube, with two dimensions representing the spatial features and a third dimension for the spectral information. There are multiple methods to acquire this 3D data cube including: (i) the point scan (or whiskbroom) which obtain the spectral information of individual pixels one at a time. Although it can provide superior spectral resolution, it is obviously a slow process; (ii) the spectral band scan (or framing) where the projected image is typically passed through tunable (or switchable) bandpass filter(s) that only allows a narrow slice of the spectrum, then the filter sweeps across the spectrum one slice at a time. This method requires expensive tunable filter(s), as such filters are quite promising with evolving speed and finer filtering bandwidth [22]. A third method (iii) is to optically duplicate the scene into multiple smaller replicas where each is passed through a narrow bandpass filter (also called a snapshot method [23]), this method offers faster acquisition. However, it requires special microfabricated lens arrays that are currently out of reach for typical consumers. The fourth method (iv), which we adopt here, is the line scan, also called the push broom scan, where the scene is scanned line-by-line and each line across the x direction is spread into a 2D spatio-spectral snapshot as indicated in Figure 1, and subsequently, these 2D snapshots are stacked to form the hyperspectral data cube . Note that the z axis is a representation of the wavelength components as it will be further explained in Section 2.1.1. In this method, a typical spectrograph can be used to spread the scanned line into the 2D spatio-spectral snapshot. As indicated in Figure 1, an imaging lens (b) forms a real image of the target (a) at a narrow slit (or window) (c) which defines the extent of the imaged line. Due to the narrow slit, the light diverges due to the diffraction at the slit and needs to be collimated through a lens (d). The collimated light then passes through dispersive optics where two options are widely used:
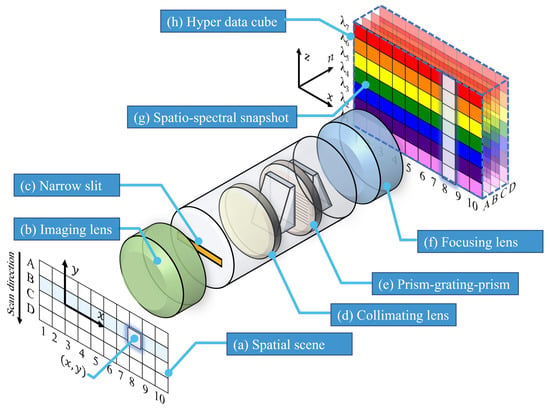
Figure 1.
An overview diagram of the line-scan (push broom) hyperspectral imaging arrangement, each line in the spatial scene (a) is dispersed into a 2D spatio-spectral snapshot (g). Note that, here, x and n represent the spatial dimensions and z represents the spectral.
- The optical prism has a very low transmission loss; however, the resulting spatial spread of wavelength is nonlinear and requires careful calibration with reliable optical sources.
- Diffraction grating spreads light linearly, which makes it quite easy to calibrate. The grating film can be sandwiched between two back-to-back prisms such that the input light and the detector are on a straight line [5], and accordingly, the arrangement is termed prism–grating–prism (PGP).
After the dispersion of the light into its spectral components, a spatio-spectral image (g) needs to be formed at the sensor. The complementary metal-oxide-semiconductor (CMOS) sensors have vastly taken over charged coupled device (CCD) sensors in consumer electronics: although CMOS sensors traditionally suffer from a higher dark current and lower signal to noise ratio, their superior read-out speed and low-cost make them widely available in consumer electronics. However, there are fundamental limits to silicon Si-based CMOS sensors (which are the typical semiconductor in consumer electronics), where their sensitivity cannot go beyond the near-infrared band (NIR) [4]. This limitation is stipulated by the bandgap energy of approximately ≈ 1.1 eV (1100 nm) beyond which there will be no photogenerated carriers. Other materials such as mercury cadmium telluride (MCT) are sensitive to much lower energy in the SWIR band and beyond [25], making them suitable for Earth observation application in vegetation and carbon dioxide emission monitoring. However, such sensors are still far from consumers’ access due to their prohibitive price tag.
In order for the line-scan method to work, a mechanism is needed to sweep the optical slit across the scene, which is typically performed using a moving platform in cases such as of Earth observation satellites, aerial photography, hyperspectral microscopy, and food production lines. However, in our case, the camera position is fixed with respect to the scene, and thus a cost-effective method is to utilize a mirror mechanism to scan the scene across the spectrograph slit.
2.1.1. Optical Dispersion Function
Assume a hyperspectral scene (image) denoted as where represent the spatial dimensions (e.g., measured in pixels) and is the spectral dimension. Let this image be factored into two components as follows,
where represents the total intensity of the pixel across all bands, and represents the normalized power spectral density of the same pixel. We define to be computed as follows
thus, the normalized power spectral density is given by . The image passes through the spectrograph slit which is represented by a windowing function , assuming that the scanning occurs along the y axis where n is the line number and L is the amount of spatial shift each time the mirror moves one step; thus, the windowed image becomes
After that, the windowed image becomes spectrally dispersed via the prism–grating–prism and spreads along the detector’s (camera) 2D sensor. As indicated in Figure 1, each point x spreads over the entire z axis. Consequently, each point spreads according to the following general form,
where is the dispersion function of the dispersive device which depends on the incident wavelength. Note that represents the resulting snapshot if all other points on the y axis are masked. For linear dispersive devices (e.g., prism–grating–prism), this spread is linearly proportional to the wavelength, but is slightly shifted (along the z axis) according to the y location of the point within the slit. As such, the spread of a single (x,y) point can be expressed as follows
where A represents the gain of the optical sensor. The above is the spread caused by a single point . Note that represents the wavelength measured in nm, while z is the desperation shift measured in pixels, so we implicitly assumed a unity conversion between nm and pixels, without loss of generality, in order to simplify the notations.
However, all points with a given y-slice that pass through the finite slit are going to have overlapping spectral spreads with a small difference in the spatial shift. The resulting snapshot is expressed as
which is what we previously termed the spatio-spectral snapshot projected at the camera’s sensor for a given line index n. An example of an actual spatio-spectral snapshot is shown in Figure 2 with a clear indication of how the finite slit width manifests as a windowed image around sharp spectral lines (e.g., the Hg spectral line). Note that it is not entirely accurate to call the spatio-spectral snapshot because, for a finite slit width, the z axis does not directly map the wavelength , but rather some smeared version of the windowed image. The summation limits in (6) are basically the extents of the scene, but effectively, only the portion that passes through the window (slit) is added. From the expression in (6), we can clearly note that the acquired data cube is only a representation of the original scene convoluted both in the spatial and spectral domains because of the finite width of the slit (however, for a given single n, we obtain as a sliced 2D spatio-spectral snapshot, while becomes a 3D cube when acquired for all n). The captured data cube can be shown to converge toward the original scene only when the slit width becomes infinitesimal, i.e., the window function becomes a Dirac delta function and (6) is only sampled at , which will result in
and by choosing a unit step width, i.e., , we obtain , which is equivalent to , by renaming the variables. In a practical sense, a very small slit in the spectrograph will cause a large amount of diffraction and will also only pass a small amount of light, causing the exposure time to increase. We will discuss in Section 2.1.4 how the formula in (6) can be exploited to apply deconvolution and sharpen monochromatic scenes to enhance the spatial resolution.
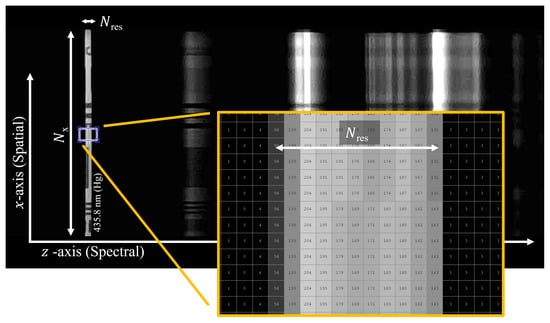
Figure 2.
An example of a spatio-spectral snapshot was captured by the developed platform. The figure shows the spectral width and spatial width of the slit at the mercury line 435.833 nm (NIST Ref L7247). The subject image used to produce this figure is the 1951 USAF test chart. Note that the effect of the finite width of the slit is abstracted in the windowing function in (6).
2.1.2. Spectral Resolution
The slit width plays a crucial role in determining both the spectral and spatial resolution of the imaging platform. To understand the spectral resolution, we start by examining the output of the spectrograph given a very narrow monochromic light source (ideally a narrowband laser or the high peak emission of a florescent light source). Such an output appears as a straight line spanning over a number of pixels for a given slit width. If the total effective width of the sensor (measured in pixels) is given by , then the spectral resolution would be,
where are the wavelengths at the edges of the effective sensor region.
2.1.3. Spatial Resolution
Since the x axis of the scene is directly mapped onto the sensor’s array in each 2D spatio-spectral snapshot , the resulting x axis resolution is the same as the number of effective pixels of the sensor’s , as indicated in Figure 2. Accordingly, it is important to design the spectrograph slit such that its projection can occupy the maximal extent of the CMOS/CCD sensor. For the proposed platform, based on consumer components, there is certainly a compromise in this regard, as consumer spectrometers are not specifically designed to be used in hyperspectral imaging. Accordingly, a careful selection of the focal length of the focusing lens (Figure 1 (f)) will improve the x axis resolution.
In terms of the y axis resolution, the situation is quite different where the line scan number n is used in lieu of the original y pixels in the scene . In particular, the slit captures multiple y pixels in each line scan due to the finite width of the slit. Consequently, all these pixels contribute to the formation of the line scan slice , and thus reduce the y resolution. To provide a better understanding of the y axis resolution performance, we focus on the estimated intensity image, which, similarly to (2), can be calculated as the sum of the spectral components as follows,
However, by restricting the spectrum to a special case of a narrow-band monochromatic scene, e.g., with a fluorescence lamp illuminated subject at one of the distinct mercury (Hg) peaks as shown in Figure 2, we can further simplify this relation. In a monochromatic scene, the normalized power spectral density reduces to a Dirac delta function at the specific illuminating/emitted wavelength, denoted as , i.e., . In this case, by substituting (6) into (9), the summation has only a non-zero value at the monochromatic emitted wavelength. Accordingly, the estimated monochromatic intensity becomes
and since the windowing function is symmetrical, i.e., , the above equation is basically a convolution operation and can be succinctly written as
where the subscript x in emphasizes the fact that the convolution operation is performed on the y variable at a fixed x value. If the windowing function is an ideal rectangle of width , i.e., , then each of y pixels are summed together. Accordingly, the upper bound of the resolution will be
which indicates that, for a maximal resolution, the slit should only pass a single pixel of the scene (i.e., when ). In other words, the captured data cube resolution is bounded by the same spatial resolution of the scene measured in pixels. However, as we will see in the next subsection, since the windowing function is known, even when the window , it is theoretically possible to perform a deconvolution such that the resolution is brought down to the one-pixel bound.
2.1.4. Deconvolution
The monochromatic image (intensity) can provide, in many cases, a reasonable indication of the overall spatial properties of the scene. Consequently, we propose here a deconvolution operation on (11) to retrieve the original monochromatic intensity based on the observed intensity . Since we have a good understanding of the windowing filter w, we can apply the well-known Lucy–Richardson algorithm [26] to deblur the observed intensity. This algorithm works in an iterative manner where each iteration tries to enhance the estimation of the noise, thus reducing the error in the deconvolution estimation. An example of the obtained resolution improvement on monochromatic intensity is shown in Figure 14, where the test setup will be explained later in Section 4, the deconvolution is implemented using the deconvlucy function in Matlab, which is based on the method explained in [26].
2.2. Platform’s Controller
The main objective of the controller can be summarized in three ways: (i) to coordinate the scanning action of the camera and the acquisition of the spatio-spectral snapshots; (ii) to stack the snapshots and store the data cube; and (iii) to provide an interface to the user. The entities required to perform these functions do not indeed have to be on a single hardware platform; however in terms of functionalities, the controller’s components can be grouped into three entities:
- Low-level controller tasked with handling the interface with the actuator/motor(s) for performing the scanning action. The scanning action in the proposed platform is achieved by rotating, i.e., deflecting, a mirror. Furthermore, note that this controller needs to sense/estimate the position of the mirror in order to provide precise movements. The controller indeed requires a regulated power source for stable motor movement.
- High-level controller that coordinates the scanning action and image acquisition, performs signal pre-processing, and stores the data slices.
- User interface to allow human or machine interface to the hyperspectral platform.
These components and their logical interconnections are shown in Figure 3. We will see in Section 3.2 that the low-level controller is in fact where the most hardware development is needed, so other entities can be implemented as a software/script using typical personal computers or using small single-board/embedded computers.
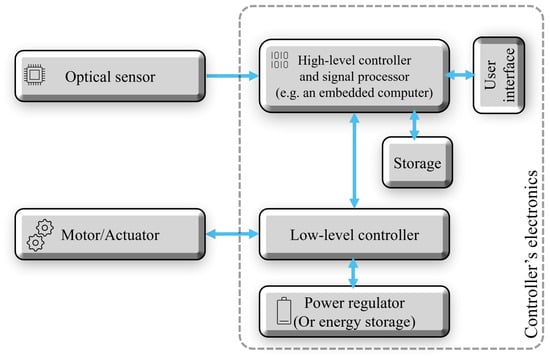
Figure 3.
Electronics and controller functional diagram of the line scan hyperspectral platform.
3. Design and Build
In order to keep the proposed platform within the affordability of researchers, we utilize consumer-grade components that are easily accessible through common online markets. We explain the design and construction of the platform in three sections according to the three main fields of expertise required to build the platform.
3.1. Opto-Mechanical Parts
The main optical and mechanical components used in the platform are shown in Figure 4 where we utilize the widely available galvanometer mirror scanners that are commonly used in laser show devices (also called galvo mirrors). These are typically highly capable devices with a fine angular resolution down to a range of a few and with a response rate in the range of multiple kHz [27]. In order to attain precise control, the motor is integrated with a high-accuracy positioning sensor providing the needed feedback for closed loop control, which is performed by the low-level controller (see Figure 3 for details). Consumer-level galvo mirrors are typically sold with an analog driver circuitry that accepts a −/+ 5 V control signal to position the mirror, where the angular deflection is linearly proportional to the input voltage. The closed loop controller is typically sold as part of the low-cost galvo mirrors setup and there is no need to develop it from scratch. Note that, in such laser scanning applications, there are typically two cascaded mirrors; one to perform the x axis scanning and another to perform the y axis scanning. In our application, we just need to move across the y axis; consequently, the x motor is removed. After the mirror, the scene passes through an imaging lens which has the task of creating a real image of the target focused right on the slit. We select the widely available CS-mount camera lens with an adjustable focus and focal lens (2.8–11 mm), these lenses are commonly used for CCTV applications. As such, a small longitudinal portion of the projected image passes through the slit, where the latter comes integrated with the spectrograph optics. In this platform, we utilize a gemstone spectroscope which is basically a simple transmission spectrograph and is widely available for consumers; this spectrograph is sold as a low-cost gemstone identification tool. This spectrograph is designed to produce a virtual image which is originally intended to be directly used by a human operator. Accordingly, in order to obtain a real image projection on the CMOS sensor, we need another focusing lens which we select as a very-low-price M12 lens (which has a 12 mm diameter thread commonly used in low-end USB cameras). The lens aperture fits well with the ocular side of the spectroscope. For the sensor, we choose the widely available Si-based CMOS sensors, and in particular, a monochrome USB camera would be better suited to the imaging requirements than RGB cameras because the latter implement different interpolation methods in the readout circuitry, complicating the amplitude calibration of the spectrum. Other combinations of the optical system are indeed possible; however, care must be taken to maximize the projection on the CMOS sensor and to minimize the chromatic aberration which constitutes the main limitation in such low-cost platforms.
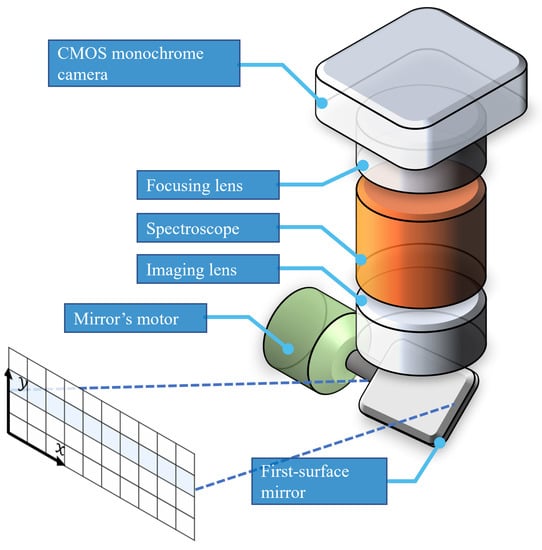
Figure 4.
Galvometer-based (galvo) mirror scanning hyperspectral imaging platform, where the mirror is placed at the very front-end of the platform.
Mechanical prototyping can be rapidly achieved using common plastic 3D printers; as such, we utilized easy-to-print polylactic acid (PLA) plastic to join the different optical parts of the system, as listed in Table 2, along with the functionality of each. The printing is recommended to be in black color in order to minimize the optical leakage and stray light. The provided open source computer-aided design (CAD) drawings are intended to be easily printable (i.e., with no or minimal support materials). Furthermore, it is to be noted that an aluminum backbone beam (with a rectangular cross-section) was used to improve the stability of the optical alignment. The CAD of the 3D parts is shown in Figure 5, while Figure 7a shows the actual assembled parts of the optical system. The source CAD files and printable STLs are provided in the following link [28].

Table 2.
Three-dimensional printed parts.
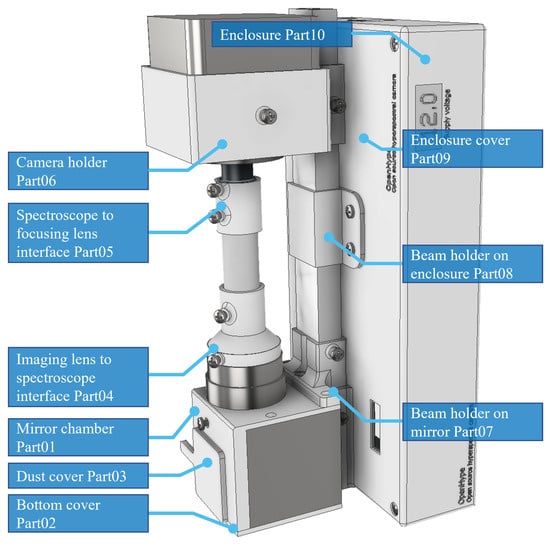
Figure 5.
Engineering illustration of the required 3D printed parts for the platform.
3.2. Electronics
To keep the design simple and with a fast design-implement cycle, we rely on typical desktop computer (PC) to perform most of the functionalities (indicated in Figure 3) including: pre-processing, storage, user interface, and high-level controlling. Accordingly, the required electronics hardware is primarily used to translate the PC commands to a deflection of the mirror angle. The interface is performed through a standard emulated serial port over USB using the popular (and very low cost) Arduino Uno development board. The board is in turn connected to a digital-to-analog converter (DAC) which has a high resolution of 12-bits, and the interface between the Arduino and the DAC is through the standard IC protocol. To further cut the development time, we utilize the popular MATLAB environment which has built-in functions for sending IC commands. As such, the desired value of the DAC can be directly issued by a MATLAB script without the need to develop a custom firmware for the Arduino. The selected DAC is MCP4725, which is widely available and has a full rail-to-rail 0 to 5 V range; however, typical galvo controllers on the market accept a different input range from −5 V to +5 V. Accordingly, the only needed circuitry to be developed is a simple amplifier that converts the 0–5 V signal into −/+5 V, which is shown in Figure 6 along with the simplified schematic diagram of the controller.
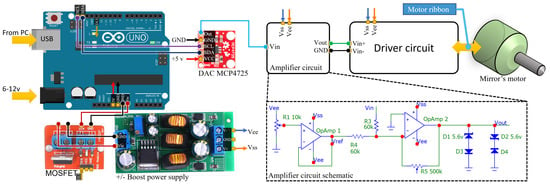
Figure 6.
A simplified schematic diagram of the low-level controller circuit where the amplifier is the only custom-made component, and all the rest are of-the-shelf consumer electronics.
The amplifier consists of two stages, the first being a voltage follower that provides a −2.5 V reference, which is in turn subtracted from the DAC’s 0–5 V using the second stage summing amplifier with 3 dB gain. The Zener diode set added at the output is optional which is intended to limit the output voltage sent to the driver circuit. The last stage of the signal is thus conditioned between −5 and +5 V, where the voltage linearly corresponds to the deflection of the mirror from the center position. The relation between the input voltage and the output can be expressed as follows
The mirror driver circuit is typically sold along with the motors and the mirrors where, unlike demanding laser scanning applications, a low frequency circuit is sufficient for scanning the scene adequately. Since the power consumption of the circuit is typically high (approximately 6–20 watts), it is recommended to only energize the driver circuit during image acquisition, which can be achieved using a solid-state switch (e.g., MOSFET) which can be controlled by the Arduino, as shown in Figure 6. For further illustration, we depict the overall abstracted build of the platform in Figure 7, showing both the optics and the electronics.
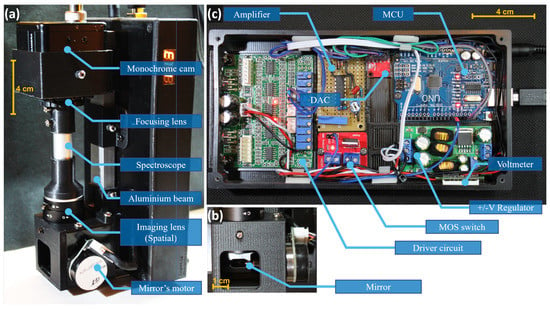
Figure 7.
Details of the platform build: (a) an overall external view of the opto-mechanical system and its components; (b) a zoomed-in view of the galvanometer mirror chamber; and (c) top view of the electronics circuitry inside the enclosure constituting the low-level controller. The overall size of the resultant platform is approximately 20 cm height × 10 cm width × 10 cm depth.
3.3. Software
In order to cut the development time and proof the concept of the platform, the high-level controller is implemented in MATLAB scripting language which has the built-in functions of a quick IC interface to the DAC. Nevertheless, it would be relatively straightforward to implement the control algorithm using Python or any other common scripting/coding tool. A simplified overall operation of the software is listed as a pseudo code in Algorithm 1 showing the two main stages of the high-level controller/software, which are: (i) the initialization stage, which establishes the connection between the PC from one side and both the low-level controller and the USB CMOS sensor camera from the other side; (ii) the second stage, which is the data cube capturing routine, which is initiated every time the user wants to capture a new hyperspectral image. This routine incrementally increases the deflection of the mirror and captures a 2D spatio-spectral snapshot at each deflection. Note that a mechanism should be implemented to ensure that the mirror has reached its destination before capturing the CMOS snapshot: one way to implement such mechanism is by waiting for a small interval between issuing the Write_DAC command and the Capture_Snapshot command.
For an easy-to-use interface, the controller is also provided in the form of a graphical user interface (GUI), as shown in Figure 8 and Figure 9. The main Capturing GUI allows the user to interactively set the serial port and the name of the camera, in addition to the desired total number of lines , which determines the scanning resolution. The GUI allows the online visualization of the results (both the estimated intensity and the current spatio-spectral snapshot (data cube slice), all while the scan is being performed. In addition, another Settings GUI is provided (as shown in Figure 9) for the user to fine-tune the USB camera settings including the brightness, contrast, exposure time, sharpness, and gamma correction. The settings GUI also allows the interactive cropping of the region of interest (ROI) corresponding to the projection of the focusing lens on the CMOS sensor. Note that this cropping step is required because both the spectroscope and the camera are consumer products which were fabricated in the intention of integration, resulting in some reduction in the number of effective pixels that are projected with the 2D spatio-spectral snapshot. After choosing the desired settings, the user can save the parameters to be automatically retrieved by the main interface GUI. The codes to generate these two GUIs are also provided as part of the open source package [28].
| Algorithm 1 OpenHype high-level controller (Simplified) |
| Initialization: Load_Parameters Connect_Arduino Connect_Camera ← Send_Parameters |
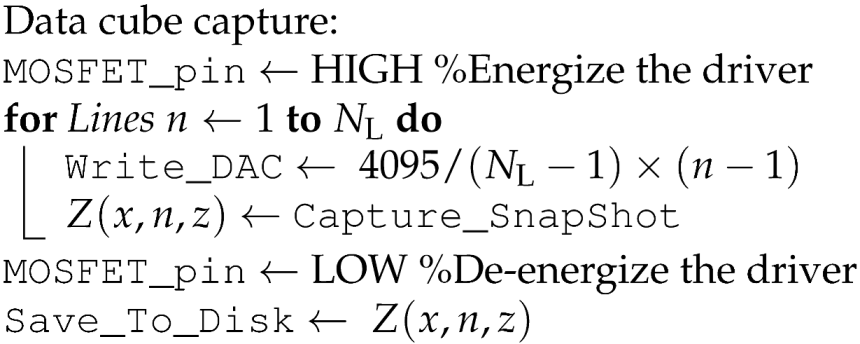 |
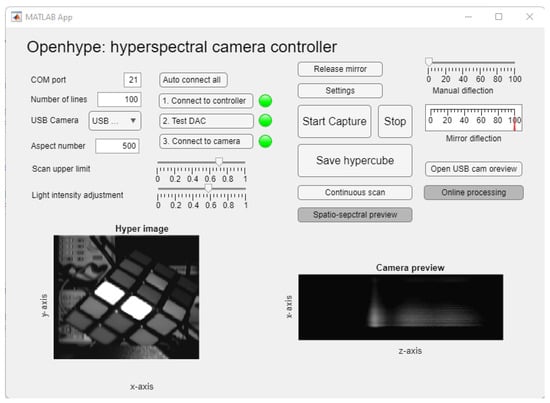
Figure 8.
The GUI interface for the hyperspectral imaging platform (Capturing GUI).
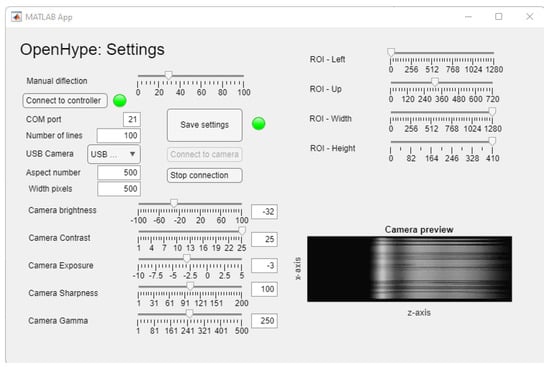
Figure 9.
The GUI for setting the parameters of the USB camera (Settings GUI).
4. Experiment and Results
There are different methods to present the 3D data cube in a meaningful manner; one simple method is to plot the overall 2D estimated intensity in (9) along with a 1D power spectral density at a selected point(s), i.e., , where is the given point and z represents the wavelength variable. For this visualization, we image a high-end optical filter wheel from Thorlabs Inc. equipped with six bandpass optical filters at consecutive center wavelengths. Namely, each filter has a bandwidth of 40 nm (full width at half maximum—FWHM) and the centers are 50 nm apart. As shown in Figure 10, the spectrum of six sampling points is superimposed where each spectrum is observed to be confine to the bandwidth of the corresponding optical filter. The overall illuminating spectrum is overlaid as a dotted line.
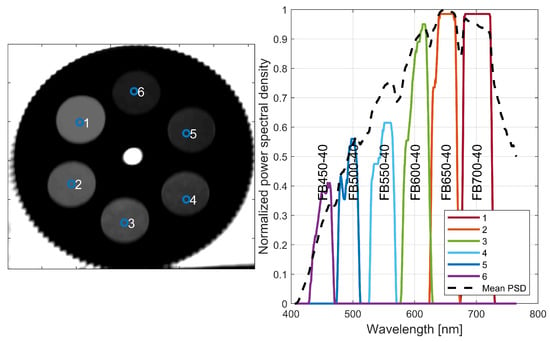
Figure 10.
Initial camera test based on a calibrated filter wheel (left) with optical bandpass filters at centers nm with a FWHM bandwidth of 40 nm. The light source is a wideband warm halogen bulb. The spectra of the 6 sample points are superimposed on the right-hand-side plot.
Another method to look at the data cube is to slice it (or bin it) into several sections according to certain wavelength ranges. The test scene in Figure 11 is a typical toy cube with bricks of 6 different colors (white, yellow, red, blue, orange, and green), where the spectrum is binned at 14 different centers showing a clear distinction of different slices. The intensity binning is performed similarly to (9), but with limits that only extend into the bin’s range, as follows
where m is the bin index and are the bounds of the bin. The sliced view in Figure 11 also shows a typical red–green–blue (RGB) reconstruction of the image. The reconstruction was performed by mapping the wavelength of each slice to the corresponding CIE 1931 XYZ color space, and then applying standard XYZ–RGB transformation, a method is explained in this publication [29].
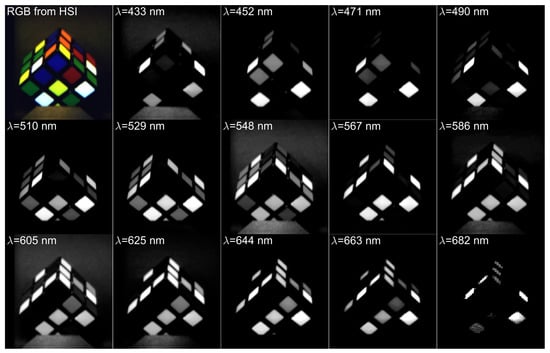
Figure 11.
The hyperspectral image obtained using the proposed HSI platform (OpenHype) binned into slices. Each spectral slice has an approximate bandwidth of 19 nm. The upper left corner image is an RGB reconstruction from the hyperspectral data.
Another much simpler method, but less accurate, is to divide the spectrum into 3 bands for (red, green, and blue) based on the wavelength and sum of the intensity inside each spectral segment. The RGB intensities are then simply calculated as
where C here represents the base color, i.e., , and , are the minimum and maximum bounds of each base color. This method is similar to the one explained in [30] which has a bandgap between the wavelength ranges. An example of three data cubes converted into RGB using this simplified method is shown in Figure 12.
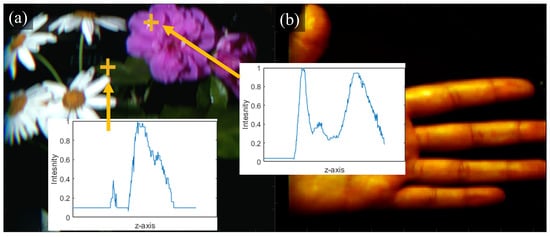
Figure 12.
Three generic scenes taken by the OpenHype platform, wherein the RGB colors are reconstructed by directly segmenting the data cube into three sections (a,b).
4.1. Cost and Build Time
Aside from the open source design and software, the main advantages of the proposed method/platform include the very low cost and the availability of components. The total cost of components is in the range of USD 190–USD 250, which is less than 1–2% of what commercial HSI devices cost. The cost breakdown includes:
- Galvo mirrors and controller USD 70–USD 120 (in our build USD 72);
- Monochrome USB camera with CS lens USD 40–USD 70 (in our build USD 59);
- Spectroscope USD 20–USD 50 (in our build USD 39);
- Electronic components USD 20 USD 30 (in our build USD 25);
- PLA 3D-printed parts USD 15 (around 30–50% of a 1 kg reel).
The building steps can be summarized in the following main steps:
- Step 1: 3D printing the enclosure and components;
- Step 2: Soldering the amplifier components;
- Step 3: Assembling the circuit modules inside the enclosure and connecting the modules;
- Step 4: Assembling the optics and adjusting the optical alignment;
- Step 5: Testing and calibrating the platform as per the method recommended in Section 4.3.
The build time depends on the experience of the builder but could roughly take around 1–2 days.
4.2. Spectral Results
For mapping the optical spectrum to the CMOS sensor’s z axis, we need to capture a series of known wavelengths . One cost-effective method is to use common florescent lamps which, unlike LEDs and incandescent sources, have sharp spectral peaks in the visible band. The emitted spectrum of a typical florescent lamp is a complex combination of mercury (Hg) vapor emission and the phosphorescent emission of the tube coating. This coating is a blend of rare earth phosphors including yttrium (Y), europium (Eu), and terbium (Tb) with different proportions aiming to provide convenient color rendering for lighting applications [31]. As such, by using a simple fluorescent tube or the more recent compact fluorescent lamp (CFL), we can note multiple spectral peaks that can be easily identified, some of which are known emission lines of Hg [32], whilst the rest are from the rare-earth-doped phosphors. Therefore, in order to perform the spectral mapping, we illuminate a bright subject with a typical CFL lamp and compare the resulting pattern to publicly available spectral measurements performed by a high-end spectrometer Ocean Optics HR2000 [33]. We depict the results in Figure 13a showing the peak mapping between the sensors z axis and the peak’s wavelength where the linearity of the utilized spectroscope is evident. To establish a comparison with other commercial devices, we utilize the mid-range compact spectrometer-Hamamatsu C12666MA which operates in the visible band. As can be seen in Figure 13c, the proposed platform outperforms this sensor and provides a much better match and resolution when compared to higher-end spectrometers. For additional comparison, note that a typical high-end commercial spectrometer has a spectral accuracy of 0.1–10 nm [34].
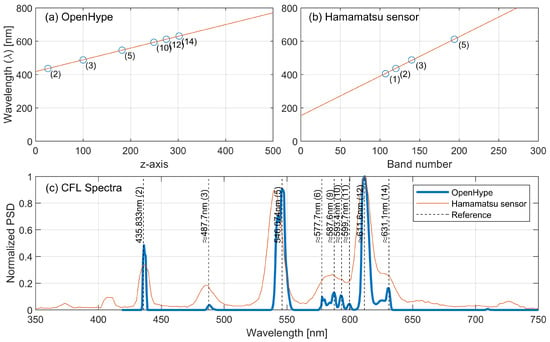
Figure 13.
(a) Spectral lines mapping for the proposed platform; and (b) lines mapping for an off-the-shelf compact sensor (Hamamamatsu [35]); (c) the mapped spectrum of a typical CFL light source comparing the proposed platform (OpenHype) against the reference [33] and the compact spectrum sensor. Spectral lines (2) and (5) are for Hg (NITS Ref L7247) at 435.833 nm 546.1 nm, respectively, and the rest are approximates based on the reference [33].
4.3. Spatial Results
In Section 2.1.2 and Section 2.1.3, we provide the theoretical basis for calculating the resolution in terms of the number of CMOS pixels. However, for a practical quantitative comparison, we utilize a version of the widely used test chart, 1951 USAF, as the target scene illuminated with a CFL light source. The collected scene by the OpenHype platform is presented in Figure 14, where Figure 14a shows the estimated intensity image obtained based on the formula in (2) where, by comparing with the monochromatic intensity , we note an improved resolution of the latter due to the lack of chromatic aberration. The final Figure 14c shows an improved monochromatic intensity after applying the presented deconvolution method in Section 2.1.4.
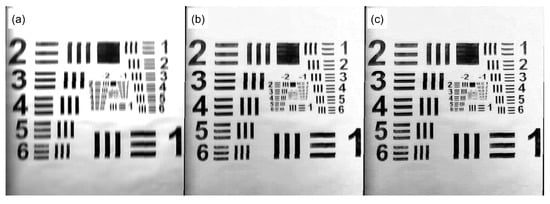
Figure 14.
Resolution test using the 1951 USAF test chart: (a) is the total estimated chromatic intensity based on (2); (b) is a monochromatic intensity selected at the mercury line nm; and (c) is the same monochromatic slice after applying Lucy–Richardson deconvolution.
5. Conclusions
This paper developed the mathematical basis for line scan hyperspectral imaging systems using a slit spectrograph including the expected resolution bounds in the spectral and spatial domains. Accordingly, a comprehensive framework for developing a low-cost hyperspectral imaging platform was presented, including the opto-mechanics and the controller, which is implemented using consumer-grade components. At the heart of the imaging platform is a low cost, consumer-grade gemstone spectroscope and a laser galvo-mirror set. The design and implementation are completely open source [28], including both the hardware and software, while providing readers with a framework to develop their own implementation of the platform. The open source nature of the proposed framework facilitates its customization and adaptation to specific remote sensing applications or other fields. It provides users with access to both the underlying software code and built hardware, allowing them to modify, adapt, and extend the platform’s functionality to suit their specific needs. This flexibility enables users to customize the platform’s data acquisition, processing, and analysis algorithms to optimize the performance for their particular application or research question. This paper further demonstrated the superior performance of the system in the spectral domain in comparison to high-end spectrometers. Furthermore, a deconvolution method was presented based on the Lucy-Richardson estimation to deblur the observed intensity, a method that significantly improves the monochromatic quality of the image. Possible future work could include further improvements to the spectrograph for reducing chromatic aberration and the framework development of a different scanning approach such as rotation-based scanning.
Author Contributions
A.A.-H. performed the design and development of the platform, development of the mathematical framework, experimentation, contributed to the writing, and led the research work. S.B. contributed to the writing of the paper and reviewing the scientific approach. S.W. provided writing contribution, and optical sensors expertise. T.H. contributed to the writing, literature review, and use-case identification. All authors have read and agreed to the published version of the manuscript.
Funding
This research received no external funding.
Data Availability Statement
Data is made available in [28] under license scheme: Attribution-NonCommercial 4.0 International (CC BY-NC 4.0).
Conflicts of Interest
The authors declare no conflict of interest.
References
- Lu, G.; Fei, B. Medical hyperspectral imaging: A review. J. Biomed. Opt. 2014, 19, 10901. [Google Scholar] [CrossRef] [PubMed]
- Meng, J.; Weston, L.; Balendhran, S.; Wen, D.; Cadusch, J.J.; Rajasekharan Unnithan, R.; Crozier, K.B. Compact Chemical Identifier Based on Plasmonic Metasurface Integrated with Microbolometer Array. Laser Photonics Rev. 2022, 16, 2100436. [Google Scholar] [CrossRef]
- Raza, A.; Dumortier, D.; Jost-Boissard, S.; Cauwerts, C.; Dubail, M. Accuracy of Hyperspectral Imaging Systems for Color and Lighting Research. LEUKOS 2023, 19, 16–34. [Google Scholar] [CrossRef]
- Adão, T.; Hruška, J.; Pádua, L.; Bessa, J.; Peres, E.; Morais, R.; Sousa, J.J. Hyperspectral Imaging: A Review on UAV-Based Sensors, Data Processing and Applications for Agriculture and Forestry. Remote Sens. 2017, 9, 1110. [Google Scholar] [CrossRef]
- Qin, J.; Kim, M.S.; Chao, K.; Chan, D.E.; Delwiche, S.R.; Cho, B.K. Line-Scan Hyperspectral Imaging Techniques for Food Safety and Quality Applications. Appl. Sci. 2017, 7, 125. [Google Scholar] [CrossRef]
- Moroni, M.; Lupo, E.; Marra, E.; Cenedese, A. Hyperspectral Image Analysis in Environmental Monitoring: Setup of a New Tunable Filter Platform. Procedia Environ. Sci. 2013, 19, 885–894. [Google Scholar] [CrossRef]
- Peyghambari, S.; Zhang, Y. Hyperspectral remote sensing in lithological mapping, mineral exploration, and environmental geology: An updated review. J. Appl. Remote Sens. 2021, 15, 031501. [Google Scholar] [CrossRef]
- Lu, B.; Dao, P.D.; Liu, J.; He, Y.; Shang, J. Recent Advances of Hyperspectral Imaging Technology and Applications in Agriculture. Remote Sens. 2020, 12, 2659. [Google Scholar] [CrossRef]
- Hycza, T.; Stereńczak, K.; Bałazy, R. Potential use of hyperspectral data to classify forest tree species. N. Z. J. For. Sci. 2018, 48, 18. [Google Scholar] [CrossRef]
- Barberio, M.; Benedicenti, S.; Pizzicannella, M.; Felli, E.; Collins, T.; Jansen-Winkeln, B.; Marescaux, J.; Viola, M.G.; Diana, M. Intraoperative Guidance Using Hyperspectral Imaging: A Review for Surgeons. Diagnostics 2021, 11, 2066. [Google Scholar] [CrossRef]
- Ortega, S.; Fabelo, H.; Iakovidis, D.K.; Koulaouzidis, A.; Callico, G.M. Use of Hyperspectral/Multispectral Imaging in Gastroenterology. Shedding Some–Different–Light into the Dark. J. Clin. Med. 2019, 8, 36. [Google Scholar] [CrossRef] [PubMed]
- Grambow, E.; Sandkühler, N.A.; Groß, J.; Thiem, D.G.E.; Dau, M.; Leuchter, M.; Weinrich, M. Evaluation of Hyperspectral Imaging for Follow-Up Assessment after Revascularization in Peripheral Artery Disease. J. Clin. Med. 2022, 11, 758. [Google Scholar] [CrossRef]
- Khaodhiar, L.; Dinh, T.; Schomacker, K.T.; Panasyuk, S.V.; Freeman, J.E.; Lew, R.; Vo, T.; Panasyuk, A.A.; Lima, C.; Giurini, J.M.; et al. The use of medical hyperspectral technology to evaluate microcirculatory changes in diabetic foot ulcers and to predict clinical outcomes. Diabetes Care 2007, 30, 903–910. [Google Scholar] [CrossRef] [PubMed]
- Peña Mdel, P.; Gottipati, A.; Tahiliani, S.; Neu-Baker, N.M.; Frame, M.D.; Friedman, A.J.; Brenner, S.A. Hyperspectral imaging of nanoparticles in biological samples: Simultaneous visualization and elemental identification. Microsc. Res. Tech. 2016, 79, 349–358. [Google Scholar] [CrossRef] [PubMed]
- Su, X.; Wang, Y.; Mao, J.; Chen, Y.; Yin, A.; Zhao, B.; Zhang, H.; Liu, M. A Review of Pharmaceutical Robot based on Hyperspectral Technology. J. Intell. Robot. Syst. 2022, 105, 75. [Google Scholar] [CrossRef]
- Abdo, M.; Badilita, V.; Korvink, J.G. Spatial scanning hyperspectral imaging combining a rotating slit with a Dove prism. Opt. Express 2019, 27, 20290–20304. [Google Scholar] [CrossRef]
- Luo, L.; Li, S.; Yao, X.; He, S. Rotational hyperspectral scanner and related image reconstruction algorithm. Sci. Rep. 2021, 11, 3296. [Google Scholar] [CrossRef]
- Liu, X.; Jiang, Z.; Wang, T.; Cai, F.; Wang, D. Fast hyperspectral imager driven by a low-cost and compact galvo-mirror. Optik 2020, 224, 165716. [Google Scholar] [CrossRef]
- Habel, R.; Kudenov, M.; Wimmer, M. Practical Spectral Photography. Comput. Graph. Forum 2012, 31, 449–458. [Google Scholar] [CrossRef]
- Salazar-Vazquez, J.; Mendez-Vazquez, A. A plug-and-play Hyperspectral Imaging Sensor using low-cost equipment. HardwareX 2020, 7, e00087. [Google Scholar] [CrossRef]
- Toivonen, M.E.; Rajani, C.; Klami, A. Snapshot hyperspectral imaging using wide dilation networks. Mach. Vis. Appl. 2020, 32, 9. [Google Scholar] [CrossRef]
- Abdlaty, R.; Sahli, S.; Hayward, J.; Fang, Q. Hyperspectral imaging: Comparison of acousto-optic and liquid crystal tunable filters. In Proceedings of the Conference Proceedings of SPIE, Houston, TX, USA, 26 June 2018; Volume 10573, p. 105732P. [Google Scholar]
- Mu, T.; Han, F.; Bao, D.; Zhang, C.; Liang, R. Compact snapshot optically replicating and remapping imaging spectrometer (ORRIS) using a focal plane continuous variable filter. Opt. Lett. 2019, 44, 1281–1284. [Google Scholar] [CrossRef] [PubMed]
- Mao, Y.; Betters, C.H.; Evans, B.; Artlett, C.P.; Leon-Saval, S.G.; Garske, S.; Cairns, I.H.; Cocks, T.; Winter, R.; Dell, T. OpenHSI: A Complete Open-Source Hyperspectral Imaging Solution for Everyone. Remote Sens. 2022, 14, 2244. [Google Scholar] [CrossRef]
- Wang, Y.W.; Reder, N.P.; Kang, S.; Glaser, A.K.; Liu, J.T.C. Multiplexed Optical Imaging of Tumor-Directed Nanoparticles: A Review of Imaging Systems and Approaches. Nanotheranostics 2017, 1, 369–388. [Google Scholar] [CrossRef] [PubMed]
- Biggs, D.S.C.; Andrews, M. Acceleration of iterative image restoration algorithms. Appl. Opt. 1997, 36, 1766–1775. [Google Scholar] [CrossRef] [PubMed]
- ThorLabs. User Guide. Available online: https://www.thorlabs.com/navigation.cfm?guide_id=2269 (accessed on 16 May 2023).
- Al-Hourani, A. OpenHype:Line Scan Hyperspectral Imaging Principles for Open-Source Low-Cost Platforms. Available online: https://github.com/AkramHourani/OpenHype (accessed on 16 May 2023).
- Magnusson, M.; Sigurdsson, J.; Armansson, S.E.; Ulfarsson, M.O.; Deborah, H.; Sveinsson, J.R. Creating RGB Images from Hyperspectral Images Using a Color Matching Function. In Proceedings of the IGARSS 2020-2020 IEEE International Geoscience and Remote Sensing Symposium, Waikoloa, HI, USA, 26 September–2 October 2020; pp. 2045–2048. [Google Scholar] [CrossRef]
- Richards, J.A. Remote Sensing Digital Image Analysis, 6th ed.; Springer International Publishing: New York, NY, USA, 2022. [Google Scholar]
- Seetharaman, S. Treatise on Process Metallurgy, Volume 3: Industrial Processes: Industrial Processes; Elsevier: London, UK, 2013. [Google Scholar]
- National Institute of Standards and Technology. Spectra Databas.
- Wikimedia Commons. Fluorescent Lighting Spectrum Peaks. 2022. Available online: https://commons.wikimedia.org/wiki/File:Fluorescent_lighting_spectrum_peaks_labelled.png (accessed on 20 November 2022).
- ThorLabs. Compact CCD Spectrometers. Available online: https://commons.wikimedia.org/wiki/File:Fluorescent_lighting_spectrum_peaks_labelled.gif (accessed on 16 May 2023).
- Hamamatsu Photonics. Mini-Spectrometer, C12666MA. Available online: https://www.hamamatsu.com/content/dam/hamamatsu-photonics/sites/documents/99_SALES_LIBRARY/ssd/c12666ma_kacc1216e.pdf (accessed on 16 May 2023).
Disclaimer/Publisher’s Note: The statements, opinions and data contained in all publications are solely those of the individual author(s) and contributor(s) and not of MDPI and/or the editor(s). MDPI and/or the editor(s) disclaim responsibility for any injury to people or property resulting from any ideas, methods, instructions or products referred to in the content. |
© 2023 by the authors. Licensee MDPI, Basel, Switzerland. This article is an open access article distributed under the terms and conditions of the Creative Commons Attribution (CC BY) license (https://creativecommons.org/licenses/by/4.0/).