Article

Video-Monitoring Tools for Assessing Beach Morphodynamics in Tidal Beaches

1
Department of Earth Sciences, Faculty of Marine and Environmental Sciences, Instituto Universitario de Investigación Marina (INMAR), University of Cádiz, 11510 Puerto Real, Cádiz, Spain
2
Department of Applied Physics, Faculty of Marine and Environmental Sciences, Instituto Universitario de Investigación Marina (INMAR), University of Cádiz, 11510 Puerto Real, Cádiz, Spain
3
TECNALIA, Basque Research and Technology Alliance (BRTA), Astondo Bidea, Edificio 700, 48160 Derio, Bizkaia, Spain
4
Institute of Marine Sciences (CSIC), Passeig Marítim de la Barceloneta 37-49, 08003 Barcelona, Catalonia, Spain
*
Author to whom correspondence should be addressed.
Remote Sens. 2023, 15(10), 2650; https://doi.org/10.3390/rs15102650
Submission received: 15 April 2023 / Revised: 17 May 2023 / Accepted: 17 May 2023 / Published: 19 May 2023
(This article belongs to the Special Issue Advances in Remote Sensing in Coastal Geomorphology Ⅱ)

Abstract

:
Beach behaviour and evolution are controlled by a large number of factors, being susceptible to human-derived pressures and the impacts of climate change. In order to understand beach behaviour at different scales, systematic monitoring programs that assess shoreline and volumetric changes are required. Video-monitoring systems are widely used in this regard, as they are cost-effective and acquire data automatically and continuously, even in bad weather conditions. This work presents a methodology to use the basic products of low-cost IP video cameras to identify both the cross-shore and long-shore variability of tidal beaches. Shorelines were automatically obtained, digital elevation models (DEMs) were generated and validated with real data, and the outputs were combined to analyse beach behaviour from a morphodynamic perspective. The proposed methodology was applied to La Victoria Beach (SW Spain) for the analysis of beach variations over a 5-year period. The combination of shoreline position analysis and data from DEMs facilitates understanding and provides a complete overview of beach behaviour, revealing alongshore differences in an apparently homogeneous beach. Furthermore, the methods used allowed us to inter-relate the different processes occurring on the beach, which is difficult to achieve with other types of techniques.

1. Introduction

Beaches are complex natural systems whose evolution and behaviour are conditioned by a large number of factors. Beaches also concentrate population and economic activities, which has led to large urban development in these areas [1]. In addition, beaches are extremely vulnerable to the impacts associated with climate change, such as relative sea level rises or changes in wave direction and/or storm frequency and intensity, as well as to decrease in sediment supply and other human-induced modifications that often lead to localised beach erosion [2]. About half of all sandy beaches in the world could be seriously threatened by erosion by the end of the century because of sea level rise, especially where landward transgression is restricted by infrastructure, although the response is dependent on many local environmental factors [3,4]. Effective management strategies are, therefore, needed for these areas, supported by morphodynamic studies that provide information on local processes.
The analysis of coastal processes and morphological responses is essential to understand beach behaviour at different scales, from event responses to seasonal and interannual changes. Beach evolution analyses of tidal areas add complexity to the study, as tidal cycles shift the oceanographic influence along the beach profile [5]. Therefore, the continuous monitoring of these zones is necessary to understand shoreline and volumetric changes and quantify the morphodynamic processes controlling these systems. On the other hand, the real-time monitoring of the rapid changes generated by high-energy events has traditionally been challenging, making it difficult to understand the processes that actually occur under storm conditions.
In beach-monitoring programs, the spatial and temporal resolution and the area and duration of the survey that can be covered are key parameters, as they determine the type of processes that can be observed, from storm-induced rapid changes to seasonal behaviour or changes driven by global atmospheric circulation patterns [6,7,8]. In this regard, the RTK-DGPS was an important breakthrough in systematic beach monitoring, making it possible to cover larger areas faster and more accurately than previous techniques, such as the theodolite and the total station [9] methods or low-cost techniques designed to reduce the number of surveyors needed [10]. Terrestrial laser scanners, airborne LiDAR sensors, and unmanned aerial vehicles are widely used for high-resolution surveys, as they are relatively fast and simple [11], although their characteristics and the need for surveyors compromise a temporal resolution. The use of satellite-based observations to study coastal regions is becoming increasingly widespread. Satellites measure a variety of physical parameters and enable the analysis of shorelines, sea levels, waves, and coastal currents, among others [12]. However, a spatiotemporal resolution is still not enough for monitoring some coastal processes in tidal beaches, where errors in satellite-derived shorelines can exceed 30 m [13], with spatial changes close to the satellite pixel resolution and temporal changes close to the satellite revisiting time. The spatial resolution has improved to 30 m for Landsat 4–8 and 10 m for Sentinel-2, while the revisit time is 5 days for Sentinel-2 at the equator, with shorter revisit intervals at higher latitudes [14].
Video-monitoring systems are commonly used to cover the spatiotemporal gap between the more traditional survey techniques and rapidly evolving satellite observations. The use of video-monitoring systems for the study of coastal processes has developed since Holman and Guza [15] applied video techniques to measure wave run-ups and Lippmann and Holman [16] started using these systems to quantify the temporal and spatial variability of sand bar morphologies. Video-monitoring systems are relatively low-cost and acquire data automatically, continuously, and periodically, even in bad weather conditions. These techniques significantly reduce field efforts compared with traditional coastal monitoring systems and allow larger regions to be covered. They can also be used for a wide range of purposes, including the analysis of rip currents [17,18], nearshore hydrodynamics [19], the behaviour of anthropized beaches in storm conditions [20], mesoforms such as bars [21,22,23] and beach cusps [24,25,26], run-up measurements [27,28], the estimation of flood processes [29], and to obtain coastal bathymetry [30,31,32]. The spatial resolution of the video monitoring depends on the system and its position with respect to the monitored area. In low-resolution systems that work with compressed images, as occurs in most IP camera systems, shoreline detection becomes complex, as data compression clusters pixels together, which makes it difficult for algorithms to work properly, mainly in the furthest areas of the system.
The collection of data with high frequency and spatial resolution, as provided by video-monitoring systems, allows for the application of statistical techniques to analyse the conditions controlling beach evolution. Among them, Empirical Orthogonal Function (EOF) analysis is one of the most widely and extensively used methods for decomposing a space–time field into spatial patterns and associated time indices. Winant et al. [33] applied it to study the seasonal changes in cross-shore beach profiles. Since then, it has been used in the analysis of beach morphodynamics (review in Larson et al. [34]). The method is purely statistical and tries to represent the complex field of spatiotemporal variability through a number of basic spatial patterns coupled with time-dependent functions [35]. Although the resulting patterns lack any direct physical meaning, they are often linked with coastal processes and behaviour [36] or can be coupled with oceanographic or sediment transport models to analyse beach changes [37].
The aim of this work is to present and validate a methodology based on the primary video-monitoring products (timex images) using a low-cost IP camera system to calculate morphological parameters that can be analysed to extract the interannual behaviour of tidal beaches. For this purpose, automatic shoreline extraction and the generation of intertidal digital elevation models (DEMs) were implemented. Furthermore, a tool was developed to validate the DEMs with measured data (ground truth). The automatically obtained shorelines were explored with Empirical Orthogonal Function (EOF) techniques in order to identify the spatial and temporal information captured by the video-monitoring station and identify both the cross-shore and long-shore variability of the system. The proposed methodology was applied to La Victoria Beach (SW Spain) for the analysis of beach variations over a 5-year period.

2. Study Zone

The method was developed and applied to a 750 m coastal stretch at La Victoria urban beach, located in the city of Cádiz (SW Spain, Figure 1). The western part of the city, where La Victoria is located, is mainly composed of sandy beaches exposed to the Atlantic Ocean.
La Victoria Beach follows an NNW-SSE orientation and presents an intermediate–dissipative profile composed of medium-to-fine sand [38]. Foreshore slope values range between 0.025 and 0.02 with seasonal changes [39]. A wide rocky shore platform extends along the coast, varying in width and depth, affecting the regular bathymetry in the zone [40]. It discontinuously appears around the mean sea level in front of La Victoria, which is considered a reef-supported beach [40]. Several nourishment works were carried out on the beach over the last two decades because of the reduction in the river sediment supply [41,42] in order to prevent erosion and damage to tourism infrastructure.
Regarding the hydrodynamic conditions, storms affecting La Victoria Beach occur mainly between November and March, associated with westerly winds. Easterly winds, although more frequent and more intense, have little impact on wave generation in this area because of their limited fetch [43]. The mean wave height is less than 1 m with associated periods of 5–6 s, although wave height during storms can exceed 4 m [44] with associated periods longer than 8 s. The dominant longshore drift is directed towards the southeast. Tides in this area are semidiurnal and mesotidal. The mean tidal range oscillates between 3.07 m and 1.11 m in mean spring and neap tides, respectively, with a tidal range of 3.89 m during the highest astronomical tide [45].

3. Methodology

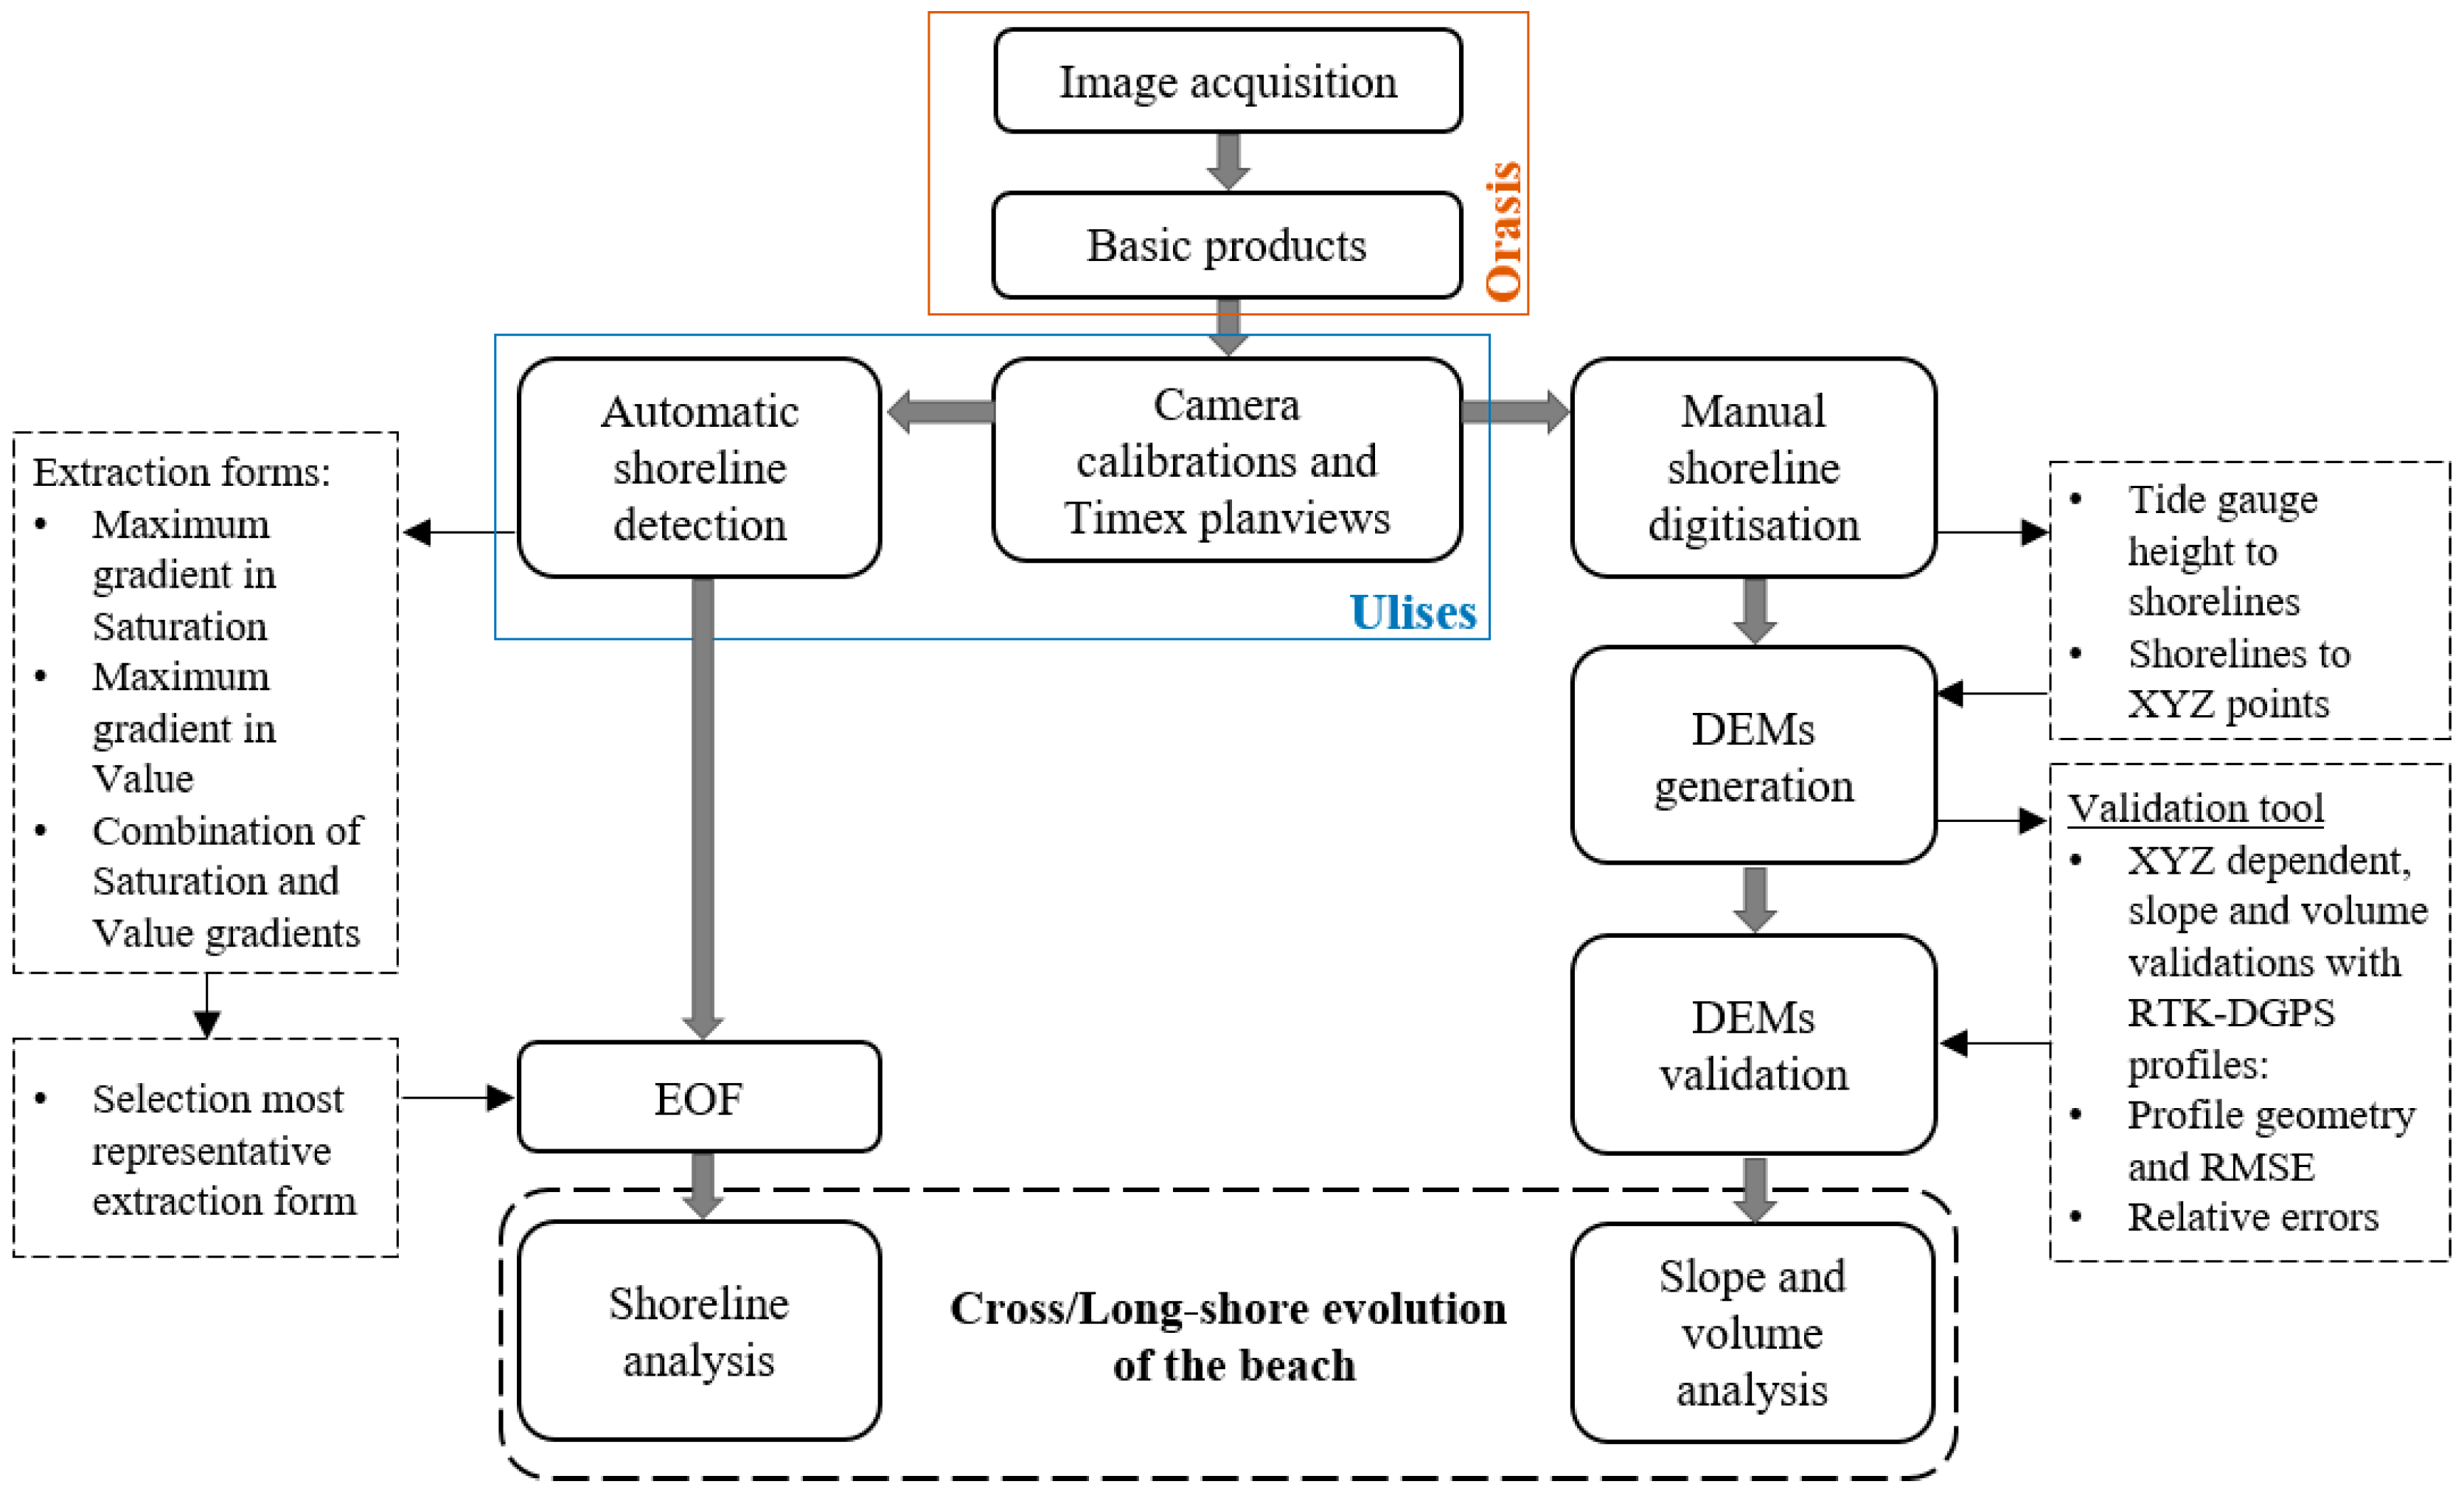
The proposed methodology jointly analyses the cross-shore and the long-shore behaviour of the beach. For this purpose, two approaches were combined, namely, shoreline-based 2D analysis, common in coastal studies, and DEM-based 3D analysis, often limited because of the impossibility of obtaining such data with a high temporal resolution. Such a combination of techniques facilitates the comprehension of processes that may be ignored when cross- and longshore behaviours are analysed independently. An overview of the workflow of the proposed analysis is presented in Figure 2.
A coastal video-monitoring system composed of 3 IP cameras of 2 MegaPixel (1600 × 1200 pixels) resolution was used in order to record beach images (Figure 1). The system was installed on top of a residential building (~49 m above the mean sea level) and covers approximately 750 m of shoreline. The system records the first 10 min of each daylight hour with a frequency of 4 Hz [26], i.e., 2400 frames per burst. After recording, three basic products are automatically obtained from each camera by using the ORASIS software [31]: snap images (snapshot image), timex images (time average image of the 2400 frames), and Sigma images (greyscale variance image of the 2400 frames). The interval of images analysed in the present work extends from September 2013 to March 2018, except for small periods in which the system was not operational for technical reasons. Camera calibration, image rectification, and planview generation were undertaken using the ULISES open-source software developed by Simarro et al. [46]. Planviews, both for timex and Sigma images, were generated with a resolution of 0.5 m/pixel. For further details on this video-monitoring system, the generation of basic products, the system calibrations, and the production of planviews, the reader is also referred to Montes et al. [26].

3.1. Automatic Shoreline Detection

Shoreline analyses during the studied period were performed by extracting the shoreline automatically from the planviews (Figure 3). System limitations, mainly derived from the resolution and compression types of the images, constrained automatic shoreline extraction, so different methods were tested to resolve this, and only timex images were used in a similar approach to the one developed by Ribas et al. [47]. The use of Sigma planviews, employed in similar studies [28,31], was discarded because of the poor results obtained in this case. The timex planviews were transformed from Red–Green–Blue (RGB) to Hue–Saturation–Value (HSV) in order to improve the results obtained when extracting the shoreline [48,49]. Three different extraction forms were used: maximum gradient in Saturation, maximum gradient in Value, and a combination of Saturation and Value gradients. The quality of the results for each of the abovementioned procedures was highly dependent on the existing conditions in each planview (sun height, luminosity, presence of shadows, etc.). Therefore, the shorelines for all planviews were generated following Ribas et al. [47] and then manually checked to ignore corrupt shorelines; those showing the best results in each case were selected. To improve the automatic extraction process, a mask was created on the zone of interest in the planview (Figure 3), and the extraction of the shoreline was only conducted during high tide (including the previous and next hour) during daylight conditions (~3 per day). This specific automatic extraction prevents the presence of buildings, roads, people, and intertidal water-filled features that can produce, in some cases, noise that could decrease the quality of the detection [48]. In order to assess shoreline evolution, the land part of the mask was used as a baseline. Moreover, all the obtained shorelines were corrected to their real Z since the planviews were generated with a constant Z.
The large number of automatically extracted shorelines obtained with this procedure, approximately 1800, allows us to perform statistical analyses to study the interannual behaviour of the beach. In this work, the spatial and temporal variability in the shoreline position is studied through an analysis of Empirical Orthogonal Functions (EOFs), also known as Principal Component Analysis [50]. Such an analysis can provide useful information on the amount of data obtained with the video-monitoring technique [51]. The EOF analysis can find a set of variables that explain data variability [52]. EOFs are the eigenfunctions of the covariance data, and they represent the dominant spatial patterns, or modes, of the variance, while their associated amplitudes represent the temporal variation, ordered by their absolute values. This method was applied in previous studies at La Victoria Beach to analyse the variations in the beach profile [39,53,54].

3.2. DEM Generation

Intertidal topography was obtained from the coastal video-monitoring system. For this purpose, shorelines of a complete tidal cycle were manually extracted once a month. The digitization of shorelines was not conducted automatically as in Section 3.1 in order to avoid problems in low-tide conditions and to ensure the quality of the extraction. This simple approach has been used by other authors for similar purposes [48,49,55]. The steps followed were (Figure 2) (i) manual digitisation of the shoreline; (ii) assignation to each shoreline of its real height value through the tide level; (iii) decomposition of shorelines into points with X, Y, Z coordinates; and (iv) generation of DEMs from XYZ points. Once generated, the DEMs were validated using the ground truth, and slope and volume values were obtained in different profiles distributed homogeneously over the DEMs (Figure 4).
The manually digitised shorelines were projected to their real coordinates via ULISES routines. Subsequently, each shoreline was assigned its corresponding height by using the sea level data from the Cádiz tide gauge [56] located in the city harbour (Figure 1). The ∼6 shorelines of each tidal cycle were decomposed into points every 0.5 m, obtaining around 9000 points with X, Y, Z coordinates for each DEM. Once these points were obtained, they were used to generate the DEMs. Monthly DEMs were built when planviews were available for spring tidal conditions. Low-wave-energy conditions were selected to avoid possible errors in the assignment of a height to each shoreline, e.g., produced by wave run-up. It must be noted that the sea level data obtained from the tide gauge include the influence of atmospheric pressure.
Once DEMs were extracted for the entire study period, an extensive DEM validation was performed using ground-truth data collected by RTK-DGPS. The topographic surveys for the validation were conducted on dates equal to or close to (<4 days) the date chosen to build the DEM in order to ensure a similar beach state (Table 1). The validation was performed using two profiles located in the southern part of the study area (orange profiles in Figure 4), where RTK-DGPS-surveyed profiles and DEM-extracted profiles were compared. In this procedure, three types of variables were computed to carry out the validation: XYZ-dependent variables, slope, and volume.
The XYZ-dependent variables analyse the profile geometry, based on Z, with a comparison between the shape of the real (RTK-DGPS) profiles and those extracted from the DEMs. Different parameters commonly employed for the estimation of errors in morphodynamic models were used [57,58,59,60,61]: correlation coefficient (R2), scatter index (SCI), relative bias (RelBias), and the Brier Skill Score (BSS), as well as the Root-Mean-Square Error (RMSE). R2 and SCI provide information about data dispersion. RelBias is a normalised relative measure of the bias. Lastly, BSS relates the variance in the difference between the real and modelled data to the variance in the real data; a BSS of 1 means that both profiles are equal, while 0 means a very bad coupling between the real and computed profiles. A detailed explanation of the parameters can be found in Roelvink et al. [62]. Finally, the RMSE (Equation (1)) estimates the vertical error (in metres), and it has been widely used in the validation of DEMs, such as those generated by UAVs [63,64]. The RMSE was calculated between the points from real surveys and points from DEMs:
R M S E = i = 1 n ( R T K z i D E M z i ) 2 n
where RTKz is the elevation of a real point measured with the RTK-DGPS, DEMz is the elevation of the DEM at the same coordinates, and n is the total number of RTKz points.
Slope and volume variables were calculated between the minimum and maximum DEM heights in each profile, which is the equivalent of intertidal beach slope and volume. After that, the relative errors were obtained for each one using Equations (2) and (3).
ε s = S l o p e D E M S l o p e R T K S l o p e R T K
ε v = V o l u m e D E M V o l u m e R T K V o l u m e R T K
where  ε s  is the slope relative error, and  ε v  is the volume relative error. Again, RTK refers to ground truth values and DEM refers to values extracted from the DEMs in both equations.
Once DEMs were extracted and validated, slopes and volumes were calculated between September 2013 and March 2018 in 14 cross-shore profiles distributed along the beach and spaced every 50 m (Figure 4). Slopes and volumes were extracted between the minimum and maximum tide levels reached on the day of DEM generation. For each parameter, the evolution in each profile during the study period was obtained, as well as the longshore variation along the beach for each survey.

4. Results

4.1. Automatic Shoreline Extraction and Shoreline Analysis

Approximately 1800 high-tide shorelines were automatically extracted over the study period, with a 46% success rate for all available planviews in high-tide conditions. Although a minimum tidal threshold was established (above 3 m) to reduce the tide influence on the results, certain oscillations directly related to the tidal range above the threshold were observed, which is accentuated under spring tides or by the effect of storm surges. The gaps correspond to periods when the system was not running properly or the shorelines could not be extracted from the planviews.
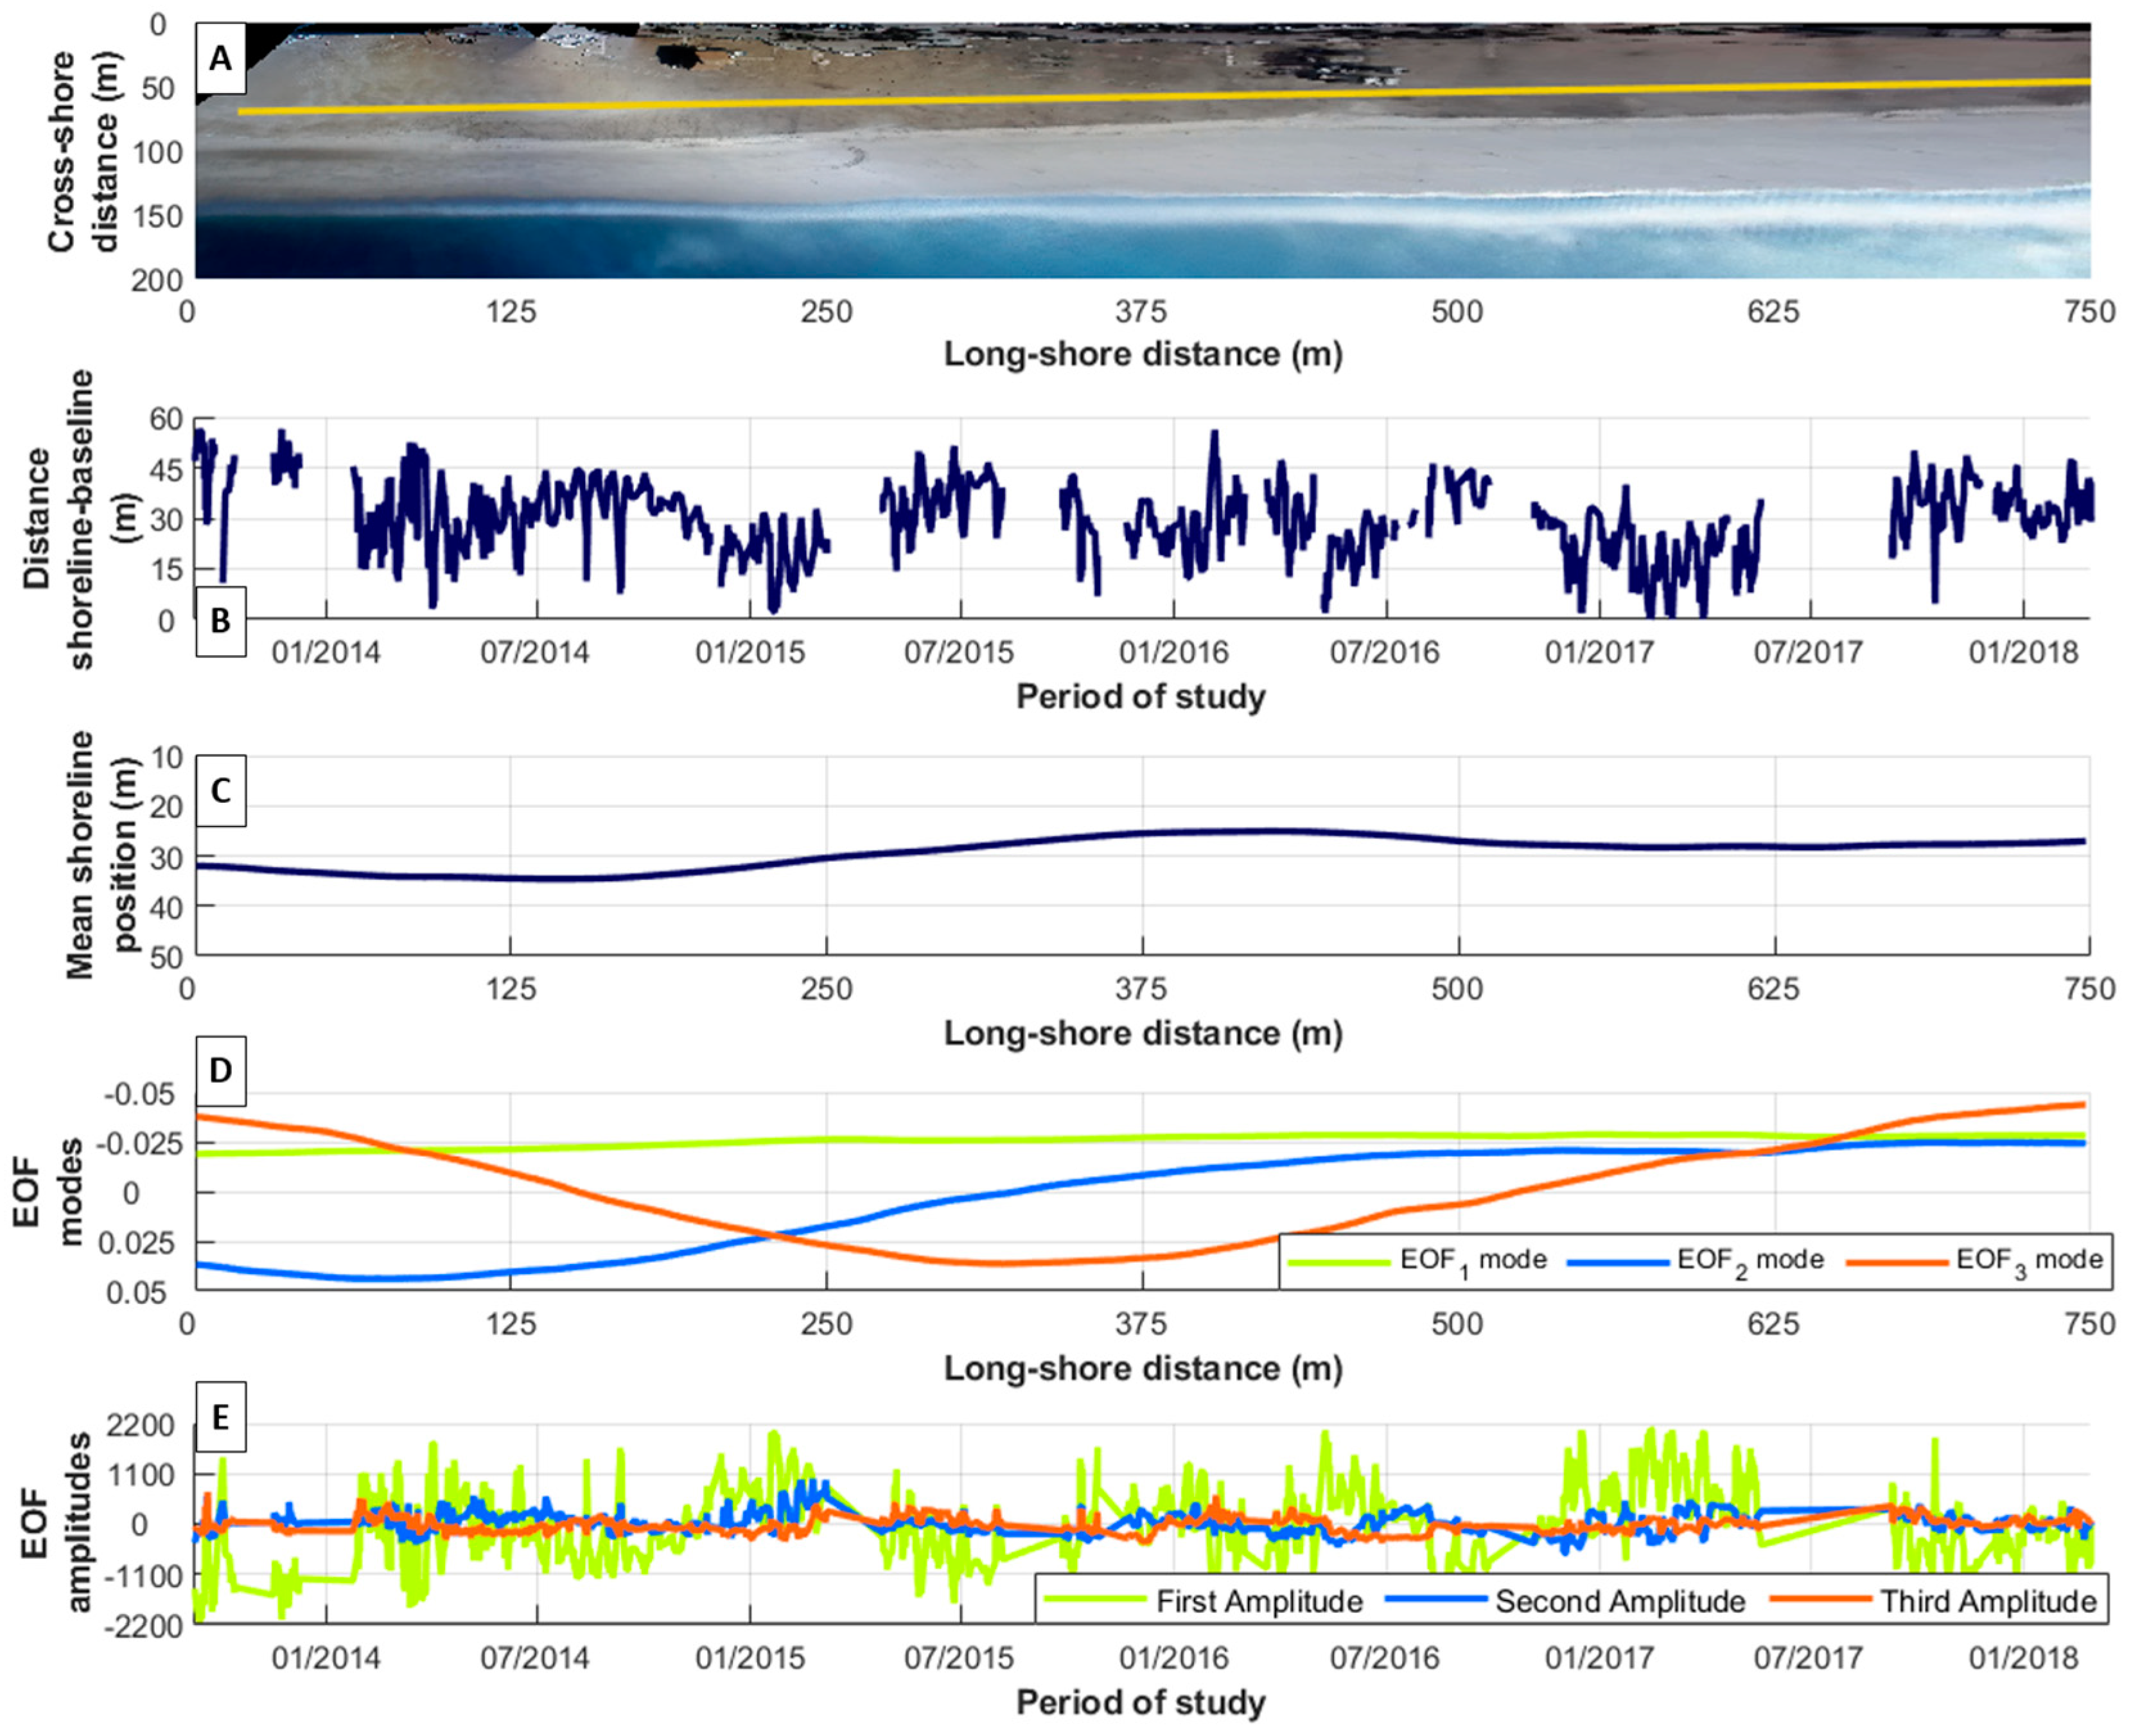
Regarding shoreline evolution based on the automatic shoreline extraction method applied, it was observed that the dry beach changes (defined from the shoreline to the baseline; see Figure 5A) showed seasonal behaviour, with clear differences between the winter and summer periods (Figure 5B). The mean beach width ranged between 5 and 55 m during this period. Minimum values were observed in winter between October and March, and values below 10 m were observed in January 2015, December 2016, and February/March 2017. Maximum values were mostly recorded in summer. In September 2013 and March 2014, values higher than 50 m were also identified. March 2014 and 2016 were two exceptions to this seasonal behaviour, showing an early increase in the dry beach area, although in both cases, it reduced afterwards, following the same trend observed in other years.
Regarding the alongshore variations, Figure 5C shows the time-averaged beach width with respect to the baseline during the study period. An alongshore differential behaviour was observed and, based on this, the beach can be divided into three sectors: (1) the northern sector, which extends along the first 250 m from the planview origin (N) and presents an average beach width higher than 30 m, with a maximum value of 35 m; (2) the central sector, between 250 and 500 m from the planview origin, which shows a reduction in beach width reaching the minimum value, 25 m, with beach widths always below 30 m; and (3) the southern zone, between 500 and 750 m from the planview origin, which was always below a 30 m beach width like the central zone, although there is a slight increase of 2–3 m, and it shows more homogeneous behaviour.
The results of the EOF analysis are also presented in Figure 5, including the spatial patterns (Figure 5D) and their corresponding amplitudes (Figure 5E), calculated on the average shoreline position. The first three EOFs describe 98% of the total variability of the beach during the study period. EOF1, explaining 89.5% of the variance, represents the accretion/erosion of the beach, depending on the negative/positive amplitude values, and in this case, its spatial mode has a constant negative sign. The values are slightly higher in the northern sector, decreasing in the central zone until they become constant in the southern sector. EOF2, which explains 5.5% of the total variance, represents beach rotation, associated with sediment transport from the zone with positive spatial mode values to the zone with negative spatial mode values, implying sediment transport from the north to the south under specific conditions. Finally, EOF3 explains 3% of the total variance and corresponds to a localised erosion/accretion process under certain conditions (recalling that EOF modes are mathematically forced to be orthogonal). Almost the entire northern and southern zones show negative values (accretion). Conversely, a small part of the northern sector together with the central sector present positive values (erosion).

4.2. DEM Generation and Validation

A total of 48 DEMs were generated for the intertidal zone at La Victoria Beach for the entire study period. All of them were located between the elevations +0.13 and +3.99 m above the tidal datum (hydrographic zero, i.e., the lowest astronomical tide).
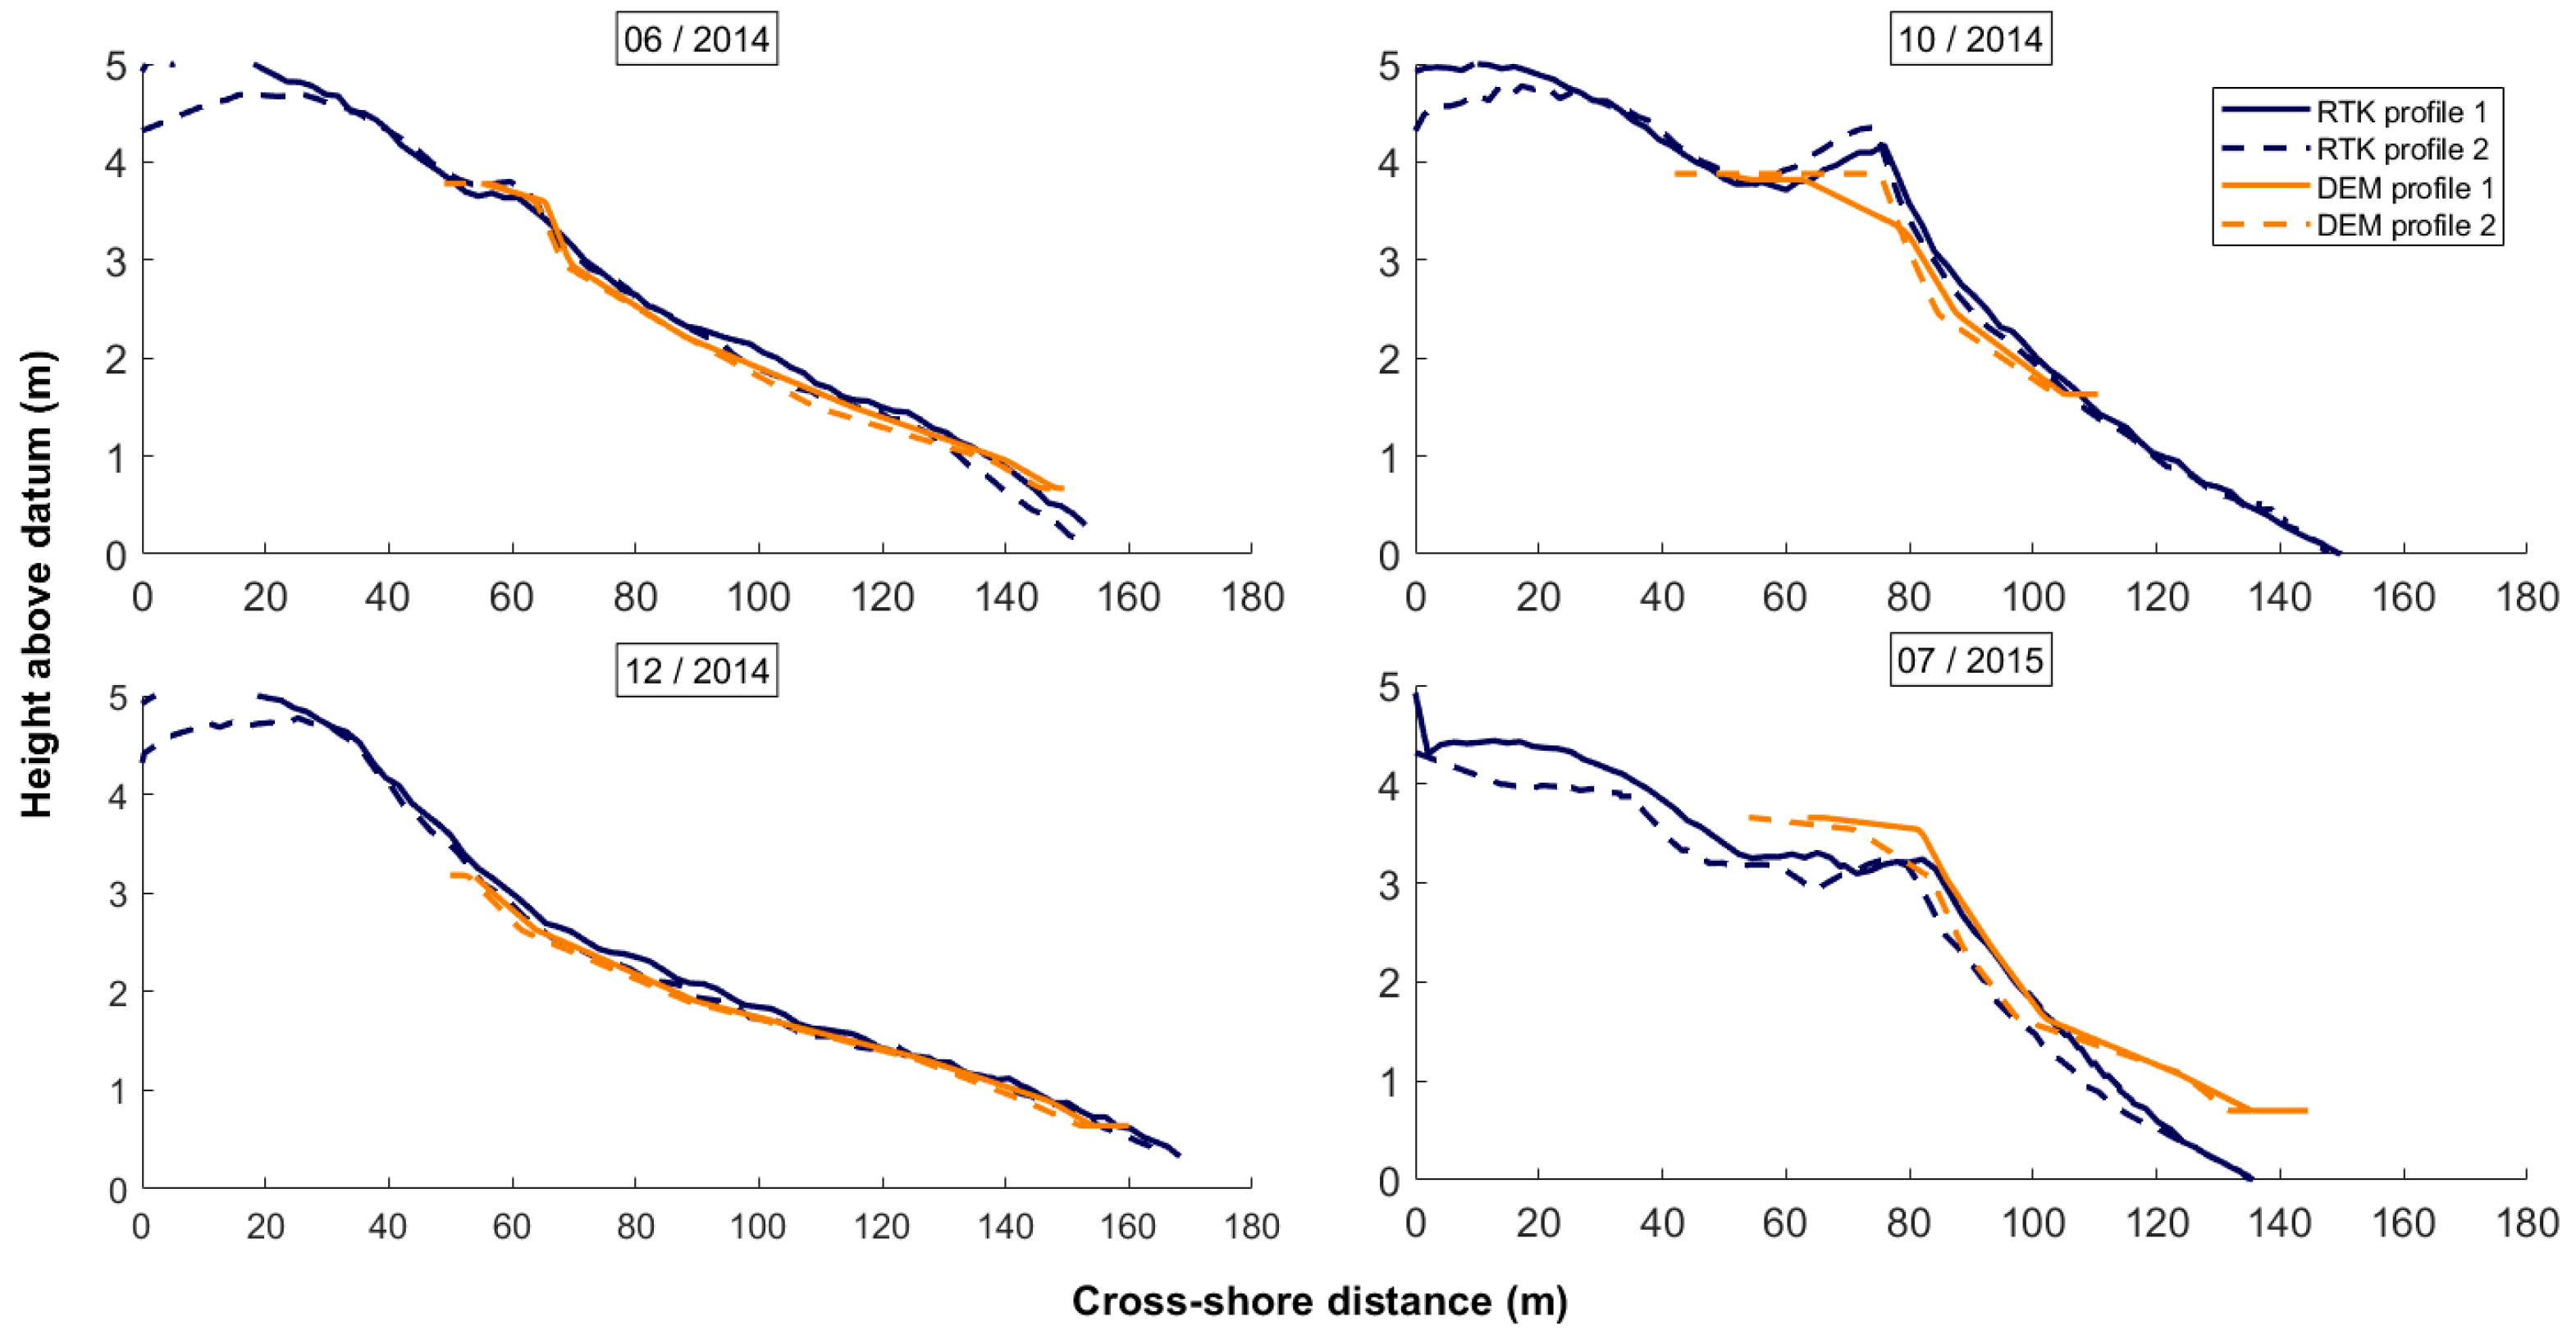
The validation results are shown in Table 2 and Table 3 and in Figure 6. Regarding the geometry of the beach profiles, all the analysed indexes of the morphodynamic models show satisfactory values (Table 2). The R2 values for both profiles were higher than 97% and in all cases over 95%, and the mean SCI values were lower than 0.13 in both profiles. The relative BIAS parameters were close to zero in most of the validations; only in July 2015 were the values of this parameter higher than 0.10 for both validation profiles (0.13 and 0.16). The BSS parameter indicated a strong similarity between the RTK-DGPS profiles and those generated by DEMs, as in all cases, the value of this parameter was over 0.90, 0.96 being the average for all the validations in both profiles. Finally, the mean RMSE in both profiles was around 25 cm. Only in one case (July 2015) were the values obtained high, greater than 45 cm, while in most cases, the vertical error was lower than 30 cm.
Regarding the validation of beach slope and volume, low mean relative errors were obtained (Table 3). The mean relative error in slope was 9.9% for profile 1 and 12.7% for profile 2. The mean error for the volume was below 10% in both profiles. Considerably higher error values were only found in the slope calculations for both profiles on the validation of 9 October 2014 (51.5% and 45.3%, respectively), while significantly higher errors (more than 20%) for the volume were only found on the validation of the 4 July 2015 (19.7% and 24.5% for profile 1 and profile 2, respectively).

4.3. Slope and Volume Evolution

The DEM-derived slope evolution (Figure 7) shows a seasonal pattern across the entire beach. During winter months, the slope decreases and then increases later during the summer months (upper panel, Figure 7). The variations recorded are small, ranging between 0.02 and 0.07 over the study period. In addition, higher slopes in the northern zone of the beach are observed in all surveys in a detailed profile analysis. In turn, the seasonal oscillations described above are more pronounced in this area, with increased disparities between the northern and southern slopes during the summer period. During winter months, these differences are smaller. In fact, if the values of this parameter are analysed for the beach in each survey (lower panel Figure 7), a higher dispersion of data is observed in the northern zone, while the data scattering is reduced in the southern sector (between 0.025 and 0.055). Furthermore, the study of the average slope behaviour also revealed higher values in the northern part that decrease towards the central zone (profiles 7–8), and the slope remains constant until the southern sector.
The beach volume (Figure 8), normalised according to the analysed profile extension, is relatively homogeneous, as low dispersion is observed between the values of the different profiles for each DEM (upper panel Figure 8). The volume ranges between 1 and 2.5 m3/m in all profiles. A clear seasonal trend is not detected. Volume variability (lower panel, Figure 8) is slightly lower in the northern area, while the average values per profile show homogeneous behaviour along the beach.

5. Discussion

5.1. Methodological Considerations

The methodological approach developed in this work combines automatic shoreline extraction and DEM generation, validation and extraction of slope and volume data from them. The results demonstrate the validity of this approach, although a number of technical considerations must be noted.
One of the main techniques applied to video-monitoring systems for the automatic extraction of shorelines [65] is the use of Sigma images. This technique was discarded in this work because of the low return rate, despite its widespread use for this purpose [28,31]. Thus, an approximation of the Pixel Intensity Clustering (PIC) model described by Aarninkhof and Roelvink [66] and Aarninkhof [67] was employed in order to improve the success rate of the automatic extraction of the shoreline. The PIC model identifies colour differences between wet and dry sand areas through the transformation of RGB images into HSV images. This model works better on dissipative beaches than, for instance, the Shore Line Intensity Maximum (SLIM) model [68], which is designed for relatively steep beaches and fails in dissipative ones [69]. By applying the PIC model to La Victoria, the shoreline extraction success rate reached 46%. In the future, this rate could be further increased by using Artificial Neural Network systems (ANN) [31,51,69]. ANN systems are trained with manual extractions of shorelines, improving the results for dissipative beaches with complex geometries (i.e., sand bars, inlets, beach cusps, etc.) such as La Victoria Beach [26].
Another major application of video-monitoring systems is topo-bathymetric data extraction, which has been widely studied and applied by different authors [30,31,48,55,70,71,72,73,74]. In this work, intertidal DEMs derived from the video-monitoring system were subjected to extensive validation in order to check their quality by using nine RTK-DGPS topographic surveys. Indexes concerning profile geometry also reveal good results in most of the cases, showing a great similarity between the profiles obtained with RTK-DGPS and the profiles obtained using the DEMs (Table 2 and Figure 6). In morphology, the BSS is considered acceptable when the value is between 0.6–0.8 and excellent when it is higher than 0.8 [59]. In this study, almost every extracted BSS is above 0.95, which indicates an excellent similarity between the measured profiles and those extracted from the DEMs. This is supported by the results of the R2, SCI, and relative bias, which, in both profiles, have values with low scattering between the real and DEM data and a low vertical offset. It is important to note that these parameters are typically used in morphodynamic models to understand the relationship between the measured profiles and the resulting model profiles. Morphodynamic models are complex and require a large amount of input data and a lot of computational time [75], so usually there are processes that are not taken into account and limit the model’s ability to estimate reality [76]. In this work, two real profiles were compared, although the one obtained from DEMs was indirectly computed. Under this premise, the threshold to accept the validation results as valid must be more demanding than those considered acceptable for morphodynamic models. Even so, in the validations carried out with these parameters, very satisfactory results were obtained.
For RMSE values, the average in both profiles was around 25 cm. These values are similar to those obtained with other methodologies, often more expensive and with lower temporal resolution. For instance, when using Unmanned Aerial Vehicles (UAVs) to build DEMs, the errors obtained are between 5 and 15 cm [63,64,77]. For LiDAR, the nominal accuracy is 15 cm, although it is only achieved on very flat areas and low flights [78]. In the present study, in some cases, the error is close to the one obtained with DGPS for this purpose, between 5 and 7 cm [79], with the advantage of faster and automated data collection, allowing for higher temporal resolution.
The results obtained also show low relative errors in slope and volume values, as most of the validations for both variables are significantly below a 10% error. These results can be considered a good fit for real data since slope errors are generally greater than volume errors given that integrated properties (volume) are less susceptible to error than derived properties (slope). The high errors obtained in some validations, mainly in the estimation of slope and volume, are associated with errors in the detection of the shoreline position. The presence of steep bars and troughs around the high tide level sometimes prevents the correct tide height estimation of the shoreline (Figure 9) because of uneven flooding in the trough.
It must be noted that the effect of wave run-ups on the water level has not been considered for the DEM extraction. The inclusion of this effect could improve the DEM quality, but it would also increase the complexity of the used tool. Furthermore, empirical estimations of wave run-ups could generate some inaccuracies [27], although this approach is widely accepted in coastal engineering. The differential behaviour of the beach slope over the study zone, along with the bathymetric complexity caused by the discontinuity in the rocky platform, hampers the definition of a unique slope value for the whole beach. Finally, low values of relative bias (Figure 6) indicate that the quality of the results is adequate even without considering a wave run-up. This index provides information about vertical variation between the model and measured profiles [62]. In this case, values near zero indicate that shoreline heights are not underestimated for not including the waves.

5.2. Beach Behaviour Analysis Based on Video-Monitoring Tools

The development of a combined methodology for a comprehensive beach analysis and its application to La Victoria Beach has allowed us to obtain results that reveal contrasting behaviour patterns in an apparently homogeneous area. The combined methodology used has made it possible to identify small changes and differential behaviours on both a spatial and temporal scale. As shown in the previous section, the good agreement between the results obtained by the monitoring system and the data obtained by the RTK-DGPS facilitates the long-term analysis of these small variations. This allows us to demonstrate the differential and seasonal behaviour of the beach in the medium term.
In this regard, La Victoria Beach was characterised by marked seasonal behaviour during the study period, previously described in this beach and surrounding ones [38,44,80]. The seasonality was considered to be highly related to the hydrodynamic conditions in the northern area of Cádiz Gulf, in which mean wave height and the peak period are higher during the end of autumn and winter months. This results in two periods with different behaviours: the storm season, between November and March, in which wave energy is higher with more southerly wave directions, and the calm season, between April and October [81]. During the storm period, the beach slope decreases to dissipate the incident energy, in contrast to the calm period, in which the beach recovers and the slope increases [82]. This response was observed in both the shoreline position and the EOF analysis (Figure 5), as was the slope evolution of the entire beach (Figure 7).
From the evolution of the slope in the different transects and the EOF analysis, an alongshore differential behaviour was found in La Victoria Beach. Based on this, the apparently homogeneous beach can be divided into three sectors, defined by using the second and third spatial modes of the EOF analysis (Figure 5D): the northern or protected sector, conditioned by the rocky shore platform supporting the beach profile; the southern or exposed sector, a completely sandy zone; and the central sector or transition zone. The exact position and extension of the transition zone are influenced by the angle of incidence of storms, which can vary between the west and southwest. This results in a longer or shorter extension of the area protected by the rocky platform. The varying angle of storm incidence also has an impact on the presence of cusps and bars in this zone [26].
As demonstrated by several authors, the geological setting has an important role in the shaping of beach profiles [83,84]. In fact, it has special relevance in alongshore differences observed in La Victoria because of the presence of the rocky platform in the northern zone. The recorded differences in slope and shoreline position between the northern and southern sectors are in accordance with those found by Muñoz-Pérez and Medina [40]. The northern zone is a type 1 perched beach according to the classification by Gallop et al. [85], in which the structure or rocky platform is connected to the beach face. Beach response to the presence of structures such as rocky platforms is still poorly understood [86], and it varies based on the specific characteristics of the area (see Gallop et al. [85] for more information and a detailed review). The rocky platform in La Victoria Beach dissipates wave energy, making the slope and the average width of this zone higher than in the exposed one. The protection not only reduces erosion but also the accretion rate [87]. As a consequence of this, the slope shows more variability in the southern zone. This is due to the “locking” effect of the rocky platform on the beach profile, which blocks the cross-shore sediment transport between the lower and upper zone of the rocky platform [88]. Muñoz-Pérez and Medina [40] found that the recovery rate of the exposed zone was three times faster than the protected one. The difference between the erosion/accretion rates in both zones could be responsible for the beach planform rotation observed in the EOF analysis.
Even though the average shoreline position did not suffer remarkable changes over the studied period, there is a slightly decreasing trend in the beach slope. In addition to this, the peak values of the slope during summer, which can be related to beach recovery processes, decreased year after year during the study period. This trend could be amplified in the context of climate change. The methodology used allows for a detailed analysis of the most vulnerable areas in the face of long-term erosion, which will allow us to design interventions to prevent or mitigate erosion in such a way that their effects are maximised and expenses are minimised, as proposed by other authors [89]. Although it is commonly accepted that perched beaches are more protected than exposed beaches, there are some cases in which the effect is the opposite, producing an increase in erosion due to changes in waves and currents generated by the rocky platform [85]. Future studies should analyse the effect of the increasingly deep rocky platform caused by sea level rises and its incidence in the evolution of La Victoria Beach.

6. Conclusions

In this work, specific tools were developed for the exploitation of a 5-year dataset from a beach video-monitoring system. Automatic shoreline extraction and DEM generation, validation and extraction of intertidal slope and volume allowed us to analyse the behaviour of La Victoria Beach. The results show that the combination of shoreline position analysis (2D) and data from DEMs (3D) facilitated the understanding and provided a complete overview of the beach’s behaviour. Furthermore, the methods used allowed us to interrelate the different processes occurring on the beach, which is difficult to achieve with other types of techniques.
The validation methodology developed for the generated DEMs is by itself a remarkable output of this work. The combination of the different procedures used allowed us to validate this tool by employing real data. It can provide geometric similarity; data scattering; and vertical errors and associated offset, slope, and volume errors. Moreover, it has wide potential applications, from LiDAR topographic data, UAVs, LaserScan data, satellite-derived bathymetry, etc., to the results of 3D morphodynamic models.
This methodology allowed us to analyse the evolution of a large urban beach, showing its spatial and temporal behaviour. The results reveal a seasonal pattern, with a marked zonation due to the presence of a rocky shore platform. Beach behaviour is defined by three processes that can explain almost all the obtained variability: erosion/accretion, alongshore transport, and beach rotation.
The proposed methodology is cost-effective, obtains data in an automatic mode with high spatiotemporal resolution, and can be easily extrapolated to other areas. This enables the analysis of vulnerable areas and facilitates the management of investments in coastal protection against climate change.

Author Contributions

J.M., conceptualization, formal analysis, investigation, methodology, software, visualization, writing—original draft, and writing—review and editing; L.d.R., conceptualization, funding acquisition, project administration, supervision, and writing—review and editing; T.A.P., formal analysis, funding acquisition, methodology, software, and writing—review and editing; J.B., conceptualization, supervision, and writing—review and editing; M.P., data curation and writing—review and editing; G.S., formal analysis, methodology, software, and writing—review and editing. All authors have read and agreed to the published version of the manuscript.

Funding

This work is a contribution to the ADACOSTA project (CGL2014-53153-R), funded by the Spanish MINECO; the CRUNCH project (FEDER-UCA18-107062), funded by European Union under the 2014-2020 ERDF Operational Programme and by the Department of Economic Transformation, Industry, Knowledge, and Universities of the Regional Government of Andalusia; and the CRISIS project (PID2019-109143RB-I00), funded by the Spanish Ministry of Science and Innovation and the European Union. J.M. was supported by contract BES-2015-073218 and a postdoctoral contract from Margarita Salas at the University of Cadiz from the Ministry of Universities of Spain, funded by the European Union—NextGenerationEU.

Data Availability Statement

Not applicable.

Acknowledgments

This work is a contribution to the research group RNM-328 of the Andalusian Research Plan (PAI).

Conflicts of Interest

The authors declare no conflict of interest.

References

  1. Todd, P.A.; Heery, E.C.; Loke, L.H.L.; Thurstan, R.H.; Kotze, D.J.; Swan, C. Towards an urban marine ecology: Characterizing the drivers, patterns and processes of marine ecosystems in coastal cities. Oikos 2019, 128, 1215–1242. [Google Scholar] [CrossRef]
  2. Cooley, S.; Schoeman, D.; Bopp, L.; Boyd, P.; Donner, S.; Ghebrehiwet, D.Y.; Ito, S.-I.; Kiessling, W.; Martinetto, P.; Ojea, E.; et al. Oceans and Coastal Ecosystems and Their Services. In Climate Change 2022: Impacts, Adaptation and Vulnerability. Contribution of Working Group II to the Sixth Assessment Report of the Intergovernmental Panel on Climate Change; Pörtner, H.-O., Roberts, D.C., Tignor, M., Poloczanska, E.S., Mintenbeck, K., Alegría, A., Craig, M., Langsdorf, S., Löschke, S., Möller, V., et al., Eds.; Cambridge University Press: Cambridge, UK; New York, NY, USA, 2022; pp. 379–550. ISBN 9781009325844. [Google Scholar]
  3. Vousdoukas, M.I.; Ranasinghe, R.; Mentaschi, L.; Plomaritis, T.A.; Athanasiou, P.; Luijendijk, A.; Feyen, L. Sandy coastlines under threat of erosion. Nat. Clim. Chang. 2020, 10, 260–263. [Google Scholar] [CrossRef]
  4. Cooper, J.A.G.; Masselink, G.; Coco, G.; Short, A.D.; Castelle, B.; Rogers, K.; Anthony, E.; Green, A.N.; Kelley, J.T.; Pilkey, O.H.; et al. Sandy beaches can survive sea-level rise. Nat. Clim. Chang. 2020, 10, 993–995. [Google Scholar] [CrossRef]
  5. Masselink, G.; Hegge, B. Morphodynamics of meso- and macrotidal beaches: Examples from central Queensland, Australia. Mar. Geol. 1995, 129, 1–23. [Google Scholar] [CrossRef]
  6. Russell, P.E. Mechanisms for beach erosion during storms. Cont. Shelf Res. 1993, 13, 1243–1265. [Google Scholar] [CrossRef]
  7. Karunarathna, H.; Pender, D.; Ranasinghe, R.; Short, A.D.; Reeve, D.E. The effects of storm clustering on beach profile variability. Mar. Geol. 2014, 348, 103–112. [Google Scholar] [CrossRef]
  8. Vos, K.; Harley, M.D.; Turner, I.L.; Splinter, K.D. Pacific shoreline erosion and accretion patterns controlled by El Niño/Southern Oscillation. Nat. Geosci. 2023, 16, 140–146. [Google Scholar] [CrossRef]
  9. Morton, R.A.; Leach, M.P.; Paine, J.G.; Cardoza, M.A. Monitoring beach changes using GPS surveying techniques. J. Coast. Res. 1993, 9, 702–720. [Google Scholar]
  10. Delgado, I.; Lloyd, G. A Simple Low Cost Method for One Person Beach Profiling. J. Coast. Res. 2004, 204, 1246–1252. [Google Scholar] [CrossRef]
  11. Guisado-Pintado, E.; Jackson, D.W.T.; Rogers, D. 3D mapping efficacy of a drone and terrestrial laser scanner over a temperate beach-dune zone. Geomorphology 2019, 328, 157–172. [Google Scholar] [CrossRef]
  12. Laignel, B.; Vignudelli, S.; Almar, R.; Becker, M.; Bentamy, A.; Benveniste, J.; Birol, F.; Frappart, F.; Idier, D.; Salameh, E.; et al. Observation of the Coastal Areas, Estuaries and Deltas from Space. Surv. Geophys. 2023. [Google Scholar] [CrossRef]
  13. Castelle, B.; Masselink, G.; Scott, T.; Stokes, C.; Konstantinou, A.; Marieu, V.; Bujan, S. Satellite-derived shoreline detection at a high-energy meso-macrotidal beach. Geomorphology 2021, 383, 107707. [Google Scholar] [CrossRef]
  14. Bergsma, E.W.J.; Almar, R. Coastal coverage of ESA’ Sentinel 2 mission. Adv. Space Res. 2020, 65, 2636–2644. [Google Scholar] [CrossRef]
  15. Holman, R.A.; Guza, R.T. Measuring run-up on a natural beach. Coast. Eng. 1984, 8, 129–140. [Google Scholar] [CrossRef]
  16. Lippmann, T.C.; Holman, R.A. The spatial and temporal variability of sand bar morphology. J. Geophys. Res. 1990, 95, 11575. [Google Scholar] [CrossRef]
  17. Austin, M.; Scott, T.; Brown, J.; Brown, J.; MacMahan, J.; Masselink, G.; Russell, P. Temporal observations of rip current circulation on a macro-tidal beach. Cont. Shelf Res. 2010, 30, 1149–1165. [Google Scholar] [CrossRef]
  18. Bracs, M.A.; Turner, I.L.; Splinter, K.D.; Short, A.D.; Lane, C.; Davidson, M.A.; Goodwin, I.D.; Pritchard, T.; Cameron, D. Evaluation of Opportunistic Shoreline Monitoring Capability Utilizing Existing “Surfcam” Infrastructure. J. Coast. Res. 2016, 319, 542–554. [Google Scholar] [CrossRef]
  19. Chickadel, C.C.; Holman, R.A.; Freilich, M.H. An optical technique for the measurement of longshore currents. J. Geophys. Res. Ocean. 2003, 108, 3364. [Google Scholar] [CrossRef]
  20. Sancho-García, A.; Guillén, J.; Ojeda, E. Storm-induced readjustment of an embayed beach after modification by protection works. Geo-Mar. Lett. 2013, 33, 159–172. [Google Scholar] [CrossRef]
  21. Armaroli, C.; Ciavola, P. Geomorphology Dynamics of a nearshore bar system in the northern Adriatic: A video-based morphological classi fi cation. Geomorphology 2011, 126, 201–216. [Google Scholar] [CrossRef]
  22. Pellón, E.; Garnier, R.; Medina, R. Intertidal finger bars at El Puntal, Bay of Santander, Spain: Observation and forcing analysis. Earth Surf. Dyn. 2014, 2, 349–361. [Google Scholar] [CrossRef]
  23. Splinter, K.D.; Gonzalez, M.V.G.; Oltman-shay, J.; Rutten, J.; Holman, R. Observations and modelling of shoreline and multiple sandbar behaviour on a high-energy meso-tidal beach. Cont. Shelf Res. 2018, 159, 33–45. [Google Scholar] [CrossRef]
  24. Almar, R.; Coco, G.; Bryan, K.R.; Huntley, D.A.; Short, A.D.; Senechal, N. Video observations of beach cusp morphodynamics. Mar. Geol. 2008, 254, 216–223. [Google Scholar] [CrossRef]
  25. Vousdoukas, M.I. Erosion/accretion patterns and multiple beach cusp systems on a meso-tidal, steeply-sloping beach. Geomorphology 2012, 141–142, 34–46. [Google Scholar] [CrossRef]
  26. Montes, J.; Simarro, G.; Benavente, J.; Plomaritis, T.A.; Del Río, L. Morphodynamics Assessment by Means of Mesoforms and Video-Monitoring in a Dissipative Beach. Geosciences 2018, 8, 448. [Google Scholar] [CrossRef]
  27. Vousdoukas, M.I.; Wziatek, D.; Almeida, L.P. Coastal vulnerability assessment based on video wave run-up observations at a mesotidal, steep-sloped beach. Ocean Dyn. 2012, 62, 123–137. [Google Scholar] [CrossRef]
  28. Simarro, G.; Bryan, K.R.; Guedes, R.M.C.; Sancho, A.; Guillen, J.; Coco, G. On the use of variance images for runup and shoreline detection. Coast. Eng. 2015, 99, 136–147. [Google Scholar] [CrossRef]
  29. Sancho-García, A.; Ruessink, B.G.; Guillén, J. Storm-surge inundation along a multibarred beach. J. Coast. Res. 2011, SI 64, 1911–1915. [Google Scholar]
  30. Stockdon, H.F.; Holman, R.A. Estimation of wave phase speed and nearshore bathymetry from video imagery. J. Geophys. Res. Ocean. 2000, 105, 22015–22033. [Google Scholar] [CrossRef]
  31. Vousdoukas, M.I.; Ferreira, P.M.; Almeida, L.P.; Dodet, G.; Psaros, F.; Andriolo, U.; Taborda, R.; Silva, A.; Ruano, A.; Ferreira, Ó. Performance of intertidal topography video monitoring of a meso-tidal reflective beach in South Portugal. Ocean Dyn. 2011, 61, 1521–1540. [Google Scholar] [CrossRef]
  32. Simarro, G.; Calvete, D.; Plomaritis, T.A.; Moreno-Noguer, F.; Giannoukakou-Leontsini, I.; Montes, J.; Durán, R. The Influence of Camera Calibration on Nearshore Bathymetry Estimation from UAV Videos. Remote Sens. 2021, 13, 150. [Google Scholar] [CrossRef]
  33. Winant, C.D.; Inman, D.L.; Nordstrom, C.E. Description of seasonal beach changes using empirical eigenfunctions. J. Geophys. Res. 1975, 80, 1979–1986. [Google Scholar] [CrossRef]
  34. Larson, M.; Capobianco, M.; Jansen, H.; Rózyński, G.; Southgate, H.N.; Stive, M.; Wijnberg, K.M.; Hulscher, S. Analysis and Modeling of Field Data on Coastal Morphological Evolution over Yearly and Decadal Time Scales. Part 1: Background and Linear Techniques. J. Coast. Res. 2003, 19, 760–775. [Google Scholar]
  35. Kroon, A.; Larson, M.; Möller, I.; Yokoki, H.; Rozynski, G.; Cox, J.; Larroude, P. Statistical analysis of coastal morphological data sets over seasonal to decadal time scales. Coast. Eng. 2008, 55, 581–600. [Google Scholar] [CrossRef]
  36. Harley, M.D.; Turner, I.L.; Short, A.D.; Ranasinghe, R. A reevaluation of coastal embayment rotation: The dominance of cross-shore versus alongshore sediment transport processes, Collaroy-Narrabeen Beach, southeast Australia. J. Geophys. Res. 2011, 116, F04033. [Google Scholar] [CrossRef]
  37. Zhang, R.; Chen, L.; Liu, S.; Zhang, H.; Gong, W.; Lin, G. Shoreline evolution in an embayed beach adjacent to tidal inlet: The impact of anthropogenic activities. Geomorphology 2019, 346, 106856. [Google Scholar] [CrossRef]
  38. Del Río, L.; Plomaritis, T.A.; Benavente, J.; Valladares, M.; Ribera, P. Establishing storm thresholds for the Spanish Gulf of Cádiz coast. Geomorphology 2012, 143–144, 13–23. [Google Scholar] [CrossRef]
  39. Benavente, J.; Plomaritis, T.A.; Del Río, L.; Puig, M.; Valenzuela, C.; Minuzzi, B.; Del Río, L.; Puig, M.; Valenzuela, C.; Minuzzi, B. Differential short- and medium-term behavior of two sections of an urban beach. J. Coast. Res. 2014, 70, 621–626. [Google Scholar] [CrossRef]
  40. Muñoz-Pérez, J.J.; Medina, R. Comparison of long-, medium- and short-term variations of beach profiles with and without submerged geological control. Coast. Eng. 2010, 57, 241–251. [Google Scholar] [CrossRef]
  41. Benavente, J.; Borja, F.; Gracia, F.J.; Rodríguez, A. Introduction to the Gulf of Cadiz coast. In Geomorphology of the South-Atlantic Spanish Coast. Guide for Fieldtrip A4, Proceedings of the 6th International Conference on Geomorphology, Zaragoza, Spain, 7–11 September 2005; Gracia, F.J., Ed.; Universidad de Zaragoza: Zaragoza, Spain, 2005; pp. 1–11. [Google Scholar]
  42. Del Río, L.; Gracia, F.J.; Benavente, J. Morphological and evolutionary classification of sandy beaches in Cadiz coast (SW Spain). J. Coast. Res. 2013, 65, 2113–2118. [Google Scholar] [CrossRef]
  43. Plomaritis, T.A.; Benavente, J.; Del Río, L.; Reyes, E.; Dastis, C.; Gómez, M.; Bruno, M. Storm early warning system as a last plug-in of a regional operational oceanography system: The case of the gulf of Cádiz. Int. Conf. Coastal. Eng. 2012, 1, management.54. [Google Scholar] [CrossRef]
  44. Puig, M.; Del Río, L.; Plomaritis, T.A.; Benavente, J. Contribution of storms to shoreline changes in mesotidal dissipative beaches: Case study in the Gulf of Cádiz (SW Spain). Nat. Hazards Earth Syst. Sci. 2016, 16, 2543–2557. [Google Scholar] [CrossRef]
  45. Instituto Hidrográfico de la Marina. Anuario de Mareas. Available online: https://armada.defensa.gob.es/ArmadaPortal/page/Portal/ArmadaEspannola/cienciaihm1/prefLang-es/02ProductosServicios--08InfoInteres--04infoAnuario (accessed on 15 May 2021).
  46. Simarro, G.; Ribas, F.; Álvarez, A.; Guillén, J.; Chic, Ò.; Orfila, A. ULISES: An Open Source Code for Extrinsic Calibrations and Planview Generations in Coastal Video Monitoring Systems. J. Coast. Res. 2017, 335, 1217–1227. [Google Scholar] [CrossRef]
  47. Ribas, F.; Simarro, G.; Arriaga, J.; Luque, P. Automatic shoreline detection from video images by combining information from different methods. Remote Sens. 2020, 12, 3717. [Google Scholar] [CrossRef]
  48. Aarninkhof, S.G.J.; Turner, I.L.; Dronkers, T.D.T.; Caljouw, M.; Nipius, L. A video-based technique for mapping intertidal beach bathymetry. Coast. Eng. 2003, 49, 275–289. [Google Scholar] [CrossRef]
  49. Huisman, C.E.; Bryan, K.R.; Coco, G.; Ruessink, B.G. The use of video imagery to analyse groundwater and shoreline dynamics on a dissipative beach. Cont. Shelf Res. 2011, 31, 1728–1738. [Google Scholar] [CrossRef]
  50. Lorenz, E.N. Empirical Orthogonal Functions and Statistical Weather Prediction; Massachusetts Institute of Technology, Department of Meteorology: Cambridge, MA, USA, 1956. [Google Scholar]
  51. Álvarez-Ellacuría, A.; Orfila, A.; Gómez-Pujol, L.; Simarro, G.; Obregon, N. Decoupling spatial and temporal patterns in short-term beach shoreline response to wave climate. Geomorphology 2011, 128, 199–208. [Google Scholar] [CrossRef]
  52. Hannachi, A.; Jolliffe, I.T.; Stephenson, D.B. Empirical orthogonal functions and related techniques in atmospheric science: A review. Int. J. Climatol. 2007, 27, 1119–1152. [Google Scholar] [CrossRef]
  53. Muñoz-Pérez, J.J.; Medina, R. Profile changes due to a fortnightly tidal cycle. In Proceedings of the International Conference on Coastal Engineering (ASCE), Sydney, Australia, 16–21 July 2000; pp. 3063–3075. [Google Scholar]
  54. Muñoz-Pérez, J.J.; Tejedor, B. Las funciones empíricas ortogonales y los cambios en el perfil de playa a corto, medio, y largo plazo. Física Tierra 2001, 13, 139–166. [Google Scholar]
  55. Uunk, L.; Wijnberg, K.M.; Morelissen, R. Automated mapping of the intertidal beach bathymetry from video images. Coast. Eng. 2010, 57, 461–469. [Google Scholar] [CrossRef]
  56. Red Mareógrafica del IEO. Available online: http://indamar.ieo.es/mareas/formulario_datos.htm (accessed on 15 May 2021).
  57. Ferreira, Ó.; Plomaritis, T.A.; Costas, S. Effectiveness assessment of risk reduction measures at coastal areas using a decision support system: Findings from Emma storm. Sci. Total Environ. 2019, 657, 124–135. [Google Scholar] [CrossRef]
  58. McCall, R.T.; van Thiel de Vries, J.S.M.; Plant, N.G.; Van Dongeren, A.R.; Roelvink, J.A.; Thompson, D.M.; Reniers, A.J.H.M. Two-dimensional time dependent hurricane overwash and erosion modeling at Santa Rosa Island. Coast. Eng. 2010, 57, 668–683. [Google Scholar] [CrossRef]
  59. van Rijn, L.C.; Walstra, D.J.R.; Grasmeijer, B.; Sutherland, J.; Pan, S.; Sierra, J.P. The predictability of cross-shore bed evolution of sandy beaches at the time scale of storms and seasons using process-based profile models. Coast. Eng. 2003, 47, 295–327. [Google Scholar] [CrossRef]
  60. Smallegan, S.M.; Irish, J.L.; van Dongeren, A.R.; Den Bieman, J.P. Morphological response of a sandy barrier island with a buried seawall during Hurricane Sandy. Coast. Eng. 2016, 110, 102–110. [Google Scholar] [CrossRef]
  61. Sutherland, J.; Peet, A.H.; Soulsby, R.L. Evaluating the performance of morphological models. Coast. Eng. 2004, 51, 917–939. [Google Scholar] [CrossRef]
  62. Roelvink, D.; Reniers, A.; van Dongeren, A.R.; van Thiel de Vries, J.S.M.; McCall, R.; Lescinski, J. Modelling storm impacts on beaches, dunes and barrier islands. Coast. Eng. 2009, 56, 1133–1152. [Google Scholar] [CrossRef]
  63. Casella, E.; Rovere, A.; Pedroncini, A.; Stark, C.P.; Casella, M.; Ferrari, M.; Firpo, M. Drones as tools for monitoring beach topography changes in the Ligurian Sea (NW Mediterranean). Geo-Mar. Lett. 2016, 36, 151–163. [Google Scholar] [CrossRef]
  64. Talavera, L.; Del Río, L.; Benavente, J.; Barbero, L.; López-Ramírez, J.A. UAS & SfM-based approach to Monitor Overwash Dynamics and Beach Evolution in a Sandy Spit. J. Coast. Res. 2018, 85, 221–225. [Google Scholar] [CrossRef]
  65. Armaroli, C.; Ciavola, P.; Balouin, Y.; Gatti, M. An Integrated Study of Shoreline Variability Using GIS and ARGUS Techniques. J. Coast. Res. 2004, 39, 473–477. [Google Scholar]
  66. Aarninkhof, S.G.J.; Roelvink, J.A. Argus-based monitoring of intertidal beach morphodynamics. In Proceedings of the Coastal Sediments Conference, Long Island, NY, USA, 21–23 June 1999; Edge, B.E., Ed.; ASCE: New York, NY, USA, 1999. [Google Scholar]
  67. Aarninkhof, S.G.J. Nearshore Bathymetry Derived from Video Imagery; Delft University of Technology: Delft, The Netherlands, 2003. [Google Scholar]
  68. Plant, N.G.; Holman, R.A. Intertidal beach profile estimation using video images. Mar. Geol. 1997, 140, 1–24. [Google Scholar] [CrossRef]
  69. Plant, N.G.; Aarninkhof, S.G.J.; Turner, I.L.; Kingston, K.S. The Performance of Shoreline Detection Models Applied to Video Imagery. J. Coast. Res. 2007, 233, 658–670. [Google Scholar] [CrossRef]
  70. Aarninkhof, S.G.J.; Ruessink, B.G.; Roelvink, J.A. Nearshore subtidal bathymetry from time-exposure video images. J. Geophys. Res. 2005, 110. [Google Scholar] [CrossRef]
  71. Holman, R.; Plant, N.G.; Holland, T. cBathy: A robust algorithm for estimating nearshore bathymetry. J. Geophys. Res. Ocean. 2013, 118, 2595–2609. [Google Scholar] [CrossRef]
  72. Simarro, G.; Calvete, D.; Luque, P.; Orfila, A.; Ribas, F. UBathy: A new approach for bathymetric inversion from video imagery. Remote Sens. 2019, 11, 2722. [Google Scholar] [CrossRef]
  73. Bergsma, E.; Conley, D.; Davidson, M.; O’Hare, T.; Almar, R. Storm Event to Seasonal Evolution of Nearshore Bathymetry Derived from Shore-Based Video Imagery. Remote Sens. 2019, 11, 519. [Google Scholar] [CrossRef]
  74. Santos, D.; Abreu, T.; Silva, P.A.; Santos, F.; Baptista, P. Nearshore Bathymetry Retrieval from Wave-Based Inversion for Video Imagery. Remote Sens. 2022, 14, 2155. [Google Scholar] [CrossRef]
  75. Poelhekke, L.; Jäger, W.S.; van Dongeren, A.R.; Plomaritis, T.A.; McCall, R.; Ferreira, Ó. Predicting coastal hazards for sandy coasts with a Bayesian Network. Coast. Eng. 2016, 118, 21–34. [Google Scholar] [CrossRef]
  76. Donnelly, C.; Kraus, N.; Larson, M. State of Knowledge on Measurement and Modeling of Coastal Overwash. J. Coast. Res. 2006, 224, 965–991. [Google Scholar] [CrossRef]
  77. Duo, E.; Chris Trembanis, A.; Dohner, S.; Grottoli, E.; Ciavola, P. Local-scale post-event assessments with GPS and UAV-based quick-response surveys: A pilot case from the Emilia-Romagna (Italy) coast. Nat. Hazards Earth Syst. Sci. 2018, 18, 2969–2989. [Google Scholar] [CrossRef]
  78. Aguilar, F.J.; Mills, J.P.; Delgado, J.; Aguilar, M.A.; Negreiros, J.G.; Pérez, J.L. Modelling vertical error in LiDAR-derived digital elevation models. ISPRS J. Photogramm. Remote Sens. 2010, 65, 103–110. [Google Scholar] [CrossRef]
  79. Baptista, P.; Bastos, L.; Bernardes, C.; Cunha, T.; Dias, J. Monitoring Sandy Shores Morphologies by DGPS—A Practical Tool to Generate Digital Elevation Models. J. Coast. Res. 2008, 246, 1516–1528. [Google Scholar] [CrossRef]
  80. Benavente, J.; Gracia, F.J.; López-Aguayo, F. Empirical model of morphodynamic beachface behaviour for low-energy mesotidal environments. Mar. Geol. 2000, 167, 375–390. [Google Scholar] [CrossRef]
  81. Plomaritis, T.A.; Benavente, J.; Laiz, I.; Del Río, L. Variability in storm climate along the Gulf of Cadiz: The role of large scale atmospheric forcing and implications to coastal hazards. Clim. Dyn. 2015, 45, 2499–2514. [Google Scholar] [CrossRef]
  82. Benavente, J.; Del Río, L.; Anfuso, G.; Gracia, F.J.; Reyes, J.L. Utility of Morphodynamic Characterisation in the Prediction of Beach Damage by Storms. J. Coast. Res. 2002, 36, 56–64. [Google Scholar] [CrossRef]
  83. Muñoz-Pérez, J.J.; Tejedor, L.; Medina, R. Equilibrium beach profile model for perched beaches. J. Coast. Res. 1999, 15, 950–957. [Google Scholar] [CrossRef]
  84. Jackson, D.W.T.; Cooper, J.A.G.; Del Río, L. Geological control of beach morphodynamic state. Mar. Geol. 2005, 216, 297–314. [Google Scholar] [CrossRef]
  85. Gallop, S.L.; Bosserelle, C.; Pattiaratchi, C.; Eliot, I. Rock topography causes spatial variation in the wave, current and beach response to sea breeze activity. Mar. Geol. 2011, 290, 29–40. [Google Scholar] [CrossRef]
  86. Ranasinghe, R.; Turner, I.L.; Symonds, G. Shoreline response to multi-functional artificial surfing reefs: A numerical and physical modelling study. Coast. Eng. 2006, 53, 589–611. [Google Scholar] [CrossRef]
  87. Gallop, S.L.; Bosserelle, C.; Eliot, I.; Pattiaratchi, C.B. The influence of limestone reefs on storm erosion and recovery of a perched beach. Cont. Shelf Res. 2012, 47, 16–27. [Google Scholar] [CrossRef]
  88. Vousdoukas, M.I.; Velegrakis, A.F.; Plomaritis, T.A. Beachrock occurrence, characteristics, formation mechanisms and impacts. Earth-Sci. Rev. 2007, 85, 23–46. [Google Scholar] [CrossRef]
  89. López-Dóriga, U.; Jiménez, J.A.; Bisaro, A.; Hinkel, J. Financing and implementation of adaptation measures to climate change along the Spanish coast. Sci. Total Environ. 2020, 712, 135685. [Google Scholar] [CrossRef] [PubMed]
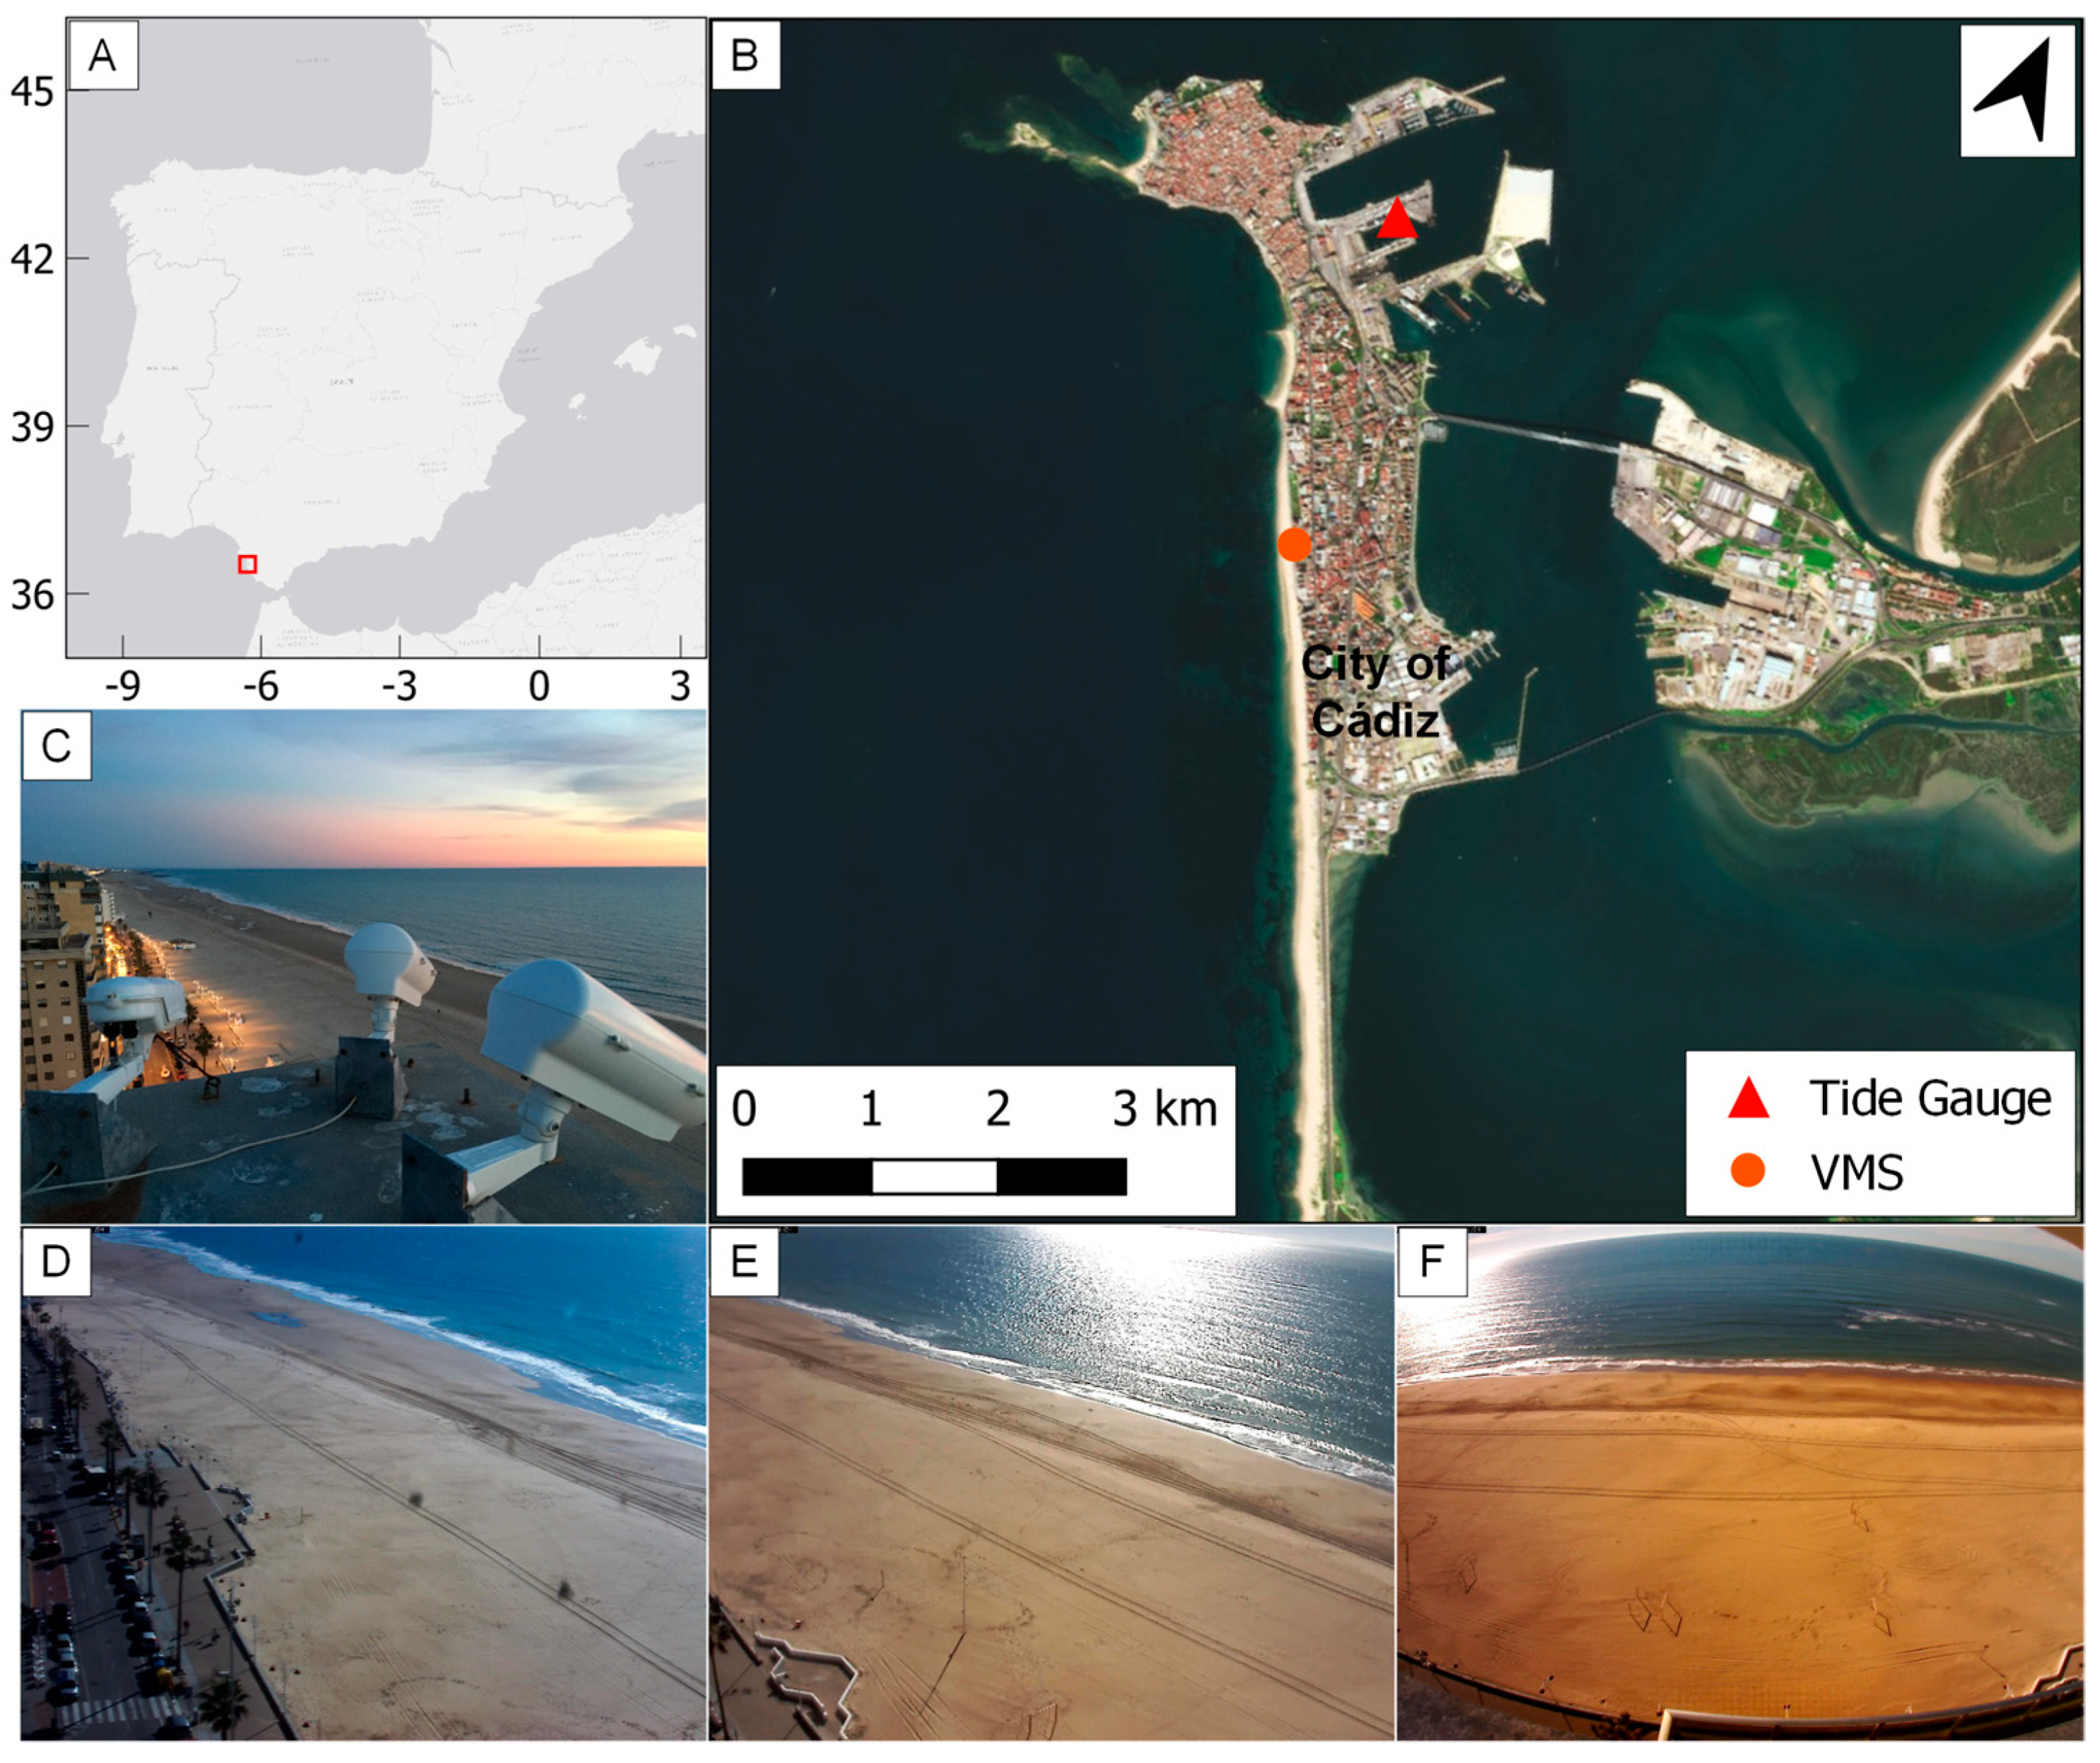
Figure 1. (A) Location of the study area in SW Spain. (B) Position of the video-monitoring system (VMS) in the city of Cadiz. (C) General view of the VMS. (DF) Areas covered by each camera.
Remotesensing 15 02650 g001
Figure 2. Methodology used to analyse beach cross- and longshore evolution combining the automatic extraction of shorelines and the generation of DEMs.
Remotesensing 15 02650 g002
Figure 3. Example of shoreline extraction (green line) using a mask (yellow lines) to avoid features of the beach that might decrease the quality of the extraction. The background planview is in pixel coordinates.
Remotesensing 15 02650 g003
Figure 4. RTK-DGPS profiles used for the validation (orange dashed lines), profiles employed to extract slope and volume (blue lines), and an example of an extracted DEM.
Remotesensing 15 02650 g004
Figure 5. Analysis of shoreline position. (A) Planview of La Victoria Beach with the baseline (yellow line) used for the analysis. (B) Mean shoreline position with respect to the baseline. (C) Result of EOF analysis. (D) Evolution of EOF amplitudes along the study period. (E) Evolution of mean shoreline position along the study period.
Remotesensing 15 02650 g005
Figure 6. Results of the DEM validation (XYZ-dependent parameters, slope, and volume) using the two RTK-DGPS profiles.
Remotesensing 15 02650 g006
Figure 7. Upper panel: evolution of beach slope in each profile of La Victoria Beach over the studied period, where profile 1 is the northernmost one and profile 14 is the southernmost one. Lower panel: variability in beach slope along the analysed profiles for each survey, where the red lines are the median, the limits of the boxes are the 25th and 75th percentiles, and the markers are the outliers.
Remotesensing 15 02650 g007
Figure 8. Upper panel: evolution of the normalized volume in each profile of La Victoria Beach over the studied period, where profile 1 is the northernmost one and profile 14 is the southernmost one. Lower panel: variability in the volume along the analysed profiles for each survey, where the red lines are the median, the limits of the boxes are the 25th and 75th percentiles, and the markers are the outliers.
Remotesensing 15 02650 g008
Figure 9. Comparison of beach profiles from RTK-DGPS surveys (blue lines) and DEMs (yellow lines) on different dates.
Remotesensing 15 02650 g009
Table 1. Dates on which the RTK-DGPS profiles were carried out and DEMs were extracted.
Survey IndexRTK-DGPS Survey DateDEM Date
123-09-201319-09-2013
203-10-201306-10-2013
303-12-201304-12-2013
431-01-201431-01-2014
518-06-201414-06-2014
609-10-201409-10-2014
725-11-201424-11-2014
803-12-201406-12-2014
902-07-201504-07-2015
Table 2. Results of the DEM validation using the two RTK-DGPS profiles (P1 and P2, Figure 4) for XYZ-dependent variables where profile geometry was analysed.
Survey IndexGeometry Errors
RSCIRelBiasBSSRMSE
P1P2P1P2P1P2P1P2P1P2
10.980.970.080.090.040.020.970.940.230.26
20.980.990.080.10.03−0.020.960.960.20.23
310.970.130.17−0.09−0.120.970.940.30.36
40.980.990.140.140.10.130.950.990.310.36
50.990.990.050.06−0.02−0.020.990.980.120.14
60.960.980.090.08−0.06−0.060.930.970.300.26
70.980.970.10.110.01−0.020.960.950.220.23
80.990.990.050.04−0.05−0.030.990.990.100.08
90.970.970.170.190.130.160.950.960.480.47
Mean0.980.980.120.130.050.050.960.960.250.26
Table 3. Results of the DEM slope and volume validations using the two RTK-DGPS profiles for the relative slope and volume error.
Survey IndexRelative Errors
Slope P1Slope P2Volume P1Volume P2
10.010.050.050.02
20.020.220.040.02
30.020.050.130.19
40.1300.120.16
50.010.130.050.04
60.520.450.120.07
70.180.220.040
8000.080.05
900.020.20.25
Mean0.10.130.090.09
Disclaimer/Publisher’s Note: The statements, opinions and data contained in all publications are solely those of the individual author(s) and contributor(s) and not of MDPI and/or the editor(s). MDPI and/or the editor(s) disclaim responsibility for any injury to people or property resulting from any ideas, methods, instructions or products referred to in the content.