Article

Comparison of Various Annual Land Cover Datasets in the Yellow River Basin

1
State Key Laboratory of Environmental Criteria and Risk Assessment, Chinese Research Academy of Environmental Sciences, Beijing 100012, China
2
State Key Laboratory of Environmental Protection for Regional Eco-Process and Function Assessment, Chinese Research Academy of Environmental Sciences, Beijing 100012, China
3
Institute of Ecology, Chinese Research Academy of Environmental Sciences, Beijing 100012, China
4
Command Center of Natural Resources Comprehensive Survey, CGS, Beijing 100055, China
5
Zhejiang Environmental Technology Co., Ltd., Hangzhou 311100, China
*
Author to whom correspondence should be addressed.
Remote Sens. 2023, 15(10), 2539; https://doi.org/10.3390/rs15102539
Submission received: 30 March 2023 / Revised: 8 May 2023 / Accepted: 10 May 2023 / Published: 12 May 2023

Abstract

:
Accurate land cover (LC) datasets are the basis for global environmental and climate change studies. Recently, numerous open-source annual LC datasets have been created due to advances in remote sensing technology. However, the agreements and sources of error that affect the accuracy of current annual LC datasets are not well understood, which limits the widespread use of these datasets. We compared four annual LC datasets, namely the CLCD, MCD12Q1, CCI-LC, and GLASS-LC, in the Yellow River Basin (YRB) to identify their spatial and temporal agreement for nine LC classes and to analyze their sources of error. The Mann–Kendall test, Sen’s slope analysis, Taylor diagram, and error decomposition analysis were used in this study. Our results showed that the main LC classes in the four datasets were grassland and cropland (total area percentage > 80%), but their trends in area of change were different. For the main LC classes, the temporal agreement was the highest between the CCI-LC and CLCD (0.85), followed by the MCD12Q1 (0.21), while the lowest was between the GLASS-LC and CLCD (−0.11). The spatial distribution of area for the main LC classes was largely similar between the four datasets, but the spatial agreement in their trends in area of change varied considerably. The spatial variation in the trends in area of change for the cropland, forest, grassland, barren, and impervious LC classes were mainly located in the upstream area region (UA) and the midstream area region (MA) of the YRB, where the percentage of systematic error was high (>68.55%). This indicated that the spatial variation between the four datasets was mainly caused by systematic errors. Between the four datasets, the total error increased along with landscape heterogeneity. These results not only improve our understanding of the spatial and temporal agreement and sources of error between the various current annual LC datasets, but also provide support for land policy making in the YRB.

Graphical Abstract

1. Introduction

Land cover (LC) change plays a key role in understanding global environmental changes, such as the carbon cycle [1,2], local climate [3,4], water quality and its distribution [5,6], biodiversity conservation [7,8], ecosystem services, and human well-being [9,10]. Concerns about LC changes have increased dramatically in recent years with the development of high-level political agreements, such as the UN Sustainable Development Goals (SDGs) and the Convention on Biological Diversity (CBD) [11,12].
Advances in remote sensing technology have contributed significantly to the development of LC change studies [13,14,15]. The international scientific community has initiated and organized numerous projects to produce LC datasets using satellite remote sensing images [16,17,18,19,20], achieving substantial results in land change monitoring and diagnosis [21,22], land change mechanisms [23,24], regional and global land change models [25,26], and global environmental change [27,28]. In addition, the production and application of annual LC datasets has significantly improved our understanding of the land change process [13,17,29]. However, the process of annual land change differs substantially from that identified by snapshots [30], which may underestimate the intensity of LC change and fail to determine whether the trend of LC change is gradual or abrupt [31].
The availability of numerous LC datasets has also raised uncertainties due to the use of various data sources, classification schemes, and methodologies. Consequently, numerous studies have been conducted to evaluate the accuracy of LC datasets from various sources, as well as to assess the agreement between them [32,33,34,35,36,37]. Most studies have focused on assessing the classification accuracy and comparing the spatial agreement of different LC datasets at a single assessment date, or on an assessment of change involving only one or two change periods [33,37,38], but few studies have investigated the spatial and temporal agreement and the source of error between the annual LC datasets. It is crucial to identify the weaknesses and limitations of current coarse land change products (e.g., burned area products) by understanding the sources of error that affect the accuracy of these products [39]. Studies comparing climate indices (e.g., temperature and precipitation) have reported [40,41] that analyzing the annual spatial and temporal agreement and source of error between various datasets is crucial for explaining biases in climate model results, as well as for the data fusion of various datasets.
Landscape heterogeneity has been frequently identified as a driver in determining the spatial agreement and variation between various LC datasets. Previous studies [33,34,42] have revealed that LC datasets in regions with high landscape heterogeneity generally have lower classification accuracy, as well as lower spatial agreement between various datasets. However, it is unclear how landscape heterogeneity affects the annual spatial and temporal agreement and source of error between various LC datasets. The LC of the Yellow River Basin (YRB) is highly heterogeneous and dynamic. Over the past 40 years, the spatial distribution pattern of LC in the YRB has changed dramatically [43,44] due to climate change [43,45,46] and human activities [47,48,49,50]. In particular, the implementation of ecological projects such as “Grain to Green” has led to a large-scale land system shift between cropland and natural vegetation on the Loess Plateau (located in the midstream area of the YRB). Previous studies [51] have reported that the area of change for the main LC classes in the YRB varied considerably between various datasets, but the spatial and temporal agreement between them was unclear. This makes the YRB an ideal region in which to conduct a study comparing the agreement and the source of error between various LC datasets.
The objective of this study is to investigate the spatial and temporal agreement and the source of error for nine LC classes between four annual datasets. The spatial and temporal agreement was assessed using the Mann–Kendall test, Sen’s slope analysis, and Taylor diagram methods, and the source of error was assessed using the error decomposition analysis method. The rest of this article is organized as follows. Section 2 presents the study area, datasets, and the method of data analysis. Section 3 presents the results of spatial and temporal agreement and the source of error between the four datasets. The relationship between landscape heterogeneity and the agreement and total errors between the four datasets is also presented in this section. Section 4 discusses the results in detail, the implications for land policy, and the limitations of this study. Section 5 concludes this study.
This study will provide new insights into the spatial and temporal agreement between the four annual LC datasets, in particular the source of error. Through this study, we will realize that further improvement of the annual LC datasets is possible through appropriate data fusion algorithms that integrate landscape heterogeneity. Furthermore, the analysis methods presented in this study will provide valuable information for future research investigating the comparison of specific land change processes, such as urban development and cropland expansion.

2. Materials and Methods

2.1. Study Area

The Yellow River Basin (YRB) is located between 96°E–119°E and 32°N–42°N (Figure 1). The YRB covers an area of 79.5 million ha. The topography of the YRB is high in the west and low in the east (Figure 1) and includes four geomorphic units from west to east: the Qinghai–Tibet Plateau, the Inner Mongolia Plateau, the Loess Plateau, and the North China Plain. The YRB is the main source of fresh water for approximately 107 million people. It is also an important grain-producing region in northern China, accounting for 18% of China’s grain production [51]. In brief, the YRB is an important ecological security barrier for northern China [52]. Typically, the YRB can be divided into four watersheds: the source area region (SA), the upstream area region (UA), the midstream area region (MA), and the downstream area region (DA) (Figure 1).

2.2. Data Sources and Pre-Processing

The main free and open-access annual LC datasets available for the China region include the Moderate Resolution Imaging Spectroradiometer (MODIS) LC dataset [53,54,55], the ESA Climate Change Initiative LC (CCI-LC) dataset [56], the Global Land Surface Satellite Global Land Cover (GLASS-GLC) dataset [57], and the China Landsat-derived Annual Land Cover Dataset (CLCD) [58]. The four LC datasets mentioned above were selected for use in this study (see Table 1 for details), and the CLCD was used as the reference dataset as it has the highest spatial resolution and classification accuracy [58]. The boundaries of the YRB were obtained from RESDC (http://www.resdc.cn, accessed on 15 January 2023). The DEM data were obtained from the Geospatial Data Cloud Platform of the Computer Network Information Center of the Chinese Academy of Sciences (http://www.gscloud.cn, accessed on 15 January 2023) with a spatial resolution of 90 m × 90 m. All data were reprojected in Mercator projection and uniformly clipped by the boundary of the YRB for subsequent processing. For direct comparison of the four annual LC datasets with different classification strategies, all the datasets were reclassified into nine LC classes: cropland, forest, grassland, shrubland, water, snow/ice, impervious, barren, and wetland. (Tables S1–S3).

2.3. Methods

In this study, we compared the four annual LC datasets to determine their temporal and spatial agreement and to analyze their sources of error for nine LC classes in the YRB. As the spatial resolution of these datasets varies from 300 m to 4 km, the spatial agreement and source of errors between these datasets cannot be directly compared. A widely used method has been to resample the LC datasets to the same spatial resolution using nearest neighbor or majority interpolation techniques. However, the resampling method could miss the detailed information of the datasets and propagate some errors into the newly resampled datasets. To overcome this problem, we compared the area estimates in the grid (0.5° × 0.5°) for each LC class instead of resampling these datasets to the same spatial resolution. In this context, the area estimates were calculated by the pixel counting method and the agreement was assessed by the correlation (with a p-value less than the significance level of 0.05) between the reference and the other three datasets.
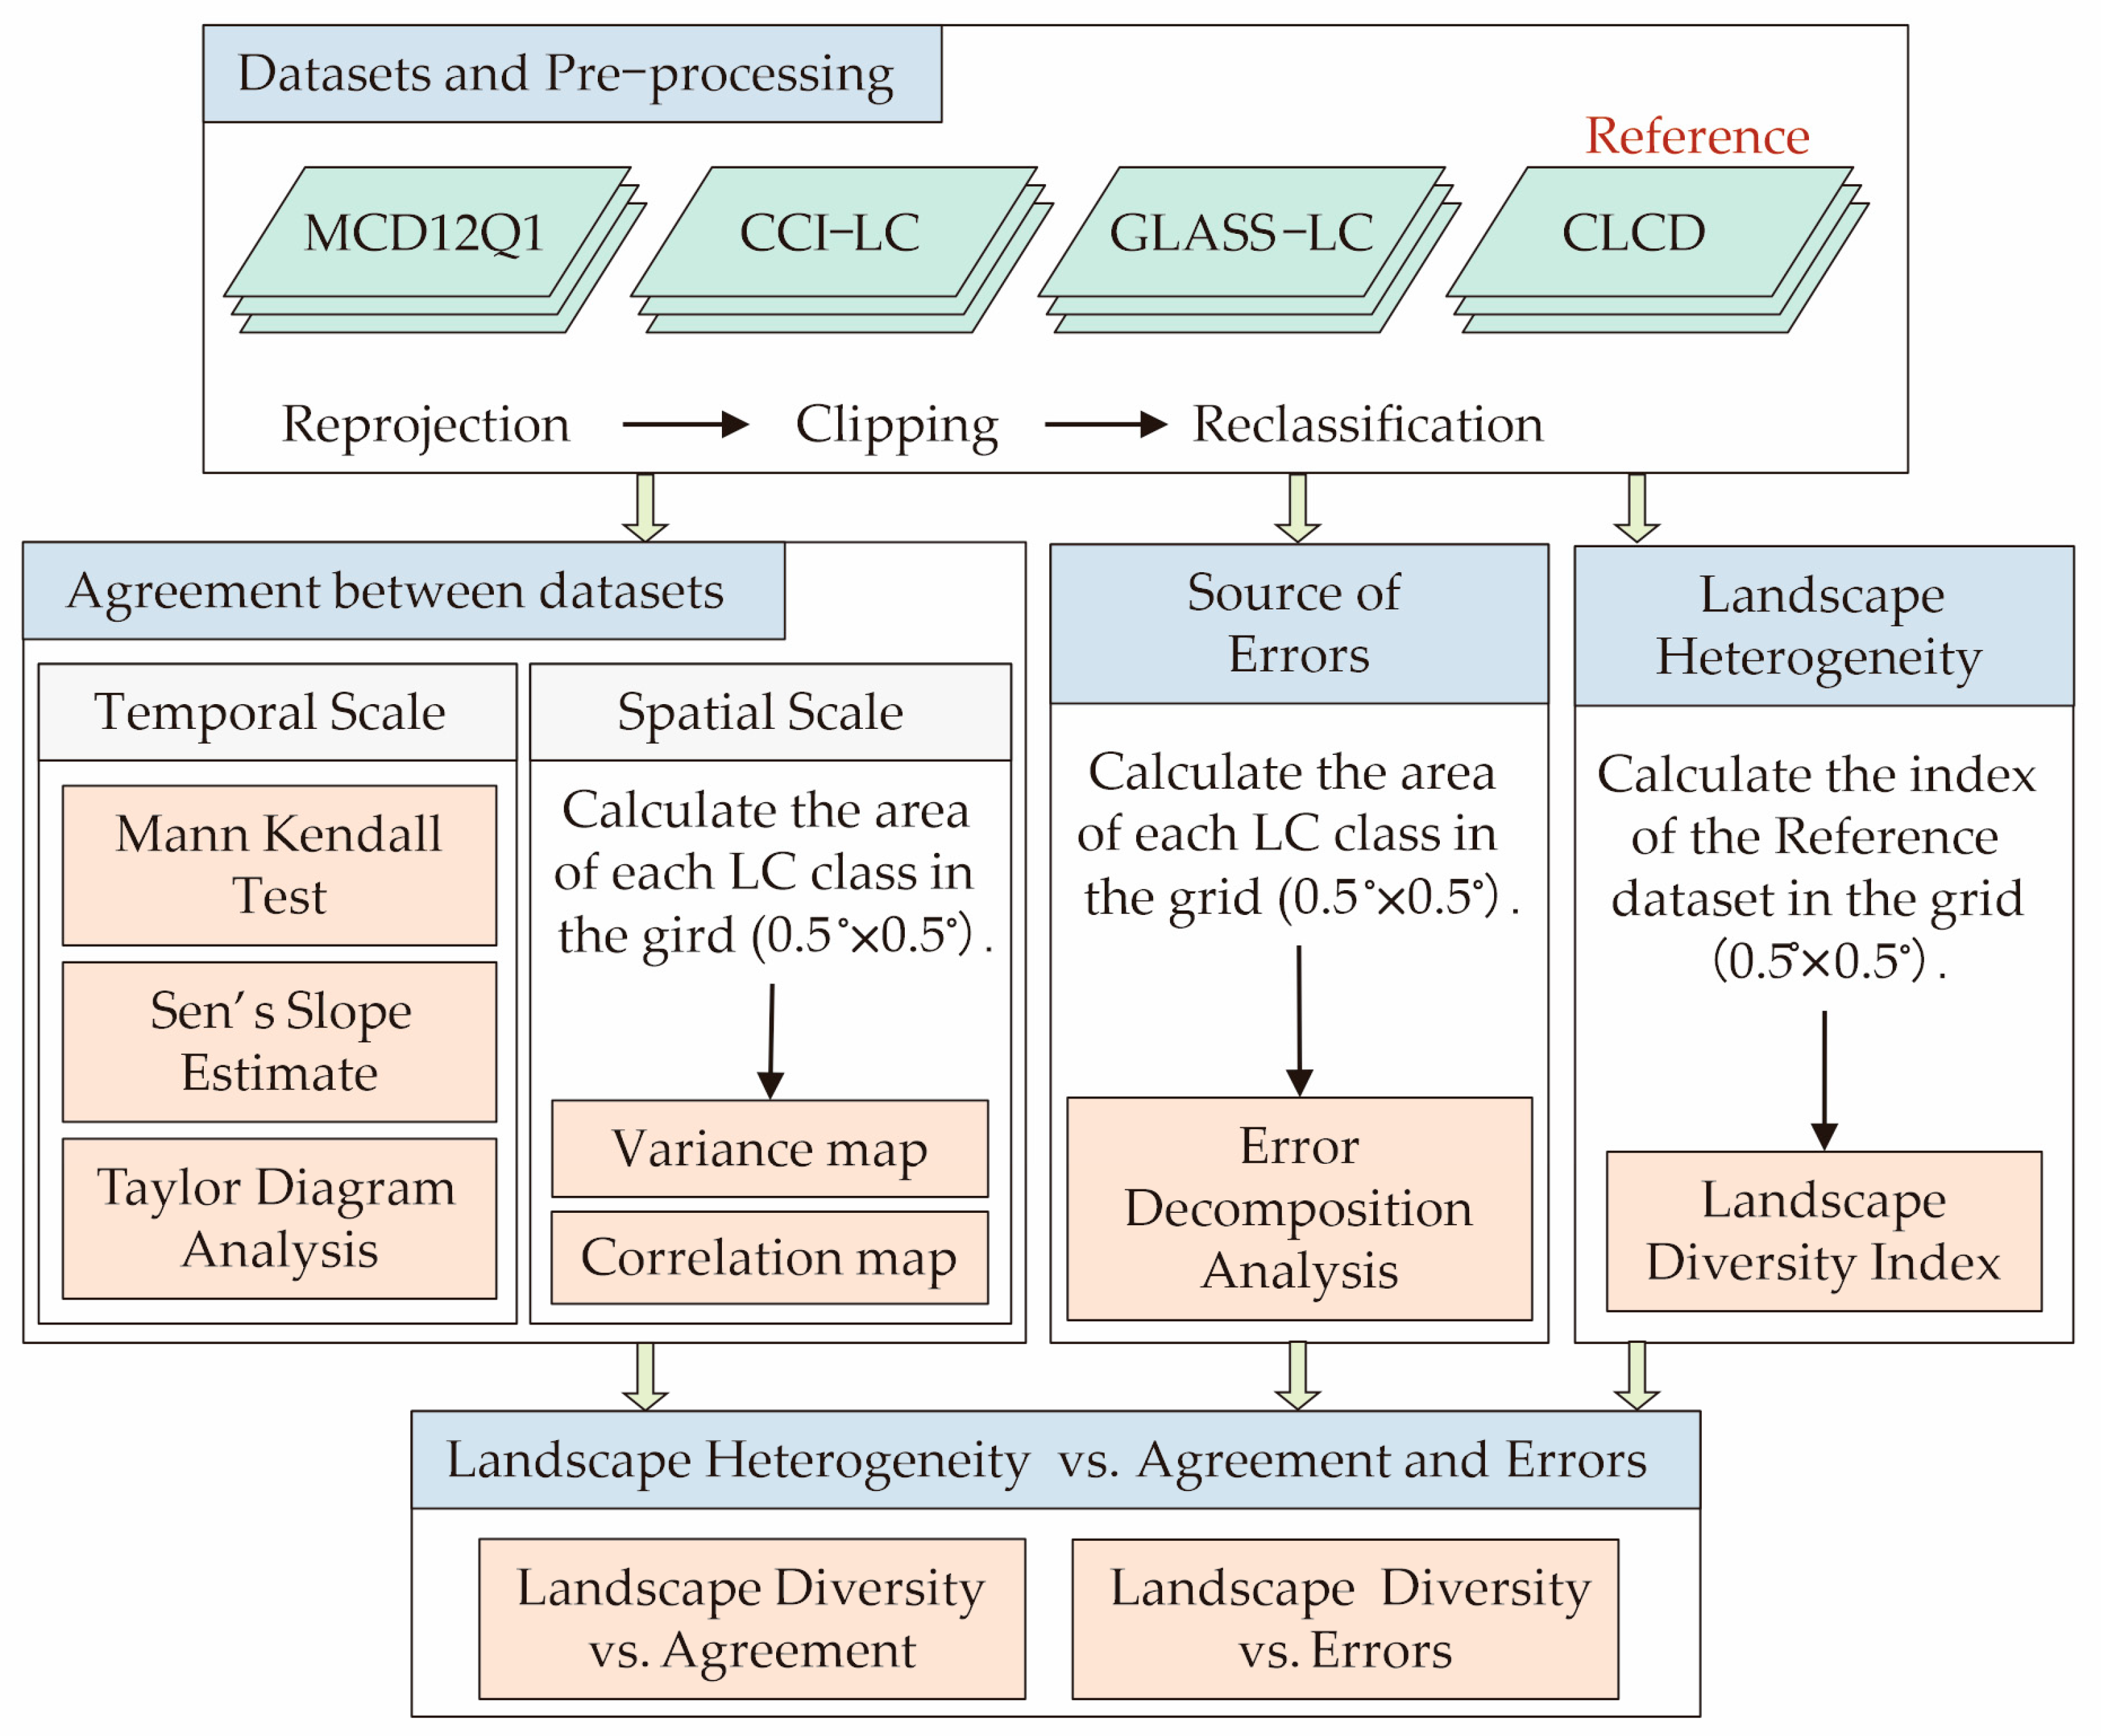
The main flowchart of the methodology used in this study was as follows (Figure 2). First, we calculated the area estimates in the whole YRB for each LC class and compared the temporal agreement between the four LC datasets. Second, we calculated the area estimates in the grid (0.5° × 0.5°) and compared the spatial agreement between the four LC datasets. Third, the area estimates in the grid (0.5° × 0.5°) were used to calculate the sources of error for each LC class. Finally, we calculated the landscape heterogeneity in the grid (0.5° × 0.5°) of the reference dataset and analyzed the relationship between landscape heterogeneity and agreement, and between landscape heterogeneity and error. Landscape heterogeneity was calculated using the landscape diversity index.

2.3.1. Estimation of Landscape Heterogeneity

Landscape heterogeneity was estimated using the landscape diversity index [59]. The landscape diversity index (H) refers to the diversity of landscape classes in each of the 0.5° × 0.5° grids in this study and was calculated as follows (Equation (1)):
H = i = 1 R p i ln ( p i )
where H is the landscape diversity index and pi is the proportion of each landscape class within the 0.5° × 0.5° grid.

2.3.2. Mann–Kendall Test and Sen’s Slope Estimate

The Mann–Kendall test and Sen’s slope estimate (β) were used to analyze the trend in area of change for the nine LC classes. The Mann–Kendall statistical test [60,61] and Sen’s slope estimate [62] are both non-parametric methods of trend detection and are commonly used for time-series data [63,64]. Sen’s slope estimate refers to the slope of the trend in the sample of N pairs of data and is estimated as follows (Equation (2)):
β = m e d i a n ( x j x i j i ) , j > i
where xj and xi are the values at time j and i (j > i), respectively. β > 0 indicates an increasing trend in the time series data, while β < 0 indicates a decreasing trend. The Mann–Kendall test statistic S is calculated as follows (Equation (3)):
S = i = 1 N 1 j = i + 1 N sgn ( x j x i )
where N is the number of data points, xi and xj are the values in time series i and j (j > i), respectively, and sgn(xjxi) is the sign function, as follows (Equation (4)):
sgn ( x j x i ) = { + 1 , ( x j x i ) > 0 0 , ( x j x i ) = 0 1 , ( x j x i ) < 0
The variance is calculated as follows (Equation (5)):
V a r ( S ) = N ( N 1 ) ( 2 N + 5 ) 18
For a sample size N > 10, the standard normality test statistic ZS is calculated as follows (Equation (6)):
Z S = { S 1 V a r ( S ) , i f S > 0 0 , i f S = 0 S + 1 V a r ( S ) , i f S < 0
The trend test is performed at a specific α significance level. If |ZS| > Z1−α/2, the null hypothesis is rejected and there is a significant trend in the time series data. Z1−α/2 is obtained from the standard normal distribution table. In this study, the significance level α = 0.05 was used. If |ZS| > 1.96, the null hypothesis of no trend was rejected at the 5% significance level.

2.3.3. Taylor Diagram Approach

Taylor diagrams [65] were used to evaluate the difference in the area of changes for the nine LC classes between the four datasets. Taylor diagrams provide a way of graphically summarizing how closely an observation dataset matches the reference dataset. The agreement between two datasets is quantified in terms of the correlation coefficient (R), the centered root-mean-square-error (E’), and the amplitude of the standard deviation (σ). These statistics are related by the following equation (Equation (7)):
E 2 = σ f 2 + σ r 2 2 σ f σ r R
where R is the correlation coefficient between the observation and reference datasets, E’ is the centered RMSE between the observation and reference datasets, and σf2 and σr2 are the variances of the observation and reference datasets, respectively. The equations for calculating the correlation coefficient (R), the centered RMSE (E’), and the standard deviations of the test dataset (σf) and the reference dataset (σr) are as follows (Equations (8)–(11)):
R = 1 N n = 1 N ( f n f ¯ ) ( r n r ¯ ) σ f σ r
E 2 = 1 N n = 1 N [ ( f n f ¯ ) ( r n r ¯ ) ] 2
σ f 2 = 1 N n = 1 N ( f n f ¯ ) 2
σ r 2 = 1 N n = 1 N ( r n r ¯ ) 2
where fn and rn are the areas for the nine LC classes, f ¯ and r ¯ are the mean areas for the nine LC classes of the observation and reference datasets, respectively, and N is the number of values in the time series or space.
In a Taylor diagram, the distance from the data point to the origin is the σ value, reflecting the magnitude of change. The position of the data points on the axes represents the R, reflecting the degree of agreement between the observation and the reference datasets. The distance of the data points from the reference points is the E’, reflecting the deviation between the observation and the reference datasets. It is generally accepted that the smaller the distance between the observation and reference dataset, the better the agreement. The diagram is particularly useful for evaluating multiple dimensions of complex models or datasets [66,67] and is widely used in scientific climate research.

2.3.4. Error Decomposition Approach

Understanding the sources of error is the basis for future improvements in the accuracy of LC classification and the development of uncertainty estimation and bias calibration techniques [68]. The Willmott decomposition technique [69] was used to determine the percentage of systematic and random error. In this approach, the systematic error is defined as the part of the error that can be fitted linearly [69,70]. The errors in the datasets can therefore be divided into percentages of systematic and random errors as follows (Equations (12) and (13)):
1 N [ n = 1 N ( f n r n ) 2 ] = 1 N [ n = 1 N ( f n * r n ) 2 ] + 1 N [ n = 1 N ( f n f n * ) 2 ]
f n * = a × r n + b
where fn* is the fitted areas for the nine LC classes through a linear function, and a and b are the slope and intercept of the fitting linear function, respectively. In Equation (11), the total mean squared error is decomposed into two components (the terms on the left): (a) the systematic error (first term on the right) and (b) the random error (second term on the right).

3. Results

3.1. Comparison on a Temporal Scale

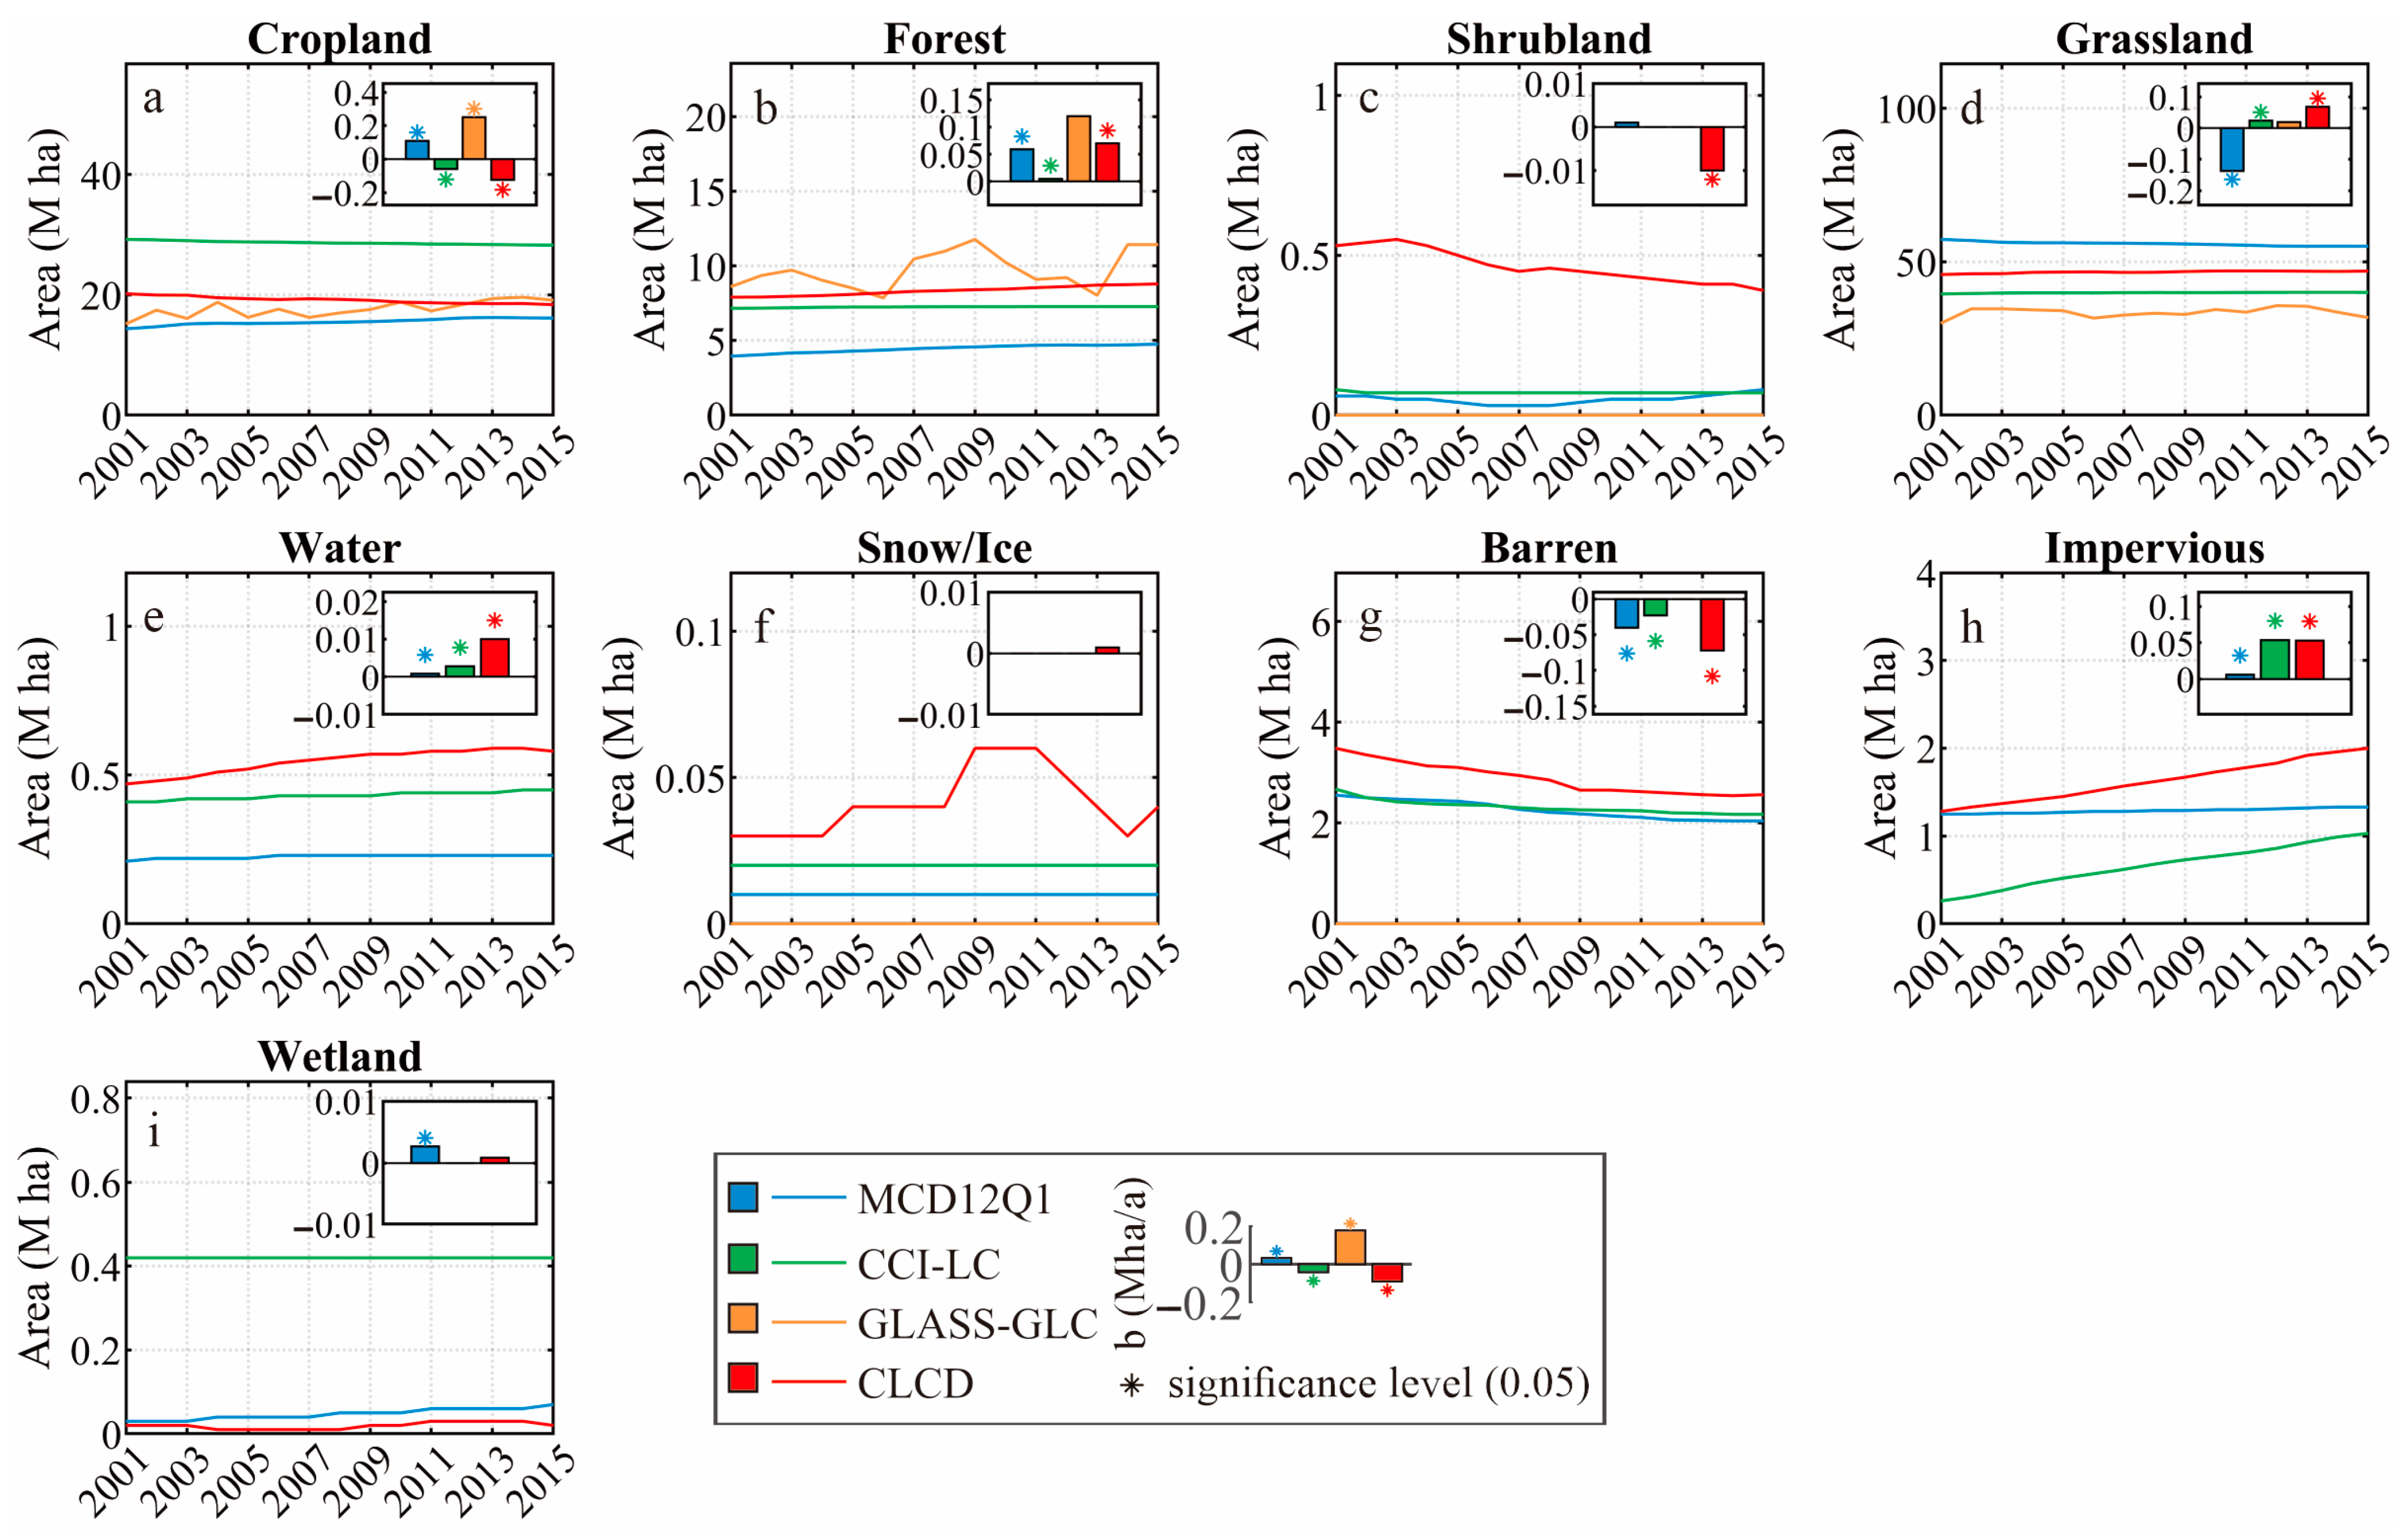
Figure 3 showed that the LC classes of the YRB are mainly grassland and cropland, but there were differences in their areas between the four datasets. For cropland, the CCI-LC had the largest area (Figure 3a) and the MCD12Q1 had the smallest area; the 15-year (2001–2015) mean area from the CCI-LC was 4.17 times larger than that from the MCD12Q1, and the 15-year (2001–2015) mean areas from the CLCD and GLASS-GLC were comparable. Regarding grassland (Figure 3d), the area from the CLCD was the largest, and the area from the MCD12Q1 was the smallest, with the 15-year mean area from the CLCD being 1.99 times that from the MCD12Q1; the 15-year mean areas from the CCI-LC and GLASS-GLC were comparable. The results of the Mann–Kendall test (S) and Sen’s slope (β) showed that the gradual change process was significant for most LC classes of the YRB from 2001 to 2015. Further analysis revealed that there was a similar temporal trend in area of change for forest and impervious areas between the four datasets (Figure 3c,h), but not for the other LC classes. The shrubland, water, snow/ice, barren, and impervious areas, which cover a small percentage of the total area, reached their highest value in the CLCD. This suggests that the CLCD, which has the highest spatial resolution, may reflect more detail in terms of the temporal change of LC than other datasets.
As shown in Figure 4, the ranking of σ values for the nine LC classes between the four datasets were GLASS-LC > CLCD > MCD12Q1 > CCI-LC, indicating that the GLASS-LC is more variable than the CLCD, while the MCD12Q1 and CCI-LC are less variable than the CLCD. The R between the CCI-LC and CLCD was positive for the seven LC classes (except for snow/ice and wetland), while the R between the MCD12Q1 and CLCD was positive for five LC classes (forest, water, barren, impervious and wetland), and the R between the GLASS-LC and CLCD was positive for only two LC classes (forest and grassland). The ranking of E’ between the three datasets and the CLCD was GLASS-LC > MCD12Q1 > CCI-LC. This suggests that the CCI-LC deviates the least from the CLCD, while the GLASS-LC deviates the most from the CLCD. These results suggest that the CCI-LC and CLCD had the highest temporal agreement, followed by the MCD12Q1, while the GLASS-LC and CLCD had the lowest temporal agreement.

3.2. Comparison on a Spatial Scale

To compare the spatial variation in area for the nine LC classes between the four datasets, the area estimates for each LC class in the grid (0.5° × 0.5°) were calculated. In general, the spatial distribution of the 15-year mean areas for the nine LC classes was relatively comparable between the four datasets, with spatial variation mainly located in the UA and MA of the YRB (Figure S1). As shown in Figure S1, the spatial distribution of cropland, forest, and grassland areas was mainly located in the UA and MA of the YRB, the spatial distribution of the barren area was in the UA of the YRB, and the spatial distribution of the impervious area was in the MA of the YRB. The spatial extent of shrubland, water, snow/ice, and wetland areas were the largest in the CLCD compared to the other three datasets. Regarding the area for the main LC classes (Figure S2), the variation between the GLASS-LC and CLCD was mainly located in the UA of the YRB, the variation between the CCI-LC and CLCD was located in the UA of the YRB, and the variation between the MCD12Q1 and CLCD was located in the UA and MA of the YRB. Compared to the CLCD, the GLASS-LC had 7.65 M ha less grassland area and 16.20 M ha more barren area; the CCI-LC had 9.02 M ha more cropland area and 6.71 M ha less grassland area; and the MCD12Q1 had 9.24 M ha more grassland area and 3.08 M ha less cropland area. These spatial variations in area may be due to the different classification strategies for LC classes such as cropland, forest, and grassland between the four datasets.
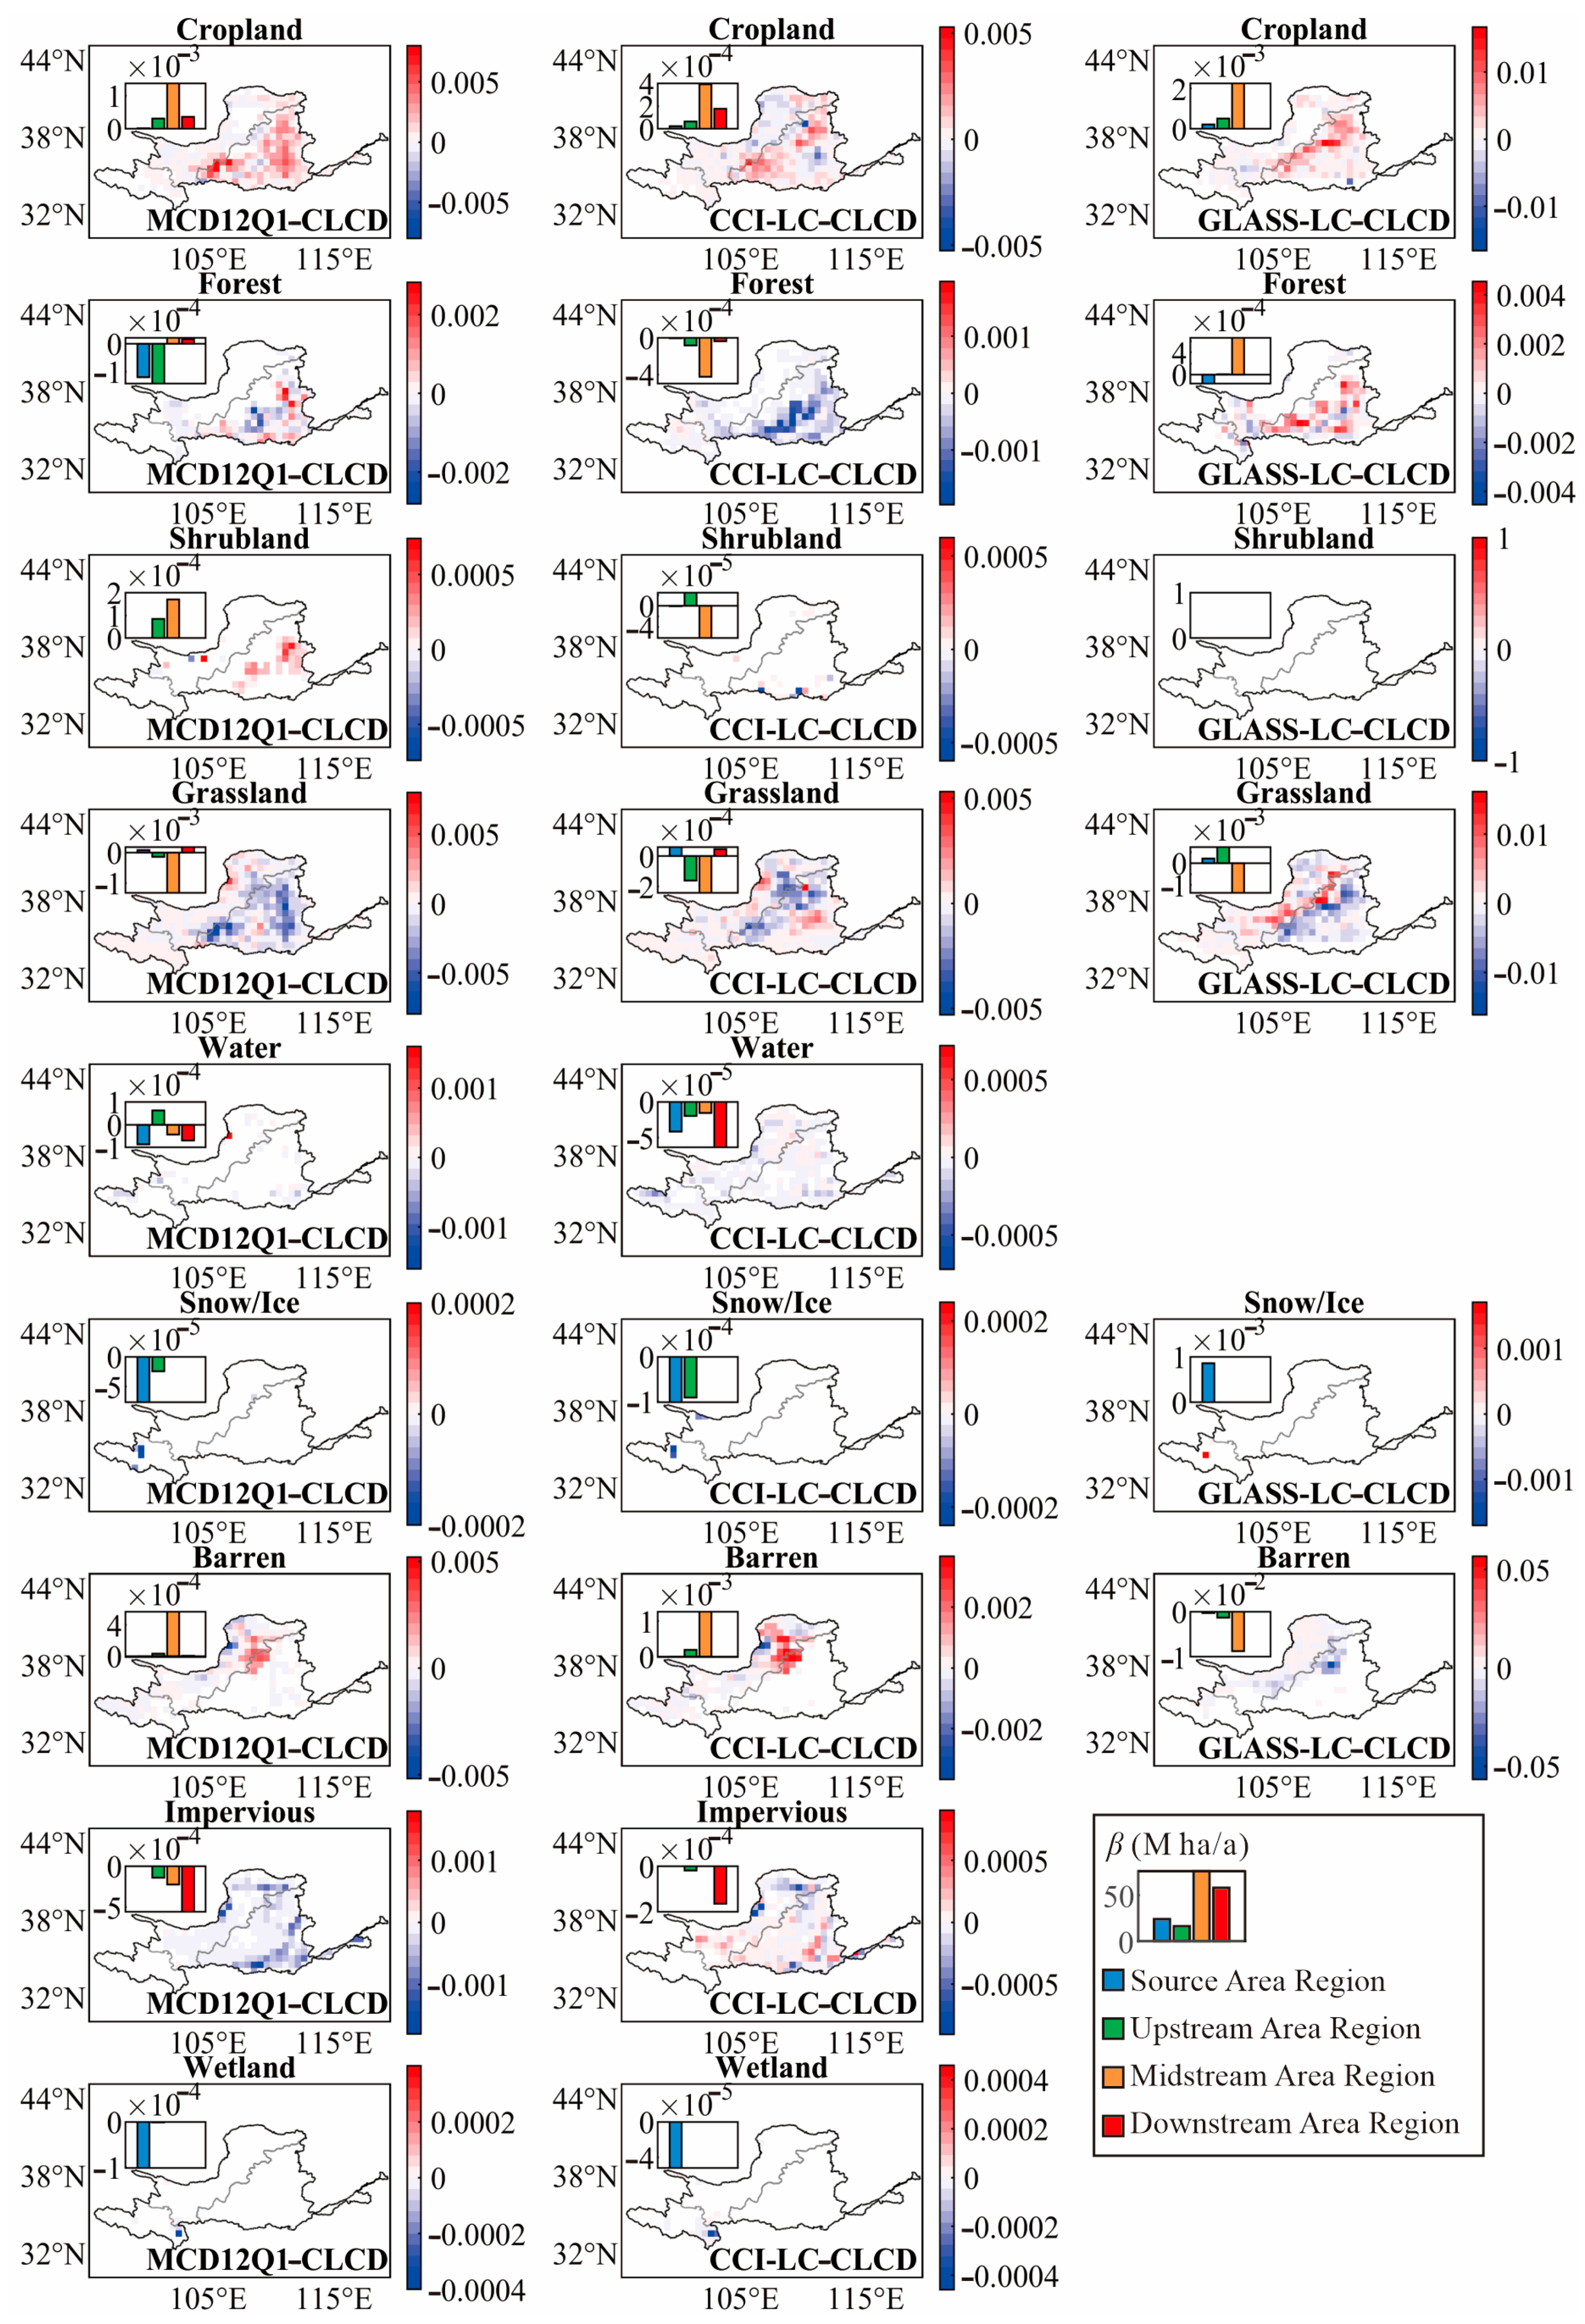
The spatial variation of the trends in area of change (β) for the main LC classes between the four datasets were mainly located in the UA and MA of the YRB (Figure 5), with a significantly large difference between the GLASS-LC and CLCD and a relatively small difference between the CCI-LC and CLCD. Further analysis revealed that the CLCD had the highest rate of grid change in terms of LC change compared to the other three datasets (Figure S3). This suggests that the spatial variation of β between the four datasets may be driven by the spatial resolution of the datasets. For the forest, water, barren, and impervious LC classes, the spatial extent of β was similar between the four datasets, varying only in magnitude (Figure S3). For example, for the forest LC class, the β between the four datasets was mainly located in the MA of the YRB; compared to the CLCD, the MCD12Q1 had a higher β in the SA and UA and a lower β in the MA and DA; the CCI-LC had a lower β in the SA, UA, MA, and DA; and the GLASS-LC had a lower β in the SA and a higher β in the MA. However, for the cropland, shrubland, grassland, snow/ice and wetland LC classes, the spatial variation of β between the four datasets was significant in both spatial extent and magnitude.
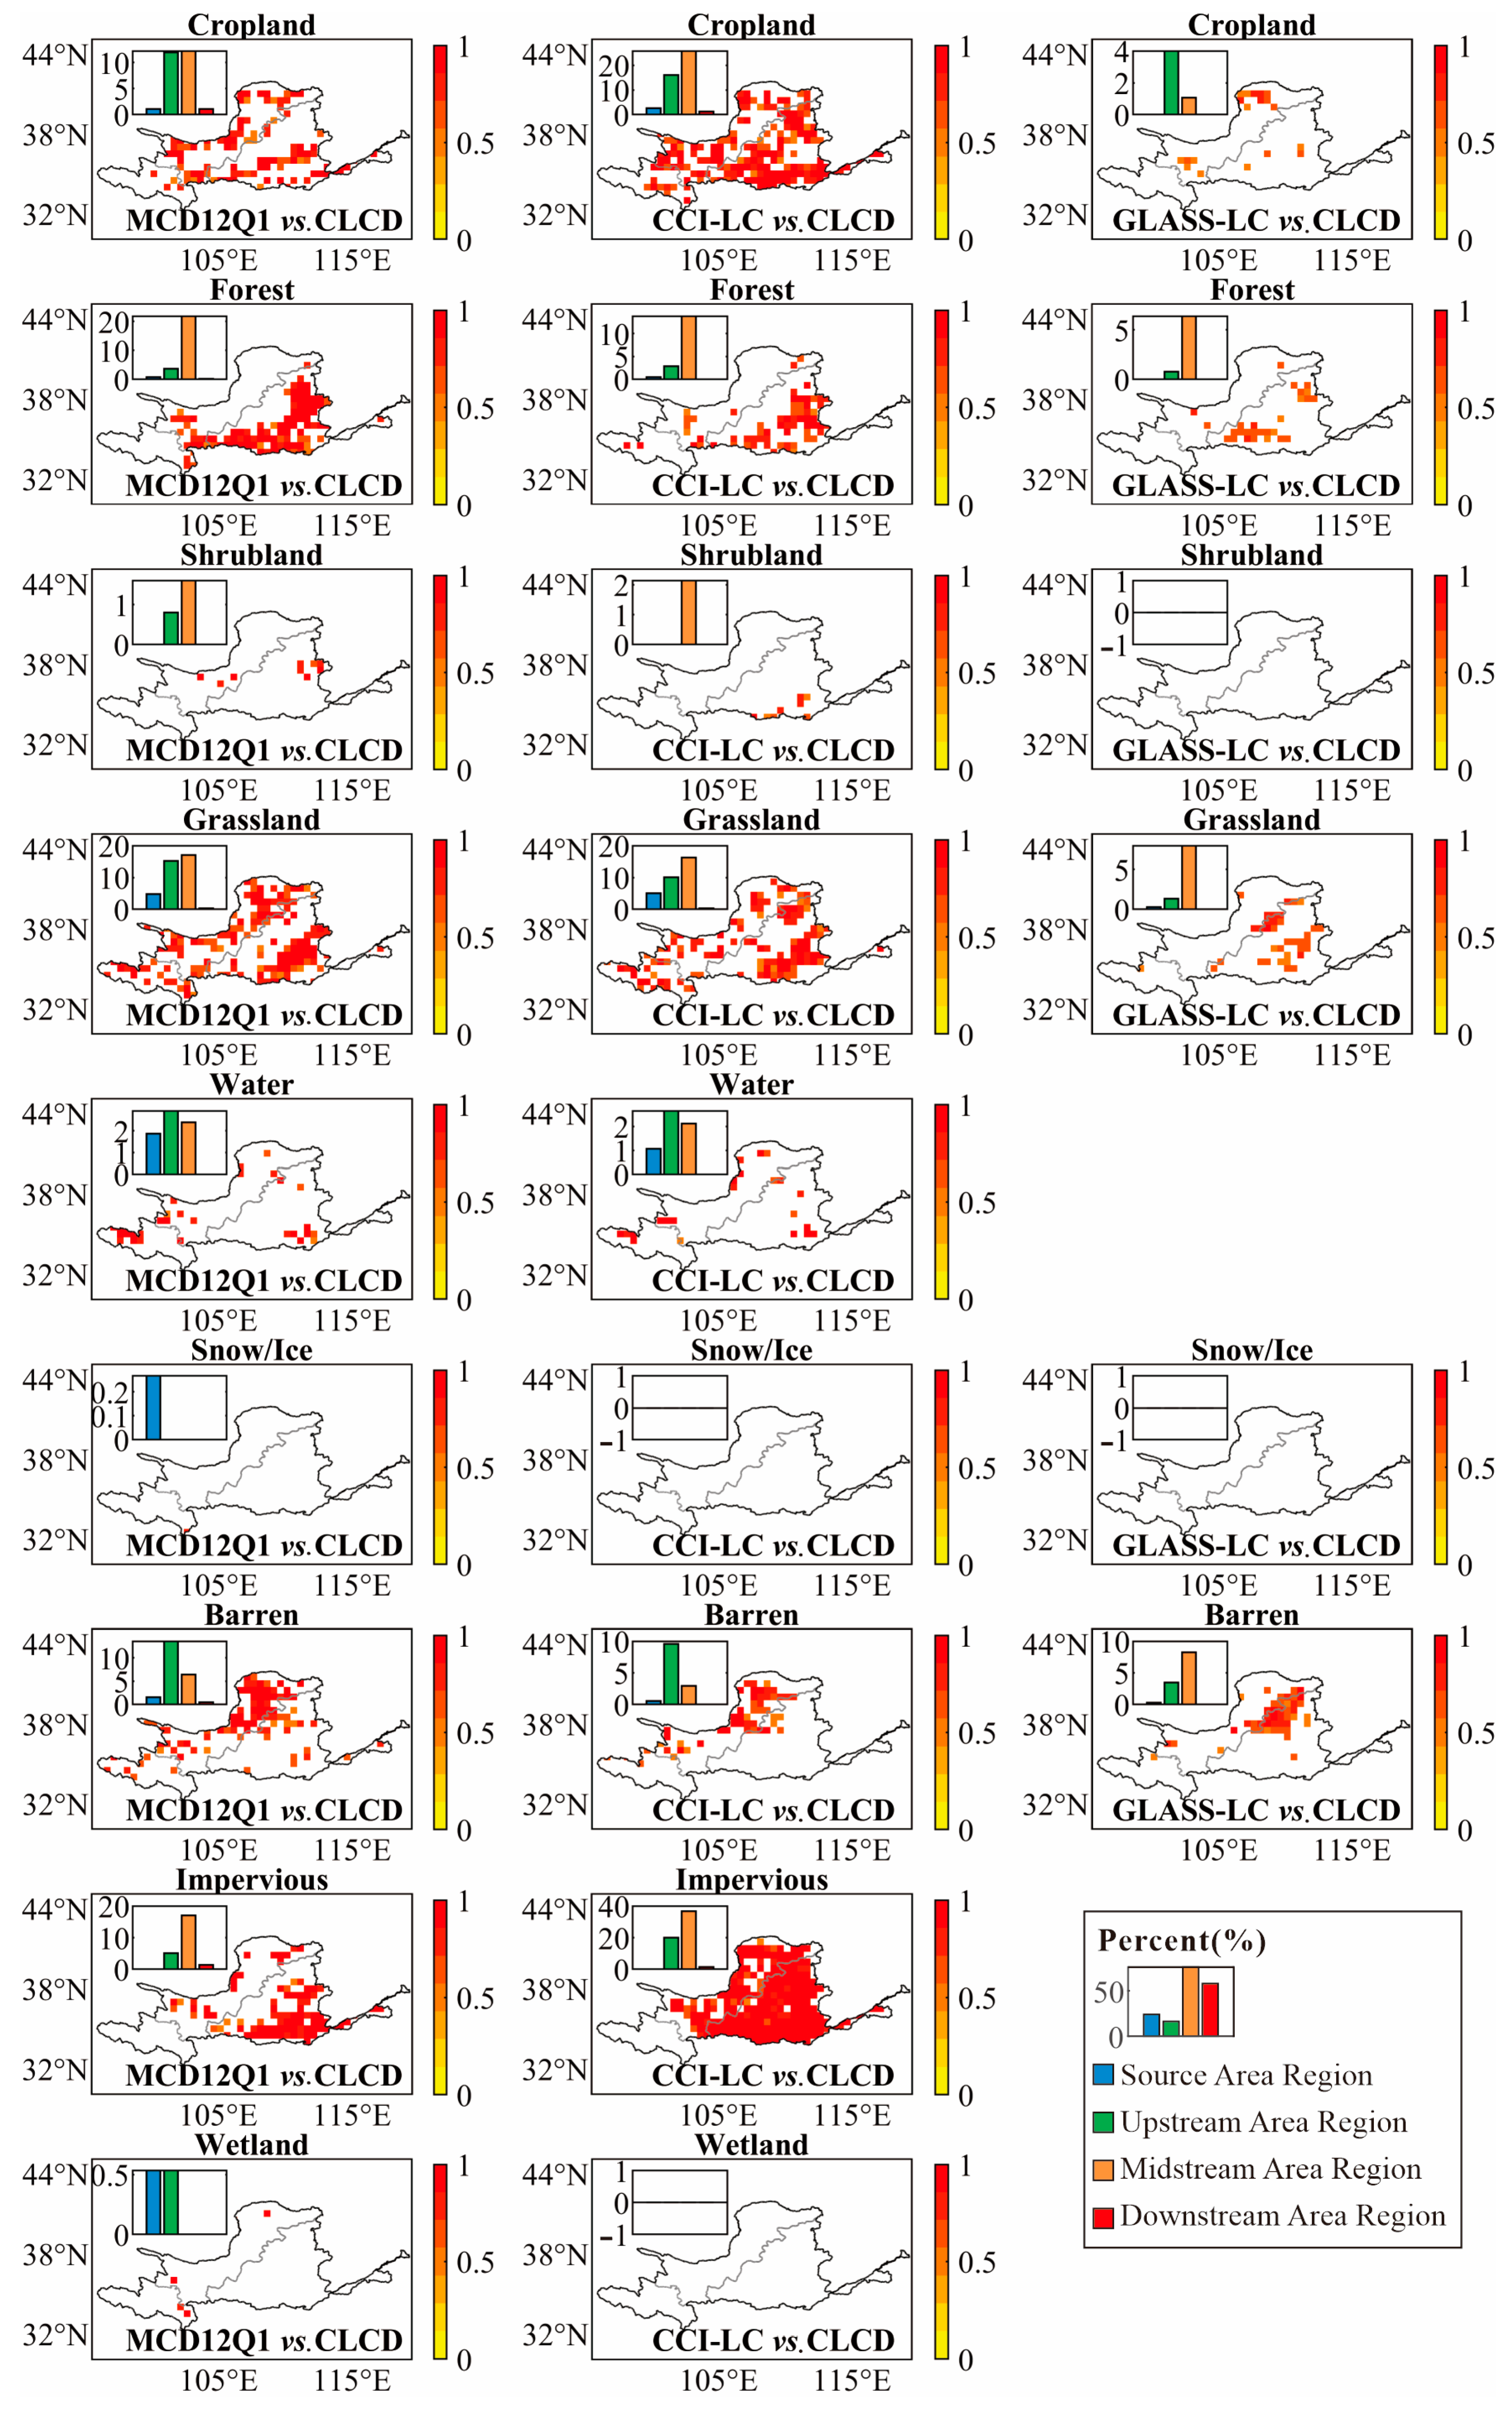
Correlation maps (R > 0, p < 0.05) were used to illustrate the spatial agreement in the area of change for nine LC classes between the four datasets in the YRB from 2001 to 2015 (Figure 6). In general, the correlation between the four datasets was higher in the UA and MA of the YRB than that of other watersheds, but there were still differences in their values. Figure 6 also showed that the spatial distribution of the correlation for the main LC classes was highest between the CCI-LC and CLCD, followed by the MCD12Q1, and lowest between the GLASS-LC and CLCD. These results suggest that the CCI-LC and CLCD had the highest spatial agreement, followed by the MCD12Q1, while the GLASS-LC and CLCD had the lowest spatial agreement.

3.3. Source of Errors

Error maps were used to illustrate the spatial variation of the total errors for nine LC classes between the four datasets in the YRB from 2001 to 2015 (Figure S4). In general, the spatial distribution of the total errors for the main LC classes between the four datasets was similar, mainly located in the UA and MA of the YRB. With the CLCD as the reference dataset (Figure S4), the total errors for the nine LC classes between the CCI-LC and MCD12Q1 were relatively small (0.0060 and 0.0069, respectively), while the GLASS-LC had the largest total error (0.0454). For the cropland, forest, grassland, barren, and impervious LC classes, the spatial extent of the total error was similar between the CCI-LC, MCD12Q1, and CLCD, while the total error between the GLASS-LC and CLCD was higher in the SA and UA. For the shrubland, water, snow/ice, and wetland LC classes, the spatial variation of the total error was probably due to the difference in classification strategies between the CCI-LC, MCD12Q1, and CLCD.
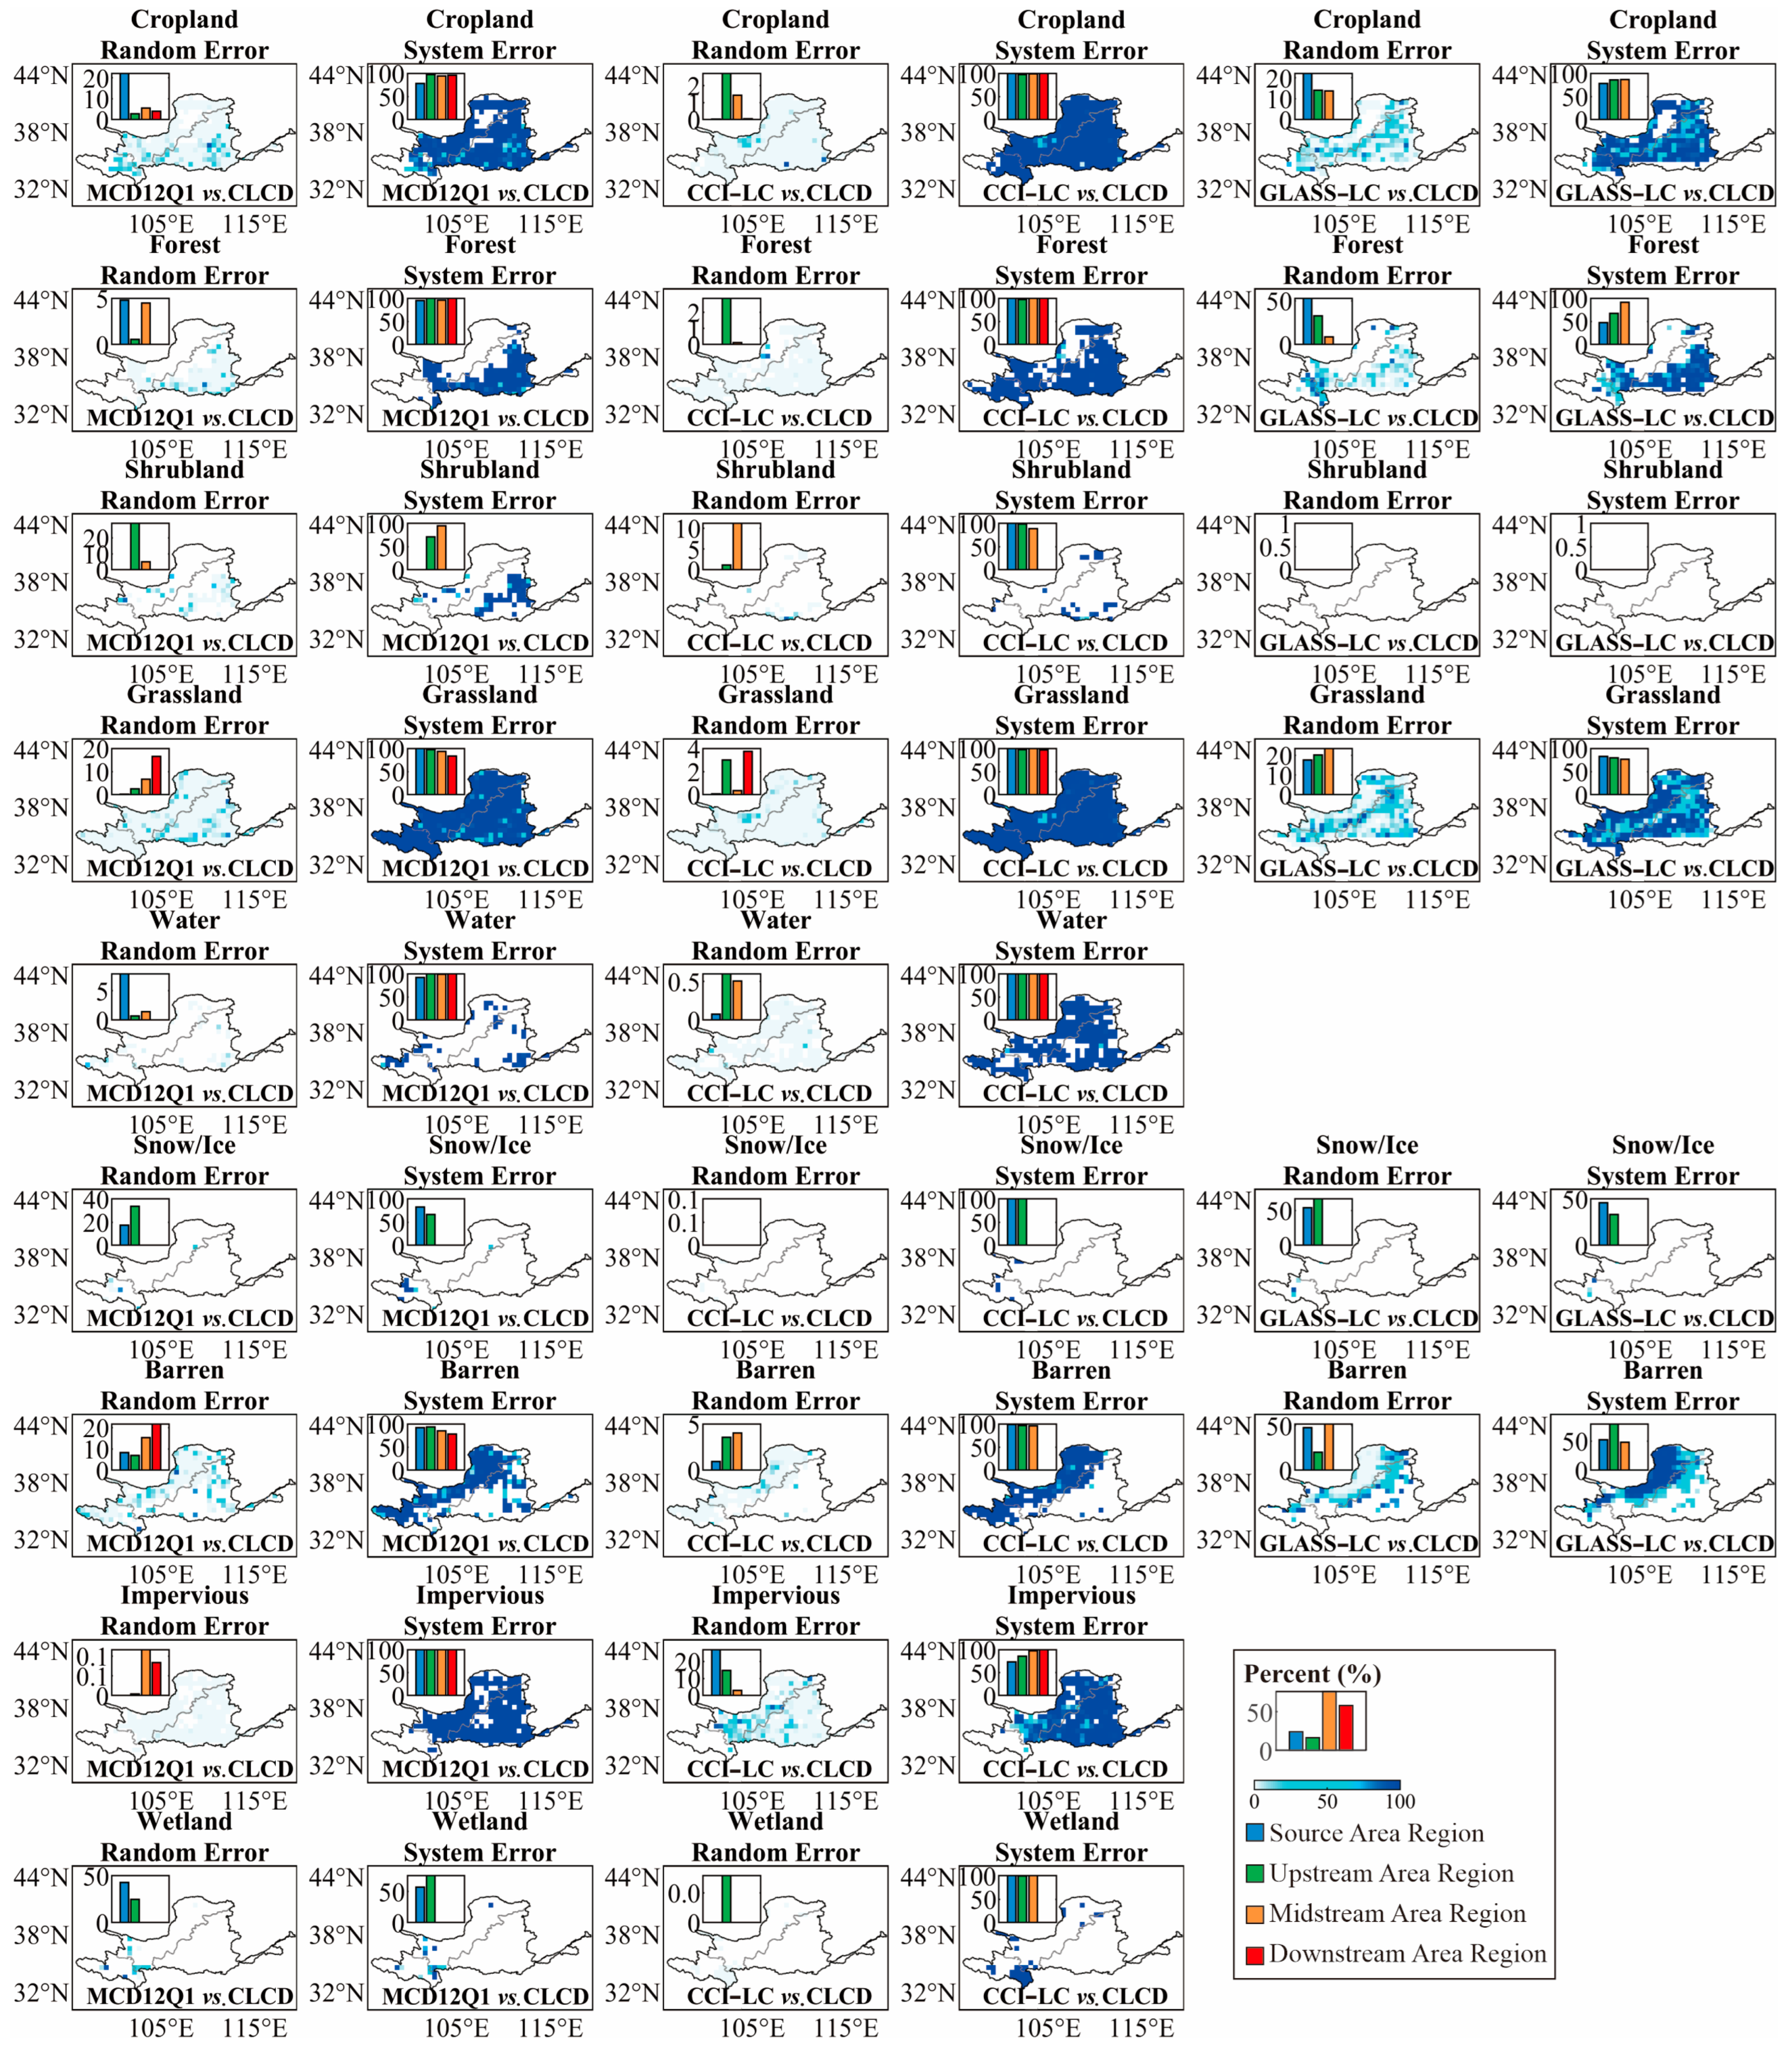
Pairs of error maps were used to illustrate the spatial variation of the percentage of random and systematic error for nine LC classes between the four datasets in the YRB from 2001 to 2015 (Figure 7). In general, the percentage of systematic error was the source of error for the main LC classes between the MCD12Q1, CCI-LC, and the GLASS-LC reference CLCD, with the CCI-LC reference CLCD having the highest value and the GLASS-LC reference CLCD having the lowest. For cropland, forest, grassland, and barren areas, with the CLCD as the reference dataset, the percentage of random error for the CCI-LC was high in the UA, while for the MCD12Q1 it was high in the DA and for the GLASS-LC it was high in the SA. For shrubland, water, snow/ice, impervious, and wetland areas, the percentage of random error for both the CCI-LC and MCD12Q1 was high in the SA and UA with the CLCD as the reference dataset.

3.4. Landscape Diversity vs. Agreement and Total Errors

The spatial distribution of landscape diversity (H) in the YRB was shown in Figure S5. In terms of elevation (Figure S5a), H was high in the lower (0.5–1.0 km) and middle (1.0–3.5 km) mountain regions of the YRB. In terms of watershed (Figure S5b), the highest H was found in the MA of the YRB, followed by the UA, while the lowest H was found in the SA and DA. In terms of landscape, the highest H was found in the Loess Plateau region (roughly in the MA and UA of the YRB).
A boxplot was used to show the variation in spatial agreement (R > 0, p < 0.05) and the total errors in landscape diversity (H) for nine LC classes between the four datasets in the YRB (Figure 8). Regarding spatial agreement, it was notable that the spatial agreement (median value) increased with H for the cropland, forest, grassland, barren, and impervious LC classes between the four datasets (Figure 8, left panel). This suggests that landscape heterogeneity may influence the spatial agreement between the four datasets. However, the relationships between spatial agreement and H were not available for shrubland, water, snow/ice, and wetland because these LC classes were found only in specific regions and covered small areas. It should be noted that the spatial agreement for the forest LC class first tended to decrease and then to increase with H between the four datasets, which may be explained by the implementation of ecological projects such as the “Grain to Green” project. Regarding the total errors, it was evident that the total error (median) tended to increase with H for the cropland, forest, grassland, barren, and impervious LC classes between the four datasets (Figure 8, right panel). This suggests that landscape heterogeneity clearly influences the spatial variation of the total errors between the four LC datasets, and thus the increase in landscape heterogeneity could lead to more uncertainty for the main LC classes. However, the relationships between the spatial distribution of the total error and H were not available for shrubland, water, snow/ice, and wetland because these LC classes were only located in specific regions and covered small areas.

4. Discussion

4.1. Comparison of Various Datasets

All the LC datasets are simulations and characterizations of LC, but the magnitude and trends in area of change estimated by different LC datasets vary considerably from study to study [33,34,35,71]. One of the main reasons for this is that the accuracy of the datasets used in previous studies has not been carefully assessed. Therefore, comparing LC datasets from various sources helps to assess the applicability of LC datasets and provides further implications for improving the assessment accuracy of LC datasets [35].
In this study, the annual LC change process was gradual in the YRB from 2001 to 2015 (Figure 3), and the temporal agreement in area estimates of change was significant between the four datasets for the forest, water, impervious, and barren LC classes. The most striking finding was that the area of cropland estimated in the CLCD and CCI-LC continued to decrease from 2001 to 2015, while that estimated in the MCD12Q1 and GLASS-LC continued to increase. Since the implementation of ecological projects, such as “Grain to Green” in 1999 [47,49,50,72], the land system in the YRB has shifted from cropland to natural ecosystems such as forest and grassland, and the provision of ecosystem services has increased. However, the trend in area of change estimated in the MCD12Q1 and GLASS-LC for cropland contradicts the “Grain to Green” process in the YRB. With the CLCD as the reference dataset (Figure 4), the area of change estimated in the MCD12Q1 showed the highest temporal agreement for specific forest, water, barren, impervious, and wetland areas, but that estimated in the CCI-LC showed the highest temporal agreement when all nine LC classes were averaged. However, Yang et al. [58] assessed the accuracy of classification between the CLCD, MCD12Q1, and CCI-LC based on the reference dataset from the Geo-Wiki test samples in China, and showed that the overall accuracy of classification in the MCD12Q1 is second only to that in the CLCD and is better than that in the CCI-LC. These results suggest that it is not acceptable to assess the accuracy of the annual LC dataset for a single year or for only a part of the time series period.
The spatial distribution of area estimates in the grid (0.5° × 0.5°) was similar for the main LC classes (i.e., cropland, forest, grassland, barren, and impervious) between the four datasets (Figure S1), but there was significant spatial variation of the trend in area estimates of change (Figure S2). Further analysis showed that the spatial variation of the trend in area estimates of change for the main LC classes between the four datasets was mainly located in the UA and MA. This agreed with the spatial distribution of the total errors between the four datasets (Figure S4). In addition, Figure 7 showed that systematic error was dominant for the main LC classes in the YRB. These results suggest that the spatial variations of the trend in area estimates of change for the main classes between the four datasets may be related to a model (e.g., a linear regression model) and can be corrected [73]. However, for the classes covering only small areas (such as shrubland, water, snow/ice, and wetland), the coarse resolution LC datasets were not suitable for further analysis.

4.2. Potential Source of Errors

Different satellite platforms, sensors, data resolutions, classification schemes, and landscape heterogeneity [34,35,38] can introduce errors into the LC dataset and propagate to affect the area estimation and simulation of the global environment [38,74,75,76]. In this study, the potential source of errors may stem from the classification schemes, pixel counting method, the landscape heterogeneity, the reference dataset, the spatial resolution of the dataset, and the spatial assessment unit.

4.2.1. Classification Scheme

To compare various LC datasets with different classification schemes, datasets with detailed classes are often transformed into a generalized scheme with fewer classes [33,34]. In this study, we used the classification scheme of the CLCD as the target classification scheme (Table 1), and reclassified the MCD12Q1 (IGBP, 17 classes), CCI-LC (LCCS, 22 classes) and GLASS-LC (7 classes) into nine classes (Tables S1–S3). As both the MCD12Q1 and CCI-LC used detailed forest and mosaic classifications, the effect of misclassification and missing data from the reclassification cannot be ignored [34,35,36]. For example, the significant spatial difference in the area estimates for forest, cropland, and grassland areas between the four datasets was partly due to the effect of misclassification and missing data. As there are 19 LC classification schemes worldwide [77] and the class definitions are not continuous, efforts are needed to derive a universal classification scheme with a unique class definition [34].

4.2.2. Pixel Counting Method

The pixel counting method is a simple way of calculating an area by determining the number of pixels assigned to an LC class and multiplying this number by the area of a pixel to obtain the area of the LC class. This method has been widely used in remote sensing studies in its simplest form, but it is also known to be biased due to the effects of commission and the omission errors [73,76,78,79]. In this study, the trend in area of change for cropland estimated in the CLCD and CCI-LC was different from that estimated in the MCD12Q1 and GLASS-LC (Figure 3 and Figure S6), and the total errors between the four datasets were significant in the YRB (Figure S7). This confirmed that area estimation by the simple pixel counting method was biased. As shown in Figure 7, the dominant systematic error components suggested that the errors could be corrected and reduced. Calibration using confusion matrices or regression was the recommended approach to reduce the errors in area estimation [38,73,76,79]. Therefore, the pixel counting method does introduce errors into the area estimates of the LC class, and consideration should be given to reducing or eliminating the bias.

4.2.3. Landscape Heterogeneity

Landscape heterogeneity can affect map accuracy and area estimation and introduce errors into LC datasets [73,80,81]. In general, the landscape heterogeneity increases the complexity of the ground, making it difficult for the satellite to distinguish the ground spectral information [80]. This results in a decrease in the map accuracy of LC and an increase in the errors of LC with landscape heterogeneity (or fragmentation), especially for the coarse resolution datasets [79,81]. In the YRB, due to the combined effects of climate change, geomorphology, and human activity [72,82], the landscape heterogeneity is high in the Loess Plateau region (roughly in the UA and MA of the YRB; Figure S5). The total error was also high for the main LC classes in the UA and MA (Figure S4) and increased with landscape heterogeneity (Figure 8). This confirmed that the hilly and gully landscape of the Loess Plateau, which increased landscape heterogeneity [36], influenced the spatial variation of the total error (especially the percentage of systematic error) between various annual LC datasets. It is worth noting that the spatial agreement of the trend in area estimates of change for the main LC classes between the four datasets was also high in the UA and MA (Figure 6). This suggested that the area estimates of change for the main LC classes were highly correlated, and that a calibration method incorporating landscape heterogeneity held the promise of reducing errors.

4.2.4. Reference Dataset

The quality of the reference dataset was another important factor affecting the assessment accuracy and area estimation of LC datasets [38,76,83,84,85,86]. As the accuracy of the current annual LC datasets provided by the data producers were based on different reference datasets, it is difficult to determine which LC datasets have the highest accuracy and are suitable for use in a specific study area in China [34]. In addition, the lack of reference datasets with annual temporal resolution may also reduce confidence in the accuracy of the annual LC datasets [84]. In this study, since a high-quality annual reference dataset of the YRB was not available, the CLCD dataset was selected as the reference dataset (Table 1). According to previous studies [32,38], it is acceptable that the CLCD could provide more accurate information about the LC class, as it had the highest spatial resolution (30 m) of the four annual LC datasets. However, there are problems to be noted with this choice of reference dataset. On the one hand, the CLCD dataset had a classification scheme of only nine classes which means that detailed information about the LC dataset is lost [34]. Several classes need to be expanded such as (1) irrigated croplands and rainfed croplands, rather than cropland, and (2) evergreen needleleaf forests, evergreen broadleaf forests, deciduous needleleaf forests, deciduous broadleaf forests, and mixed forests, rather than forest. Furthermore, the overall accuracy of the CLCD was 79.31%, according to the data producer [58], which is lower than the accuracy of 85% recommended by previous studies [38,76,83,84]. This may reduce confidence in the results derived from this study.

4.2.5. Spatial Resolution of Dataset

The spatial resolution of the LC dataset can also affect the assessment accuracy and area estimation of LC datasets [38,73]. On the one hand, the spatial resolution of a dataset can affect the spatial errors of a dataset. In general, it is accepted that a high-resolution dataset provides fewer spatial errors compared to a coarse resolution dataset [34,39]. This was confirmed by the results showing higher total errors in the GLASS-GLC compared to the CCI-LC and MCD12Q1 (with the CLCD as the reference dataset) (Figure 8 and Figure S4). On the other hand, the spatial resolution of a dataset affects the occurrence of mixed pixels, which affects the area estimates [73,80]. Generally, the number of mixed pixels was considered to result from the combined effect of the spatial resolution and spatial patterns of a class in the landscape, and the number of mixed pixels was expected to decrease as the spatial resolution increased [80]. In addition, the area estimate was expected to be close to the true area value. This was confirmed by the results showing that the area estimates of the CCI-LC and MCD12Q1 were close to that of the CLCD compared to that of the GLASS-LC (Figure 3 and Figure 4). It should be noted that, as a trade-off between the within-class variability and the boundary effect, assessment accuracy does not always increase with spatial resolution [80,87]. A finer resolution could lead to higher within-class variances, resulting in higher classification errors and variance in the LC class area estimates. Therefore, the errors associated with any LC dataset should be carefully evaluated to ensure that the quality of the LC dataset meets a specific user-defined target.

4.2.6. Spatial Assessment Unit

The spatial unit that serves as the basis for the location-specific comparison of the reference classification and the map classification can be a pixel, a polygon, or a block [38,76,88]. In this study, since the spatial resolution of these datasets varies from 300 m to 4 km, we had to resample the dataset before performing a pixel-to-pixel comparison. To avoid any misclassification introduced by the resampling method, we used a 0.5° × 0.5° grid (roughly equivalent to a “block”) instead of a pixel as the basic spatial assessment unit (Section 2), and calculated the area estimates of the LC classes in each grid (0.5° × 0.5°) using the pixel counting method. We also calculated the area estimates in the watershed and in the entire YRB (roughly equivalent to a “polygon”). The choice of spatial assessment unit can affect the calculation of the metrics used in this study, such as landscape heterogeneity (Section 2). As mentioned in Section 4.2.3, an increase in landscape heterogeneity can lead to a decrease in the map accuracy of LC and an increase in the errors of LC [79,81], so the relationship between the spatial assessment unit and landscape heterogeneity was essential to reveal the effect of the spatial assessment unit on the map accuracy and the area estimates of the LC classes. In this study, the landscape diversity of the YRB was 1.1343, and that of the grids in the YRB was 0.6223 ± 0.3381 (mean ± std.) (Figure S5). The landscape heterogeneity decreased as the size of the spatial assessment unit changed from a “polygon” (large) to a “block” (small). This was similar to the results of a previous study [88]. This suggests that the map accuracy is expected to increase as the size of the spatial assessment unit decreases, possibly due to the change in within-class variances. However, as mentioned in Section 4.2.5, the trade-off between the within-class variability and the boundary effect together determines the map accuracy. We could not assert that the map accuracy always increases as the size of the spatial assessment unit decreases. The relationship between spatial assessment unit, landscape heterogeneity, and classification accuracy needs further investigation.

4.3. Implications for Ecosystem Services Valuation

Understanding land change processes has been shown to be critical in addressing the current policy challenges related to land use and sustainability solutions [89]. The accurate valuation of ecosystem service values (ESV) based on LC is a tool for raising public awareness of natural resource scarcity and informing policy decisions [90]. A recent global valuation of ESV based on various LC datasets showed that different inputs of LC data resulted in an ESV ranging from USD 35.0 to 56.5 trillion/a [91]. This suggests that the inputs of LC data have a significant impact on the valuation of ESV. In this study, we found significant temporal and spatial variation in trends in area of change for the main LC classes between various LC datasets in the YRB (Figure 3 and Figure S4). Ignoring such variation will inevitably lead to divergent results in ESV, which in turn will hamper the land policy-making process. Therefore, policy makers need to fully consider the impact of the input of LC data from various datasets on the valuation of ESV in land policy making.

5. Conclusions

The purpose of this study is to investigate the spatial and temporal agreement and the source of error for nine LC classes between four annual datasets, i.e., the CLCD, MCD12Q1, CCI-LC, and GLASS-LC, in the YRB from 2001 to 2015. We compared the spatial and temporal agreement between the four annual LC datasets. The results showed that in the YRB, the main LC classes were grassland and cropland among the four datasets, and that the temporal trend in area of change for the main LC classes was mainly gradual. However, the temporal trends in area of change for the main LC classes differed between the four datasets. The highest temporal agreement was found in the CCI-LC reference CLCD, followed by the MCD12Q1, while the lowest temporal agreement was found in the GLASS-LC reference CLCD. Although the spatial distribution in area for the main LC classes was largely similar between the four datasets, there was significant spatial variation in the trends in area of change in the YRB. Spatial variation in area for the cropland, forest, grassland, barren, and impervious LC classes was mainly located in the UA and MA of YRB. High percentages of systematic error for the main LC classes were also located in the UA and MA, suggesting that the spatial variation in area between the four datasets may be related to some function, and that such spatial variation can be reduced mathematically. The relationship between landscape heterogeneity and the total error suggests that the spatial agreement between the annual LC datasets can be expected to improve as landscape heterogeneity is incorporated into further calibration algorithms. Future research should focus not only on the development of annual LC validation sample collections, but also on comparative studies between various annual LC datasets, taking into account scale effects on spatial and temporal agreement and sources of error. These results not only improve our understanding of the spatial and temporal agreement and sources of error between the various current annual LC datasets, but also provide support for land policy making in the YRB.

Supplementary Materials

The following supporting information can be downloaded at: https://www.mdpi.com/article/10.3390/rs15102539/s1, Figure S1: Comparison of the spatial distribution of the 15-year (2001–2015) mean area (M ha) for nine LC classes between the four datasets in the YRB; Figure S2: Comparison of the spatial variation of the 15-year (2001–2015) mean area (M ha) for nine LC classes between the four datasets in the YRB; Figure S3: Comparison of the Sen’s slope estimate (β, M ha/a) in area of change for nine LC classes in four datasets in the YRB from 2001 to 2015; Figure S4: Comparison of the spatial variation of the total errors for nine LC classes between the four datasets in the YRB from 2001 to 2015; Figure S5: Spatial distribution of landscape diversity (H) in the YRB and its distribution characteristics with (a) elevation and (b) watershed division; Figure S6: Comparison of the Sen’s slope estimate (β, M ha/a) in area of change for Cropland in 4 datasets in the YRB from 2001 to 2015. Figure S7: Comparison of the spatial variation of the total error for Cropland between the 4 datasets in the YRB from 2001 to 2015. Table S1: MCD12Q1 classification scheme [53,54,55] and reclassification scheme used in this study; Table S2: CCI-LC classification scheme [56] and reclassification scheme for this study; Table S3: GLASS-GLC classification scheme [57] and reclassification scheme used in this study.

Author Contributions

Conceptualization, B.L.; methodology, B.L.; software, B.L.; validation, B.L. and Y.S.; formal analysis, Z.Z., L.P. and M.X.; investigation, S.J.; data curation, Y.S.; writing—original draft preparation, B.L.; writing—review and editing, B.L., L.P. and Z.Z.; visualization, S.J.; supervision, J.L.; project administration, X.G. and J.L.; funding acquisition, X.G., J.L. and Z.Z. All authors have read and agreed to the published version of the manuscript.

Funding

This research was funded by the Joint Research on Ecological Conservation and High-Quality Development of the Yellow River Basin program (2022-YRUC-01-0102) and the National Natural Science Foundation of China (42101266).

Data Availability Statement

The data presented in this study are available upon request from the corresponding authors.

Acknowledgments

We acknowledge the data support from “Geographic Data Sharing Infrastructure, Geographic Data Sharing Infrastructure, Resource and Environment Science and Data Center” (http://www.resdc.cn, accessed on 15 January 2023). We thank Yang Guo from Zhejiang University City College for the comments and advice on the manuscript.

Conflicts of Interest

The authors declare no conflict of interest.

Abbreviations

LC, land cover; YRB, yellow river basin; SA, source area region; UA, upstream area region; MA, midstream area region; DA, downstream area region; MCD12Q1, Moderate Resolution Imaging Spectroradiometer Land Cover Dataset; CCI-LC, ESA Climate Change Initiative Land Cover Dataset; GLASS-GLC, Global Land Surface Satellite Global Land Cover Dataset; CLCD, China Landsat-derived Annual Land Cover Dataset; ESV, ecosystem services values; H, landscape diversity; β, Sen’s slope estimate; S, Mann–Kendall test statistic; R, correlation coefficient; E’, centered root-mean-square-error; σ, standard deviation.

References

  1. Babbar, D.; Areendran, G.; Sahana, M.; Sarma, K.; Raj, K.; Sivadas, A. Assessment and prediction of carbon sequestration using Markov chain and InVEST model in Sariska Tiger Reserve, India. J. Clean. Prod. 2021, 278, 123333. [Google Scholar] [CrossRef]
  2. Gasser, T.; Crepin, L.; Quilcaille, Y.; Houghton, R.A.; Ciais, P.; Obersteiner, M. Historical CO 2emissions from land use and land cover change and their uncertainty. Biogeosciences 2020, 17, 4075–4101. [Google Scholar] [CrossRef]
  3. Tran, D.X.; Pla, F.; Latorre-Carmona, P.; Myint, S.W.; Caetano, M.; Kieu, H.V. Characterizing the relationship between land use land cover change and land surface temperature. ISPRS J. Photogramm. Remote Sens. 2017, 124, 119–132. [Google Scholar] [CrossRef]
  4. Kafy, A.A.; Rahman, M.S.; Faisal, A.A.; Hasan, M.M.; Islam, M. Modelling future land use land cover changes and their impacts on land surface temperatures in Rajshahi, Bangladesh. Remote Sens. Appl. Soc. Environ. 2020, 18, 100314. [Google Scholar] [CrossRef]
  5. Aghsaei, H.; Mobarghaee Dinan, N.; Moridi, A.; Asadolahi, Z.; Delavar, M.; Fohrer, N.; Wagner, P.D. Effects of dynamic land use/land cover change on water resources and sediment yield in the Anzali wetland catchment, Gilan, Iran. Sci. Total Environ. 2020, 712, 136449. [Google Scholar] [CrossRef] [PubMed]
  6. Mello, K.D.; Taniwaki, R.H.; Paula, F.R.D.; Valente, R.A.; Randhir, T.O.; Macedo, D.R.; Leal, C.G.; Rodrigues, C.B.; Hughes, R.M. Multiscale land use impacts on water quality: Assessment, planning, and future perspectives in Brazil. J. Environ. Manag. 2020, 270, 110879. [Google Scholar] [CrossRef] [PubMed]
  7. Newbold, T.; Hudson, L.N.; Hill, S.L.L.; Contu, S.; Lysenko, I.; Senior, R.A.; Börger, L.; Bennett, D.J.; Choimes, A.; Collen, B.; et al. Global effects of land use on local terrestrial biodiversity. Nature 2015, 520, 45–50. [Google Scholar] [CrossRef]
  8. Randin, C.F.; Ashcroft, M.B.; Bolliger, J.; Cavender-Bares, J.; Coops, N.C.; Dullinger, S.; Dirnböck, T.; Eckert, S.; Ellis, E.; Fernández, N.; et al. Monitoring biodiversity in the Anthropocene using remote sensing in species distribution models. Remote Sens. Environ. 2020, 239, 111626. [Google Scholar] [CrossRef]
  9. IPBES. Global Assessment Report on Biodiversity and Ecosystem Services of the Intergovernmental Science-Policy Platform on Biodiversity and Ecosystem Services; IPBES Secretariat: Bonn, Germany, 2019; p. 1148. [Google Scholar]
  10. Chen, W.; Zhao, H.; Li, J.; Zhu, L.; Wang, Z.; Zeng, J. Land use transitions and the associated impacts on ecosystem services in the Middle Reaches of the Yangtze River Economic Belt in China based on the geo-informatic Tupu method. Sci. Total Environ. 2020, 701, 134690. [Google Scholar] [CrossRef]
  11. Meyfroidt, P.; de Bremond, A.; Ryan, C.M.; Archer, E.; Aspinall, R.; Chhabra, A.; Camara, G.; Corbera, E.; DeFries, R.; Díaz, S.; et al. Ten facts about land systems for sustainability. Proc. Natl. Acad. Sci. USA 2022, 119, e2109217118. [Google Scholar] [CrossRef]
  12. Estoque, R.C. A Review of the Sustainability Concept and the State of SDG Monitoring Using Remote Sensing. Remote Sens. 2020, 12, 1770. [Google Scholar] [CrossRef]
  13. Tamiminia, H.; Salehi, B.; Mahdianpari, M.; Quackenbush, L.; Adeli, S.; Brisco, B. Google Earth Engine for geo-big data applications: A meta-analysis and systematic review. Isprs J. Photogramm. Remote Sens. 2020, 164, 152–170. [Google Scholar] [CrossRef]
  14. Amani, M.; Ghorbanian, A.; Ahmadi, S.A.; Kakooei, M.; Moghimi, A.; Mirmazloumi, S.M.; Moghaddam, S.H.A.; Mahdavi, S.; Ghahremanloo, M.; Parsian, S.; et al. Google Earth Engine Cloud Computing Platform for Remote Sensing Big Data Applications: A Comprehensive Review. IEEE J. Sel. Top. Appl. Earth Obs. Remote Sens. 2020, 13, 5326–5350. [Google Scholar] [CrossRef]
  15. Noi Phan, T.; Kuch, V.; Lehnert, L.W. Land cover classification using google earth engine and random forest classifier-the role of image composition. Remote Sens. 2020, 12, 2411. [Google Scholar] [CrossRef]
  16. Brown, J.F.; Tollerud, H.J.; Barber, C.P.; Zhou, Q.; Dwyer, J.L.; Vogelmann, J.E.; Loveland, T.R.; Woodcock, C.E.; Stehman, S.V.; Zhu, Z.; et al. Lessons learned implementing an operational continuous United States national land change monitoring capability: The Land Change Monitoring, Assessment, and Projection (LCMAP) approach. Remote Sens. Environ. 2020, 238, 111356. [Google Scholar] [CrossRef]
  17. Potapov, P.; Hansen, M.C.; Kommareddy, I.; Kommareddy, A.; Turubanova, S.; Pickens, A.; Adusei, B.; Tyukavina, A.; Ying, Q. Landsat Analysis Ready Data for Global Land Cover and Land Cover Change Mapping. Remote Sens. 2020, 12, 426. [Google Scholar] [CrossRef]
  18. Phiri, D.; Simwanda, M.; Salekin, S.; Nyirenda, V.R.; Murayama, Y.; Ranagalage, M. Sentinel-2 data for land cover/use mapping: A review. Remote Sens. 2020, 12, 2291. [Google Scholar] [CrossRef]
  19. Chaves, M.E.D.; Picoli, M.C.A.; Sanches, I.D. Recent applications of Landsat 8/OLI and Sentinel-2/MSI for land use and land cover mapping: A systematic review. Remote Sens. 2020, 12, 3062. [Google Scholar] [CrossRef]
  20. Homer, C.; Dewitz, J.; Jin, S.; Xian, G.; Costello, C.; Danielson, P.; Gass, L.; Funk, M.; Wickham, J.; Stehman, S.; et al. Conterminous United States land cover change patterns 2001–2016 from the 2016 National Land Cover Database. ISPRS J. Photogramm. Remote Sens. 2020, 162, 184–199. [Google Scholar] [CrossRef]
  21. Huang, H.; Chen, Y.; Clinton, N.; Wang, J.; Wang, X.; Liu, C.; Gong, P.; Yang, J.; Bai, Y.; Zheng, Y.; et al. Mapping major land cover dynamics in Beijing using all Landsat images in Google Earth Engine. Remote Sens. Environ. 2017, 202, 166–176. [Google Scholar] [CrossRef]
  22. Lambin, E.F.; Geist, H.J.; Lepers, E. Dynamics of Land-Use and Land-Cover Change in Tropical Regions. Annu. Rev. Environ. Resour. 2003, 28, 205–241. [Google Scholar] [CrossRef]
  23. Curtis, P.G.; Slay, C.M.; Harris, N.L.; Tyukavina, A.; Hansen, M.C. Classifying drivers of global forest loss. Science 2018, 361, 1108–1111. [Google Scholar] [CrossRef] [PubMed]
  24. Plieninger, T.; Draux, H.; Fagerholm, N.; Bieling, C.; Bürgi, M.; Kizos, T.; Kuemmerle, T.; Primdahl, J.; Verburg, P.H. The driving forces of landscape change in Europe: A systematic review of the evidence. Land Use Policy 2016, 57, 204–214. [Google Scholar] [CrossRef]
  25. Jepsen, M.R.; Kuemmerle, T.; Müller, D.; Erb, K.; Verburg, P.H.; Haberl, H.; Vesterager, J.P.; Andrič, M.; Antrop, M.; Austrheim, G.; et al. Transitions in European land-management regimes between 1800 and 2010. Land Use Policy 2015, 49, 53–64. [Google Scholar] [CrossRef]
  26. Meyfroidt, P.; Roy Chowdhury, R.; de Bremond, A.; Ellis, E.C.; Erb, K.H.; Filatova, T.; Garrett, R.D.; Grove, J.M.; Heinimann, A.; Kuemmerle, T.; et al. Middle-range theories of land system change. Glob. Environ. Change 2018, 53, 52–67. [Google Scholar] [CrossRef]
  27. de Baan, L.; Alkemade, R.; Koellner, T. Land use impacts on biodiversity in LCA: A global approach. Int. J. Life Cycle Assess. 2013, 18, 1216–1230. [Google Scholar] [CrossRef]
  28. Naess, J.S.; Cavalett, O.; Cherubini, F. The land-energy-water nexus of global bioenergy potentials from abandoned cropland. Nat. Sustain. 2021, 4, 525–536. [Google Scholar] [CrossRef]
  29. Zalles, V.; Hansen, M.C.; Potapov, P.V.; Parker, D.; Stehman, S.V.; Pickens, A.H.; Parente, L.L.; Ferreira, L.G.; Song, X.P.; Hernandez-Serna, A.; et al. Rapid expansion of human impact on natural land in South America since 1985. Sci. Adv. 2021, 7, 11. [Google Scholar] [CrossRef]
  30. Rao, Y.; Zhang, J.; Wang, K.; Jepsen, M.R. Understanding land use volatility and agglomeration in northern Southeast Asia. J. Environ. Manag. 2021, 278, 111536. [Google Scholar] [CrossRef]
  31. Zhou, Q.; Li, B.; Kurban, A. Trajectory analysis of land cover change in arid environment of China. Int. J. Remote Sens. 2008, 29, 1093–1107. [Google Scholar] [CrossRef]
  32. Giri, C.; Zhu, Z.L.; Reed, B. A comparative analysis of the Global Land Cover 2000 and MODIS land cover data sets. Remote Sens. Environ. 2005, 94, 123–132. [Google Scholar] [CrossRef]
  33. Herold, M.; Mayaux, P.; Woodcock, C.E.; Baccini, A.; Schmullius, C. Some challenges in global land cover mapping: An assessment of agreement and accuracy in existing 1 km datasets. Remote Sens. Environ. 2008, 112, 2538–2556. [Google Scholar] [CrossRef]
  34. Yang, Y.; Xiao, P.; Feng, X.; Li, H. Accuracy assessment of seven global land cover datasets over China. ISPRS J. Photogramm. Remote Sens. 2017, 125, 156–173. [Google Scholar] [CrossRef]
  35. Hua, T.; Zhao, W.; Liu, Y.; Wang, S.; Yang, S. Spatial Consistency Assessments for Global Land-Cover Datasets: A Comparison among GLC2000, CCI LC, MCD12, GLOBCOVER and GLCNMO. Remote Sens. 2018, 10, 1846. [Google Scholar] [CrossRef]
  36. Sun, W.; Ding, X.; Su, J.; Mu, X.; Zhang, Y.; Gao, P.; Zhao, G. Land use and cover changes on the Loess Plateau: A comparison of six global or national land use and cover datasets. Land Use Policy 2022, 119, 106165. [Google Scholar] [CrossRef]
  37. Wang, H.; Cai, L.P.; Wen, X.J.; Fan, D.L.; Wang, Y.J. Land cover change and multiple remotely sensed datasets consistency in China. Ecosyst. Health Sustain. 2022, 8, 2040385. [Google Scholar] [CrossRef]
  38. Stehman, S.V.; Foody, G.M. Key issues in rigorous accuracy assessment of land cover products. Remote Sens. Environ. 2019, 231, 111199. [Google Scholar] [CrossRef]
  39. Franquesa, M.; Stehman, S.V.; Chuvieco, E. Assessment and characterization of sources of error impacting the accuracy of global burned area products. Remote Sens. Environ. 2022, 280, 113214. [Google Scholar] [CrossRef]
  40. Miao, C.Y.; Duan, Q.Y.; Sun, Q.H.; Li, J.D. Evaluation and application of Bayesian multi-model estimation in temperature simulations. Prog. Phys. Geogr.-Earth Environ. 2013, 37, 727–744. [Google Scholar] [CrossRef]
  41. Sun, Q.; Miao, C.; Duan, Q.; Kong, D.; Ye, A.; Di, Z.; Gong, W. Would the ‘real’ observed dataset stand up? A critical examination of eight observed gridded climate datasets for China. Environ. Res. Lett. 2014, 9, 015001. [Google Scholar] [CrossRef]
  42. Van Oort, P.A.J.; Bregt, A.K.; De Bruin, S.; De Wit, A.J.W.; Stein, A. Spatial variability in classification accuracy of agricultural crops in the Dutch national land-cover database. Int. J. Geogr. Inf. Sci. 2004, 18, 611–626. [Google Scholar] [CrossRef]
  43. Wang, H.S.; Liu, D.S.; Lin, H.; Montenegro, A.; Zhu, X.L. NDVI and vegetation phenology dynamics under the influence of sunshine duration on the Tibetan plateau. Int. J. Climatol. 2015, 35, 687–698. [Google Scholar] [CrossRef]
  44. Wen, X.; Theau, J.M. Assessment of ecosystem services in restoration programs in China: A systematic review. Ambio 2020, 49, 584–592. [Google Scholar] [CrossRef] [PubMed]
  45. Miao, C.; Ni, J.; Borthwick, A.G.L.; Yang, L. A preliminary estimate of human and natural contributions to the changes in water discharge and sediment load in the Yellow River. Glob. Planet. Chang. 2011, 76, 196–205. [Google Scholar] [CrossRef]
  46. Wang, Q.-x.; Fan, X.-h.; Qin, Z.-d.; Wang, M.-b. Change trends of temperature and precipitation in the Loess Plateau Region of China, 1961–2010. Glob. Planet. Chang. 2012, 92–93, 138–147. [Google Scholar] [CrossRef]
  47. Lu, Y.H.; Fu, B.J.; Feng, X.M.; Zeng, Y.; Liu, Y.; Chang, R.Y.; Sun, G.; Wu, B.F. A Policy-Driven Large Scale Ecological Restoration: Quantifying Ecosystem Services Changes in the Loess Plateau of China. PLoS ONE 2012, 7, 10. [Google Scholar] [CrossRef]
  48. Lü, Y.; Zhang, L.; Feng, X.; Zeng, Y.; Fu, B.; Yao, X.; Li, J.; Wu, B. Recent ecological transitions in China: Greening, browning, and influential factors. Sci. Rep. 2015, 5, 8732. [Google Scholar] [CrossRef] [PubMed]
  49. Fu, B.J.; Wang, S.; Liu, Y.; Liu, J.B.; Liang, W.; Miao, C.Y. Hydrogeomorphic Ecosystem Responses to Natural and Anthropogenic Changes in the Loess Plateau of China. Annu. Rev. Earth Planet. Sci. 2017, 45, 223–243. [Google Scholar] [CrossRef]
  50. Wu, X.; Wei, Y.; Fu, B.; Wang, S.; Zhao, Y.; Moran, E.F. Evolution and effects of the social-ecological system over a millennium in China’s Loess Plateau. Sci. Adv. 2020, 6, eabc0276. [Google Scholar] [CrossRef]
  51. Ji, Q.; Liang, W.; Fu, B.; Zhang, W.; Yan, J.; Lü, Y.; Yue, C.; Jin, Z.; Lan, Z.; Li, S.; et al. Mapping Land Use/Cover Dynamics of the Yellow River Basin from 1986 to 2018 Supported by Google Earth Engine. Remote Sens. 2021, 13, 1299. [Google Scholar] [CrossRef]
  52. Li, G.; Jiang, C.; Zhang, Y.; Jiang, G. Whether land greening in different geomorphic units are beneficial to water yield in the Yellow River Basin? Ecol. Indic. 2021, 120, 106926. [Google Scholar] [CrossRef]
  53. Friedl, M.A.; McIver, D.K.; Hodges, J.C.F.; Zhang, X.Y.; Muchoney, D.; Strahler, A.H.; Woodcock, C.E.; Gopal, S.; Schneider, A.; Cooper, A.; et al. Global land cover mapping from MODIS: Algorithms and early results. Remote Sens. Environ. 2002, 83, 287–302. [Google Scholar] [CrossRef]
  54. Friedl, M.A.; Sulla-Menashe, D.; Tan, B.; Schneider, A.; Ramankutty, N.; Sibley, A.; Huang, X. MODIS Collection 5 global land cover: Algorithm refinements and characterization of new datasets. Remote Sens. Environ. 2010, 114, 168–182. [Google Scholar] [CrossRef]
  55. Sulla-Menashe, D.; Gray, J.M.; Abercrombie, S.P.; Friedl, M.A. Hierarchical mapping of annual global land cover 2001 to present: The MODIS Collection 6 Land Cover product. Remote Sens. Environ. 2019, 222, 183–194. [Google Scholar] [CrossRef]
  56. ESA. Land Cover CCI Product User Guide Version 2. Tech. Rep. 2017. Available online: http://maps.elie.ucl.ac.be/CCI/viewer/download/ESACCI-LC-Ph2-PUGv2_2.0.pdf (accessed on 15 January 2023).
  57. Liu, A.; Wu, Q.; Cheng, X. Using the Google Earth Engine to estimate a 10 m resolution monthly inventory of soil fugitive dust emissions in Beijing, China. Sci. Total Environ. 2020, 735, 139174. [Google Scholar] [CrossRef] [PubMed]
  58. Yang, J.; Huang, X. The 30&thinsp;m annual land cover dataset and its dynamics in China from 1990 to 2019. Earth Syst. Sci. Data 2021, 13, 3907–3925. [Google Scholar] [CrossRef]
  59. Shannon, C.E. A mathematical theory of communication. Bell Syst. Tech. J. 1948, 27, 379–423. [Google Scholar] [CrossRef]
  60. Mann, H.B. Nonparametric Tests Against Trend. Econometrica 1945, 13, 245–259. [Google Scholar] [CrossRef]
  61. Kendall, K. Thin-film peeling-the elastic term. J. Phys. D Appl. Phys. 1975, 8, 1449. [Google Scholar] [CrossRef]
  62. Sen, P.K. Robustness of Some Nonparametric Procedures in Linear Models. Ann. Math. Stat. 1968, 39, 1913–1922. [Google Scholar] [CrossRef]
  63. Gocic, M.; Trajkovic, S. Analysis of changes in meteorological variables using Mann-Kendall and Sen’s slope estimator statistical tests in Serbia. Glob. Planet. Chang. 2013, 100, 172–182. [Google Scholar] [CrossRef]
  64. Yin, H.; Prishchepov, A.V.; Kuemmerle, T.; Bleyhl, B.; Buchner, J.; Radeloff, V.C. Mapping agricultural land abandonment from spatial and temporal segmentation of Landsat time series. Remote Sens. Environ. 2018, 210, 12–24. [Google Scholar] [CrossRef]
  65. Taylor, K.E. Summarizing multiple aspects of model performance in a single diagram. J. Geophys. Res. Atmos. 2001, 106, 7183–7192. [Google Scholar] [CrossRef]
  66. Miao, C.Y.; Duan, Q.Y.; Sun, Q.H.; Huang, Y.; Kong, D.X.; Yang, T.T.; Ye, A.Z.; Di, Z.H.; Gong, W. Assessment of CMIP5 climate models and projected temperature changes over Northern Eurasia. Environ. Res. Lett. 2014, 9, 055007. [Google Scholar] [CrossRef]
  67. Sun, Q.H.; Miao, C.Y.; Duan, Q.Y. Changes in the Spatial Heterogeneity and Annual Distribution of Observed Precipitation across China. J. Clim. 2017, 30, 9399–9416. [Google Scholar] [CrossRef]
  68. Sun, Q.; Miao, C.; Duan, Q.; Ashouri, H.; Sorooshian, S.; Hsu, K.-L. A Review of Global Precipitation Data Sets: Data Sources, Estimation, and Intercomparisons. Rev. Geophys. 2018, 56, 79–107. [Google Scholar] [CrossRef]
  69. Willmott, C.J. On the Validation of Models. Phys. Geogr. 1981, 2, 184–194. [Google Scholar] [CrossRef]
  70. AghaKouchak, A.; Mehran, A.; Norouzi, H.; Behrangi, A. Systematic and random error components in satellite precipitation data sets. Geophys. Res. Lett. 2012, 39, L09406. [Google Scholar] [CrossRef]
  71. Foody, G.M. Status of land cover classification accuracy assessment. Remote Sens. Environ. 2002, 80, 185–201. [Google Scholar] [CrossRef]
  72. Liu, B.; Pan, L.; Qi, Y.; Guan, X.; Li, J. Land Use and Land Cover Change in the Yellow River Basin from 1980 to 2015 and Its Impact on the Ecosystem Services. Land 2021, 10, 1080. [Google Scholar] [CrossRef]
  73. Gallego, F.J. Remote sensing and land cover area estimation. Int. J. Remote Sens. 2004, 25, 3019–3047. [Google Scholar] [CrossRef]
  74. Foody, G.M. Valuing map validation: The need for rigorous land cover map accuracy assessment in economic valuations of ecosystem services. Ecol. Econ. 2015, 111, 23–28. [Google Scholar] [CrossRef]
  75. Estes, L.; Chen, P.; Debats, S.; Evans, T.; Ferreira, S.; Kuemmerle, T.; Ragazzo, G.; Sheffield, J.; Wolf, A.; Wood, E.; et al. A large-area, spatially continuous assessment of land cover map error and its impact on downstream analyses. Glob. Chang. Biol. 2018, 24, 322–337. [Google Scholar] [CrossRef]
  76. Olofsson, P.; Foody, G.M.; Herold, M.; Stehman, S.V.; Woodcock, C.E.; Wulder, M.A. Good practices for estimating area and assessing accuracy of land change. Remote Sens. Environ. 2014, 148, 42–57. [Google Scholar] [CrossRef]
  77. Nedd, R.; Light, K.; Owens, M.; James, N.; Johnson, E.; Anandhi, A. A Synthesis of Land Use/Land Cover Studies: Definitions, Classification Systems, Meta-Studies, Challenges and Knowledge Gaps on a Global Landscape. Land 2021, 10, 994. [Google Scholar] [CrossRef]
  78. Olofsson, P.; Arévalo, P.; Espejo, A.B.; Green, C.; Lindquist, E.; McRoberts, R.E.; Sanz, M.J. Mitigating the effects of omission errors on area and area change estimates. Remote Sens. Environ. 2020, 236, 111492. [Google Scholar] [CrossRef]
  79. Waldner, F.; Defourny, P. Where can pixel counting area estimates meet user-defined accuracy requirements? Int. J. Appl. Earth Obs. Geoinf. 2017, 60, 1–10. [Google Scholar] [CrossRef]
  80. Liu, P.; Pei, J.; Guo, H.; Tian, H.; Fang, H.; Wang, L. Evaluating the Accuracy and Spatial Agreement of Five Global Land Cover Datasets in the Ecologically Vulnerable South China Karst. Remote Sens. 2022, 14, 3090. [Google Scholar] [CrossRef]
  81. Smith, J.H.; Stehman, S.V.; Wickham, J.D.; Yang, L.M. Effects of landscape characteristics on land-cover class accuracy. Remote Sens. Environ. 2003, 84, 342–349. [Google Scholar] [CrossRef]
  82. Wen, X.; Deng, X.Z. Current soil erosion assessment in the Loess Plateau of China: A mini-review. J. Clean. Prod. 2020, 276, 123091. [Google Scholar] [CrossRef]
  83. Olofsson, P.; Foody, G.M.; Stehman, S.V.; Woodcock, C.E. Making better use of accuracy data in land change studies: Estimating accuracy and area and quantifying uncertainty using stratified estimation. Remote Sens. Environ. 2013, 129, 122–131. [Google Scholar] [CrossRef]
  84. Stehman, S.V.; Pengra, B.W.; Horton, J.A.; Wellington, D.F. Validation of the U.S. Geological Survey’s Land Change Monitoring, Assessment and Projection (LCMAP) Collection 1.0 annual land cover products 1985–2017. Remote Sens. Environ. 2021, 265, 112646. [Google Scholar] [CrossRef]
  85. Nelson, M.D.; Garner, J.D.; Tavernia, B.G.; Stehman, S.V.; Riemann, R.I.; Lister, A.J.; Perry, C.H. Assessing map accuracy from a suite of site-specific, non-site specific, and spatial distribution approaches. Remote Sens. Environ. 2021, 260, 112442. [Google Scholar] [CrossRef]
  86. Pengra, B.W.; Stehman, S.V.; Horton, J.A.; Dockter, D.J.; Schroeder, T.A.; Yang, Z.; Cohen, W.B.; Healey, S.P.; Loveland, T.R. Quality control and assessment of interpreter consistency of annual land cover reference data in an operational national monitoring program. Remote Sens. Environ. 2020, 238, 111261. [Google Scholar] [CrossRef]
  87. Hsieh, P.-F.; Lee, L.; Chen, N.-Y. Effect of spatial resolution on classification errors of pure and mixed pixels in remote sensing. IEEE Trans. Geosci. Remote Sens. 2001, 39, 2657–2663. [Google Scholar] [CrossRef]
  88. Stehman, S.V.; Wickham, J.D. Pixels, blocks of pixels, and polygons: Choosing a spatial unit for thematic accuracy assessment. Remote Sens. Environ. 2011, 115, 3044–3055. [Google Scholar] [CrossRef]
  89. Lambin, E.F.; Turner, B.L.; Nyakundi, F. Commentary: Policy challenges for global land use. Glob. Environ. Change 2021, 71, 102411. [Google Scholar] [CrossRef]
  90. Costanza, R.; de Groot, R.; Sutton, P.; van der Ploeg, S.; Anderson, S.J.; Kubiszewski, I.; Farber, S.; Turner, R.K. Changes in the global value of ecosystem services. Glob. Environ. Chang. 2014, 26, 152–158. [Google Scholar] [CrossRef]
  91. Song, X.P. Global Estimates of Ecosystem Service Value and Change: Taking Into Account Uncertainties in Satellite-based Land Cover Data. Ecol. Econ. 2018, 143, 227–235. [Google Scholar] [CrossRef]
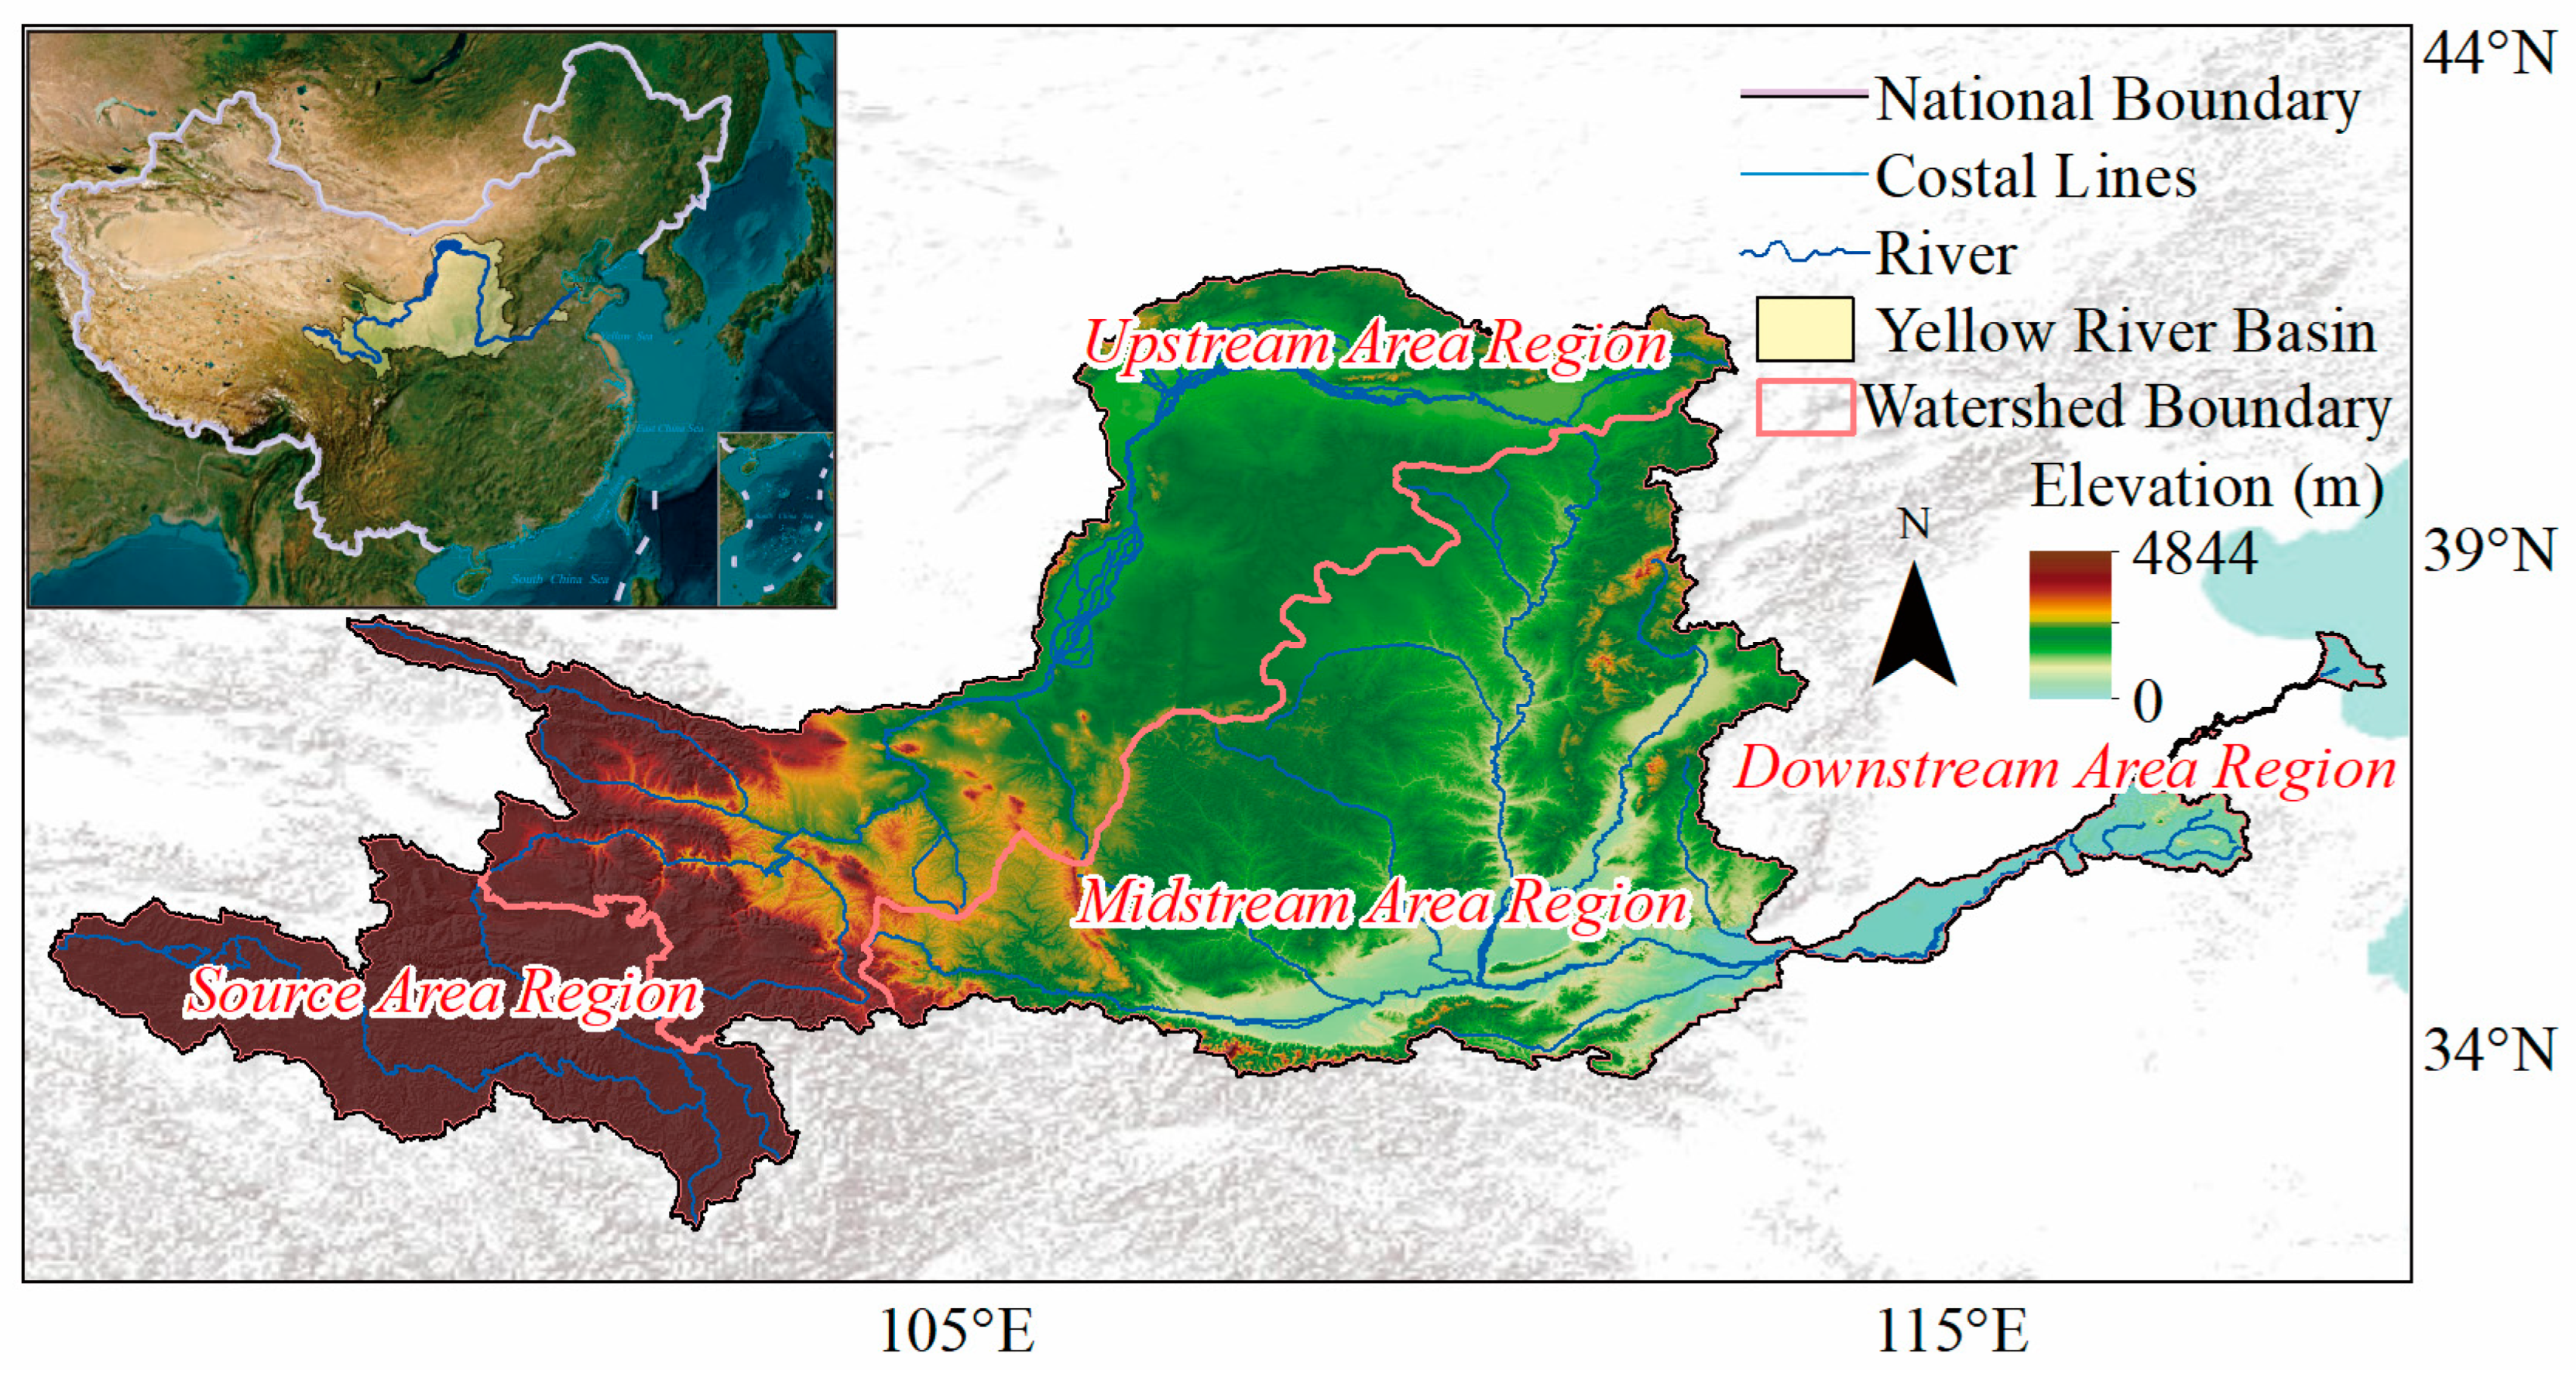
Figure 1. Location and geomorphology of the Yellow River Basin (YRB).
Remotesensing 15 02539 g001
Figure 2. Flowchart of the comparison between the four annual LC datasets.
Remotesensing 15 02539 g002
Figure 3. Comparison of the annual area of change for the nine LC classes between the four datasets in the YRB from 2001 to 2015. (a) Cropland, (b) forest, (c) shrubland, (d) grassland, (e) water, (f) snow/ice, (g) barren, (h) impervious, (i) wetland. The inset graph is the Sen’s slope estimate (β) of the area of change in the four datasets and * indicates that the result passed the Mann–Kendall test with α = 0.05.
Remotesensing 15 02539 g003
Figure 4. Taylor diagrams of the area of change for the nine LC classes between the four datasets in the YRB from 2001 to 2015. (a) Cropland, (b) forest, (c) shrubland, (d) grassland, (e) water, (f) snow/ice, (g) barren, (h) impervious, (i) wetland.
Remotesensing 15 02539 g004
Figure 5. Comparison of the spatial variation of the Sen’s slope estimate (β, M ha/a) for nine LC classes between the four datasets in the YRB from 2001 to 2015. Values are summary results in a 0.5° × 0.5° grid, blank areas have no values, and the inset graph shows the differences in β for each LC class in the SA, UA, MA, and DA watersheds, respectively.
Remotesensing 15 02539 g005
Figure 6. Comparison of the spatial distribution of the correlation (R > 0, p < 0.05) for nine LC classes between the four other datasets in the YRB from 2001 to 2015. Values are summary results in a 0.5° × 0.5° grid, blank areas have no values, and the inset graph shows the percentage of correlated grids for each LC class in the SA, UA, MA, and DA watersheds, respectively.
Remotesensing 15 02539 g006
Figure 7. Comparison of the spatial variation of the percentage of systematic and random error for nine LC classes between the four datasets in the YRB from 2001 to 2015. Values are summary results in a 0.5° × 0.5° grid, blank areas have no values, and the inset graph shows the percentage of systematic and random error for each LC class in the SA, UA, MA, and DA watersheds, respectively.
Remotesensing 15 02539 g007
Figure 8. Comparison of the variations in spatial agreement (R > 0, p < 0.05) (left panel) and total errors (right panel) with landscape diversity (H) for nine LC classes between the four datasets in the YRB from 2001 to 2015.
Remotesensing 15 02539 g008
Table 1. Characteristics of the four LC datasets.
LC DatasetGLASS-GLCMCD12Q1CCI-LC CLCD
Satellite sensorNOAA AVHRRTerra and Aqua MODISENVISAT MERIS SPOT VGTLandsat TM/ETM+, HJ-1
Input data41 metrics derived from NDVI and 5 spectral bands16-day nadir BRDF adjusted reflectance, 7 spectral bands, EVIMERIS 7-day composite surface reflectance, SPOT VGT time series dataOptical bands in TM/ETM + and HJ-1, some auxiliary, e.g., MODIS NDVI time series data
Spatial resolution4 km500 m300 m30 m
Temporal resolution1981–20152001–20191992–20181990–2019
Classification scheme7 classesIGBP (17 classes)LCCS (22 classes)9 classes
Classification strategy and methodThe Earth was divided into equal map sheets and classified separately by the combination of pixel- and object-based methods [57].The Earth was viewed as an entirety and was classified using the decision tree method [53,54,55].The Earth was divided into 22 climatic regions and each region was classified separately by the combined use of the supervised and unsupervised methods [56].The Earth was divided into equal map sheets and classified separately by the combination of pixel- and object-based methods [58].
Disclaimer/Publisher’s Note: The statements, opinions and data contained in all publications are solely those of the individual author(s) and contributor(s) and not of MDPI and/or the editor(s). MDPI and/or the editor(s) disclaim responsibility for any injury to people or property resulting from any ideas, methods, instructions or products referred to in the content.