1. Introduction
Maize is an important food crop, and its yield is essential for food security [
1]. Maize is a hermaphroditic crop that is amenable to self-pollination, although self-pollination is not beneficial for the selection of superior seeds. Therefore, it is important to ensure the cross-pollination of maize, which is beneficial for breeding and improves the yield [
2,
3]. In addition, during maize pollination, the wind blows many pollen grains onto the female panicle. However, the high respiratory capacity of pollen means that these pollen grains consume large amounts of nutrients, thereby competing for nutrients with the female panicle and disfavoring the growth of the latter [
4,
5,
6,
7]. At the same time, the long tassel creates more shade, reducing photosynthesis in the maize leaves, which is not conducive to the growth of maize. The overabundance of tassels also hinders pest control and reduces the yield [
8,
9,
10]. Given these effects caused by maize tassels, maize de-masculinization contributes significantly to yield improvement. Yang et al. [
11] studied how septate de-etiolated carrying parietal lobes affect photosynthetic characteristics, dry matter accumulation, and yield in both castrated and undesired maize and showed that these lobes increase the area exposed to light in the middle and lower sections of the maize plant. This phenomenon increases the photosynthetic capacity of maize and facilitates the translocation of photosynthetic products to the grain to increase yield. The mainstay of conventional pollination is to pluck the tassel when the maize begins to bolt, relying on artificial septation or straining to leave about half of the male panicles for pollination, which is required for sufficient pollination of female panicles. Once maize pollination is complete, the remaining half of the tassels can be removed to reduce occlusion and improve photosynthesis [
12,
13,
14].
However, the traditional method of removing maize tassels relies on manual identification and is time consuming and laborious. The application of computer vision technology to crop identification thus provides a welcomed technological means to accurately identify maize tassels, leading to efficient scientific guidance in de-androgenesis. Accurately determining the number of maize tassels provides strong support for quickly learning the progress of maize bolting.
Traditional maize tassel recognition is mainly based on color space and machine learning [
15,
16]. Tang et al. [
17] proposed an image segmentation algorithm based on the hue–saturation–intensity color space to extract maize tassels from images and proposed a method to identify maize tassels. The results showed that this method can extract maize tassel parts from images and spatially locate the maize tassels. Ferhat et al. [
18] proposed a detection algorithm for eliminating maize tassels by combining traditional color images with machine learning. The algorithm uses color information and support vector machine classifiers to binarize images, performs morphological analysis to determine the possibly pure location of tassels, uses clustering to merge multiple detections of the same tassels, and determines the final location of the maize tassels. The results showed that male tassels could be detected in color images. Mao et al. [
19] transformed red–green–blue (RGB) maize field images into hue–saturation–intensity space, binarized the hue component, filtered, denoised, morphologically processed, and generated rectangular box areas, and confirmed the removal of false detections by using a learning vector quantization neural network. The results showed that this method improved the segmentation accuracy of maize tassels.
In recent years, with the development of unmanned aerial remote sensing technology [
20,
21,
22,
23] and computer vision technology [
24,
25], agricultural intelligent monitoring systems have been continuously improved. The advantages of high efficiency, convenience, and low cost have made unmanned aerial vehicles (UAVs) popular with many researchers for collecting agricultural data. With efficient in-depth learning algorithms, computer vision technology is increasingly important in image classification, target detection, and image segmentation [
26,
27,
28,
29]. Significant research has been performed on maize tassel recognition based on UAV remote sensing technology and deep learning algorithms. For example, Lu et al. [
30] proposed the TasselNet model to count maize tassels by using a local regression network and made the maize tassel dataset public. Liang et al. [
31] proposed the SSD MobileNet model, which is deployed on a UAV system and is ideally suited for recognizing maize tassels. Yang et al. [
32] improved the target detection model of the anchorless frame CenterNet [
33] to efficiently detect maize tassels. Liu et al. [
34] used the Faster R-CNN model to detect maize tassels by replacing different main feature extraction networks. They concluded that the residual network (ResNet) [
35] works better as a feature extraction network for maize tassels than the visual geometry group network (VGGNet) [
36].
Although significant research has focused on detecting maize tassels [
37], the complexity of the field environment and the interference involved in detecting maize tassels, including image resolution, brightness, tassel varieties, and planting density, make this a challenging task [
30]. In fact, the detection of maize tassels requires a model for small-target detection [
38,
39,
40], which means that detection depends heavily on the target of the detection model. The target detection model based on convolution neural networks may be divided into one-stage and two-stage target detection networks. One-stage target detection algorithms include SSD [
41], the YOLO series [
42,
43,
44,
45,
46], and RetinaNet [
47]. Second-stage target detection networks mainly include Faster R-CNN [
48].
RetinaNet has many structures in its model that are useful for small-target detection. For example, its anchor frames come in many sizes, ensuring detection accuracy for large and small targets. Moreover, RetinaNet uses a feature pyramid network (FPN) [
49], which is very useful for expressing small-target feature information. Therefore, this model has been used to detect numerous small targets. For example, Li et al. [
50] accurately detected wheat ears by using the RetinaNet model and found that the algorithm accuracy exceeds that of the Faster R-CNN network. In other work, Chen et al. [
51] improved the RetinaNet model to improve the identification accuracy of flies. Therefore, this study uses the RetinaNet model for maize tassel detection and improves the recognition accuracy of smaller tassels by optimizing the model and introducing an attention mechanism. In addition, we analyze how image resolution, brightness, plant varieties, and planting density affect the detection model.
2. Materials and Methods
2.1. Field Experiments
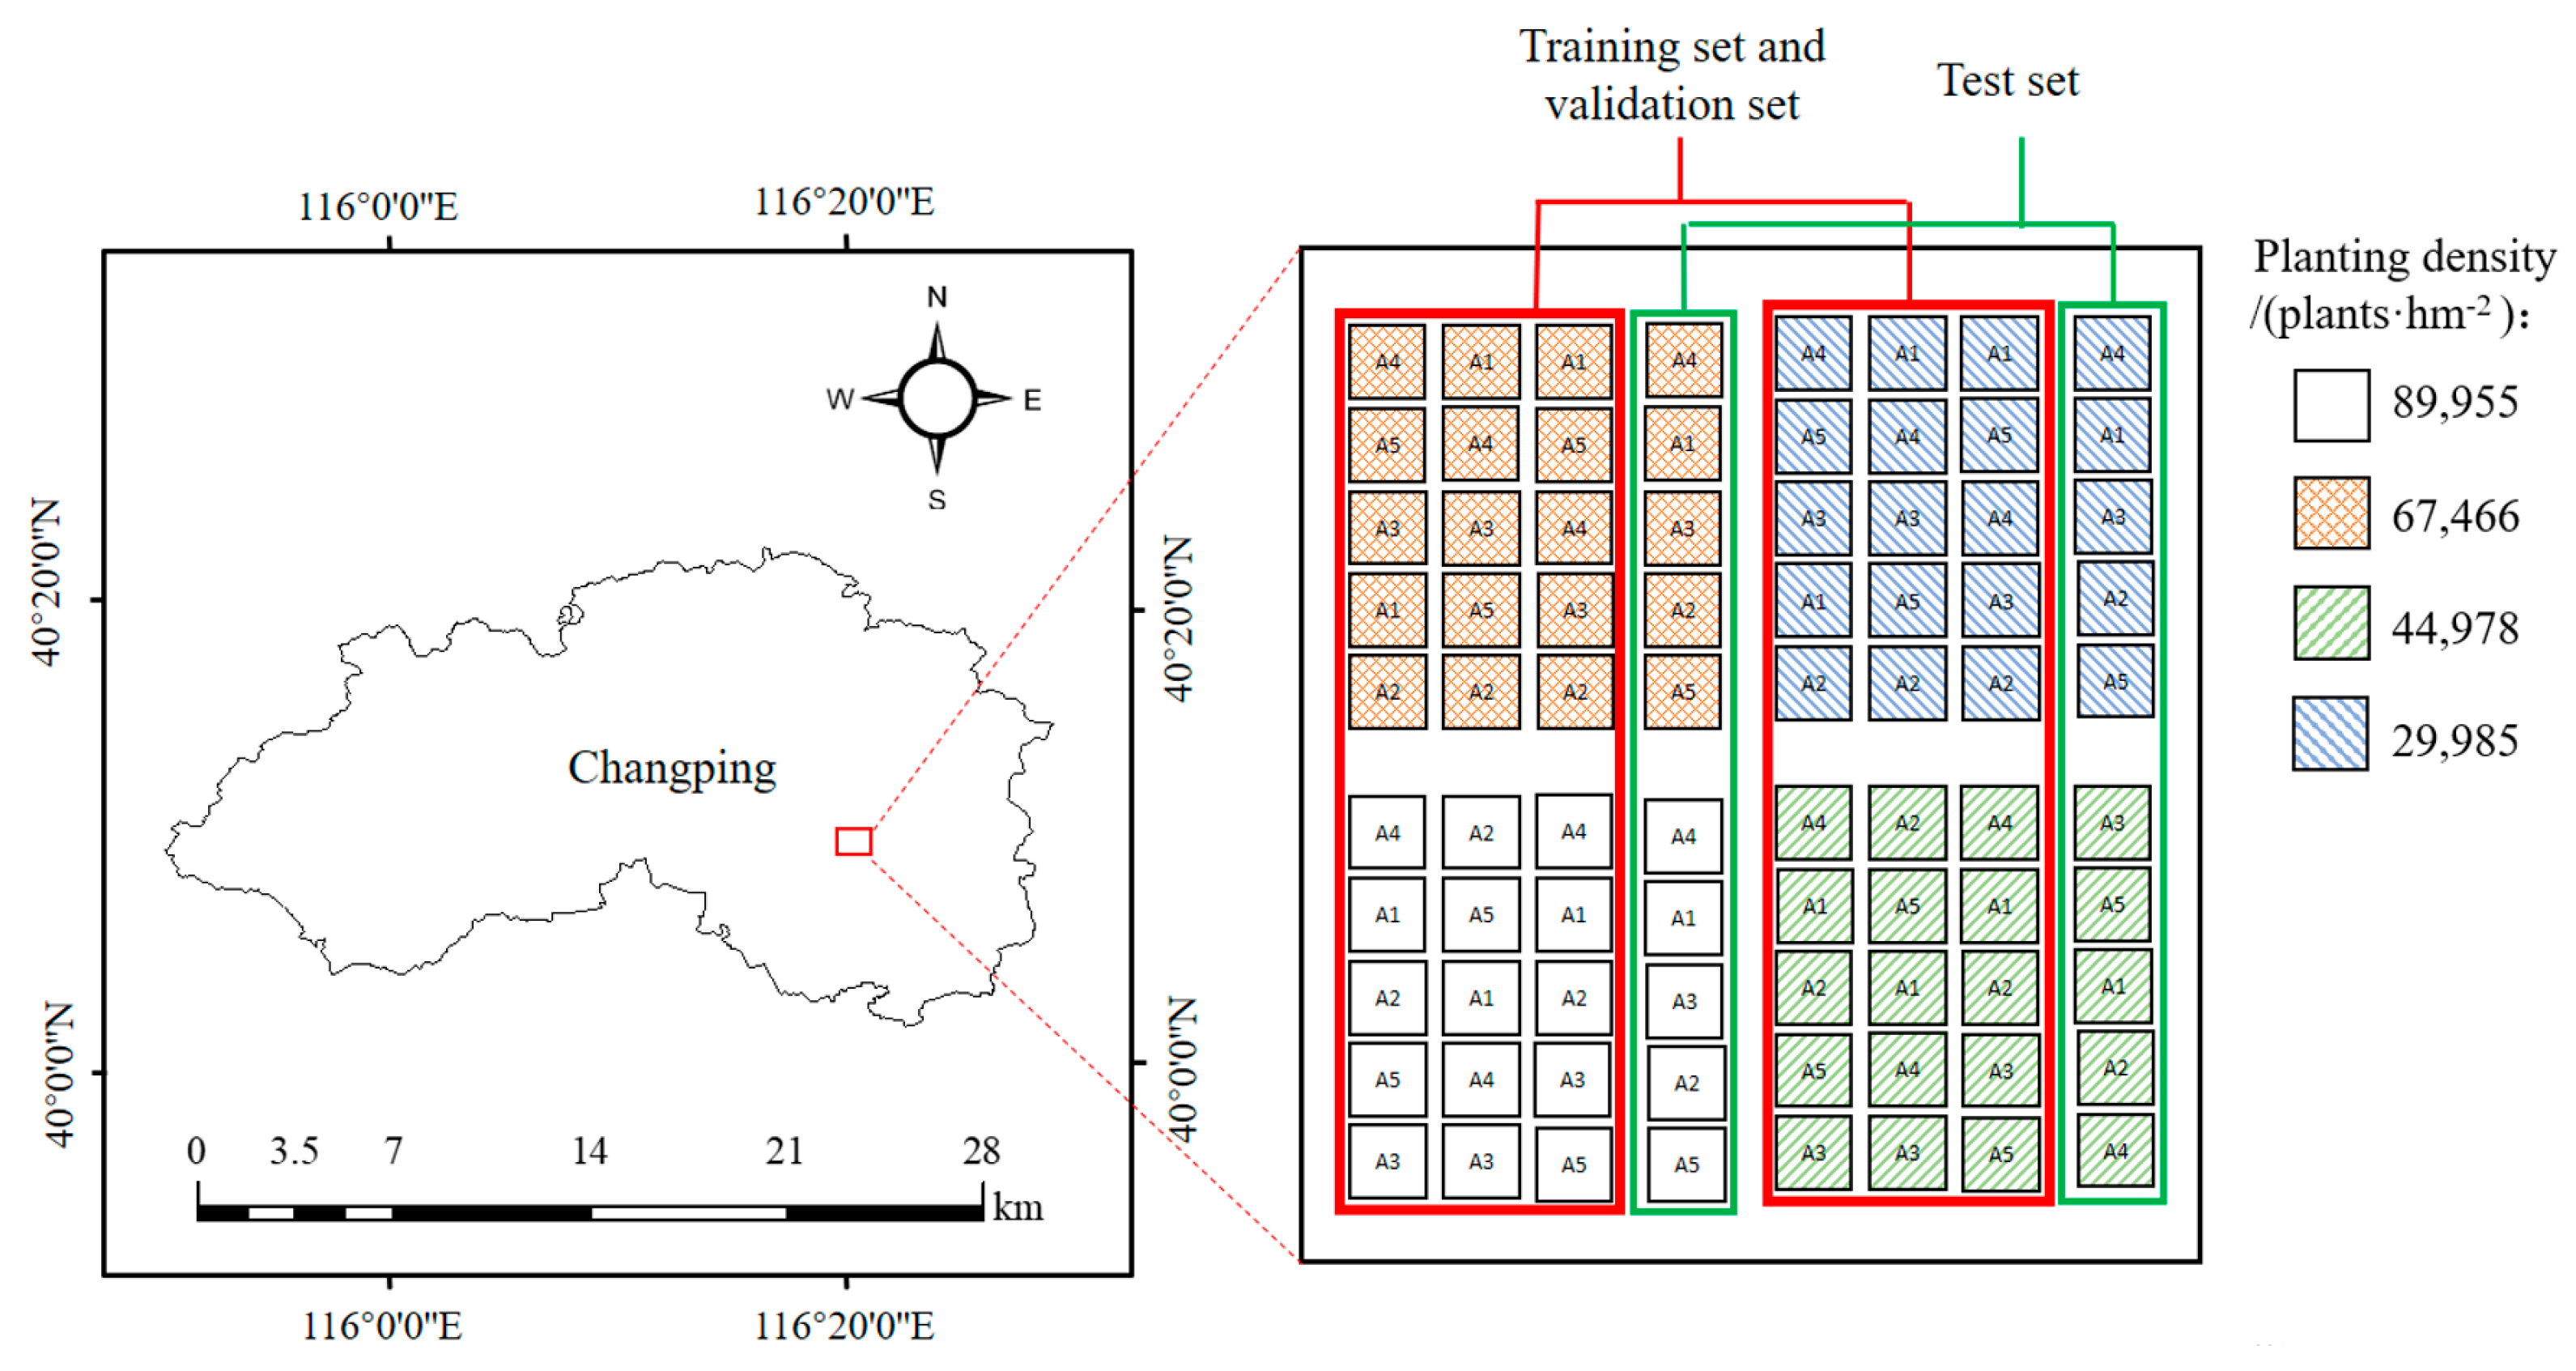
The experimental data were collected at the National Precision Agriculture Research and Demonstration Base in Xiaotangshan Town, Changping District, Beijing, China, at 36 m above sea level. The whole trial area contained 80 plots, with each plot measuring 2.5 m × 3.6 m. This experiment used five maize varieties of different genetic backgrounds: Nongkenuo336 (A1), Jingjiuqingzhu16 (A2), Tianci19 (A3), Zhengdan958 (A4), and Xiangnuo2008 (A5). The agronomic characteristics of each maize variety are given in
Table 1. Each maize variety was planted at four planting densities: 29,985, 44,978, 67,466, and 89,955 plants/hm
2 and repeated twice. The trial was sown on 11 June 2021 and harvested on 11 September 2021.
2.2. Data Acquisition and Preprocessing
We used a DJI Royal Mavic 2 portable UAV to collect images from 80 plots in the trial on 9 August 2021 (13:30–14:00), when all maize had entered the silking stage. Data were collected in cloudy, windless conditions to reduce any effect on the detection of illumination and maize plant oscillation. The UAV was equipped with a 20-megapixel Hasselblad camera and flew at an altitude of 10 m, with 80% forward overlap and 80% lateral overlap, a pixel resolution of 0.2 cm, and an image resolution of 5472 pixels × 3648 pixels for a total of 549 images of maize tassels. The images acquired by the UAV were divided into training and validation sets and a test set, and the trial area was organized as shown in
Figure 1. Given the large size of each image, the maize tassels were relatively dense and occupied a small pixel area, making it impossible to train and detect the images directly. To ensure the speed of network training in the later stage, the acquired images were cropped to a size of 600 pixels × 600 pixels.
To analyze how variety and planting density affect tassel detection, we ensured an equal amount of data for training and validation for the different varieties and planting densities. Therefore, for the training and validation sets, 80 images of tassels of each maize variety at each planting density were taken as the training set for a total of 1600 images for the five varieties and four planting densities. For the validation set, 10 images of tassels were acquired for each maize variety and each planting density for a total of 200 images. For the test set, 16 images were acquired of tassels for each maize variety and planting density for a total of 320 images. In addition, we acquired images of the test set area at a height of 5 m. A total of 12 images was acquired to verify the effect of different resolutions on the detection effectiveness of the model.
LabelImg is an open-source image labeling tool that saves the labeled targets as XML files in the PASCAL VOC format used by ImageNet. The XML file saved after labeling each image contains the width and height of the image and the number of channels, as well as the category of the target and the coordinates of the top-left and bottom-right vertices of the target bounding box.
2.3. Model Description
RetinaNet is a typical one-stage object detection algorithm that is widely used in various fields. The RetinaNet model consists mainly of a feature extraction module, an FPN module, a classification module, and a regression module. The feature extraction module mainly uses the residual network. When an image is input, the Conv3_x, Conv4_x, and Conv5_x layers are output by the feature extraction network and then passed to the FPN module for feature fusion. Finally, five feature maps, P3–P7, are output to the classification and regression module for target prediction. In addition, the RetinaNet network uses focal loss as the loss function, which solves the imbalance between positive and negative samples during training.
Figure 2 shows the RetinaNet network structure.
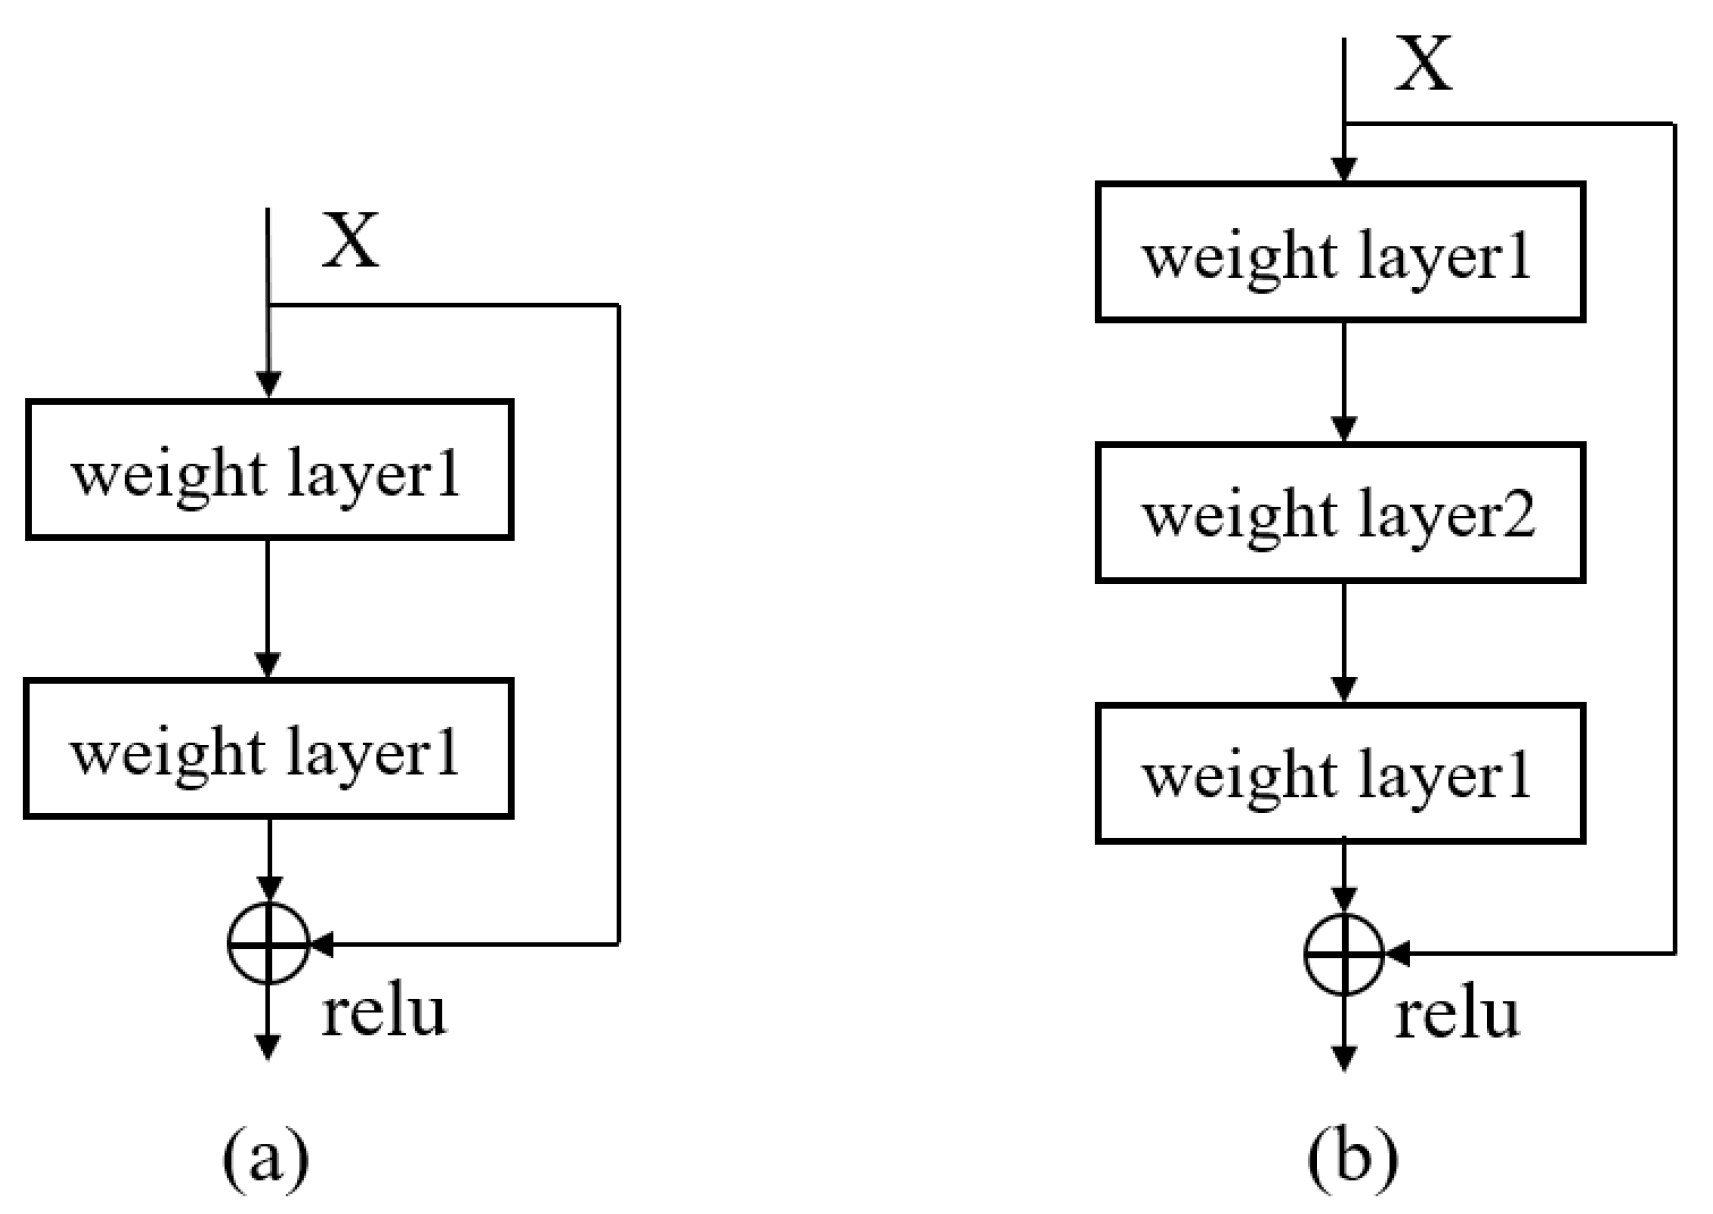
The RetinaNet model uses the Resnet network as the backbone feature extraction network, which consists mainly of residual blocks. Before the residual network was proposed, with the establishment of a deeper network, the network gradient disappeared and degenerated. In other words, the training loss increased upon increasing the number of network layers, and the network effect worsened. Introducing the residual block allowed the network to be built deeper, improving the results. Two main types of residual block structures are BasicBlock and BottleNeck, which are shown in
Figure 3.
- (2)
Feature Pyramid Network
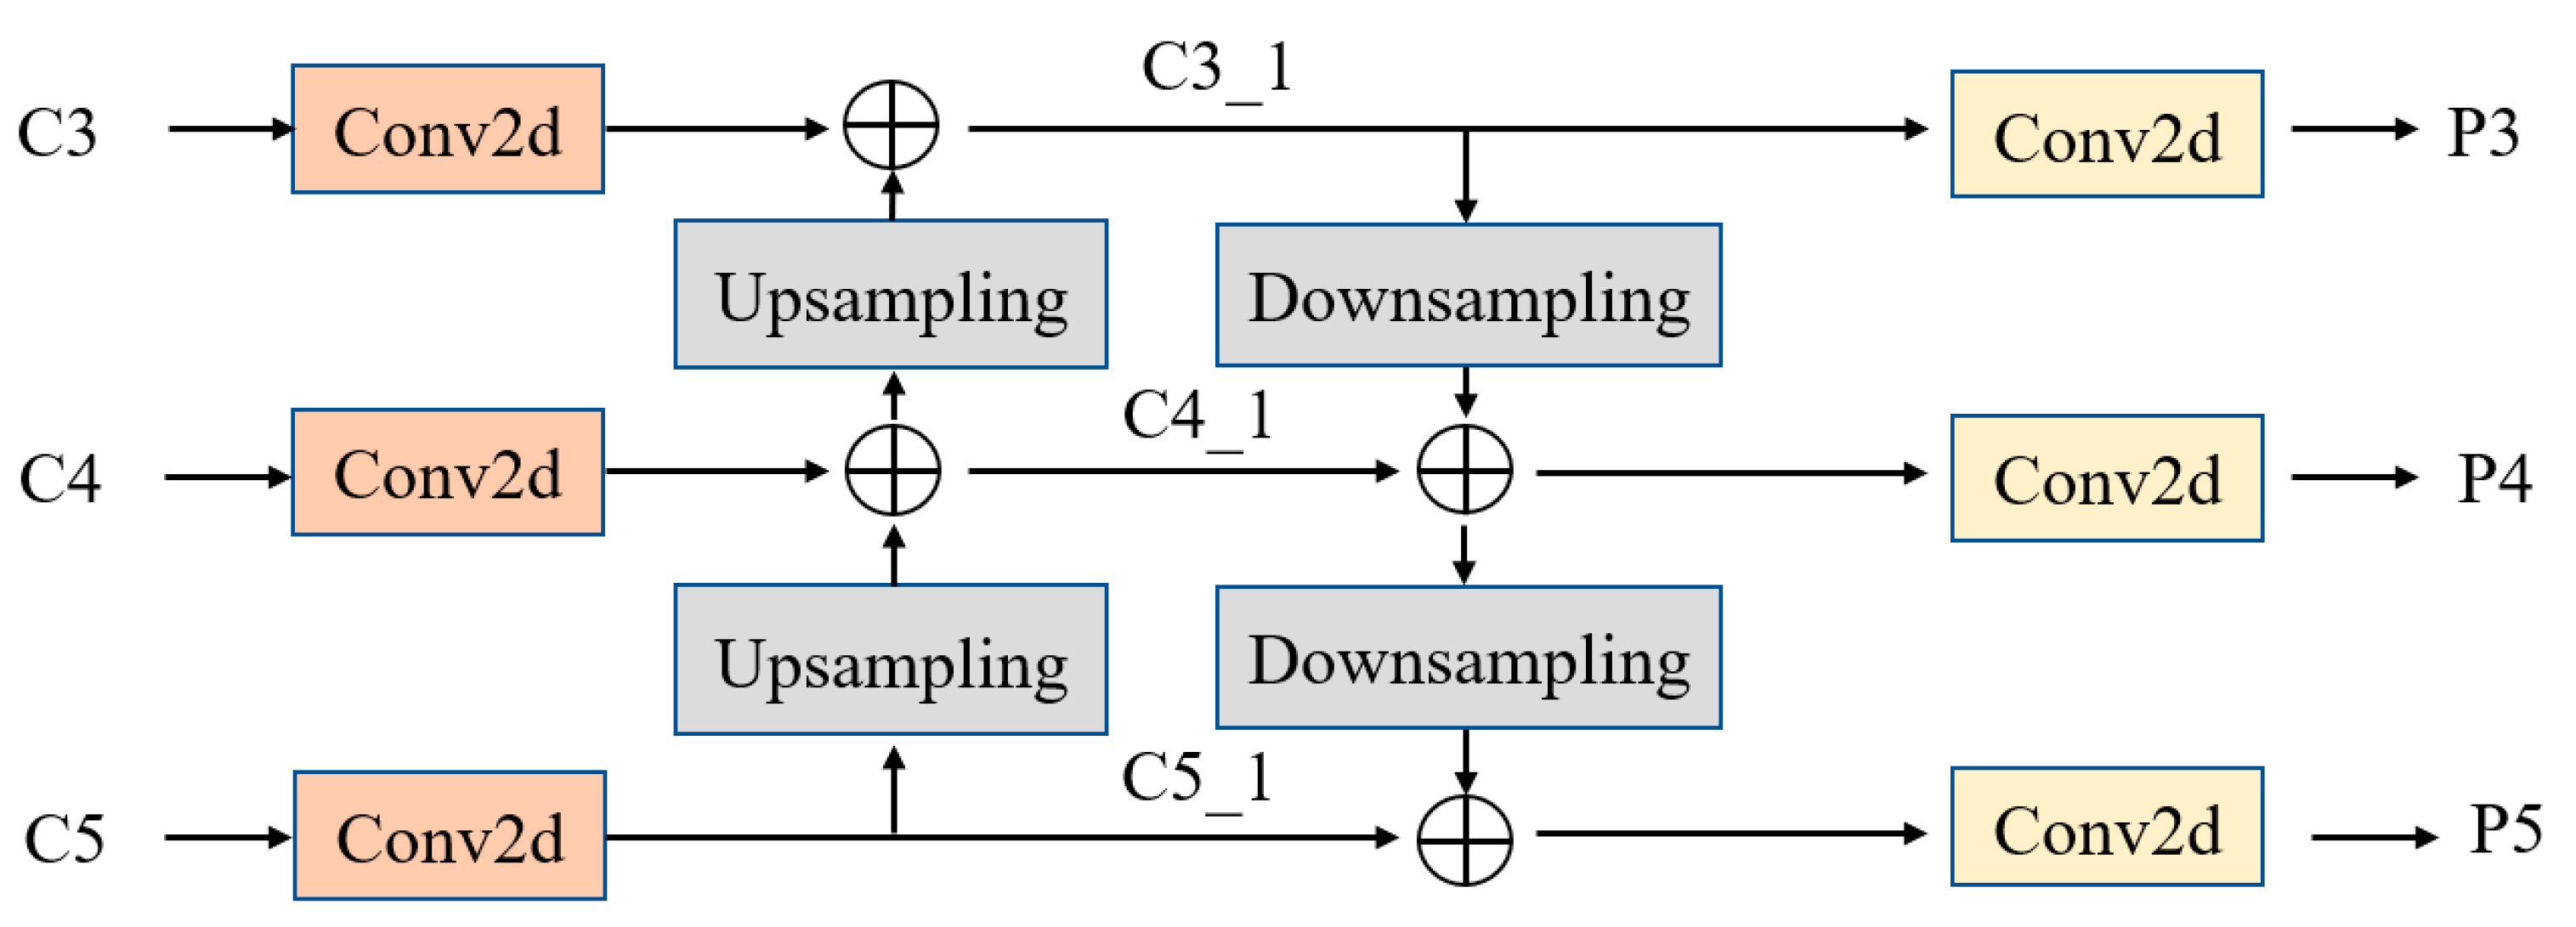
In the RetinaNet model, the FPN enhances the feature extraction capability of the network by combining high-level semantic features with underlying features. The FPN up-samples and stacks the feature maps C3–C5 output from the feature extraction network to produce the feature-fused P3–P5 feature maps. P6 is obtained by convolving C5 once, with a kernel size of 3 × 3 and a step size of two. P7 is obtained by convolving P6 once with the activation function Relu, with a kernel size of 3 × 3 and a step size of two. The smaller size of the upper-level feature map facilitates the detection of larger objects, and the larger size of the lower-level feature map facilitates the detection of smaller objects. The result is five feature maps, P3–P7, where P3–P5 are generally used for small-target detection and P6 and P7 for large-target detection.
- (3)
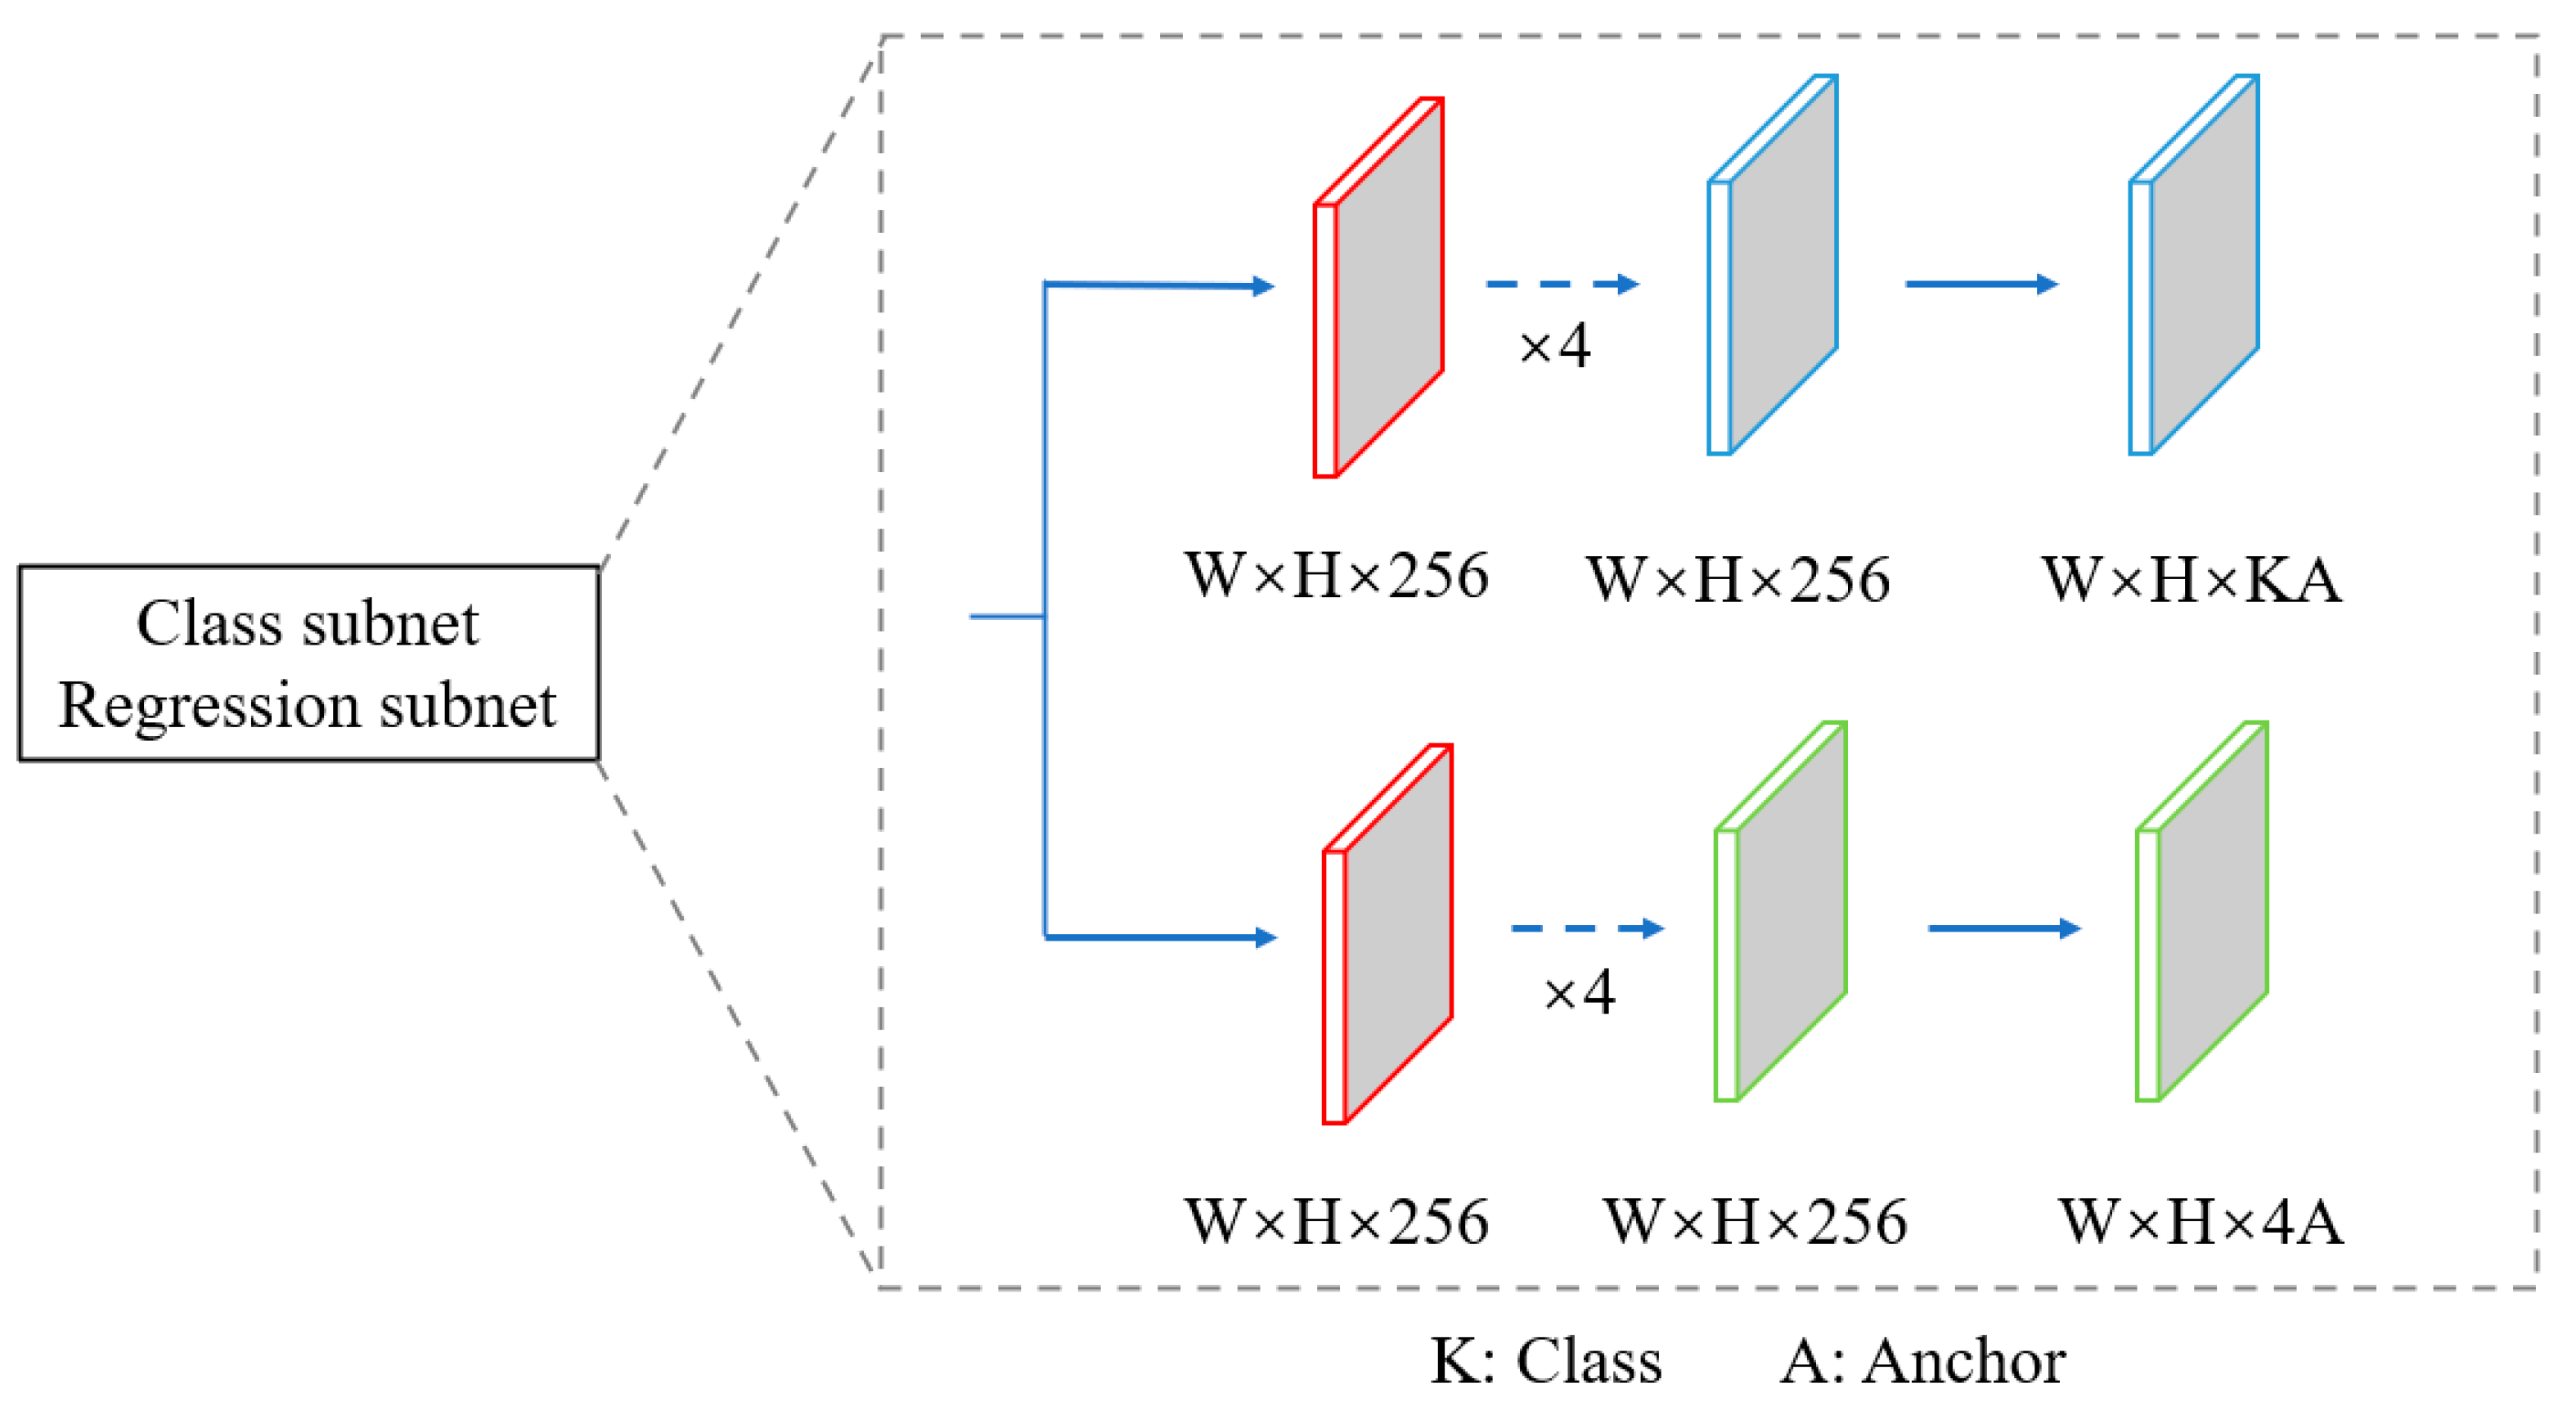
Classification and Regression Subnet
The classification and regression subnet is connected to a fully convolutional network at each FPN level. The main role of this network is to predict the probability of each anchor frame and K-class object occurring at each spatial location and to output the object’s location relative to the anchor point when the prediction is a positive sample. The classification subnet uses four 3 × 3 convolution kernels to convolve the feature map, at which point the Relu activation function is used. When the final layer is reached, a 3 × 3 convolution operation is applied, the sigmoid serves as the activation function, and the number of channels in the output image is K × A. The regression subnet has a structure like that of the classification subnet, except that the activation function differs from the number of channels in the final output layer. The last layer of the regression subnet uses linear activation, and the number of channels in the output image is 4A.
Figure 4 shows the structure of the classification and regression subnet.
The loss function has two functions: containing classification loss and regression loss. Classification loss uses focal loss as the loss function, which calculates the classification loss for all positive and negative samples. The bounding box regression loss uses Smooth L1 loss as the loss function, which calculates the regression loss for all positive samples. The loss function is:
where Loss is the loss function,
is the number of positive samples,
is the classification loss of each sample,
is the number of all positive and negative samples,
is the regression loss of each positive sample, and
is the number of positive samples.
Focal loss is proposed based on the cross-entropy loss function. The purpose is to solve the positive and negative sample imbalance problem in the target detection task. The cross-entropy loss function is:
where
indicates that the predicted output is a positive sample, and
is the probability of predicting a positive sample.
To solve the problem of imbalance between positive and negative samples during training, a weighting factor α is added to the cross-entropy function to reduce the weighting of negative samples. However, this approach does not distinguish between hard and easy samples, so another modulation factor
is introduced, thus reducing the weight of easy samples and making the model focus on hard samples during training. The focal loss function is:
where
is the focal loss function,
is the weighting factor,
is the focusing parameter, and
is the model prediction probability. The function Smooth L1 loss is used to calculate the uncertainty of the bounding box regression and positioning as follows:
where
is the location of the predicted bounding box, and
is the location of the ground truth bounding box.
2.4. Optimizing the Feature Pyramid Network
In the RetinaNet algorithms, the FPN is bottom up, with the semantic information at the higher levels being passed up through lateral connections. While this approach enhances the semantic information of the FPN, the higher-level feature maps go through multiple layers of the network, at which point the target information is already very fuzzy. In
Figure 2, C5 is the high-level output of the feature extraction network and directly outputs feature map P5 after two convolutions. However, P5 has been convolved several times by this time and contains little target information, especially for small targets. Therefore, this study optimizes the classical FPN based on the RetinaNet algorithms by adding a top-down route to fuse the bottom semantic information with the top semantic information, thereby compensating for and enhancing the localization information. The classical FPN output C3_1 is first down-sampled and weight-fused with C4_1 and then the fused result is down-sampled and weight-fused with C5_1. The FPN-optimized outputs P3–P5 are obtained by convolving the results of each layer output.
Figure 5 shows the structure of the optimized FPN.
2.5. Attention Mechanisms
The attention mechanism makes the network pay more attention to the desired target information. In this study, the goal of the network was to accurately detect maize tassels, so the attention mechanism was introduced into the network to make the model pay more attention to the characteristic information of maize tassels. The attention mechanism was divided into a channel attention mechanism, a spatial attention mechanism, and a combined spatial and channel attention mechanism.
This study used the CBAM attention mechanism [
52], which combines the channel attention mechanism and the spatial attention mechanism. The input feature map was first passed through the channel attention module, which performs global maximum pooling and global average pooling on the individual input feature layers to obtain two channel attention vectors. These two channel attention vectors are then passed into a shared network consisting of a hidden layer and a multi-layer perceptron. The two output channel attention vectors are then summed, and the weights of each channel in the output feature layer are normalized to [0, 1] by a sigmoid function to obtain the weighting output of the channel attention module. We multiplied this weighting by the input feature layer to obtain the output feature map, then passed this output feature map into the spatial attention module and took the maximum pooling and average pooling for each feature point on the feature map. The two pooling results were then stacked, and the number of channels was adjusted by using a convolution with a unity channel count. The weights of each feature point in the feature layer were then normalized to [0, 1] by a sigmoid function, and the output weightings were multiplied by the input feature layer to obtain the CBAM output.
Figure 6 shows the structure of the CBAM.
2.6. Experimental Environment and Configuration
The experimental environment required for model training includes hardware and software environments. The experiment was set up as follows: hardware environment: CPU, Intel i5-8000; RAM, 64G; GPU, NVIDIA GeForce GTX1080Ti (video memory, 11G); software environment: operating system, Windows 10.0; programming language, Python 3.7; deep learning framework, PyTorch 1.2; Cuda version 10.0. Before training, the model parameters needed to be set to the parameter values given in
Table 2.
2.7. Evaluation Metrics
In this study, average precision (AP), precision (P), recall (R), and intersection over union (IOU) were used to evaluate the model detection performance. AP is a comprehensive evaluation metric of maize tassel detection, and its value is a very important indicator of model performance. Precision refers to the fraction of correctly predicted positive samples with respect to all predicted positive samples. Recall refers to the fraction of correctly predicted positive samples with respect to all positive samples. The intersection over union refers to the ratio of the intersection to the union of the prediction bounding box and ground truth. The average precision, precision, recall, and intersection over union are calculated as follows:
where TP is positive samples predicted to be positive, TN is positive samples predicted to be negative, FP is negative samples predicted to be positive, and FN is positive samples predicted to be negative. The intersection over union is given by:
where A is the prediction bounding box area, and B is the ground truth area.
In addition, this study also used counting metrics, mainly because detection metrics do not distinguish well between differences in detection due to different varieties and planting densities. The counting metrics are calculated as follows:
where
is the coefficient of determination (the larger the value of
, the better the pre-diction of the model, and the maximum cannot exceed 1). RMSE is the root-mean-square error (the smaller the value of RMSE, the better the prediction of the model). MAE is the mean absolute error, where
is the number of test images.
and
are the ground truth number and the number of prediction bounding boxes of maize tassels in image
, and
is the mean of the ground truth number.
4. Discussion
4.1. Effect of Image Resolution on Detection of Maize Tassels
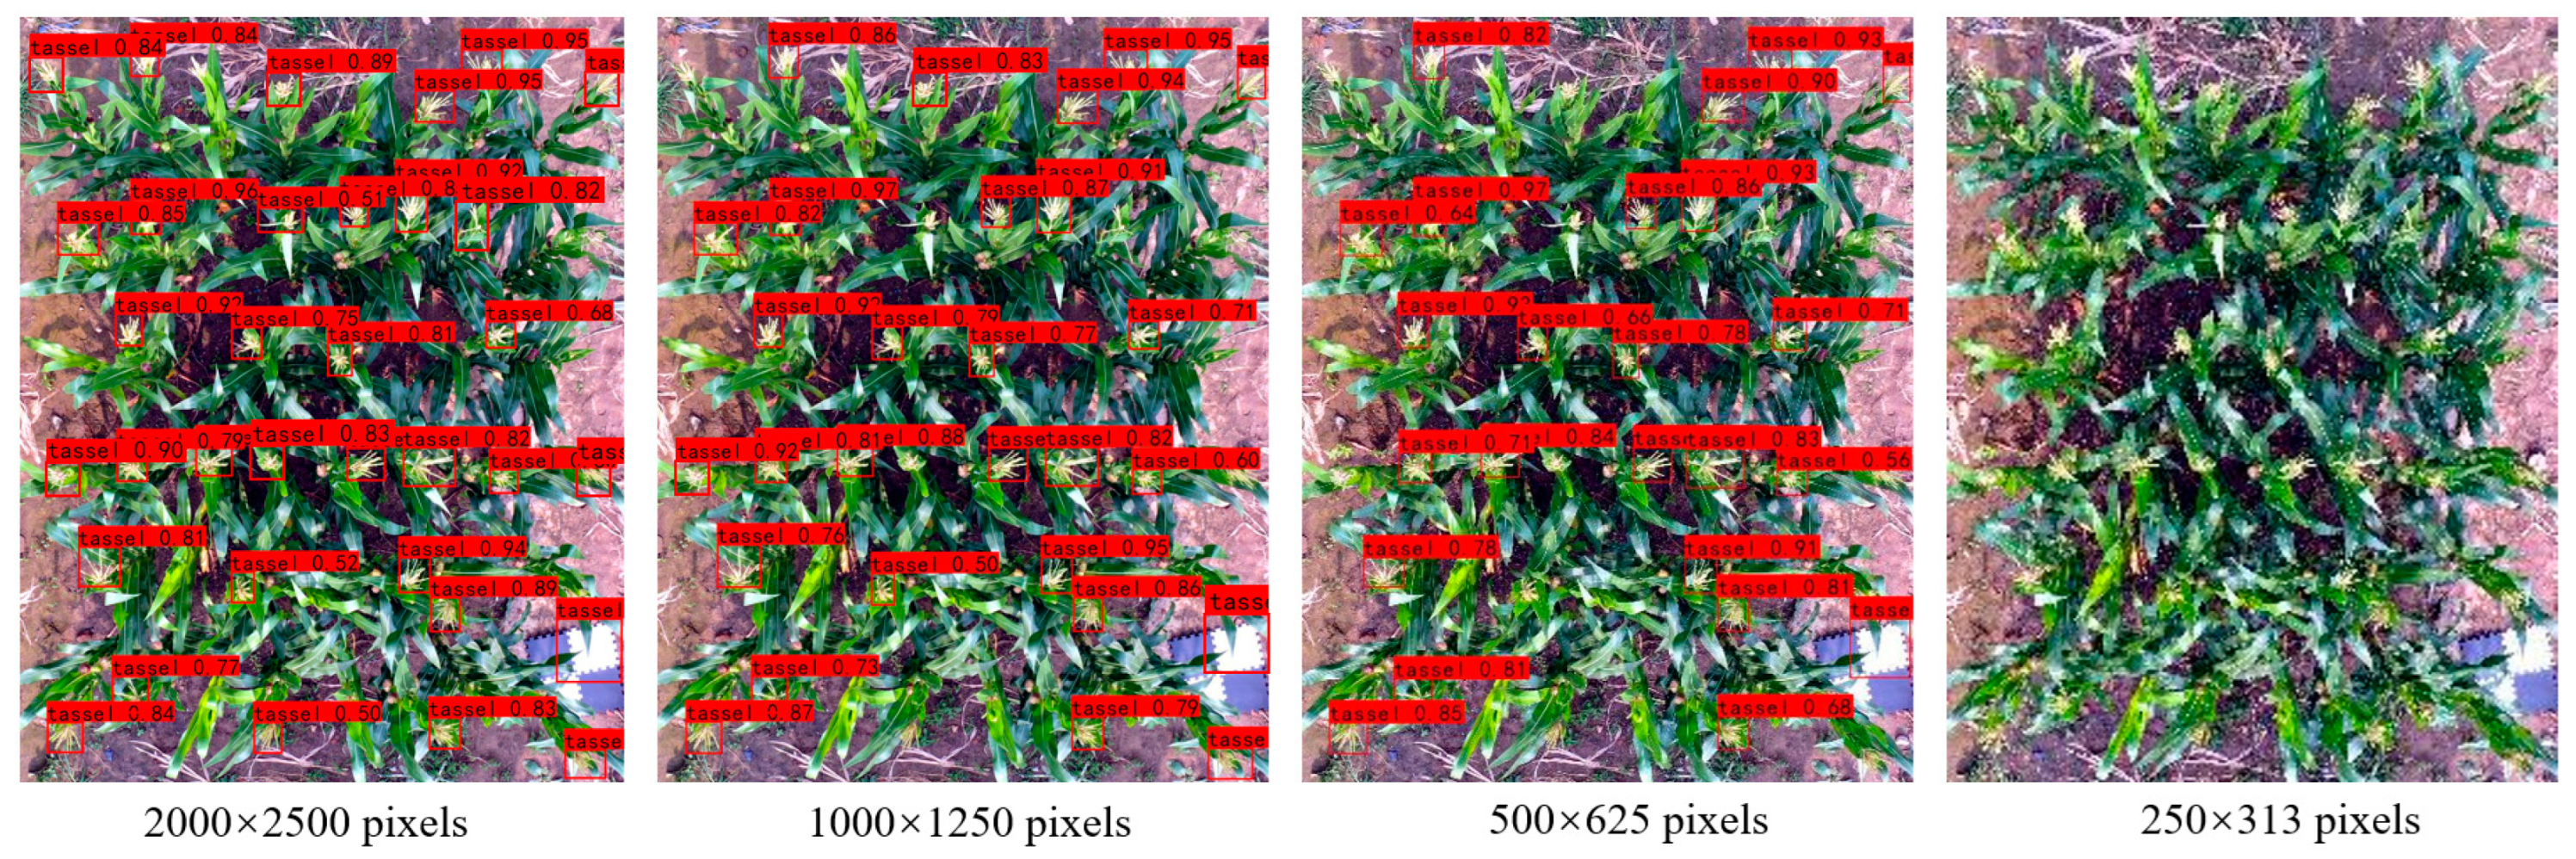
When using the same UAV to acquire images of maize tassels, different flight altitudes of the UAV can result in different image resolutions for the same area. Therefore, to investigate differences in the detection of maize tassels in the same area from images with different resolutions, we used the UAV to acquire images of the test area from an altitude of 5 m. The original images were cropped from 5472 × 3648 to 2000 × 2500 pixels for model detection purposes. We used Envi software to triple down-sample images with a resolution of 2000 × 2500 pixels to obtain images with resolutions of 1000 × 1250, 500 × 625, and 250 × 313 to simulate a UAV acquiring images of the same area from a height of 10, 20, and 40 m. The results of the improved RetinaNet model for detection appear in
Figure 10.
Figure 10 contains a total of 35 maize tassels. In the image with a resolution of 2000 × 2500 pixels, the model detected 33 maize tassels and one false positive. In the image with a resolution of 1000 × 1250 pixels, the model detected 27 maize tassels and one false positive. In the image with a resolution of 500 × 625 pixels, the model detected 23 maize tassels and one false positive. In the image with a resolution of 250 × 313 pixels, the model detected zero maize tassels. Based on this analysis, the model becomes significantly less effective in detecting maize tassels as the image resolution decreases. In low-resolution images, the maize tassels are not easily detected because they contain fewer pixels, so less feature information can be extracted. Future work should investigate how to detect maize tassels at low resolution to improve the detection of maize tassels in low-resolution images.
4.2. Effect of Brightness on Detection of Maize Tassels
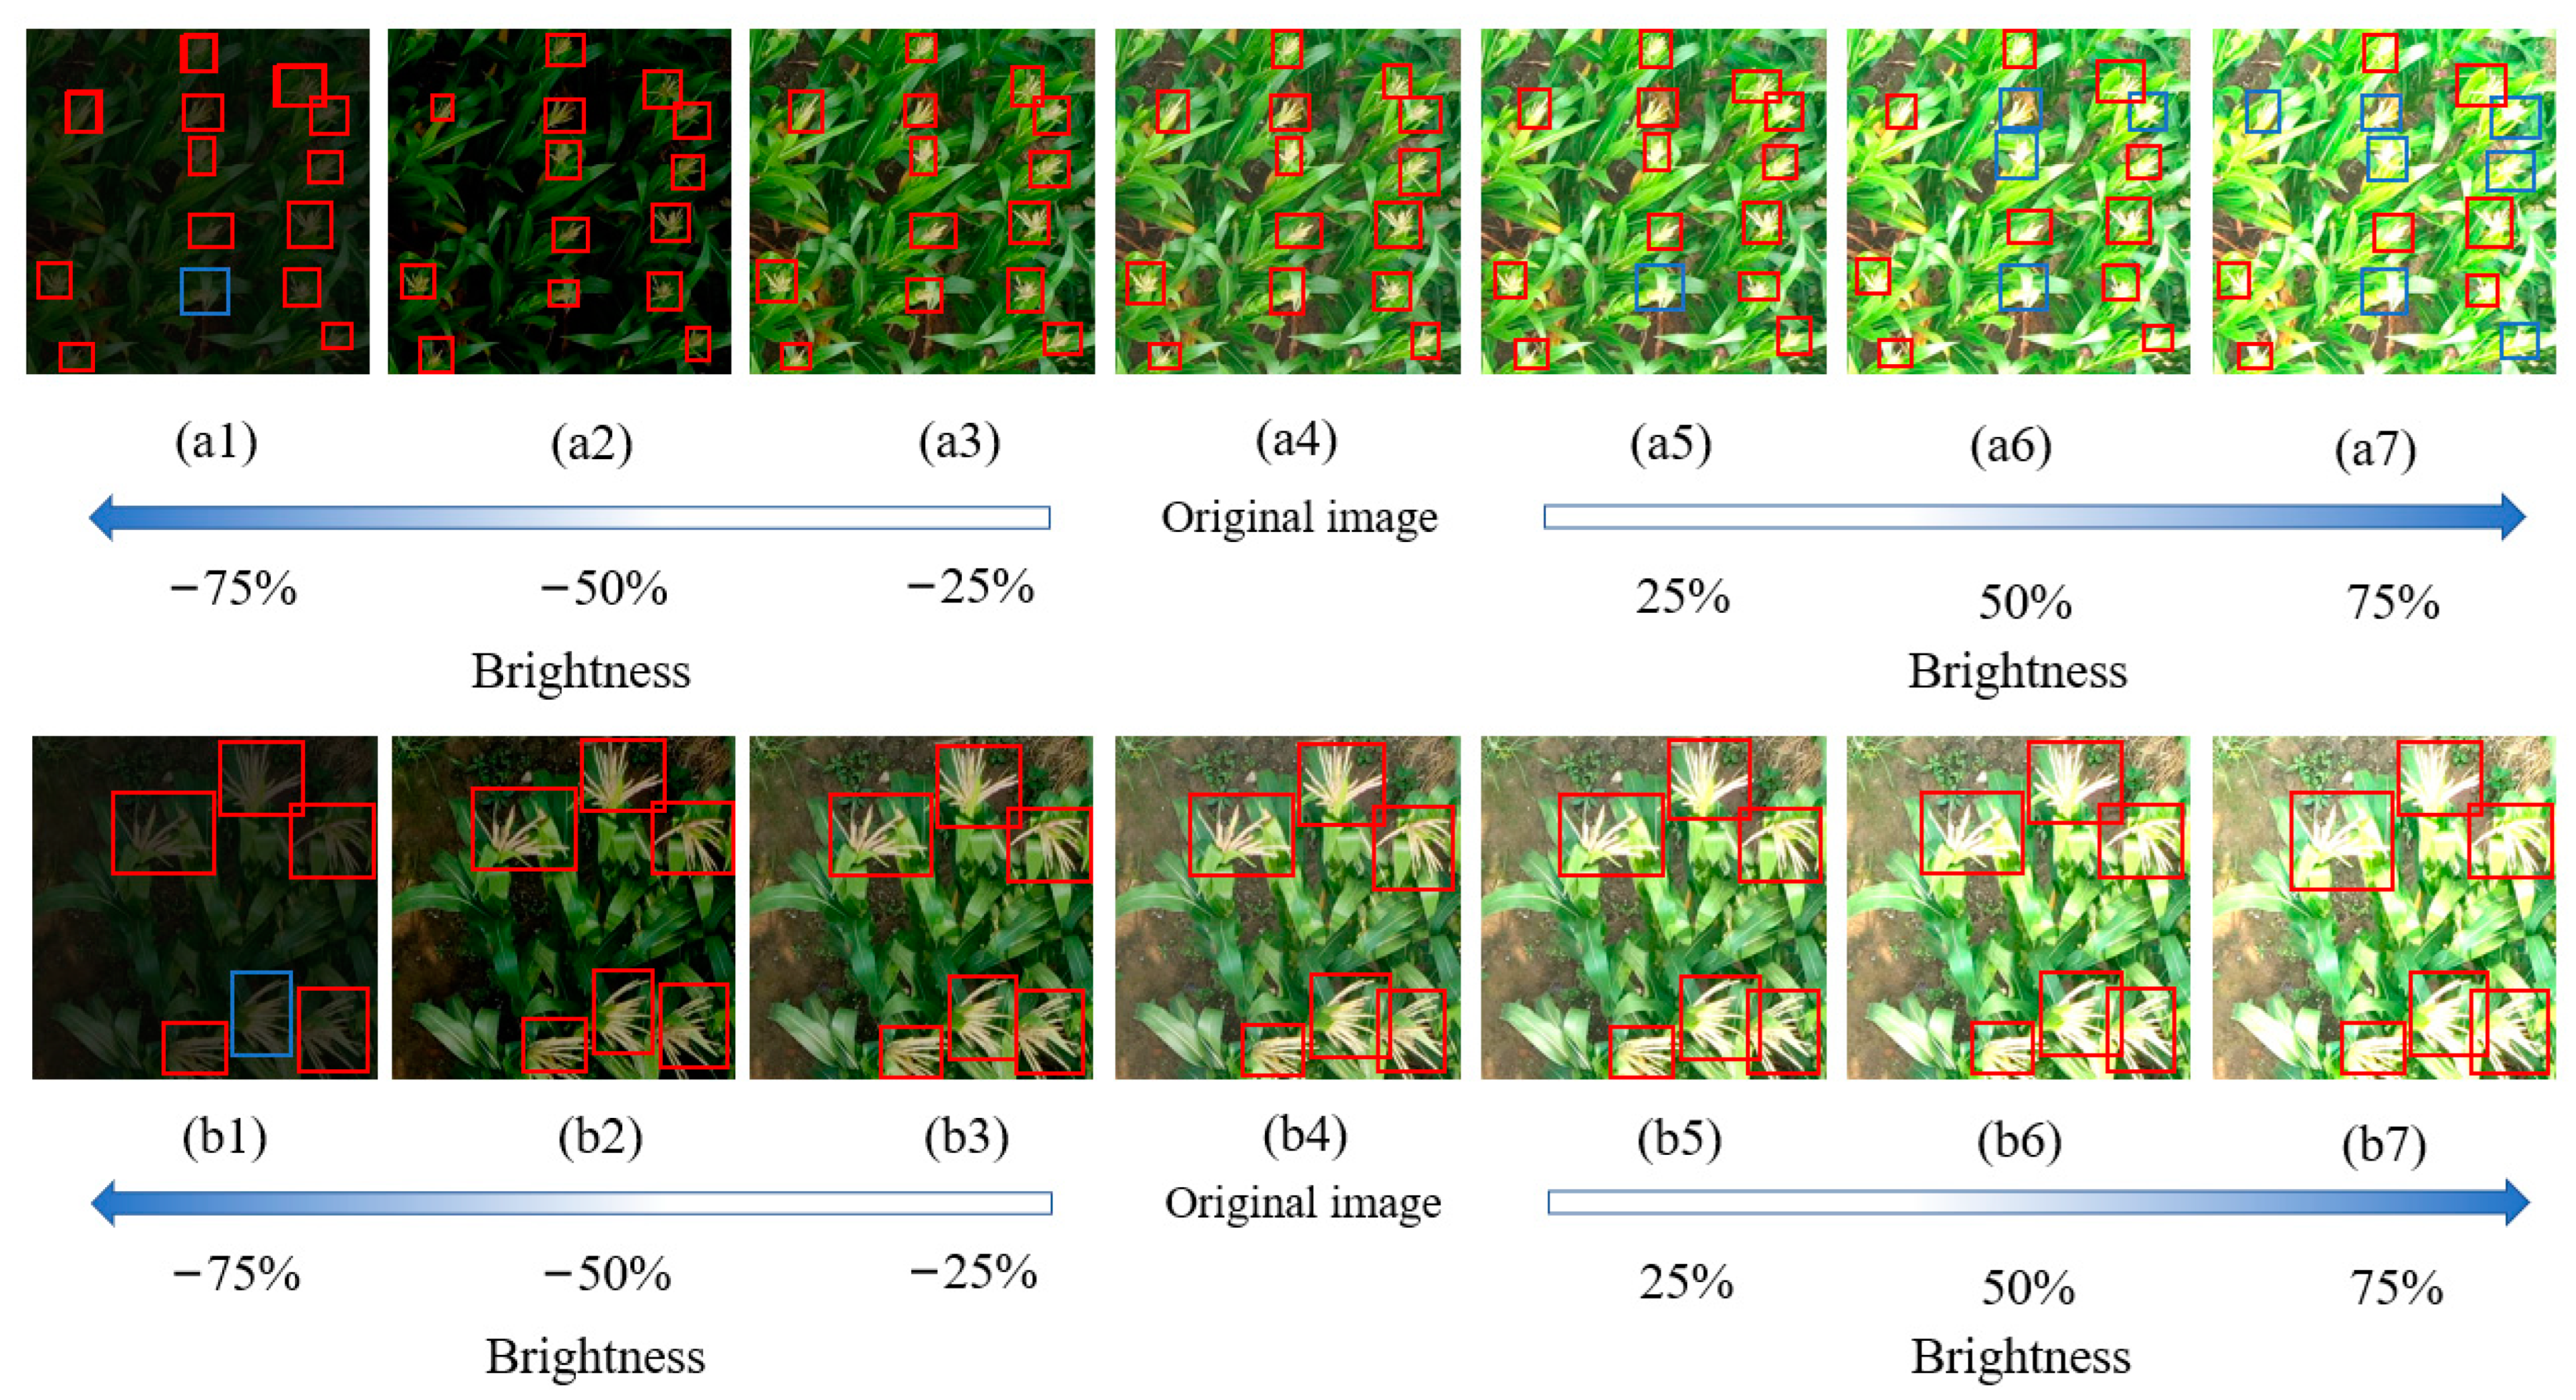
Although the improved RetinaNet model already performed better for detecting maize tassels, we further investigated whether the interference of complex backgrounds, such as brightness variations, affects the model’s detection capability. In this study, we conducted experiments to elucidate how image brightness affects the detection of maize tassels. The experiments used images of smaller and larger maize tassels from the test dataset and processed the image pixels in a Python program using the exponential transform function of the NumPy library to increase or decrease the brightness of the images. We used an improved RetinaNet model to detect the maize tassels under different conditions of brightness. The results appear in
Figure 11.
Figure 11 shows that the detection by the improved RetinaNet model of maize tassels at different brightness levels depended significantly on the brightness.
Figure 11(a1)–(a7) show the detection of smaller maize tassels. When the brightness was −75%, the improved RetinaNet model detected fewer maize tassels. When the brightness was −50% or −25%, the improved RetinaNet model detected a relatively constant number of maize tassels with a detection accuracy approaching 100%. With enhanced brightness (25%, 50%, and 75%), the RetinaNet model again detected fewer maize tassels, with the number of missed tassels increasing with increasing brightness.
Figure 11(b1)–(b7) show the detection by the improved RetinaNet model of larger maize tassels. These results show that, as the brightness decreases, fewer maize tassels are detected, and, as the brightness increases, only larger maize tassels are detected.
The above analysis shows that the improved RetinaNet model has difficulty detecting maize tassels at different levels of brightness. As the brightness is reduced, the detection of maize tassels becomes progressively worse; as the brightness increases, smaller maize tassels are less often detected than larger ones. The main reason for this is that excessive brightness severely increases the interference from the image background, making it less likely that small maize tassels are detected. These experimental results have important implications for the detection of small maize tassels in complex scenarios. In practical scenarios, the effect of light intensity on detection must be considered when using UAV remote sensing and AI detection techniques for maize tassel detection.
4.3. Effect of Plant Variety on Detection of Maize Tassels
This study was designed to investigate how different maize varieties and the resulting maize tassel morphology affect the detection by the improved RetinaNet model. The experiment was carried out on 5, 9, and 20 August 2021 using the same UAV to obtain images of maize tassels from the same height (10 m). As of 5 August 2021, all maize varieties had already entered the filling stage, and, on 20 August 2021, all maize tassels had entered the milking stage. In other words, before these data were acquired, all maize tassels had already completed pollination, so their status remained largely unchanged during these experiments.
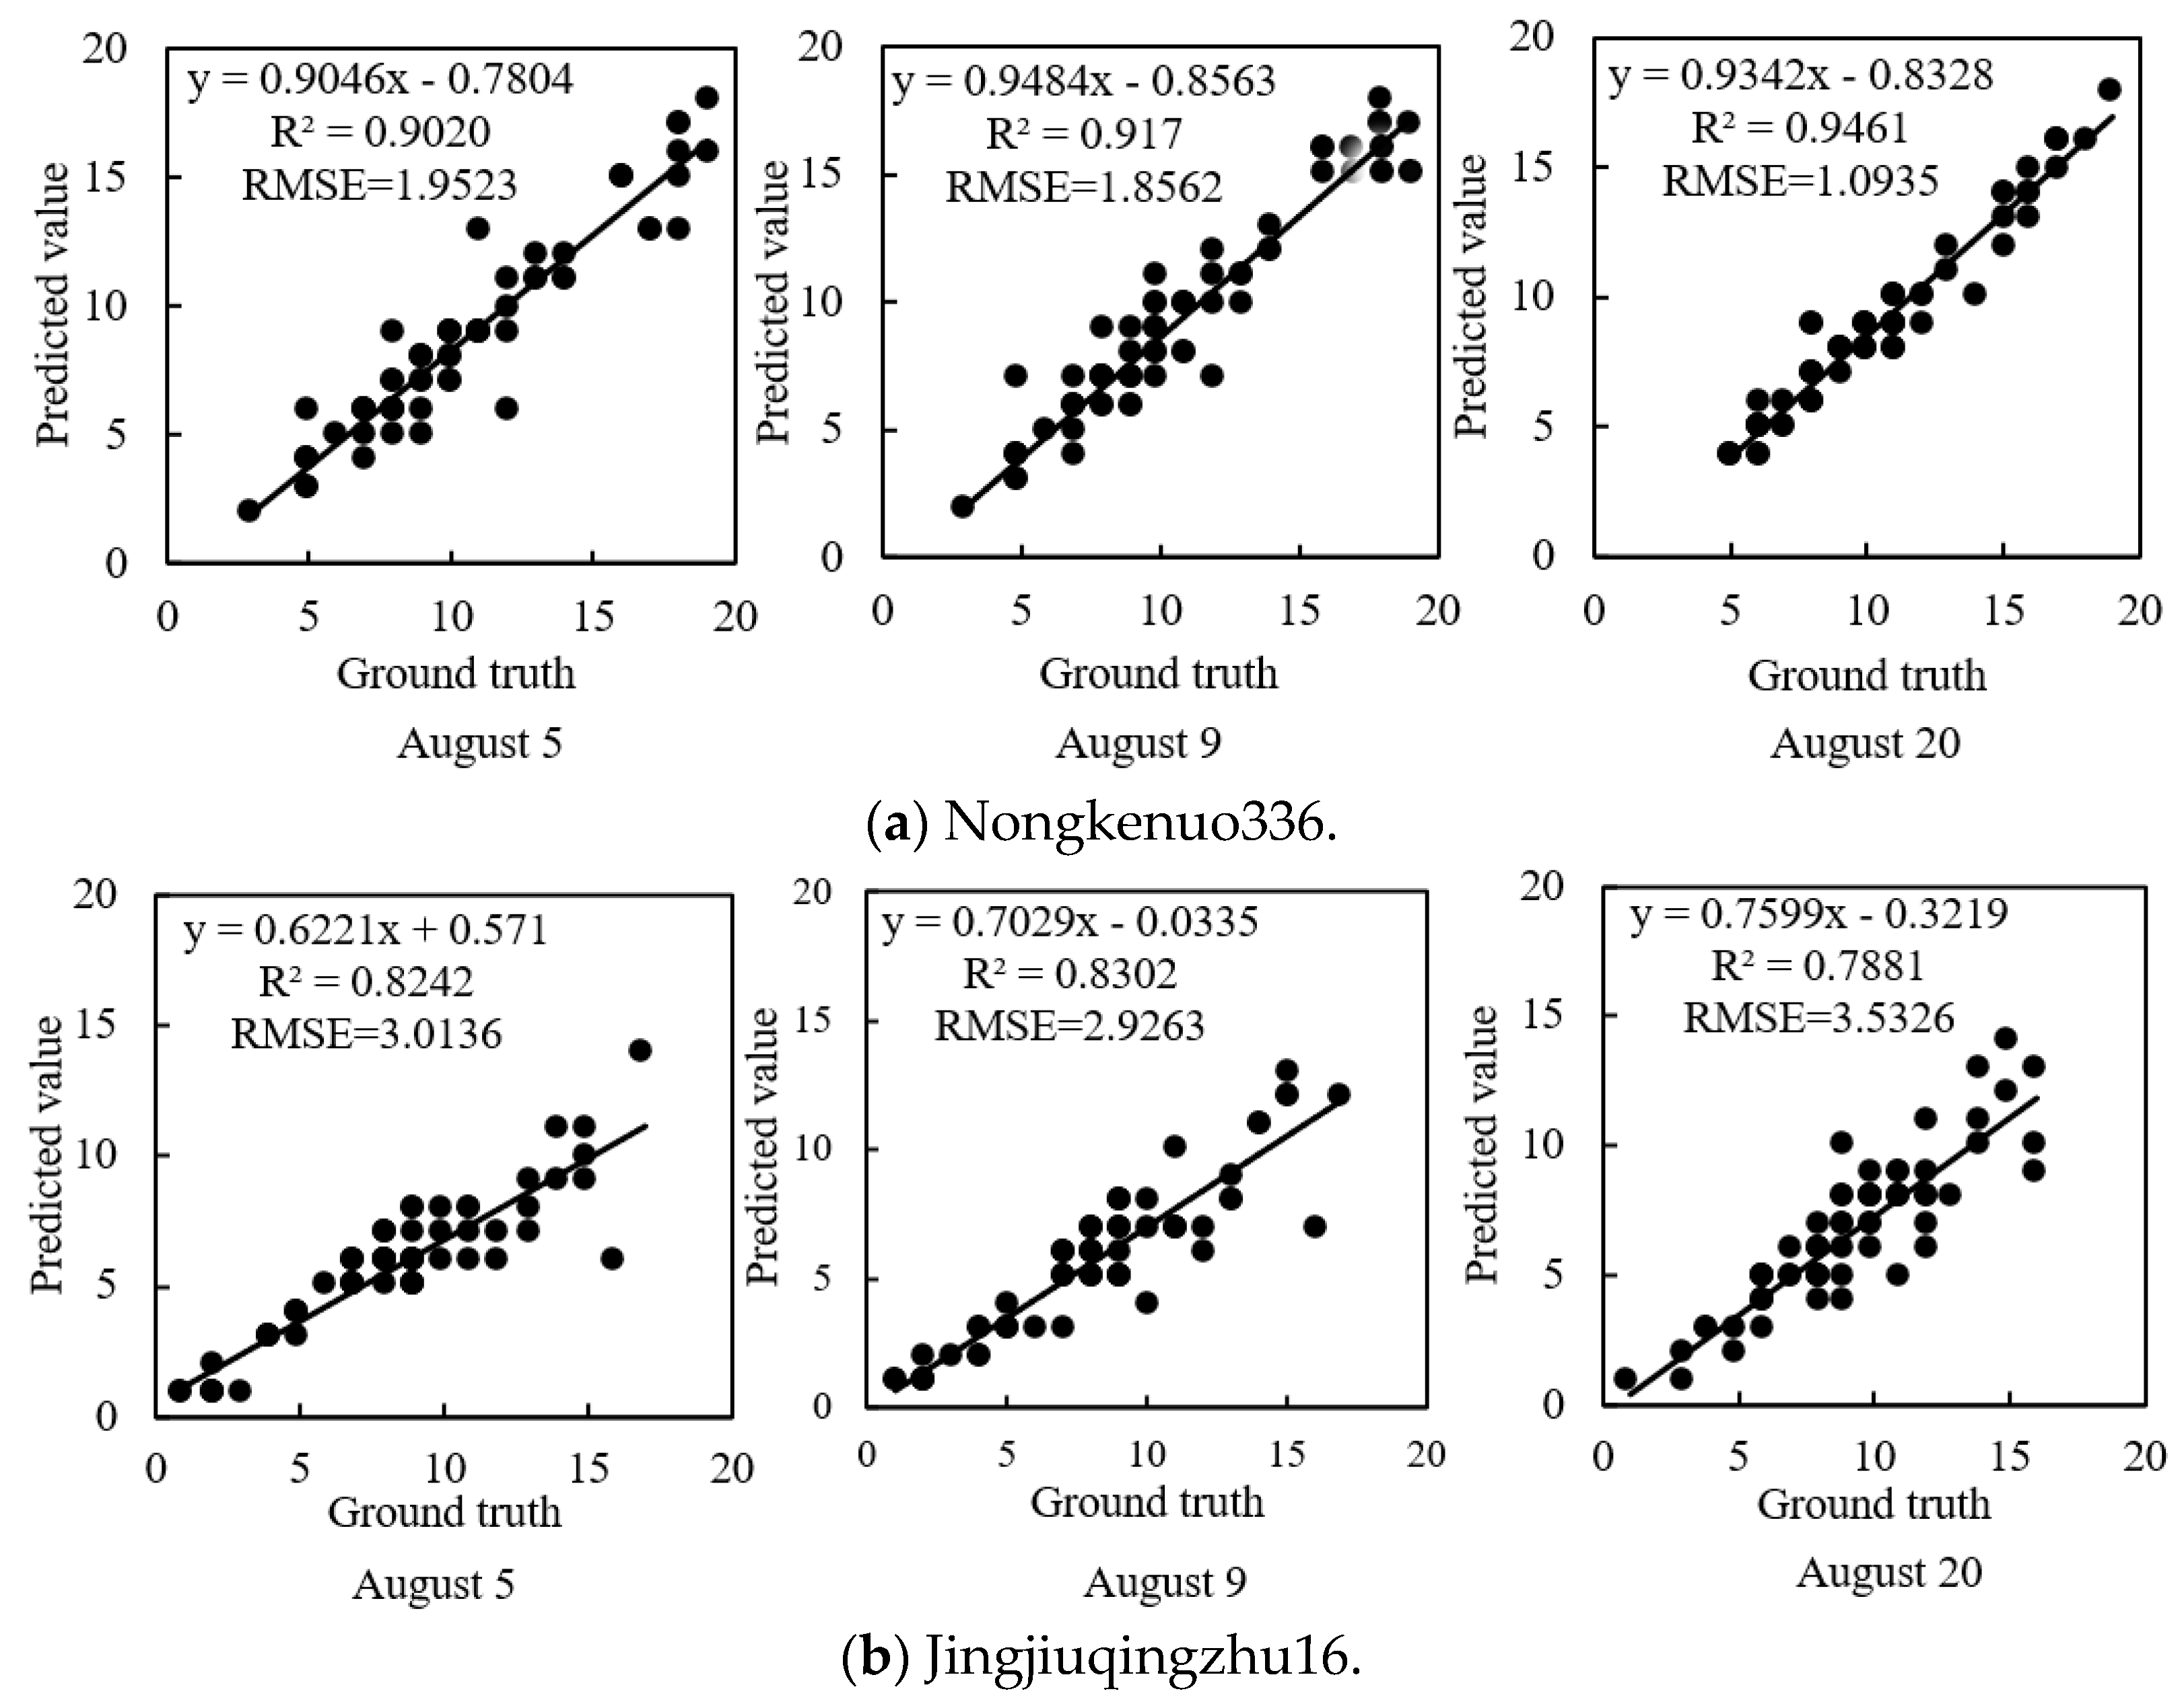
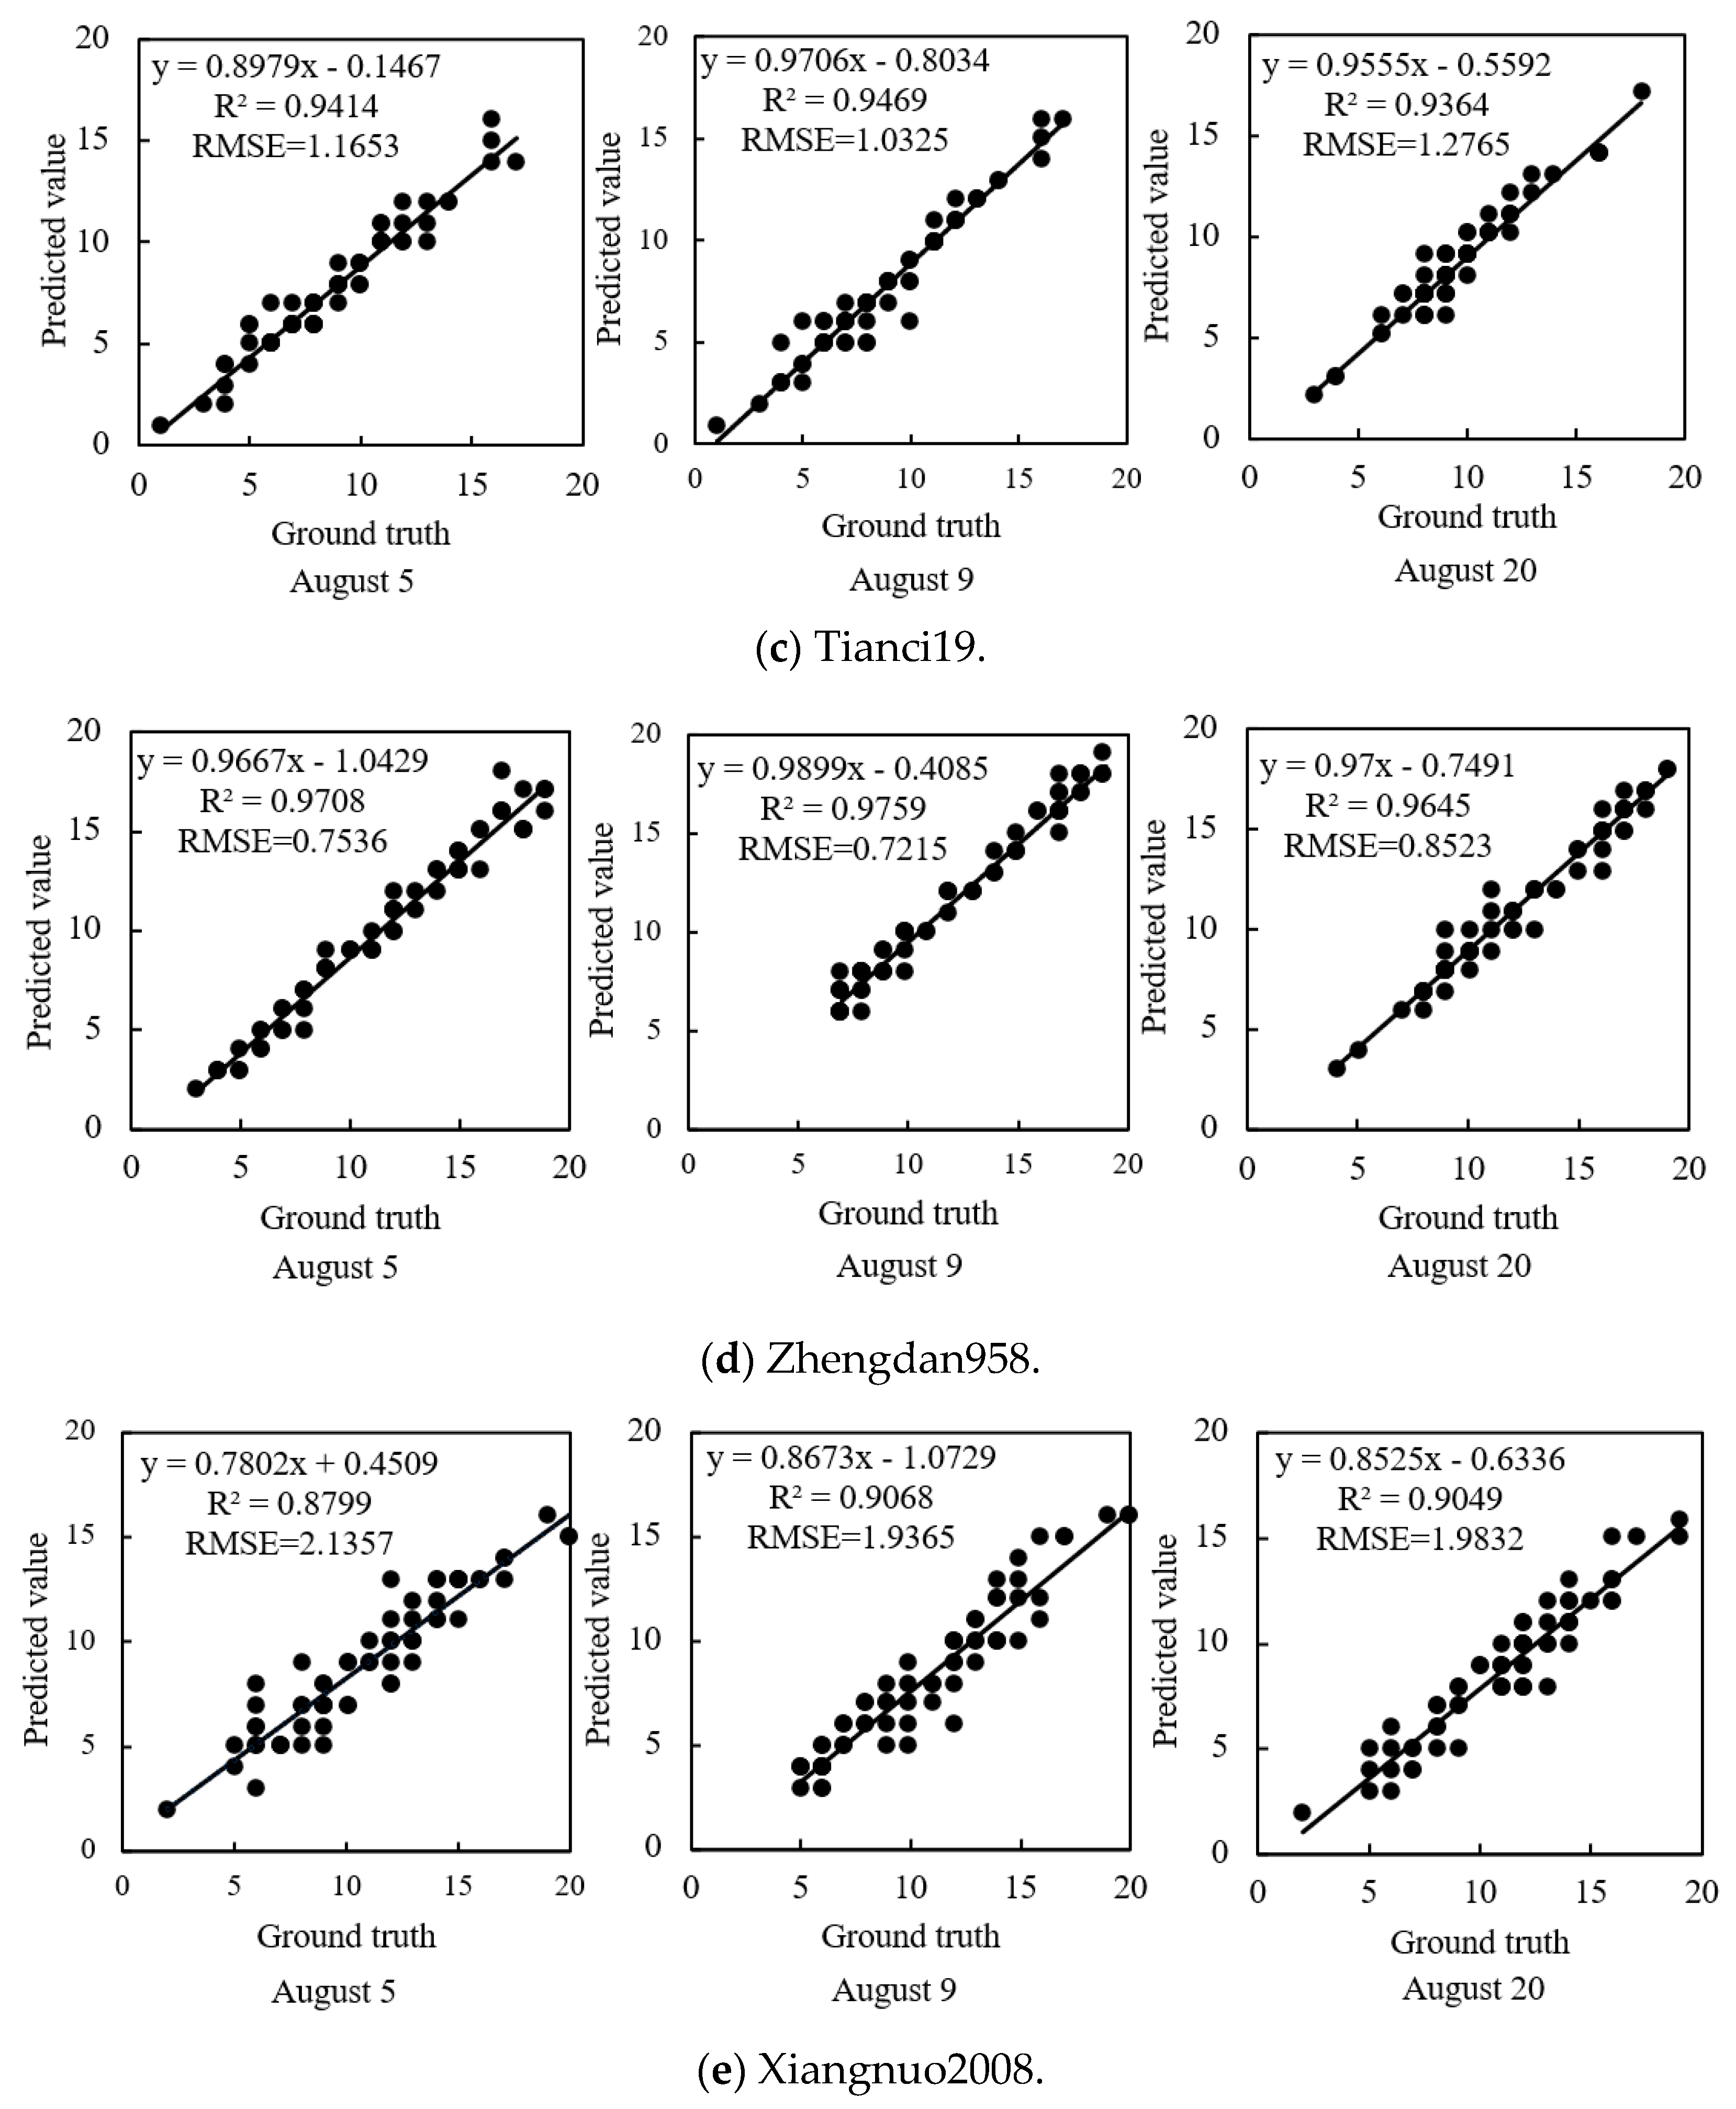
Figure 12 shows the morphology of maize tassels of different varieties. This study used maize tassel data acquired by the UAV on 9 August 2021 as the dataset to train the model used herein, and the test set of 320 images may be divided into five groups based on plant variety, with 64 images in each group. The maize tassel images acquired on 5 and 20 August were filtered, and 320 images of maize tassels were obtained in the same way in the same area as the test set acquired on 9 August. The images were divided by plant variety into five datasets, with 64 images in each group. After preparing the datasets, the maize tassels were detected by the improved RetinaNet model, and the results are shown in
Figure 13.
For the Zhengdan958 variety, the experimental results gave R2 = 0.9708, 0.9759, and 0.9654 for 5, 9, and 20 August, respectively, and RMSE = 0.7536, 0.7215, and 0.8523, respectively. Among the five varieties, the model was most effective for detecting maize tassels of Zhengdan958. For the Jingjiuqinzhu16 variety, the improved RetinaNet model produced R2 = 0.8242, 0.8302, and 0.7881 and RMSE = 3.0136, 2.9263, and 3.5326, respectively. Of the five varieties, the most difficult to detect was Jingjiuqingzhu16. Zhengdan958, Nongkenuo336, and Tianci19 all had better detection results, whereas Jingjiuqingzhu16 and Xiangnuo2008 had poorer detection results. The main reason is that the spike branches of Jingjiuqingzhu16 and Xiangnuo2008 are thinner and have fewer branches, so they are more likely to be missed, whereas Zhengdan958, Nongkenuo336, and Tianci19 are more easily detected because they have larger and more numerous spike branches. The above analysis shows that differences in the tassel morphology of the different maize varieties can affect the efficiency of model detection. In practical applications, the flight height of the UAV can be adjusted to account for the varieties of maize tassels, or the data can be augmented during data processing to improve the detection results.
4.4. Effect of Planting Density on Detection of Maize Tassels
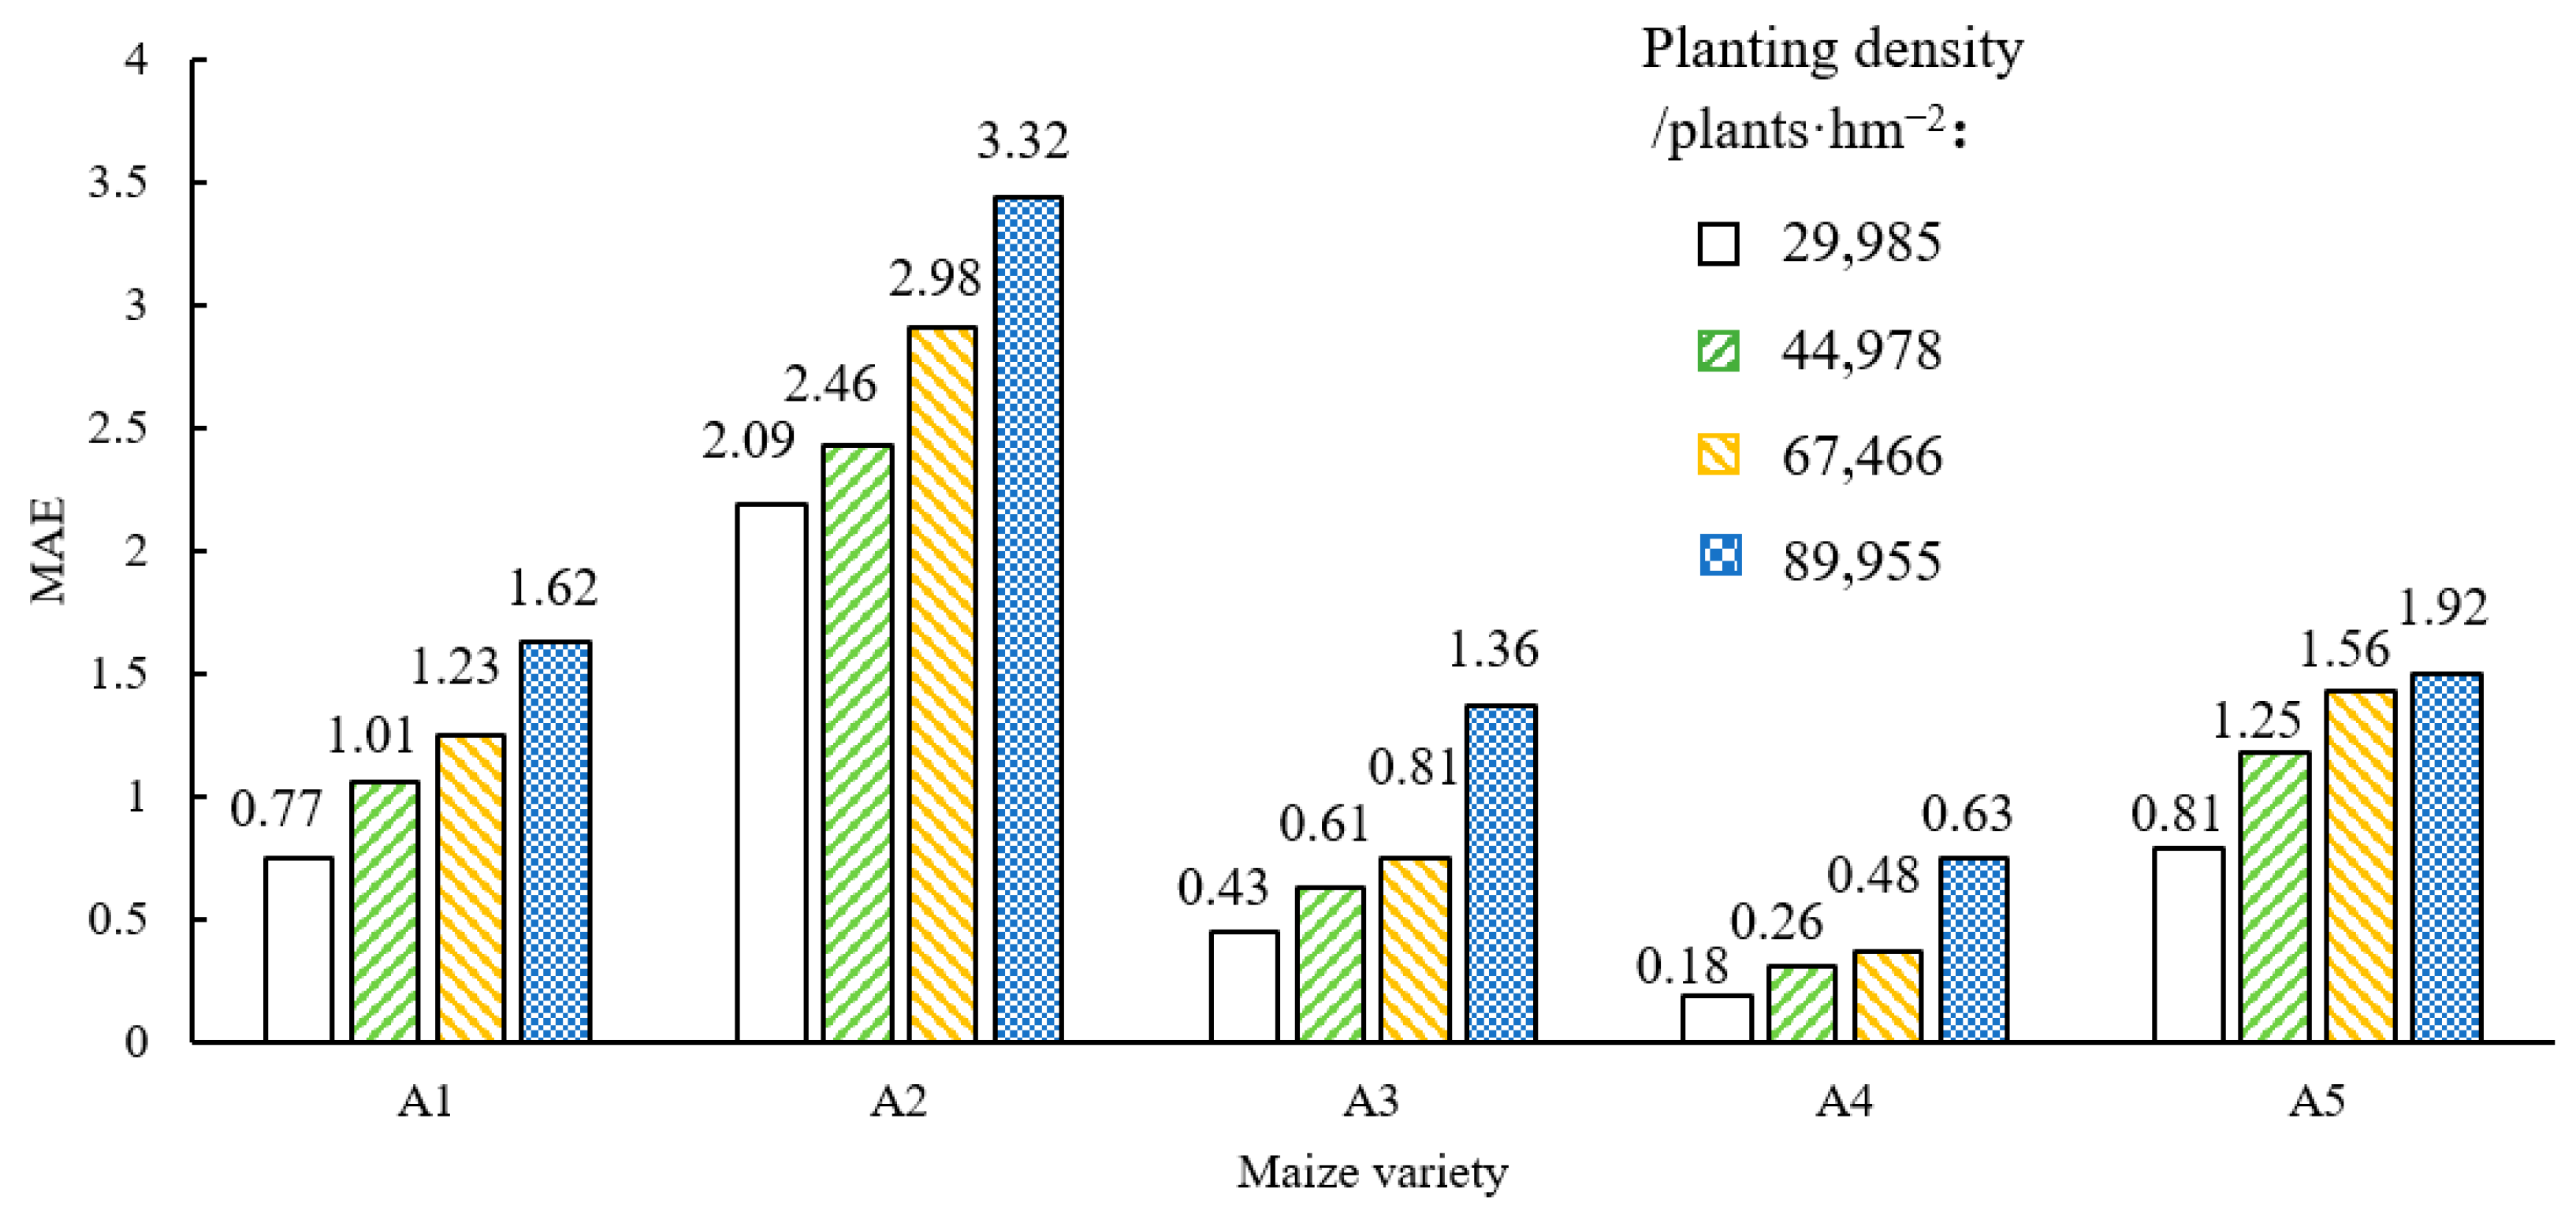
To investigate how the planting density affects the detection of maize tassels, 320 images acquired on 9 August 2021 from the sample area were classified according to the planting density, producing 16 images for each variety and each planting density. To verify how the planting density affects maize tassel detection by the improved RetinaNet model, we examined images of maize tassels at different planting densities for given plant varieties and calculated the MAE. In fact, we conducted thinning work at the seedling stage to ensure that the strongest plants were left at each point and that there were no shortages or excess seedlings, so the planting density was stable and reliable. The recommended planting density for Nongkenuo336 is 45,000–52,500 plants/hm
2, 67,500–75,000 plants/hm
2 for Jingjiuqingzhu16, 60,000–67,500 plants/hm
2 for Tianci19, 82,500–90,000 plants/hm
2 for Zhengdan958, and 52,500–60,000 plants/hm
2 for Xiangnuo2008.
Figure 14 shows the experimental results.
The results in
Figure 14 show that, at the same planting density, the MAE varied widely between plant varieties. At planting densities of 29,985, 44,978, 67,466, and 89,955 plants/hm
2, the respective MAEs of the model were 0.77, 1.01, 1.23, and 1.62 for Nongkenuo336, 2.09, 2.46, 2.98, and 3.32 for Jingjiuqinzhu16, 0.43, 0.61, 0.81, and 1.36 for Tianci19, 0.18, 0.26, 0.48, and 0.63 for Zhengdan958, and 0.81, 1.25, 1.56, and 1.92 for Xiangnuo2008. The MAEs for Zhengdan958 were significantly smaller than those for Jingjiuqinzhu16. The MAE for a given variety increased with increasing planting density.
These results show that the detection accuracy of the improved RetinaNet depends not only on planting density but also on plant variety. The main trend is that the detection error increased as the planting density increased. The main reason for this trend is that increasing planting density causes increasing overlap and shading between the tassels, interfering with the detection process. Maize tassel detection by the improved RetinaNet model also depended on the variety of maize tassels, with Zhengdan958 having larger and more numerous branches, which resulted in lower detection errors, whereas Jingjiuqinzhu16 has thinner and less numerous branches, which resulted in higher detection errors. These results confirm that maize tassels of different plant varieties affect the detection by the improved RetinaNet model.
5. Conclusions
The main purpose of this study was to improve the model for detection of maize tassels, especially when faced with multiscale maize tassel detection. We used an unmanned aerial vehicle (UAV) to obtain maize tassel images, created a maize tassel dataset, which we used to optimize the FPN structure, and introduced an attention mechanism based on the RetinaNet model. By improving the RetinaNet model, we could increase the detection effectiveness for maize tassels of different sizes as a way to achieve the goal of multiscale tassel detection. In addition, we analyzed different image resolutions, brightness levels, plant varieties, and planting densities to determine how these factors affect maize tassel detection by the improved RetinaNet model.
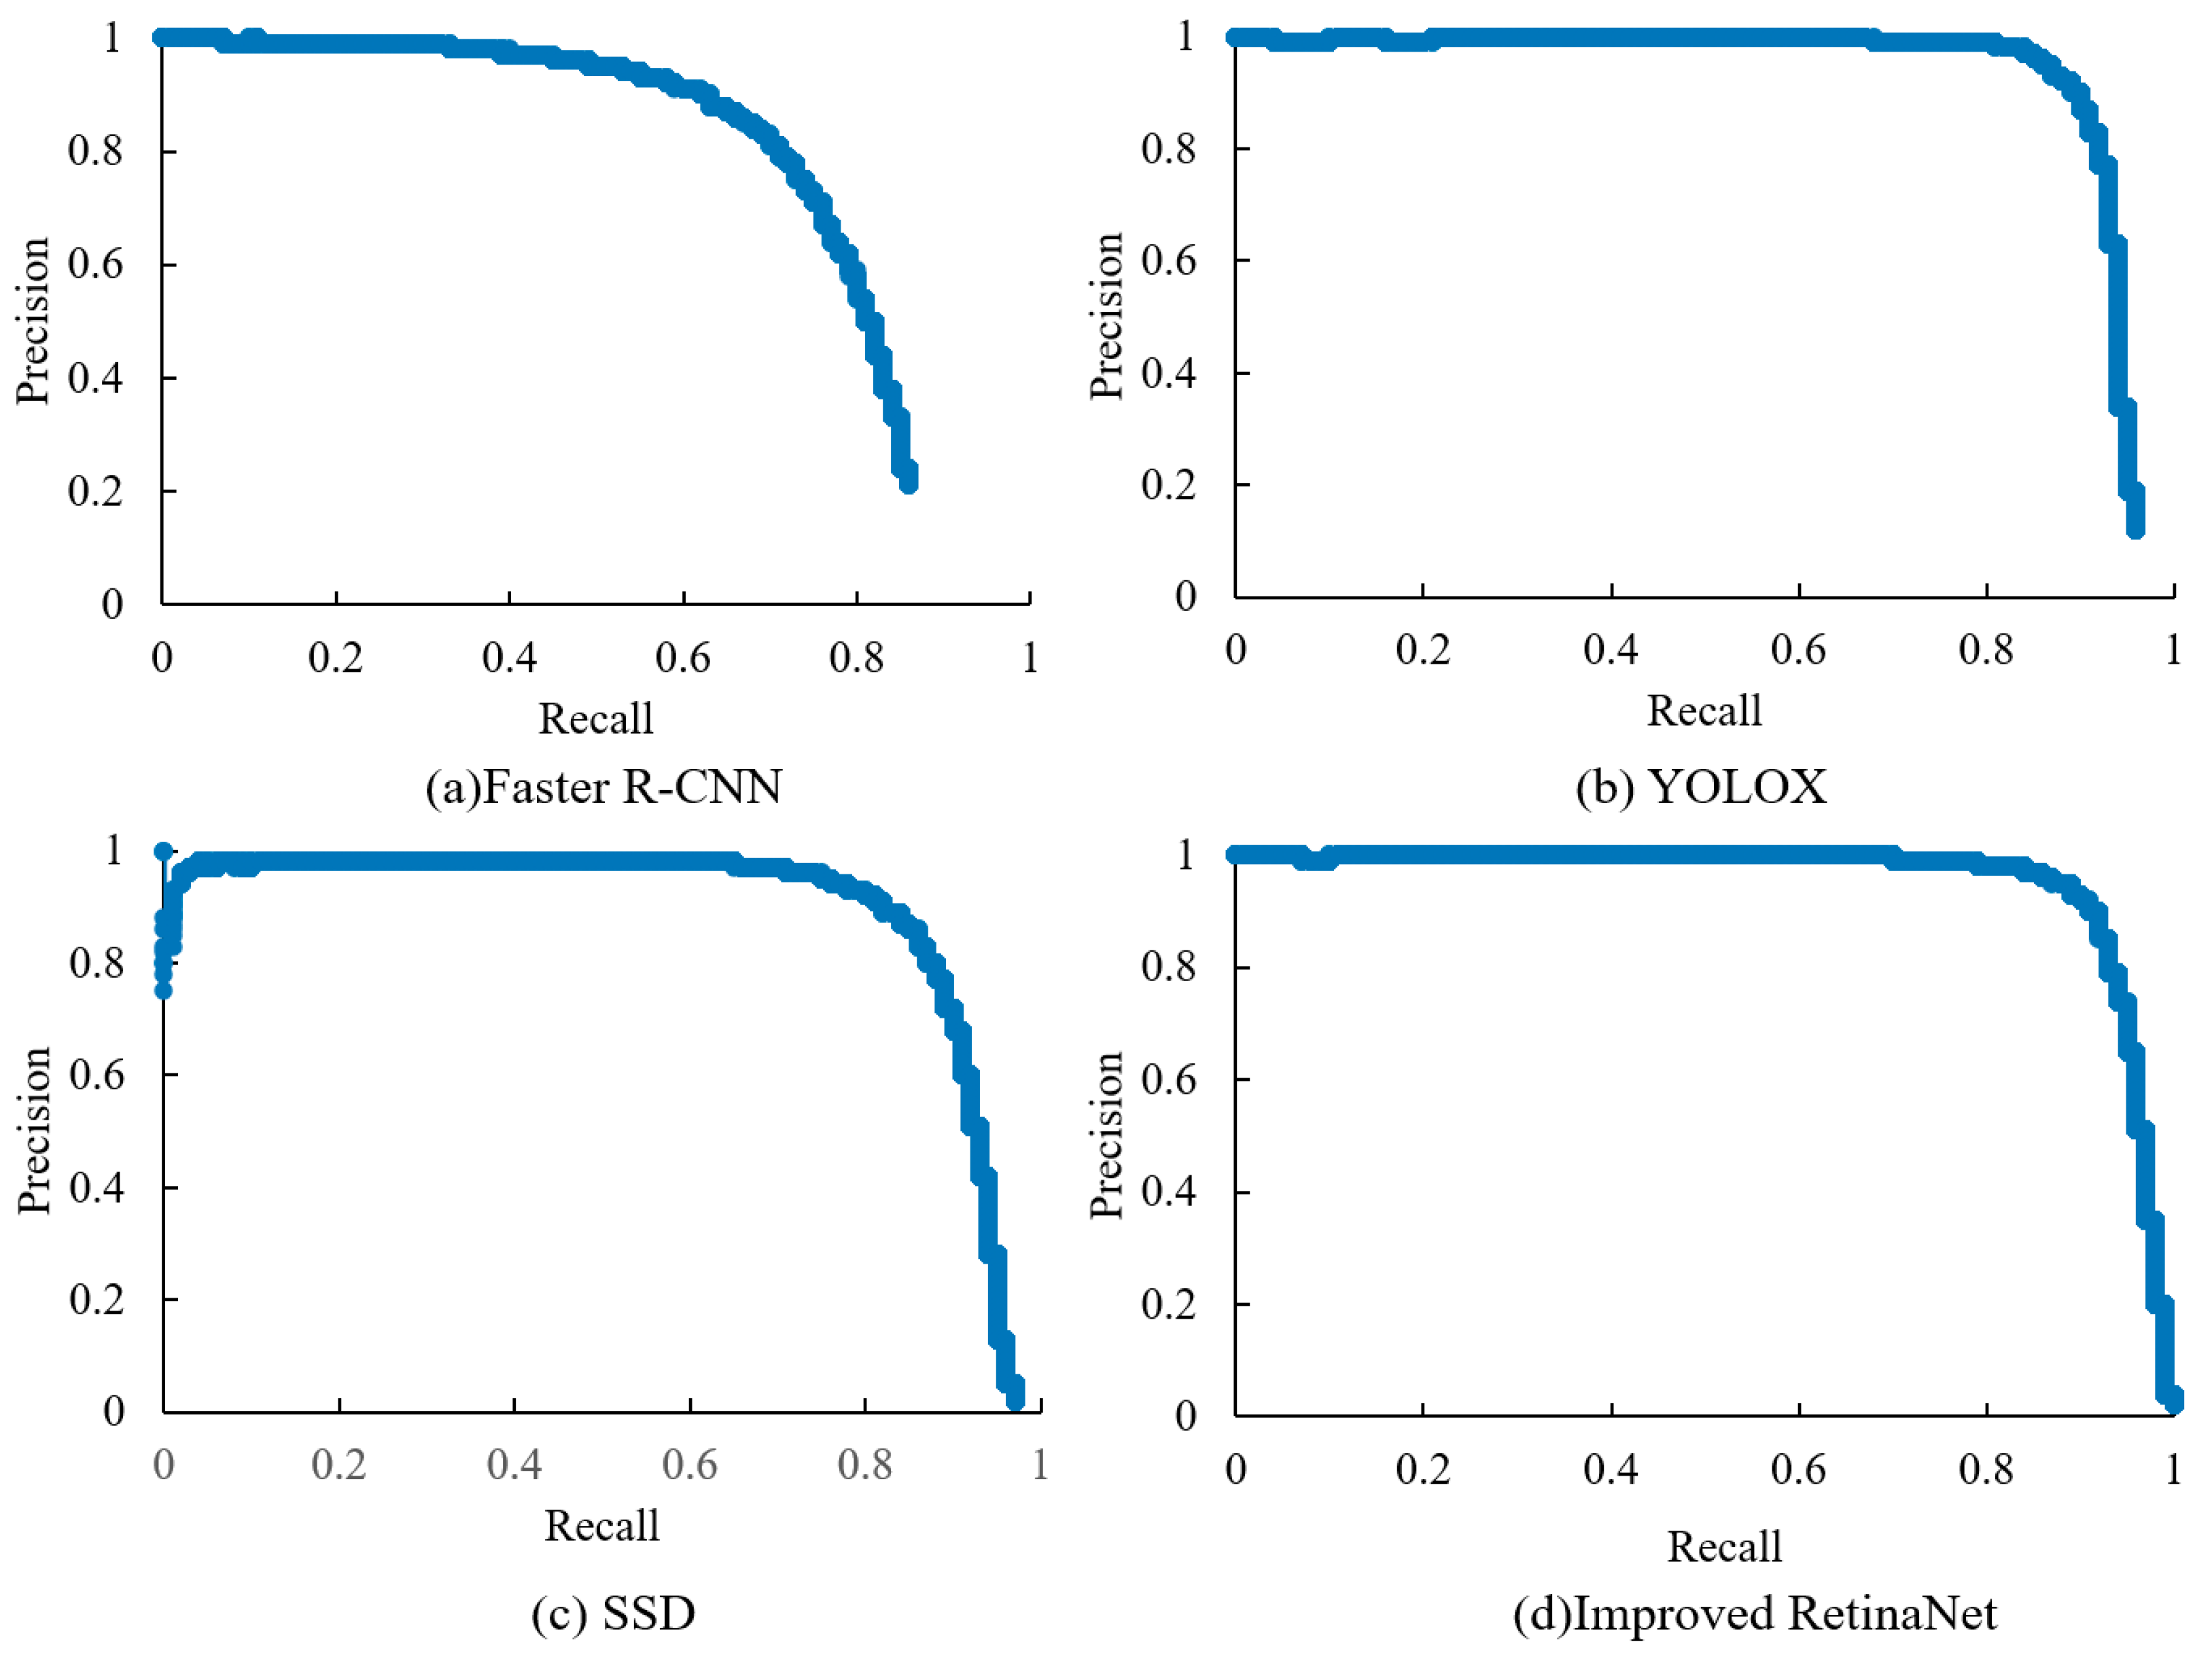
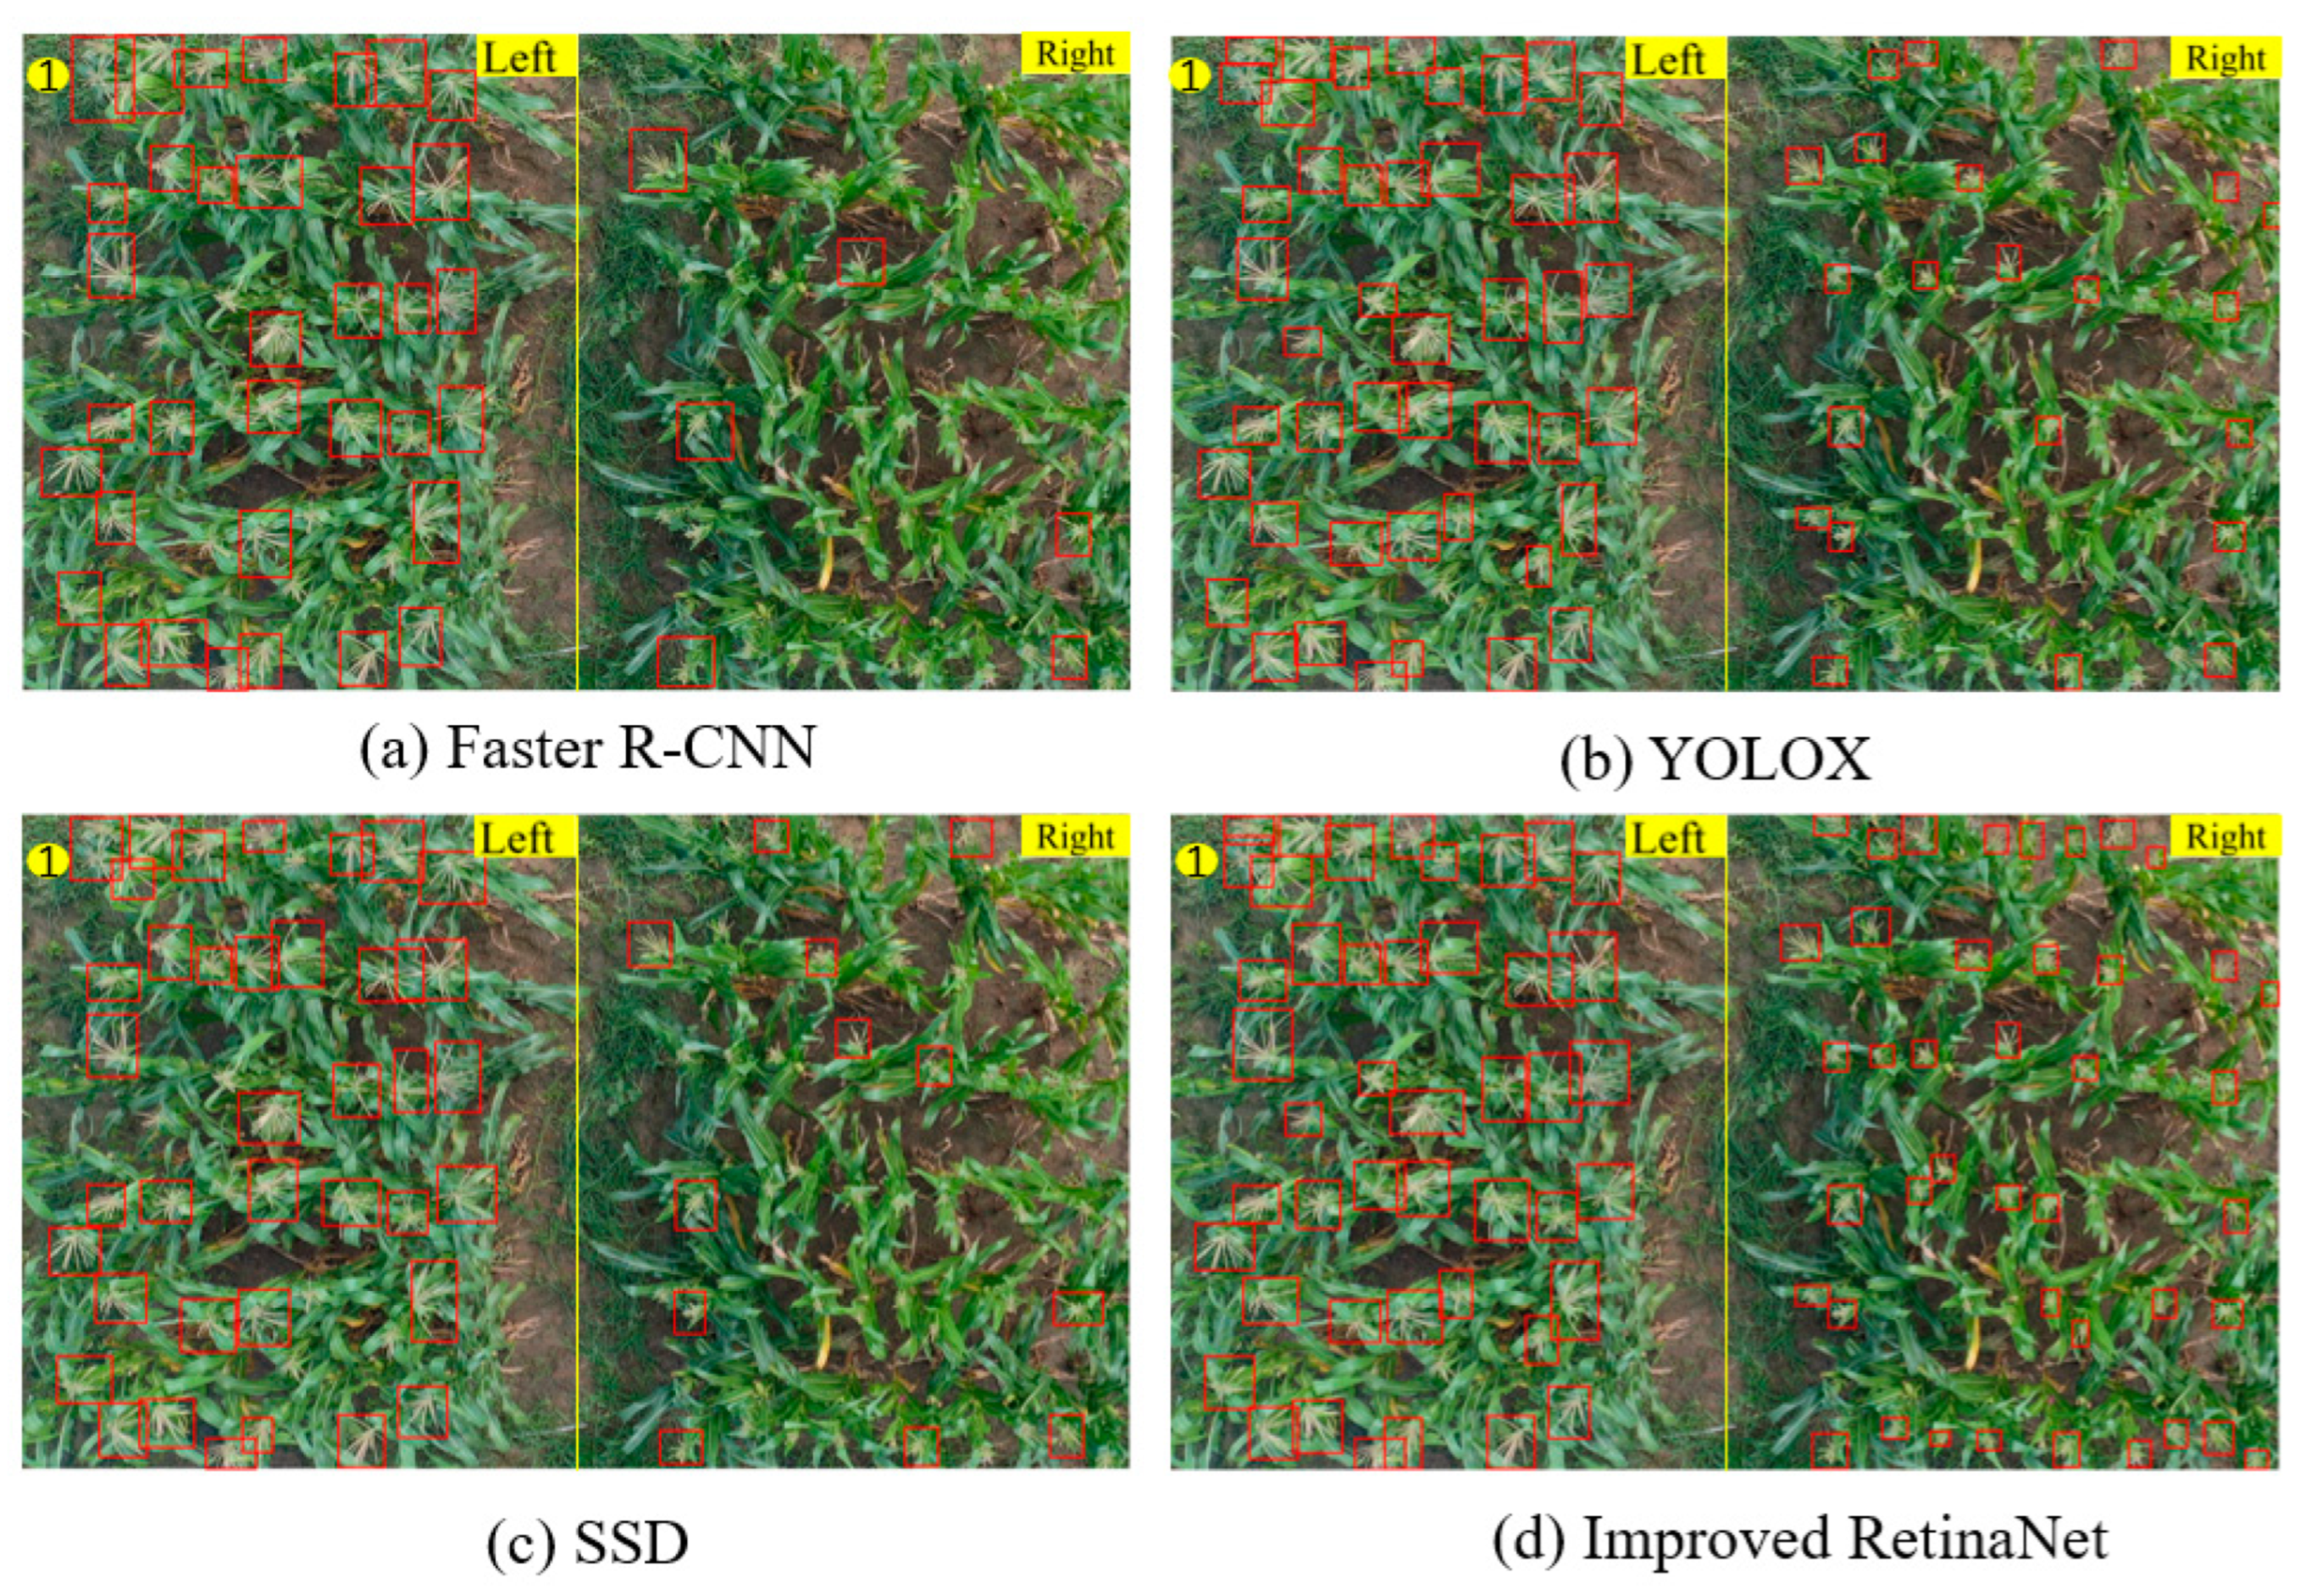
The results of this research led to the following conclusions: Optimizing the FPN structure and introducing the CBAM attention mechanism significantly improved the ability of the improved RetinaNet model to detect maize tassels. The average precision of the improved RetinaNet algorithm was 0.9717, the precision was 0.9802, and the recall was 0. 9036. The improved RetinaNet algorithm was also compared with the conventional object detection algorithms Faster R-CNN, YOLOX, and SSD. The improved RetinaNet algorithm more accurately detected maize tassels than these conventional algorithms, especially smaller maize tassels. The detection accuracy of the improved RetinaNet model decreased as the image resolution decreased. In addition, when the image brightness was low, the improved RetinaNet model better detected maize tassels and vice versa. Furthermore, this effect was amplified for small maize tassels. The tassel morphology depends on the maize variety, so detection by the improved RetinaNet algorithm also depended on the maize variety. Of the five maize varieties tested, Zhengdan958 (Jinjiuqinzhu16) tassels were detected the most (least) accurately. The detection accuracy also depended on planting density. Essentially, increasing the planting density increased the error in maize tassel detection. This study used UAV remote sensing technology and computer vision technology to improve maize de-fertilization and counting capabilities, which are vital for maize production and monitoring. In future work, we hope to predict maize tassel growth by using remote sensing and deep learning technologies.
