Article

Assessment of Nitrogen Nutrition Index of Winter Wheat Canopy from Visible Images for a Dynamic Monitoring of N Requirements

by
Christelle Gée
1,*,
Emmanuel Denimal
2,
Maël de Yparraguirre
1,
Laurence Dujourdy
2 and
Anne-Sophie Voisin
1
1
Agroécologie, INRAE, Institut Agro, Université Bourgogne Franche-Comté, F-21000 Dijon, France
2
Institut Agro, Cellule d’appui à la Recherche en Science des Données, F-21000 Dijon, France
*
Author to whom correspondence should be addressed.
Remote Sens. 2023, 15(10), 2510; https://doi.org/10.3390/rs15102510
Submission received: 1 April 2023 / Revised: 3 May 2023 / Accepted: 5 May 2023 / Published: 10 May 2023
(This article belongs to the Section Remote Sensing in Agriculture and Vegetation)

Abstract

:
Hand-held chlorophyll meters or leaf-clip-type sensors indirectly and instantaneously measure leaf N content. They can provide an N nutrition index (NNI) value that is crucial information for adjusting the amount of N fertilizer to the actual N status of the plant. Although these measurements are non-invasive and non-destructive, they require numerous repetitions at the canopy scale. The objective of this work was to explore the potential of visible images to predict nitrogen status in winter wheat crops from estimating NNI and to compare these results with those deduced from classical methods. Based on a dark green colour index (DGCI), which combines hue, saturation and brightness, a normalized DGCI (nDGCI) was proposed as the ratio between the measurements of the study microplot and those of the over-fertilized microplot. The methodology was performed on winter wheat microplots with a nitrogen gradient. Half of the microplots were grown with a single cultivar (LG Absalon) and the other half with a mixture of four wheat cultivars. The impact of optical device (digital camera or smartphone), the white balance (Manual or Automatic), the crop growth stage (two-nodes or heading) and cultivars (single or mixed) on the relationship between (DGCI, nDGCI) and NNI was evaluated. The results showed a close correlation between the nDGCI values and the NNI_NTester values, especially on a single cultivar (LG Absalon; R2 = 0.73 up to 0.91 with smartphone). It suggested that the relationship is highly sensitive to the wheat cultivar. This approach with no specific calibration of images is promising for the estimation of N requirements in wheat field.

1. Introduction

The balance-sheet method was widely used for decades as a reference method to calculate the amount of nitrogen (N) fertilizer to supply to winter wheat [1,2]. Even this method is based on rigorous scientific knowledge, it remains difficult to minimize N losses whilst maximizing crop yield and quality. A mismatch between the science-based method and its implementation was evidenced [3]. Among other reasons, it appears particularly difficult to accurately predict the actual crop N requirement in advance (i.e., at the end of winter). Therefore, alternative methods were proposed for a dynamic fertilization management [4], through a better adjustment of N fertilization (as dates/rates of N inputs) to the wheat crop N requirements. For this, these methods use a weekly estimation of the crop’s nitrogen status all along wheat growth using the N nutrition index (NNI) [5,6], so as to synchronize the periods the dates/rates of inputs with plant N requirements [7,8,9]. NNI is calculated as the ratio of the measured N concentration (%N) and the N concentration critical value (%Nc) for a defined dry biomass [10]. The calculation of the NNI, therefore, necessarily involves destructive field sampling for dry biomass and N content in biomass. Proxi- or remote-sensing techniques are promising for indirect estimation of NNI, as they have the advantages of being fast, non-destructive and reliable [11]. As leaf N content is strongly correlated with chlorophyll content [12], it can be estimated indirectly on the basis of the optical properties of leaves [13,14]. Thus, hand-held chlorophyll meters (Greenseeker (NTech Industries, Inc., Ukiah, CA, USA)) or leaf-clip-type sensors such as Yara N-Tester (Yara International ASA, Oslo, Norway) or SPAD-502 (Minolta Camera Co., Osaka, Japan) or Dualex Scientific+ (Force-A, Orsay, France) were developed to measure indirectly the leaf chlorophyll content instantaneously. Nevertheless, studies on the correlation between conventional (Chlorophyll meter readings, CMR) or reflectance (NDVI) measurements are affected by genotypes and growth stage [15,16,17]. For this reason, a normalized CMR (or CMR index) was proposed. It corresponds to the ratio between the CMR of plants and that of N over-fertilized plants [18,19]. Since they require contact measurement of the leaf, they are still tedious to use on a stand scale. With imagery, a non-contact approach, using the reflectance signal, has been developed to characterize the intrinsic parameters of vegetation. This approach is based on colour vegetation indices (CVIs) that combine simple mathematical operations on reflectance [20]. For fertilization [21,22], these indices are mainly based on Red, RedEdge and Near Infrared wavelengths (NDVI: Normalized Difference Vegetation Index [23], SAVI: Soil Adjusted Vegetation Index [24], NBI: Nitrogen Balance Index [25]). Based on visible images, the low-cost smartphone approach could also offer a promising solution. In the visible range, the most common vegetation index is the excess green index (ExG or 2g-r-b index) proposed by Woebbecke et al. [26]. Another visible band index, the triangular greenness index (TGI) was explored to leaf chlorophyll content by remote sensing [27]. The correlation coefficient between TGI and chlorophyll meter readings was −0.86. However, it was found that the hue (H), saturation (S) and brightness (B) of CVIs showed strong correlation with chlorophyll meter readings [28,29]. Thus, Karcher and Richardson [30] proposed a specific vegetation index developed in the HSB colour space, the Dark Green Colour Index (0 ≤ DGCI ≤ 1). It is particularly correlated with the nitrogen status of crops. They also demonstrated that correlations between colour and chlorophyll are dependent to cultivar but did not explore the effect of cultivar on the relationship between DGCI and NNI. DGCI was first proposed to assess the N status of turfgrass, it was later used for rice, soybean or maize crops with visible images taken at leaf scale and using the colour disks of standard calibration board [30,31,32,33,34]. According to a calibration process of DGCI (corrected leaf DGCI) for illumination, these studies revealed a strong correlation (R2 > 0.85) between DGCI and chlorophyll meter readings (CMR). The calibration is based on the use of standardized yellow (DGCI = 0) and dark green (DGCI = 1) disks. The range of DGCI values is correlated to a leaf colour chart (LCC) developed to guide the real-time needs-based fertilizer N application in rice. Depending on the number of colour panels, different LCC [35,36,37] were developed with a colour ranging from yellow-green (N deficient) to dark green (N excess). Moreover, a mobile application was also developed [38,39]. The extension of this method to the quantification of rice canopy was explored [40,41] using unmanned aerial vehicle (UAV) imaging technologies. The results indicated the ability of DGCI values to assess (R2 = 0.67) plant N status in the field in large-scale. However, for all these studies very few address the cultivar effect looking at the correlation between DGCI values and leaf chlorophyll (SPAD measurements) or leaf N concentration. To continue this field approach at the canopy scale, the objective of this work is to explore the potential of DGCI and nDGCI values to predict N status in winter wheat crops from estimating NNI and to compare these results with those deduced from classical methods.
To validate the protocol for image acquisition, the impact of different factors on the relationship between normalized DGCI (nDGCI) values and Yara N-Tester readings (CMR) were tested: (1) DGCI vs. nDGCI to evaluate the impact of standardization of image data, (2) different optical systems (a digital camera and two smartphones) to evaluate the effect of optical parameters internal to the optical sensors and of lighting through the study of white balance setting (Manual or Automatic), (3) the impact on crop growth stage and (4) cultivars (one or mixture of cultivars).

2. Materials and Methods

2.1. Field Experimental Site

Winter wheat (Triticum aestivum L.) crops were seeded in November 2021 in 24 microplots (3 rows and 1.50 m length each) at the experimental site of the “Institut National de Recherche pour l’agriculture, l’alimentation et l’environnement” (INRAE), located in Bretenière (Eastern France, 47°13′25″N; 5°5′57″E, altitude = 206 m). Soil measurements indicated a silty-clay soil. The main characteristics of the soil were a high silt and clay content (50 and 45%, respectively) and a low sand content (5%). Among the microplots, half concerned a winter wheat cultivar LG Absalon and the other half concerned a mixture of cultivars (LG Absalon, Lipari, Rubisko and Tenor), designated hereafter as Mixture (Figure 1).

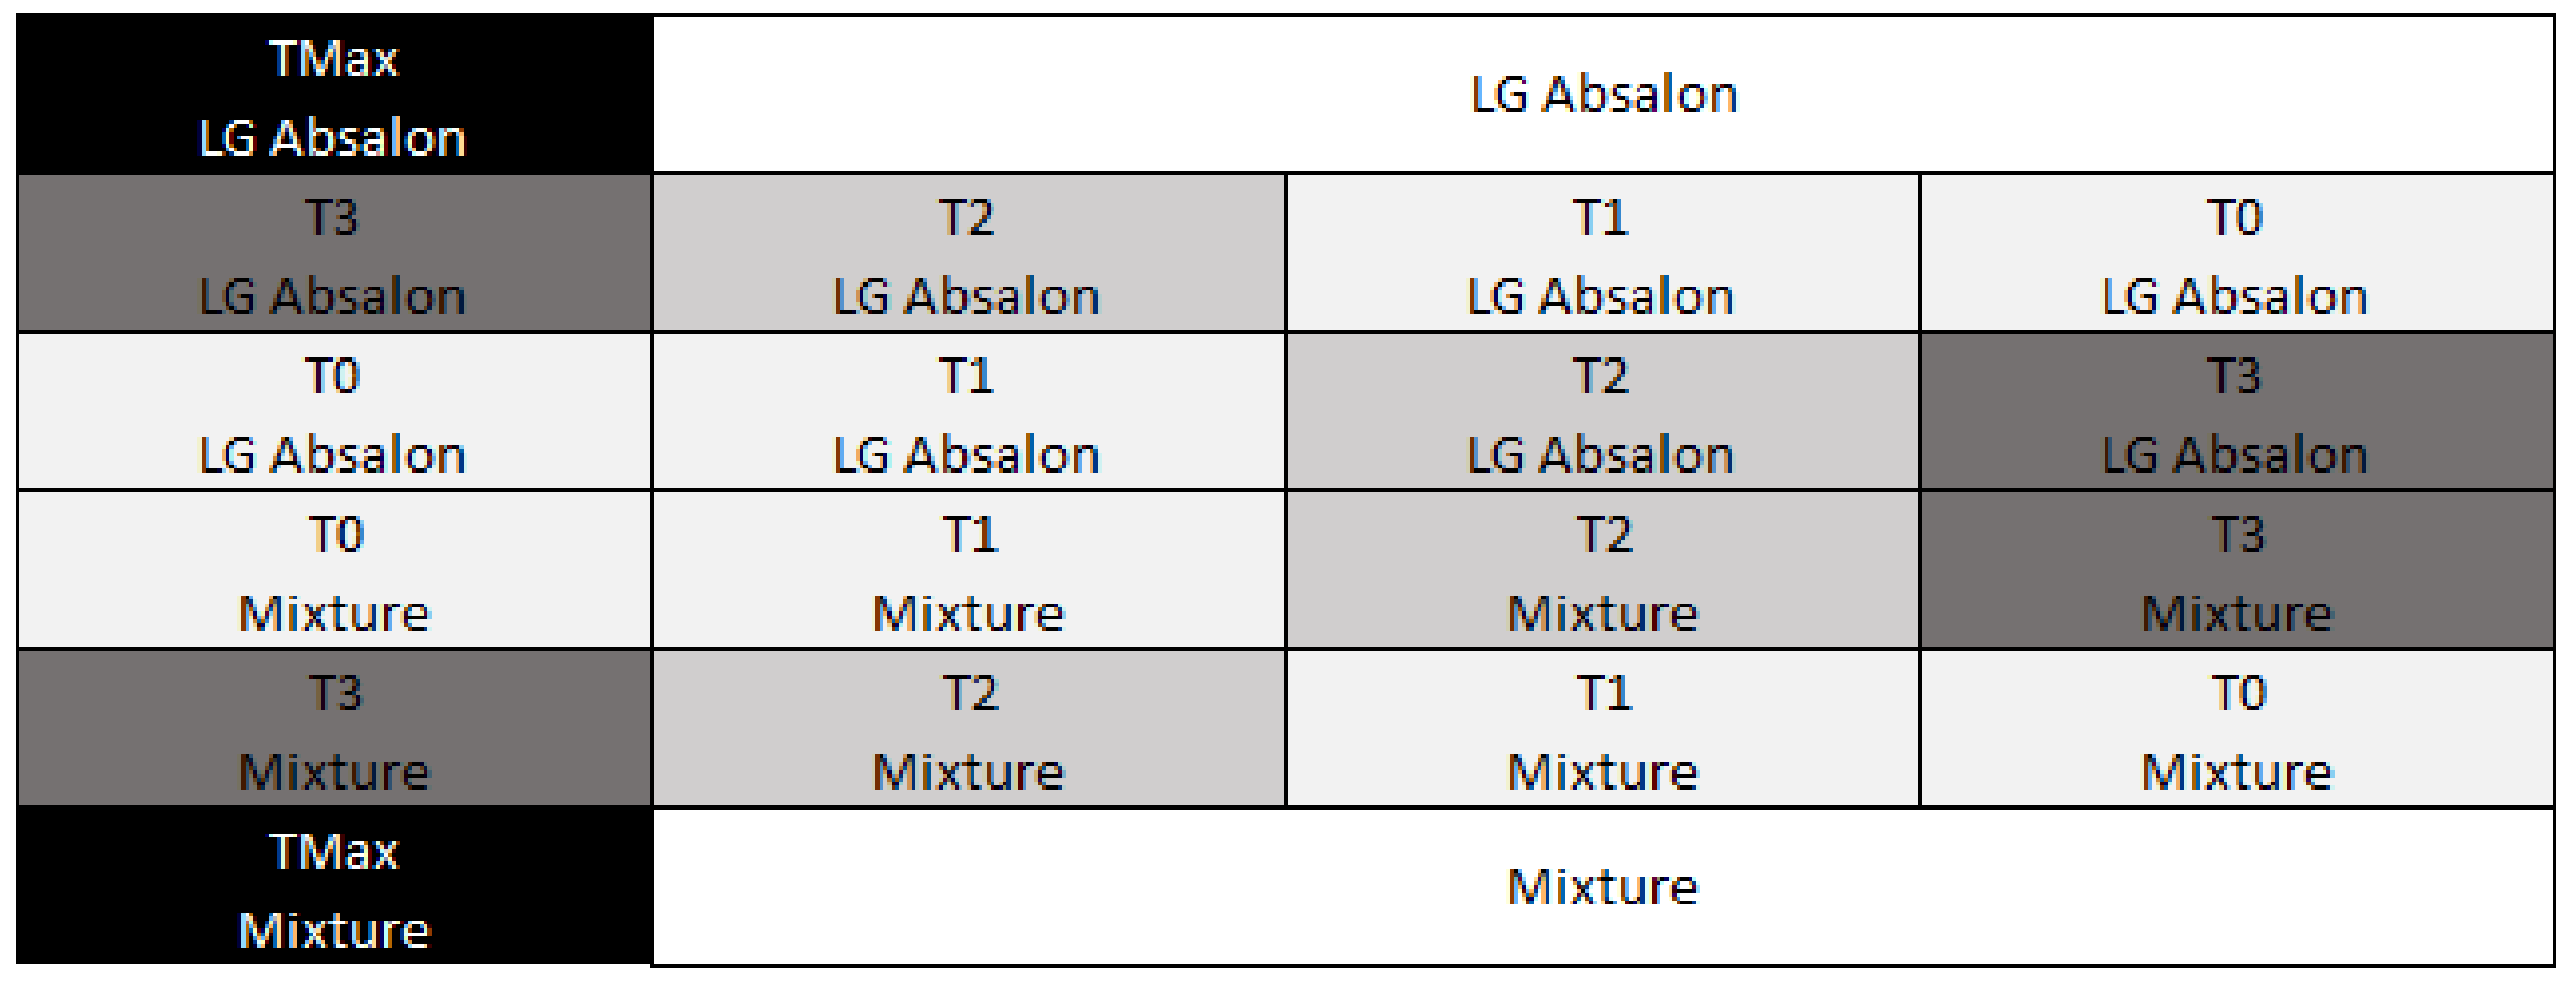
2.2. Nitrogen Gradient in the Experiments

A wide range of N rates were used to obtain a wide range of wheat NNI values, using several applications of N input doses of 50 kg N.ha−1 in the form of NH4NO3. Five nitrogen fertilization rates ranging from 0 (T0, no N fertilizer) to 320 kg N.ha−1 (Tmax) were, thus, carried out with different splitting of the N inputs (T1 = 1 input to T3: 3 inputs) from the end of winter to heading. To consider local variations through replications, each of the modalities was doubled in a random design (Figure 1). Over-fertilized microplots (Tmax) were used as controls for the maximal levels of NNI (Table 1). For the Tmax modality, a maximum N rate of 80 kg N.ha−1 was applied to overcome any N deficiency.

2.3. Sampling and Measurements

The measurements were carried out in 2022 on three dates (22 April, 3 May and 17 May) corresponding to two key fertilization stages on BBCH (Biologische Bundesanstalt, Bundessortenamt and Chemische Industrie) scale [42]: BBCH 32 for the two nodes detectable (22 April, 3 May) and BBCH 51 for the beginning of heading (17 May). On each observation date, three types of measurements were performed simultaneously on a single observation area of 0.25 m2 of microplots: aerial biomass samples, N content destructive measurements, readings from a Yara N-Tester chlorophyll meter [43] and digital visible images for the calculation of DGCI. This observation area corresponded to the area covered by a downward-facing camera located 1 m from the ground. The photographs were taken under homogeneous light conditions with three different optical systems: Canon EOS 760D, a Japanese camera; Realme, a Chinese smartphone and Galaxy Samsung 10+, a Korean smartphone. This involved working with sensors from different brands and ensuring that all sensors offer a ‘Manual’ white balance mode. These optical device configurations ensured that all the upper leaves were clearly visible and avoided saturation of the photo sensor in some image areas. The objective was to evaluate the effect of the camera type and internal calibration on the DGCI and nDGCI values and on the relationship between NNI, DGCI and nDGCI.
Leaf transmittance measurements with the N-Tester were carried out according to the protocol indicated on the manual of the device, via the clamp of a series of 30 leaves, considering the last spread leaf of the wheat plants. The device provides an average value per series of 30 measurements. It was repeated twice for each observation area. The average of these two values were used in the following. To associate the Yara N-Tester chlorophyll meter readings (CMR) with an NNI value, readings were normalized to the maximal value obtained on over-fertilized microplot. Indeed, the value given by the chlorophyll meter can depend on several factors: the effect of the cultivar (with different green colour of leaf orientations), the growth stage of the wheat and the effect of the experimenter (who can pinch the leaf at different places or the height at which the leaf is pinched can make the measurements vary). This approach was explored by many researchers, suggesting using a normalized CMR (or CMR index): the raw reading of the plants divided by that of fully N-fertilized plants [44,45] at the same growing stage and in the same growing season. The normalized values for crop sensor readings for Yara N-Tester were calculated as follows:
N T e s t e r   i n d e x = N T e s t e r   r e a d i n g o b s e r v e d   p l o t N T e s t e r   r e a d i n g o v e r f e r t i l i z e d   p l o t
Then, relationships between crop sensor ratio (i.e., SPAD, Yara N-Tester) index and nitrogen nutrition index values were deduced from models detailed in [3,44]. Concerning the model for the Yara N-Tester measurements, the equations are as follows:
I f     N T e s t e r   r e a d i n g   0.92     N N I N T e s t e r = 0.0771 . e 2.5232 x
I f     N T e s t e r   r e a d i n g > 0.92     N N I N T e s t e r = 1425.4   x 3 4001.4 x 2 + 3748.7 x 1171.2
With   x =   N Tester   index
Within each observation area, biomass samples were taken by sampling the entire aboveground biomass of the wheat plants over a length of 50 cm in three rows. The dry biomass (DM in t.ha−1) was then deduced from weighing oven drying (80 °C) for 48 h. The NNI was then calculated using the equations of the N dilution critical curve for wheat [10].
I f   D M < 1.55   t . ha 1   t h e n   % N c = 4.4 ;   I f   D M 1.55   t . ha 1   t h e n   % N c = 5.35 D M 0.442
N N I = % N o b s % N c  

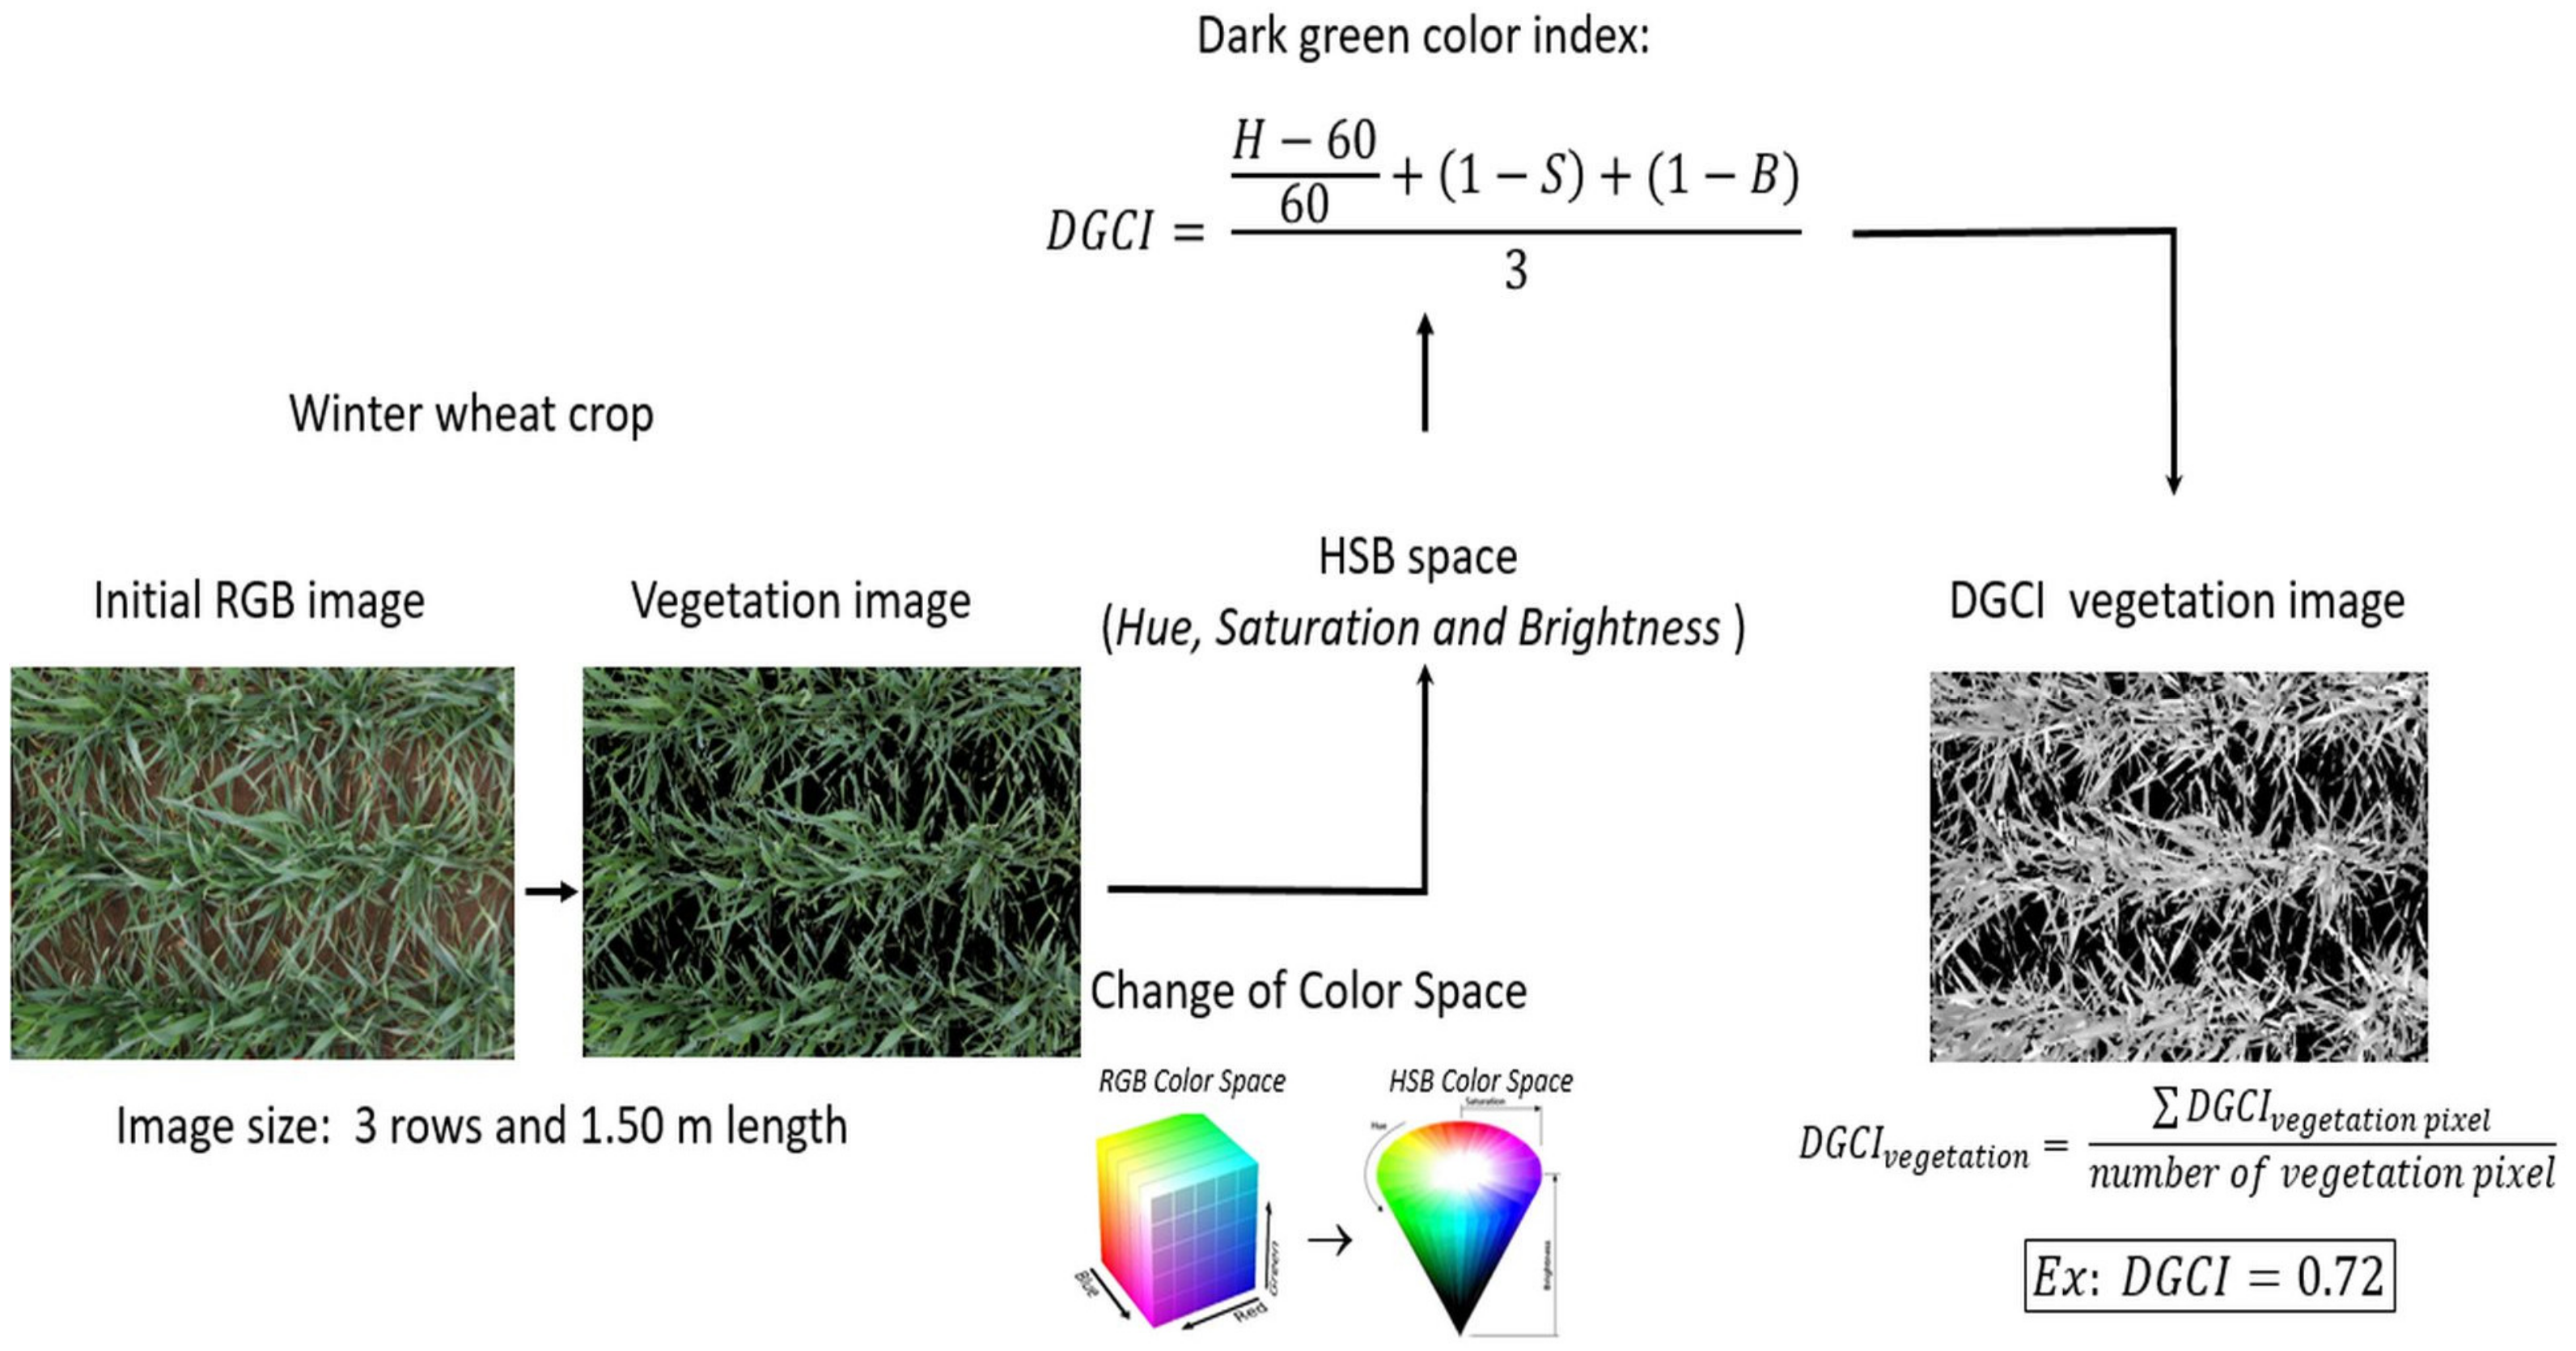
2.4. Image Processing-DGCI Indicator Calculation

From the initial image (RGB: Red, Green, Blue), a vegetation image is deduced using an appropriate thresholding to extract only the vegetation pixels via a MetaIndex developed by Gée et al. [46] This index is a combination of the six most popular vegetation indices for characterizing vegetation. It uses a consensus vote to classify a pixel as vegetation, which makes the classification more robust than a simple index. Then, by converting the processed RGB image into the HSB (Hue, Saturation, Brightness) colour space, the DGCI raw value (without any correction or calibration) of each vegetation pixel is calculated from the equation [30] defined as follows:
D G C I   r a w   v a l u e = H u e 60 60 + 1 S a t u r a t i o n + 1 B r i g h t n e s s 3
Finally, the DGCI value of the vegetation image is calculated as the average of the DGCI raw values of the vegetation pixels (Figure 2). The DGCI limits are between 0 (yellow hue, potentially reflecting low N content) and 1 (dark green hue, potentially reflecting high N content). Even if the HSB colour space is that which mimics the human perception of colour and is device–independent, it is also sensitive to lighting conditions [22,31].
A normalized DGCI, nDGCI, was also calculated (Equation (7)) as the ratio of the DGCI value of the observed microplot image to that of the image of an over-fertilized microplot (Tmax). The aim of this new indicator, nDGCI, assuming that the same shooting parameters are used for both plots, is to avoid any image calibration based on the use of a colour chart and to overcome the differences in the solar illumination conditions and internal parameters of the optical sensors.
n D G C I = D G C I o b s e r v e d   p l o t D G C I o v e r f e r t i l i z e d   p l o t
Table 2 describes the modalities (crop growth stage, camera, white balance) and number of images taken during the three measurement dates.
Furthermore, among the shooting parameters, the white balance (WB) is likely to have an influence on the dark green colour index (DGCI) and, therefore, two settings (manual vs. automatic) were tested. Unlike manual mode, in automatic mode, the WB values can change depending on the lighting conditions of the observed scene, which can disrupt the normalized DGCI value.

2.5. Statistical Analysis

In order to explore the potential of the DGCI index as a proxy for estimating the NNI usually derived from conventional methods (biomass, N-Tester), relationships between the (DGCI, nDGCI) and N-Tester index were assessed by linear regression through the coefficient of determination (R2). Different linear regressions were studied by examining the influence of four factors. Plant-related factors were studied through (1) the wheat cultivar (pure one or a mixture of four) and (2) the growth stage (BBCH 32 and BBCH 51). In addition, factors related to the optical sensors were explored: (3) white balance (Manual vs. Automatic) and (4) camera type (Canon EOS 760D; Realme smartphone; Galaxy Samsung 10+ smartphone). Finally, special attention was paid to the type of camera used to verify the generalization of the linear relationship between nDGCI and NNI. From a statistical point of view, to assess the significant influence of this factor on the slope and intercept of the regression, an analysis of the covariance (ANCOVA) was used. It requires prior attention to ensure that the classical statistical assumptions of the data were fulfilled. Statistical analyses were performed in R (version 4.2.1, [47]) and RStudio [48], an integrated development environment for R.

3. Results

In this section, the objective is to understand how DGCI and nDGCI values vary as a function of four factors: optical device, white balance, growth stage and wheat cultivar. Thus, the conditions of use of these new indices are explored. Results concerning a mixture of varieties are presented in the appendices.

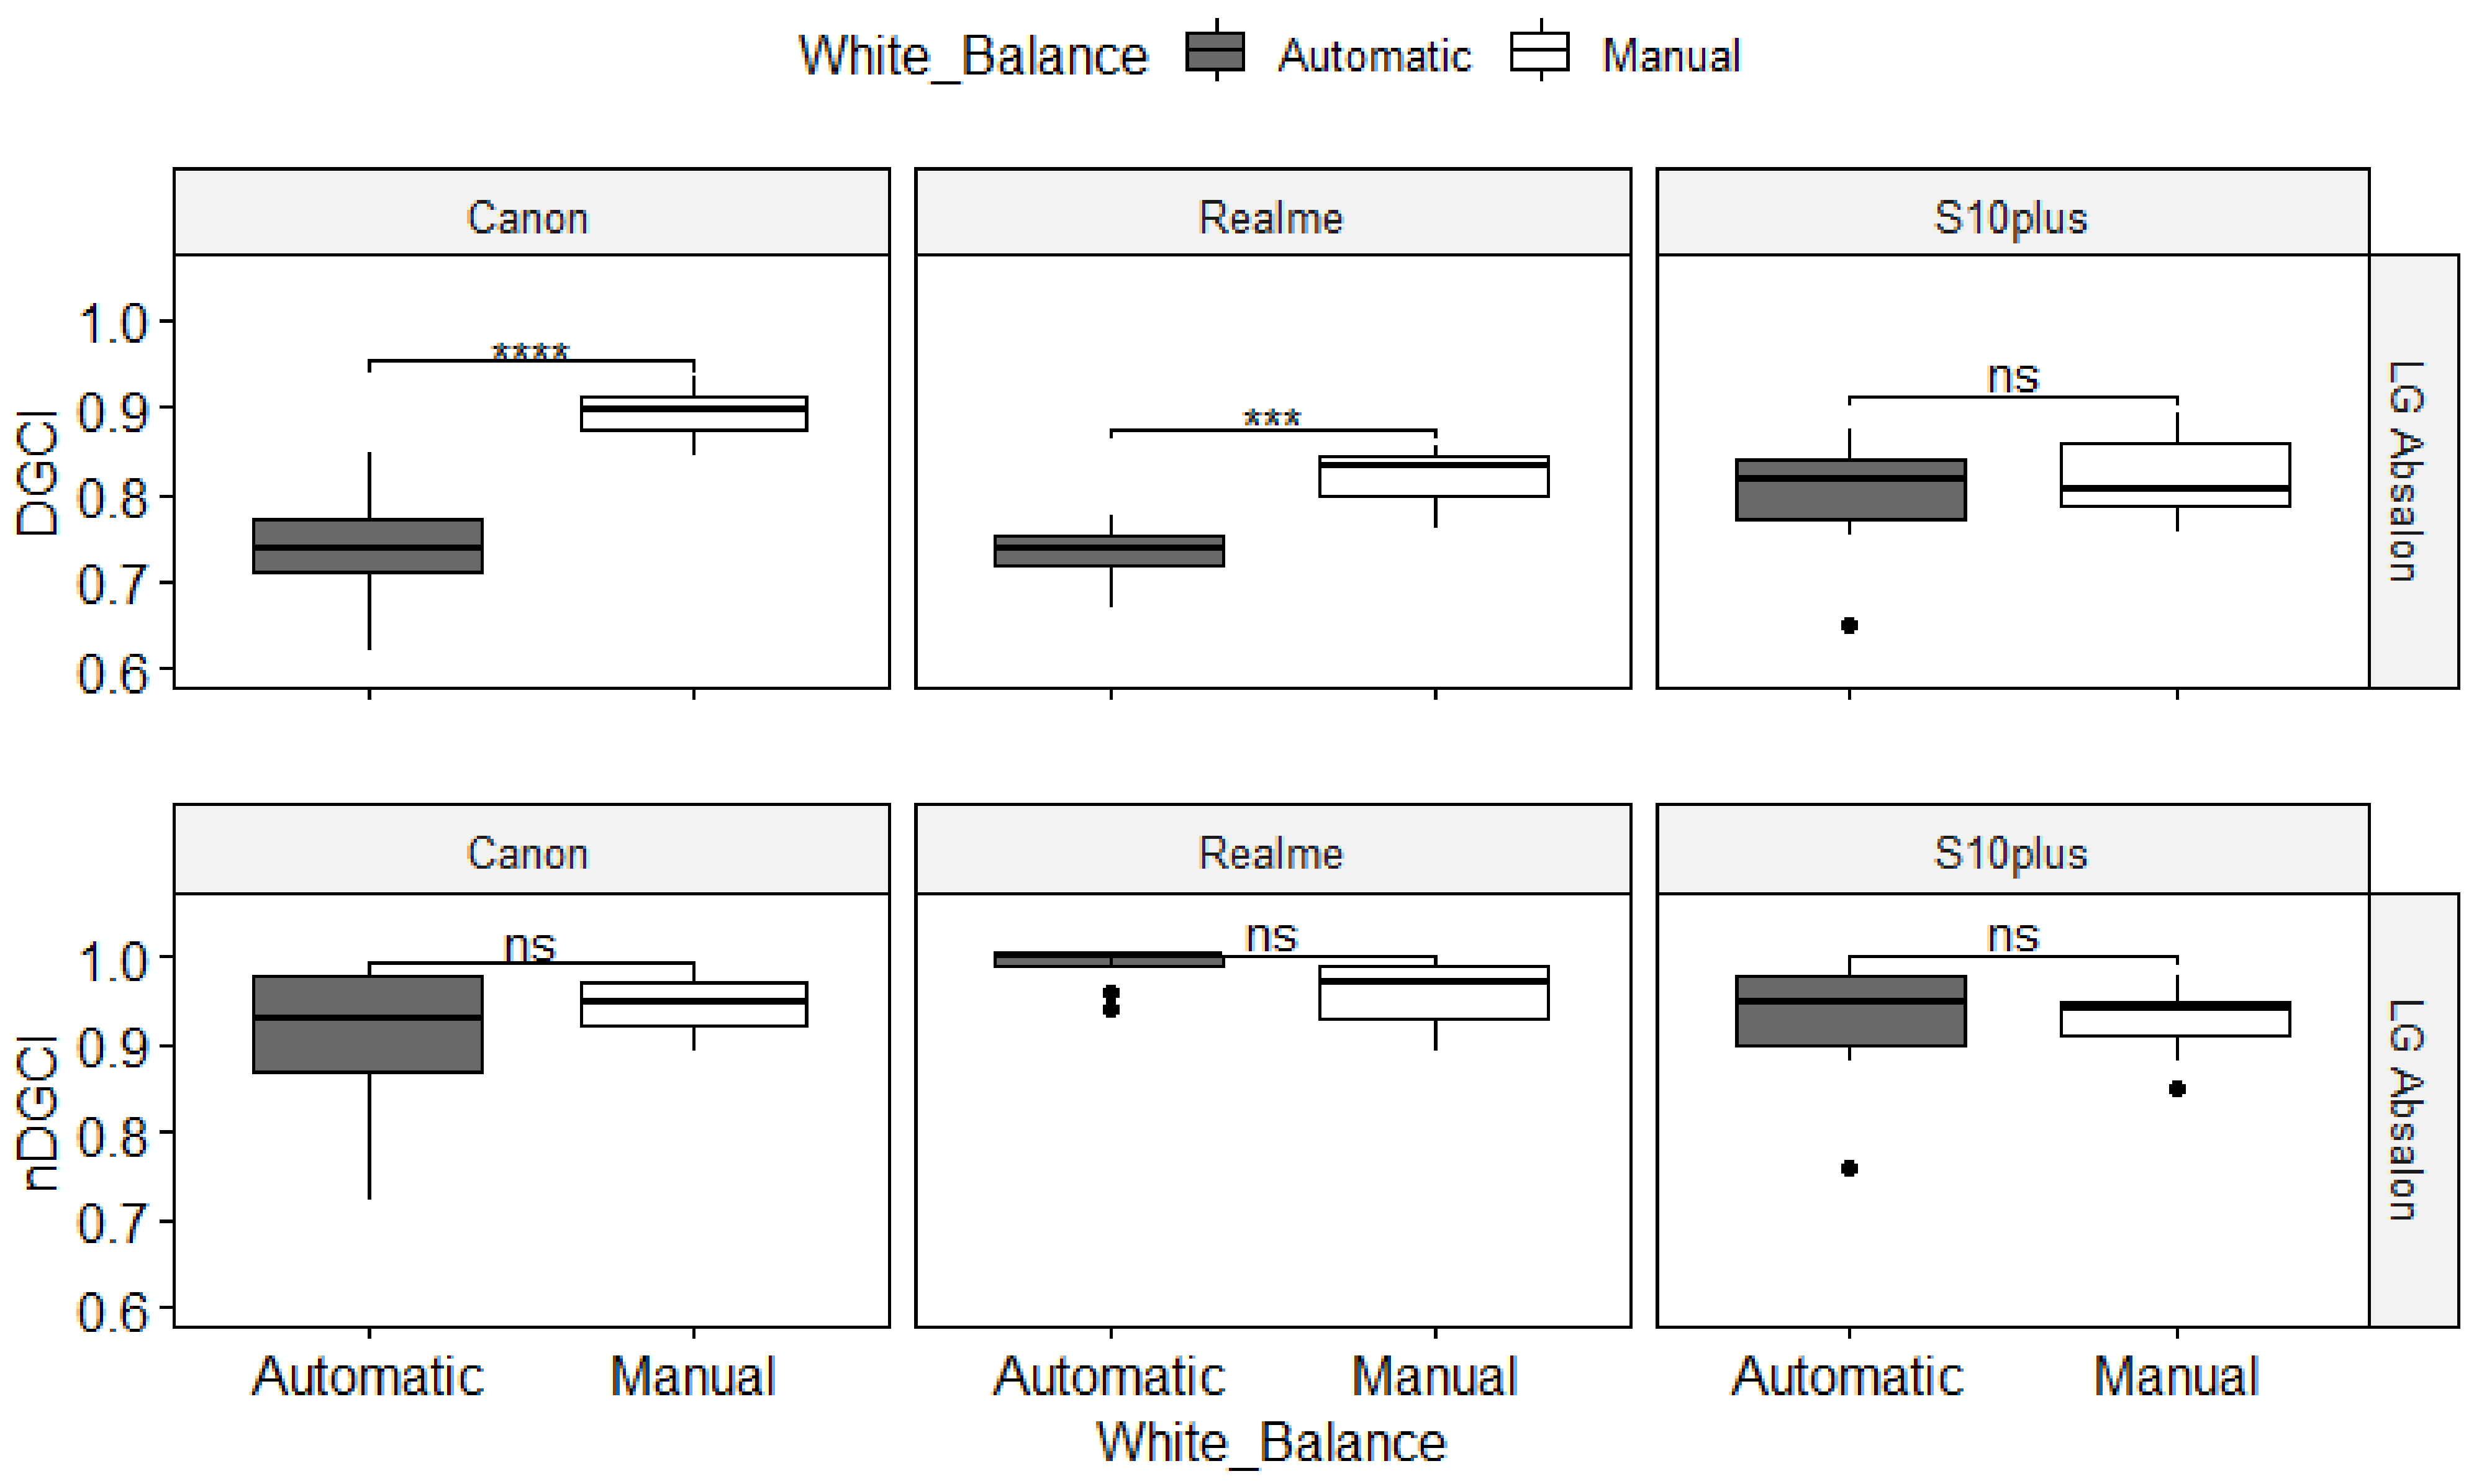
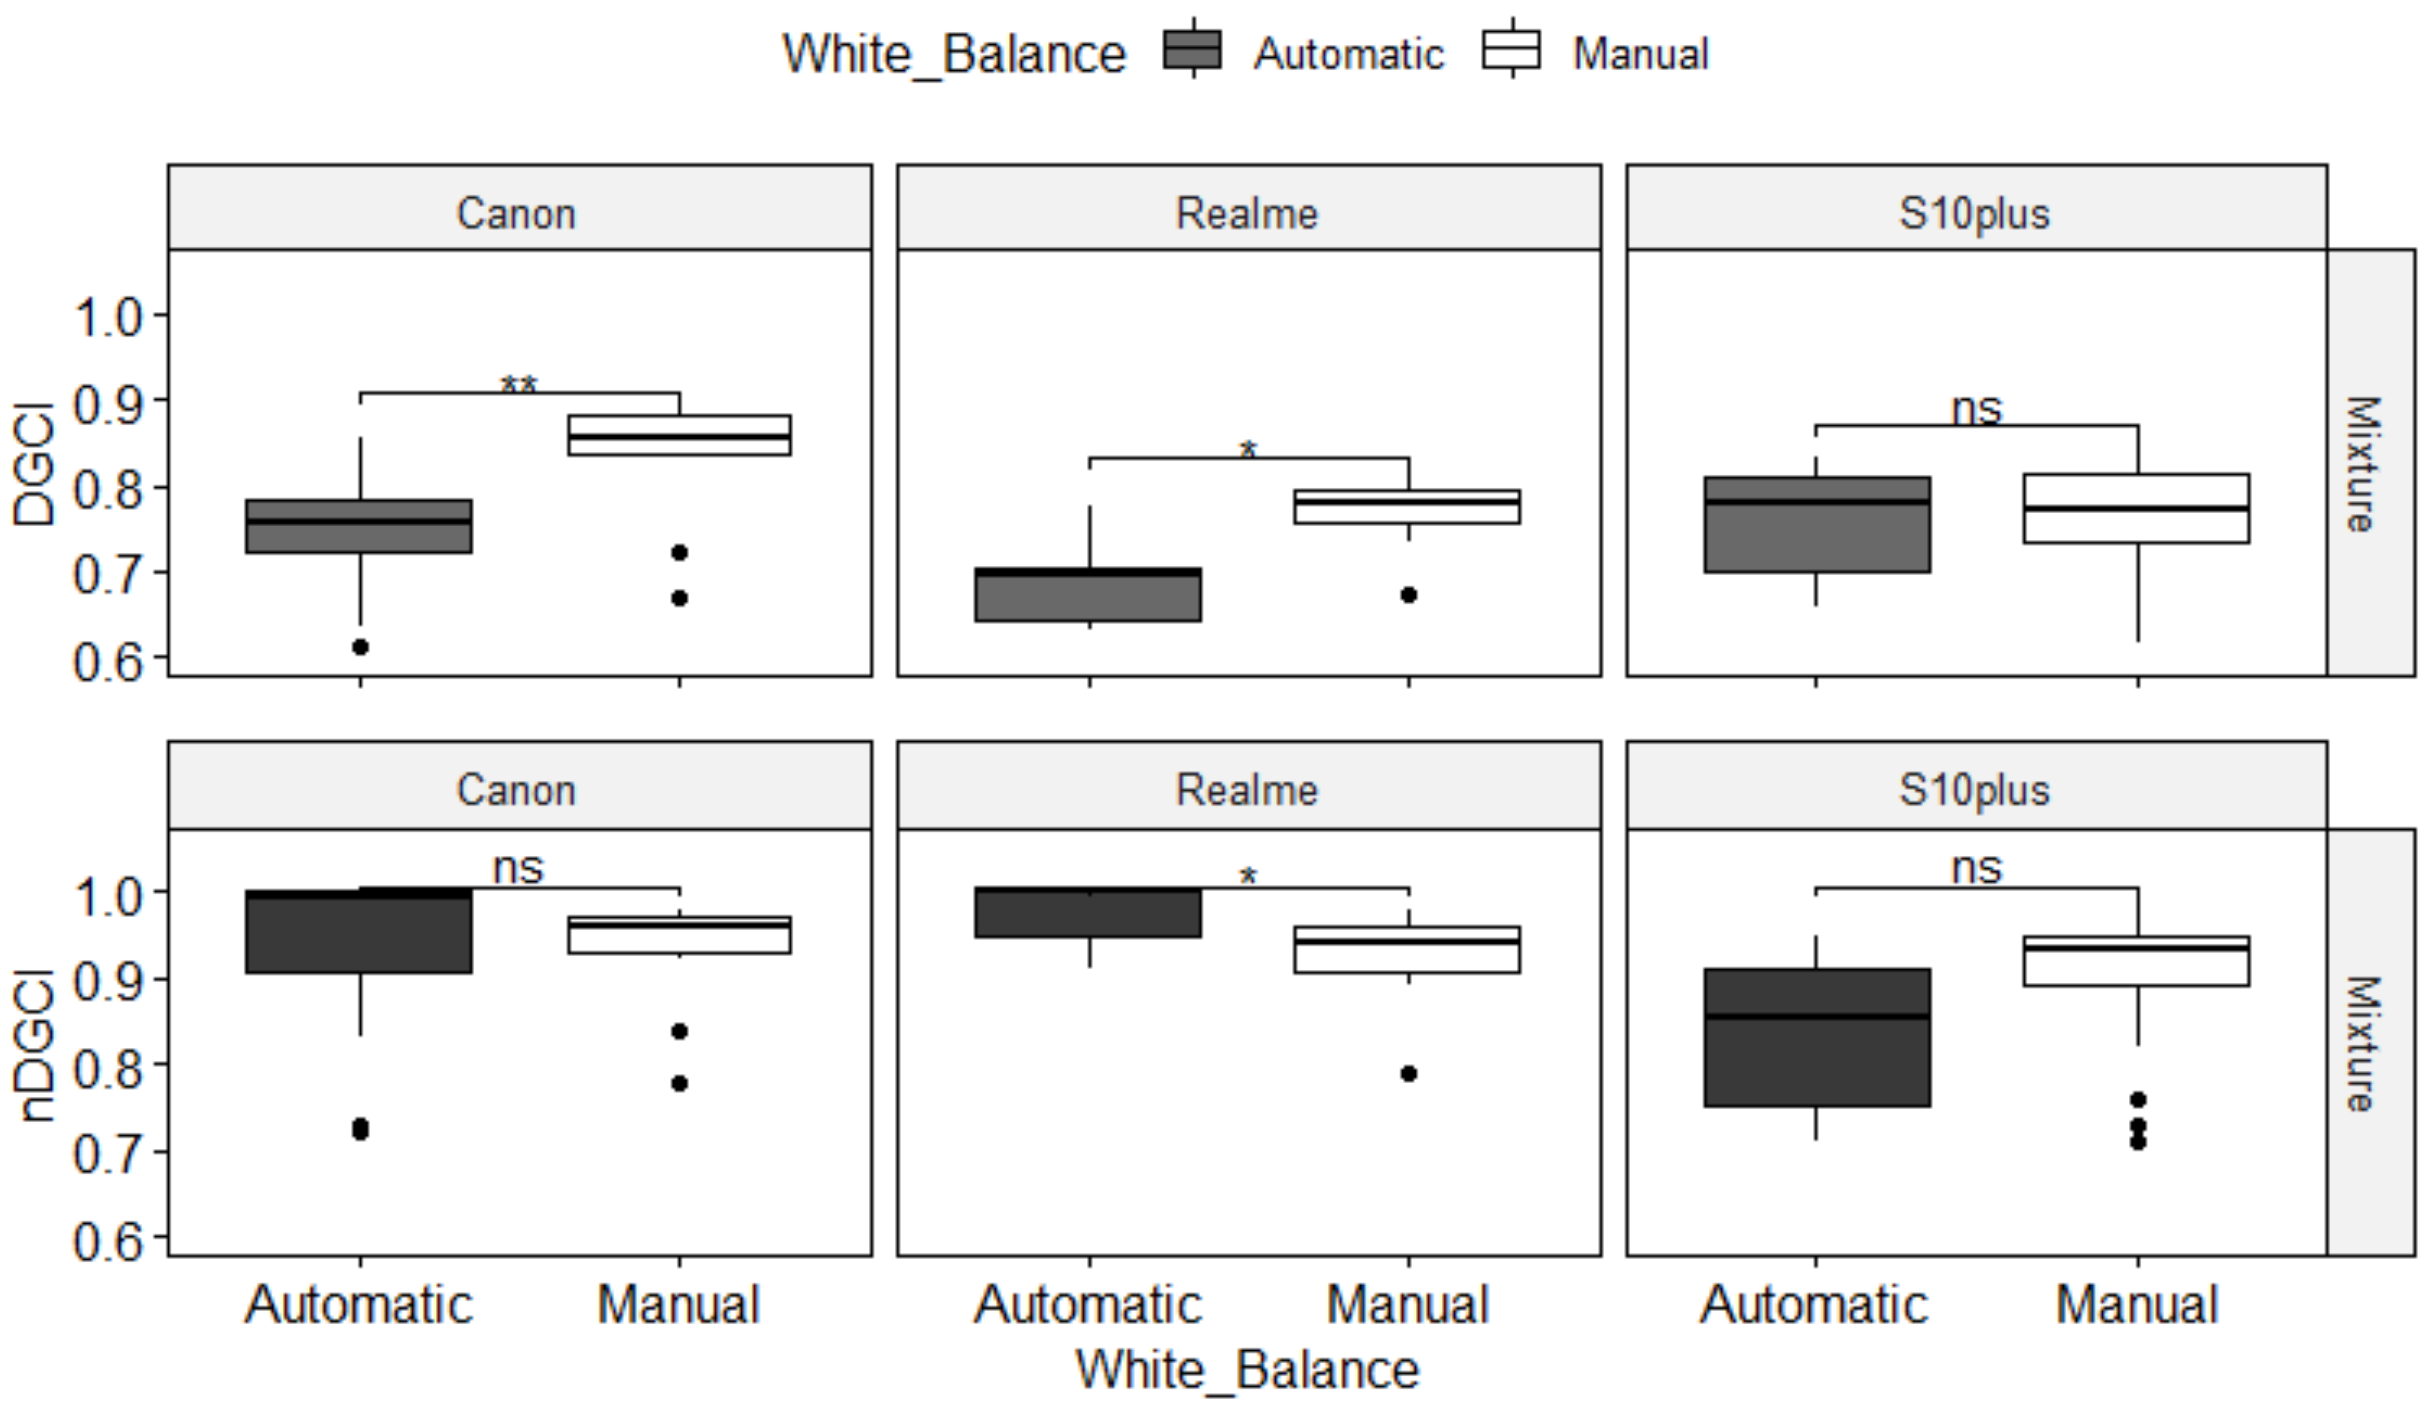
3.1. Comparison between DGCI and nDGCI Values

Figure 3 shows a comparison between DGCI and nDGCI values as a function of WB setting (automatic vs. manual) for each camera (Canon EOS 760D, Realme and S10+) according to the LG Absalon wheat cultivar. For each device, depending on the WB modality, the DGCI values showed differences that were statistically significant, except for the S10+. However, with the nDGCI values, which smoothened the results, no difference was observed between the two WB settings or even between the devices. Thus, the methodology implemented for the nDGCI, indicates values more stable than DGCI values regardless of the type of device used. For the Canon and the S10+, however, the automatic mode showed a greater dispersion of the nDGCI values, unlike the Realme device. The type of WB seemed to have an influence on the result of the measurement, which confirms that for the use of the nDGCI, it is necessary to set up the WB at a constant value using the manual mode. The nDGCI, which is based on data standardization, is independent of the device [22,31], but also of the lighting conditions which are eliminated if the manual mode of the WB is selected correctly.
When measurements were made on the mixture of wheat cultivars, similar results (with a higher dispersion of measurements) could be observed in Figure A1. In these figures, the outliers concerning the values of DGCI and nDGCI are observed. The analysis of the images associated with these values shows that the lighting conditions were not correct, with most often a strong dark area in the image. These data were, subsequently, removed from the dataset.

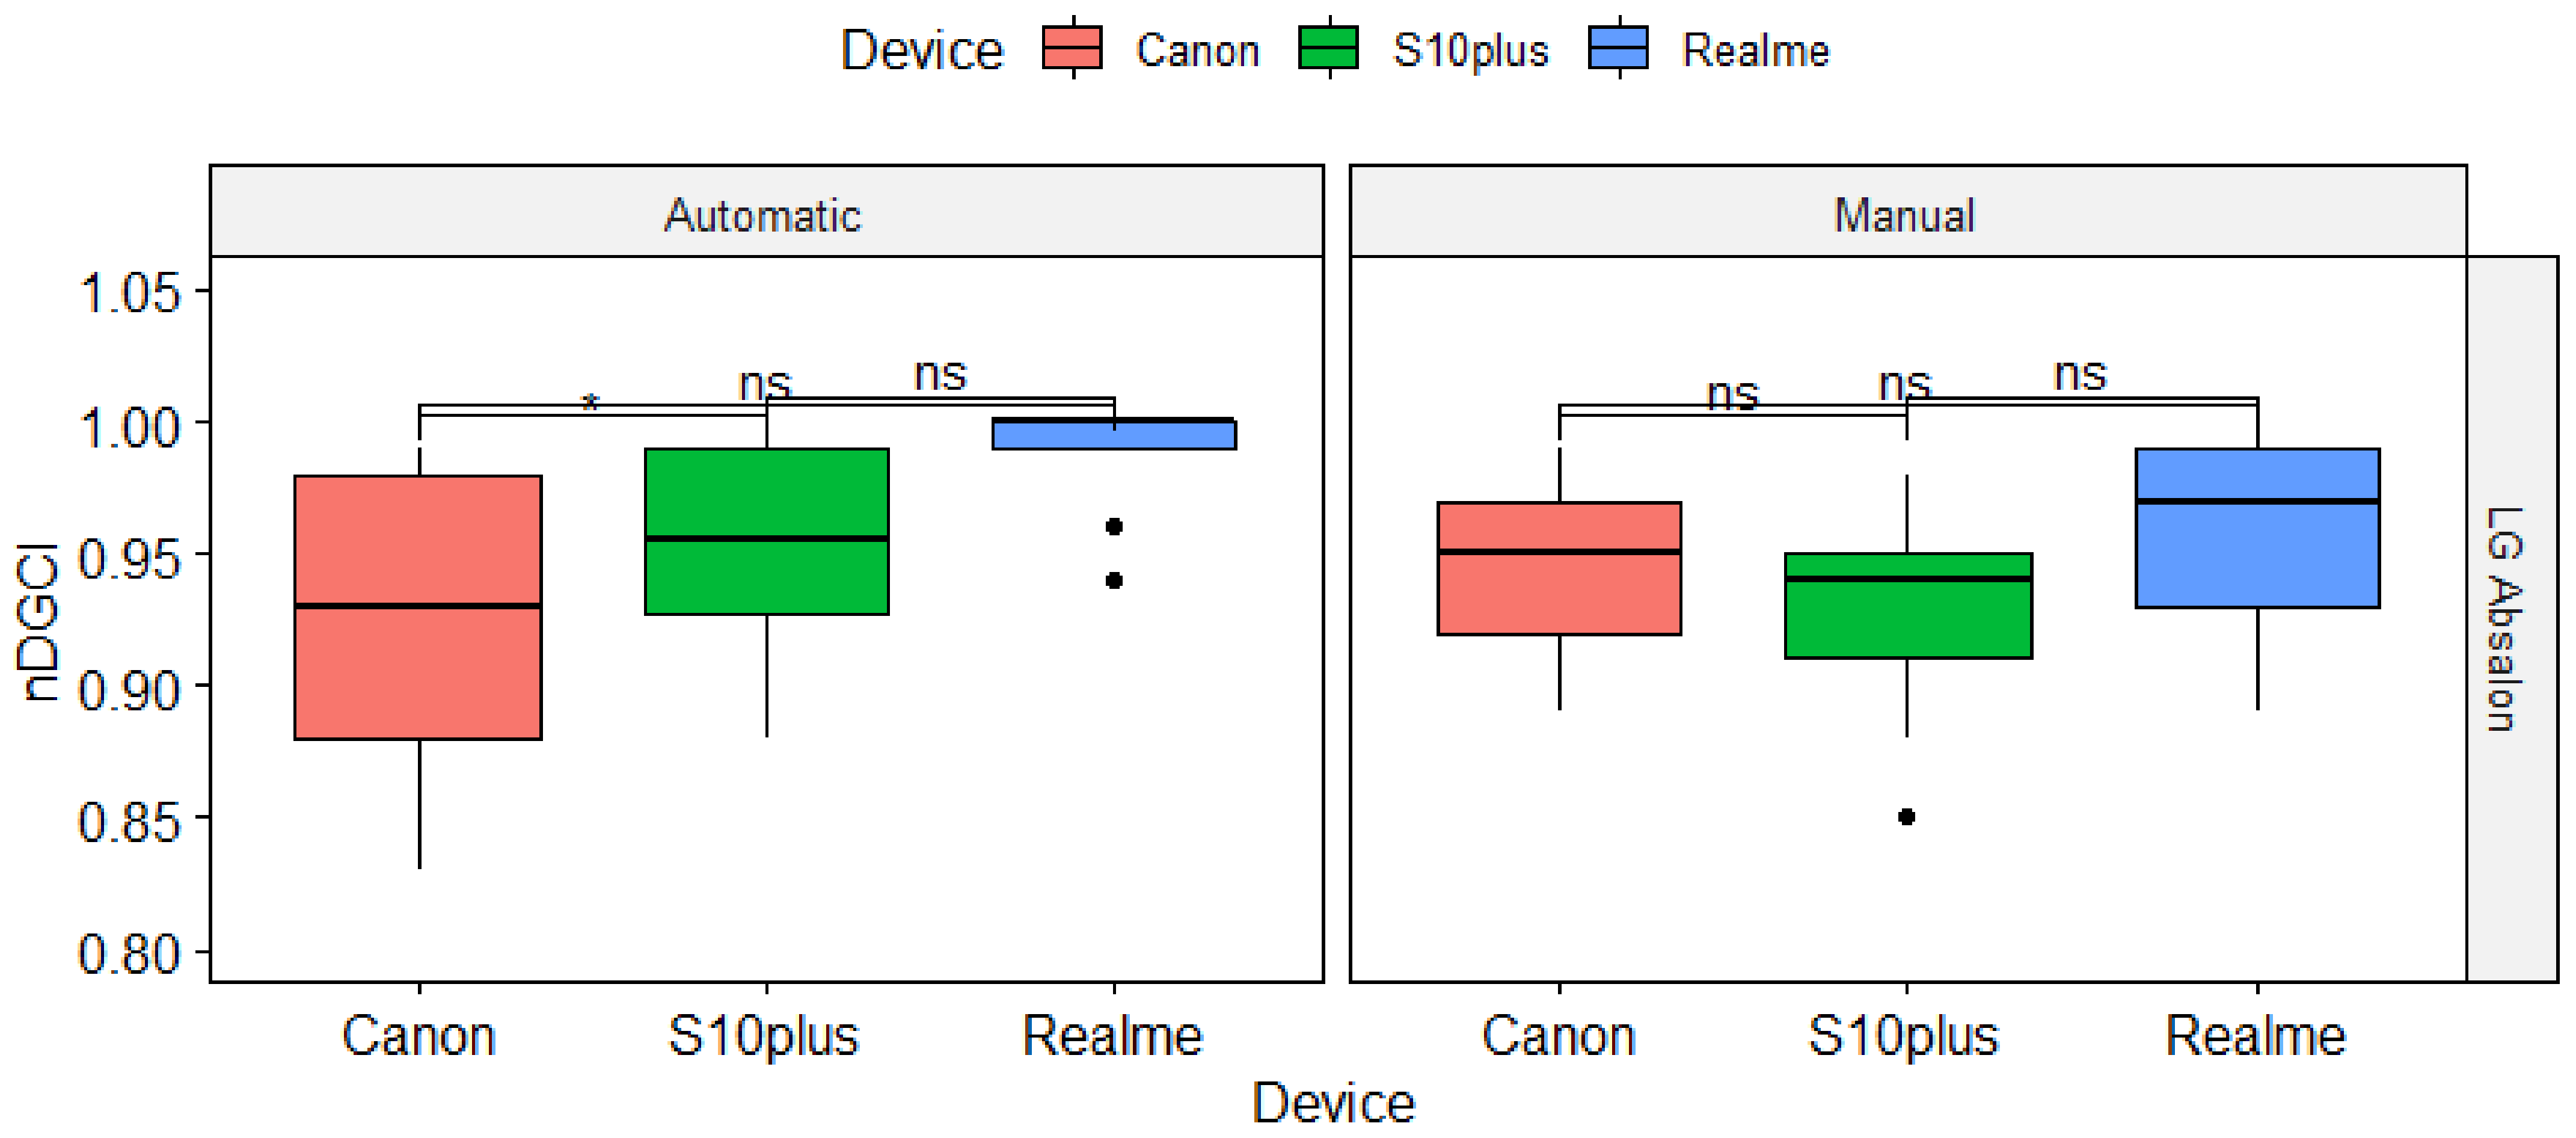
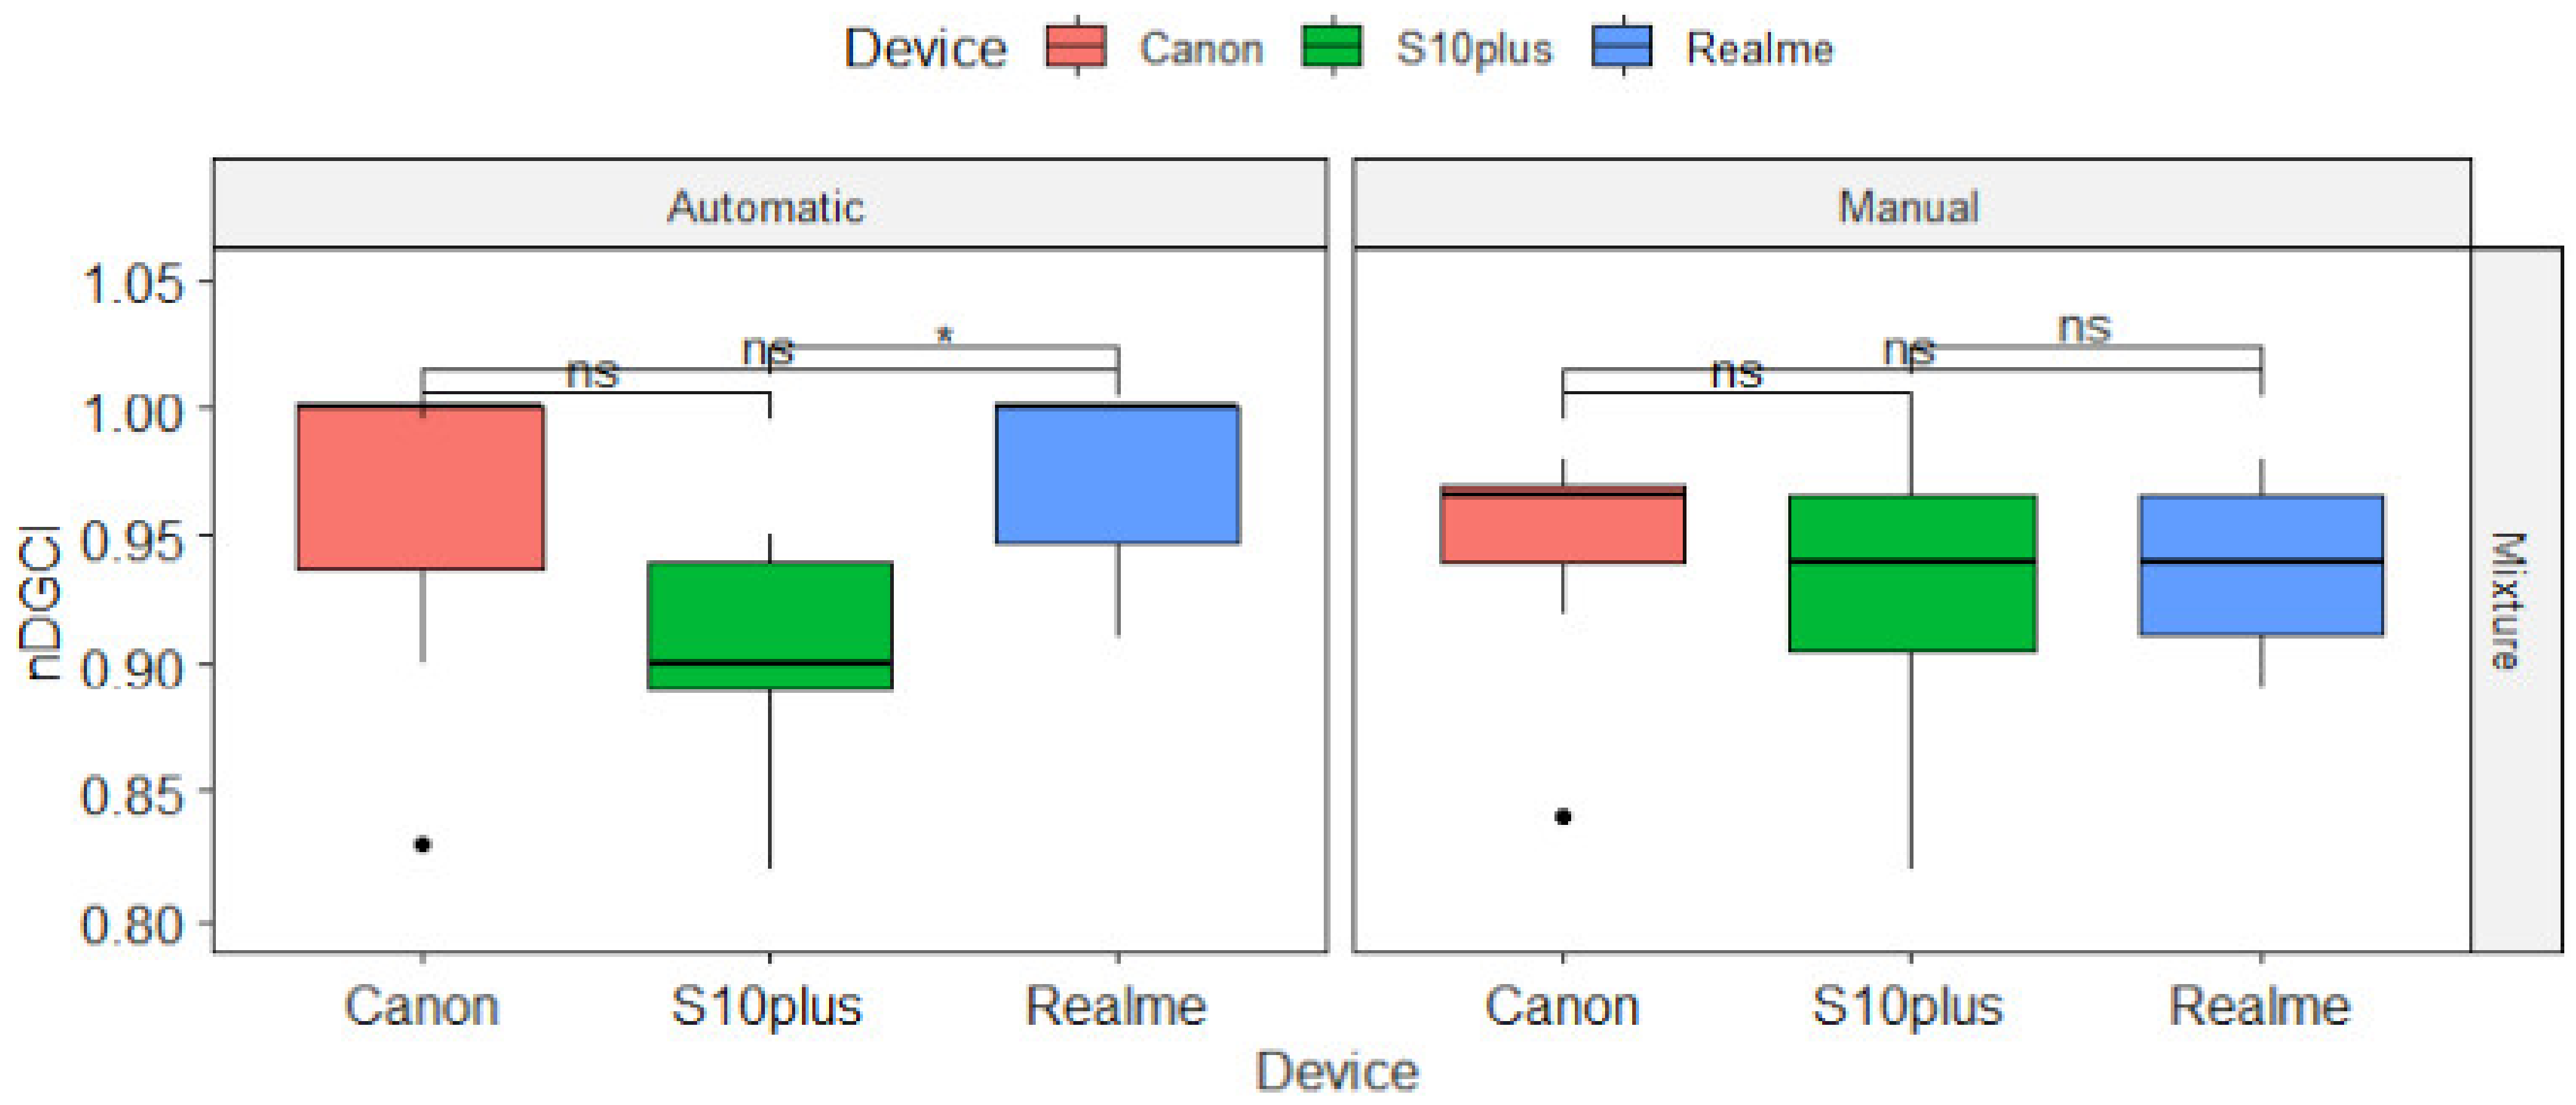
3.2. Impact of the Devices on nDGCI Values

Focusing on the nDGCI values and for the wheat cultivar LG Absalon, we investigated whether the ‘Device’ factor had an influence on the results. Figure 4 shows that regardless of the white balance setting, the effect of the device was not statistically significant (ns) when the white balance was in manual mode. In the automatic mode, there was a different effect of the devices on values: the digital camera (Canon EOS 760D) did not react the same as the two smartphones (Realme and S10+). Thus, it confirmed that in manual mode, the intrinsic parameters of the three devices had no influence on the DGCI values. Concerning measurements made on the mixture of wheat cultivars, similar results were observed with the manual mode (Figure A2), but with the automatic mode of WB, a different effect was observed between S10+ and Realme.

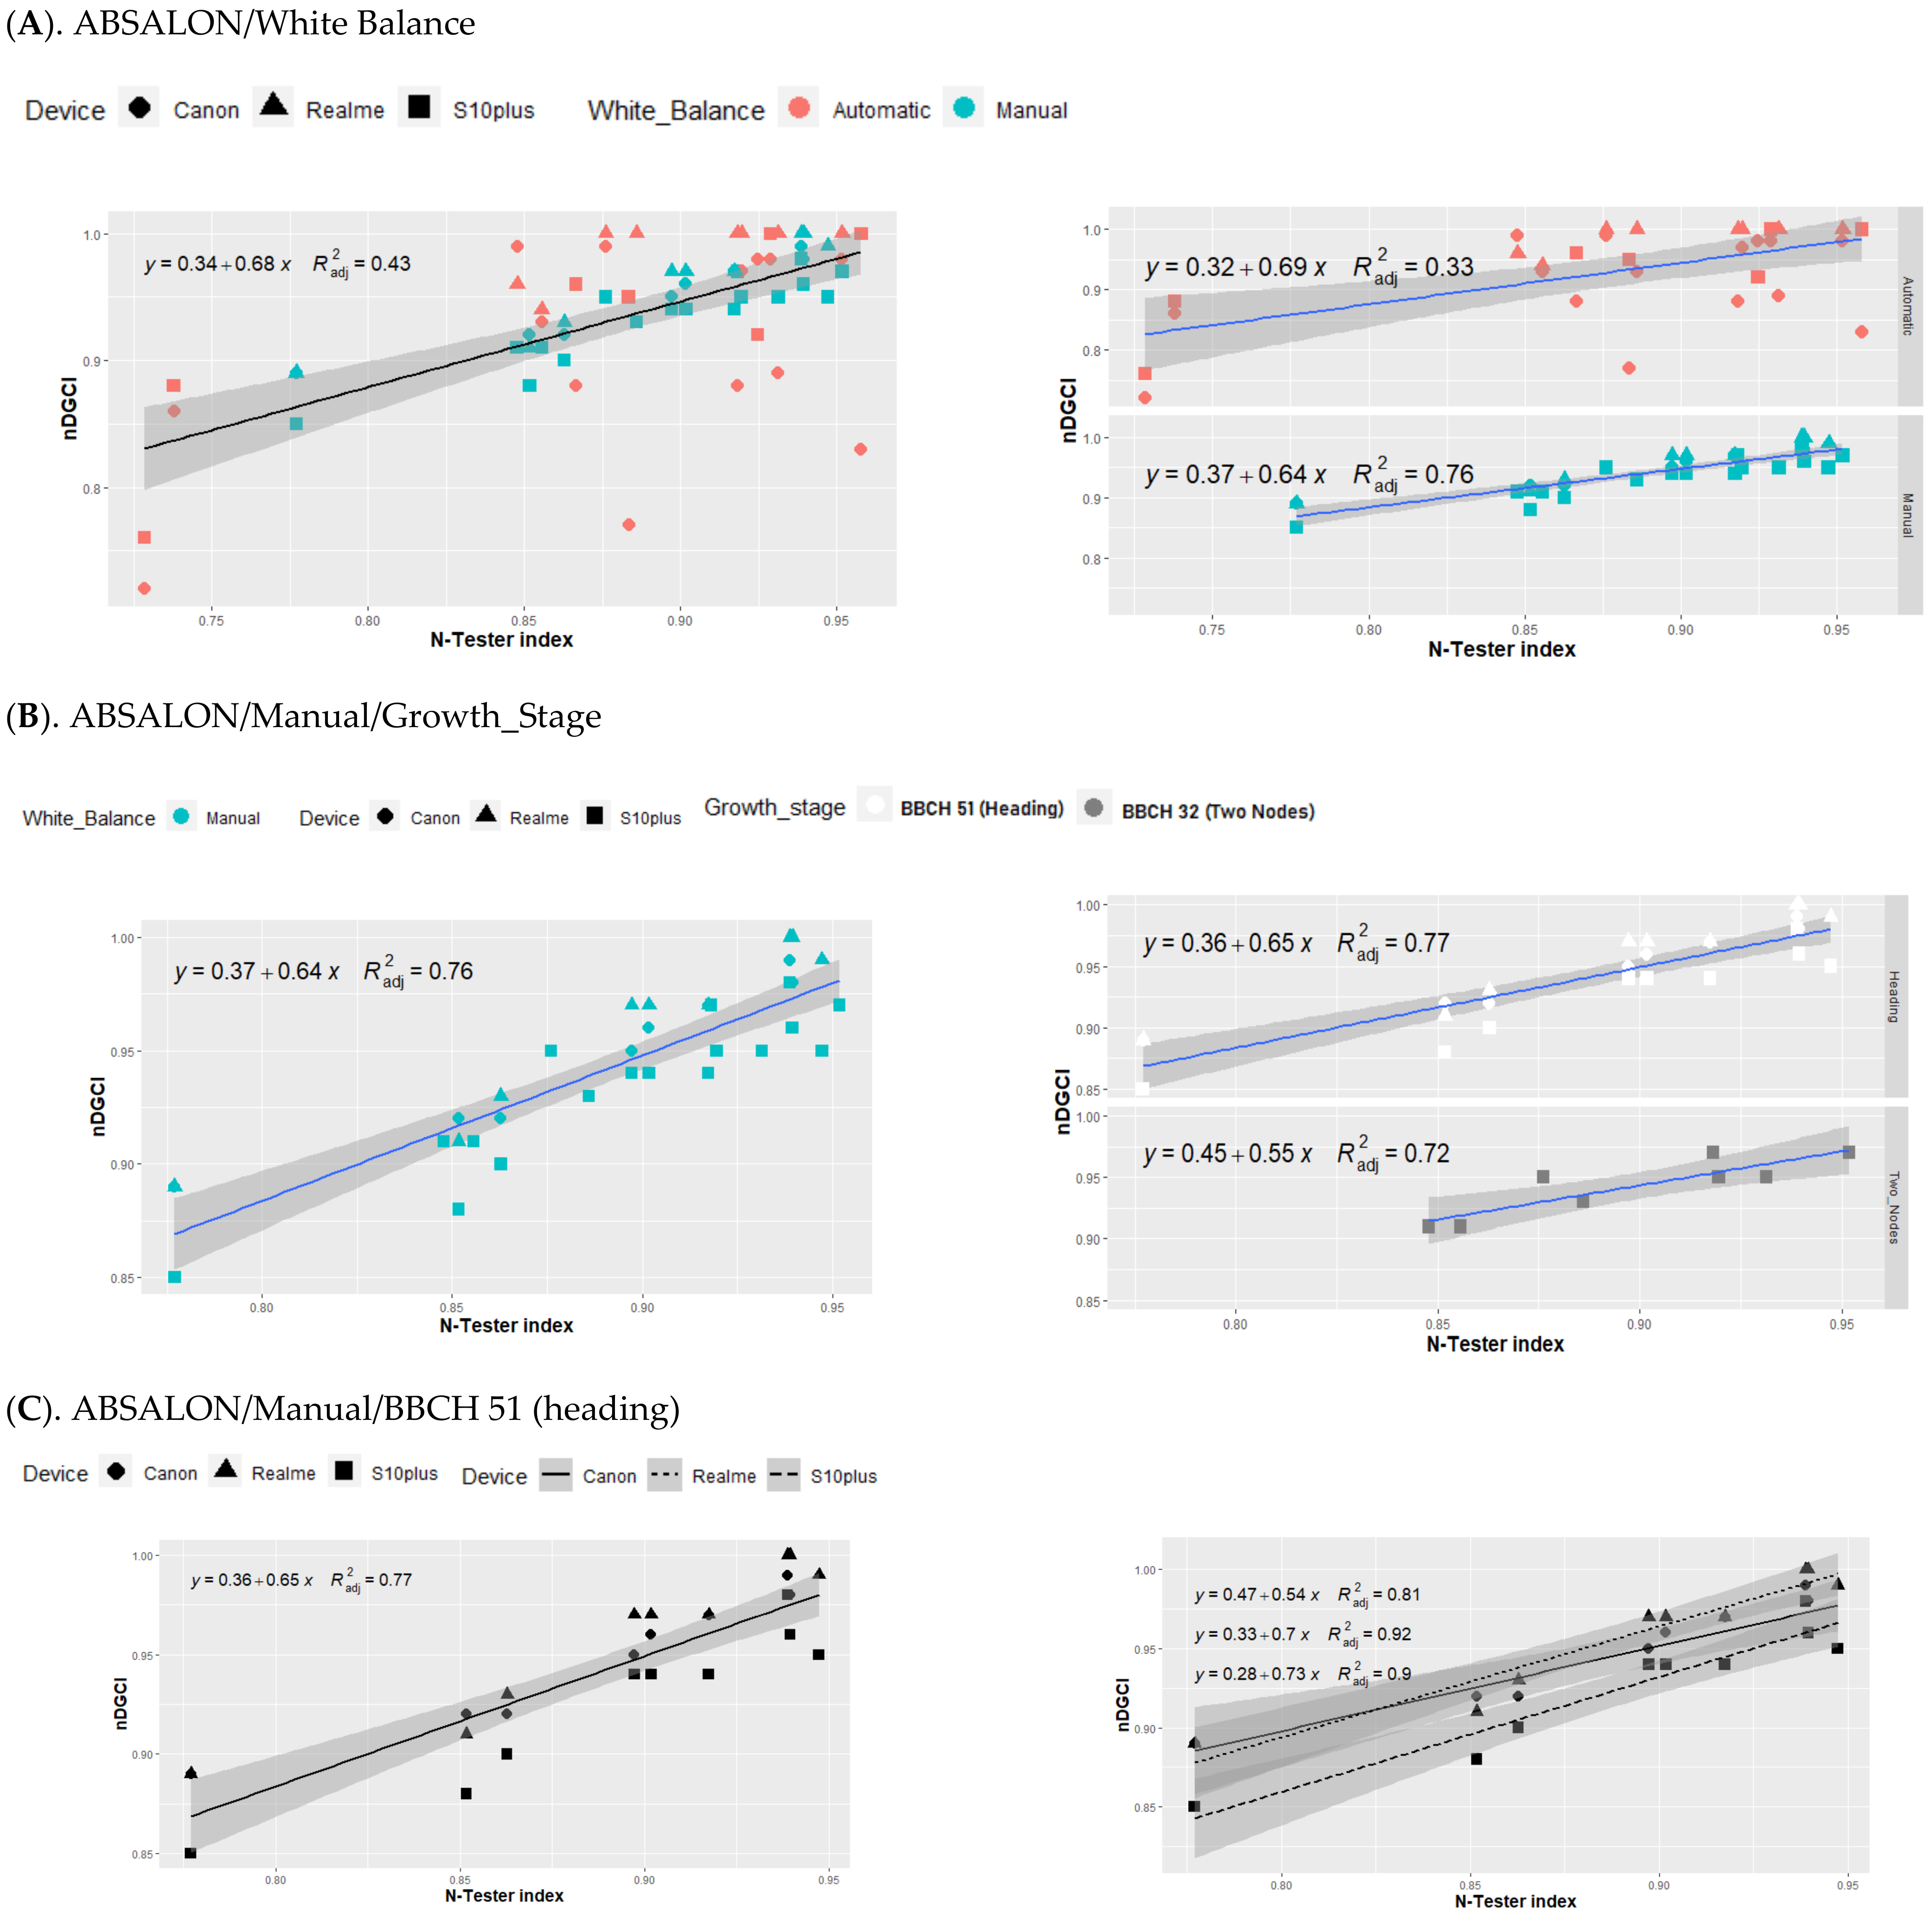
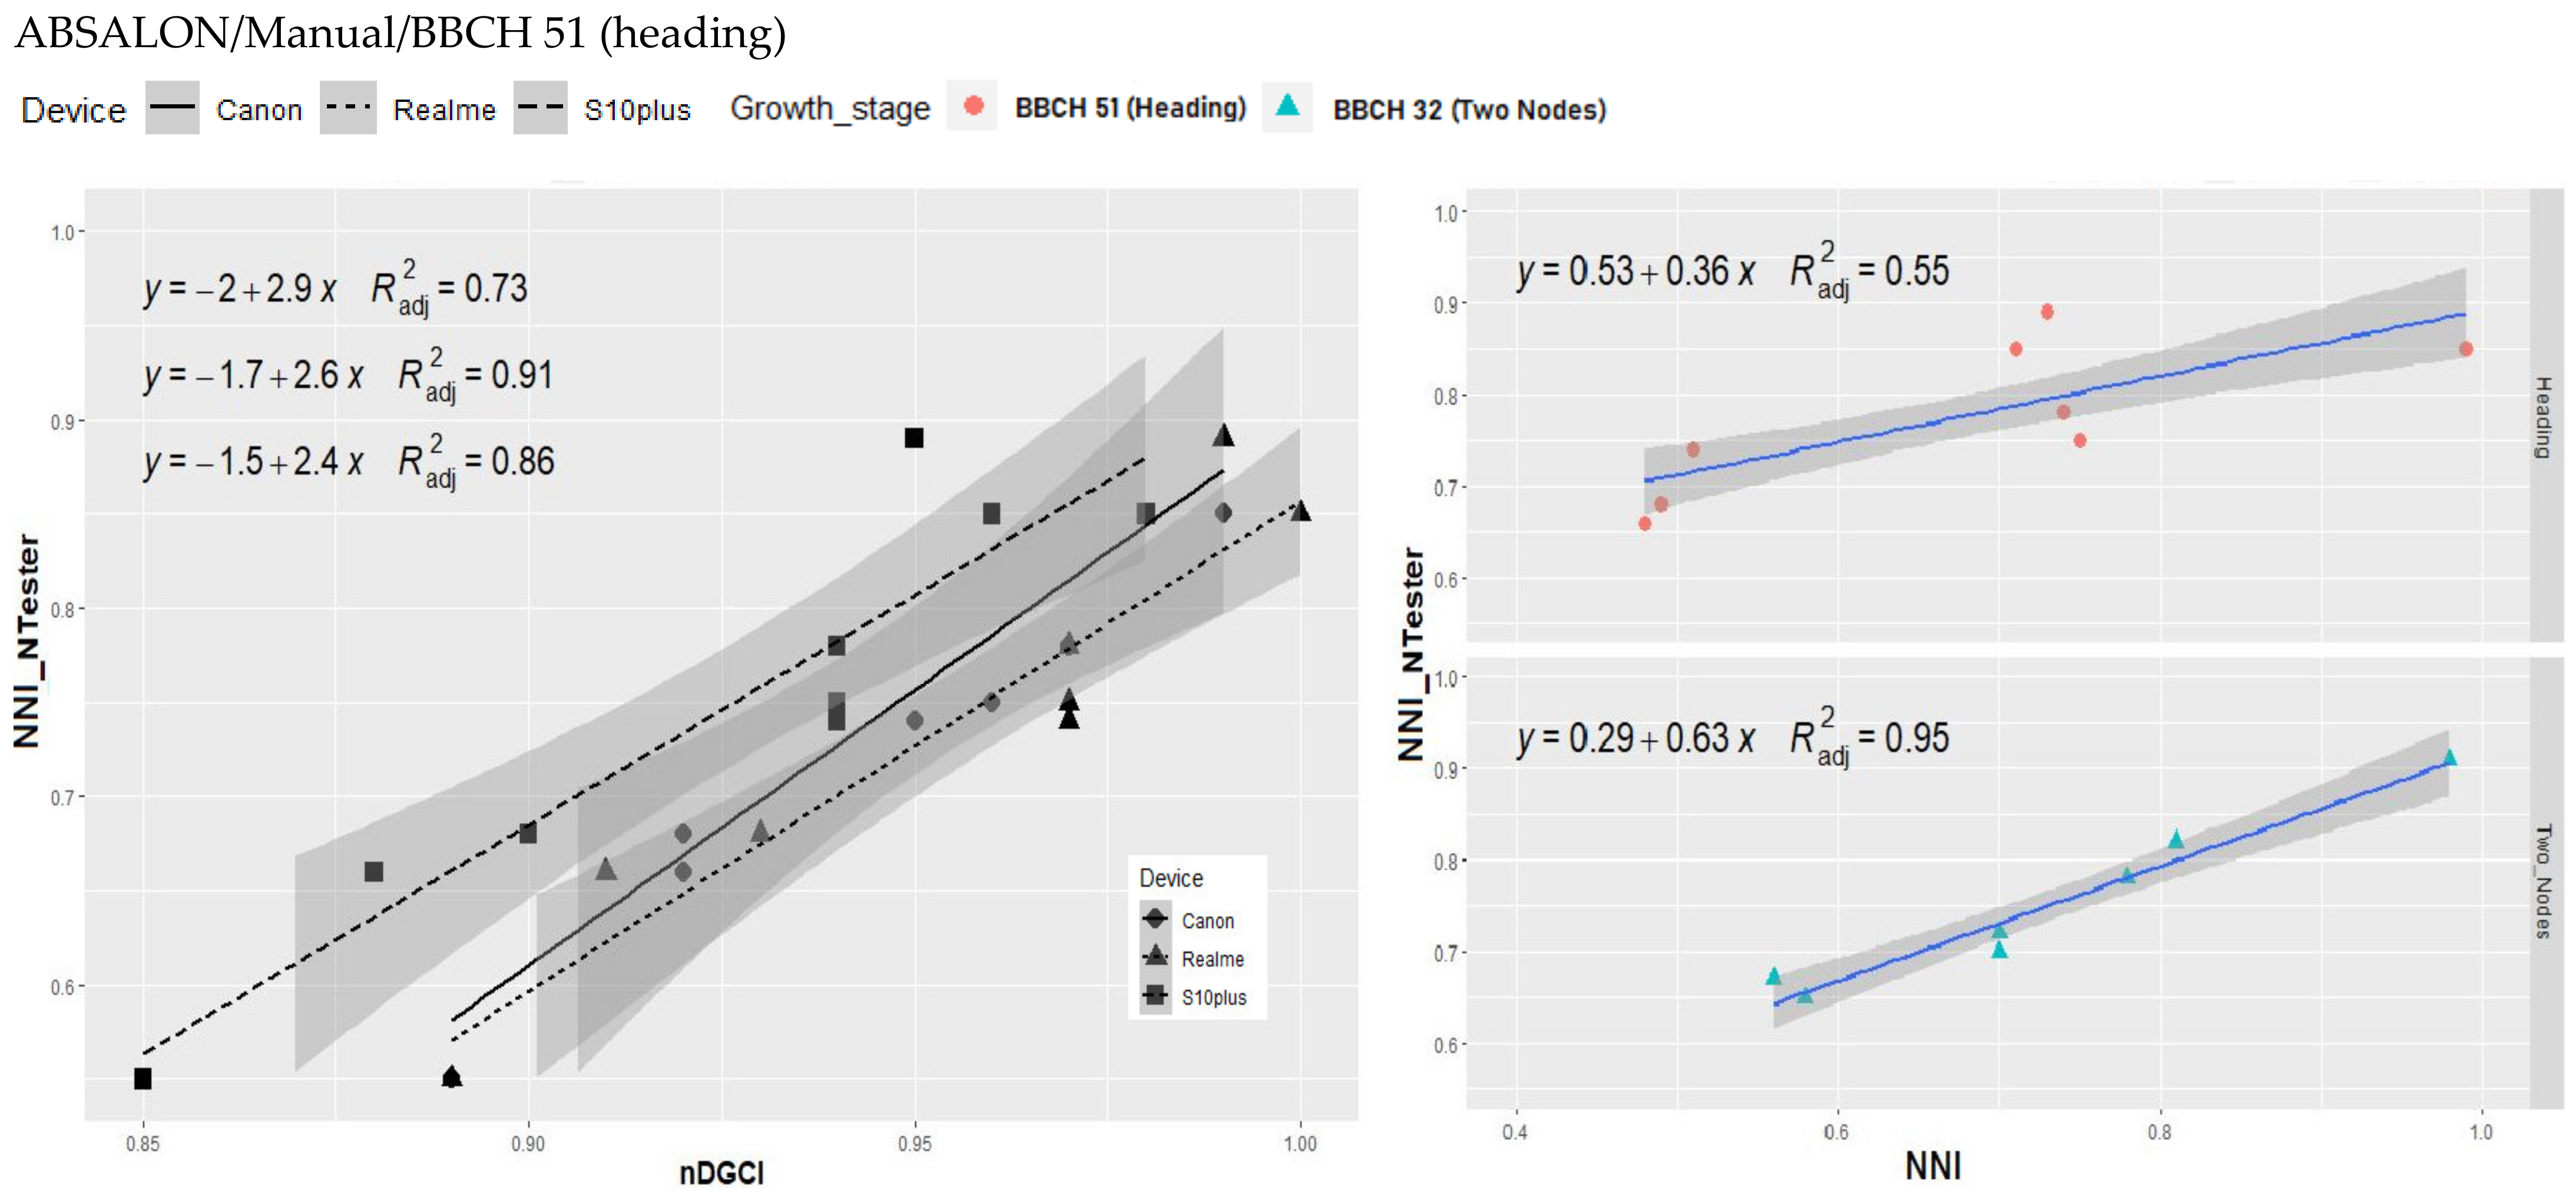
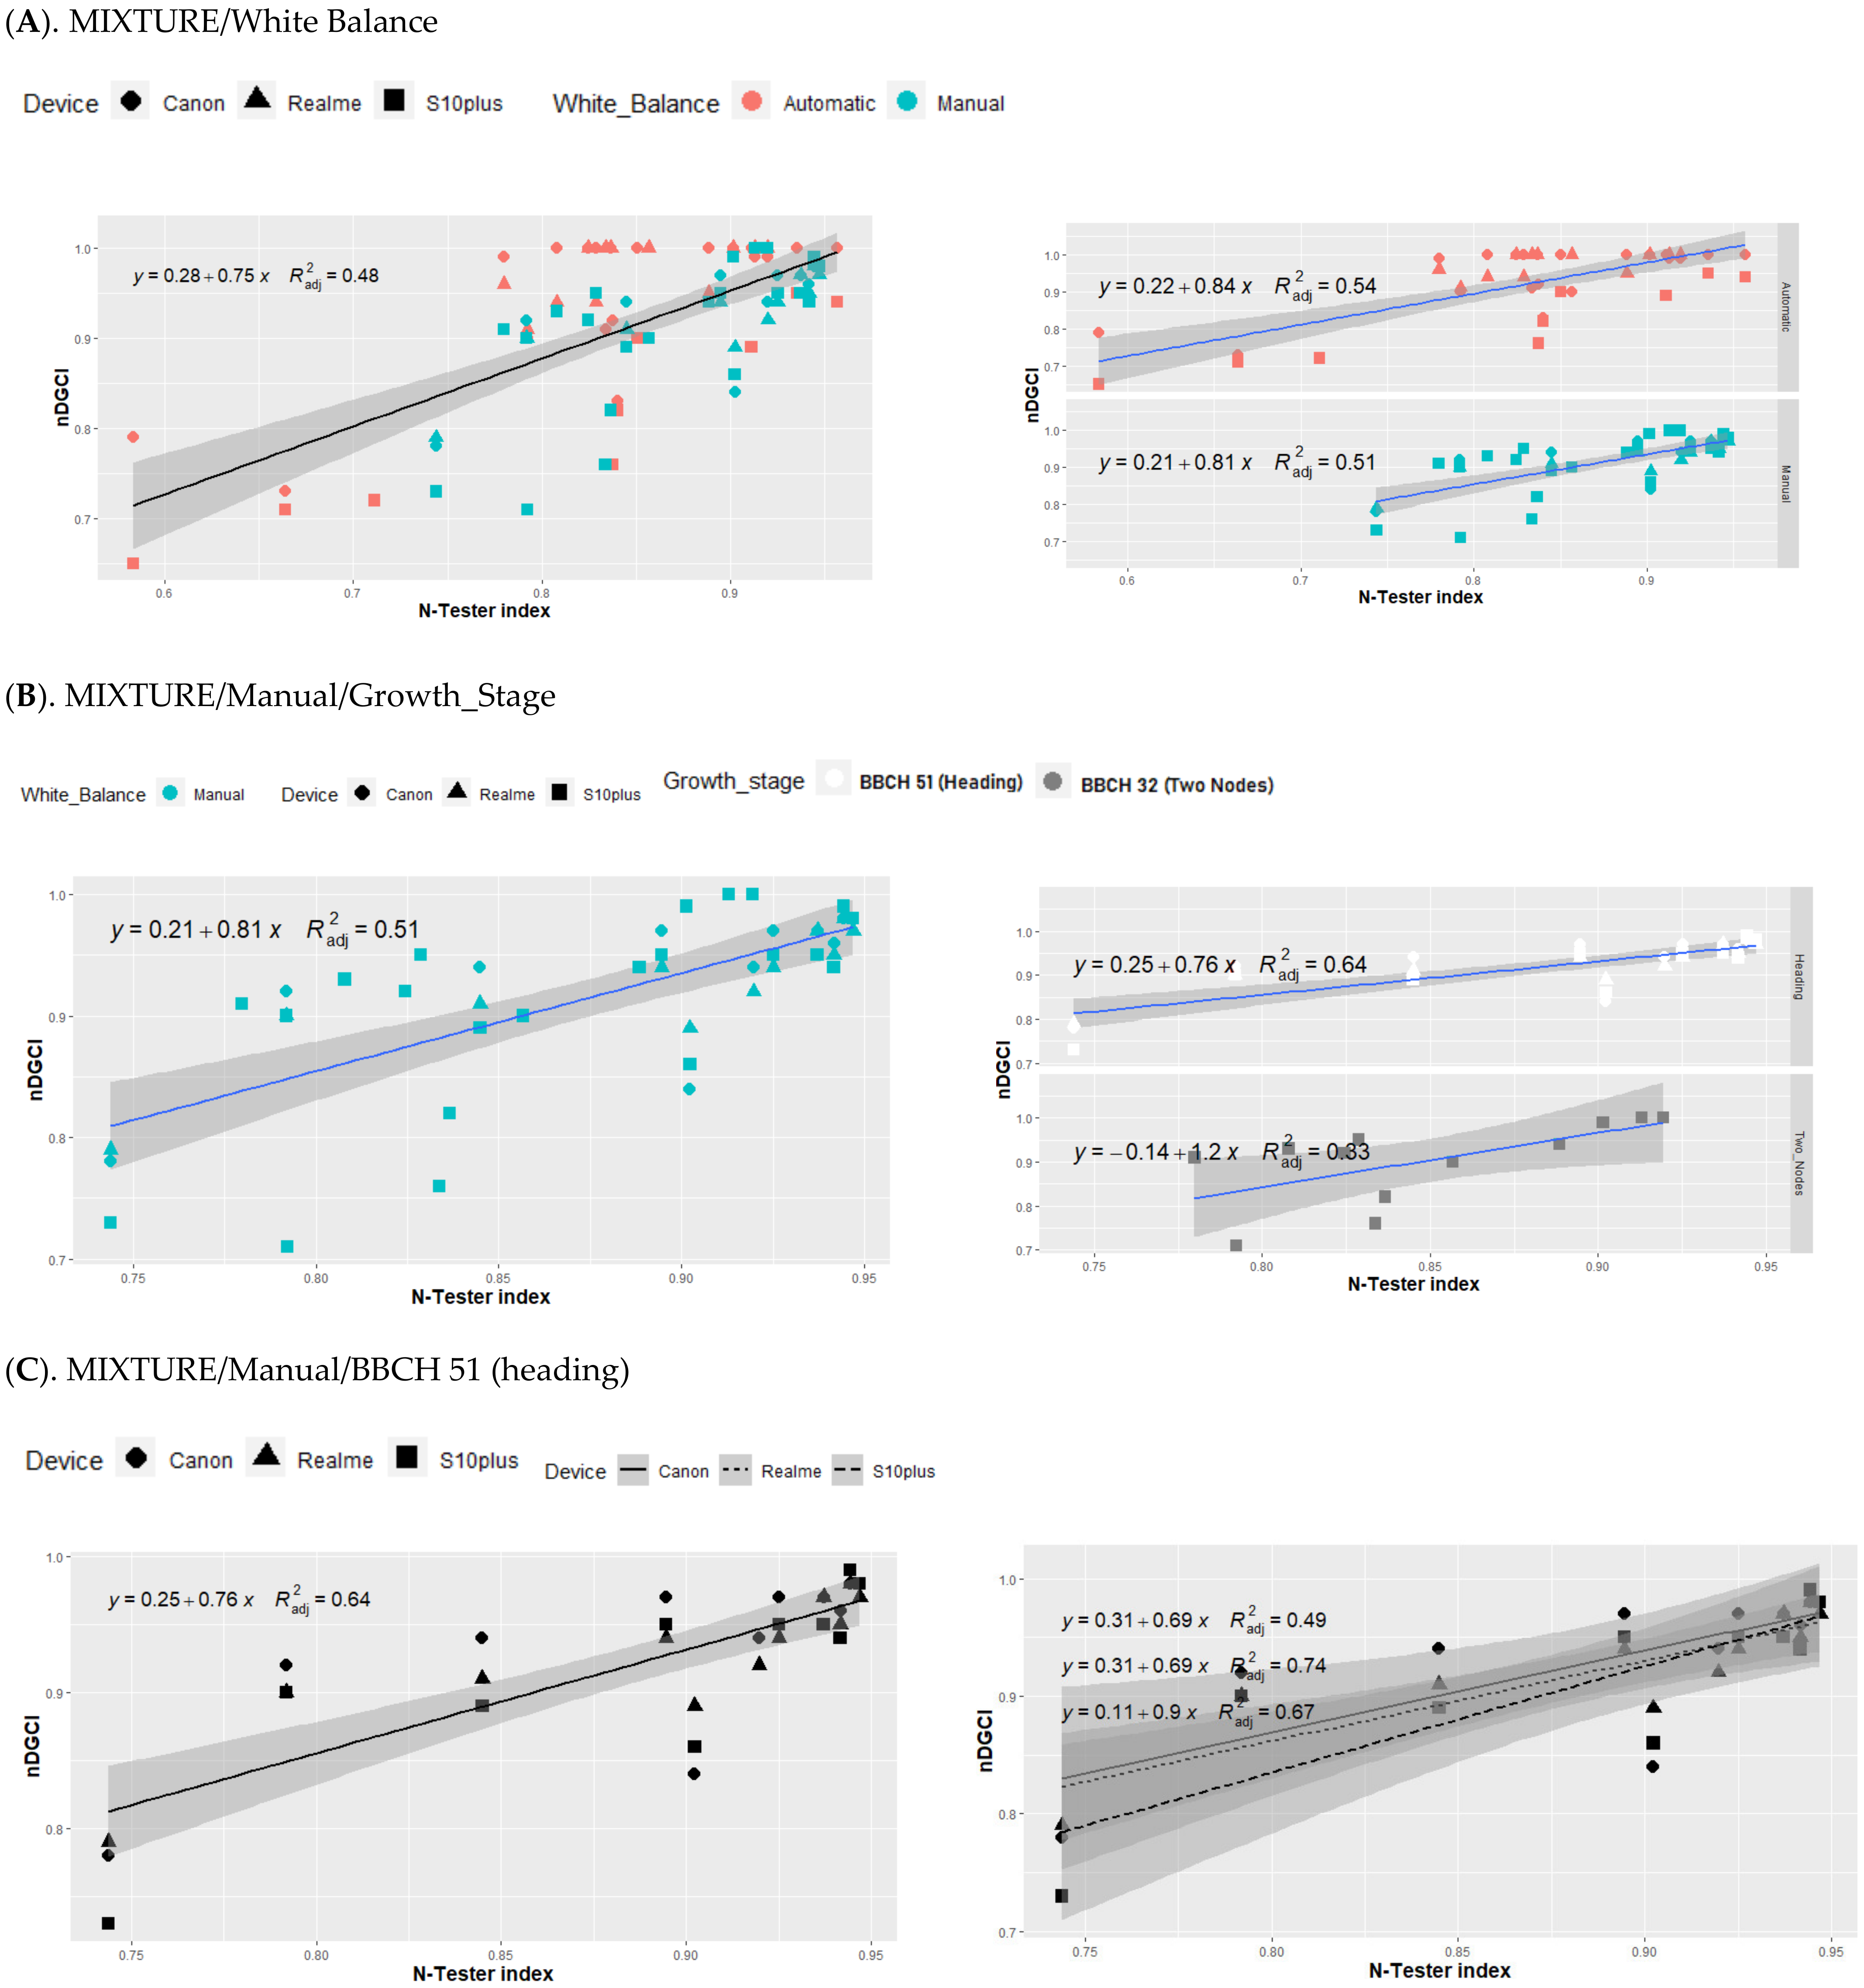
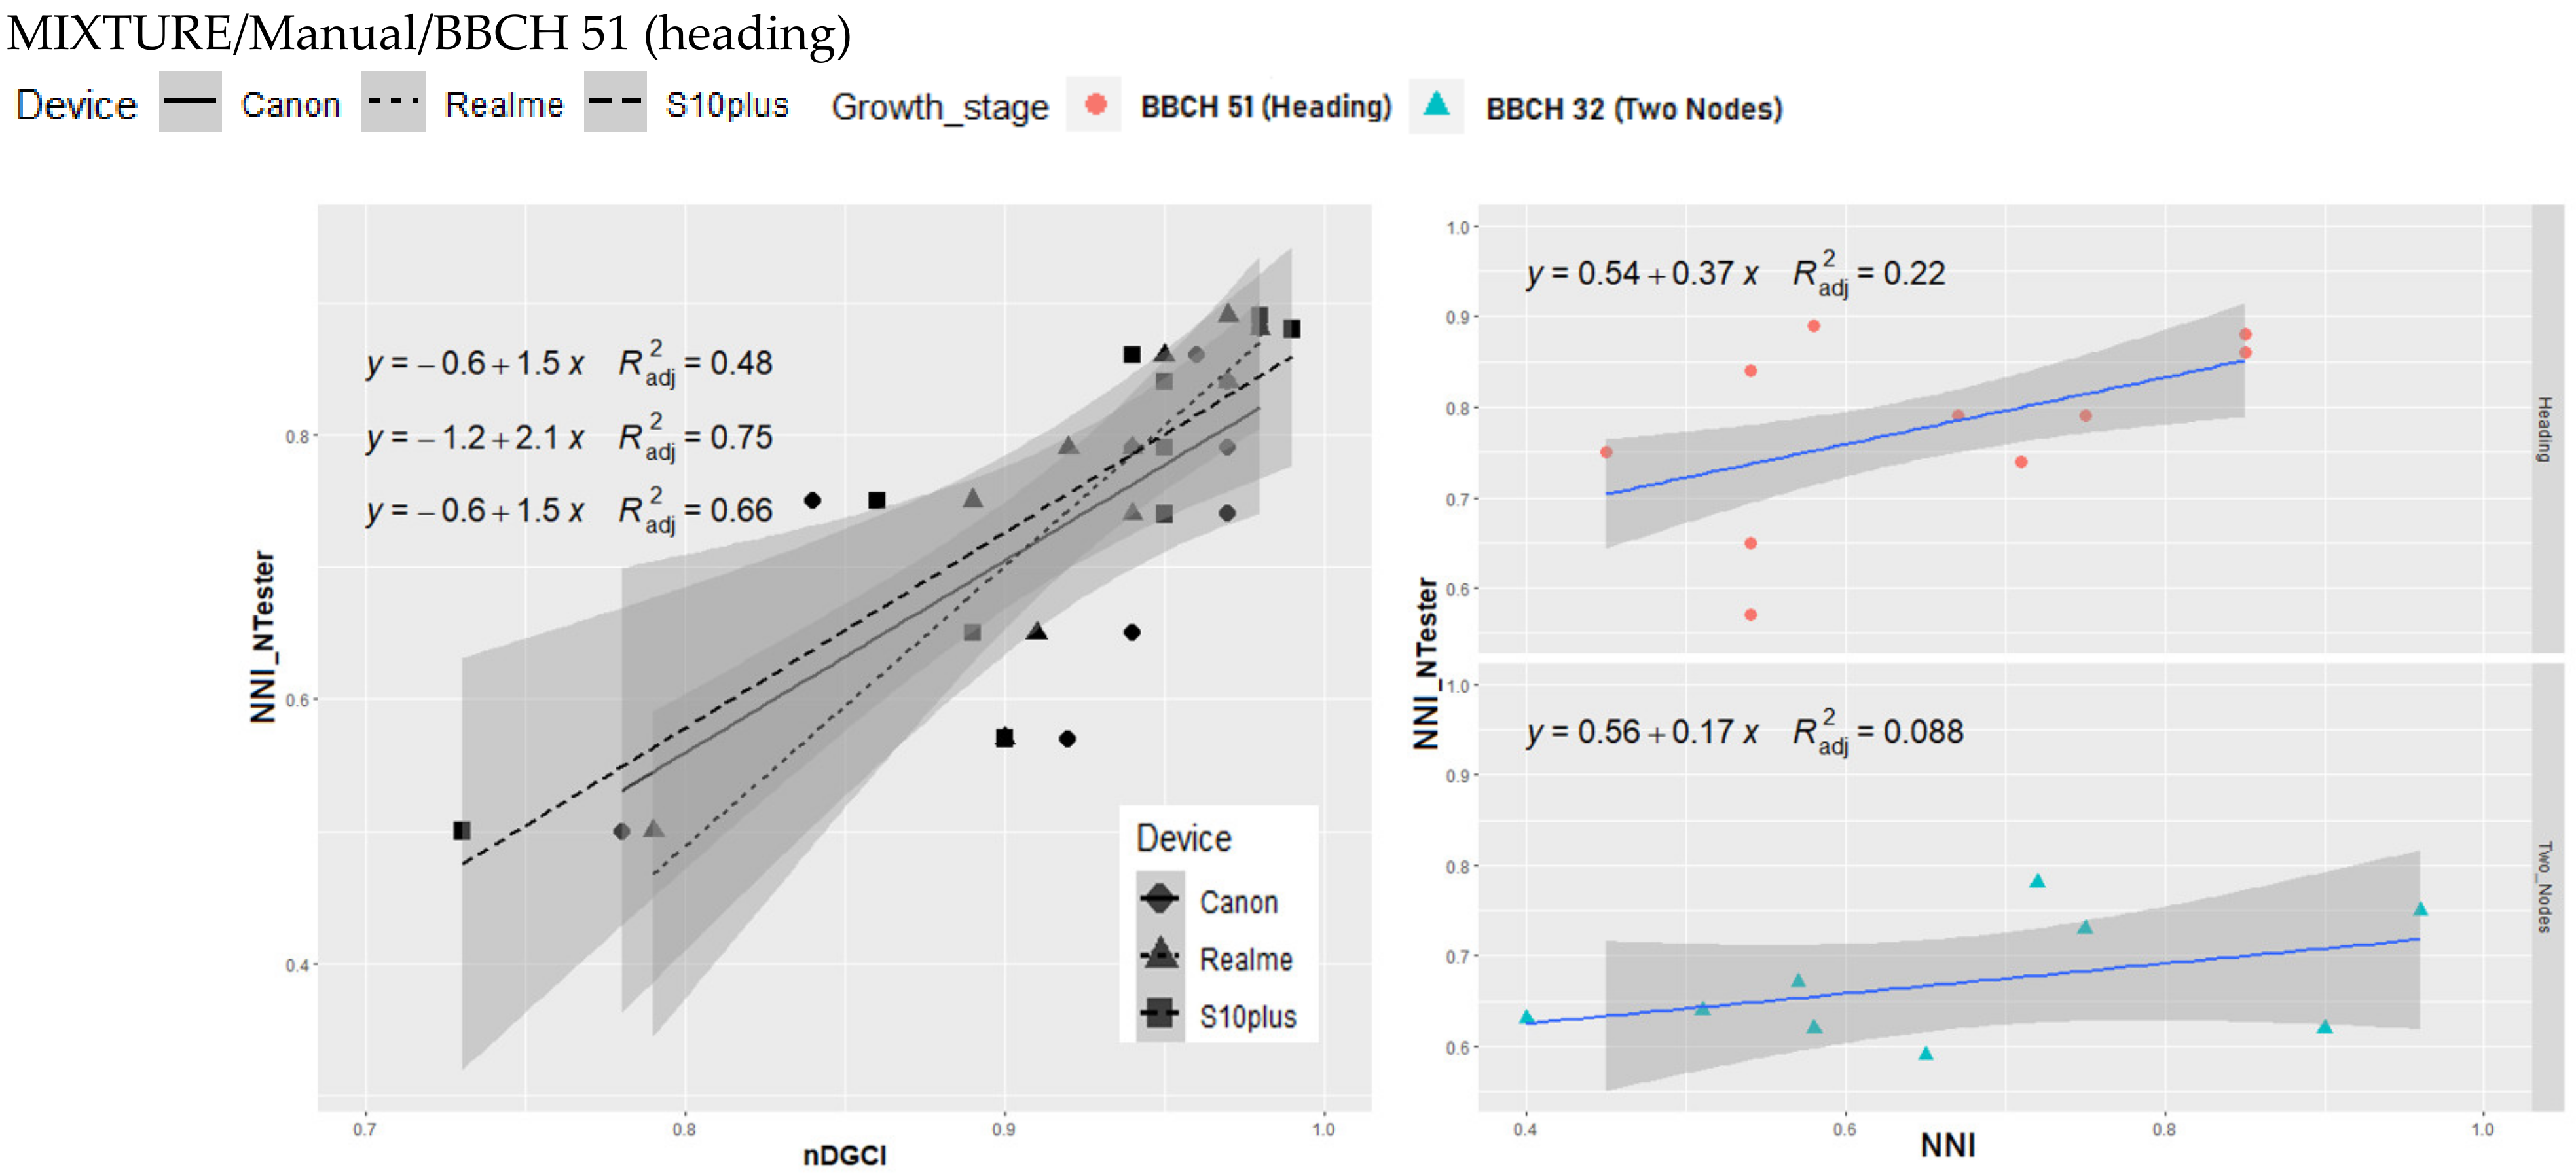
3.3. Relationship between nDGCI and Yara N-Tester

After examining the influence of optical factors (optical device and white balance) on DGCI and nDGCI values, the investigations focused on the effect of these factors on the relationship between nDGCI values and N-Tester index deduced for N-Tester values. Figure 5 presents a global result of this relationship according to the LG Absalon wheat cultivar; results concerning a mixture of varieties are presented in Appendix A (Figure A3). Regarding the results of Figure 5 (Panel A), the linear relationship involving nDGCI values of the whole dataset, independently of any optical factor (device and white balance), the quality of the linear regression was low (R2 = 0.43). However, when considering the white balance modalities (Panel A), the quality of the linear regression was greatly improved with Manual mode (R2 = 0.76) compared to Automatic mode (R2 = 0.33). The same results were observed in the case of a mixture of wheat cultivars (Figure A3). By carrying on the analysis of this relationship while keeping optimal working conditions, i.e., with the LG Absalon wheat cultivar with the WB set to Manual, Figure 5 (Panel B) shows that the improvement of the quality of the linear regression considering the plant-related factors: growth stage and cultivar. The close relationship (R2 = 0.76) was maintained in the case of the BBCH 51 (heading) growth stage (R2 = 0.77) and was slightly less tight for the BBCH 32 (two nodes) stage (R2 = 0.72) with, in both cases, a significant positive relationship (p-value < 0.05). In the case of the BBCH 32 stage (two-nodes), it is difficult to conclude on the declining quality of this relationship because the dataset containing the WB set to Manual was too small (20 over 60, see Table 2) and the trend still showed a strong relationship. Concerning the mixture of wheat cultivars (Figure A3), compared to the single cultivar LG Absalon, the quality of the linear relationship deteriorated from (R2 = 0.76) to (R2 = 0.51) when the WB was set to Manual (Panel A). As for the LG Absalon wheat cultivar, as regards the growth stage of BBCH 51 (heading) (Panel B), the quality was also improved (R2 = 0.64).
To further analyse the influence of the different factors in the relationship, the possible influence of each device was evaluated (Figure 5, Panel C) on the linear regression (slope and intercept). For this study, the following plant factors were selected: the wheat cultivar LG Absalon and the BBCH 51 (heading) growth stage. Moreover, the WB was set to Manual. The relationship between nDGCI and N-tester index for BBCH 51 (heading) showed that the linear relationship is slightly degraded for the cultivar mixture (R2 = 0.64, Figure A3, Panel C) compared to a pure cultivar (LG Absalon, R2 = 0.77, Figure 5, Panel C). However, under these conditions, a close relationship was obtained for each device with a coefficient of determination ranging from 0.81 for the Canon digital camera to 0.91 for the smartphones. The quality of the linear regression seemed to be slightly better for the two smartphones, the Realme (R2 = 0.92) and the Samsung S10+ (R2 = 0.9) compared to the Canon camera (R2 = 0.81). The slopes of the linear regressions for the smartphone data, Realme and S10+, were parallel; but the intercepts are offset. For the Canon camera and the Realme smartphone, the intercepts were relatively close, but the slopes were slightly different. Finally, for the Canon camera and the S10+ smartphone, the intercepts were different and the slopes slightly different. From these observations, we used an analysis of the covariance, ANCOVA, to test for a general linear model, the influence of the devices on the linear regression (slope and intercept). For this purpose, one interaction term (‘Device’ modality) was inserted into the linear model (nDGCI~N-Tester index). Concerning the slope of the relationship, the result of ANOVA table indicated a p-value = 0.25, which means that the interaction (i.e., the device) was not statistically significant and, so, the variation of the nDGCI (via the slope) was not different for the three devices.
Consequently, the statistical analysis was further developed by exploring the effect of the interaction (i.e., device) on the intercept. In practice, this involves making two adjustments: one with k lines of identical slopes, and another with a single line (identical slopes and ordinates for the k lines). After, the result of the comparison of these fits was carried out with an F-test, which was found to be statistically significant (p-value = 0.006). This means that a difference between the intercepts was highlighted. In conclusion, the type of device did not seem to influence the slope of the linear regression but it had a statistically significant effect on the intercept. In the case of a mixture of wheat cultivars, the results are presented in Appendix A (Figure A3, Panel C), the quality of the linear relationships deteriorated from R2 = 0.74 (for the Realme Smartphone) to R2 = 0.49 (for the digital Camera Canon). Regarding ANCOVA, the result was different from that obtained for LG Absalon. For the mixture of cultivars, there was no statistical difference between the devices. We can, therefore, assume a single relationship (a single line), whatever the optical device.

4. Discussion

Visible imaging seems to be a promising alternative to N-Tester chlorophyll meter. Previous results indicate that there is a strong relationship between nDGCI values and the N-Tester index values independent of optical devices, provided that the white balance setting is selected in Manual mode. In the literature, the DGCI index relies on a calibration based on the use of a Munsell (or MacBeth) colour chart, which makes it usable only at the plant leaf scale [32,33]. By proposing a normalized DGCI (nDGCI), based on a measurement of an over-fertilized plot, it becomes possible to work easily at the plant stand level to prescribe a dynamic fertilization management from local information.

Response of the nDGCI to Leaf Nitrogen Status

In a dynamic management of nitrogen fertilization in wheat, the measurements obtained with the nDGCI indicator were first compared with that of the NNI_NTester deduced from Equations (2) and (3). Working with optimal experimental conditions (i.e., only one cultivar and WB set on Manual and a sufficient nDGCI dataset), this led us to work at BBCH 51 (heading) wheat growth stage with a dataset of 27 observables.
The results are presented in Figure 6 (left panel). The values of nDGCI agreed well with NNI-NTester, where the best correlation was obtained for smartphones (R2 = 0.91 for the Realme and R2 = 0.86 for the S10+). The statistical analysis of ANCOVA type showed, as before, that the slope of the linear regression was not influenced by the type of device (no significant statistical effect) but the intercept was sensitive to the device type. Therefore, a calibration curve per device type seems necessary to transform the nDGCI back into the N-Tester index and then into NNI_Tester. Further measurements are needed to confirm this trend and to further investigate the effect of wheat growth stage and the robustness of these relationships over time. In Figure 6 (right panel), the quality of the relationship between the NNI_NTester values and the NNI data from the laboratory’s biomass measurements, which gives access to direct measurements of plant nitrogen, was also investigated. These results confirm that the relationship is best for the wheat growth stage BBCH 32 (two-nodes) (R2 = 0.95) than for the BBCH 51 (heading) stage (R2 = 0.55). This result is consistent with the literature which considers it at a key stage to fertilize [34].
Concerning the mixture of wheat cultivars, the results presented in Figure A4 are of lower quality compared to those obtained for a single cultivar, but the same trends are observed. In Figure A4, left panel, the best correlation is obtained for smartphones (R2 = 0.75 for the Realme and R2 = 0.66 for the S10+). In addition, the strong relationship observed between NNI_NTester and NNI (deduced from biomass, see Equations (4) and (5)) for the cultivar LG Absalon is, in the case of the mixture, non-existent. This shows that this relationship seems very sensitive to the wheat variety.
In the literature, the replacement of NNI by optical measurements was well studied, looking, in particular, at the effect of cultivar and growth stage of wheat. For example, specific relationships were found between SPAD measurement and NNI of winter wheat at early stem elongation [49] or at flowering for durum wheat [16]. These results seem to show that, in the absence of calibration or normalization of the CMR, it is impossible to find a relationship that is not dependent on growth stage or genotype. Another work reported the use of normalized reflectance signals, such as NDVI, to prescribe variable nitrogen fertilization on a winter wheat crop [15]. However, the results showed that values tend to vary between genotypes, years and sites. Nevertheless, Prost and Jeuffroy [44] found a non-cultivar dependent exponential relationship between SPAD index and NNI at flowering stage for winter wheat (Triticum aestivum L.), with an r2 equal to 0.89. These promising results give us hope that a similar relationship will be found with the use of nDGCI. This requires further experiments focusing on the study of different cultivars rather than the comparison between a cultivar and a mixture of different cultivars.
However, to go as far as recommending a nitrogen fertilization using visible imagery, it will be necessary to concentrate the nDGCI measurements with the WB set to Manual mode and at the wheat growth stage BBCH 32 (two-nodes) and then identify the best model to correlate nDGCI to NNI.

5. Conclusions

This study demonstrated the potential of the nDGCI to replace the contact measurements issued from Yara N-Tester readings independently of the optical device used. The use of normalization of DGCI improved the acquisition protocol with the absence of a colour chart, allowing its adoption for proximal sensing applications (drones and ground robots). This result was conditioned by the fact that the study microplot and the over-fertilized microplot must be measured simultaneously to calculate the nDGCI with the white balance set to the same Manual mode.
This work showed the best results for the winter wheat crop on a single variety (LG Absalon). The results suggest that the relationship between nDGCI and NNI_NTester is highly sensitive to the wheat variety. Although the wheat growth stage BBCH 32 (two-nodes) is a crucial stage for N fertilization, it was not possible to confirm this because of a lack of data on this stage. However, further experiments are needed to expand the dataset and study this relationship with other cultivars during the wheat growing season and in different years. Nevertheless, this is a promising study to monitor the nitrogen status of crops using low-cost, visible-imaging techniques to adjust nitrogen inputs as closely as possible to crop needs.

Author Contributions

Methodology: C.G. and A.-S.V.; acquisition: C.G., M.d.Y. and A.-S.V.; statistical analyses: L.D., C.G. and A.-S.V.; image processing: E.D. and C.G. All authors have read and agreed to the published version of the manuscript.

Funding

This work was funded by Plant2Pro® Institute in the frame of its 2022 call for projects. Plant2Pro® is supported by ANR (agreement #22-CARN-024-01).

Acknowledgments

Many thanks to Valérie Dufayet and Céline Colombet, who were involved in this project in the design of the crop system and in the in-field N fertilization management, respectively.

Conflicts of Interest

The authors declare no conflict of interest.

Appendix A

Figure A1. Comparison between DGCI and nDGCI values as a function of the white balance (WB) setting (Automatic vs. Manual) for each camera (Canon EOS 760D, Realme and Samsung S10+) concerning a mixture of wheat cultivars. (Significance of the codes: p-value < 0.01 (**), p-value < 0.05 (*) and p-value > 0.05 (ns)).
Remotesensing 15 02510 g0a1
Figure A2. Study of the impact of the three devices (digital camera: Canon EOS 760D and two smartphones: Realme and Samsung S10+) on the nDGCI values measured on a mixture of wheat cultivars according to the Automatic or Manual white balance mode (significance of the codes: p-value < 0.05 (*) and p-value > 0.05 (ns)).
Remotesensing 15 02510 g0a2
Figure A3. Relationship between the normalized DGCI (nDGCI) and the N-Tester index deduced from N_tester values for the dataset concerning the mixture of wheat cultivars and whatever the optical device with the WB set to Automatic or Manual (Panel (A)) and among wheat growth stage: BBCH 32 (two-nodes) or BBCH 51 (heading) (Panel (B)) or devices: Canon EOS 760D, Realme and Samsung S10+ (Panel (C)).
Remotesensing 15 02510 g0a3
Figure A4. Relationships by the device type between the normalized DGCI (nDGCI) and the NNI deduced from N-Tester readings (NNI_NTester) for the LG Absalon cultivar dataset and for all the optical device with the WB set to Manual and considering the wheat growth stage BBCH 51 (heading) ((left) panel). Relationships (regardless of the optical device) between NNI_NTester and NNI derived from biomass measurements ((right) panel) according to the wheat growth stage (BBCH 32, two-nodes vs. BBCH 51, heading).
Remotesensing 15 02510 g0a4

References

  1. Comifer. Calcul De La Fertilisation Azotée, Guide Méthodologique Pour L’établissement Des Prescriptions Locales (Calculation of Nitrogen Fertilisation, Methodological Guide for Establishing Local Requirements); Comifer: Paris, France, 2011. [Google Scholar]
  2. Hébert, J. La fumure azotée du blé tendre d’hiver (Nitrogen fertilizsation of soft winter wheat). Bull. Technol. Inform. Min. Agric. 1969, 224, 755–766. [Google Scholar]
  3. Ravier, C.; Jeuffroy, M.H.; Meynard, J.M. Mismatch between a science-based decision tool and its use: The case of the balance-sheet method for nitrogen fertilization in France. NJAS Wagening J. Life Sci. 2016, 79, 31–40. [Google Scholar] [CrossRef]
  4. Ravier, C.; Jeuffroy, M.H.; Gate, P.; Cohan, J.P.; Meynard, J.M. Combining user involvement with NNIovative design to develop a radical new method for managing N fertilization. Nutr. Cycl. Agroecosyst. 2018, 110, 117–134. [Google Scholar] [CrossRef]
  5. Lemaire, G.; Gastal, F.; Salette, J. Analysis of the effect of N nutrition on dry matter yield of a sward by reference to potential yield and optimum N content. In Proceedings of the 16th International Grassland Congress, Nice, France, 4–11 October 1989; pp. 179–180. [Google Scholar]
  6. Gastal, F.; Lemaire, G. N uptake and distribution in crops: An agronomical and ecophysiological perspective. J. Exp. Bot. 2002, 53, 789–799. [Google Scholar] [CrossRef]
  7. Lemaire, G.; Ciampitti, I. Crop mass and N status as prerequisite covariables for unravelling nitrogen use efficiency across genotype-by-environment-by-management scenarios: A Review. Plants 2020, 9, 1309. [Google Scholar] [CrossRef]
  8. Sharma, L.K.; Bali, S.K. A review of methods to improve nitrogen use efficiency in agriculture. Sustainability 2018, 10, 51. [Google Scholar] [CrossRef]
  9. Gastal, F.; Lemaire, G.; Durand, J.L.; Louarn, G. Chap. 8: Quantifying crop responses to nitrogen and avenues to improve nitrogen-use efficiency. In Crop Physiology, 2nd ed.; Academic Press: Cambridge, MA, USA, 2015; pp. 161–206. [Google Scholar] [CrossRef]
  10. Justes, E.; Mary, B.; Meynard, J.M.; Machet, J.M.; Thelier-Huché, L. Determination of a critical nitrogen dilution curve for winter wheat crops. Ann. Bot. 1994, 74, 397–407. [Google Scholar] [CrossRef]
  11. Chen, P. A comparison of two approaches for estimating the wheat nitrogen nutrition index using remote sensing. Remote Sens. 2015, 7, 4527–4548. [Google Scholar] [CrossRef]
  12. Padilla, F.M.; Gallardo, M.; Pena-Fleitas, M.T.; De Souza, R.; Thompson, R. Proximal optical sensors for nitrogen management of vegetable crops: A review. Sensors 2018, 18, 2083. [Google Scholar] [CrossRef]
  13. Baret, F.; Fourty, T. Radiometric estimates of nitrogen status of leaves and canopies. In Diagnosis of the Nitrogen Status in Crops; Lemaire, G., Ed.; Springer: Berlin/Heidelberg, Germany, 1997; pp. 201–227. [Google Scholar] [CrossRef]
  14. Haboudane, D.; Tremblay, N.; Miller, J.R. Remote Estimation of Crop Chlorophyll Content Using Spectral Indices Derived From Hyperspectral Data. IEEE Trans. Geosci. Remote Sens. 2008, 46, 423–437. [Google Scholar] [CrossRef]
  15. Samborski, S.M.; Gozdowski, D.; Walsh, O.S.; Lamb, D.W.; Stępień, M.; Gacek, E.S.; Drzazga, T. Winter Wheat Genotype Effect on Canopy Reflectance: Implications for Using NDVI for In-Season Nitrogen Topdressing Recommendations. J. Agron. 2015, 107, 2097–2106. [Google Scholar] [CrossRef]
  16. Debaeke, P.; Rouet, P.; Justes, E. Relationship between the normalized SPAD index and the nitrogen nutrition index: Application to Durum Wheat. J. Plant Nutr. 2006, 29, 75–92. [Google Scholar] [CrossRef]
  17. Bavec, F.; Bavec, M. Chlorophyll meter readings of winter wheat cultivars and grain yield prediction. Commun. Soil Sci. Plan. 2001, 32, 2709–2719. [Google Scholar] [CrossRef]
  18. Varvel, G.E.; Schepers, J.S.; Francis, D.D. Ability for In-Season Correction of Nitrogen Deficiency in Corn Using Chlorophyll Meters. Soil Sci. Soc. Am. J. 1997, 61, 1233–1239. [Google Scholar] [CrossRef]
  19. Blackmer, T.M.; Schepers, J.S. Use of a Chlorophyll Meter to Monitor Nitrogen Status and Schedule Fertigation for Corn. J. Prod. Agr. 1995, 8, 56–60. [Google Scholar] [CrossRef]
  20. Jinru, X.; Su, B. Significant Remote Sensing Vegetation Indices: A Review of Developments and Applications. J. Sens. 2017, 2017, 1353691. [Google Scholar] [CrossRef]
  21. Gabriel, J.L.; Zarco-Tejada, P.J.; Lopez-Herrera, P.J.; Perez-Martin, E.; Alonso-Ayuso, M.; Quemada, M. Airborne and ground level sensors for monitoring nitrogen status in a maize crop. Biosyst. Eng. 2017, 160, 124–133. [Google Scholar] [CrossRef]
  22. Saberioon, M.M.; Amin MS, M.; Gholizadeh, A.; Ezri, M.H. A Review of Optical Methods for Assessing Nitrogen Contents During Rice Growth. Appl. Eng. Agric. 2014, 30, 657–669. [Google Scholar] [CrossRef]
  23. Rouse, J.; Haas, R.; Schell, J.; Deering, D. Monitoring vegetation systems in the Great Plains with ERTS. In Third Earth Resources Technology Satellite-1 Symposium—Volume I: Technical Presentations; NASA: Washington, DC, USA, 1974; p. 309. [Google Scholar]
  24. Huete, A.R. A Soil—Adjusted Vegetation Index (SAVI). Remote Sens. Environ. 1988, 25, 295–309. [Google Scholar] [CrossRef]
  25. Cerovic, Z.G.; Ghozlen, N.B.; Milhade, C.; Obert, M.; Debuisson, S.; Le Moigne, M. Nondestructive diagnostic test for nitrogen nutrition of grapevine (Vitis vinifera L.) based on dualex leaf-clip measurements in the field. J. Agric. Food Chem. 2015, 63, 3669–3680. [Google Scholar] [CrossRef]
  26. Woebbecke, D.M.; Meyer, G.E.; Von Bargen, K.; Mortensen, D.A. Color indices for weed identification under various soil, residue, and lighting conditions. Trans. ASAE 1995, 38, 259–269. [Google Scholar] [CrossRef]
  27. Hunt, E.; Daughtry, C.; Eitel, J.; Long, D. Remote Sensing Leaf Chlorophyll Content Using a Visible Band Index. Agron. J. 2011, 103, 1090–1099. [Google Scholar] [CrossRef]
  28. Vollmann, J.; Walter, H.; Sato, T.; Schweiger, P. Digital image analysis and chlorophyll metering for phenotyping the effects of nodulation in soybean. Comput. Electron. Agric. 2011, 75, 190–195. [Google Scholar] [CrossRef]
  29. Rigon, J.; Silvia Capuani, S.; Fernandes, D.; Guimarães, T. A novel method for the estimation of soybean chlorophyll content using a smartphone and image analysis. Photosynthetica 2016, 54, 559–566. [Google Scholar] [CrossRef]
  30. Karcher, D.E.; Richardson, M.D. Quantifying turfgrass color using digital image analysis. Crop Sci. 2003, 43, 943–951. [Google Scholar] [CrossRef]
  31. Hassanijalilian, O.; Igathinathane, C.; Doetkott, C.; Bajwa, S.; Nowatzki, J.; Esmaeili, S.A.J. Chlorophyll estimation in soybean leaves infield with smartphone digital imaging and machine learning. Comput. Electron. Agric. 2020, 174, 105433. [Google Scholar] [CrossRef]
  32. Rorie, R.L.; Purcell, L.C.; Mozaffari, M.; Karcher, D.E.; King, C.A.; Marsh, M.C.; Longer, D.E. Association of “greenness” in corn with yield and leaf nitrogen concentration. Agron. J. 2011, 103, 529–535. [Google Scholar] [CrossRef]
  33. Rorie, R.L.; Purcell, L.C.; Karcher, D.E.; King, C.A. The assessment of leaf nitrogen in corn from digital images. Crop Sci. 2011, 51, 2174–2180. [Google Scholar] [CrossRef]
  34. Rhezali, A.; Lahlali, R. Nitrogen (N) Mineral Nutrition and Imaging Sensors for Determining N Status and Requirements of Maize. J. Imaging 2017, 3, 51. [Google Scholar] [CrossRef]
  35. Furuya, S. Growth diagnosis of rice plants by means of leaf colour. Jpn. Agric. Res. Q. 1987, 20, 147–153. [Google Scholar]
  36. Singh, B.; Singh, Y.; Ladha, J.K.; Bronson, K.F.; Balasubramanian, V.; Singh, J.; Khind, C.S. Chlorophyll meter-and leaf colour chart-based nitrogen management for rice and wheat in Northwestern India. Agron. J. 2002, 94, 821–829. [Google Scholar] [CrossRef]
  37. Yang, W.H.; Peng, S.; Huang, J.; Sanico, A.L.; Bures, R.J.; Witt, C. Using leaf colour charts to estimate leaf nitrogen status of rice. Agron. J. 2003, 95, 212–217. [Google Scholar] [CrossRef]
  38. Petiole Pro. Available online: https://www.petiolepro.com/blog/dark-green-colour-index-dgci-a-new-measurement-of-chlorophyll/ (accessed on 20 March 2023).
  39. Bacenetti, J.; Paleari, L.; Tartarini, S.; Vesely, F.M.; Foi, M.; Movedi, E.; Ravasi, R.A.; Bellopede, V.; Durello, S.; Ceravolo, C.; et al. May smart technologies reduce the environmental impact of nitrogen fertilization? A case study for paddy rice. Sci. Total Environ. 2020, 715, 136956. [Google Scholar] [CrossRef] [PubMed]
  40. Li, J.; Zhang, F.; Qian, X.; Zhu, Y.; Shen, G. Quantification of rice canopy nitrogen balance index with digital imagery from unmanned aerial vehicle. Remote Sens. Lett. 2015, 6, 183–189. [Google Scholar] [CrossRef]
  41. Saberioon, M.M.; Amin, M.S.M.; Anuar, A.R.; Gholizadeh, A.; Wayayok, A.; Khairunniza-Bejo, S. Assessment of rice leaf chlorophyll content using visible bands at different growth stages at both the leaf and canopy scale. Int. J. Appl. Earth Obs. Geoinf. 2014, 32, 35–45. [Google Scholar] [CrossRef]
  42. Meier, U. Growth Stages of Mono-and Dicotyledonous Plants. In BBCH Monograph, 2nd ed.; Federal Biological Research Centre for Agriculture and Forestry: Quedlinburg, Germany, 2001; p. 158. [Google Scholar]
  43. YARA, Nanterre, France. N-Tester, Mode D’emploi. Blé, Orge de Printemps, Pomme de Terre, Maïs. (N-Tester, Instructions for use. Wheat, Spring Barley, Potato, Maize). Available online: https://www.yara.fr/contentassets/89e0f28207c14d8e84aceae75cfc1437/n-tester-manuel-mais.pdf/ (accessed on 20 March 2023).
  44. Prost, L.; Jeuffroy, M.H. Replacing the nitrogen nutrition index by the chlorophyll meter to assess wheat N status. Agron. Sustain. Dev. 2007, 27, 321–330. [Google Scholar] [CrossRef]
  45. Aranguren, M.; Castellon, A.; Aizpurua, A. Crop sensor based non-destructive estimation of nitrogen nutritional status, yield, and grain protein content in wheat. Agriculture 2020, 10, 148. [Google Scholar] [CrossRef]
  46. Gée, C.; Denimal, E. Two new non-destructive image-derived indicators for spatial assessment of the impact of broadleaf weeds on wheat biomass. Remote Sens. 2020, 12, 2982. [Google Scholar] [CrossRef]
  47. R Core Team. R: A Language and Environment for Statistical Computing; R Foundation for Statistical Computing: Vienna, Austria, 2022; Available online: https://www.R-project.org (accessed on 20 March 2023).
  48. RStudio Team. RStudio: Integrated Development Environment for R. Posit Team; Posit Software, PBC: Boston, MA, USA, 2022; Available online: http://www.posit.co/ (accessed on 20 March 2023).
  49. Vouillot, M.O.; Huet, P.; Boissard, P. Early detection of N deficiency in a wheat crop using physiological and radiometric methods. Agronomie 1998, 18, 117–130. [Google Scholar] [CrossRef]
Figure 1. Schematic representation of the layout of the 24 microplots randomly distributed according to the five nitrogen application modalities (T0 to TMax) and according to the two wheat cultivars (LG Absalon or Mixture).
Remotesensing 15 02510 g001
Figure 2. Illustration of the calculation of the DGCI, dark green colour index, from a visible image in a wheat stand.
Remotesensing 15 02510 g002
Figure 3. Comparison between DGCI and nDGCI values as a function of the white balance (WB) setting (automatic vs. manual) for each camera (Canon EOS 760D, Realme and S10+) according to the LG Absalon wheat cultivar. (Significance of the codes: p-value < 1 × 10⁻⁴ (****), p-value < 0.001 (***) and p-value > 0.05 (ns)).
Remotesensing 15 02510 g003
Figure 4. Study of the impact of the three devices (digital camera: Canon EOS 760D and two smartphones: Realme and S10+) on the nDGCI values measured on the wheat cultivar (LG Absalon) according to the according to the white balance mode (Automatic or Manual). (Significance of the codes: p-value < 0.05 (*) and p-value > 0.05 (ns)).
Remotesensing 15 02510 g004
Figure 5. Relationship between the normalized DGCI (nDGCI) and the N-Tester index deduced from Yara N-Tester values for the dataset concerning the LG Absalon wheat cultivar and whatever the optical device with the WB set to Automatic or Manual (Panel (A)) and among wheat growth stage: BBCH 32 (two-nodes) or BBCH 51 (heading) (Panel (B)) and among devices: Canon EOS 760D, Realme and Samsung S10+ (Panel (C)).
Remotesensing 15 02510 g005
Figure 6. Relationships by device type between the normalized DGCI (nDGCI) and NNI_NTester deduced from N-tester readings (NNI_NTester) for the LG Absalon cultivar dataset and for all the optical device with the WB set to Manual and considering the wheat growth stage BBCH 51 (heading) ((left) panel). Relationships (regardless of the optical device) between NNI_NTester and NNI derived from biomass measurements ((right) panel) according to the wheat growth stage (BBCH 32, two-nodes vs. BBCH 51, heading).
Remotesensing 15 02510 g006
Table 1. Levels and dates of N fertilizer inputs (in kg N.ha−1) for the five rates (T0, T1, T2, T3, Tmax).
N Fertilizer Inputs
through 50 kg N.ha−1 Dose
14 February7 March28 March18 AprilTotal
T00 dose00000
T11 dose0500050
T22 doses050500100
T33 doses0505050150
TMaxOver-N fertilization80808080320
Table 2. Description of the characteristics of the optical sensors for the set of images used at each observation date.
Growth StageDateCamera TypeCamera Set-UpDatset Number of ImagesCultivar
White Balance
BBCH 32
(two-nodes)
22nd April CanonAutomatic1632LG Abs (7)/Mixture (9)
SamsungAutomatic16LG Abs (7)/Mixture (9)
3rd May CanonAutomatic2060LG Abs (8)/Mixture (12)
RealmeAutomatic20LG Abs (8)/Mixture (12)
SamsungManual20LG Abs (8)/Mixture (12)
BBCH 51
(heading)
17th May CanonManual2059LG Abs (9)/Mixture (11)
RealmeManual20LG Abs (9)/Mixture (11)
SamsungManual19LG Abs (9)/Mixture (10)
Disclaimer/Publisher’s Note: The statements, opinions and data contained in all publications are solely those of the individual author(s) and contributor(s) and not of MDPI and/or the editor(s). MDPI and/or the editor(s) disclaim responsibility for any injury to people or property resulting from any ideas, methods, instructions or products referred to in the content.

