Abstract
Traditional PPP-RTK algorithm research has focused on users in a reference station network. However, if a proper PPP-RTK user algorithm can be designed for out-of-network users to achieve accurate and rapid positioning, the effective service area of existing reference station networks can be markedly expanded. To address the problem of extrapolating atmospheric corrections for out-of-network users, this study presents a single-reference-station (SRS) PPP-RTK model to address atmospheric delay corrections, by ensuring that only corrections from the closest reference station are used. Several numerical experiments were designed and conducted to compare the performance of the presented model and a widely used interpolation model. The extrapolation error distribution, mean and the maximum of absolute values of errors, and standard deviation of errors were selected as indicators. The results show that the SRS PPP-RTK model is significantly more accurate than the interpolation model. Thus, for out-of-network users, we suggest that the presented SRS PPP-RTK model should be used, and the residual atmospheric delays are needed to be estimated.
1. Introduction
Traditional precise point positioning (PPP) [1,2] is based on real-valued ambiguity solutions, and it can provide users with centimeter-level positioning solutions after about a half-hour convergence. Numerous studies have been conducted to shorten the convergence time and improve the algorithm and processing strategy. The improved PPP algorithm, which considers multi-frequencies and multi-systems, has been studied extensively [3,4]. Cai et al. [5] proposed an approach to accelerate the single-frequency PPP convergence by combining a quad-constellation global navigation satellite system (GNSS) and global ionospheric map (GIM) data. Xiang et al. [6] developed an ionosphere-constrained PPP model to incorporate ionospheric total electron content (TEC) in the slant (STEC) and vertical (VTEC) directions when leveraging a regional network. Furthermore, one of the most typical solutions is the positioning technology known as the PPP real-time kinematic (PPP-RTK) model [7,8], which is an integer ambiguity resolution (IAR)-enabled PPP. Different from single-baseline RTK that uses information of delays from a single reference station, the PPP-RTK model utilizes corrections generated by several surrounding reference stations. Thus, the corrected user observations of the PPP-RTK model are significantly less influenced by atmospheric delays than single-baseline RTK, especially for the long baseline situation. Moreover, compared with the widely used network RTK model, PPP-RTK also has several advantages, such as a smaller communication bandwidth, more accurate representation when considering different error sources, and better adaptability for broadcasting services.
As an important module of PPP-RTK, the PPP ambiguity resolution (AR) model uses phase hardware delay corrections generated by a regional network of reference stations to correct user ambiguities and then to perform an efficient AR. There are several realization methods for PPP-AR, such as the decoupled clock method by Collins et al. [9], the uncalibrated phase delays (UPD) method by Ge et al. [10], the integer phase clock method by Laurichesse et al. [11], and the Australian method by Odijk et al. [12]. Based on the UPD method, in order to implement PPP-RTK, Li et al. [13] first designed the Regional Augmented PPP (RA-PPP) system. In the RA-PPP model, precise atmospheric corrections are generated from the PPP-fixed solution of the reference stations. Then, the corrections are interpolated at users to correct L1/L2 phase observations or their combinations, which enable users to fix their ambiguities and to acquire precise solutions. More details about the algorithm can be found in Wang et al. [14].
In using these methods, a high quality of service for in-network users can be guaranteed. However, we believe that the service range of a reference station network should not be limited to the network coverage area. Owing to the distance correlation characteristic of atmospheric delays, the high precise positioning service should still be available within a certain distance away from the network. If a proper PPP-RTK user algorithm can be designed for out-of-network users to obtain accurate and rapid positioning, the effective service area of an existing reference station network can be markedly expanded. If the network coverage area is a square whose sides measure 50 km (50 × 50 km), and if the effective service area can be longer than 5 km on each side (60 × 60 km), the service area will increase by 44%. Thus, out-of-network user algorithms are likely to become a new research topic, and the service potential of regional reference station networks is expected to be comprehensively explored. A proper algorithm can shorten the convergence time of an outside user for as far a distance as possible as well as ensure that solution errors change smoothly when the user moves from inside the network to outside. To achieve this goal, there are still several research subjects that must be explored in depth.
The atmospheric correction utilization method at the user end, i.e., the interpolation model for estimating the distance-dependent corrections for a rover station’s location, is a key issue in ensuring the successful implementation of PPP-RTK. Several interpolation methods have been proposed in recent decades, such as the Linear Combination Model [15,16], the Distance-Based Linear Interpolation Method [17], the Linear Interpolation Method [18,19], and the Low-Order Surface Model (LSM) [19]. Dai et al. [20] compared these models based on network RTK technology. Wang et al. [21] profoundly studied and compared the performance of commonly used interpolation methods on atmospheric correction interpolations from the point of view of PPP-RTK users. Their experimental results showed that the LSM model with one height component and three horizontal components demonstrated the best adaptability to different observation situations. Thus, the LSM is selected as one of the major research subjects in the numerical experiments in this work.
Although the interpolation models of network RTK or PPP-RTK have been thoroughly studied, almost all the available literature about interpolation methods has focused on interpolating the atmospheric corrections of regular in-network users. However, there are still a few studies that provide a useful reference. Edwards et al. [22] conducted network RTK experiments with the aid of two commercial service providers, Leica’s “SmartNet” and Trimble’s “VRS Now”. They found that positional accuracy tends to be poorest outside of the bounds of the network and at greater elevation differences from nearby reference stations. Yoon et al. [23] used corrections provided by the South Korea network to implement a PPP-RTK algorithm based on range measurements and validated its accuracy. The results showed that positioning applied with extrapolated correction was more accurate than point positioning with improvements of approximately 20~50%. Wang and Yin [24] found that corrections with a high accuracy can rarely be obtained when the user is located out of a network coverage area, regardless of which interpolation model is used. Based on the network RTK model, Deng and Cheng [25] compared the extrapolation accuracy of the coordinate linear interpolation and distance linear interpolation models. They found that the out-of-network users can reach within 5 cm estimation accuracy of the extrapolation comprehensive error in areas within a 40 km distance of the network. Kim and Langley [26] believed that for a rover outside the network, the network RTK must extrapolate the corrections, meaning that it faces the same challenge as a single baseline RTK. The improved single baseline RTK algorithm they presented is recommended for direct use in this situation. However, the existing literature has not determined which model should be used to extrapolate accurate atmospheric corrections for out-network users in the currently widely used PPP-RTK system framework.
As a key step of correction revisions, we believe that the extrapolation model for out-of-network users is worth exploring. The first question is whether the interpolation model (which generally has been built into user positioning software) should also be used for extrapolating corrections for out-of-network users. The second is if the interpolation models are unsuitable to derive the atmospheric corrections. These problems will be discussed in this study through a comparison of the models.
The remainder of this paper is organized as follows. We first introduce the traditional interpolation model, and applicability of the traditional model for an out-of-network user situation is analyzed. Then, a simpler but more suitable user correction generation method is suggested. Finally, the errors of two extrapolation models are compared using real network observation data, and the superiority of the presented method is confirmed.
2. Atmospheric Delay Correction Utilization Method
The details of the atmospheric correction generation algorithm can be referred to in Wang et al. [14]. At each reference station, the ambiguities are fixed using UPDs first. After the AR are successfully completed, the corresponding UD ambiguities can be conveniently corrected. The UPD-corrected wide-lane (WL) and narrow-lane (NL) UD ambiguities are as follows:
where and are the receiver-dependent and satellite-dependent UPD, respectively; is the UPD-biased float ambiguity; and is the UPD-corrected float ambiguity. After fixing the WL and NL ambiguities, the original ambiguities, i.e., and , can then be trivially recovered.
Then, the atmospheric corrections can be estimated using an inversion calculation. This inversion estimation method will be introduced firstly here. In addition to the receiver clock, the distance, , and the satellite clock, , are clearly known. Influenced by the mapping function, the traditional model of wet delays cannot precisely describe the actual delays; therefore, the tropospheric parameter estimated in PPP is not directly used here. In contrast, the tropospheric delay, which includes the dry and wet components, can be derived from IF observations. We calculate the total slant tropospheric delays as [14]
and the tropospheric residual correction equals this value minus the model part. The ionospheric corrections can then be derived as [13]
where in Equations (2) and (3), and denote the code and phase observations, respectively. is the receiver-to-satellite geometric distance. c is the speed of light. The subscript i and superscript s denote the frequency and satellite, respectively. denotes the slant troposphere correction. and are the receiver and satellite IF clock error. is the ambiguity in cycles with as the wavelength. and are range and phase ionospheric corrections, respectively. is the code hardware delay in meters, while is the phase hardware delay in cycles. The hardware delays can be represented by UPDs directly. Although the hardware delays are corrected with UPDs, there are still some residuals absorbed by the ionospheric corrections. However, the remaining biases are not needed to be estimated at the user, and the proof can be found in [14].
After receiving atmospheric corrections from the server, the user utilizes an appropriate interpolation model to interpolate the corrections according to their approximate positions and then corrects their observations. With reference to Wang et al. [21], the low-order surface model (LSM), with one height component and three horizontal components, has the best adaptability and the highest accuracy for use in different observation situations, and is as follows:
where the model coefficients (, , ⋯ ) can be calculated using the relative positions of the reference stations and the corresponding atmospheric corrections, and ∆I denotes the interpolated ionospheric correction of this position. The subscript and superscript u and s denote the user and satellite, respectively; n denotes the number of reference stations used here. The tropospheric interpolated corrections, , are generated using the same method. Then, the undifferenced observations corrected by the interpolated atmospheric corrections at the rover are obtained as follows:
where and are the code and carrier phase observations, respectively, corrected by the ionosphere, troposphere, DCB, and satellite clock corrections; is the troposphere model delay. Note that the phase and range ionospheric corrections are estimated and used separately, and thus, and have different signs.
The classical LSM model has been widely used by in-network users. The common research focus toward this model is how to improve its adaptability by adjusting the parameters and their order according to different observation environments. However, these conditions differ substantially for out-of-network users. Changing parameters and their order may be almost worthless to this group, as reference stations can only be located in a certain direction. Therefore, the most pressing limitation to the model’s accuracy is the absence of constraint in spatial variation from several directions rather than the form of the model. When the directions of gradient change of delays vary for in-network and out-of-network area, the estimated values derived from the interpolation model and the real values may drastically differ. Figure 1 illustrates the problem clearly, as the atmospheric delay is simplified into two dimensions. Two reference stations named as A and B enclose the network covering area, and a user is located outside the network. The modeled atmospheric delay is represented as the line, and the real delay is the curve. In the area between A and B, the modeled and real delays are close, because the known delays of reference station A and B can restrain the errors. However, for a user outside the coverage area, the variety in delay gradient totally differs from that of the inside area; therefore, a large gap between the modeled and real delays occurs. Thus, it may be inappropriate to use the interpolation model to calculate the extrapolated atmospheric corrections for out-of-network users.
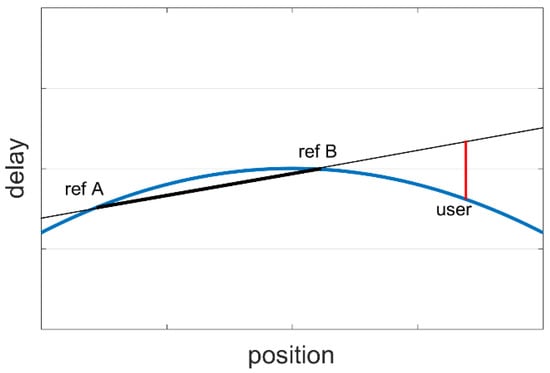
Figure 1.
Diagram of extrapolating atmospheric delay corrections using the interpolation model.
Considering that the delays from reference stations at greater distances can only provide users with a highly limited (or even incorrect) reference value, we suggest that the correction information from distant reference stations should be discarded, meaning that only the corrections of the closest reference station to a user are utilized, which is referred to as a single-reference-station (SRS) PPP-RTK in this study. There are three benefits to this approach. First, only the nearest reference station is valid; therefore, the reliability of the corrections is at the highest guaranteed level. Second, this method is compatible with the traditional PPP-RTK algorithm. The crucial steps, such as the correction generation by the server, as well as parameter estimation and ambiguity resolution by the user, are totally the same as the algorithm utilized when a user is located in a network. Third, as the corrections from distant reference stations are no longer used, there is no need for out-of-network users to be transmitted corresponding information. In other words, every reference station supports the users within the network, while only the stations on the edge of the network must broadcast their corrections to remote users. Thus, the overall data volume and transmission load can be maintained at a low level. The SRS PPP-RTK model is specially designed for the users outside the network. We suggest that user positioning software auto-switch the correction utilization method from a traditional PPP-RTK to the SRS model, when the Delaunay triangulated reference station network cannot cover the user. Moreover, the performance of the SRS model is not influenced by the scales of reference station networks, due to only one reference station being utilized. In contrast, the quality of interpolated corrections is highly relevant with the network dimension for the in-network users [27,28].
Assuming that the ith reference station is the nearest to the user, the user ionospheric corrections can directly read as follows:
and the observation revision process is consistent with Equation (5). Notably, when a user far from the nearest reference station reaches a certain distance, such as 20 km (this distance is adjustable according to ionosphere condition), the atmospheric delay corrections should not be regarded as exact values. Thus, the residual atmospheric delays following a revision must be estimated in the PPP observation equations. One of the estimation and usage methods of uncertainty of the corrections was proposed in Wang et al. [29]. The authors believed that there are two different error sources of interpolated atmospheric corrections: one relates to the error propagation law and the other to the systematic bias of the interpolation model. Thus, the uncertainty is composed of two parts and has to be estimated separately. The “error propagation law” part is calculated at the server according to the observation noise and is subsequently transmitted to users, while the “systematic bias” part is estimated at the user. Referring to the variance calculation results of interpolated correction errors of surrounding stations, the “systematic bias” part of uncertainty can be derived. The experiment results show that the estimated variances can fully capture the actual temporal variation of atmospheric conditions.
In the following sections, a series of numerical experiments are performed to compare the reliability of estimated user corrections using the SRS PPP-RTK and interpolation models, and the advantages of the former will be highlighted. Moreover, the ionospheric delays are mainly studied and compared in this work, rather than the tropospheric delays, because the spatial variation of ionospheric delays is much more dramatic, and the ionospheric errors have more influence on the positioning results.
3. Datasets
We employed observation data from a network with four reference stations and sixteen out-of-network rover stations in Minnesota, USA, as shown in Figure 2. GPS and Galileo dual-system observation data from 12:00 to 24:00 Greenwich Mean Time (6:00 to 18:00 local time) on 30 June 2020 were utilized with a 5 s sampling interval.
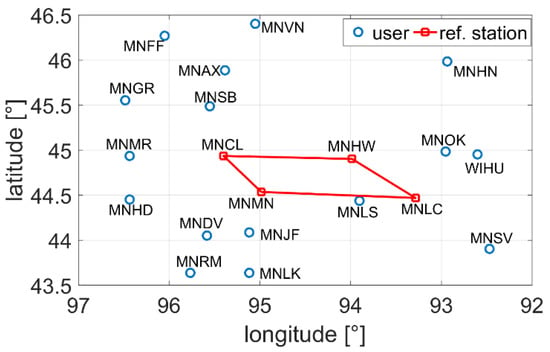
Figure 2.
Reference station network in Minnesota, USA.
To clearly specify the distances and relative position relationship, the information about the distances between each rover station and the center of the network, the nearest reference station of each rover station, and the distances between each rover station and nearest reference are listed in Table 1.

Table 1.
Distance and direction information of rover stations.
The nearest rover station to the center of the network is MNLS, whose distance is only 51.3 km, whereas the farthest station is MNFF, whose distance reaches 214.6 km. The shortest distance between a rover station and its nearest reference station is 49.0 km, and the longest is 165.0 km. The ionospheric delays are mainly studied and compared in this work, rather the tropospheric delays, because the spatial variation of ionospheric delays is much more dramatic, and the ionospheric errors have more influence on the positioning results.
4. Results and Discussion
In this section, the performance of two correction utilization methods is compared using the intuitive extrapolation error distribution, the mean and the maximum of absolute values of errors, and the standard deviation of errors. The corrections generated with the user’s real observations are used as references. The differences of extrapolated and real corrections of each satellite are calculated first, which are raw errors. As raw ionosphere delay corrections have a receiver-related bias, this bias must be eliminated from the raw errors of each satellite to ensure the final errors are clean. The precise bias is not easily estimated; thus, we have utilized the mean of the raw errors as a replacement value.
The MNFF station in the north and the MNRM station in the south are selected as examples to show the errors. The L1 ionospheric correction errors of all satellites of MNFF using two utilization methods are shown in Figure 3, and those of MNRM are shown in Figure 4.
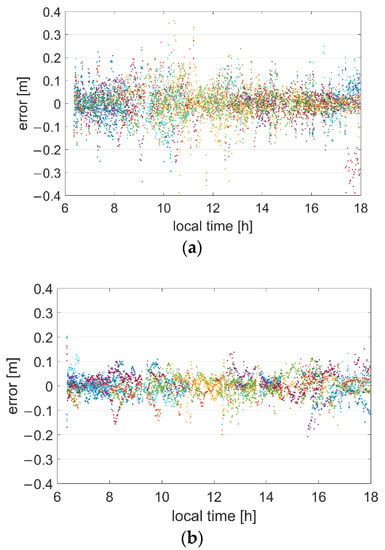
Figure 3.
L1 ionospheric correction errors of all satellites of the MNFF station. Each color denotes one satellite. (a) Extrapolation model, (b) SRS PPP-RTK model.
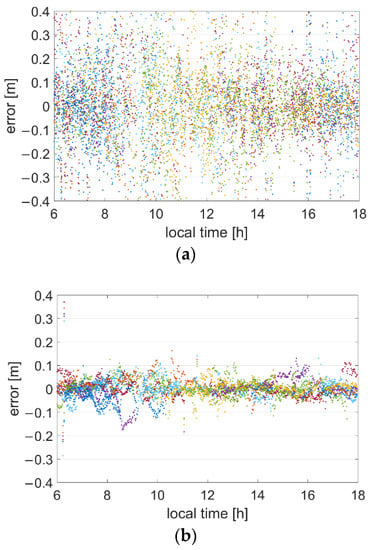
Figure 4.
L1 ionospheric correction errors of all satellites of the MNRM station. Each color denotes one satellite. (a) Extrapolation model. (b) SRS PPP-RTK model.
For the MNFF station, most errors were within 0.2 m when the interpolation model is used, but several error points ranged between 0.1 and 0.2 m. However, when the SRS PPP-RTK model was utilized, most errors remained within 0.1 m, and only a tiny percentage of errors were more than 0.1 m. For the MNRM station, the differences in errors between the models are considerable. The errors of the SRS PPP-RTK model were within 0.1 m, but those of the interpolation model reached 0.4 m and even higher. In terms of providing an intuitive error distribution, the SRS PPP-RTK model is substantially better than the interpolation model. In addition, the errors of MNRM were much larger than the errors of MNFF station, even if MNFF is actually farther. This means that the distribution of errors is strongly related with the direction. It will be further proven with Table 2 in the following experiments.

Table 2.
Mean and maximum of absolute values of the errors of all stations.
If one or more inaccurate corrections are used to correct the observations, the consequences will be a biased solution, a longer convergence time and failures in ambiguity resolution. The statistical results of L1 ionospheric correction errors are exhibited to further detail the performance of the two models. The MNVN station in the north and the MNLK station in the south are selected as examples to detail these results. Figure 5 and Figure 6 represent the mean and the maximum of the absolute values of errors, respectively, of these two stations using the two models. Table 2 lists the statistical mean and the average maximum of the absolute values of errors of all the stations.
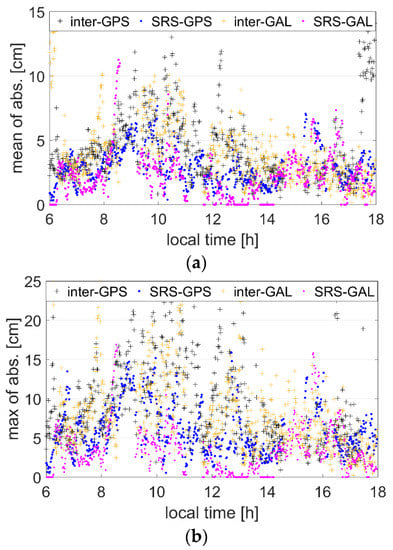
Figure 5.
Statistical results of errors of the MNVN station. (a) Mean of absolute values of errors. (b) Maximum of absolute values of errors.
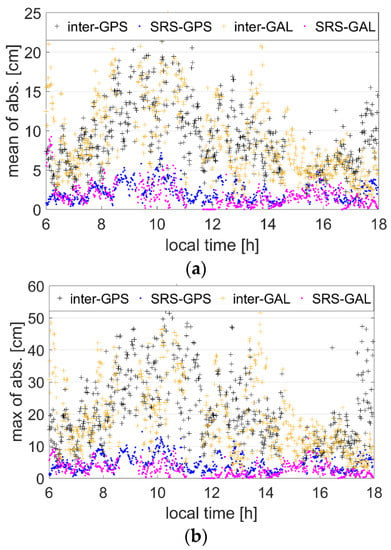
Figure 6.
Statistical results of errors of the MNLK station; plus signs denote the results of the interpolation model, and dots represent the SRS model. (a) Mean of absolute values of errors. (b) Maximum of absolute values of errors.
Because different satellite systems have varying biases, the results of GPS and Galileo are calculated and shown separately. As the figures show, regardless of the GNSS system, reference station, and statistical indicators used, the SRS model performs better than the interpolation model for the users located outside the reference station network. This is especially true for the MNLK station, where most means of the absolute values of errors are less than 5 cm, and most maximums of those values are less than 10 cm when the SRS model is used. However, for the interpolation model, most means ranged between 3 and 20 cm, and the maximums even reached 50 cm. The same conclusion can be drawn after analyzing the information from Table 2. For all stations, all means were less than 3 cm using the SRS model. For the interpolation model, only half of the means were within 3 cm, and several results were higher than 5 cm. The experimental results reflect the rationality of the explanation in Figure 1. Moreover, the correction errors of the interpolation model showed an obvious spatial correlation. The errors of several southeast stations (such as MNRM, NVDV, and so on) were much larger than the errors of stations in other directions, as Figure 2 shows, even if most of their distances to the network center were not longer. This phenomenon confirms that the correction errors of the interpolation model may be extremely large if the gradient change direction of delays varies between in-network and out--of-network areas.
For users far from a network, the residual atmospheric delays following revision must be estimated in the PPP observation equations. Thus, corrections and their standard deviations are utilized in the parameter estimation process as a priori information [29]. The accuracy of atmospheric correction significantly influences the parameter precision and convergence time. Generally, if the ambiguities can be successfully and correctly fix, the smaller the standard deviations are, the faster the convergence speed is. Thus, the real standard deviations of the corrections were also analyzed in this study. Figure 7 and Figure 8 show the standard deviations of L1 ionosphere delay corrections of all the satellites of the MNSV station in the west and the MNMR station in the east using two correction utilization methods. The corrections of every three minutes were used to calculate one standard deviation.
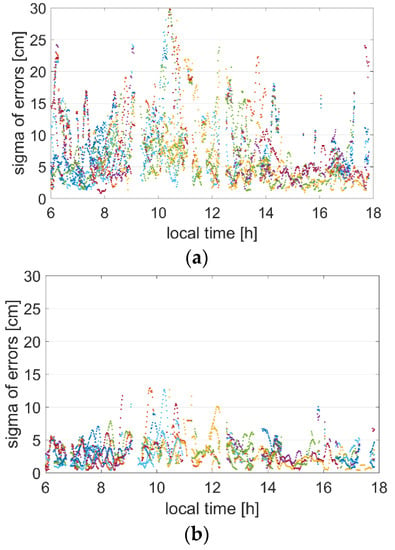
Figure 7.
Standard deviations of L1 ionosphere delay corrections of all satellites of the MNSV station. (a) Interpolation model. (b) SRS PPP-RTK model.
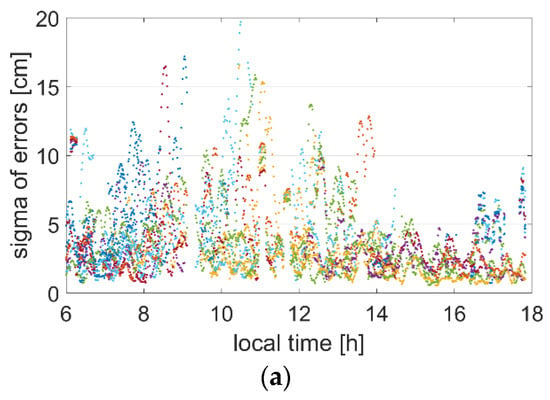
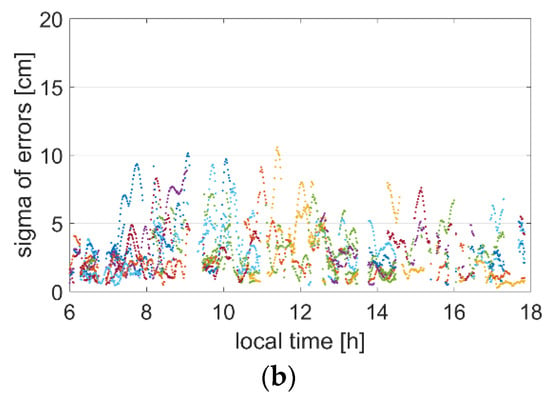
Figure 8.
Standard deviations of L1 ionosphere delay corrections of all satellites of the MNMR station. (a) Interpolation model. (b) SRS PPP-RTK model.
As Figure 7 shows, almost all the standard deviations are within 10 cm, and a considerable proportion of the standard deviations are less than 5 cm using the SRS PPP-RTK model. However, several results range between 10 and 20 cm for the interpolation model. The same conclusions can be obtained from Figure 8. There are few results higher than 10 cm for the SRS PPP-RTK model, unlike for the interpolation model. Moreover, the data gap in the figures is caused by the AR failure of a reference station.
In order to further validate the conclusions, observations of three user stations (MNJF, MNHD and MNSB) were used to conduct the static PPP-RTK positioning experiment. Although the residual delays should be estimated to acquire quick convergence, the residuals were ignored in our experiment to highlight the influence of the correction errors, and to make the differences of the two models clearer. We restarted the PPP-RTK user engine each minute in the experimental period, and two-minute observation data were utilized for each calculation except for the first 20 min for reference station initialization; thus, there were a total of 700 calculations per user. The ambiguities were attempted to be fixed at every epoch, and the ratio threshold was set to 1.7. If the ambiguity-fixed coordinate solution could be acquired within the two minutes, and the horizontal error was less than 10 cm, we called it a correct solution. The proportion of correct solutions was counted. The statistical results are shown in Figure 9.
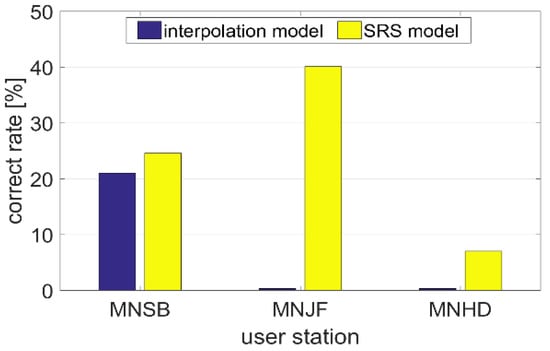
Figure 9.
Proportion of correct solutions of three stations.
As the figure shows, for the MNJF station, the correct rate is 40.1% using the SRS model, while the rate of the interpolation model is only 0.3%, the same as the MNHD station. As for the MNSB station, the statistical results of the SRS and interpolation models are 24.6% and 21.0%, respectively. The results of the farthest station, MNHD, is the worst, whose correct rate is only 7.0% even if the SRS model is used, because the distance between MNHD and the nearest reference station reaches 115 km. The results are entirely consistent with Table 2, in which SRS performed much more superiorly than the interpolation model for the MNJF and MNHD stations and slightly better than the latter for the MNSB station.
5. Conclusions
If a proper PPP-RTK user algorithm can be designed for out-of-network users, and accurate and rapid positioning can be achieved, the effective service area of the existing reference station network can be significantly expanded. The extrapolation model for estimating the atmospheric corrections is one of the key issues to realize the out-of-network PPP-RTK user algorithm. However, the commonly used interpolation model is proven not suitable for the extrapolation. To address the problem, also as a major contribution of this work, we presented a single-reference-station PPP-RTK model to accurately process the atmospheric delay corrections sent from a server. In this model, only the corrections of the closest reference station to a user were used. This correction utilization method maximizes the reliability of corrections and is compatible with the traditional PPP-RTK algorithm, which means that the current widely used PPP-RTK user software does not require a comprehensive update. Moreover, only the stations on the edge of the network must broadcast their corrections to out-of-network users in this model; thus, the service economic cost and bandwidth pressure can be limited. The user should auto-switch from the traditional PPP-RTK to the SRS model once moved outside the network. A series of numerical experiments were performed to compare the reliability of the estimated user correction using the SRS PPP-RTK and traditional interpolation models. The results show that regardless of the intuitive extrapolation error distribution, the mean and the maximum of absolute values of errors or standard deviation of errors are selected as indicators. The SRS PPP-RTK model performs significantly better than the interpolation model. Thus, for out-of-network users, we suggest that the proposed SRS PPP-RTK model should be used to generate corrections, and the residual atmospheric delays after revisions are estimated. Based on the results of this work, the detailed PPP-RTK user algorithm for out-of-network users under various observation conditions is expected to be further researched in the future.
Author Contributions
Methodology, S.W.; software, S.W.; validation, S.W. and R.T.; investigation, J.H.; resources, R.T.; data curation, R.Z.; writing—original draft preparation, S.W. and L.F.; writing—review and editing, S.W. and L.F.; supervision, R.T.; project administration, X.L.; funding acquisition, R.T. All authors have read and agreed to the published version of the manuscript.
Funding
This research was funded by National Science Foundation for Young Scientists of China grant number 42104020, National Natural Science Funds of China grant number 41674034, 41974032 and 42274019.
Data Availability Statement
The data that support the findings of this study are openly available on the American National Geodetic Survey website at https://geodesy.noaa.gov/CORS/data.shtml, (accessed on 8 November 2022).
Conflicts of Interest
The authors declare no conflict of interest.
References
- Malys, S.; Jensen, P.A. Geodetic Point Positioning with GPS Carrier Beat Phase Data from the CASA UNO Experiment. Geophys. Res. Lett. 1990, 17, 651–654. [Google Scholar] [CrossRef]
- Zumberge, J.; Heflin, M.; Jefferson, D.; Watkins, M.; Webb, F. Precise point positioning for the efficient and robust analysis of GPS data from large networks. J. Geophys. Res. 1997, 102, 5005–5017. [Google Scholar] [CrossRef]
- Elsobeiey, M. Precise point positioning using triple-frequency GPS measurements. J. Navig. 2015, 68, 480–492. [Google Scholar] [CrossRef]
- Li, X.; Ge, M.; Dai, X.; Ren, X.; Fritsche, M.; Wickert, J.; Schuh, H. Accuracy and reliability of multi-GNSS real-time precise positioning: GPS, GLONASS, BeiDou, and Galileo. J. Geod. 2015, 89, 607–635. [Google Scholar] [CrossRef]
- Cai, C.; Gong, Y.; Gao, Y.; Kuang, C. An Approach to Speed up Single-Frequency PPP Convergence with Quad-Constellation GNSS and GIM. Sensors 2017, 17, 1302. [Google Scholar] [CrossRef]
- Xiang, Y.; Gao, Y.; Li, Y. Reducing convergence time of precise point positioning with ionospheric constraints and receiver differential code bias modeling. J. Geod. 2020, 94, 1–13. [Google Scholar] [CrossRef]
- Mervart, L.; Lukes, Z.; Rocken, C.; Iwabuchi, T. Precise point positioning with ambiguity resolution in real-time. In Proceedings of the ION GNSS 21st International Technical Meeting of the Satellite Division, Savannah, GA, USA, 16–19 September 2008; Institute of Navigation: Manassas, VA, USA, 2008; pp. 397–405. [Google Scholar]
- Teunissen, P.J.G.; Khodabandeh, A. Review and principles of PPP-RTK methods. J. Geod. 2015, 89, 217–240. [Google Scholar] [CrossRef]
- Collins, P.; Lahaye, F.; Heroux, P.; Bisnath, S. Precise point positioning with ambiguity resolution using the decoupled clock model. In Proceedings of the 21st International Technical Meeting of the Satellite Division of The Institute of Navigation (ION GNSS 2008), Savannah, GA, USA, 16–19 September 2008; Institute of Navigation: Manassas, VA, USA, 2018; pp. 1315–1322. [Google Scholar]
- Ge, M.; Gendt, G.; Rothacher, M.; Shi, C.; Liu, J. Resolution of GPS carrier-phase ambiguities in precise point positioning (PPP) with daily observations. J. Geod. 2008, 82, 389–399. [Google Scholar] [CrossRef]
- Laurichesse, D.; Mercier, F.; Berthias, P.; Broca, P.; Cerri, L. Integer ambiguity resolution on undifferenced GPS phase measurements and its application to PPP and satellite precise orbit determination. Navigation 2009, 56, 135–149. [Google Scholar] [CrossRef]
- Odijk, D.; Zhang, B.; Khodabandeh, A.; Odolinski, R.; Teunissen, P.J. On the estimability of parameters in undifferenced, uncombined GNSS network and PPP-RTK user models by means of S-system theory. J. Geod. 2016, 90, 15–44. [Google Scholar] [CrossRef]
- Li, X.; Zhang, X.; Ge, M. Regional reference network augmented precise point positioning for instantaneous ambiguity resolution. J. Geod. 2011, 85, 151–158. [Google Scholar] [CrossRef]
- Wang, S.; Li, B.; Ge, H.; Zhang, Z. Algorithm and assessment of ambiguity-Fixed PPP with BeiDou observations and regional network augmentation. J. Surv. Eng. 2020, 146, 04020009. [Google Scholar] [CrossRef]
- Han, S.; Rizos, C. GPS Network design and error mitigation for real-time continuous array monitoring systems. In Proceedings of the 9th International Technical Meeting of the Satellite Division of The Institute of Navigation (ION GPS 1996), Kansas City, MO, USA, 17–20 September 1996; Institute of Navigation: Manassas, VA, USA, 1996; pp. 1827–1836. [Google Scholar]
- Han, S.; Rizos, C. Instantaneous ambiguity resolution for medium-range GPS kinematic positioning using multiple reference stations. In Advances in Positioning and Reference Frames; International Association of Geodesy Symposia; Springer: Berlin/Heidelberg, Germany, 1998; Volume 118, pp. 283–288. ISBN 3-540-64604-3. [Google Scholar]
- Gao, Y.; Li, Z.; McLellan, J.F. Carrier phase based regional area differential GPS for decimeter-level positioning and navigation. In Proceedings of the 10th International Technical Meeting of the Satellite Division of The Institute of Navigation (ION GPS 1997), Kansas City, MO, USA, 16–19 September 1997; Institute of Navigation: Manassas, VA, USA, 1997; pp. 1305–1313. [Google Scholar]
- Wanninger, L. Improved ambiguity resolution by regional differential modelling of the ionosphere. In Proceedings of the 8th International Technical Meeting of the Satellite Division of The Institute of Navigation (ION GPS 1995), Palm Springs, CA, USA, 12–15 September 1995; Institute of Navigation: Manassas, VA, USA, 1995; pp. 55–62. [Google Scholar]
- Wübbena, G.; Bagge, A.; Seeber, G.; Böder, V.; Hankemeier, P. Reducing distance dependent errors for real-time precise DGPS applications by establishing reference station networks. In Proceedings of the ION ITM 1996, Kansas City, MO, USA, 17–20 September 1996; pp. 1845–1852. [Google Scholar]
- Dai, L.; Han, S.; Wang, J.; Rizos, C. Comparison of interpolation algorithms in network-based GPS techniques. Navigation 2003, 50, 277–293. [Google Scholar] [CrossRef]
- Wang, S.; Li, B.; Gao, Y.; Gao, Y.; Guo, H. A comprehensive assessment of interpolation methods for regional augmented PPP using reference networks with different scales and terrains. Measurement 2020, 150, 107067. [Google Scholar] [CrossRef]
- Edwards, S.; Clarke, P.; Penn, N.; Goebell, S. An examination of network RTK GPS services in Great Britain. Surv. Rev. 2013, 42, 107–121. [Google Scholar] [CrossRef]
- Yoon, W.; Park, K.; Kim, H.; Seo, S.; Park, J. Accuracy analysis of code-based PPP-RTK positioning utilizing k-ssr correction messages outside the reference network. Navig. Timing 2017, 6, 79–86. [Google Scholar]
- Wang, S.; Yin, M. Analysis of Creating Correction Algorithms for GPS Network RTK System. Appl. Mech. Mater. 2014, 501, 2172–2181. [Google Scholar] [CrossRef]
- Deng, J.; Cheng, X. Analysis and research of extrapolation accuracy with interpolation model based on network RTK. Appl. Mech. Mater. 2013, 411, 1732–1737. [Google Scholar] [CrossRef]
- Kim, D.; Langley, R. Improving Long-Range RTK; GPS World: Cleveland, OH, USA, 2008; pp. 50–56. [Google Scholar]
- Psychas, D.; Verhagen, S. Real-Time PPP-RTK Performance Analysis Using Ionospheric Corrections from Multi-Scale Network Configurations. Sensors 2020, 20, 3012. [Google Scholar] [CrossRef]
- Yin, X.; Chai, H.; El-Mowafy, A.; Zhang, Y.; Zhang, Y.; Du, Z. Modeling and assessment of atmospheric delay for GPS/Galileo/BDS PPP-RTK in regional-scale. Measurement 2022, 194, 111043. [Google Scholar] [CrossRef]
- Wang, S.; Li, B.; Tu, R.; Lu, X.; Zhang, Z. Uncertainty estimation of atmospheric corrections in large-scale reference networks for PPP-RTK. Measurement 2022, 190, 110744. [Google Scholar] [CrossRef]
Disclaimer/Publisher’s Note: The statements, opinions and data contained in all publications are solely those of the individual author(s) and contributor(s) and not of MDPI and/or the editor(s). MDPI and/or the editor(s) disclaim responsibility for any injury to people or property resulting from any ideas, methods, instructions or products referred to in the content. |
© 2022 by the authors. Licensee MDPI, Basel, Switzerland. This article is an open access article distributed under the terms and conditions of the Creative Commons Attribution (CC BY) license (https://creativecommons.org/licenses/by/4.0/).