Article

Dynamic of Fluorescence Emissions at O2A and O2B Telluric Absorption Bands in Forested Areas with Seasonal APAR and GPP Variations

1
Global Change Research Institute of the Czech Academy of Sciences, Bělidla 986/4a, 603 00 Brno, Czech Republic
2
School of GeoSciences, University of Edinburgh, Crew Bldg, Kings Bldgs, Alexander Crum Brown Rd, Edinburgh EH9 3FF, UK
*
Author to whom correspondence should be addressed.
Remote Sens. 2023, 15(1), 67; https://doi.org/10.3390/rs15010067
Submission received: 12 November 2022 / Revised: 18 December 2022 / Accepted: 20 December 2022 / Published: 23 December 2022

Abstract

:
We measured dynamics of solar-induced chlorophyll fluorescence at telluric oxygen absorption bands O2A and O2B in evergreen spruce and deciduous beech forests. Seasonal variations in fluorescence emissions were compared with NDVI. Daily changes in fluorescence emissions were compared with canopy shadow fraction (αS) dynamics, which showed impact of branch and leaf positions on detected fluorescence signals based on comparison with canopy height model. Absorbed photosynthetically active radiation (APAR) was recognized as a large determinant of fluorescence changes within the O2A band (SIFA), with R2 > 0.68. Fluorescence within the O2B band was more directly linked to NDVI. Although, the seasonal dynamics of fluorescence within the O2B band (SIFB) were similar to SIFA in the spruce forest. In the beech forest, SIFB showed different seasonal dynamics as compared with SIFA. SIFA in the spruce forest showed a relationship to gross primary productivity (GPP), with R2 = 0.48, and a relationship of R2 = 0.37 was estimated for the SIFA-GPP connection in the beech forest. SIFB was better linked to seasonal GPP in the beech forest, but with a negative slope in the relationship with R2 = 0.61. We have shown that measurements of passive fluorescence signals at telluric oxygen absorption bands can contribute to understanding to photosynthesis processes in forest canopies.

1. Introduction

Optical remote sensing may serve as a tool for monitoring ecosystem dynamics and photosynthesis, both spatially and temporally. Photosynthesis by trees is typically a seasonal response to a complex set of variables, including vegetation type, photoperiod, solar angle, and weather. It is, therefore, important to identify and validate remote sensing approaches to facilitate phenology predictions across vegetation types and to identify the environmental and physiological factors that influence the optical signals. Ultimately, we expect this approach will lead to a deeper understanding of canopy photosynthesis in relation to climatic change and management [1].
Chlorophyll fluorescence is considered as an indicator of vegetation functionality. However, there is still a lack of knowledge of how the observed changes in fluorescence are influenced by canopy structural properties and the concentration of chlorophyll and other pigments. Structural properties may refer to the branches’ layout on the trees and foliar distribution on the branches, which can result in shading of portions of foliar area during the day at certain sun azimuth and zenith configurations [2]. As a result, the effect of canopy self-shading can impact upon remote sensing parameters [3,4]. Foliar chlorophyll content is closely related to canopy NDVI index, which refers also to the quantity of biomass in the vegetative period [5].
Fluorescence is a radiative signal arising deep within the photosynthetic system. It offers information about photosynthesis due to its link to non-photochemical quenching [6,7]. Large-scale detections of fluorescence signals from sensors deployed in the field are now possible with advances in measuring techniques. The network of spectral measurements at flux towers may provide opportunities to study passive fluorescent signals as a measure of plant stress and photosynthesis [8]. Two characteristic peaks of fluorescent emission are present in the red and far-red parts of the spectrum at 685 and 740 nm. Two photosystems (PSI and PSII) in plant leaves contribute to both peaks. The peak at 685 nm is closely connected to emission from PSII and has received greater attention in the earlier photosynthesis studies that have relied on artificial light excitation. This peak, however, may vary during the season along with variations in chlorophyll content as a consequence of the overlap between the spectra of fluorescent emission and chlorophyll absorption [9,10]. The far-red peak at 740 nm consists of fluorescent emissions from both PSII and PSI and generally increases with chlorophyll content [11].
The most frequently used methods to estimate fluorescence from passive unattended measurements of the radiance spectra rely on Fraunhofer line depth discrimination of the oxygen absorption bands near 687 nm (O2B) and 760 nm (O2A) by using infilling methods for the spectra [12,13,14]. The use of SIF has increased in the last decade. Maps of the global distribution of fluorescence have been developed using data from the satellites GOSAT [15], GOME-2 [16], and OCO-2 [17]. These studies evaluated mostly fluorescence near the oxygen absorption band at 760 nm. The efforts have also led to attempts to link SIF emissions estimated from satellite sensors to carbon fluxes at the canopy level (e.g., [18]). However, insufficient understanding of the dynamics of fluorescence precludes scaling-up to longer-term observations.
It has been documented that the relation of fluorescence emission in the O2A band to photosynthesis is more straightforward and dependent on APAR [19] and is, therefore, becoming widely used. However, some recent studies have suggested that the fluorescence of PSII with the peak value set directly to the O2B waveband is less affected by absorbed photosynthetically active radiation (APAR) and, therefore, provides more information on photosynthesis [20,21]. Several studies have provided a comparative analyses of the relationships between fluorescence emissions at O2A and O2B bands, revealing also the relationships of the emissions to canopy photosynthesis [22,23,24]. Complexity in diurnal SIF dynamics in natural stands arises from nonhomogeneous canopies, which can create a highly dynamic light environment that influences photosynthesis and NPQ within the canopy [25]. At certain solar angles, shaded leaves may be abruptly exposed to higher light intensities, e.g., sunflecks, causing more photosystem II (PSII) reaction centers to be occupied while NPQ concomitantly increases to offset the absorption of excess light energy. As a result, canopy structure, plant physiology, and solar geometry interactively impact the emission of SIF, and such interaction depends on canopy architectures. Solar zenith and azimuth angles change the distribution of light within the canopy and thereby affect the detected fluorescence signals. The ratio of fluorescence peaks is found to be sensitive to nitrogen content, water status, and temperature stress in plants [26] and, hence, have attracted attention in similar comparative studies [22,23]. The possibility of employing the ratio of fluorescence estimated at the oxygen bands (i.e., 687 nm and 760 nm) for photosynthesis detection was studied by Wieneke et al. [27]; the ratio is more frequently used to make comparisons with foliar characteristics between days.
The current limited knowledge of how optical features correlate with photosynthesis precludes the generalization of any measured data to large areas and across long time periods. Integrated data, mainly those that map seasonal variations of fluorescence at fine temporal resolution, are scarce. The growing network of flux towers is capable of hosting tower-mounted spectrometers and, thus, allows intensive and extensive measuring fluorescence seasonality. The results of such measurements can be used to further test the potentials and limitations of spectral measurements for monitoring ecosystem functioning. In this study, we make comparisons between on-site estimated fluorescence at O2A and O2B oxygen bands; we show how they are influenced by canopy structure, NDVI, and APAR, and we demonstrate how these fluorescence emissions are related to canopy Gross Primary Productivity. This work uses a dataset already presented in Kováč et al. [28] but further extends analysis with a consideration of fluorescence emissions dynamics at the O2B band. We show also diurnal trends in fluorescence emissions. The data originate from automated spectroradiometers that were placed above evergreen spruce and deciduous beech forests to study the dynamic changes in fluorescence along with the changes in NDVI and GPP. We aimed to explore how the changes in optical parameters were correlated with changes in photosynthetic CO2 uptake and environmental factors.

2. Materials and Methods

2.1. Site Descriptions

Data for this study were collected at ecosystem stations located in mountainous ecosystems, Bílý Kříž and Štítná, in the Czech Republic. The stations host eddy covariance systems that measure ecosystem exchange of CO2. Equipment deployed at the stations is part of the CzeCOS (http://www.czecos.cz/, accessed on 19 December 2022, Figure 1) and ICOS (http://icos-cp.eu, accessed on 19 December 2022) infrastructures. The Bílý Kříž site is located in the northeastern Czech Republic (49°30′07.474″ N, 18°32′12.777″ E) at 875 m a.s.l. The ecosystem consists of a coniferous evergreen Norway spruce (Picea abies L. Karst.) forest. The forest is on a 13° slope oriented south–southwest. The data presented here have been collected at a 37-year-old stand 17 m tall in the year 2018. The Štítná site is located in the southeastern Czech Republic (49°02′09.510″ N, 17°58′11.640″ E) at 540 m a.s.l. The Štítná site has European beech (Fagus sylvatica L.) trees which were 116 years old, with an average height 31 m in 2017. Site is oriented west–southwest, and trees are spread on a hill with a 10° slope.

2.2. Measurements of NDVI and Fluorescence

Optical parameters are estimated from spectral measurements using autonomous spectrometers that are mounted on top of the towers above the forest canopies. Measurements at each station employ a pair of JAZ spectrometers (Ocean Optics, Dunedin, FL, USA) that operate simultaneously to collect irradiance and reflected radiance data [29]. Operational setup, calibration procedure, and setup for measurements at the stations are described in Kováč et al. [28]. Instruments have a resolution (FWHM) of 1 nm, and they scan at steps of approximately 0.3 nm in the visible and near-infrared area. Spectrometers are housed in two insulated boxes (Figure 1) that ensure thermal stability during the measurements. Key features of pre-season preparations of the measurements are calibration of the up-welling and down-welling radiation flux using a Spectralon panel and radiometric calibration of each measuring unit using a HL-2000 calibration lamp (Ocean Optics, USA). Following these procedures, we are able to capture spectra accurately with radiometric units. These steps were the key prerequisites for estimations of fluorescence from measured data. Measurements of the spectra in the field started at 07:00 and ended at 19:00 every day at 5 min intervals. Protocols, calibrations, and measurements were identical for both sites. The fiber optic components of the spectrometers were mounted on the tops of the meteorological towers at a distance approximately 4 m to the south side to avoid artificial shading of the measured area (Figure 1). Field of view of the measurements is 21° for field-stop sensor, and optical fiber measuring solar irradiance spectrum is equipped with a CC-3 cosine corrector (Ocean Optics). Reflectance at Bílý Kříž (spruce forest) was measured at a height of 20 m above the canopy, which corresponded to a sampling area of approximately 80 m2 and covered a broad area around seven spruce trees. At the Štítná site, the setup resulted in data acquisition from one tree crown. The optical parameters were calculated as half-hourly averages.
NDVI is estimated from reflectance at 720 and 780 nm, following work by Patel et al. [30] as:
NDVI = R 780 R 720 R 780 + R 720
Estimations of SIF in the O2A and O2B atmospheric absorption bands were based on measuring the response in a single waveband with the maximum absorption by oxygen (Figure 2). The 3-FLD approach was applied to the spectra to estimate fluorescence. The equation was applied to two telluric oxygen absorption bands, O2B (687 nm) and O2A (760.4 nm). Estimation of fluorescence from radiance spectra used the following calculations:
SIF = L ( λ in ) E ( λ in ) · ( wleft · L ( λ left ) + wright · L ( λ right ) ) wleft · E ( λ left ) + wright · E ( λ right ) 1 E ( λ in ) wleft · E ( λ left ) + wright · E ( λ right )
where
wleft = λ in λ left λ right λ left
and
wright = λ right λ in λ right λ left
L(λleft) and L(λright) in these equations represent the radiances in the left and right shoulders of the oxygen absorption band (Figure 2), respectively, and E(λleft) and E(λright) similarly represent the solar irradiances. wleft and wright are the weights of the two bands outside the oxygen absorption band. Wavelengths of 756.2 nm (λleft), 760.4 nm (λin), and 775.3 nm (λright) were selected to estimate SIF in the O2A band. Fluorescence in the O2B band was estimated from signals measured at 681 nm, 687.4 nm, and 710.1 nm. Although the response curve of light reflected from the forest was relatively flat around 680 nm (Figure 2), we detected small variations at the central waveband 687.4, which we were able to discriminate as fluorescence using the Equations (2)–(4).
Quantum yield of fluorescence describes the fraction of photons that are re-emitted relative to the photons absorbed by the vegetation cover [27]. Yield of fluorescence emission in O2A and O2B band are calculated as a ratio between absolute emission and APAR as:
FYSIFA = SIFA APAR
FYSIFB = SIFB APAR
APAR for the forest canopies was calculated as the difference between incoming PAR and PAR reflected from the forests. Incoming and reflected photosynthetically active radiation (PAR) within the spectral range of 400–700 nm was measured using an LI-190/R quantum sensor (LI-COR Biosciences, Lincoln, NE, USA). APAR was converted from µmols to Watts and calculated per unit wavelength between 400 and 700 nm, and the resulting yield was expressed per amount of PAR absorbed by 1 nm waveband in PAR region (APAR(nm−1)).

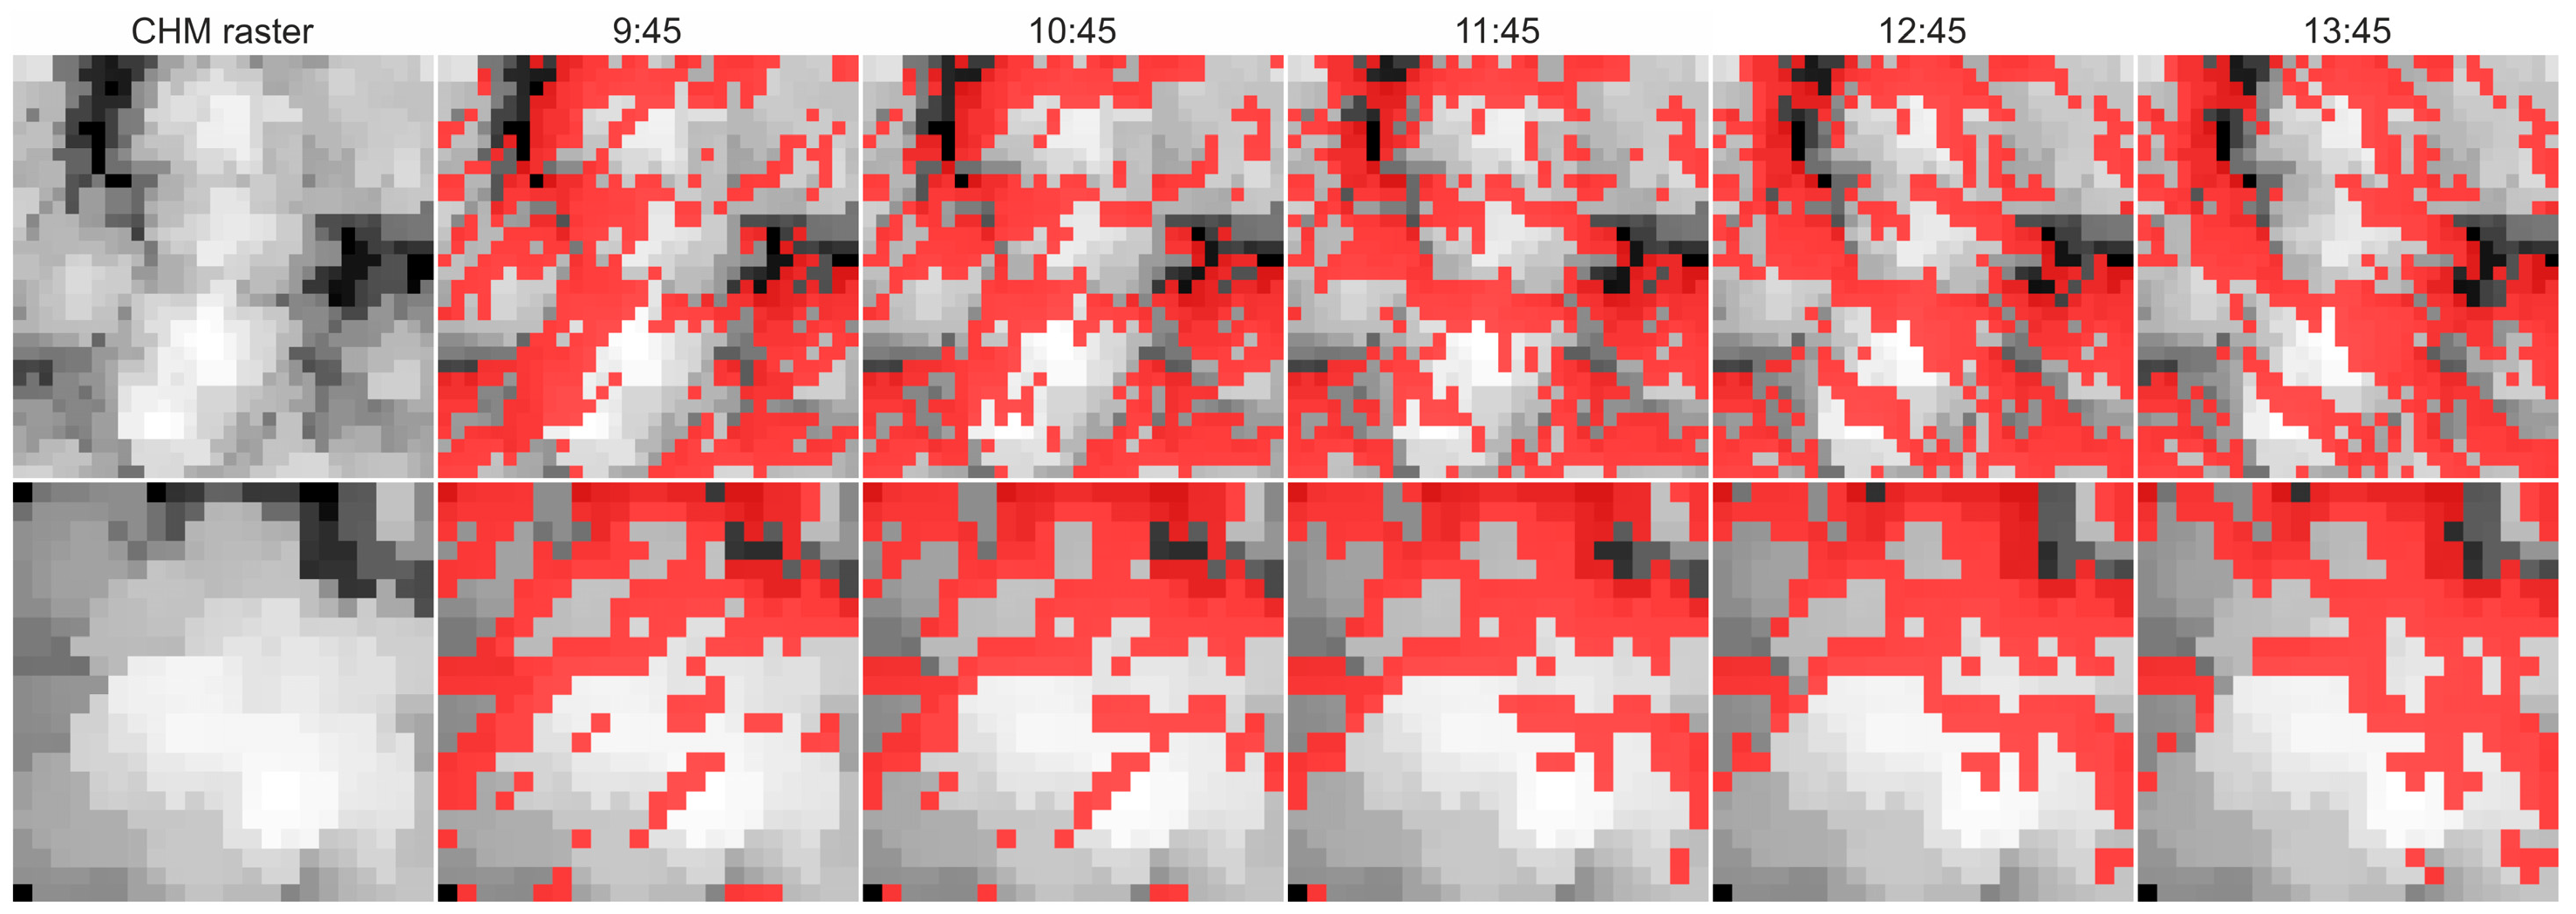
2.3. Estimation of Canopy Shadow Fraction

Estimation of canopy shadow fraction used data acquired with airborne laser scanner. Data were collected using the Riegl LMS Q-780 scanner (RIEGL Laser Measurement Systems, Horn, Austria). Acquisition of canopy shadow fraction was achieved using the LAStools software (rapidlasso, Gilching, Germany). The Lasgrid function of this software extracted top points in the canopy height model raster (CHM). The spatial resolution in the raster was 0.25 m. HILLSHADE function from the Matplotlib library [31] was then applied to the data to estimate canopy shadow fraction at different sun zenith and azimuth configurations extracted from the Pysolar library (pysolar.org) for geographical coordinates and altitudes of the stations. The canopy shadow fraction was computed in 30 min intervals as the proportion of shaded pixels in the raster based on binary classification. Pixels with recorded shading proportions higher than 0.5 were considered as shaded, and their occurrence within the CHM raster was recorded as shadowed pixels, which contributed to recorded canopy shadow fraction (Figure 3 and Figure 4). Shadow fraction is quite an important variable in remote sensing because it affects escape factors of incoming photons (fesc), also thereby influencing remote detection of fluorescence, as shown, e.g., by Yang and van der Tol [32].
Shadow fraction in the spruce forest was estimated for the area covered by 7 trees that were actually measured with the spectrometer. The trees are spread over a land area of 8 × 8 m (32 × 32 pixels). In the beech forest, the evaluated area included the crown of just one tree actually measured using a spectrometer. The evaluated area was 5.5 × 5.5 m (23 × 23 pixels in total). The αS of the small plot was compared with dynamics at the 50 × 50 m wide plot that served as the control area for the measurements. These supportive data represent dynamics in shadows in the broad forest.

2.4. Eddy Covariance Data

Gross primary productivity of the forests was estimated using the eddy covariance technique. Instrumentation comprises HS-50 ultrasonic anemometers (Gill Instruments, Lymington, UK) and LI-7200 infrared gas analyzers (LI-COR Biosciences, Lincoln, NE, USA) to collect data. The instruments were installed approximately 8 m above the forest at heights of 25 m (Bílý Kříž) and 44 m (Štítná) above ground level. Measurements and data processing of the flux data follow standards established by ICOS. Processing of the flux data were performed using EddyPro version 6.2.x (LI-COR Biosciences, Lincoln, NE, USA). Net ecosystem exchange was partitioned into gross primary productivity and ecosystem respiration according to Lasslop et al. [33] with the use of REddyproc [34]. Fluxes were aggregated at half-hour intervals using block averaging.

2.5. Data Analysis

Temporal variations in the data were analyzed after selection of conditions of APAR > 300 μmol m−2 s−1 and sun elevations > 25°. These filters were applied to show seasonal dynamics in NDVI, SIFA, SIFB, and FYSIFA with FYSIFB. Then, days with clear skies, identified from the parabolic daily trend in incoming PAR, were picked up for further analysis of diurnal data trends. These data were divided into four subsets by month and averaged at half-hour intervals to show the dynamics of the means for measured variables during four characteristic periods of the year and to show variations in the variables with shadow fraction (αS). Intervals between dates in each data group do not exceed 30 days. Thus, we isolated groups of data collected under similar SZA simultaneously at 30 min steps in the day. Mean values were calculated for 3- to 5-day blocks, depending on the availability of cloudless days in the data set.
For the primary regression analysis, we selected data from days with clear sky conditions in time intervals between 10:00 am and 2:00 pm (April–October) and extracted the midday averages across 2 h intervals for data analysis. These data are characteristic, most with APAR > 800 μmol m−2 s−1. For better comparison, relationships between variables were compared also between half-hourly averaged data on selected days between 10 and 14 h. The linear regressions were evaluated at p < 0.05, p < 0.01, and p < 0.001.

3. Results

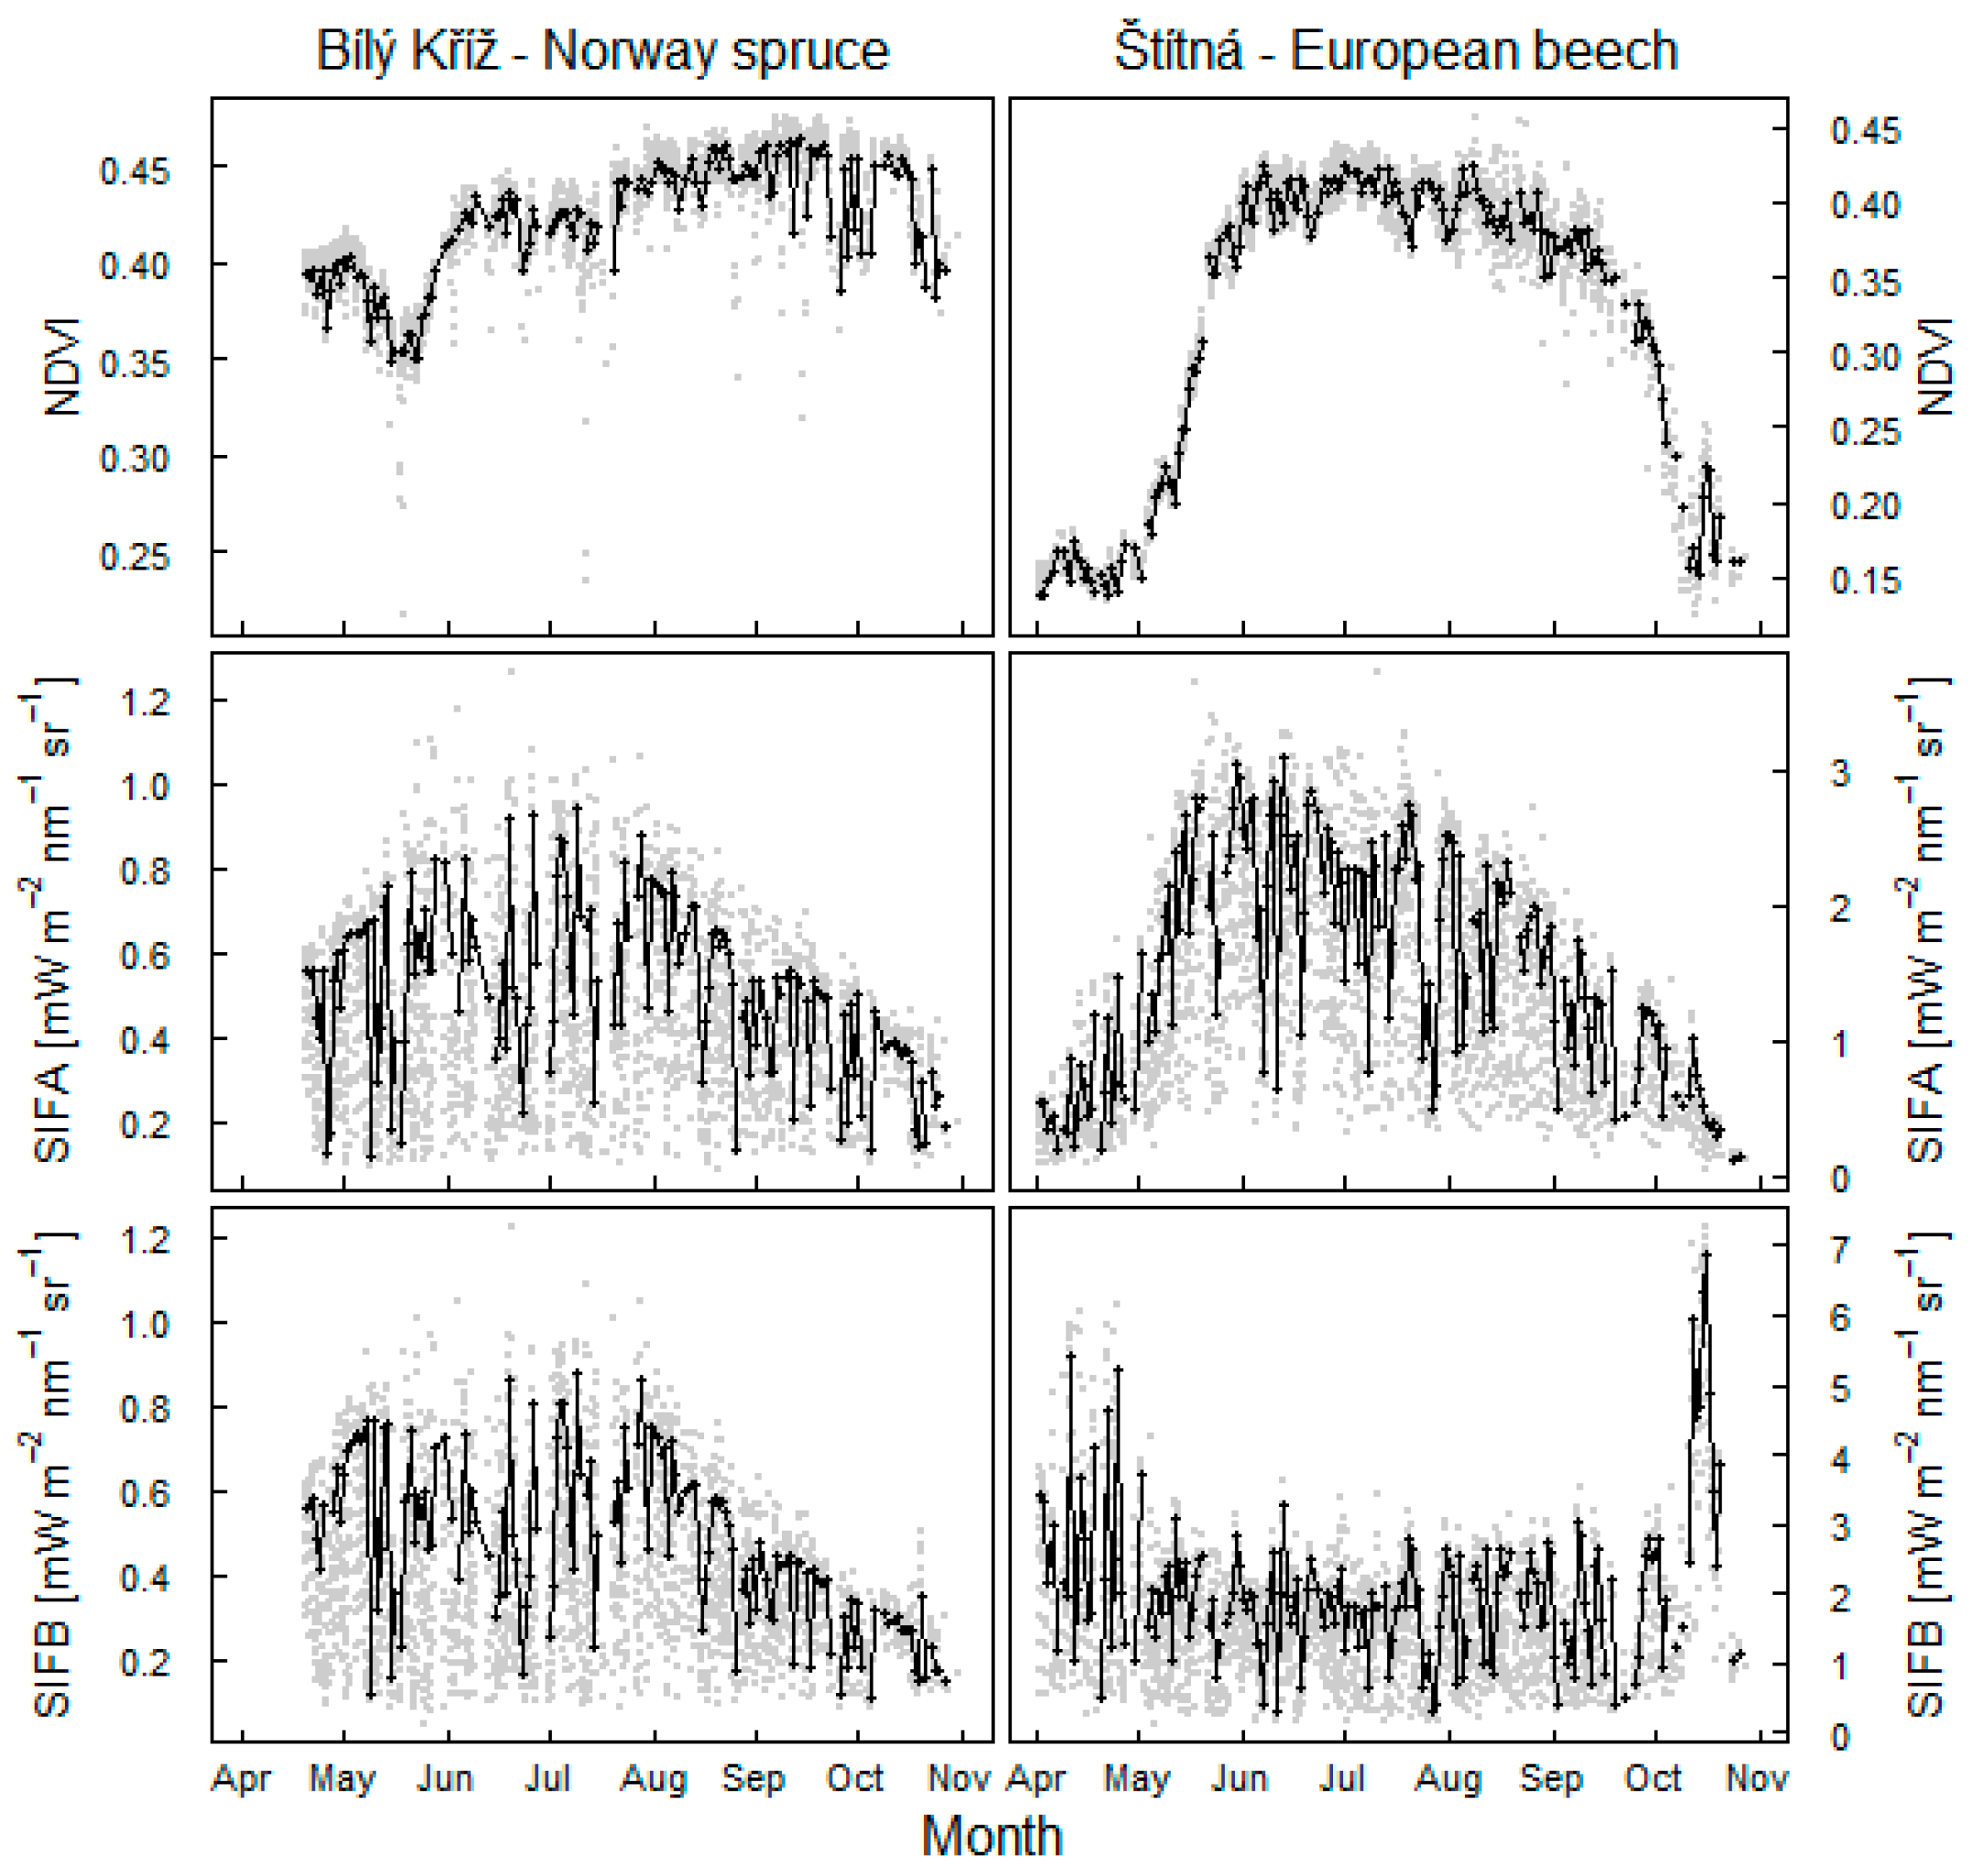
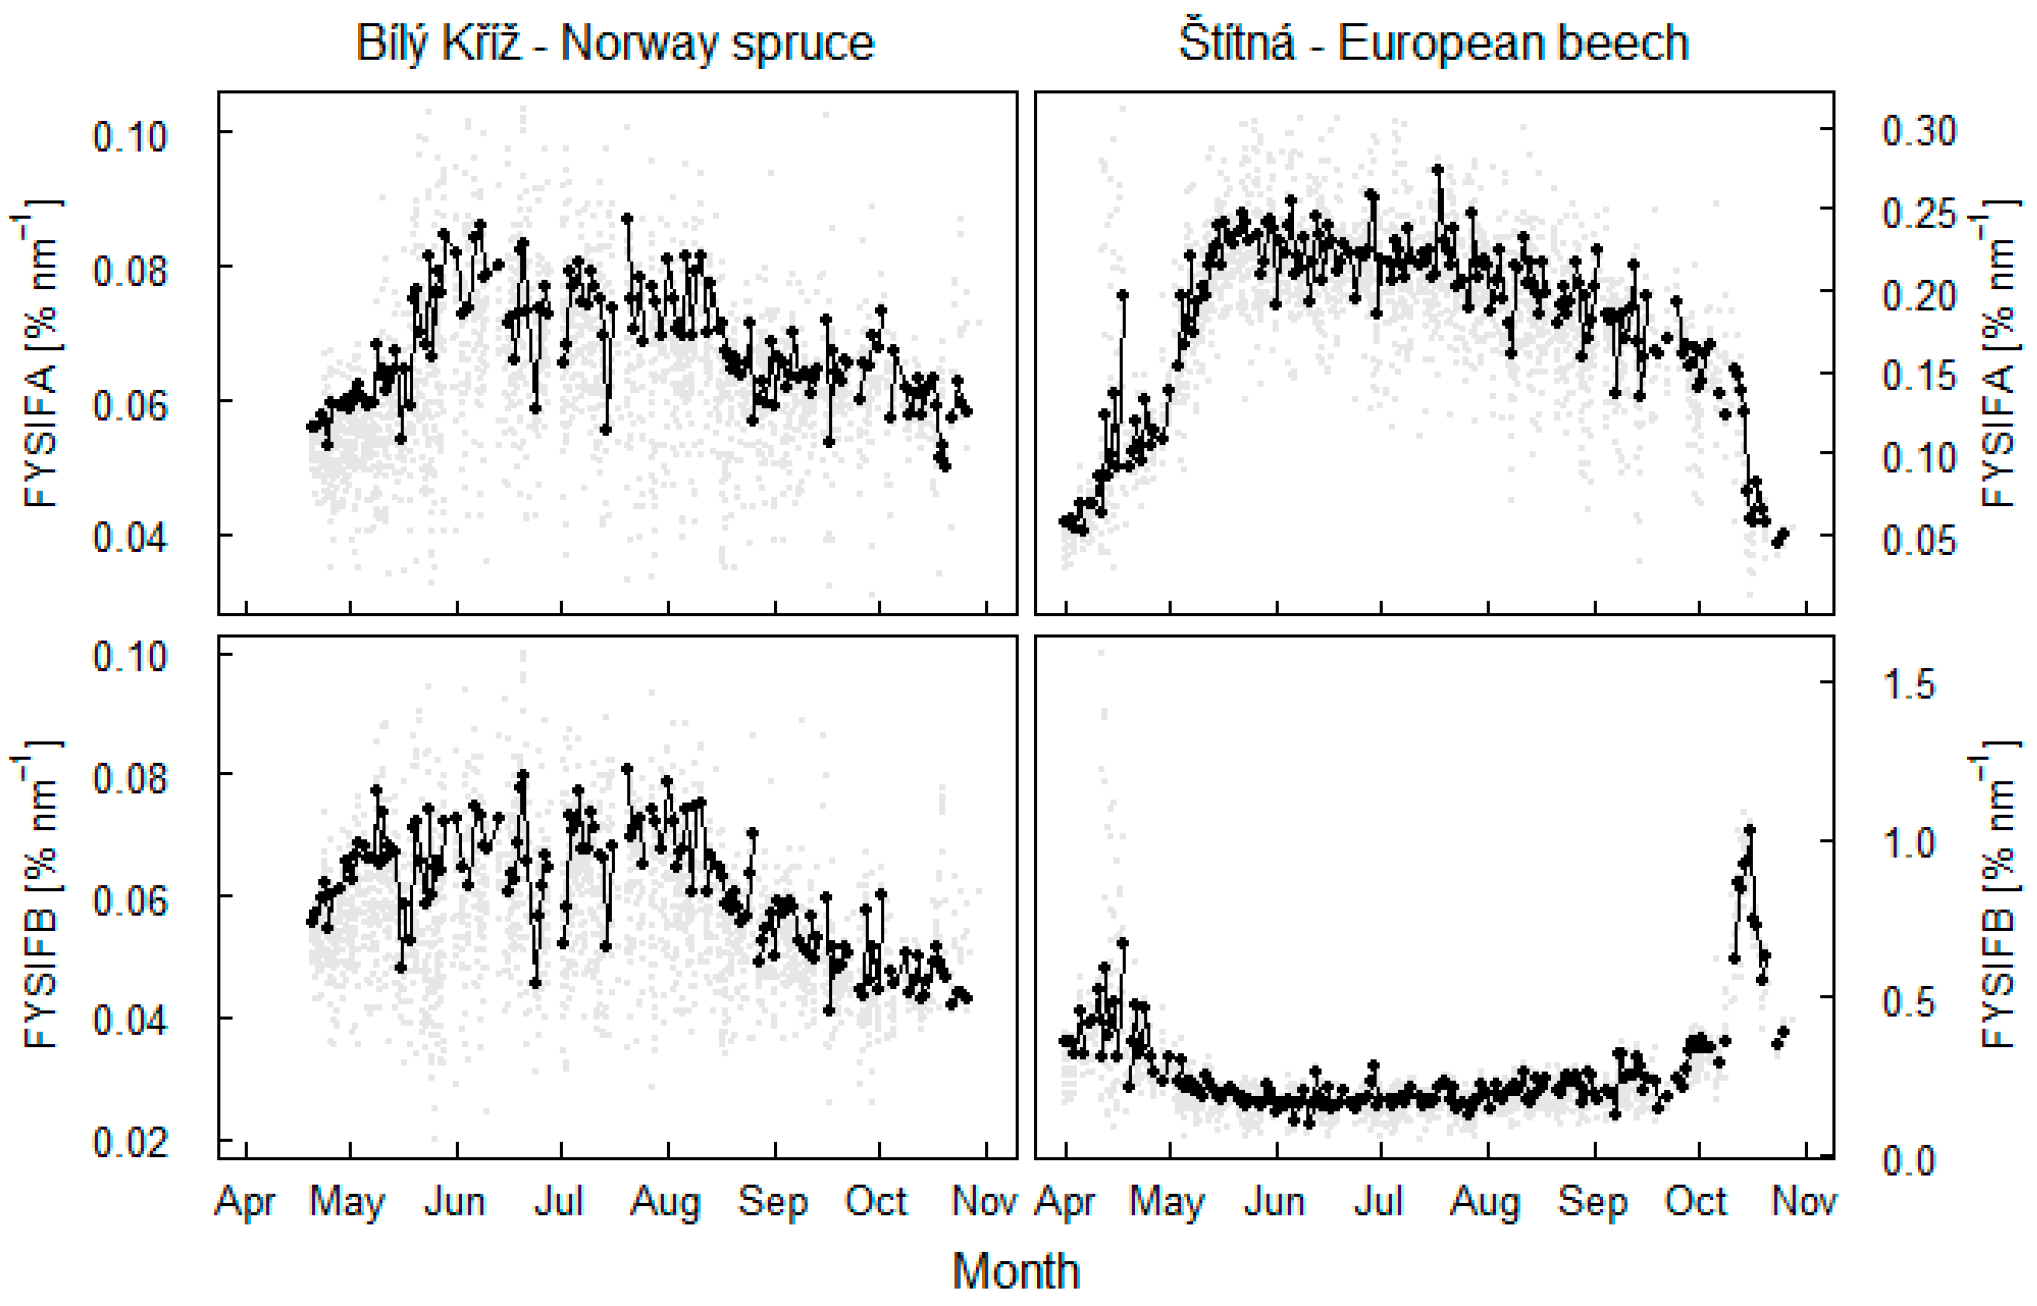
3.1. Seasonal Pattern of Fluorescence Changes

The onset of the vegetative period in spring was evident in both forests with an increase in NDVI (Figure 5). However, it was the fluorescence in O2A band that best indicated both the onset of the season in spring and the ending of the season in late autumn at both sites. In the spruce forest with seasonally high NDVI, the dynamics of SIFB emission were similar to SIFA (Figure 5), thus suggesting a similar connection to canopy photosynthesis. However, the observed changes of SIFB within the season were less pronounced than for SIFA. SIFB in the beech forest showed lower dynamics from June to September, but stronger emissions in the O2B band were recorded at the beginning and end of the growing season, with changes associated with establishment and senescence of leaves.
More information was revealed by the yield of fluorescence emission (Figure 6). Yield of SIFA showed rapid increase in spring. This increase in SIFA characterized the ‘re-awakening’ of photosynthesis in the evergreen spruce trees and the establishing of leaves and photosynthesis in the deciduous beech trees. Similarly, FYSIFA indicated the declining of photosynthesis functions in later periods of the year. FYSIFB in the spruce forest was not dynamic at the start of season but decreased more than FYSIFA in late July. The decrease was associated with rain event (155 mm in three days between July 17 and 19) and increasing of canopy NDVI (Figure 5). Thus, dynamics in FYSIFB strongly supported the assumption that fluorescence emission in the O2B band is strongly associated with changes in NDVI. In the beech forest, a summer minimum in FYSIFB occurred at the start of the summer in fully developed leaves. This value was linked to maximum NDVI reached in spring and was associated with maximum SIFA emission, as displayed in Figure 5.

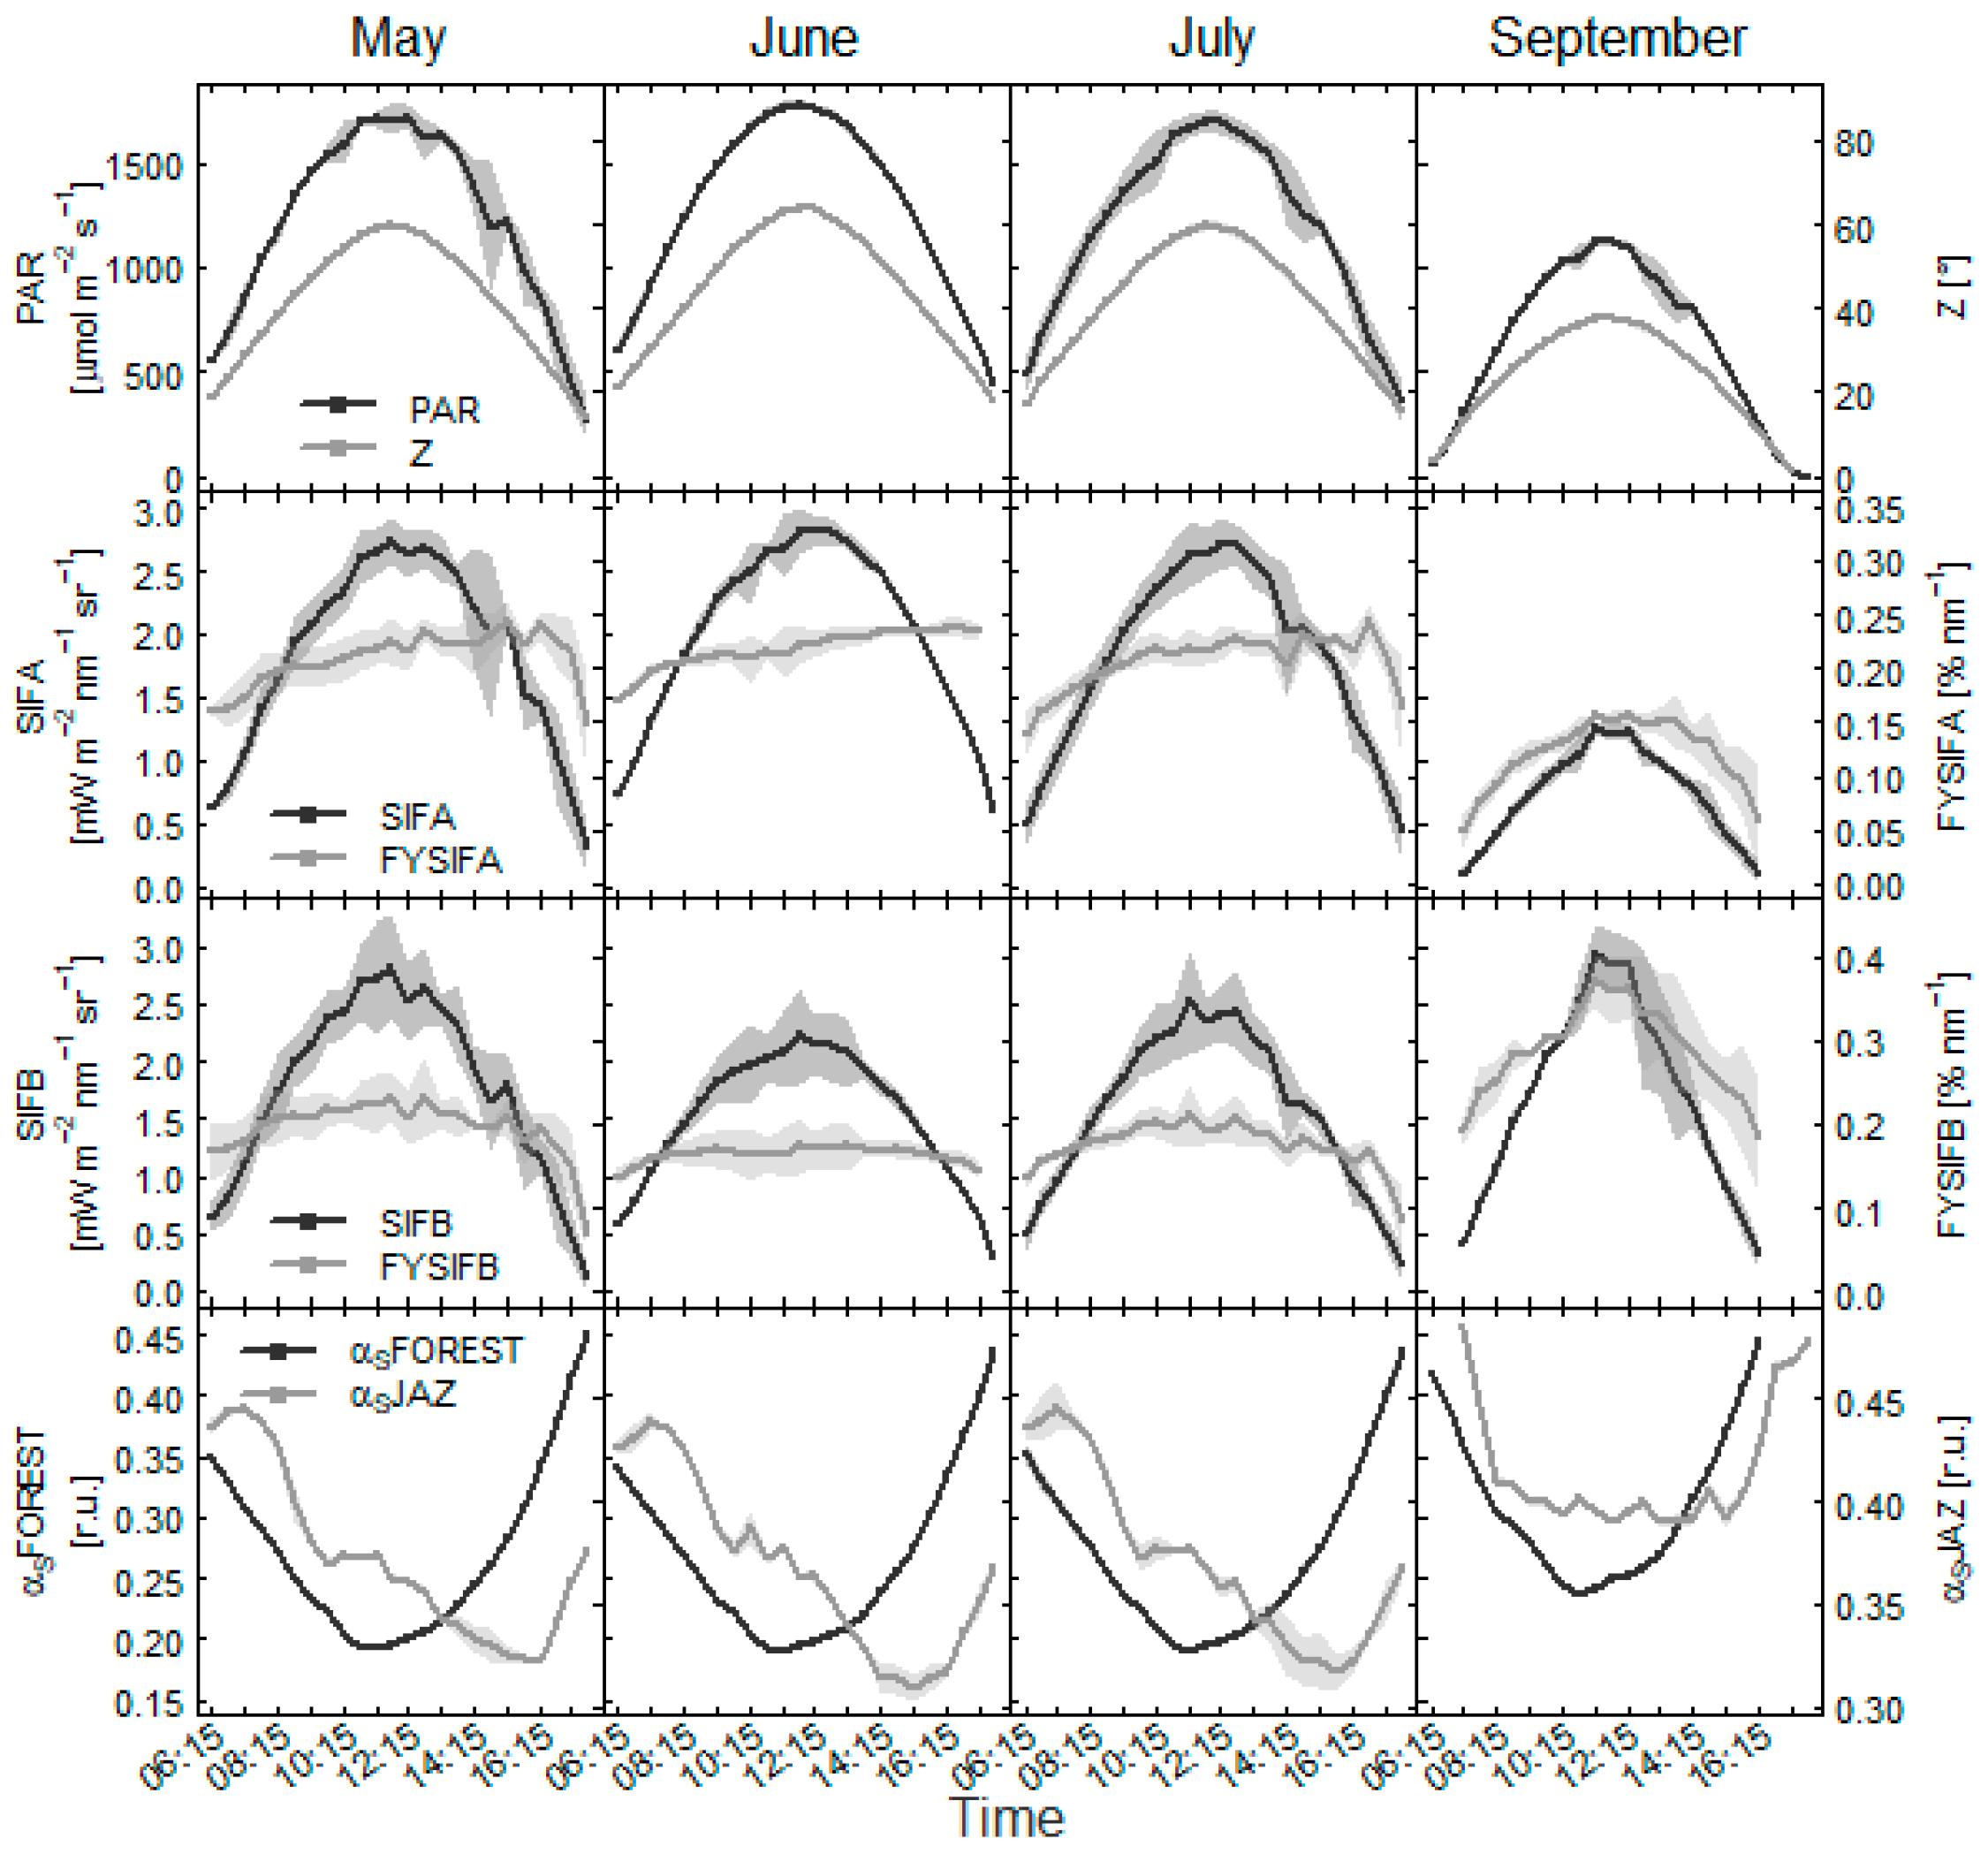
3.2. Variability of Fluorescence within Days

Within days, the dynamics of absolute fluorescence emission in both the O2A and O2B band was sensitive to incoming PAR (Figure 7 and Figure 8). Diurnal dynamics in yield of the fluorescence emissions (FYSIFA, FYSIFB) revealed that daily measured SIF values were sensitive to canopy shadow fraction. The comparisons between fluorescence and αS data showed that the amount of foliage in the measured area propagated into daily observations of SIF. The observed changes may have reflected also the dynamics in photosynthesis.
Measurements in the beech forest suggested a greater effect of canopy shadow fraction on fluorescence emission in O2A band (Figure 8). The FYSIFA in the afternoon tended to increase coherently with increased sunlit proportion of foliage in the measured area, particularly for the observations in the beech forest. FYSIFB values presented rather similar dynamics in the morning and afternoon hours, suggesting a closer link to canopy physiology. For the measurements in the spruce forest, FYSIFB similarly decreased in the afternoon hours as compared with FYSIFA values (Figure 7). A decrease in the rate of fluorescence emission at both emission peaks typically occurred at approximately 10 a.m. as a response to decreasing photosynthetic functions of the canopy. The decrease typically occurred in conjunction with αS and increased shading within the canopy in less favorable conditions for photosystems functionality. The measurements favored emission in the O2B band as the signal with the closer link to photosynthesis. Fluorescence emission in the O2A band may have been overestimated with scattering effects in the near-infrared area.

3.3. Factors That Determine Fluorescence Emissions in the O2A and O2B Bands

SIFA was significantly correlated with APAR in the spruce forest (R2 = 0.69; p < 0.001, Figure 9) and in the beech forest (R2 = 0.80; p < 0.001). A positive slope in the relationship between APAR and fluorescence emission in the O2B band was recorded in the beech forest, with R2 = 0.79 (p < 0.001). SIFB in the beech forest did not show a close relationship to APAR with R2 = 0.27 (p < 0.001). Relationships between these data at 30 min intervals tended to be lower.
We show the relationship between fluorescence and NDVI for data at high light intensities, with highlighted R2 values for estimations during the summer (Figure 10). In deciduous beech trees, the highest SIFB was estimated for the start and end of the season for the forest with low NDVI. A negative correlation between NDVI and SIFB (R2 = 0.57; p < 0.001) was recorded. The observed relationship was due to an overlapping between spectra of fluorescence and absorption spectrum by chlorophylls. A similar relationship was recorded for the SIFB-NDVI relationship in the spruce forest, with R2 = 0.62 (p < 0.001). Trends in seasonal data deteriorate mostly with seasonality in NDVI. A similar pattern in the relationship was observed in the case of the spruce forest for the relationship between SIFA and NDVI, with lower R2 = 0.40 (p < 0.001). NDVI had no impact on SIFA in the beech forest (Figure 10); rather, a positive trend was observed here. The trends cannot be scaled more directly between days. It appears that within days, trends are more strongly influenced with PAR, but seasonality with NDVI precludes larger generalization of the relationship between the data.
SIFA was significantly correlated (R2 = 0.48; p < 0.001) with GPP in the spruce forest (Figure 11), but a somewhat poorer relation between SIFA and GPP was seen from the beech forest (R2 = 0. 37; p < 0.001). SIFB was associated with GPP data in the spruce forest with R2 = 0.29 (p < 0.001). SIFB was efficient in estimating GPP of the beech forest with R2 = 0.61 (p < 0.001) but with a negative slope in the relationship, contrary to the other graphs. For the data with GPP of the beech forest in the range 15 to 35 µmol m−2 s−1, we recorded R2 = 0.49 (p < 0.001).
Seasonality of fluorescence emissions in O2A and O2B bands with foliar chlorophyll concentrations of the trees propagated into a seasonal trend in the SIFA:SIFB ratio (Figure 12). The dynamics of the SIFA:SIFB ratio were similar between the forests at the start of the season. An increase was observed in the ratio between SIFA and SIFB above 1 at the start of the season (Figure 12). However, the established trend diverged later in the season, and the response in the ratio diverged between forests in August. The SIFA:SIFB ratio increased to values of 1.4 in spruce forest, with increasing reabsorption of SIFB emission by vegetation cover. The SIFA:SIFB ratio in beech forest decreased with senescence in the leaves towards end of the season and reached zero with leaf fall.

4. Discussion

4.1. Measurement of Fluorescence in the O2B Band

In this study, we examined the relationship between fluorescence at 760 nm quantified using a 3FLD method from spectra with nanometer resolution (i.e., 1 nm FWHM) and fluorescence at 687 nm estimated from the same spectral measurements with the same resolution in adjacent spectral wavebands. According to Julitta et al. [12], resolution of the spectrometer of at least 1 nm is required for estimating fluorescence in O2A band, and for estimating fluorescence in the O2B band, a finer resolution of at least 0.5 nm is required to achieve a similar degree of precision in measurements. However, our data showed that 1 nm resolution is sufficient for estimating fluorescence in the O2B band: the estimated SIFB showed a clear signal, and the signal yielded similarities to the SIFA signal both seasonally (Figure 5) and diurnally (Figure 7 and Figure 8). Our measurements showed that the signal of O2B fluorescence emission provided a meaningful trend across the season and the changes agree with the pattern of NDVI. Fluorescence in O2A and O2B bands shared similar sensitivity to PAR and showed sensitivity to NDVI. Inversion in the relationship between O2B fluorescence and NDVI (Figure 10) suggested that the signal is reversibly scaled with NDVI; thereby we presume that SIFB emissions are highly dependent on chlorophyll concentration, as shown by Gitelson et al. [10].
The yield of fluorescence emission at O2B band from the daily observations showed a decrease in the afternoon. The observed trend may be considered as a response to a general physiological decline in the afternoon hours, typically occurring in photosynthesis in environments with excessive PAR [35]. The measured SIFA was dependent on scattering and the amount of leaves in the field of view (FOV), whereas SIFB appeared to be a parameter linked more directly to physiology and less to shading effects in the forest canopies (Figure 7 and Figure 8). Our results suggested that SIFB may be suitable for measuring GPP changes in deciduous plants, despite the negative slope across the season. The relationship between GPP and SIFB was largely driven by changes in NDVI (Figure 9). The dynamics of the SIF parameters at the start of vegetative period estimated for the beech forest (Figure 5) were similar to those observed by Daumard et al. [36] in a sorghum stand. These authors reported that fluorescence at 687 nm increased rapidly during early growth and then became saturated, even as SIFA continued to increase. The trend of decreasing SIFA emission and increasing SIFB towards the end of season was similarly matched by Magney et al. [22], who conducted measurements of fluorescence at both oxygen bands together with NDVI in a soybean field. The observed trend towards the end of soybean growing cycle was matched with a decrease in NDVI, similar to the findings of our study. The dependence of SIFB on APAR in the beech forest was quite low (Figure 6), which suggests that the dependency between SIFB and GPP is strongly affected by different factors. Variations in SIFB with foliar NDVI have a greater potential to determine the relationship between SIFB and GPP across the season (Figure 9). In daily observations at 30 min intervals, the relationship between SIFB and GPP was lowered with PAR (Figure 9), which underestimated SIFB emissions, as compared with GPP at APAR ˂ 1200 µmol m−2 s−1 (Figure 11).

4.2. Relationship of Fluorescence Emissions to GPP

Meroni et al. [37] found that far-red SIF (SIFA) in grasslands increases in spring, peaks in early summer, and then decreases in late summer. These changes are attributed primarily to NDVI of the canopy and to the PAR intensity. A similar trend was also observed by Campbell et al. [38] in a field of corn (Zea mays). Forests are quite different in structure from graminaceous vegetation, but we found comparable SIFA changes in both forests, with SIFA more strongly correlated with GPP across the season in the spruce forest (Figure 11). This dependency may have developed on the basis of a lower APAR later in the season, but the dispersion in the data also depended on the contribution of other factors, including perhaps pigment contents or the activity of the xanthophyll cycle. A large number of studies demonstrate a nonlinear relationship between fluorescence and GPP at fine spatial and temporal scales or under stress [8,38,39,40,41]. Unlike reflectance or vegetation indices, which are relatively stable over short timespans, SIF fluctuates instantaneously with PAR and dynamic regulations of photosynthesis and NPQ [21]. The competing influences of NPQ and photosynthesis on SIF yield under stress [7,41] may account for the observed poor relationship between fluorescence emissions and seasonal GPP.
Diurnal changes in SIFA may represent photosynthetic activity because both chlorophyll fluorescence and the xanthophyll cycle are usually involved in photoprotection under conditions of excessive radiation [42,43]. The link between SIF and photosynthesis depends on the rate of NPQ and is influenced by stress levels because both radiative and non-radiative pathways of dissipation are sensitive to stress [44]. High PAR intensity and a high vapor–pressure deficit are considered to be critical factors for dynamics observed at midday [45,46]. We observed high diurnal fluctuations of SIF in the spruce forest (Figure 5), which could indicate an enhanced NPQ later in the growing season. Spruce species are especially known to have a high capacity for dynamic NPQ [47]. Other studies have also found that decreases in SIF due to plant stress, especially under limited water supply, were linked to higher NPQ values [48,49]. Part of the observed dynamics can be attributed to canopy scattering, which may increase reflected radiance in the far-red part of the spectrum in dried foliage and may, thus, increase the detected fluorescence. This may apply particularly where the detected signal is concomitant with any signal from the woody parts of the forest [50]. Therefore, a quite high SIF emission was detected in spruce forest before mid-July (Figure 6), which was an extremely dry period [51] ending with heavy rainfall that led to an increase in foliar NDVI (Figure 5).
The dominance of APAR in the SIF signal at seasonal scales has been previously demonstrated [32,52,53]. The dependence of SIFA on APAR in our study is strong because morning periods with lower APAR were included in the analysis. SIFA, thus, likely contains information regarding both APAR and LUE, variables that determine GPP (GPP = APAR × LUE). Fluorescence can thereby estimate changes in photosynthetic efficiency, as indicated in Yang et al. [54], Verma et al. [55], and Miao et al. [56]. Dominance of this relationship was shown from the dependency of the fluorescence emission on APAR (Figure 9). The relationship between SIFA and GPP in the beech forest (Figure 10) may have been accentuated with regulation in GPP by physiological factors, e.g., with stomata [41,43]. The dispersion in the data points can be effectively lowered with spatial resolution of the measurements by making measurements from a larger distance at a larger area [39,57].
Some studies have provided inconclusive results regarding the SIFB-GPP dependency analysis, e.g., Tagliabue et al. [39]. Wieneke et al. [27] identified a significant but relatively weak correlation (R2 = 0.25) between airborne-based SIFB and GPP in stressed sugar beet plants and a positive correlation between GPP and SIFB in unstressed plots. We assume that in our study, similar principles applied in the SIFB-GPP relationship in the beech forest, in which the variable related to stress was NDVI and the resulting relationship had a negative slope. SIFB-GPP relationship in the spruce forest was positive. In the evergreen forest, there were no apparent changes in NDVI throughout the season that would have altered the slope of the relationship between fluorescence emission and GPP. It appears that the dependency of the SIFB signal on NDVI kept the scatter of data points from beech trees low.
Several recent studies have stated that canopy structure drives diurnal SIF dynamics retrieved from ground-based towers [53,58]. Measurements confirmed that the detected fluorescence signal is sensitive to plant physiology, related to shading within canopy and dependent also on NDVI (Figure 5, Figure 6, Figure 7 and Figure 8). We showed daily fluorescence dynamics as viewed from the top of canopy observations with the analysis of data from airborne LiDAR scanner. Canopy shadow fraction explained part of the observed daily variability in fluorescence in addition to changes induced by sunlight. Propagation of αS into observed SIF-GPP relationships observed in Figure 11 may be minimal. We expect fluorescence to be more responsive to tree physiology and fluctuations in GPP at a seasonal timeframe.

4.3. The Ratio between Fluorescence Emissions at O2A and O2B Bands

The ratio of fluorescence emissions between the two peaks was not used directly for quantitative analyses, but it does serve as an indicator of exposure to stress, as in many previous studies. Wieneke et al. [27] showed that red to far-red fluorescence ratio has an increasing tendency to be related to lowering light use efficiency throughout the day, thus showing a link of the fluorescence ratio to daily photosynthesis. We showed seasonal changes in the ratio associated with changes in forest NDVI and exposure to environmental factors. It is reasonable to assume that dynamics in the fluorescence emission ratio across the season was associated with changes in chlorophyll concentrations. Foliar chlorophyll concentration may have contributed to emission in the O2A band and to decreased emission in O2B band with reabsorption of the signal [10]. These factors affected observed seasonality in SIFA:SIFB ratio.
At both sites, we detected a rapid increase in the SIFA:SIFB ratio in spring as NDVI increased with foliar development, then the ratio between SIFA and SIFB emission decreased towards August with adjustments in pigments. The trends diverged later towards the autumn. The ratio between SIFA and SIFB in spruce increased as a result of decrease in SIFB emission with reabsorption of this signal. In beech, the decrease with autumn senescence was observed and continued until falling to zero with leaf fall. The observed trend looked to be well-scaled across season with NDVI, and a decrease in the SIFA:SIFB ratio would be a common response to lowering chlorophyll content in trees following senescence and decreasing nitrogen status [59,60]. The opposite trend in the ratio between emissions was recorded by Corp et al. [61] in a corn field, with increasing fertilization. The observed trend would fit the dynamics of our data in spruce forest.

4.4. General Purpose of the Study

We provided an overview of fluorescence dynamics in O2A and O2B band in deciduous beech and evergreen spruce forests. The dynamics of fluorescence parameters at fine temporal scale is difficult to obtain from measurements using airborne sensors due to constructional limitations of the sensors and long revisit periods between the measurements. We used daily measured data of fluorescence at forest sites to explore possibilities of using this signal as a physiological measure. Deciduous and evergreen forest were selected for the measurements, which offer distinct and specific dynamics in leaf area index and photosynthetic pigments in the season. Fluorescence parameters showed specific response to photosynthesis of trees, both seasonally and within days, dependent on forest NDVI and APAR. In addition, the dynamics of canopy shadow fraction in the measured area may be affecting the measured signal, as shown in the analysis. Data showed that the changes are linked to GPP of the forests, and therefore, the signals can be scaled to GPP in studies conducted at higher spatial level.
We summarize major outcomes from the study into six points:
-
fluorescence in the O2A band shows positive correlation with APAR and GPP in forest stands (Figure 9 and Figure 11);
-
fluorescence in the O2B band is influenced with canopy NDVI (Figure 10);
-
self-shading within canopy can impact daily observed dynamics of fluorescence at O2A band (Figure 7 and Figure 8);
-
in the evergreen needle forest, fluorescence in the O2B band decreases towards autumn more strongly than O2A fluorescence, coherently with decreasing GPP (Figure 5), the change being linked to sensitivity of the emission to foliar NDVI;
-
a negative correlation is recorded in the beech forest in the relationship between SIFB and GPP, the trend is related to NDVI seasonality, and the connection between the data deteriorates under lower PAR levels (Figure 11);
-
the ratio between fluorescence emissions at O2A and O2B bands shows similar response at the start of the season at both forest sites, but the trend diverges towards autumn dependent on tree species and dynamics of NDVI (Figure 12).

5. Conclusions

We estimated fluorescence signals at the O2A and O2B oxygen lines from continually measured spectra of irradiance and reflected radiance at the forest sites. The data were captured using spectrometers mounted on the towers above the beech and spruce forest ecosystems. Sensitivity of fluorescence within the O2A band to gross primary productivity was primarily driven by dependency of the fluorescence emission on APAR. Seasonality in forest NDVI influenced the relationship of fluorescence within the O2B band to GPP. This relationship was positive in the evergreen spruce forest and negative in the deciduous beech forest. The estimated relationships among SIFA, SIFB, and GPP were significant. Our results support the assumption that SIF retrievals from ’middle-class’ spectrometers are sufficiently accurate and that fluorescence can successfully track physiological changes induced by environmental factors. The analyses showed how biological factors may influence the diurnal cycle of SIF. Daily data also showed that detected fluorescence at the O2A line was influenced by canopy shadow fraction. Measurements also showed that structural properties of the forests can affect the scaling of the SIF signal to ground measurements of GPP.

Author Contributions

Conceptualization, D.K.; methodology, D.K., J.N. and L.Š.; software, D.K., J.N. and L.Š.; formal analysis, D.K.; data curation, D.K.; writing—original draft preparation, D.K.; writing—review and editing, D.K. and J.G.; visualization, D.K., J.N. and L.Š.; project administration, O.U. All authors have read and agreed to the published version of the manuscript.

Funding

This work was supported by the Ministry of Education, Youth, and Sports of the Czech Republic within the National Infrastructure for Carbon Observations—CzeCOS (No. LM2018123) and SustES—Adaptation Strategies for Sustainable Ecosystem Services and Food Security under Adverse Environmental Conditions (CZ.02.1.01/0.0/0.0/16_019/0000797).

Data Availability Statement

The data presented in this study are available on request from the corresponding author. The data are not publicly available due to uniqueness of the dataset.

Conflicts of Interest

The authors declare no conflict of interest. The funders had no role in the design of the study; in the collection, analyses, or interpretation of data; in the writing of the manuscript; or in the decision to publish the results.

References

  1. Balzarolo, M.; Anderson, K.; Nichol, C.; Rossini, M.; Vescovo, L.; Arriga, N.; Wohlfahrt, G.; Calvet, J.-C.; Carrara, A.; Cerasoli, S.; et al. Ground-Based Optical Measurements at European Flux Sites: A Review of Methods, Instruments and Current Controversies. Sensors 2011, 11, 7954–7981. [Google Scholar] [CrossRef] [PubMed]
  2. Hall, F.G.; Hilker, T.; Coops, N.C.; Lyapustin, A.; Huemmrich, K.F.; Middleton, E.; Margolis, H.; Drolet, G.; Black, T.A. Multi-Angle Remote Sensing of Forest Light Use Efficiency by Observing PRI Variation with Canopy Shadow Fraction. Remote Sens. Environ. 2008, 112, 3201–3211. [Google Scholar] [CrossRef] [Green Version]
  3. Markiet, V.; Hernandez-Clemente, R.; Mõttus, M. Spectral Similarity and PRI Variations for a Boreal Forest Stand Using Multi-Angular Airborne Imagery. Remote Sens. 2017, 9, 1005. [Google Scholar] [CrossRef] [Green Version]
  4. Zhang, Z.; Zhang, Y.; Zhang, Q.; Chen, J.M.; Porcar-Castell, A.; Guanter, L.; Wu, Y.; Zhang, X.; Wang, H.; Ding, D.; et al. Assessing Bi-Directional Effects on the Diurnal Cycle of Measured Solar-Induced Chlorophyll Fluorescence in Crop Canopies. Agric. For. Meteorol. 2020, 295, 108147. [Google Scholar] [CrossRef]
  5. Garroutte, E.L.; Hansen, A.J.; Lawrence, R.L. Using NDVI and EVI to Map Spatiotemporal Variation in the Biomass and Quality of Forage for Migratory Elk in the Greater Yellowstone Ecosystem. Remote Sens. 2016, 8, 404. [Google Scholar] [CrossRef] [Green Version]
  6. Lichtenthaler, H.K.; Rinderle, U. The Role of Chlorophyll Fluorescence in the Detection of Stress Conditions in Plants. Crit. Rev. Anal. Chem. 1988, 19, S29–S85. [Google Scholar] [CrossRef]
  7. Acebron, K.; Matsubara, S.; Jedmowski, C.; Emin, D.; Muller, O.; Rascher, U. Diurnal Dynamics of Nonphotochemical Quenching in Arabidopsis Npq Mutants Assessed by Solar-Induced Fluorescence and Reflectance Measurements in the Field. New Phytol. 2021, 229, 2104–2119. [Google Scholar] [CrossRef]
  8. Damm, A.; Elber, J.; Erler, A.; Gioli, B.; Hamdi, K.; Hutjes, R.; Kosvancova, M.; Meroni, M.; Miglietta, F.; Moersch, A.; et al. Remote Sensing of Sun-Induced Fluorescence to Improve Modeling of Diurnal Courses of Gross Primary Production (GPP). Glob. Chang. Biol. 2010, 16, 171–186. [Google Scholar] [CrossRef] [Green Version]
  9. Buschmann, C. Variability and Application of the Chlorophyll Fluorescence Emission Ratio Red/Far-Red of Leaves. Photosynth. Res. 2007, 92, 261–271. [Google Scholar] [CrossRef]
  10. Gitelson, A.A.; Buschmann, C.; Lichtenthaler, H.K. Leaf Chlorophyll Fluorescence Corrected for Re-Absorption by Means of Absorption and Reflectance Measurements. J. Plant Physiol. 1998, 152, 283–296. [Google Scholar] [CrossRef]
  11. van Wittenberghe, S.; Alonso, L.; Verrelst, J.; Hermans, I.; Delegido, J.; Veroustraete, F.; Valcke, R.; Moreno, J.; Samson, R. Upward and Downward Solar-Induced Chlorophyll Fluorescence Yield Indices of Four Tree Species as Indicators of Traffic Pollution in Valencia. Environ. Pollut. 2013, 173, 29–37. [Google Scholar] [CrossRef] [PubMed]
  12. Julitta, T.; Corp, L.A.; Rossini, M.; Burkart, A.; Cogliati, S.; Davies, N.; Hom, M.; MacArthur, A.; Middleton, E.M.; Rascher, U.; et al. Comparison of Sun-Induced Chlorophyll Fluorescence Estimates Obtained from Four Portable Field Spectroradiometers. Remote Sens. 2016, 8, 122. [Google Scholar] [CrossRef] [Green Version]
  13. Meroni, M.; Colombo, R. Leaf Level Detection of Solar Induced Chlorophyll Fluorescence by Means of a Subnanometer Resolution Spectroradiometer. Remote Sens. Environ. 2006, 103, 438–448. [Google Scholar] [CrossRef]
  14. Perez-Priego, O.; Zarco-Tejada, P.J.; Miller, J.R.; Sepulcre-Cantó, G.; Fereres, E. Detection of Water Stress in Orchard Trees with a High-Resolution Spectrometer through Chlorophyll Fluorescence in-Filling of the O-2-A Band. IEEE Trans. Geosci. Remote Sens. 2005, 43, 2860–2869. [Google Scholar] [CrossRef]
  15. Frankenberg, C.; O´Dell, C.; Guanter, L.; McDuffie, J. Remote Sensing of Near-Infrared Chlorophyll Fluorescence from Space in Scattering Atmospheres: Implications for Its Retrieval and Interferences with Atmospheric CO2 Retrievals. Atmos. Meas. Tech. 2012, 5, 2081–2094. [Google Scholar] [CrossRef] [Green Version]
  16. Joiner, J.; Yoshida, Y.; Vasilkov, A.; Schaefer, K.; Jung, M.; Guanter, L.; Zhang, Y.; Garrity, S.R.; Middleton, E.M.; Huemmrich, K.F. The Seasonal Cycle of Satellite Chlorophyll Fluorescence Observations and Its Relationship to Vegetation Phenology and Ecosystem Atmosphere Carbon Exchange. Remote Sens. Environ. 2014, 152, 375–391. [Google Scholar] [CrossRef] [Green Version]
  17. Sun, Y.; Frankenberg, C.; Jung, M.; Joiner, J.; Guanter, L.; Köhler, P.; Magney, T. Overview of Solar-Induced Chlorophyll Fluorescence (SIF) from the Orbiting Carbon Observatory-2: Retrieval, Cross-Mission Comparison, and Global Monitoring for GPP. Remote Sens. Environ. 2018, 209, 808–823. [Google Scholar] [CrossRef]
  18. Li, X.; Xiao, J.; He, B. Chlorophyll Fluorescence Observed by OCO-2 Is Strongly Related to Gross Primary Productivity Estimated from Flux Towers in Temperate Forests. Remote Sens. Environ. 2018, 204, 659–671. [Google Scholar] [CrossRef]
  19. Migliavacca, M.; Perez-Priego, O.; Rossini, M.; El-Madany, T.S.; Moreno, G.; van der Tol, C.; Rascher, U.; Berninger, A.; Bessenbacher, V.; Burkart, A.; et al. Plant Functional Traits and Canopy Structure Control the Relationship between Photosynthetic CO2 Uptake and Far-Red Sun-Induced Fluorescence in a Mediterranean Grassland under Different Nutrient Availability. New Phytol. 2017, 214, 1078–1091. [Google Scholar] [CrossRef] [Green Version]
  20. Rossini, M.; Panigada, C.; Cilia, C.; Meroni, M.; Busetto, L.; Cogliati, S.; Amaducci, S.; Colombo, R. Discriminating Irrigated and Rainfed Maize with Diurnal Fluorescence and Canopy Temperature Airborne Maps. ISPRS Int. J. Geo-Inf. 2015, 4, 626–646. [Google Scholar] [CrossRef]
  21. Porcar-Castell, A.; Tyystjarvi, E.; Atherton, J.; van der Tol, C.; Flexas, J.; Pfuendel, E.E.; Moreno, J.; Frankenberg, C.; Berry, J.A. Linking Chlorophyll a Fluorescence to Photosynthesis for Remote Sensing Applications: Mechanisms and Challenges. J. Exp. Bot. 2014, 65, 4065–4095. [Google Scholar] [CrossRef] [PubMed] [Green Version]
  22. Magney, T.S.; Frankenberg, C.; Köhler, P.; North, G.; Davis, T.S.; Dold, C.; Dutta, D.; Fisher, J.B.; Grossmann, K.; Harrington, A.; et al. Disentangling Changes in the Spectral Shape of Chlorophyll Fluorescence: Implications for Remote Sensing of Photosynthesis. J. Geophys. Res. Biogeosci. 2019, 124, 1491–1507. [Google Scholar] [CrossRef] [Green Version]
  23. Zhang, C.; Atherton, J.; Peñuelas, J.; Filella, I.; Kolari, P.; Aalto, J.; Ruhanen, H.; Bäck, J.; Porcar-Castell, A. Do All Chlorophyll Fluorescence Emission Wavelengths Capture the Spring Recovery of Photosynthesis in Boreal Evergreen Foliage? Plant Cell Environ. 2019, 42, 3264–3279. [Google Scholar] [CrossRef]
  24. Pierrat, Z.; Nehemy, M.F.; Roy, A.; Magney, T.; Parazoo, N.C.; Laroque, C.; Pappas, C.; Sonnentag, O.; Grossmann, K.; Bowling, D.R.; et al. Tower-Based Remote Sensing Reveals Mechanisms Behind a Two-Phased Spring Transition in a Mixed-Species Boreal Forest. J. Geophys. Res. 2021, 126, e2020JG006191. [Google Scholar] [CrossRef]
  25. Lappi, J.; Stenberg, P. Joint Effect of Angular Distribution of Radiation and Spatial Pattern of Trees on Radiation Interception. Ecol. Modell. 1998, 112, 45–51. [Google Scholar] [CrossRef]
  26. Ač, A.; Malenovský, Z.; Olejníčková, J.; Gallé, A.; Rascher, U.; Mohammed, G. Meta-Analysis Assessing Potential of Steady-State Chlorophyll Fluorescence for Remote Sensing Detection of Plant Water, Temperature and Nitrogen Stress. Remote Sens. Environ. 2015, 168, 420–436. [Google Scholar] [CrossRef] [Green Version]
  27. Wieneke, S.; Burkart, A.; Cendrero-Mateo, M.P.; Julitta, T.; Rossini, M.; Schickling, A. Linking Photosynthesis and Sun-Induced Fluorescence at Sub-Daily to Seasonal Scales. Remote Sens. Environ. 2018, 219, 247–258. [Google Scholar] [CrossRef]
  28. Kováč, D.; Ač, A.; Šigut, L.; Peñuelas, J.; Grace, J.; Urban, O. Combining NDVI, PRI and the Quantum Yield of Solar-Induced Fluorescence Improves Estimations of Carbon Fluxes in Deciduous and Evergreen Forests. Sci. Total Environ. 2022, 829, 154681. [Google Scholar] [CrossRef]
  29. Kováč, D.; Veselovská, P.; Klem, K.; Večeřová, K.; Ač, A.; Peñuelas, J.; Urban, O. Potential of Photochemical Reflectance Index for Indicating Photochemistry and Light Use Efficiency in Leaves of European Beech and Norway Spruce Trees. Remote Sens. 2018, 10, 1202. [Google Scholar] [CrossRef] [Green Version]
  30. Patel, M.K.; Ryu, D.; Western, A.W.; Suter, H.; Young, I.M. Which Multispectral Indices Robustly Measure Canopy Nitrogen across Seasons: Lessons from an Irrigated Pasture Crop. Comput. Electron. Agric. 2021, 182, 106000. [Google Scholar] [CrossRef]
  31. Hunter, J.D. Matplotlib: A 2D Graphics Environment. Comput. Sci. Eng. 2007, 9, 90–95. [Google Scholar] [CrossRef]
  32. Yang, P.; van der Tol, C. Linking Canopy Scattering of Far-Red Sun-Induced Chlorophyll Fluorescence with Reflectance. Remote Sens. Environ. 2018, 209, 456–467. [Google Scholar] [CrossRef]
  33. Lasslop, G.; Reichstein, M.; Papale, D.; Richardson, A.; Arneth, A.; Barr, A.; Stoy, P.; Wohlfahrt, G. Separation of Net Ecosystem Exchange into Assimilation and Respiration Using a Light Response Curve Approach: Critical Issues and Global Evaluation. Glob. Chang. Biol. 2010, 16, 187–208. [Google Scholar] [CrossRef] [Green Version]
  34. Wutzler, T.; Lucas-Moffat, A.; Migliavacca, M.; Knauer, J.; Sickel, K.; Šigut, L. Basic and Extensible Post-Processing of Eddy Covariance Flux Data with REddyProc. Biogeosciences 2018, 15, 5015–5030. [Google Scholar] [CrossRef] [Green Version]
  35. Mohotti, A.J.; Lawlor, D.W. Diurnal Variation of Photosynthesis and Photoinhibition in Tea: Effects of Irradiance and Nitrogen Supply during Growth in the Field. J. Exp. Bot. 2002, 53, 313–322. [Google Scholar] [CrossRef] [PubMed]
  36. Daumard, F.; Goulas, Y.; Champagne, S.; Fournier, A.; Ounis, A.; Olioso, A.; Moya, I. Continuous Monitoring of Canopy Level Sun-Induced Chlorophyll Fluorescence During the Growth of a Sorghum Field. IEEE Trans. Geosci. Remote Sens. 2012, 50, 4292–4300. [Google Scholar] [CrossRef]
  37. Meroni, M.; Barducci, A.; Cogliati, S.; Castagnoli, F.; Rossini, M.; Busetto, L.; Migliavacca, M.; Cremonese, E.; Galvagno, M.; Colombo, R.; et al. The Hyperspectral Irradiometer, a New Instrument for Long-Term and Unattended Field Spectroscopy Measurements. Rev. Sci. Instrum. 2011, 82, 43106. [Google Scholar] [CrossRef]
  38. Campbell, P.K.E.; Huemmrich, K.F.; Middleton, E.M.; Ward, L.A.; Julitta, T.; Daughtry, C.S.T.; Burkart, A.; Russ, A.L.; Kustas, W.P. Diurnal and Seasonal Variations in Chlorophyll Fluorescence Associated with Photosynthesis at Leaf and Canopy Scales. Remote Sens. 2019, 11, 488. [Google Scholar] [CrossRef] [Green Version]
  39. Tagliabue, G.; Panigada, C.; Dechant, B.; Baret, F.; Cogliati, S.; Colombo, R.; Migliavacca, M.; Rademske, P.; Schickling, A.; Schüttemeyer, D.; et al. Exploring the Spatial Relationship between Airborne-Derived Red and Far-Red Sun-Induced Fluorescence and Process-Based GPP Estimates in a Forest Ecosystem. Remote Sens. Environ. 2019, 231, 111272. [Google Scholar] [CrossRef]
  40. Magney, T.S.; Barnes, M.L.; Yang, X. On the Covariation of Chlorophyll Fluorescence and Photosynthesis across Scales. Geophys. Res. Lett. 2020, 47, e2020GL091098. [Google Scholar] [CrossRef]
  41. Marrs, J.K.; Reblin, J.S.; Logan, B.A.; Allen, D.W.; Reinmann, A.B.; Bombard, D.M.; Tabachnik, D.; Hutyra, L.R. Solar-Induced Fluorescence Does not Track Photosynthetic Carbon Assimilation Following Induced Stomatal Closure. Geophys. Res. Lett. 2020, 47, e2020GL087956. [Google Scholar] [CrossRef]
  42. Cogliati, S.; Rossini, M.; Julitta, T.; Meroni, M.; Schickling, A.; Burkart, A.; Pinto, F.; Rascher, U.; Colombo, R. Continuous and Long-Term Measurements of Reflectance and Sun-Induced Chlorophyll Fluorescence by Using Novel Automated Field Spectroscopy Systems. Remote Sens. Environ. 2015, 164, 270–281. [Google Scholar] [CrossRef]
  43. Pinto, F.; Damm, A.; Schickling, A.; Panigada, C.; Cogliati, S.; Müller-Linow, M.; Balvora, A. Sun-Induced Chlorophyll Fluorescence from High-Resolution Imaging Spectroscopy Data to Quantify Spatio-Temporal Patterns of Photosynthetic Function in Crop Canopies. Plant Cell Environ. 2016, 39, 1500–1512. [Google Scholar] [CrossRef] [PubMed] [Green Version]
  44. Paul-Limoges, E.; Damm, A.; Hueni, A.; Liebisch, F.; Eugster, W.; Schaepman, M.E.; Buchmann, N. Effect of Environmental Conditions on Sun-Induced Fluorescence in a Mixed Forest and a Cropland. Remote Sens. Environ. 2018, 219, 310–323. [Google Scholar] [CrossRef]
  45. Kováč, D.; Veselá, B.; Klem, K.; Večeřová, K.; Materová, Z.; Peñuelas, J.; Urban, O. Correction of PRI for Carotenoid Pigment Pools Improves Photosynthesis Estimation across Different Irradiance and Temperature Conditions. Remote Sens. Environ. 2020, 244, 111834. [Google Scholar] [CrossRef]
  46. Pons, T.L.; Welschen, R.A.M. Midday Depression of Net Photosynthesis in the Tropical Rainforest Tree Eperua Grandiflora: Contributions of Stomatal and Internal Conductances, Respiration and Rubisco Functioning. Tree Physiol. 2003, 23, 937–947. [Google Scholar] [CrossRef] [PubMed] [Green Version]
  47. Kurasová, I.; Kalina, J.; Urban, O.; Štroch, M.; Špunda, V. Acclimation of Two Distinct Plant Species, Spring Barley and Norway Spruce, to Combined Effect of Various Irradiance and CO2 Concentration during Cultivation in Controlled Environment. Photosynth. 2003, 41, 513–523. [Google Scholar] [CrossRef]
  48. Meroni, M.; Rossini, M.; Picchi, V.; Panigada, C.; Cogliati, S.; Nali, C.; Colombo, R. Assessing Steady-State Fluorescence and PRI from Hyperspectral Proximal Sensing as Early Indicators of Plant Stress: The Case of Ozone Exposure. Sensors 2008, 8, 1740–1754. [Google Scholar] [CrossRef] [Green Version]
  49. Peguero-Pina, J.J.; Morales, F.; Flexas, J.; Gil-Pelegrín, E.; Moya, I. Photochemistry, Remotely Sensed Physiological Reflectance Index and de-Epoxidation State of the Xanthophyll Cycle in Quercus Coccifera under Intense Drought. Oecologia 2008, 156, 1–11. [Google Scholar] [CrossRef]
  50. Cogliati, S.; Celesti, M.; Cesana, I.; Miglietta, F.; Genesio, L.; Julitta, T.; Schuettemeyer, D.; Drusch, M.; Rascher, U.; Jurado, P.; et al. A Spectral Fitting Algorithm to Retrieve the Fluorescence Spectrum from Canopy Radiance. Remote Sens. 2019, 11, 1840. [Google Scholar] [CrossRef]
  51. de la Motte, L.; Beauclaire, Q.; Heinesch, B.; Cuntz, M.; Foltýnová, L.; Šigut, L.; Kowalska, N.; Manca, G.; Ballarin, I.G.; Vincke, C.; et al. Non-Stomatal Processes Reduce Gross Primary Productivity in Temperate Forest Ecosystems during Severe Edaphic Drought. Philos. Trans. R. Soc. B Biol. Sci. 2020, 375, 20190527. [Google Scholar] [CrossRef] [PubMed]
  52. Koffi, E.N.; Rayner, P.J.; Norton, A.J.; Frankenberg, C.; Scholze, M. Investigating the Usefulness of Satellite-Derived Fluorescence Data in Inferring Gross Primary Productivity within the Carbon Cycle Data. Biogeosciences 2015, 12, 4067–4084. [Google Scholar] [CrossRef] [Green Version]
  53. Dechant, B.; Ryu, Y.; Badgley, G.; Zeng, Y.; Berry, J.A.; Zhang, Y.; Goulas, Y.; Li, Z.; Zhang, Q.; Kang, M.; et al. Canopy Structure Explains the Relationship between Photosynthesis and Sun-Induced Chlorophyll Fluorescence in Crops. Remote Sens. Environ. 2020, 241, 111733. [Google Scholar] [CrossRef] [Green Version]
  54. Yang, X.; Tang, J.; Mustard, J.F.; Lee, J.; Rossini, M.; Joiner, J.; Munger, J.W.; Kornfeld, A.; Richardson, A.D. Solar-Induced Chlorophyll Fluorescence That Correlates with Canopy Photosynthesis on Diurnal and Seasonal Scales in a Temperate Deciduous Forest. Geophys. Res. Lett. 2015, 42, 2977–2987. [Google Scholar] [CrossRef]
  55. Verma, M.; Schimel, D.; Evans, B.; Frankenberg, C.; Beringer, J.; Eldering, A. Effect of Environmental Conditions on the Relationship between Solar-Induced Fluorescence and Gross Primary Productivity at an OzFlux Grassland Site. J. Geophys. Res. Biogeosci. 2017, 2, 716–733. [Google Scholar] [CrossRef] [Green Version]
  56. Miao, G.; Guan, K.; Yang, X.; Bernacchi, C.J.; Berry, J.A.; DeLudia, E.H. Sun-Induced Chlorophyll Fluorescence, Photosynthesis, and Light Use Efficiency of a Soybean Field from Seasonally Continuous Measurements. J. Geophys. Res. Biogeosci. 2018, 123, 610–623. [Google Scholar] [CrossRef]
  57. van der Tol, C.; Berry, J.A.; Campbell, P.K.E.; Rascher, U. Models of Fluorescence and Photosynthesis for Interpreting Measurements of Solar-Induced Chlorophyll Fluorescence. J. Geophys. Res. Biogeosci. 2014, 119, 2312–2327. [Google Scholar] [CrossRef]
  58. Yang, P.; van der Tol, C.; Campbell, P.K.E.; Middleton, E.M. Unraveling the Physical and Physiological Basis for the Solar-Induced Chlorophyll Fluorescence and Photosynthesis Relationship Using Continuous Leaf and Canopy Measurements of a Corn Crop. Biogeosciences 2021, 18, 441–465. [Google Scholar] [CrossRef]
  59. Apostol, S.; Viau, A.A.; Tremblay, N. A Comparison of Multiwavelength Laser-Induced Fluorescence Parameters for the Remote Sensing of Nitrogen Stress in Field-Cultivated Corn. Can. J. Remote Sens. 2007, 33, 150–161. [Google Scholar] [CrossRef]
  60. Kebabian, P.L.; Theisen, A.F.; Kallelis, S.; Freedman, A. A Passive Two-Band Sensor of Sunlight-Excited Plant Fluorescence. Rev. Sci. Instrum. 1999, 70, 4386–4393. [Google Scholar] [CrossRef]
  61. Corp, L.A.; McMurtrey, J.E.; Middleton, E.M.; Mulchi, C.L.; Chappelle, E.W.; Daughtry, C.S.T. Fluorescence Sensing Systems: In Vivo Detection of Biophysical Variations in Field Corn Due to Nitrogen Supply. Remote Sens. Environ. 2003, 86, 470–479. [Google Scholar] [CrossRef]
Figure 1. Positions of Bílý Kříž and Štítná experimental sites within the Czech Republic. Photographs show instrumentation used for measurements of canopy sun-induced fluorescence at both sites. The upper row photos show the layout of instruments at the Bílý Kříž site; lower row photos display instrumentation in the beech forest at the Štítná site.
Remotesensing 15 00067 g001
Figure 2. Spectra of irradiance and reflected radiance from the spruce (Picea abies) forest at the Bílý Kříž station and from the beech (Fagus sylvatica) forest at the Štítná station measured at midday on a sunny day in summer. Grey vertical lines indicate the wavelengths used as reference for estimating fluorescence emissions in the O2A band and in the O2B band from the spectra.
Remotesensing 15 00067 g002
Figure 3. Canopy height model (CHM) raster images of trees measured using a spectrometer. On the left side we show the structure of tree crowns as seen from above. Raster images are on a greyscale that indicates identified height of the pixel in the canopy. The upper row includes raw and αS images of spruce trees, lower row shows dynamics of beech tree. Dynamics of estimated shadow fraction in this area in 1 h steps near midday are shown with red color. Pictures show dynamics of shadows on 5 July.
Remotesensing 15 00067 g003
Figure 4. Canopy height model (CHM) raster images of trees measured using a spectrometer. On the left side, we show the structure of tree crowns as seen from above. Raster images are on a greyscale that indicates identified height of the pixel in the canopy. The upper row includes raw and αS images of spruce trees, lower row shows dynamics of beech tree. Dynamics of estimated shadow fraction in this area in 1 h steps near midday are shown with red color. Pictures show dynamics of shadows on 15 September.
Remotesensing 15 00067 g004
Figure 5. Dynamics of fluorescence in O2A band (SIFA) and fluorescence in O2B band (SIFB) shown in direct comparison with seasonal trend in NDVI at spruce and beech forests. Black dots show mean dynamics in a 2 h long period at midday. Grey points refer to dynamics at 30 min intervals within days with PAR intensities > 300 µmol m−2 s−1 and SZA > 25°.
Remotesensing 15 00067 g005
Figure 6. Dynamics in yield of fluorescence emission in O2A band (FYSIFA) and O2B band (FYSIFB). Mean value dynamics for a midday 2 h long period is shown with a black line. Grey points put into display values at 30 min intervals.
Remotesensing 15 00067 g006
Figure 7. Diurnal change of incoming PAR to the forest at the Bílý Kříž site on days evaluated as clear days. Daily dynamics of fluorescence emission in O2A band and O2B bands from the spruce forest are shown with adjacent change in the yield of this emission. The yield of SIFA and SIFB is expressed per unit of absorbed PAR (nm). Dynamics of shadow fraction in area under spectrometer (αSJAZ) and at the forest level (αSFOREST) at corresponding sun azimuth and zenith angles (Z) are shown in the bottom panel.
Remotesensing 15 00067 g007
Figure 8. Diurnal change of incoming PAR to the forest at the Štítná site on days evaluated as clear days. Daily dynamics of fluorescence emission in O2A band and O2B bands are shown with adjacent change in the yield of this emission. Dynamics of shadow fraction in area under spectrometer (αSJAZ) and at the forest level (αSFOREST) at corresponding sun azimuth and zenith angles (Z) are shown in the bottom panel.
Remotesensing 15 00067 g008
Figure 9. Dependency of fluorescence in O2A band (SIFA) and O2B band (SIFB) on amount of absorbed photosynthetically active radiation (APAR). Relationships between black points refer to averaged data across 2 h interval at midday on days with almost no clouds. N = 80 for spruce data set and N = 93 for beech data set. Grey points data refer to relationships on selected days between the data in 30 min intervals between 10:00 to 14:00 h. The asterisk indicates statistical significance of the result (*** for p ˂0.001, ** for p ˂0.01).
Remotesensing 15 00067 g009
Figure 10. Dependency of fluorescence emission in O2A band (SIFA) and O2B band (SIFB) on NDVI of the spruce and beech forests. Black points refer to fluorescence and NDVI data in time intervals with significant relationship between fluorescence emission and NDVI. These points refer to data measured in the summer period, N = 46 for spruce data set and N = 68 for beech data set. Grey points show relationships between data in 30 min intervals, and relationships refer to time intervals shown in Figure 9. The asterisk *** indicates statistically significant result at p < 0.001.
Remotesensing 15 00067 g010
Figure 11. Dependency between SIFA and GPP at examined forest sites is shown in the upper panels. Dependency between SIFB and GPP is shown in the bottom panels. Black points refer to seasonal values of parameters averaged across 2 h long intervals on days with clear sky conditions. Grey points show relationship between data on selected days in 30 min temporal intervals between 10:00 and 14:00 h. The asterisk *** indicates statistically significant result at p < 0.001.
Remotesensing 15 00067 g011
Figure 12. Seasonal variations in the ratio between fluorescence emission in the O2A and in the O2B band. Black points highlight average seasonal variation in SIFA:SIFB ratio estimated across 2 h long interval in the midday. Grey points show dynamics in 30 min intervals, temporal intervals are equal to those displayed in Figure 5.
Remotesensing 15 00067 g012
Disclaimer/Publisher’s Note: The statements, opinions and data contained in all publications are solely those of the individual author(s) and contributor(s) and not of MDPI and/or the editor(s). MDPI and/or the editor(s) disclaim responsibility for any injury to people or property resulting from any ideas, methods, instructions or products referred to in the content.

