Article

A Semi-Empirical Retrieval Method of Above-Ground Live Forest Fuel Loads by Combining SAR and Optical Data

School of Resources and Environment, University of Electronic Science and Technology of China, Chengdu 611731, China
*
Author to whom correspondence should be addressed.
Remote Sens. 2023, 15(1), 5; https://doi.org/10.3390/rs15010005
Submission received: 3 November 2022 / Revised: 21 November 2022 / Accepted: 13 December 2022 / Published: 20 December 2022
(This article belongs to the Special Issue In Situ Data in the Interplay of Remote Sensing)

Abstract

:
Forest fuel load is the key factor for fire risk assessment, firefighting, and carbon emissions estimation. Remote sensing technology has distinct advantages in fuel load estimation due to its sensitivity to biomass and adequate spatiotemporal observations for large scales. Many related works applied empirical methods with individual satellite observation data to estimate fuel load, which is highly conditioned on local data and limited by saturation problems. Here, we combined optical data (i.e., Landsat 7 ETM+) and spaceborne Synthetic Aperture Radar (SAR) data (i.e., ALOS PALSAR) in a proposed semi-empirical retrieval model to estimate above-ground live forest fuel loads (FLAGL). Specifically, optical data was introduced into water cloud model (WCM) to compensate for vegetation coverage information. For comparison, we also evaluated the performance of single spaceborne L-band SAR data (i.e., ALOS PALSAR) in fuel load estimation with common WCM. The above two comparison experiments were both validated by field measurements (i.e., BioSAR-2008) and leave-one-out cross-validation (LOOCV) method. WCM with single SAR data could achieve reasonable performance (R2 = 0.64 or higher and RMSEr = 35.3% or lower) but occurred an underestimation problem especially in dense forests. The proposed method performed better with R2 increased by 0.05–0.13 and RMSEr decreased by 5.8–12.9%. We also found that the underestimation problem (i.e., saturation problem) was alleviated even when vegetation coverage reached 65% or the total FLAGL reached about 183 Tons/ha. We demonstrated our FLAGL estimation method by validation in an open-access dataset in Sweden.

1. Introduction

Wildfires have a vital impact on the formation and succession of ecosystems [1,2]. They can enrich biodiversity and vegetation vertical structure thereby promoting the nutrient cycle and enhancing vegetation resistance to diseases or insect pests [3,4]. However, an uncontrolled wildfire may destroy the soil and water conservation ability of vegetation, release atmospheric greenhouse gases, and even threaten the safety of human life and property [5,6,7,8,9,10]. In most forest ecosystems, wildfires are mainly divided into surface fires and crown fires, in which the above-ground live fuel load (FLAGL) is the main energy resource. Prior knowledge of FLAGL (refer to the canopy and stem fuel load) is important for fire risk assessment, firefighting, and carbon emissions estimation.
The canopy fuel load commonly includes foliage (including needles and leaves), branch wood, and other suspended biomass such as lichens and mosses [11]. The foliage fuel load (FFL, referring to the dry weight of needles and leaves per unit area) and branch fuel load (BFL, referring to the dry weight of branches per unit area) are the main energy source supporting the spread of crown fire [12,13,14,15,16,17]. Stem fuel load (SFL, referring to the dry weight of stems per unit area) can interact with fires and help carry fires although it is not a substantial loss of biomass [18,19,20,21,22]. Hence, the FLAGL (i.e., FFL, BFL and SFL) are generally affected by fire [18] and play an important role in fire-related factors assessment, including flame length, fire intensity, fire severity and fuel loss [23,24,25,26]. FLAGL is also an indispensable input parameter for fire behavior models [27,28,29].
Precise grasp of the spatial distribution of FLAGL (i.e., fuel accumulation in two-dimensional plane space) is helpful for fire managers to assess forest fire risk and manage fuel load in advance (e.g., planning prescribed burning) and avoid uncontrollable fire disasters. Traditionally, FLAGL is usually obtained by combining field inventory data (e.g., diameter at breast height, height, tree species, etc.) and allometric equations. This kind of method derives the relationship between stand parameters and biomass fractions by cutting down trees, which is neither a desirable nor effective way [30]. The rapid development of remote sensing (RS) technology has brought new opportunities for the quantitative derivation of FLAGL, since RS can provide adequate spatiotemporal earth observations from regional to global scale and implement fuel loads assessment even in rugged topography [11,31,32].
Previous studies mainly utilize single optical data to estimate fuel load. Those studies focused on the vegetation type classification from multispectral information first, and then applied the corresponding fuel model [33,34]. For high spatial resolution optical images (e.g., 0.6 m), the tree scale parameters are also derived to estimate fuel load by image segmentation technology [32,35]. Although optical data has advantage over vegetation classification and foliage biomass indication [36], it is not a good indicator of woody biomass. Because optical data can hardly characterize the vertical structure of forest, and the saturation point of spectral bands is low (between 15 and 100 Tons/ha) [11,37,38]. On the contrary, the exploration of SAR data in fuel load estimation is far less than that of optical data. While there are a number of studies focused on aboveground biomass estimation using SAR sensors [39,40,41], there are few specifically targeted at fuel load assessments, and even fewer that examine components of fuel loads (e.g., foliage, branch and stem).
In this study, we first used spaceborne SAR data in FLAGL estimation via common Water Cloud Model (WCM). Next, we introduced the optical data as vegetation information into common WCM. These two models were both validated by the BioSAR-2008 dataset and compared with each other. The spatial distribution of FLAGL was mapped using the optimal model. The overarching objective is to provide accurate information of FLAGL for fire managers, which can effectively guide fuel management work and thus achieve early prevention, suppression, and response of forest fire by planning prescribed burning, increasing the distance between fuels, etc.

2. Materials

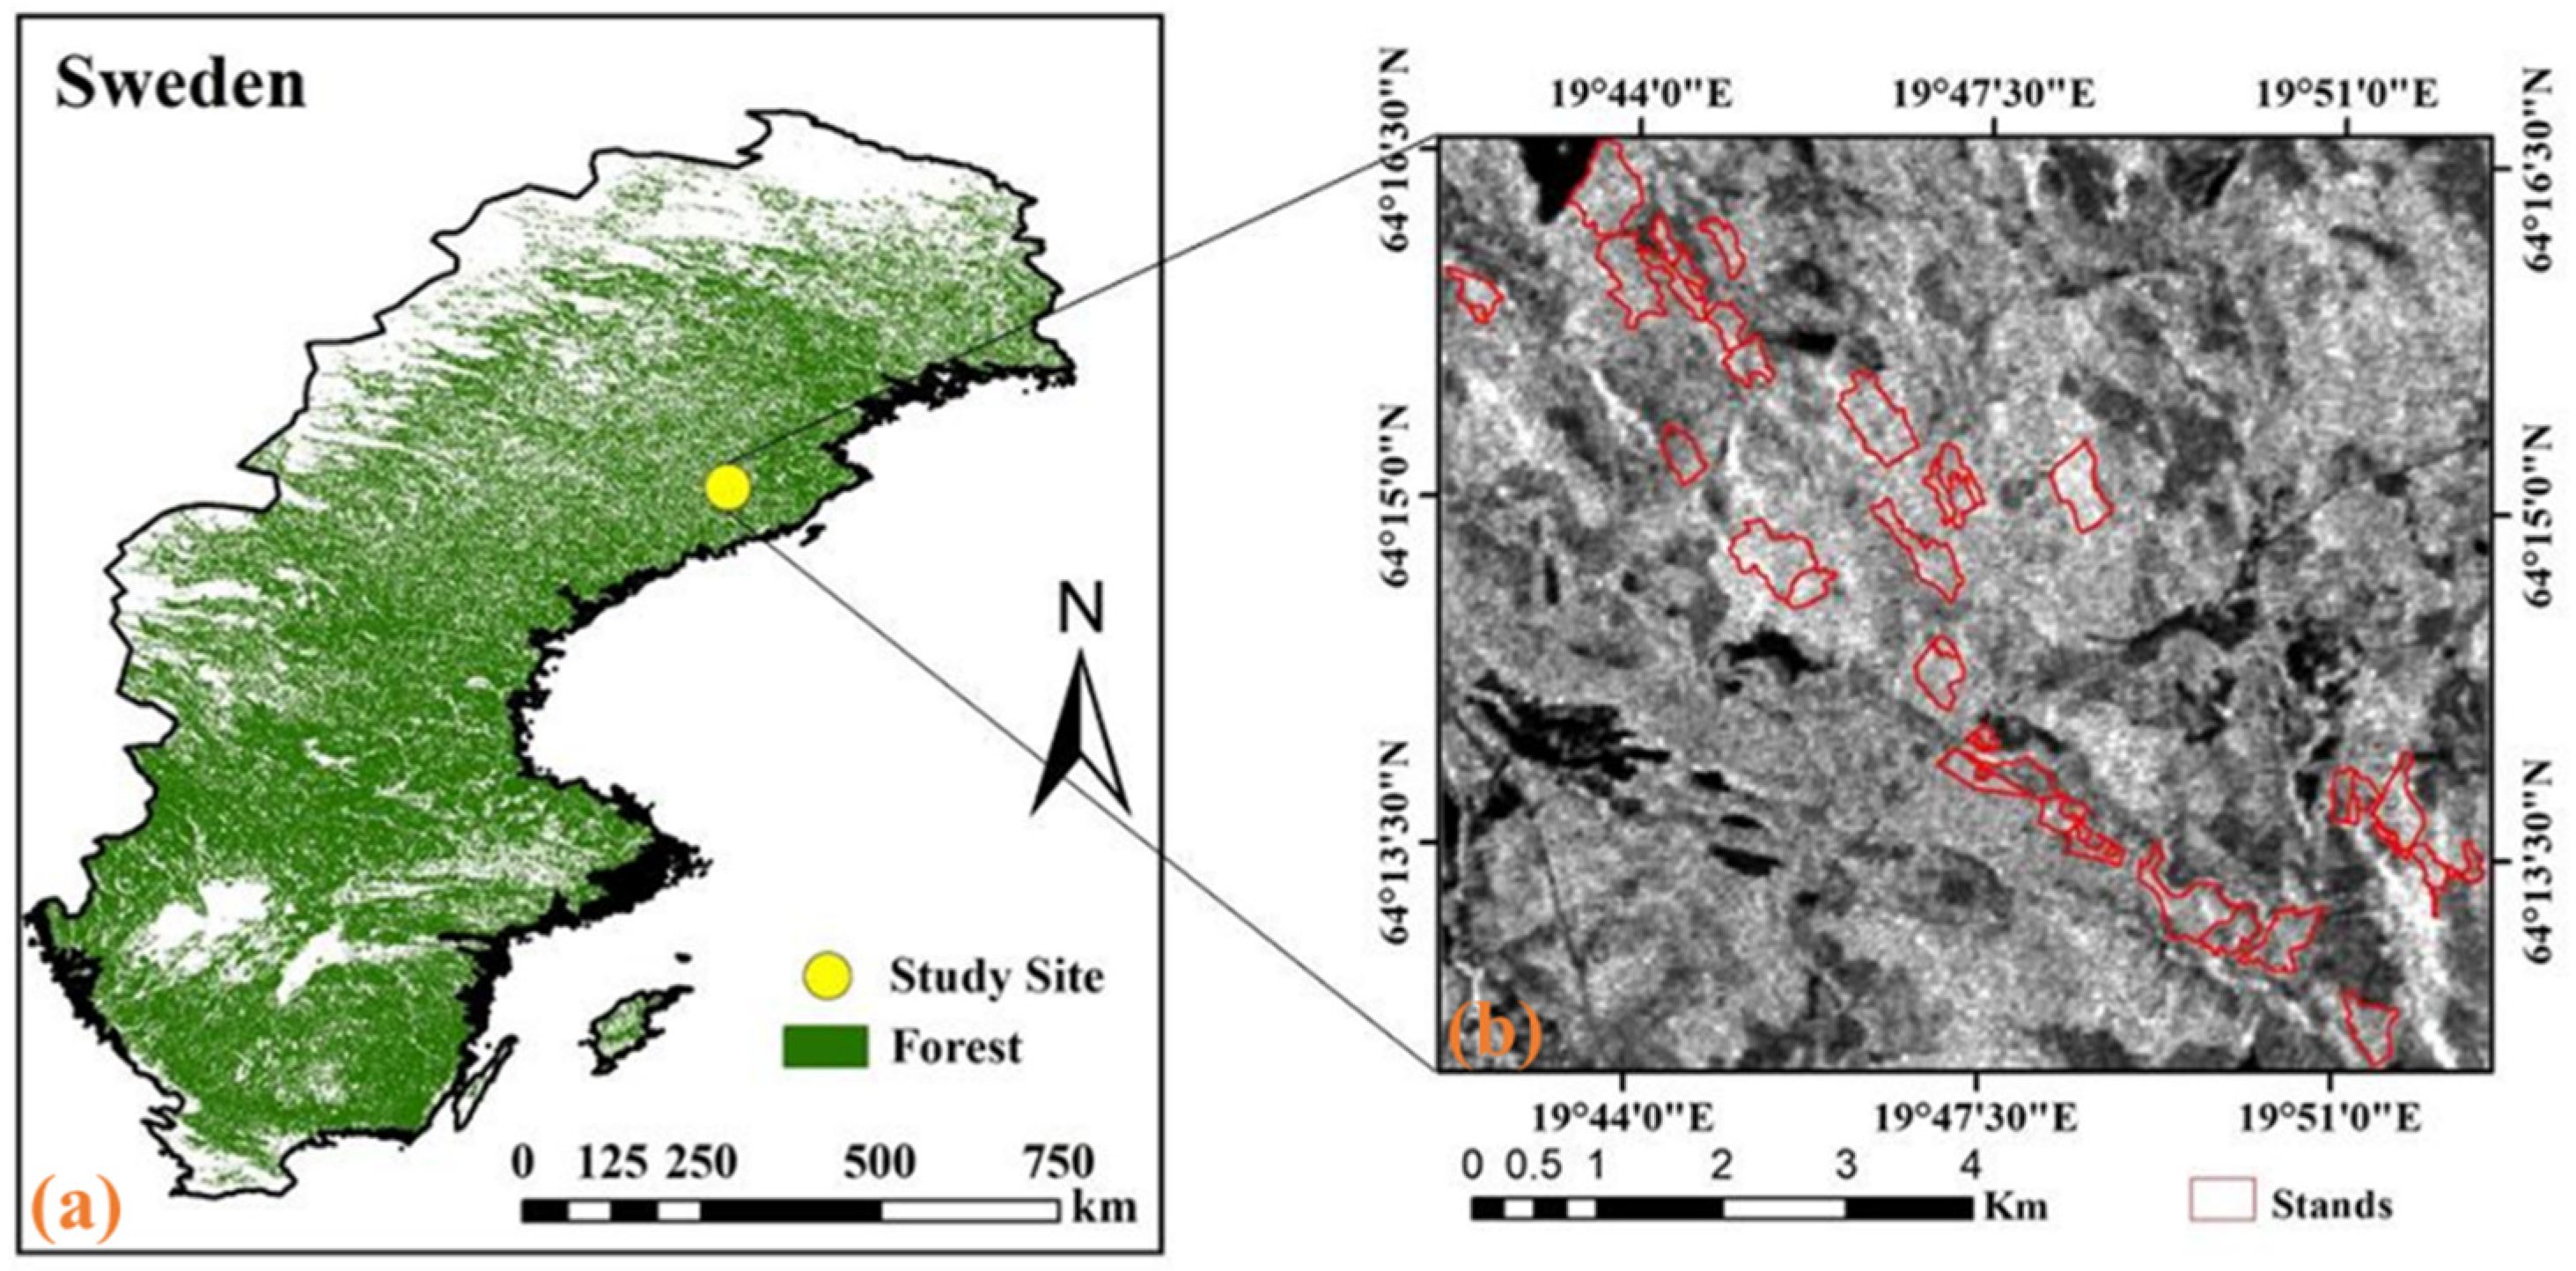
2.1. Study Site and Ground Measurements

The study area was selected in the forest region of Krycklan which is located in the boreal zone of Västerbotten county, northern Sweden (64°14′N, 19°46′E). This site covers 6800 ha in total, which is covered mostly by forests with scattered cropland and lakes. Pine, spruce, and birch are dominant tree species. The terrain is rugged, with an elevation between 125 and 350 m. The annual mean precipitation and temperature are 600 mm and 1 °C, respectively, and about half of the rainfall happens in snow.
Forest inventory data were obtained from the BioSAR campaign which was carried out in October 2008. The BioSAR-2008 dataset is available in the European Space Agency (ESA) Earth Observation campaigns (https://www.esa.int last access 10 December 2022). In the BioSAR-2008 dataset, a total of 31 forest stands were investigated, whose sizes range from 2.4 to 26.3 ha. Each stand is arranged with 10 circular sampling plots (radius 10 m). In each sample plot, the diameter at breast height (DBH) of all trees with a DBH > 4 cm were measured, and randomly selected 1.5 sample trees in average (according to the proportion of the basal area) to record their height and age. These field survey data were combined with allometric equations [42] to obtain different parts of fuel load (i.e., biomass fractions). The stand-level summaries of the data were obtained by averaging across all sampling plots. Detailed information about these field inventory data can be found in [43]. However, two of the 31 forest stands are located adjacent to the bare land which may distort the reflected signal. We eliminated these two stands since they were classified as non-forest in global forest/non-forest maps from ALOS PALSAR data [44], thus resulting in 29 forest stands shown in Figure 1.

2.2. Satellite Data

The surface reflectance product of Landsat 7 ETM+ with a spatial resolution of 30 m was applied as multispectral data in this study. To match the field inventory data, a preprocessed Landsat 7 ETM+ product (7 October 2008) was selected and downloaded from Google Earth Engine (GEE) [45]. However, the ETM+ data obtained after the 31 May 2003 has scan-line-off strips due to a problem in the scan line corrector system [46]. Part of the stands in this study were affected by the gaps. For these stands, all pixels away from data gaps were extracted and averaged. For those stands that are not affected, all pixels were extracted and averaged as the observed optical data of each stand. There was no stand wholly located in the gaps. We compared pixels for which data were missing and for which data were present by averaging coincident data in the Landsat VCF product. There was a high correlation between the scan-line gaps and surrounding pixels, and we concluded it was acceptable to average across stand polygons without the missing pixel data.
The ALOS (Advanced Land Observing Satellite) PALSAR (Phased Array type L-band Synthetic Aperture Radar) mosaic yearly product with slope-correction and ortho-rectification was used as spaceborne SAR data in this study [47]. We acquired the product of 2008 with a spatial resolution of 25 m from GEE. The working wavelength of 23.6 cm in the L-band makes the sensor signal more sensitive to forest structure and moisture characteristics thus more suitable for forest monitoring [48]. The digital numbers were converted to gamma naught ( γ 0 ) as follows [44]:
γ 0 d B = 10 × l o g 10 D N 2 83
where γ 0 is backscatter coefficient in d B unit and D N is the digital number. The gamma naught ( γ 0 ) in d B unit was converted to the linear unit:
γ 0 l i n e a r = 10 γ 0 d B 10
The average of the converted SAR data within each stand is taken as the observed SAR data of each stand.
Auxiliary data includes vegetation coverage and land cover data. The vegetation coverage data used in this study is Landsat Vegetation Continuous Fields (VCF). Sexton [49] generated this 30-m-resolution tree cover percentage dataset by rescaling the 250-m-resolution MODerate-resolution imaging spectroradiometer (MODIS) VCF product and combining Landsat optical data. The “tree_canopy_cover” band of this product refers to the percentage of wood vegetation with a height greater than 5 m above the horizontal ground. They provided four global products at the 30 m resolution in 2000, 2005, 2010 and 2015. Here, we acquired the 2010 epoch from GEE to match field data. The land cover data used in this study is GlobeLand30 (http://www.globallandcover.com/ last access 10 December 2022). GlobeLand30 is the first 30 m resolution global land cover data product with an overall accuracy of 83.5% [50,51], which includes 10 types of land cover, such as artificial surface, vegetation, etc. There are three products in 2000, 2010 and 2020, respectively. The product of 2010 was selected for this experiment and for more details about this product please refer to [51].

3. Methods

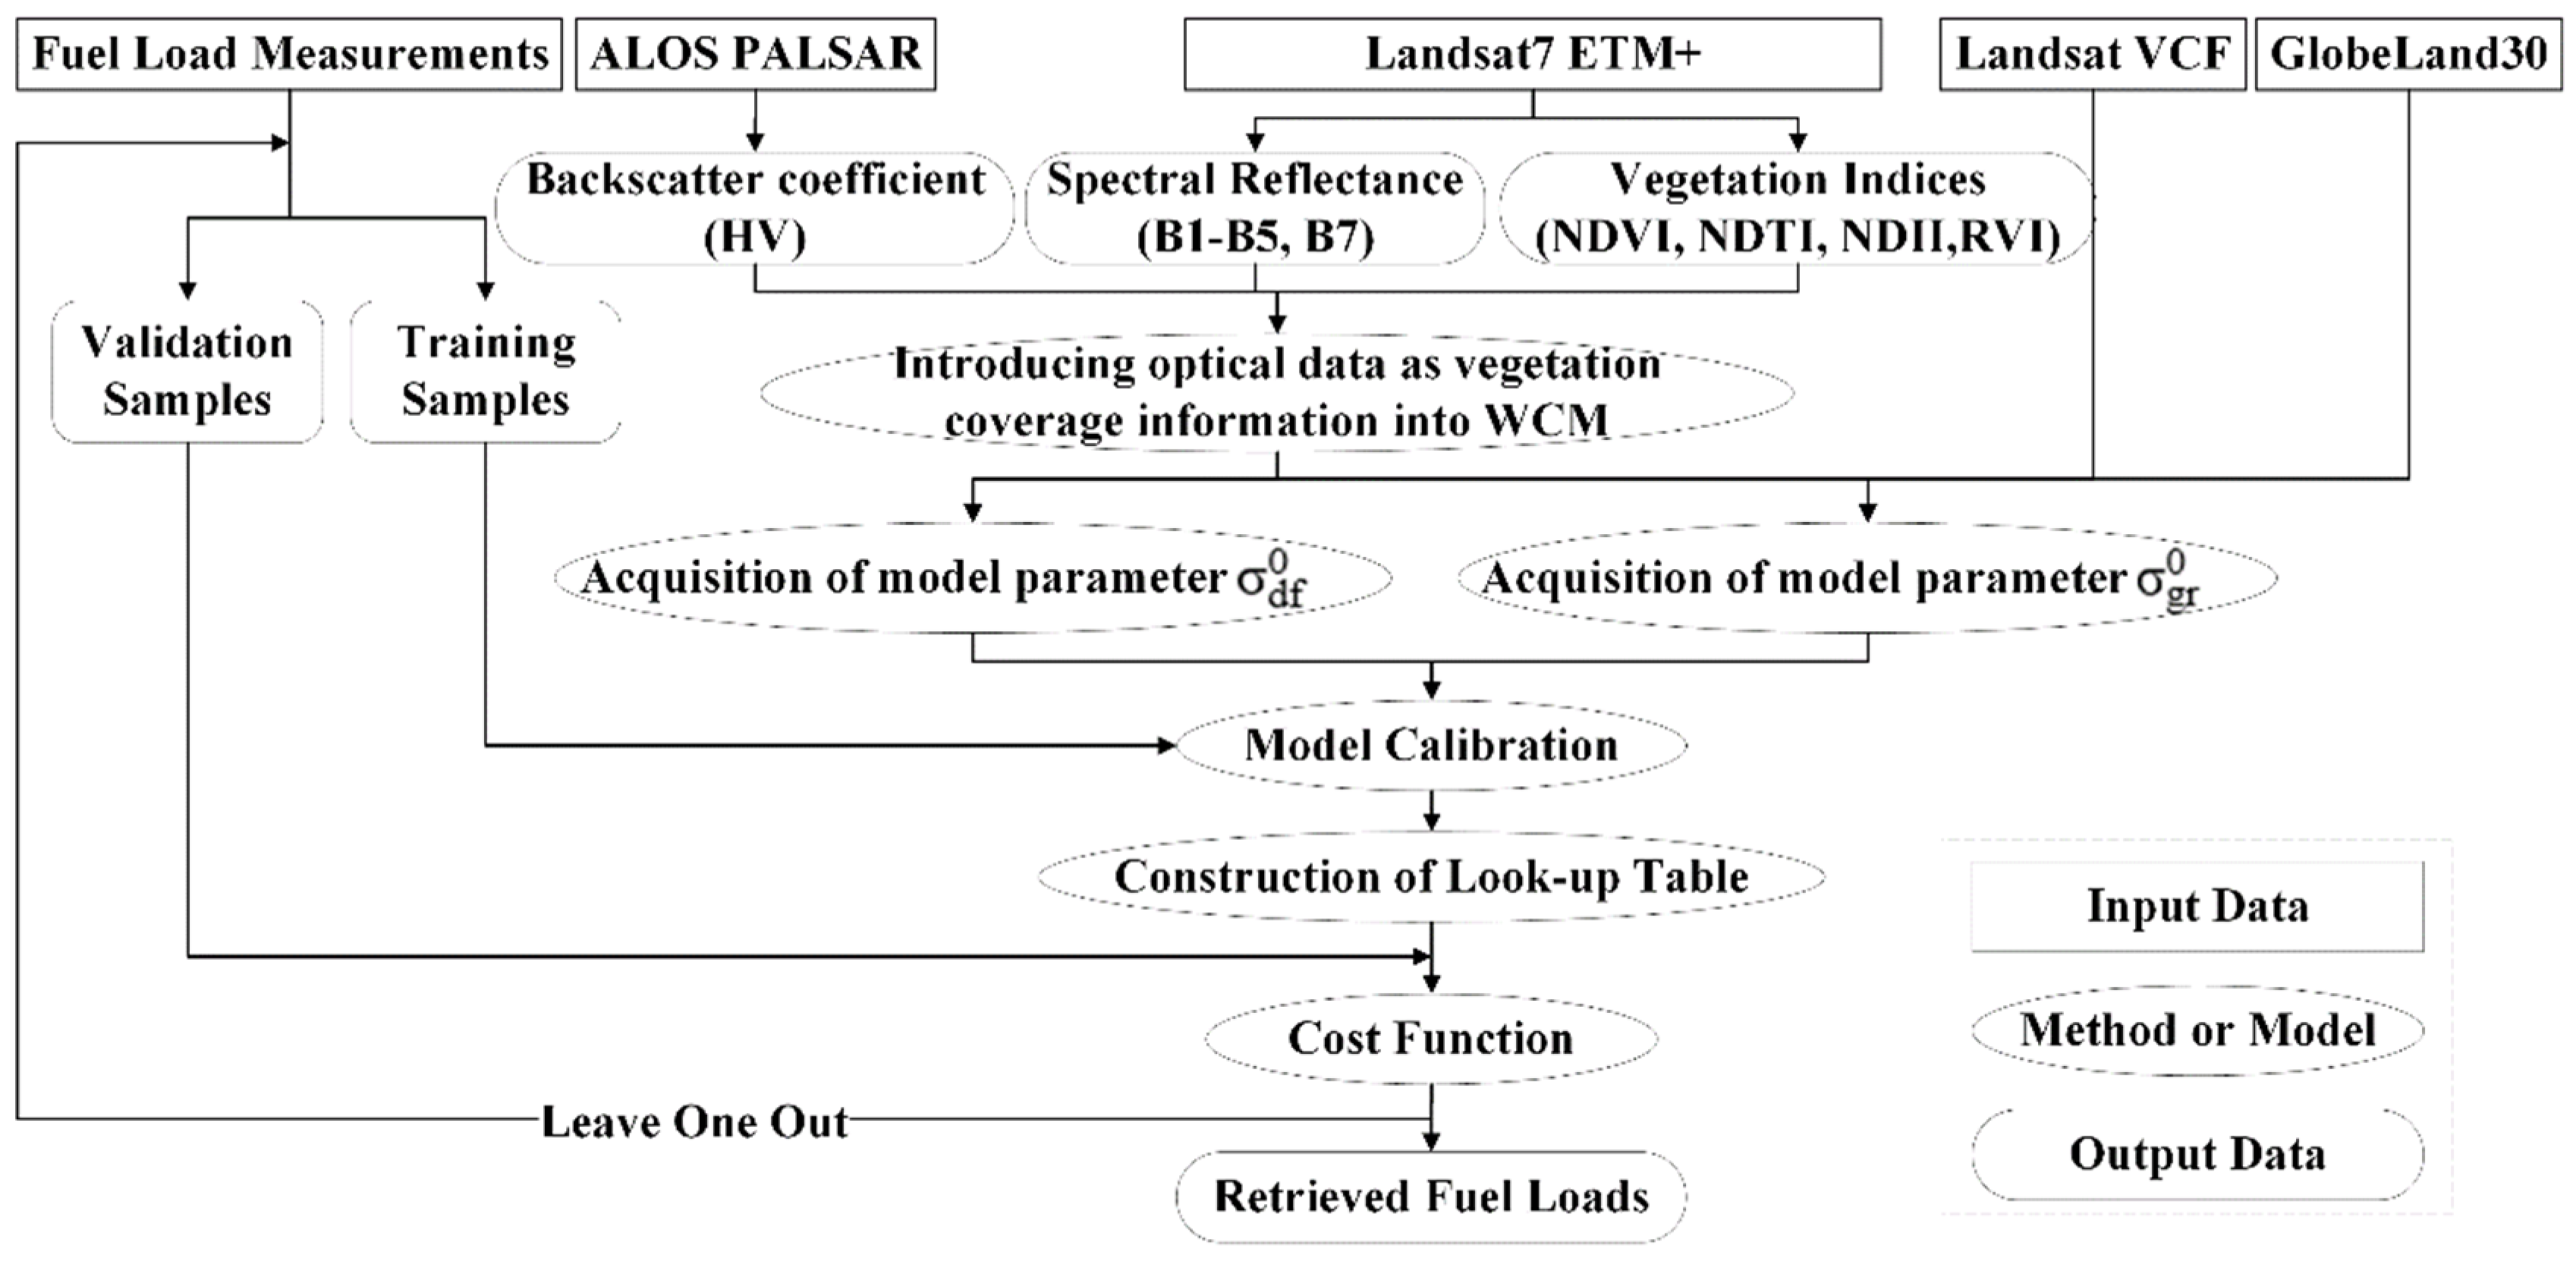
3.1. Water Cloud Model (WCM)

The methods for vegetation parameter inversion based on remote sensing include physically based models, empirical models (statistical relationships), and semi-empirical models. Physical models are robust and transferable but have limitations in application due to their complicated calculations [52]. Empirical models are straightforward and widely used, but they lack physical meaning and are highly conditioned on local data [53,54]. The semi-empirical models integrate the empirical presentations with the physical model which sidestep the non-transferability obstacles of empirical methods and the complexity of physical models [55].
Therefore, the semi-empirical model (i.e., WCM) was applied in this study to simulate the scattering mechanisms of the forest. The L-band SAR data used in this experiment has a larger wavelength than the size of leaves, thus it can completely penetrate the forest canopy and receive signals below the canopy [56,57]. Since the L-band SAR data has strong penetration, an extended water cloud model which considering the canopy cover was used to supplement the contribution of gaps in forests to total backscatter [58]. In this model, the total backscatter is the sum of three parts:
σ t 0 = 1 f v c σ g r 0 + f v c σ g r 0 e α h + f v c σ v e g 0 1 e α h
The first part represents the direct ground scattering through forest gaps. The second part represents ground scattering attenuated by forest coverage. The last part represents direct scattering from vegetation. f v c , σ g r 0 and σ v e g 0 are fractional vegetation coverage (the percentage of horizontal ground covered by vegetation), ground backscatter coefficient, and vegetation backscatter coefficient, respectively. e α h describes the two-way tree transmissivity which is exponentially related to α (the two-way attenuation per meter of tree canopy) and h (the thickness of vegetation layer).
By combining the similar items of Equation (3), it can be expressed by a simpler form:
σ t 0 = σ g r 0 T f o r + σ v e g 0 1 T f o r
T f o r = 1 f v c + f v c e α h
where T f o r describes the forest transmissivity. In biomass estimation, T f o r can be replaced with a biomass related function [52]:
σ t 0 = σ g r 0 e δ B + σ v e g 0 1 e δ B
where δ is the forest transmissivity parameter and B is aboveground biomass. In the forest with gaps, additional compensation for σ v e g 0 is necessary since the backscatter from the forest still contains a certain contribution of ground. Equation (6) can be inverted to get σ v e g 0 from those so-called “dense-forest” pixels backscatter σ d f 0 and biomass value of “dense-forest” class B d f :
σ v e g 0 = σ d f 0 σ g r 0 e δ B d f 1 e δ B d f

3.2. Semi-Empirical Modelling for Combining Optical and SAR Data

3.2.1. Limitation of WCM

In previous applications of WCM presented in Section 3.1, SAR is the only remote sensing data source used to calibrate the model and retrieve the target parameters. The single parameter ( δ ) that needs calibration in WCM can be expressed as the following equation according to Equations (4)–(6):
δ = 1 B ln 1 f v c + f v c e α h
For each determined biomass value ( B ), the forest transmissivity ( δ ) can be further abstracted as the following functional relationship:
δ = F f v c , α , h
That is, the forest transmissivity coefficient which describes the trend of backscatter with the increase of biomass is determined by three physical variables: fractional vegetation coverage ( f v c ), two-way signal attenuation ( α ), and vegetation layer thickness ( h ). The last two variables can be indicated by SAR well. However, SAR shows a relatively weak representative ability of f v c compared to optical data. On contrary, many studies have used optical data to derive vegetation coverage since optical information (including spectral reflectance and vegetation indices (VIs)) is sensitive to vegetation coverage [59,60,61,62,63,64,65,66].

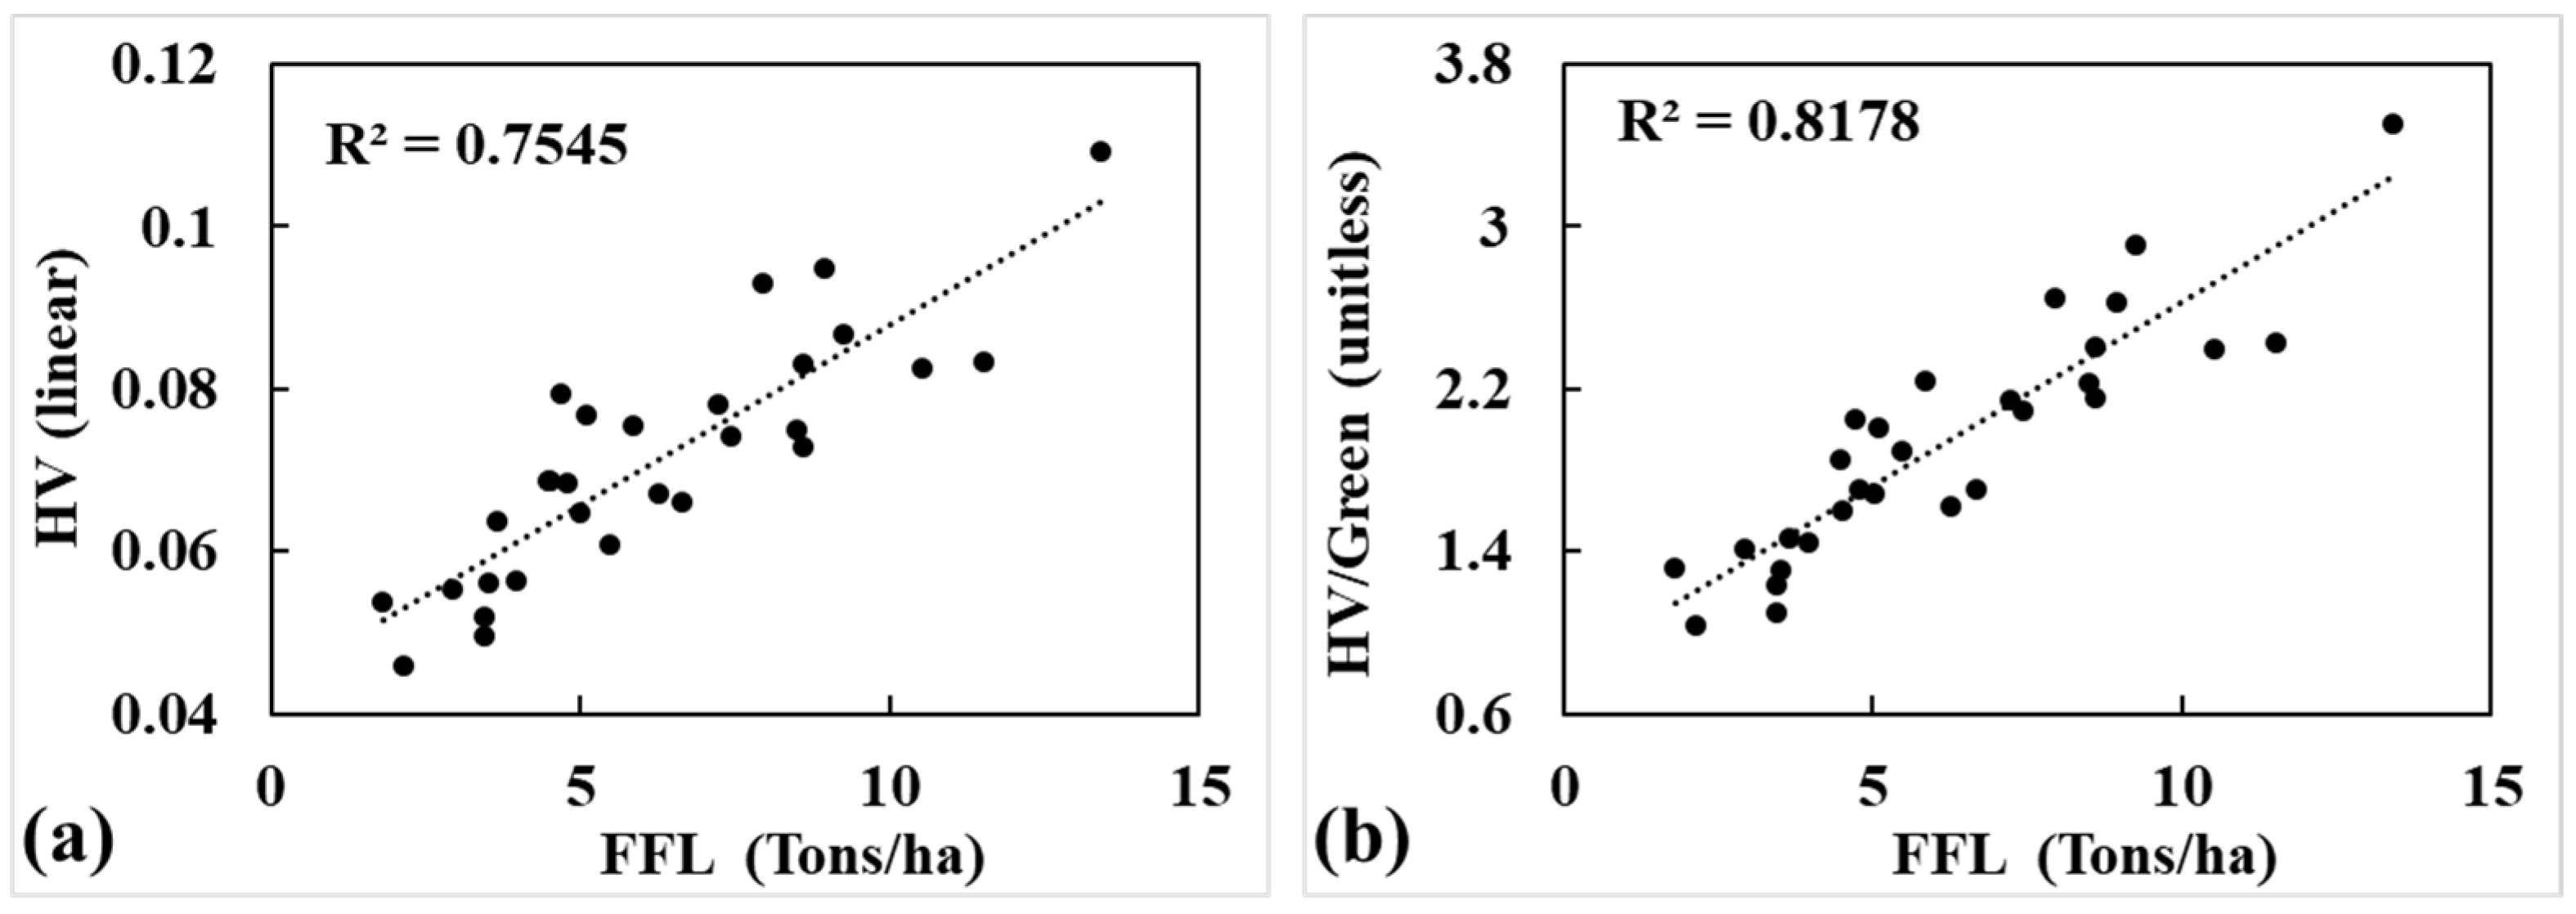
3.2.2. Vegetation Coverage Information Expressed by Optical Data

The optical reflectance signal from vegetation canopy is composed of both soil information and vegetation information which can be divided by vegetation coverage [67,68].
R t o t a l = f v c R v e g + 1 f v c R s o i l
where R t o t a l , R v e g and R s o i l represent the total reflectance, the pure vegetation reflectance, and the pure soil reflectance, respectively. Hence, the vegetation coverage can be derived inverting Equation (10) [66,69]:
f v c = R t o t a l R s o i l R v e g R s o i l
It should be noted that the pure soil reflectance and the pure vegetation reflectance can be considered as constant in a certain study area [61]. Therefore, Equation (11) can be simplified as:
f v c = a R + b
where a and b are constants in the study area and R is the optical information of pixels including spectral bands and VIs.
In addition, according to Equation (10) and WCM, the forest transmissivity of optical data can be expressed as:
T f o r = 1 f v c
Similar to WCM described above, here the forest transmissivity of optical data can be replaced by an exponential function of biomass:
T f o r = 1 f v c = e τ B
where τ expresses the forest transmissivity of optical data and B is aboveground biomass. Then, the vegetation coverage can also be expressed as:
f v c = 1 e τ B

3.2.3. Introducing Optical Data as Vegetation Coverage Information into WCM

This study introduces optical data as vegetation coverage information into WCM. Assuming that can enhance the model’s ability to simulate ground reflection signals in dense forest areas by supplementing vegetation coverage information.
Here, the vegetation coverage is introduced into WCM first:
σ t 0 f v c = [ σ g r 0 e δ B + σ d f 0 σ g r 0 e δ B d f 1 e δ B d f   1 e δ B ] f v c
where ⊗ represent any one of the four arithmetic (i.e., addition, subtraction, multiplication, and division) and f v c is vegetation coverage. Then, the new model is obtained by express f v c using optical data:
σ t 0 R = [ σ g r 0 e δ F + σ d f 0 σ g r 0 e δ F d f 1 e δ F d f   1 e δ F ] 1 b e τ F a
where σ t 0 , σ g r 0 and σ d f 0 represent the total backscatter, the ground backscatter, and the dense vegetation backscatter, respectively; R is optical information including spectral bands and VIs; F d f and F are “dense forest” fuel load and fuel load, respectively; a, b, δ, and τ are the four empirical coefficients in the new model.

3.3. Model Calibration and Fuel Load Retrieval

For the calibration of the new model expressed in Equation (17), there are seven unknowns to be determined: σ g r 0 , σ d f 0 , a, b, τ, δ and F d f . σ g r 0 represents the backscatter coefficient of the surface without vegetation cover (i.e., ground) and σ d f 0 is the backscatter coefficient of dense vegetation cover. The specific calibration will be described in detail later. The other parameters (i.e., a, b, τ, and δ) related to the forest structure characteristics were optimized by the non-linear Levenberg–Marquardt algorithm [70]. F d f is the fuel load value of the “dense forest” class. Here, we selected the 90 percentile of fuel load value in our study area as F d f according to [52,71].
The acquisition of σ g r 0 needs auxiliary data including Landsat VCF product and GlobeLand30 to ensure the reliability of the selected candidate “ground” pixels, since non-soil or non-vegetation pixels (such as water body, impervious surface, etc.) may cause fluctuation of backscatter coefficient, resulting in distorted σ g r 0 . Considering there are very few pixels with vegetation coverage of zero after excluding non-soil or non-vegetation pixels, the pixels with vegetation coverage less than 25% were also included in candidate “ground” pixels. Taking the study area as the center, all pixels within the radius of 250 pixels that match the above conditions were selected. The median value of the backscatter coefficient of all selected pixels was taken as σ g r 0 since the median value can represent the centralized trend of data.
The acquisition of σ d f 0 is similar to σ g r 0 . The corresponding Landsat VCF product of the study area should be used as auxiliary data. By selecting the pixels with vegetation coverage greater than 70%, the median value of all pixels was taken to represent the reflection signal under dense vegetation coverage in the study area.
Since the data were under constraints of limited size, the leave-one-out cross-validation (LOOCV) method [72] was used to validate the new model. In the LOOCV method, each sample was excluded one by one, and the model is calibrated with the remaining samples to predict the excluded sample.
The new model has no corresponding numerical solution. Thus, the look-up table (LUT) methodology was applied to acquire the optimal fuel load from the observed RS data. To build the LUT, the calibrated model was executed forward with one input (i.e., fuel load value) to generate simulated RS data. The range of fuel load value in LUT was set according to field FLAGL measurements.
After the completion of LUT, the fuel load was retrieved through a cost function that quantized the similarity between the simulated and observed signals to search out the best-fitted simulated RS signal in LUT with the observed one. In this experiment, we used the absolute difference as the cost function:
M A E r = μ s i m μ o b s
where μ s i m and μ o b s represent the simulated and observed RS data, respectively.
The determine coefficient (R2, Equation (19)), root mean square error (RMSE, Equation (20)) and relative RMSE (RMSEr, Equation (21)) were used as accuracy indicators for models:
R 2 = i = 1 n P i P ¯ O i O ¯ i = 1 n P i P ¯ 2 i = 1 n O i O ¯ 2
RMSE = 1 n i = 1 n P i O i 2
RMSEr = RMSE   O ¯
where P i and O i represent predicted and observed fuel load, respectively, P ¯ and O ¯ represent the mean of predicted and observed fuel load, respectively, and n is the sample size.

3.4. Comparison Experiments
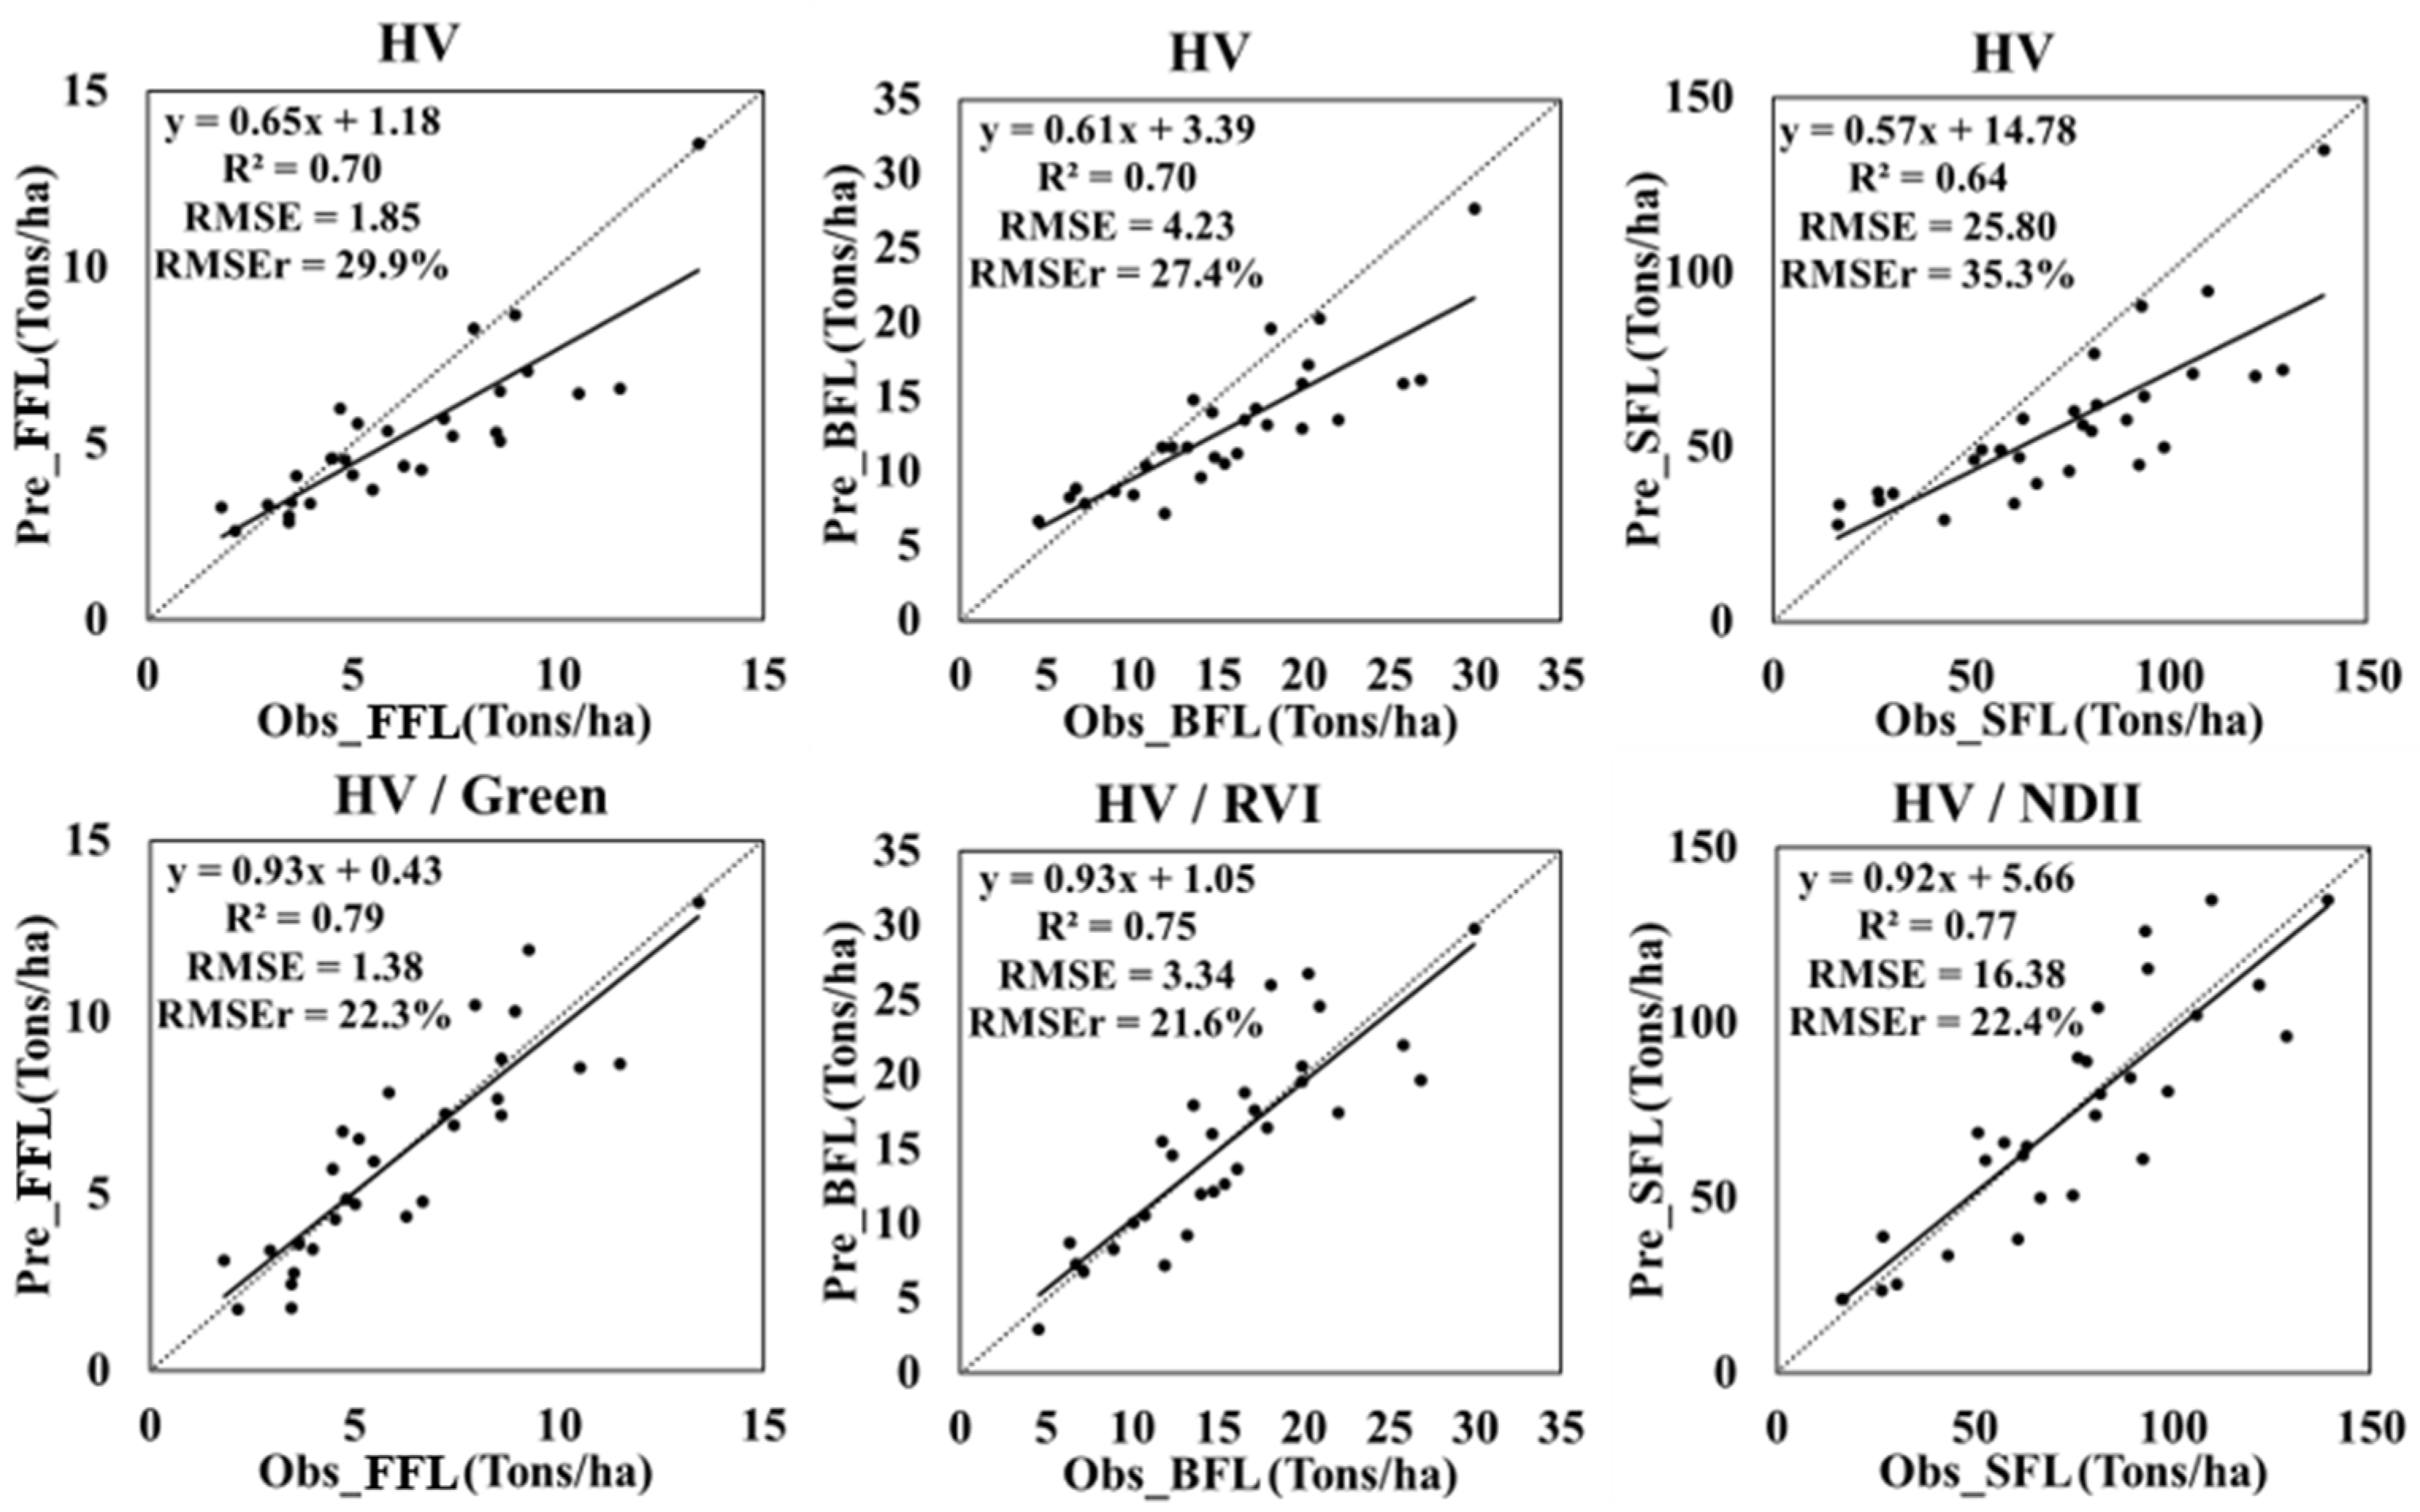
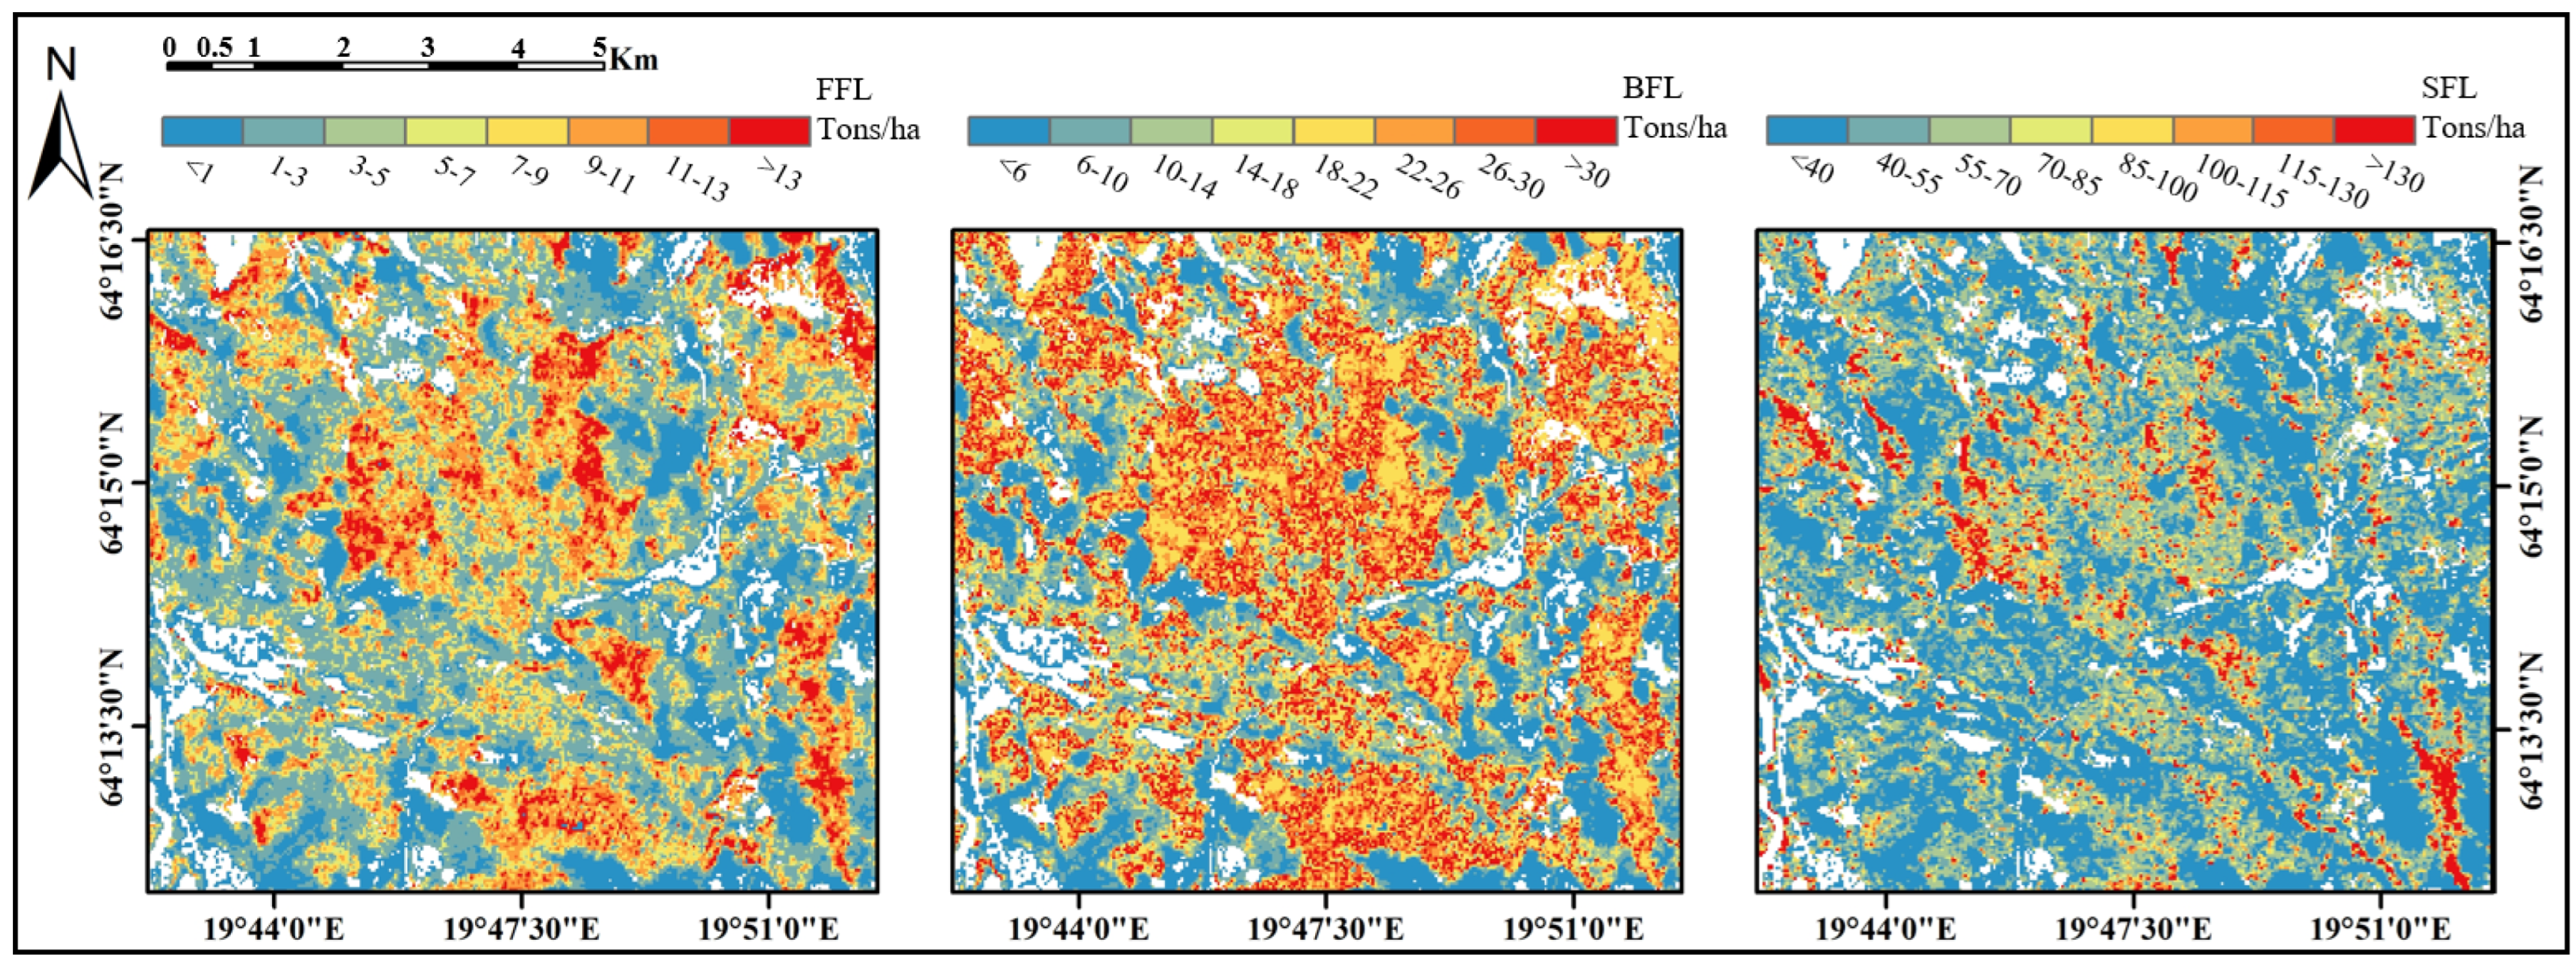
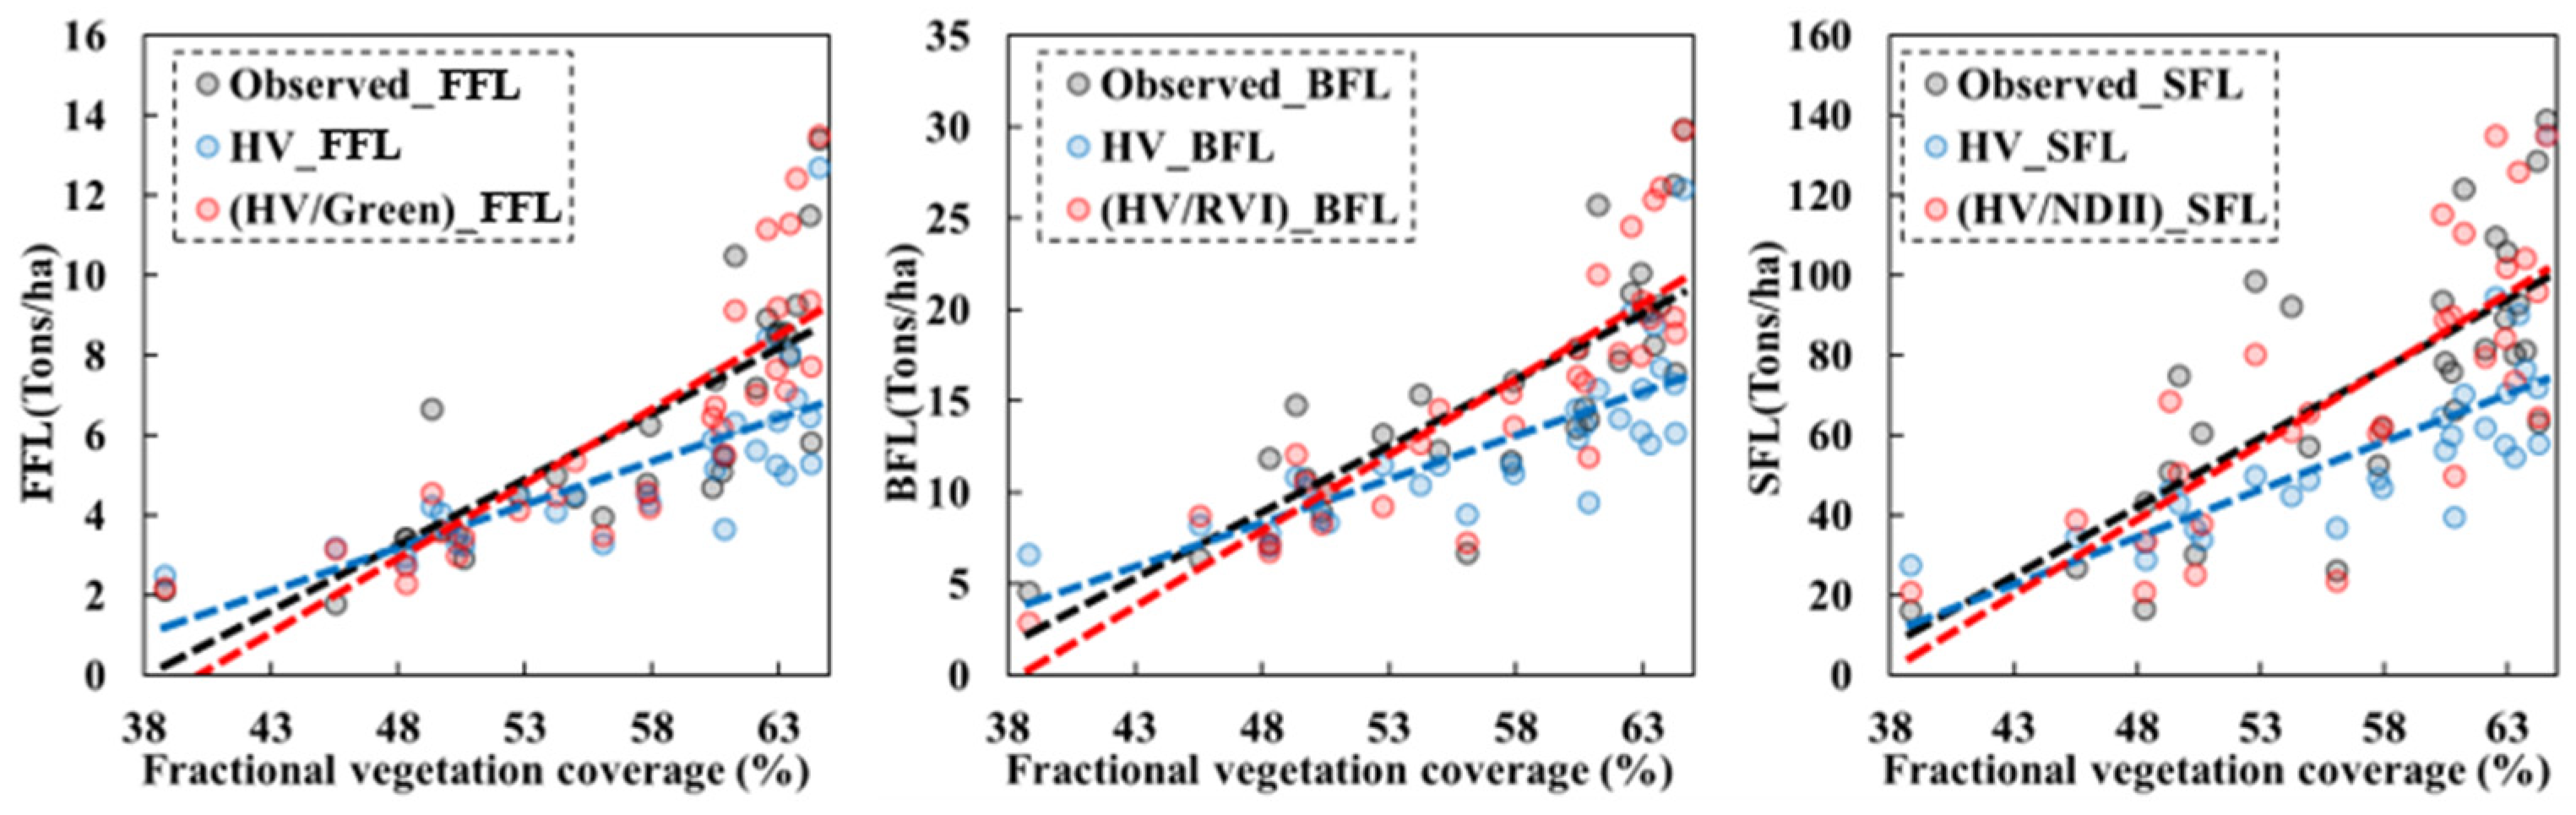
In this study, the WCM with L-band spaceborne SAR data was first applied to FLAGL (above-ground forest fuel loads, indicating FFL, BFL and SFL) inversion. Further, the new model was developed to retrieve FLAGL by introducing optical data as vegetation coverage information into WCM. Performances of WCM and new model were adequately verified using the leave-one-out cross-validation (LOOCV) method. The flowchart of the new model for FLAGL estimation from SAR and optical data is illustrated in Figure 2.
In addition to the six spectral bands of Landsat, four VIs were also selected for new model exploration in this study. The VIs including Normalized Difference Infrared Index (NDIISWIR2) [73], Normalized Difference Tillage Index (NDTI) [74], Normalized Difference Vegetation Index (NDVI) [75], and Ratio Vegetation Index (RVI) [76] are listed in Table 1. The composition of NDIISWIR2 and NDTI both contain short wave infrared band, which indicates the vegetation water content and dry matter situation well [54,77,78,79]. NDVI composed of Red and NIR bands with minimal water absorption is also sensitive to vegetation coverage thus a good indicator of vegetation biophysical variable [54,80]. RVI that defined as the ratio of Green band to Blue band here since chlorophyll absorbs red and blue light, reflects green light and carotenoids also absorb blue light [81].
Based on the 10 optical variables (spectral bands and vegetation indices) in this paper, we explored all the possible combinations. To verify the effectiveness of the proposed algorithm, the experimental results were compared with those before the introduction of optical data. A total of 41 experiments were conducted in this study (Table 2).

4. Results

The performance of FLAGL inversion using WCM with SAR is shown in Table 3. It can be found that the WCM with HV polarization of L-band spaceborne SAR data has potential in FLAGL inversion with reasonable performance (R2 = 0.64 or higher).
The quantitative estimation of FLAGL can be further improved by adding optical information with the new model. The performances of new models that performed better than WCM are listed in Table 4. It can be found that there are many new models that perform better than WCM through introducing optical data as vegetation coverage information into WCM (R2 increased by 0.05–0.13 and RMSEr decreased by 5.8–12.9%).
For foliage fuel load, when SAR data were used alone for inversion, R2 is 0.70 and RMSE is 1.85 Tons/ha (Table 3). Almost all optical data can be fused with HV backscattering coefficient to improve accuracy (Table 4). The R2 was increased from 0.70 to 0.79 and the RMSEr was decreased from 29.9% to 22.3%. Taking the Blue band as an example, among all the four combination ways of HV and Blue band (addition, subtraction, multiplication, and division), both the inversion performance of ‘HV-Blue’ and ‘HV/Blue’ are better than that of single HV, so as to other optical variables. In other words, the addition of any optical information in this study will certainly improve the retrieval results of FFL since leaves are distributed in the forest canopy, and the multispectral signals can reflect the density of green vegetation and biochemical characteristics of leaves such as leaf type, chlorophyll, etc. Among all the inversion results of FFL by new model, ‘HV/Green’ is the best (R2: 0.79; RMSE: 1.38 Tons/ha; RMSEr: 22.3%), as shown in bold underlined of Table 4.
For branch fuel load, when SAR data were used alone for inversion, the performance was similar to FFL with R2 of 0.70 Tons/ha and RMSE of 4.23 Tons/ha (Table 3). As for the new model, the most optical information can be suitably integrated with HV backscatter which reduced RMSE especially the Green band and RVI, indicating that the addition of optical information improves the performance of WCM for forest backscatter simulation. The reason is that optical data is sensitive to vegetation coverage, as described in Section 3.2. Among all the results obtained by the new model, ‘HV/RVI’ is the best (R2: 0.75; RMSE: 3.34 Tons/ha; RMSEr: 21.6%), as shown in bold and underlined in Table 4.
For stem fuel load, the performance of WCM with HV backscatter alone was worse than BFL or FFL (Table 3), while two kinds of sensor information compensate each other well especially SAR data and optical vegetation index (Table 4). Specifically, a single multispectral band has little effect on SFL inversion, while VIs selected in this study have a more obvious effect. Among all new model inversion results of SFL, ‘HV/NDII’ is the best (R2: 0.77; RMSE: 16.38 Tons/ha; RMSEr: 22.4%), as shown in bold and underlined in Table 4.
More detailed information about the best results of FLAGL inversion using WCM and the new model is shown in Figure 3. For FLAGL retrieved by HV backscatter alone using WCM (the first row in Figure 3), the dispersion of observed fuel load and predicted by WCM is scattered, and there is a distinct underestimation at the high value. The R2 ranges from 0.64 to 0.70 while the RMSEr ranges from 27.4% to 35.3%. The fusion of optical information and HV polarization using the new model effectively alleviated the underestimation of high value and improved the model performance (R2 ranges from 0.75 to 0.79 while the RMSEr ranges from 21.6% to 22.4%).
Based on the optimum models, we derived the spatial distribution of FLAGL in study area and shown in Figure 4. Considering the scan-line-off strips in Landsat 7, we filled these gaps using ENVI 5.3 software before mapping to make the final fuel load map spatially continuous. The product was masked by the GlobeLand30 to exclude those non-forest areas. It can be found that the distribution of these three types of fuel loads in space presents a good consistency.
The performances of WCM and new model with different vegetation coverage are shown in Figure 5. The observed and predicted fuel loads by WCM and new model were sorted by fractional vegetation coverage. The black dots, blue dots, and red dots are observed fuel loads, predicted fuel loads by WCM, and predicted fuel loads by the new model, respectively. The dotted lines of corresponding colors are the trend lines fitted by these points. It can be found that with the increase in vegetation coverage, the fuel load shows an upward trend. Particularly, the trend of the red line (predicted fuel loads by new model) is more similar to that of the black line (observed fuel load) than the blue line (predicted fuel loads by WCM). Moreover, the WCM using HV alone shows an underestimation problem in the case of dense fuel loads especially when FFL > 4 Tons/ha, BFL > 10 Tons/ha, and SFL > 30 Tons/ha. However, the new model can effectively alleviate this problem by introducing optical data as vegetation coverage information into WCM. Specifically, the new model did not exhibit any underestimation even when vegetation coverage reached 65% and the total FLAGL reached about 183 Tons/ha.

5. Discussion

5.1. Significance of this Study and Analysis with Previous Studies

FLAGL are generally affected by fire [18] and play an important role in the assessment of fire-related factors [23,24,25,26]. However, there are few previous studies on the quantitative inversion of fuel load using spaceborne SAR data. In fact, previous studies have shown high sensitivity of SAR on forest biomass components and stand structure [82,83,84,85,86]. In particular, the long band electromagnetic waves are sensitive to forest biomass and water content thus can be used as a direct measurement of forest biomass and structure [87], thus derived many successful applications of SAR in above-ground biomass estimation [52,88,89,90,91]. The results in this study are consistent with previous studies that SAR can be a good indicator of FLAGL (i.e., biomass components) with R2 is 0.64 or higher and RMSEr is 35.3% or lower. The reason of this result may due to the strong penetration ability of SAR signals and its ability to characterize forest vertical structure [87].
However, single SAR data-based biomass estimation studies exhibited different saturation levels limited to forest types, sensor characteristics, and other factors [82,92]. That is, the sensitivity of backscatter signal to biomass decreases when the vegetation coverage reaches a certain biomass density [93]. To overcome such limitations, SAR and optical data were synergized to estimate biomass using empirical methods [91,94,95]. Indeed, multispectral signals can reflect the density of green vegetation and biochemical characteristics of leaves such as leaf type, chlorophyll, etc. Thus, the combination of two types of data performs better than single data, which can effectively enhance the saturation point of dense vegetation area [96,97].
Following previous studies, this study developed a semi-empirical retrieval method of above-ground forest fuel load (FLAGL, indicating FFL, BFL, and SFL) estimation by introducing optical data as vegetation coverage information into WCM. Results showed that the new model which combines optical information and SAR data performed better than WCM using spaceborne SAR data alone (R2 increased by 0.05–0.13 and RMSEr decreased by 5.8–12.9%). In addition, the new model did not exhibit any underestimation even when vegetation coverage reaches 65% and the total FLAGL reaches about 183 Tons/ha. These results are also consistent with previous studies that the integration of SAR and optical data can alleviate the saturation problems [96,97]. The optical data is helpful to fitting forest transmissivity parameter because of its sensitivity to vegetation coverage, thus simulating remote sensing signals realistically. It is expected that this method can be applied in forest fire prevention and control in the future by providing spatiotemporal continuous distribution information of fuel load.

5.2. References for Subsequent Fuel Load Research

For FFL, it can be found that all optical variables selected in this study combined with HV polarization appropriately can effectively improve the inversion (e.g., increased R2 or decreased RMSE), especially the Green band. Since the vegetation cover type of the study area is evergreen coniferous forest, even in autumn or winter, the leaves still contain chlorophyll, which has strong reflection characteristics to green light. For BFL, most fused data in proper combination mode contribute to inversion by decreasing RMSE, especially the SWIR band and RVI. For SFL, the combination of VIs and HV is better than that of spectral bands. Most VIs selected in this experiment contribute to SFL inversion since they are composed of near-infrared and short wave infrared which correlated to biomass [98]. The best performance of SFL inversion is “HV/NDII” since NDII is composed of NIR and SWIR2 bands which can indicate the vegetation water content and dry matter status [54,77,78,79].
On the whole, the WCM with L-band spaceborne SAR data has great potential in FLAGL estimation. Although WCM exhibits an underestimation problem in dense mature forests, it performed well in sparse young forests. The addition of optical information effectively alleviates this problem, and has the most obvious effect on improving FFL, followed by BFL and SFL. This may be because leaves are distributed in the canopy and affect spectral reflectance by the physical scattering of light and the radiation energy absorbed by chemical absorption. Scattering is caused by the optical inhomogeneity of the plant surface and cell internal structure. Absorption is caused by pigments in visible light, water, and other biochemical substances such as cellulose, lignin, starch, and protein in the infrared band [99]. Although it is difficult for optical signals to penetrate the forest canopy to detect stem due to their limited penetration ability, the addition of optical data still improved the accuracy of SFL inversion. This may be attributed to the optical data supplemented the vegetation coverage information in WCM. Moreover, the optical remote sensing data has a high temporal resolution which could describe the phenological character of vegetation and indicate the vegetation coverage well. Therefore, the addition of optical data can enhance the ability of new models in simulating the remote sensing signal of landscapes and effectively improve the estimation accuracy of FLAGL.

5.3. Sources of Error and Uncertainty

There are some sources of uncertainty in this experiment. The field data calculated through forest structure parameters and allometric equations may introduce some error, since the allometric equations were derived from statistical relationships of limited field data which cannot describe all trees characteristics. The selection of “ground” candidate pixels may also introduce errors, since those pixels with less vegetation covered may be also selected as an approximation of pure “ground” pixel. In addition, the field data used in this study did not provide any soil moisture or information during sampling, which are determinants for radar backscatter. So, considering the uncertainties may be caused by soil moisture, we only selected the HV polarization to perform models in this study. In the HV polarimetric channel, volume scattering is the dominant scattering mechanism, and its scattering center of the interferometric phase is closer to the vegetation canopy top than that of the HH channel. The contribution of the ground layer is less important than that of the vegetation layers in HV polarimetric channel [100,101,102,103,104,105]. In future work, we will try to quantitatively consider the soil moisture in fuel load estimation by SAR (including cross and co-polarizations). The application of SAR data still needs a lot of work. In addition to the soil moisture, there is also the interference of rainfall and wind speed on SAR observation signals, especially in the analysis of time series SAR data [106,107]. In the future fuel load estimation work, we will further take these factors into account.

5.4. Model Operation and Optimization

The models in this study are semi-empirical models, which means that the model operation and optimization were all dependent on field data. Therefore, we divided the field measurements into calibrate data and validate data first. Then, the parameters in the models were calibrated by the calibration data. The model performance was validated by the validation data. During the LOOCV process, the parameters were decided by 28 groups of field data each time. That is, these parameters were determined by the calibration data without any artificial influence. Specifically, these parameters were fitted by the non-linear Levenberg–Marquardt algorithm which provides a unique solution for certain calibration data. In fact, the calibration of these parameters is definitely a process of optimization. Because the non-linear Levenberg–Marquardt algorithm is actually a parameter optimization algorithm, it can provide the most optimized parameters by fitting the model with the calibration data. That is, the parameters fitted by non-linear Levenberg–Marquardt algorithm were indeed the optimal one under the giving calibration data. To sum up, the calibration and optimization of parameters is the same process, which is completed and determined by the non-linear Levenberg–Marquardt algorithm and the calibration data.
The inversion results of the forest fuel load also show that the calibration of the parameters meets expectations. In addition, the combination of SAR and optical data has better correlation performance than single SAR data. Take the Green band and FFL as an example, the R2 is higher when combined with the HV and Green band (Figure 6).

6. Conclusions

Fuel load is a critical factor in fire ignition, spread, and intensity. Few previous studies used spaceborne SAR data to estimate fuel load. This study explored the potential of spaceborne L-band SAR data in live fuel load estimation using WCM and achieved reasonable performance (R2 = 0.64 or higher and RMSEr = 35.3% or lower). However, the results of using WCM exhibited the underestimation phenomenon in dense mature forest. We presented a new model by introducing the optical data as vegetation coverage information into WCM, since the multispectral signals can reflect the density of green vegetation and biochemical characteristics of leaves such as leaf type, chlorophyll, etc. The new model performs better than WCM in FLAGL inversion with R2 increased by 0.05–0.13 and RMSEr decreased by 5.8–12.9%. Besides, the new model did not show any underestimation problem even when vegetation coverage reaches 65% and the total FLAGL reaches about 183 Tons/ha. Specifically, the addition of most optical parameters (e.g., bands or VIs) especially the Green band in this study could certainly improve the inversion results of FFL since leaves are distributed in the forest canopy. As for BFL, the Green band, SWIR band and the RVI contributed to its estimation. As for SFL, the VIs (e.g., NDII, NDTI, and NDVI) have a more obvious effect than optical bands on SFL inversion. These results show the feasibility of using the proposed new model to estimate FLAGL based on optical and SAR data, which provides a good application prospect for forest fire risk warning, prevention, and extinguishing.

Author Contributions

Conceptualization, Y.L. and B.H.; methodology, Y.L.; validation Y.L. and B.H.; formal analysis, Y.L.; investigation, Y.L.; resources, B.H.; data curation, Y.L.; writing—original draft preparation, Y.L.; writing—review and editing, Y.L. and B.H.; visualization, Y.L.; supervision, B.H.; project administration, B.H.; funding acquisition, B.H. All authors have read and agreed to the published version of the manuscript.

Funding

This research was funded by National Natural Science Foundation of China (Contract No. U20A2090).

Institutional Review Board Statement

Not applicable.

Informed Consent Statement

Not applicable.

Data Availability Statement

The BioSAR-2008 is an open-access dataset which is available in European Space Agency (http://eopi.esa.int, accessed on 2 November 2022).

Acknowledgments

The authors would like to appreciate the ONERA, ESA, and BioSAR team for providing the BioSAR 2008 datasets.

Conflicts of Interest

The authors declare no conflict of interest.

References

  1. Bowman, D.M.; Balch, J.K.; Artaxo, P.; Bond, W.J.; Carlson, J.M.; Cochrane, M.A.; D’Antonio, C.M.; Defries, R.S.; Doyle, J.C.; Harrison, S.P.; et al. Fire in the earth system. Science 2009, 324, 481–484. [Google Scholar] [CrossRef] [PubMed]
  2. Ruokolainen, L.; Salo, K. The Effect of Fire sIntensity on Vegetation Succession on a Sub-Xeric Heath during Ten Years after Wildfire. Ann. Bot. Fenn. 2009, 46, 30–42. [Google Scholar] [CrossRef] [Green Version]
  3. Kilgore, B. The Ecological Role of Fire in Sierran Conifer Forests: Its Application to National Park Management. Quat. Res. 1973, 3, 496–513. [Google Scholar] [CrossRef]
  4. Chu, T.; Guo, X. Remote Sensing Techniques in Monitoring Post-Fire Effects and Patterns of Forest Recovery in Boreal Forest Regions: A Review. Remote Sens. 2013, 6, 470–520. [Google Scholar] [CrossRef] [Green Version]
  5. Rieman, B.E.; Gresswell, R.E.; Young, M.K.; Luce, C.H. Introduction to the effects of wildland fire on aquatic ecosystems in the Western USA. Forest Ecol. Manag. 2003, 178, 1–3. [Google Scholar] [CrossRef]
  6. Liu, X.; He, B.; Quan, X.; Yebra, M.; Qiu, S.; Yin, C.; Liao, Z.; Zhang, H. Near Real-Time Extracting Wildfire Spread Rate from Himawari-8 Satellite Data. Remote Sens. 2018, 10, 1654. [Google Scholar] [CrossRef] [Green Version]
  7. Boerner, R.E.J.; Huang, J.; Hart, S.C. Impacts of fire and fire surrogate treatments on forest soil properties: A meta-analytical approach. Ecol. Appl. 2009, 19, 338–358. [Google Scholar] [CrossRef]
  8. Van der Werf, G.R.; Morton, D.C.; DeFries, R.S.; Olivier, J.G.J.; Kasibhatla, P.S.; Jackson, R.B.; Collatz, G.J.; Randerson, J.T. CO2 emissions from forest loss. Nat. Geoence 2009, 2, 737–738. [Google Scholar] [CrossRef]
  9. Van der Werf, G.R.; Randerson, J.T.; Giglio, L.; Collatz, G.J.; Kasibhatla, P.S.; Arellano, A.F. Interannual variability in global biomass burning emissions from 1997 to 2004. Atmos. Chem. Phys. 2006, 6, 3423–3441. [Google Scholar] [CrossRef] [Green Version]
  10. Massetti, A.; Rüdiger, C.; Yebra, M.; Hilton, J. The Vegetation Structure Perpendicular Index (VSPI): A forest condition index for wildfire predictions. Remote Sens. Environ. 2019, 224, 167–181. [Google Scholar] [CrossRef]
  11. Keane, R.E.; Burgan, R.; van Wagtendonk, J. Mapping wildland fuels for fire management across multiple scales: Integrating remote sensing, GIS, and biophysical modeling. Int. J. Wildl. Fire 2001, 10, 301–319. [Google Scholar] [CrossRef]
  12. Mitsopoulos, I.D.; Dimitrakopoulos, A.P. Allometric equations for crown fuel biomass of Aleppo pine (Pinus halepensis Mill.) in Greece. Int. J. Wildl. Fire 2007, 16, 642–647. [Google Scholar] [CrossRef]
  13. Pyne, S.J.; Andrews, P.L.; Laven, R.D. Introduction to Wildland Fire; CSIRO Publishing: Clayton, Victoria, Australia, 1996. [Google Scholar]
  14. Küçük, Ö.; Bilgili, E.; Sağlam, B. Estimating crown fuel loading for calabrian pine and Anatolian black pine. Int. J. Wildl. Fire 2008, 17, 147–154. [Google Scholar] [CrossRef]
  15. Kucuk, O.; Saglam, B.; Bilgili, E. Canopy Fuel Characteristics and Fuel Load in Young Black Pine Trees. Biotechnol. Biotechnol. Equip. 2014, 21, 235–240. [Google Scholar] [CrossRef] [Green Version]
  16. Baysal, İ.; Yurtgan, M.; Küçük, Ö.; Öztürk, N. Estimation of Crown Fuel Load of Suppressed Trees in Non-treated Young Calabrian Pine (Pinus brutia Ten.) Plantation Areas. Kast. Üniversitesi Orman Fakültesi Derg. 2019, 19, 351–360. [Google Scholar] [CrossRef] [Green Version]
  17. Skowronski, N.S.; Clark, K.L.; Duveneck, M.; Hom, J. Three-dimensional canopy fuel loading predicted using upward and downward sensing LiDAR systems. Remote Sens. Environ. 2011, 115, 703–714. [Google Scholar] [CrossRef]
  18. Martins, F.d.S.R.V.; dos Santos, J.R.; Galvão, L.S.; Xaud, H.A.M. Sensitivity of ALOS/PALSAR imagery to forest degradation by fire in northern Amazon. Int. J. Appl. Earth Obs. Geoinf. 2016, 49, 163–174. [Google Scholar] [CrossRef]
  19. Rodríguez-Trejo, D.A.; Pausas, J.G.; Miranda-Moreno, A.G. Plant responses to fire in a Mexican arid shrubland. Fire Ecol. 2019, 15, 11. [Google Scholar] [CrossRef]
  20. French, N.; Bourgeau-Chavez, L.L.; Yong, W.; Kasischke, E.S. Initial Observations of Radarsat Imagery at Fire-Disturbed Sites in Interior Alaska. Remote Sens. Environ. 1999, 68, 89–94. [Google Scholar] [CrossRef]
  21. Anastasia, P.; Ioannis, G.; Sander, V.; Annekatrien, D. Evaluation of ALOS PALSAR Imagery for Burned Area Mapping in Greece Using Object-Based Classification. Remote Sens. 2013, 5, 5680–5701. [Google Scholar]
  22. Kalogirou, V.; Ferrazzoli, P.; Vecchia, A.D.; Foumelis, M. On the SAR Backscatter of Burned Forests: A Model-Based Study in C-Band, over Burned Pine Canopies. IEEE Trans. Geosci. Remote Sens. 2014, 52, 6205–6215. [Google Scholar] [CrossRef]
  23. Byram, G. Combustion of forest fuels. Forest Fire Control Use 1959, 4, 61–89. [Google Scholar]
  24. Thomas, P.H. The size of flames from natural fires. Ninth Symp. Combust. 1963, 9, 844–859. [Google Scholar] [CrossRef]
  25. Stocks, B.J.; Alexander, M.E.; Wotton, B.M.; Stefner, C.N.; Flannigan, M.D.; Taylor, S.W.; Lavoie, N.; Mason, J.A.; Hartley, G.R.; Maffey, M.E.; et al. Crown fire behaviour in a northern jack pine–black spruce forest. Can. J. Forest Res. 2004, 34, 1548–1560. [Google Scholar] [CrossRef] [Green Version]
  26. Pollet, J.; Omi, P.N. Effect of thinning and prescribed burning on crown fire severity in ponderosa pine forests. Int. J. Wildl. Fire 2002, 11, 1–10. [Google Scholar] [CrossRef]
  27. Andersen, H.-E.; McGaughey, R.J.; Reutebuch, S.E. Estimating forest canopy fuel parameters using LIDAR data. Remote Sens. Environ. 2005, 94, 441–449. [Google Scholar] [CrossRef]
  28. Burgan, R.E.; Rothermel, R.C. BEHAVE: Fire Behavior Prediction and Fuel Modeling System-Fuel Subsystem; Quinney Library: Logan, UT, USA, 2013. [Google Scholar]
  29. Finney, M.A. FARSITE: Fire Area Simulator-Model Development and Evaluation; US Department of Agriculture, Forest Service, Rocky Mountain Research Station: Fort Collins, CO, USA, 1998.
  30. Erdody, T.L.; Moskal, L.M. Fusion of LiDAR and imagery for estimating forest canopy fuels. Remote Sens. Environ. 2010, 114, 725–737. [Google Scholar] [CrossRef]
  31. Li, Z.; Shi, H.; Vogelmann, J.E.; Hawbaker, T.J.; Peterson, B. Assessment of Fire Fuel Load Dynamics in Shrubland Ecosystems in the Western United States Using MODIS Products. Remote Sens. 2020, 12, 1911. [Google Scholar] [CrossRef]
  32. Jin, S.; Chen, S.-C. Application of QuickBird imagery in fuel load estimation in the Daxinganling region, China. Int. J. Wildl. Fire 2012, 21, 583–590. [Google Scholar] [CrossRef]
  33. Brandis, K.; Jacobson, C. Estimation of vegetative fuel loads using Landsat TM imagery in New South Wales, Australia. Int. J. Wildl. Fire 2003, 12, 185–194. [Google Scholar] [CrossRef]
  34. Keane, R.E.; Mincemoyer, S.A.; Schmidt, K.M.; Long, D.G.; Garner, J.L. Mapping vegetation and fuels for fire management on the Gila National Forest Complex, New Mexico. Rev. Cuba. De Cardiol. Y Cirugía Cardiovasc. 2000, 46, 308–311. [Google Scholar]
  35. Mallinis, G.; Mitsopoulos, Ι.; Stournara, P.; Patias, P.; Dimitrakopoulos, A. Canopy Fuel Load Mapping of Mediterranean Pine Sites Based on Individual Tree-Crown Delineation. Remote Sens. 2013, 5, 6461–6480. [Google Scholar] [CrossRef] [Green Version]
  36. Sader, S.A.; Waide, R.B.; Lawrence, W.T.; Joyce, A.T. Tropical forest biomass and successional age class relationships to a vegetation index derived from Landsat TM data. Remote Sens. Environ. 1989, 28, 143–156. [Google Scholar] [CrossRef]
  37. García, M.; Saatchi, S.; Casas, A.; Koltunov, A.; Ustin, S.; Ramirez, C.; Balzter, H. Extrapolating Forest Canopy Fuel Properties in the California Rim Fire by Combining Airborne LiDAR and Landsat OLI Data. Remote Sens. 2017, 9, 394. [Google Scholar] [CrossRef] [Green Version]
  38. Wulder, M.A. Optical remote-sensing techniques for the assessment of forest inventory and biophysical parameters. Prog. Phys. Geogr. 1998, 22, 449. [Google Scholar] [CrossRef]
  39. Blomberg, E.; Ulander, L.; Tebaldini, S.; Ferro-Famil, L. Evaluating P-Band TomoSAR for Biomass Retrieval in Boreal Forest. IEEE Trans. Geosci. Remote Sens. 2020, 59, 3793–3804. [Google Scholar] [CrossRef]
  40. Crabbe, R.A.; Lamb, D.W.; Edwards, C.; Andersson, K.; Schneider, D. A Preliminary Investigation of the Potential of Sentinel-1 Radar to Estimate Pasture Biomass in a Grazed, Native Pasture Landscape. Remote Sens. 2019, 11, 872. [Google Scholar] [CrossRef] [Green Version]
  41. Li, B. Estimating Forest Aboveground Biomass Using Gaofen-1 Images, Sentinel-1 Images, and Machine Learning Algorithms: A Case Study of the Dabie Mountain Region, China. Remote Sens. 2021, 14, 176. [Google Scholar]
  42. Petersson, H. Biomassafunktioner för trädfraktioner av tall, gran och björk i Sverige. SLU Inst. för Skoglig Resur. Och Geomatik Arbetsrapport 1999, 59. [Google Scholar]
  43. Hajnsek, I.; Scheiber, R.; Keller, M.; Horn, R.; Lee, S.; Ulander, L.; Gustavsson, A.; Sandberg, G.; Le Toan, T.; Tebaldini, S.; et al. BIOSAR 2008: Final Report. 2009. Available online: https://elib.dlr.de/63157/ (accessed on 3 November 2022).
  44. Shimada, M.; Itoh, T.; Motooka, T.; Watanabe, M.; Shiraishi, T.; Thapa, R.; Lucas, R. New global forest/non-forest maps from ALOS PALSAR data (2007–2010). Remote Sens. Environ. 2014, 155, 13–31. [Google Scholar] [CrossRef]
  45. Gorelick, N.; Hancher, M.; Dixon, M.; Ilyushchenko, S.; Moore, R. Google Earth Engine: Planetary-scale geospatial analysis for everyone. Remote Sens. Environ. 2017, 202, 18–27. [Google Scholar] [CrossRef]
  46. Storey, J.; Scaramuzza, P.; Schmidt, G. Landsat 7 scan line corrector-off gap filled product development. Proc. Pecora 2005, 16, 23–27. [Google Scholar]
  47. Shimada, M.; Ohtaki, T. Generating Large-Scale High-Quality SAR Mosaic Datasets: Application to PALSAR Data for Global Monitoring. IEEE J. Sel. Top. Appl. Earth Obs. Remote Sens. 2010, 3, 637–656. [Google Scholar] [CrossRef]
  48. Thapa, R.B.; Watanabe, M.; Motohka, T.; Shimada, M. Potential of high-resolution ALOS–PALSAR mosaic texture for aboveground forest carbon tracking in tropical region. Remote Sens. Environ. 2015, 160, 122–133. [Google Scholar] [CrossRef]
  49. Sexton, J.O.; Song, X.P.; Feng, M.; Noojipady, P.; Anand, A.; Huang, C.; Kim, D.H.; Collins, K.M.; Channan, S.; Dimiceli, C. Global, 30-m resolution continuous fields of tree cover: Landsat-based rescaling of MODIS vegetation continuous fields with lidar-based estimates of error. Int. J. Digit. Earth 2013, 6, 427–448. [Google Scholar] [CrossRef] [Green Version]
  50. Jun, C.; Ban, Y.; Li, S. China: Open access to Earth land-cover map. Nature 2015, 514, 434. [Google Scholar] [CrossRef]
  51. Chen, J.; Chen, J.; Liao, A.; Cao, X.; Chen, L.; Chen, X.; He, C.; Han, G.; Peng, S.; Lu, M.; et al. Global land cover mapping at 30 m resolution: A POK-based operational approach. ISPRS J. Photogramm. Remote Sens. 2015, 103, 7–27. [Google Scholar] [CrossRef] [Green Version]
  52. Cartus, O.; Santoro, M.; Kellndorfer, J. Mapping forest aboveground biomass in the Northeastern United States with ALOS PALSAR dual-polarization L-band. Remote Sens. Environ. 2012, 124, 466–478. [Google Scholar] [CrossRef]
  53. Santis, A.D.; Asner, G.P.; Vaughan, P.J.; Knapp, D.E. Mapping burn severity and burning efficiency in California using simulation models and Landsat imagery. Remote Sens. Environ. 2010, 114, 1535–1545. [Google Scholar] [CrossRef]
  54. Yebra, M.; Dennison, P.E.; Chuvieco, E.; Riaño, D.; Zylstra, P.; Hunt, E.R.; Danson, F.M.; Qi, Y.; Jurdao, S. A global review of remote sensing of live fuel moisture content for fire danger assessment: Moving towards operational products. Remote Sens. Environ. 2013, 136, 455–468. [Google Scholar] [CrossRef]
  55. Santoro, M.; Cartus, O. Research Pathways of Forest Above-Ground Biomass Estimation Based on SAR Backscatter and Interferometric SAR Observations. Remote Sens. 2018, 10, 608. [Google Scholar] [CrossRef] [Green Version]
  56. Ottinger, M.; Kuenzer, C. Spaceborne L-Band Synthetic Aperture Radar Data for Geoscientific Analyses in Coastal Land Applications: A Review. Remote Sens. 2020, 12, 2228. [Google Scholar] [CrossRef]
  57. Ramsey, E.; Rangoonwala, A.; Bannister, T. Coastal Flood Inundation Monitoring with Satellite C-band and L-band Synthetic Aperture Radar Data. JAWRA J. Am. Water Resour. Assoc. 2013, 49, 1239–1260. [Google Scholar] [CrossRef]
  58. Askne, J.I.H.; Dammert, P.B.G.; Ulander, L.M.H.; Smith, G. C-band repeat-pass interferometric SAR observations of the forest. IEEE Trans. Geosci. Remote Sens. 1997, 35, 25–35. [Google Scholar] [CrossRef]
  59. Roderick, M.L.; Noble, I.R.; Cridland, S.W. Estimating woody and herbaceous vegetation cover from time series satellite observations: GCTE/LUCC RESEARCH LETTER. Glob. Ecol. Biogeogr. 1999, 8, 501–508. [Google Scholar] [CrossRef]
  60. Xiao, J.; Moody, A. A comparison of methods for estimating fractional green vegetation cover within a desert-to-upland transition zone in central New Mexico, USA. Remote Sens. Environ. 2005, 98, 237–250. [Google Scholar] [CrossRef]
  61. Gao, L.; Wang, X.; Johnson, B.A.; Tian, Q.; Wang, Y.; Verrelst, J.; Mu, X.; Gu, X. Remote sensing algorithms for estimation of fractional vegetation cover using pure vegetation index values: A review. ISPRS J. Photogramm. Remote Sens. 2020, 159, 364–377. [Google Scholar] [CrossRef]
  62. Baret, F.; Clevers, J.G.P.W.; Steven, M.D. The robustness of canopy gap fraction estimates from red and near-infrared reflectances: A comparison of approaches. Remote Sens. Environ. 1995, 54, 141–151. [Google Scholar] [CrossRef]
  63. Chopping, M.; Su, L.; Rango, A.; Martonchik, J.V.; Peters, D.P.C.; Laliberte, A. Remote sensing of woody shrub cover in desert grasslands using MISR with a geometric-optical canopy reflectance model. Remote Sens. Environ. 2008, 112, 19–34. [Google Scholar] [CrossRef]
  64. Ge, J.; Meng, B.; Liang, T.; Feng, Q.; Gao, J.; Yang, S.; Huang, X.; Xie, H. Modeling alpine grassland cover based on MODIS data and support vector machine regression in the headwater region of the Huanghe River, China. Remote Sens. Environ. 2018, 218, 162–173. [Google Scholar] [CrossRef]
  65. Jia, K.; Liang, S.; Gu, X.; Baret, F.; Wei, X.; Wang, X.; Yao, Y.; Yang, L.; Li, Y. Fractional vegetation cover estimation algorithm for Chinese GF-1 wide field view data. Remote Sens. Environ. 2016, 177, 184–191. [Google Scholar] [CrossRef]
  66. Xihan, M.; Wanjuan, S.; Zhan, G.; Mcvicar, T.R.; Donohue, R.J.; Guangjian, Y. Fractional vegetation cover estimation by using multi-angle vegetation index. Remote Sens. Environ. 2018, 216, 44–56. [Google Scholar]
  67. Leprieur, C.; Verstraete, M.M.; Pinty, B. Evaluation of the performance of various vegetation indices to retrieve vegetation cover from AVHRR data. Remote Sens. Rev. 1994, 10, 265–284. [Google Scholar] [CrossRef]
  68. Gutman, G.; Ignatov, A. The derivation of the green vegetation fraction from NOAA/AVHRR data for use in numerical weather prediction models. Int. J. Remote Sens. 2010, 19, 1533–1543. [Google Scholar] [CrossRef]
  69. Tao, L.; Wamg, G.; Chen, W.; Chen, X.; Chen, X.; Cai, Q. Soil Moisture Retrieval From SAR and Optical Data Using a Combined Model. IEEE J. Sel. Top. Appl. Earth Obs. Remote Sens. 2019, 12, 637–647. [Google Scholar] [CrossRef]
  70. Moré, J.J. The Levenberg-Marquardt algorithm: Implementation and theory. In Numerical Analysis; Springer: New York, NY, USA, 1978; pp. 105–116. [Google Scholar]
  71. Santoro, M.; Beer, C.; Cartus, O.; Schmullius, C.; Shvidenko, A.; McCallum, I.; Wegmüller, U.; Wiesmann, A. Retrieval of growing stock volume in boreal forest using hyper-temporal series of Envisat ASAR ScanSAR backscatter measurements. Remote Sens. Environ. 2011, 115, 490–507. [Google Scholar] [CrossRef]
  72. Meng, B.; Ge, J.; Liang, T.; Yang, S.; Gao, J.; Feng, Q.; Cui, X.; Huang, X.; Xie, H. Evaluation of Remote Sensing Inversion Error for the Above-Ground Biomass of Alpine Meadow Grassland Based on Multi-Source Satellite Data. Remote Sens. 2017, 9, 372. [Google Scholar] [CrossRef]
  73. Hardisky, M.A.; Klemas, V.; Smart, R.M. The influence of soil salinity, growth form, and leaf moisture on the spectral radiance of Spartina Alterniflora canopies. Photogramm. Eng. Remote Sens. 1983, 49, 77–84. [Google Scholar]
  74. Deventer, V.; Ward, A.D.; Gowda, P.H.; Lyon, J.G. Using Thematic Mapper Data to Identify Contrasting Soil Plains and Tillage Practices. Photogramm. Eng. Remote Sens. 1997, 63, 87–93. [Google Scholar]
  75. Tucker, C.J. Red and photographic infrared linear combinations for monitoring vegetation. Remote Sens. Environ. 1979, 8, 127–150. [Google Scholar] [CrossRef] [Green Version]
  76. Jordan, C.F. Derivation of Leaf-Area Index from Quality of Light on the Forest Floor. Ecology 1969, 50, 663–666. [Google Scholar] [CrossRef]
  77. Yebraa, M.; Quanc, X.; Riaño, D.; Larraondof, P.R.; van Dijk, A.I.J.M.; Cary, G.J. A fuel moisture content and flammability monitoring methodology for continental Australia based on optical remote sensing. Remote Sens. Environ. 2018, 212, 260–272. [Google Scholar] [CrossRef]
  78. García-Haro, F.J.; Campos-Taberner, M.; Moreno, L.; Tagesson, H.T.; Gilabert, A. A global canopy water content product from AVHRR/Metop. ISPRS J. Photogramm. Remote Sens. 2020, 162, 77–93. [Google Scholar] [CrossRef]
  79. Wang, L.; Jr., E.R.H.; Qu, J.J.; Hao, X.; Daughtry, C.S.T. Remote sensing of fuel moisture content from ratios of narrow-band vegetation water and dry-matter indices. Remote Sens. Environ. 2013, 129, 103–110. [Google Scholar] [CrossRef] [Green Version]
  80. Houborg, R.; Soegaard, H.; Boegh, E. Combining vegetation index and model inversion methods for the extraction of key vegetation biophysical parameters using Terra and Aqua MODIS reflectance data. Remote Sens. Environ. 2007, 106, 39–58. [Google Scholar] [CrossRef]
  81. Li, X.; Li, L.; Liu, X. Collaborative inversion heavy metal stress in rice by using two-dimensional spectral feature space based on HJ-1 A HSI and radarsat-2 SAR remote sensing data. Int. J. Appl. Earth Obs. Geoinf. 2019, 78, 39–52. [Google Scholar] [CrossRef]
  82. Dobson, M.C.; Ulaby, F.T.; LeThoan, T.; Beaudoin, A.; Kassischke, E.S.; Christensen, N. Dependence of Radar Backscatter on Coniferous Forest Biomass. IEEE Trans. Geosci. Remote Sens. 1992, 30, 412–415. [Google Scholar] [CrossRef]
  83. Kasischke, E.S.; Bourgeau-Chavez, L.L.; Christensen, N.L.; Haney, E. Observations on the sensitivity of ERS-1 SAR image intensity to changes in aboveground biomass in young loblolly pine forests. Int. J. Remote Sens. 1994, 15, 3–16. [Google Scholar] [CrossRef]
  84. Kasischke, E.S.; Norman, L.; Christensen, J.; Bourgeau-Chavez, L.L. Correlating radar backscatter with components of biomass in loblolly pine forests. IEEE Trans. Geosci. Remote Sens. 1995, 33, 643–659. [Google Scholar] [CrossRef]
  85. Harrell, P.A.; Bourgeau-Chavez, L.L.; Kasischke, E.S.; French, N.H.F.; Christensen, N.L. Sensitivity of ERS-1 and JERS-1 radar data to biomass and stand structure in Alaskan boreal forest. Remote Sens. Environ. 1995, 54, 247–260. [Google Scholar] [CrossRef]
  86. Harrell, P.A.; Kasischke, E.S.; Bourgeau-Chavez, L.L.; Haney, E.M.; Christensen, N.L. Evaluation of approaches to estimating aboveground biomass in southern pine forests using SIR-C data. Remote Sens. Environ. 1997, 59, 223–233. [Google Scholar] [CrossRef]
  87. Saatchi, S.S.; Moghaddam, M. Estimation of Crown and Stem Water Content and Biomass of Boreal Forest Using Polarimetric SAR Imagery. IEEE Trans. Geosci. Remote Sens. 2000, 38, 697–709. [Google Scholar] [CrossRef] [Green Version]
  88. Bouvet, A.; Mermoz, S.; Le Toan, T.; Villard, L.; Mathieu, R.; Naidoo, L.; Asner, G.P. An above-ground biomass map of African savannahs and woodlands at 25 m resolution derived from ALOS PALSAR. Remote Sens. Environ. 2018, 206, 156–173. [Google Scholar] [CrossRef]
  89. Ningthoujam, R.K.; Joshi, P.K.; Roy, P.S. Retrieval of forest biomass for tropical deciduous mixed forest using ALOS PALSAR mosaic imagery and field plot data. Int. J. Appl. Earth Obs. Geoinf. 2018, 69, 206–216. [Google Scholar] [CrossRef]
  90. Cartus, O.; Santoro, M. Exploring combinations of multi-temporal and multi-frequency radar backscatter observations to estimate above-ground biomass of tropical forest. Remote Sens. Environ. 2019, 232, 111313. [Google Scholar] [CrossRef]
  91. Forkuor, G.; Benewinde Zoungrana, J.-B.; Dimobe, K.; Ouattara, B.; Vadrevu, K.P.; Tondoh, J.E. Above-ground biomass mapping in West African dryland forest using Sentinel-1 and 2 datasets—A case study. Remote Sens. Environ. 2020, 236, 111496. [Google Scholar] [CrossRef]
  92. Sandberg, G.; Ulander, L.M.; Fransson, J.E.S.; Holmgren, J.; Le Toan, T. L-and P-band backscatter intensity for biomass retrieval in hemiboreal forest. Remote Sens. Environ. 2011, 115, 2874–2886. [Google Scholar] [CrossRef]
  93. Golshani, P.; Maghsoudi, Y.; Sohrabi, H. Relating ALOS-2 PALSAR-2 Parameters to Biomass and Structure of Temperate Broadleaf Hyrcanian Forests. J. Indian Soc. Remote Sens. 2019, 47, 749–761. [Google Scholar] [CrossRef]
  94. Zhang, Z.; Ni, W.; Sun, G.; Huang, W.; Ranson, K.J.; Cook, B.D.; Guo, Z. Biomass retrieval from L-band polarimetric UAVSAR backscatter and PRISM stereo imagery. Remote Sens. Environ. 2017, 194, 331–346. [Google Scholar] [CrossRef]
  95. Ho Tong Minh, D.; Toan, T.L.; Rocca, F.; Tebaldini, S.; d’Alessandro, M.M.; Villard, L. Relating P-Band Synthetic Aperture Radar Tomography to Tropical Forest Biomass. IEEE Trans. Geosci. Remote Sens. 2014, 52, 967–979. [Google Scholar] [CrossRef]
  96. Liao, Z.; Van Dijk, A.I.J.M.; He, B.; Larraondo, P.R.; Scarth, P.F. Woody vegetation cover, height and biomass at 25-m resolution across Australia derived from multiple site, airborne and satellite observations. Int. J. Appl. Earth Obs. Geoinf. 2020, 93, 102209. [Google Scholar] [CrossRef]
  97. Imhoff, M.L. A theoretical analysis of the effect of forest structure on synthetic aperture radar backscatter and the remote sensing of biomass. IEEE Trans. Geosci. Remote Sens. 1995, 33, 341–352. [Google Scholar] [CrossRef]
  98. Nuthammachot, N.; Askar, A.; Stratoulias, D.; Wicaksono, P. Combined use of Sentinel-1 and Sentinel-2 data for improving above-ground biomass estimation. Geocarto Int. 2020, 37, 366–376. [Google Scholar] [CrossRef]
  99. Sasan, V.; Javad, S.; Kamran, A.; Hadi, F.; Hamed, N.; Tien, P.; Dieu, T.B. Improving Accuracy Estimation of Forest Aboveground Biomass Based on Incorporation of ALOS-2 PALSAR-2 and Sentinel-2A Imagery and Machine Learning: A Case Study of the Hyrcanian Forest Area (Iran). Remote Sens. 2018, 10, 172. [Google Scholar]
  100. Vaglio Laurin, G.; Pirotti, F.; Callegari, M.; Chen, Q.; Cuozzo, G.; Lingua, E.; Notarnicola, C.; Papale, D. Potential of ALOS2 and NDVI to Estimate Forest Above-Ground Biomass, and Comparison with Lidar-Derived Estimates. Remote Sens. 2016, 9, 18. [Google Scholar] [CrossRef] [Green Version]
  101. Sinha, S.; Mohan, S.; Das, A.K.; Sharma, L.K.; Jeganathan, C.; Santra, A.; Santra Mitra, S.; Nathawat, M.S. Multi-sensor approach integrating optical and multi-frequency synthetic aperture radar for carbon stock estimation over a tropical deciduous forest in India. Carbon Manag. 2019, 11, 39–55. [Google Scholar] [CrossRef]
  102. Reese, H.; Nilsson, M.; Olsson, H. Comparison of Resourcesat-1 AWiFS and SPOT-5 data over managed boreal forest stands. Int. J. Remote Sens. 2009, 30, 4957–4978. [Google Scholar] [CrossRef] [Green Version]
  103. Zhen, Z.; Lou, Y.; Moses, O.A.; Rui, L.; Li, M.; Jun, L. Hyperspectral vegetation indexes to monitor wheat plant height under different sowing conditions. Spectrosc. Lett. 2020, 53, 194–206. [Google Scholar] [CrossRef]
  104. Gao, S.; Niu, Z.; Huang, N.; Hou, X. Estimating the Leaf Area Index, height and biomass of maize using HJ-1 and RADARSAT-2. Int. J. Appl. Earth Obs. Geoinf. 2013, 24, 1–8. [Google Scholar] [CrossRef]
  105. Hethcoat, M.G.; Carreiras, J.M.B.; Edwards, D.P.; Bryant, R.G.; Quegan, S. Detecting tropical selective logging with C-band SAR data may require a time series approach. Remote Sens. Environ. 2021, 259, 112411. [Google Scholar] [CrossRef]
  106. Huang, S.; Crabtree, R.L.; Potter, C.; Gross, P. Estimating the quantity and quality of coarse woody debris in Yellowstone post-fire forest ecosystem from fusion of SAR and optical data. Remote Sens. Environ. 2009, 113, 1926–1938. [Google Scholar] [CrossRef]
  107. Hui, L.; Jinsong, C.; Zhiyuan, P.; Songling, Z.; Xianzhi, H. Monitoring Sugarcane Growth Using ENVISAT ASAR Data. IEEE Trans. Geosci. Remote Sens. 2009, 47, 2572–2580. [Google Scholar] [CrossRef]
Figure 1. Geographical location of the study area. (a) The location of study area in Sweden. (b) The distribution of forest stands.
Remotesensing 15 00005 g001
Figure 2. Methodological flowchart of FLAG estimation from integrated optical and SAR data with new model.
Remotesensing 15 00005 g002
Figure 3. Comparison of FLAGL (FFL, BFL and SFL) inversion results using WCM (top row) and the new model (bottom row) on BioSAR-2008.
Remotesensing 15 00005 g003
Figure 4. The spatial distribution of FLAGL in the study area.
Remotesensing 15 00005 g004
Figure 5. Comparison of model performance with different vegetation coverage.
Remotesensing 15 00005 g005
Figure 6. The correlation relationship between HV and FFL (a), and HV/Green and FFL (b).
Remotesensing 15 00005 g006
Table 1. VIs introduced into WCM for FLAGL retrieval.
Vegetation IndicesEquationsReferences
Normalized Difference Infrared Index N D I I = N I R S W I R 2 N I R + S W I R 2 [73]
Normalized Difference Tillage Index N D T I = S W I R 1 S W I R 2 S W I R 1 + S W I R 2 [74]
Normalized Difference Vegetation Index NDVI = N I R R E D N I R + R E D [75]
Ratio Vegetation Index RVI = G r e e n B l u e [76]
Table 2. Experimental setup in modelling FLAG.
ExperimentData SourceInput Format
WCMHVHV
New modelHV, Blue, Green, Red, NIR, SWIR1, SWIR2,
NDII, NDTI, NDVI,
RVI
* HV ⊗ Blue
* HV ⊗ Green
* HV ⊗ Red
* HV ⊗ NIR
* HV ⊗ SWIR1
* HV ⊗ SWIR2
* HV ⊗ NDII
* HV ⊗ NDTI
* HV ⊗ NDVI
* HV ⊗ RVI
* ⊗ represents any one of the four arithmetic (i.e., addition, subtraction, multiplication, and division).
Table 3. Retrieval results of FLAGL (FFL, BFL and SFL) by HV polarization backscatter alone using WCM.
Fuel LoadR2RMSERMSEr
FFL0.701.8529.9%
BFL0.704.2327.4%
SFL0.6425.8035.3%
Table 4. Retrieval results of FLAGL (FFL, BFL and SFL) by the combination of HV backscatter and optical information (band or vegetation index) with new model. The bold underlined items are the best retrieval results.
Fuel LoadR2RMSERMSErCombination Format
FFL0.791.3822.3%HV/Green
0.771.4924.0%HV/RVI
0.751.5625.2%HV-SWIR1
0.751.5925.7%HV/SWIR1
0.751.6025.8%HV-SWIR2
0.741.6426.5%HV-Blue
0.721.6426.5%HV/Blue
0.721.6927.3%HV/Red
0.711.7327.9%HV/SWIR2
0.711.7428.1%HV × NDII
0.701.6226.1%HV-Green
0.701.7127.6%HV/NIR
BFL0.753.3421.6%HV/RVI
0.713.4422.3%HV-Green
0.713.5623.1%HV/Green
0.713.5623.1%HV/NIR
SFL0.7716.3822.4%HV/NDII
0.7716.5622.7%HV/NDTI
0.7417.3523.7%HV/NDVI
0.6919.1326.2%HV-Blue
0.6919.6826.9%HV + Blue
0.6819.9027.2%HV-Green
0.6719.6826.9%HV × RVI
0.6719.9027.2%HV-Red
0.6720.3327.8%HV + Green
0.6619.8927.2%HV/Blue
0.6621.1028.9%HV-NIR
0.6520.8928.6%HV-SWIR2
0.6420.8328.5%HV +Red
Disclaimer/Publisher’s Note: The statements, opinions and data contained in all publications are solely those of the individual author(s) and contributor(s) and not of MDPI and/or the editor(s). MDPI and/or the editor(s) disclaim responsibility for any injury to people or property resulting from any ideas, methods, instructions or products referred to in the content.

