1. Introduction
As urbanization gains traction, illegal land occupation is becoming increasingly prominent. Consequently, newly constructed land has become a key subject of supervision and regulation in land development. To effectively improve the monitoring capacity of natural resources and achieve the “early detection and early prevention” goal of natural resource management against illegal land occupation, remote sensing image change detection technology is urgently needed to extract the features pertaining to changes in the development of different types of constructed land. According to the classification system in the land use change surveys, new bare land is among the most significant forms of change in constructed land, where a certain land type is converted from its vegetated or natural state into cleared land for construction. Therefore, obtaining automatic and accurate regional and even national data on land development changes is crucial for natural resource management.
Remote sensing change detection is the process of determining changes in land coverage based on multiple satellite images at different points in time to obtain accurate real-time information. Change detection methods for remote sensing images are mainly divided into two major categories: traditional and deep learning methods. Traditional methods can be divided into image differencing and feature-based and target-driven change detection. These traditional change detection methods have limitations such as the inability to eliminate manual intervention and low levels of automation, and they are easily affected by changes in imaging conditions, image acquisition time, image matching quality, and noise, which render the change detection results unsatisfactory. With the gradual expansion of deep learning in the field of remote sensing, the power of neural networks in feature selection and fitting has generated new ideas for image change detection tasks. Since the introduction of AlexNet [
1] in 2012, convolutional neural networks (CNN) with enhanced structure and performance have been launched every year, such as Visual Geometry Group (VGG) [
2], GoogLeNet [
3], fully convolutional networks (FCNs) [
4], U-Net [
5], Residual Network (ResNet) [
6], and Efficientnet [
7]. Many deep learning methods for change detection have been derived based on these networks. As deep learning-based image change detection can autonomously identify high-dimensional features reflected in the changed regions of the image without human intervention, it is the mainstream method today.
Currently, most deep learning methods treat remote sensing image change detection as a semantic segmentation task by evaluating the changes in each pixel in the input image pair. Most models are based on the classic U-Net’s encoder–decoder network architecture design and have built on it, including DeepLab V3+ [
8] and Semantic FPN [
9]. Change detection models, such as SNUNet-CD [
10] and STANet [
11], have been used to study remote sensing change detection in land use based on deep learning networks, with a significant focus on changes in buildings [
12,
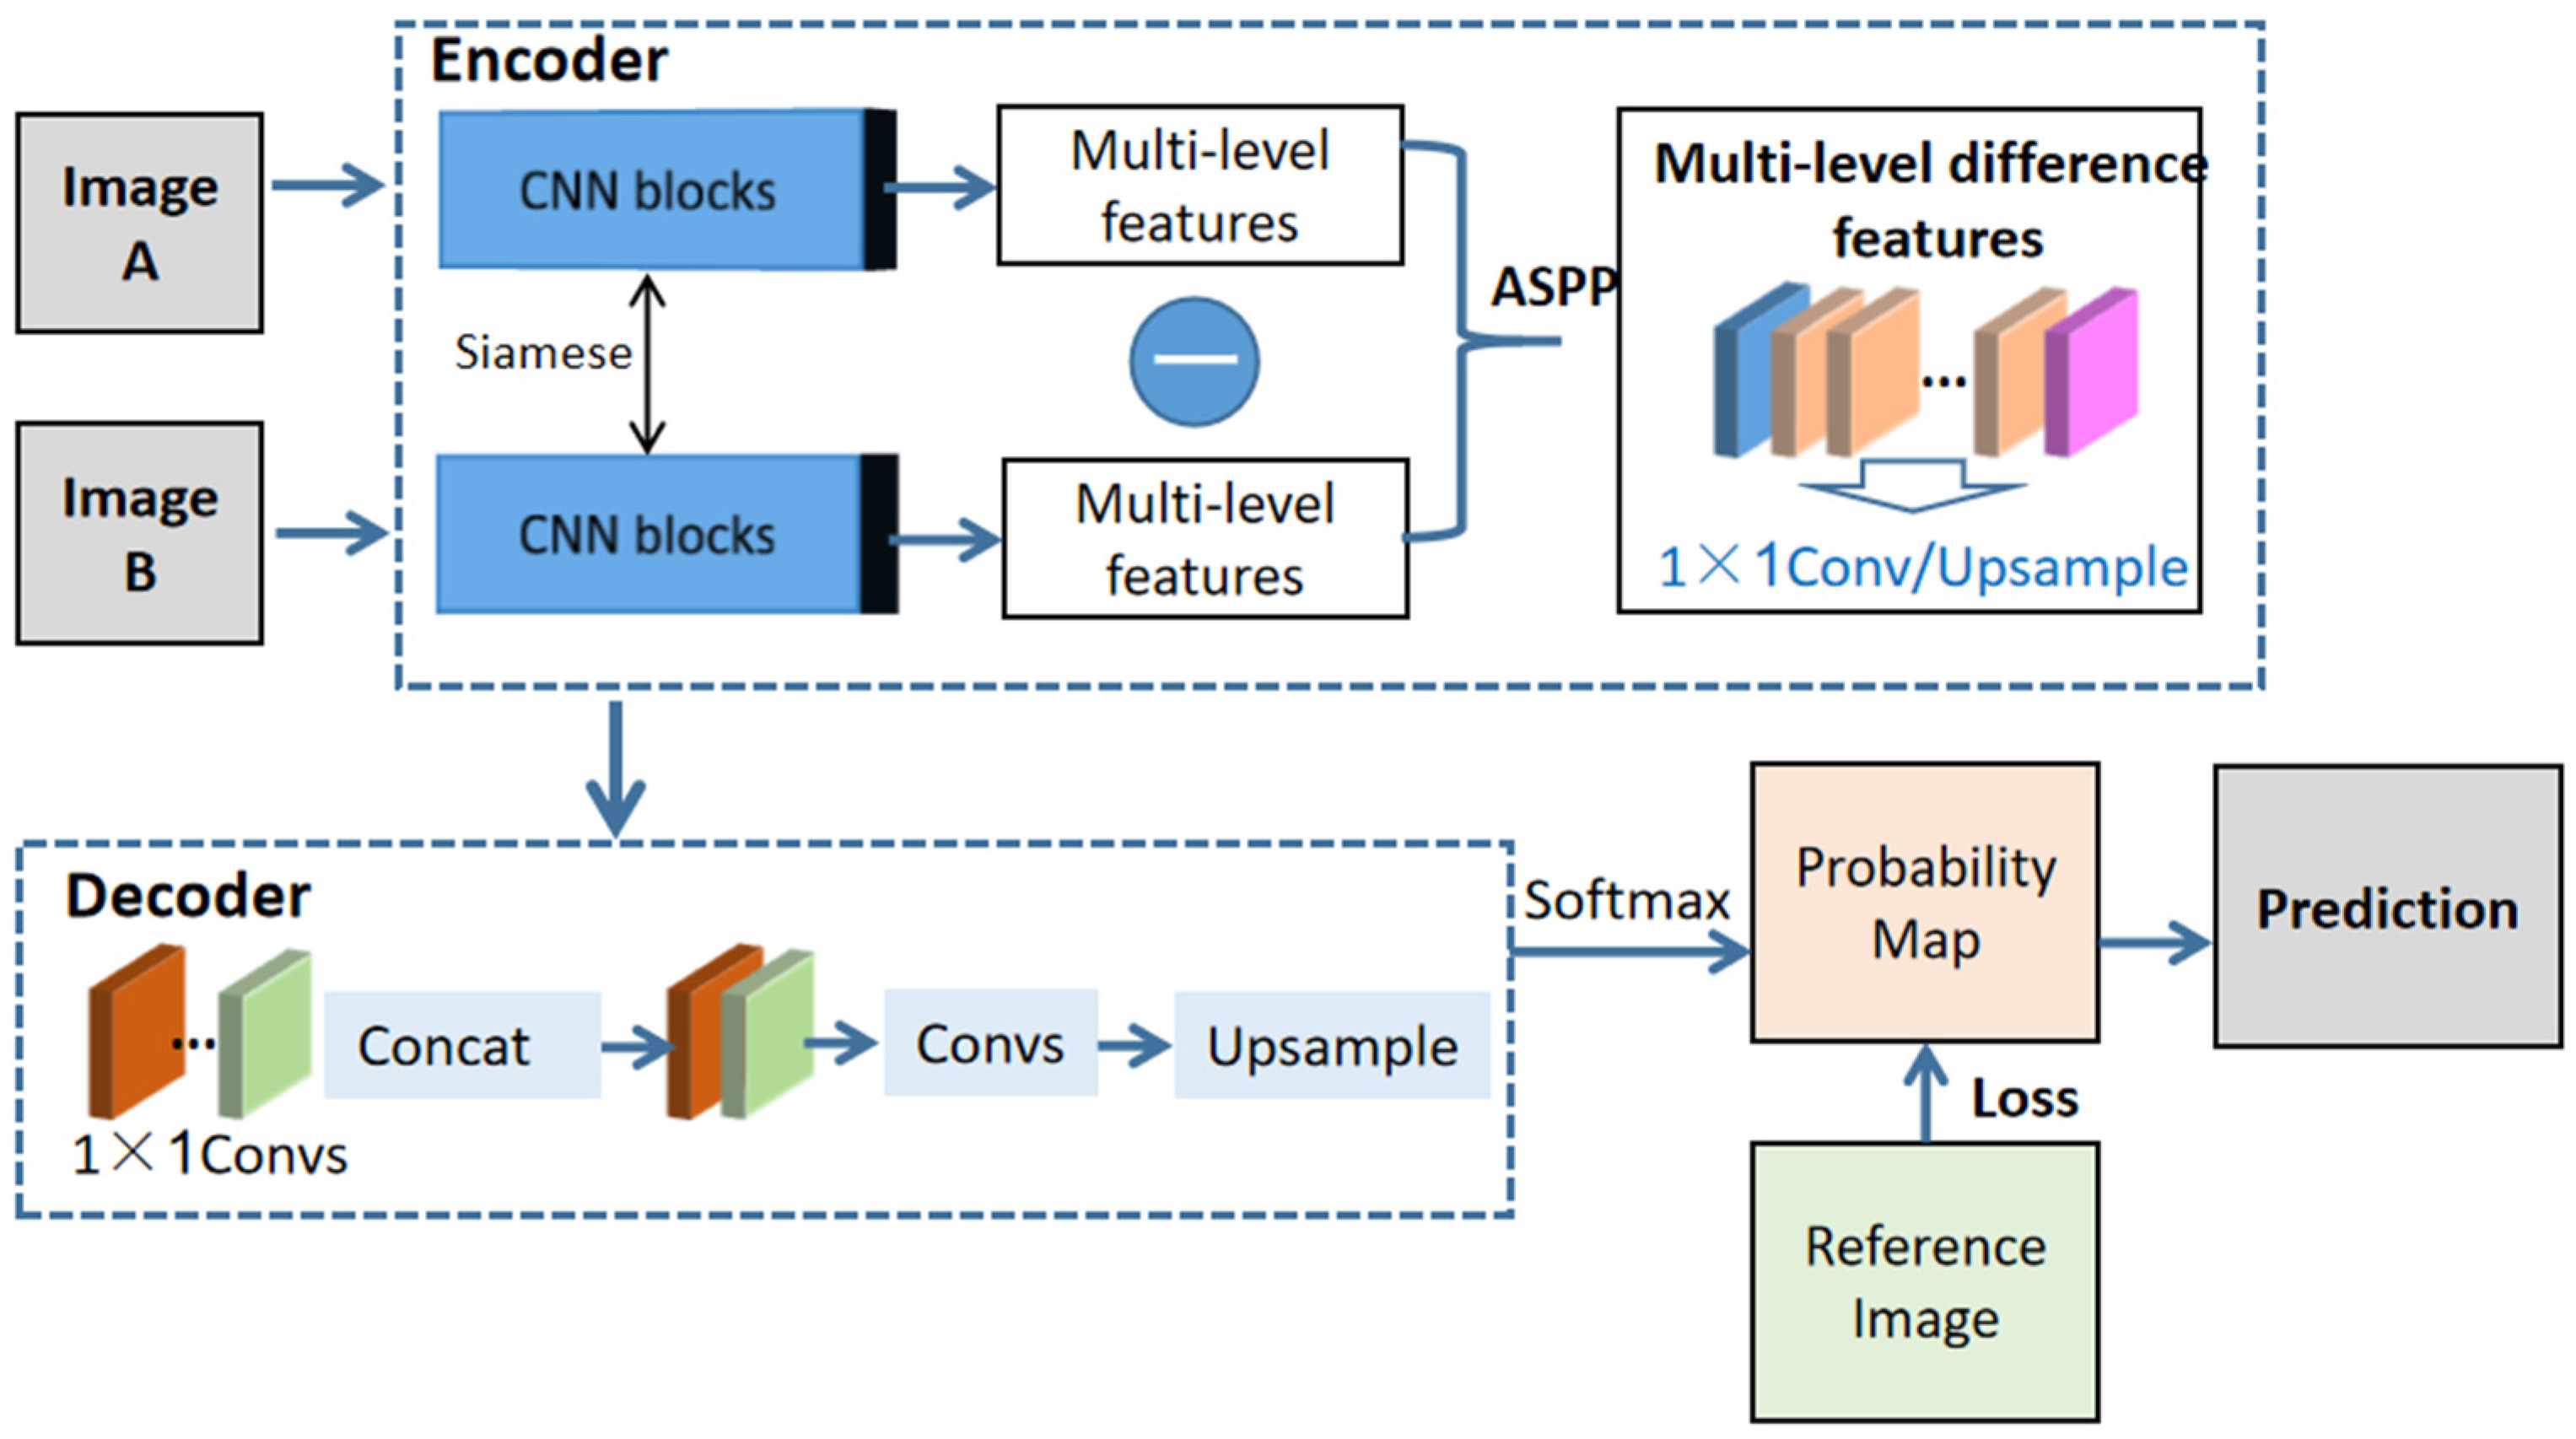
13]. Presently, relatively few relevant studies have used deep learning algorithms for high-resolution remote sensing change detection on land use in large areas (such as city- and national-level) with practical business applications. Furthermore, several studies are limited to a few test images or small areas. In this study, we address the business demand for the automatic feature extraction of new bare land at a national scale. This fully integrates the Siamese neural networks, atrous convolution, encoder–decoder, and other advanced algorithms and network structures to build a generalized deep CNN change detection model framework for automatic extraction on large-scale newly constructed bare land with accuracy and efficiency.
The accuracy of deep learning in the automatic feature extraction of land cover change has considerably improved compared with that of traditional algorithms. However, owing to the complexity of geospatial landscapes and non-uniform image quality, the automatic extraction of change parcels for large-scale, practical business applications is hindered by high false and missed detection rates and irregular parcel morphology. This results in a significant workload for subsequent manual verification, which makes it difficult to meet the need for high-precision and high-frequency monitoring.
Current research on feature extraction for the remote sensing of newly constructed land mainly focuses on the design and improvement of change detection models, rather than the post-processing of parcels that have been extracted [
14]. Taking new bare land as a case in point, the original parcels extracted using deep learning models are often segmented, small, or have jagged edges or holes within them, which directly affect their practical application.
Post-processing is an operation performed after the change parcels of remote sensing images have been automatically extracted, which can further reduce the errors in the parcels. Commonly used post-processing operations include parcel aggregation, morphological processing, filtering, and region growing algorithms. Of these, parcel aggregation is an important aspect of post-processing. Most current studies focus on modeling the aggregation of multi-category land use parcels [
15,
16], which takes into account the spatial topology and semantic information of the land type. However, the calculation of the semantic proximity is generally closely related to the multi-level category attributes of the land type and its tenure information. In terms of single-category parcel aggregation, there are relatively more studies on the aggregation of building outlines [
17], with no relevant post-processing studies on the parcels of newly constructed bare land.
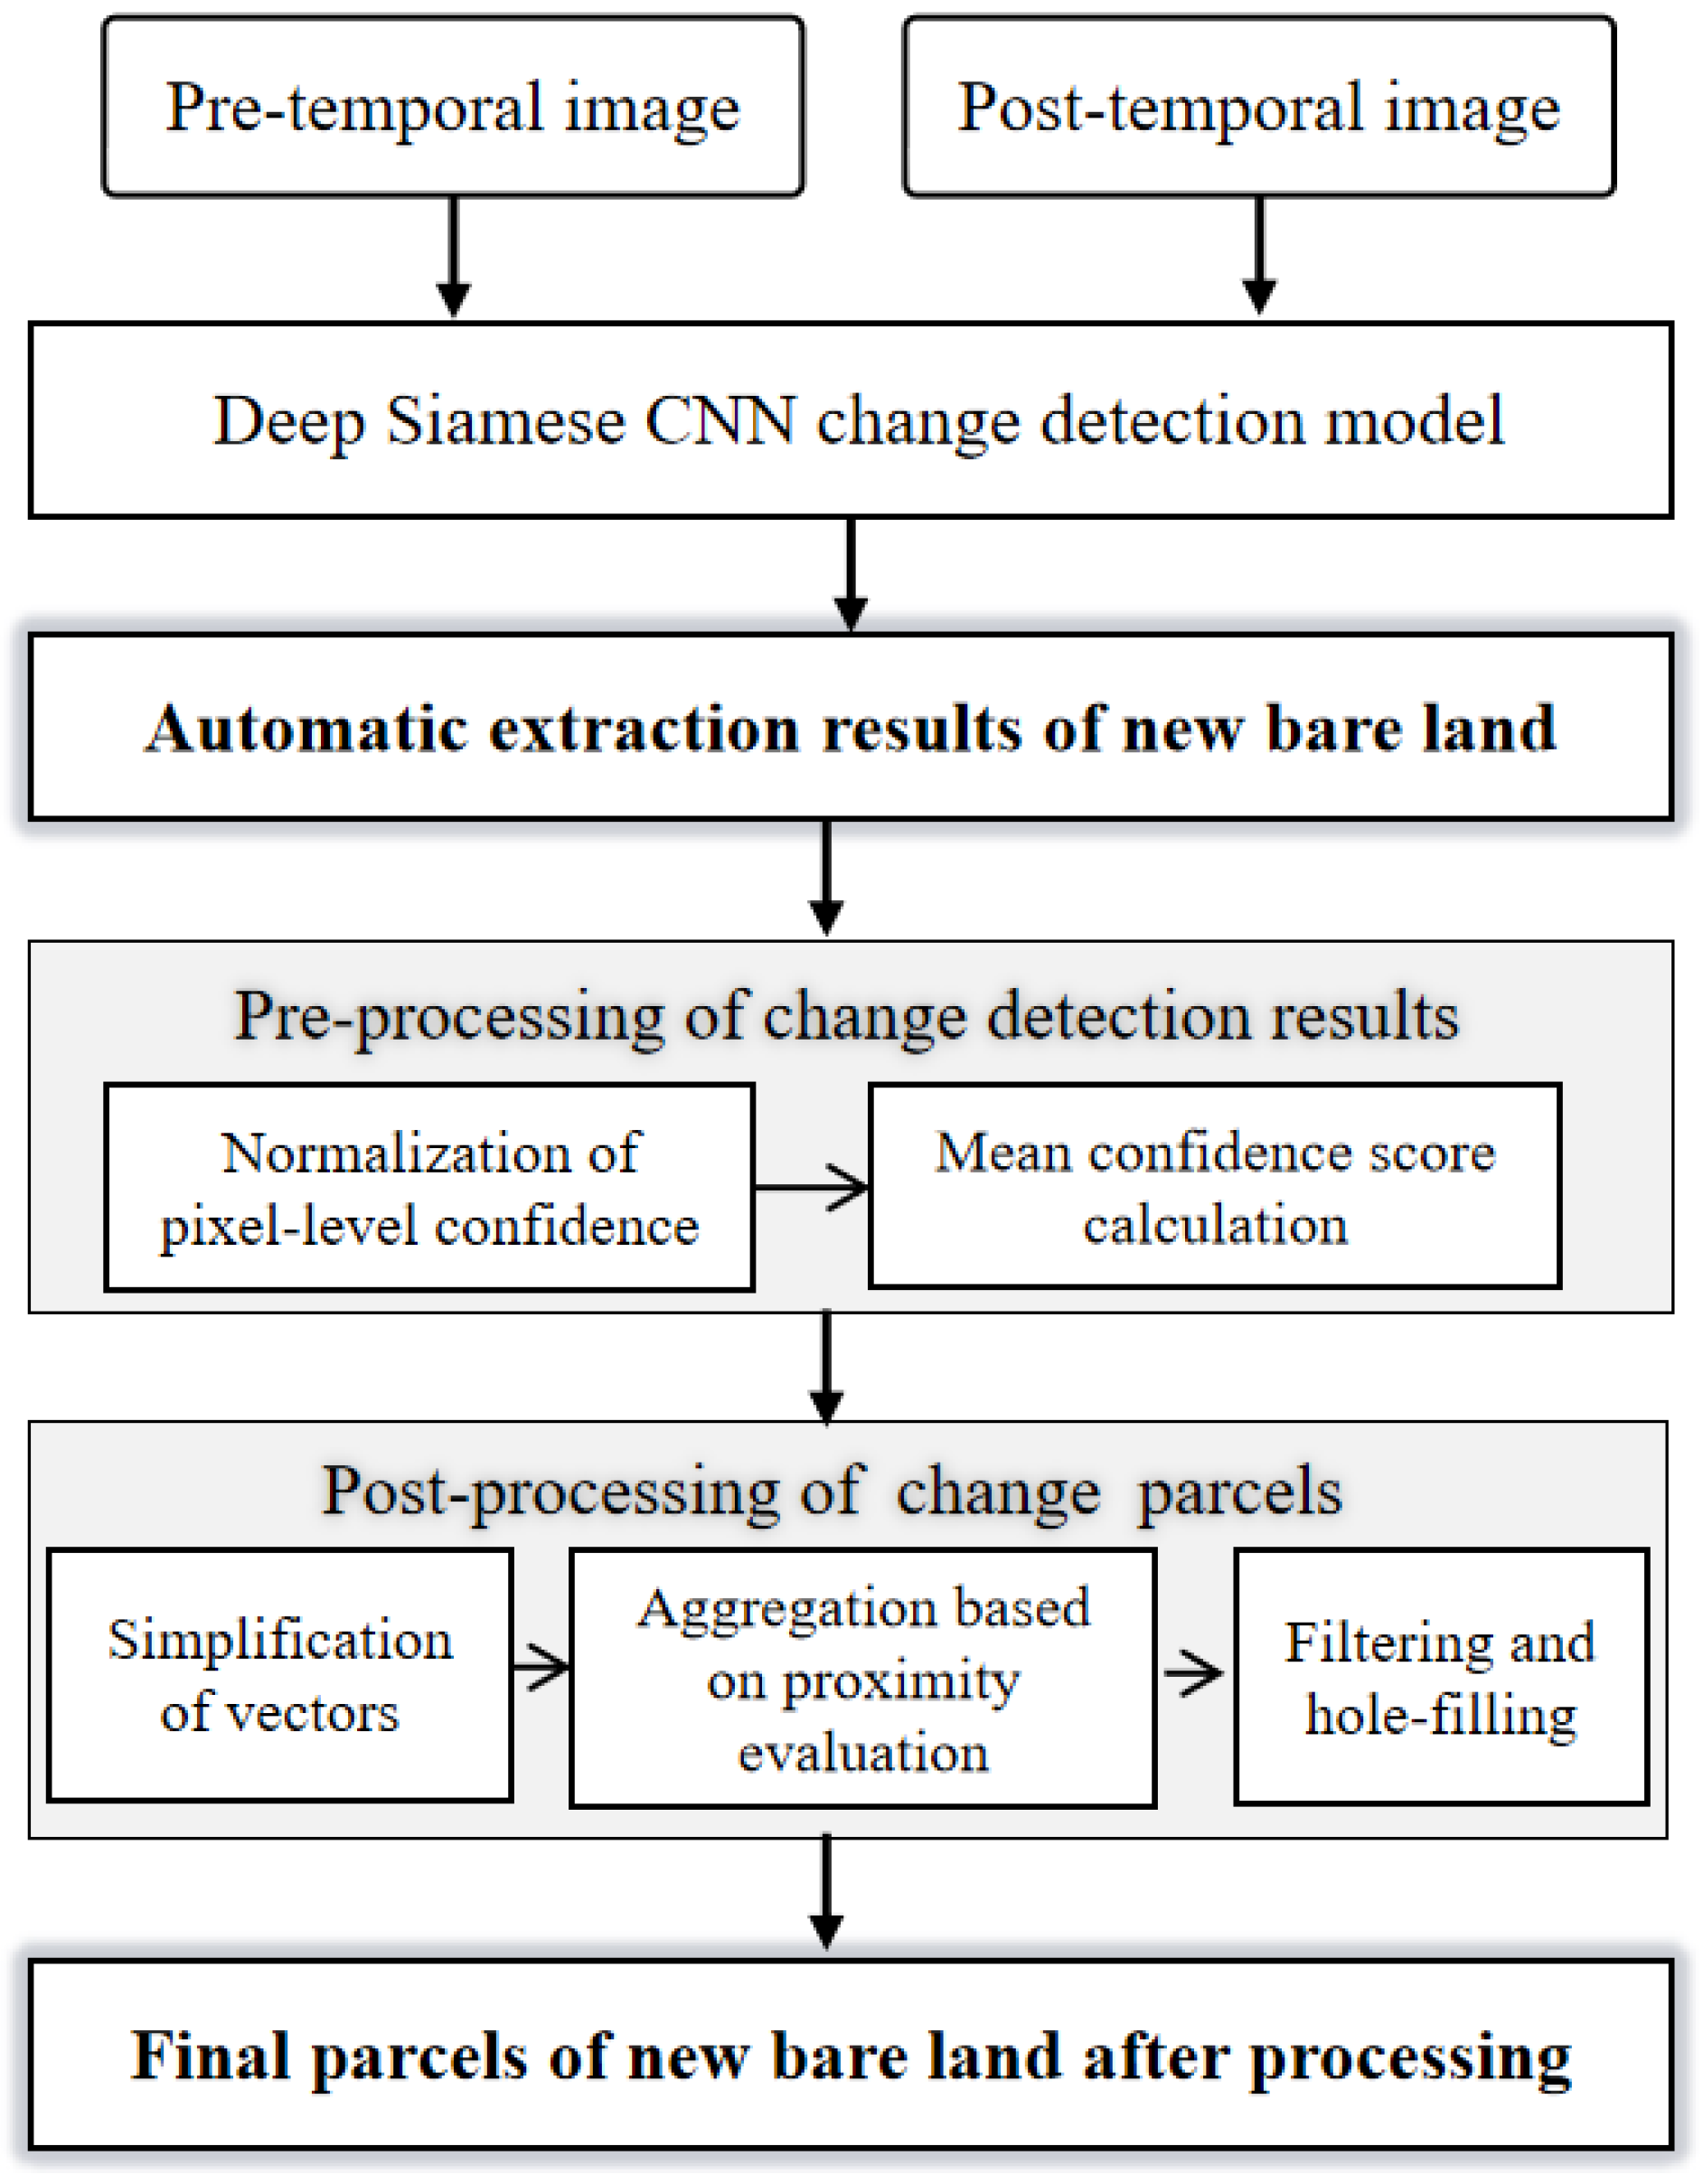
Therefore, building on the foundations of a deep CNN change detection model framework, this study focuses on adaptive post-processing techniques on the change detection results—in particular, the automatic extraction of new bare land parcels, which can further improve the performance and accuracy of change detection from the initial prediction. The major contributions of this study can be summarized as follows:
A generalized deep CNN change detection model framework is constructed by integrating Siamese neural networks, atrous convolution, encoder–decoder, and other advanced algorithms and network structures to perform the large-scale automatic extraction of new bare land parcels with accuracy and efficiency.
To tackle the issue of large data volume, false extraction, and the difficulty of practical application in the automatic feature extraction of new bare land parcels, a complete parcel optimization process from the “pixel-object” pre-processing to comprehensively post-process the vector parcels is proposed by utilizing the probability distribution of pixel-level change.
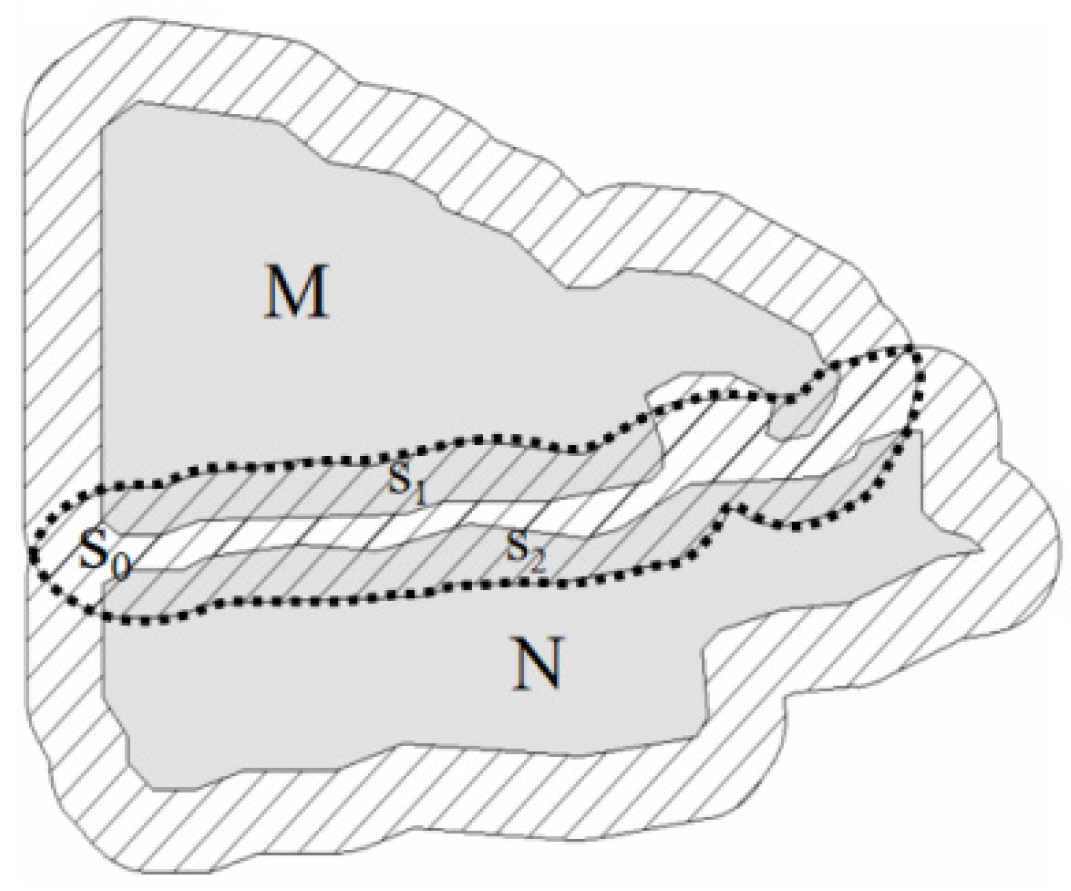
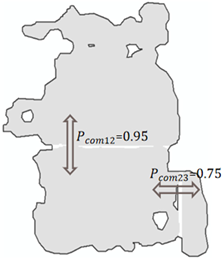
A multi-criteria proximity evaluation model is proposed by integrating the spatial distance between parcels, their overlapping area, and confidence difference to aggregate adjacent parcels.
The rest of this paper is organized as follows.
Section 2 introduces the methodology of this paper.
Section 3 presents the study areas and setup of the experiments. The experimental results are shown in
Section 4 and the performance of the proposed method is discussed in
Section 5. Finally, the conclusions are given in
Section 6.
3. Experiments
3.1. Study Areas and Data Sources
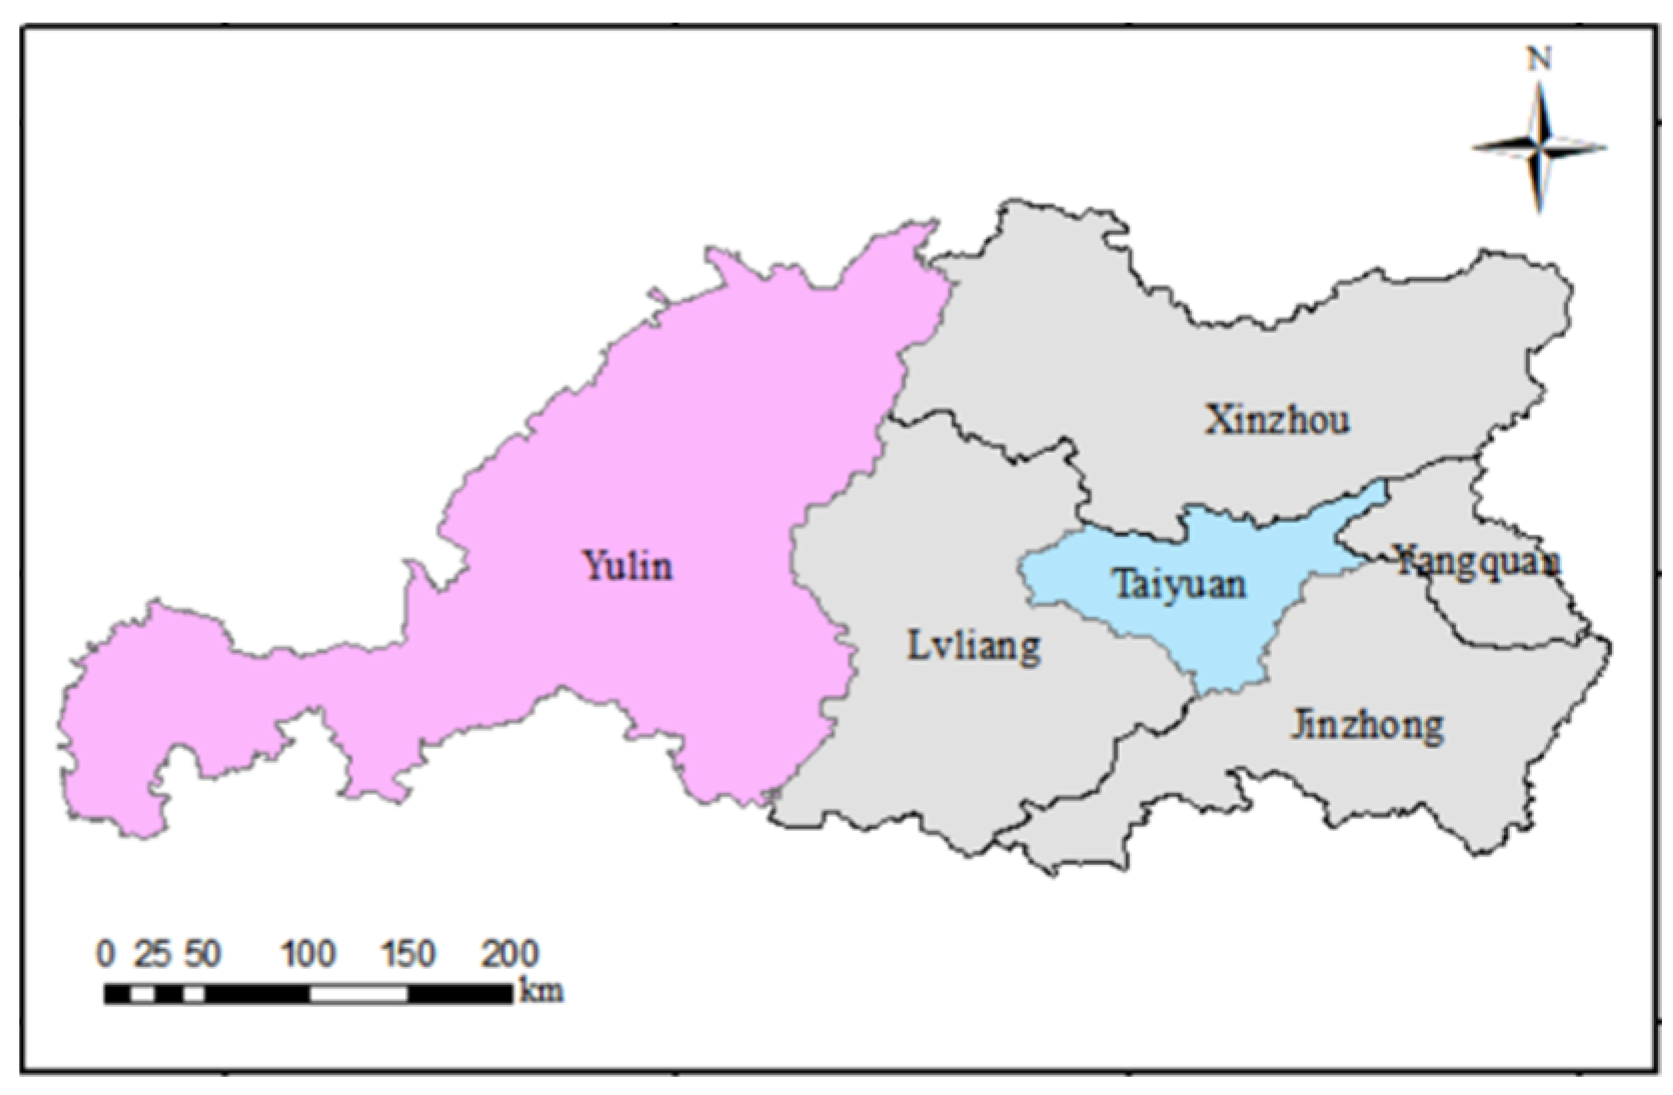
Two regions in the Shanxi Province, China, were selected as the experimental areas: Yulin and Taiyuan (
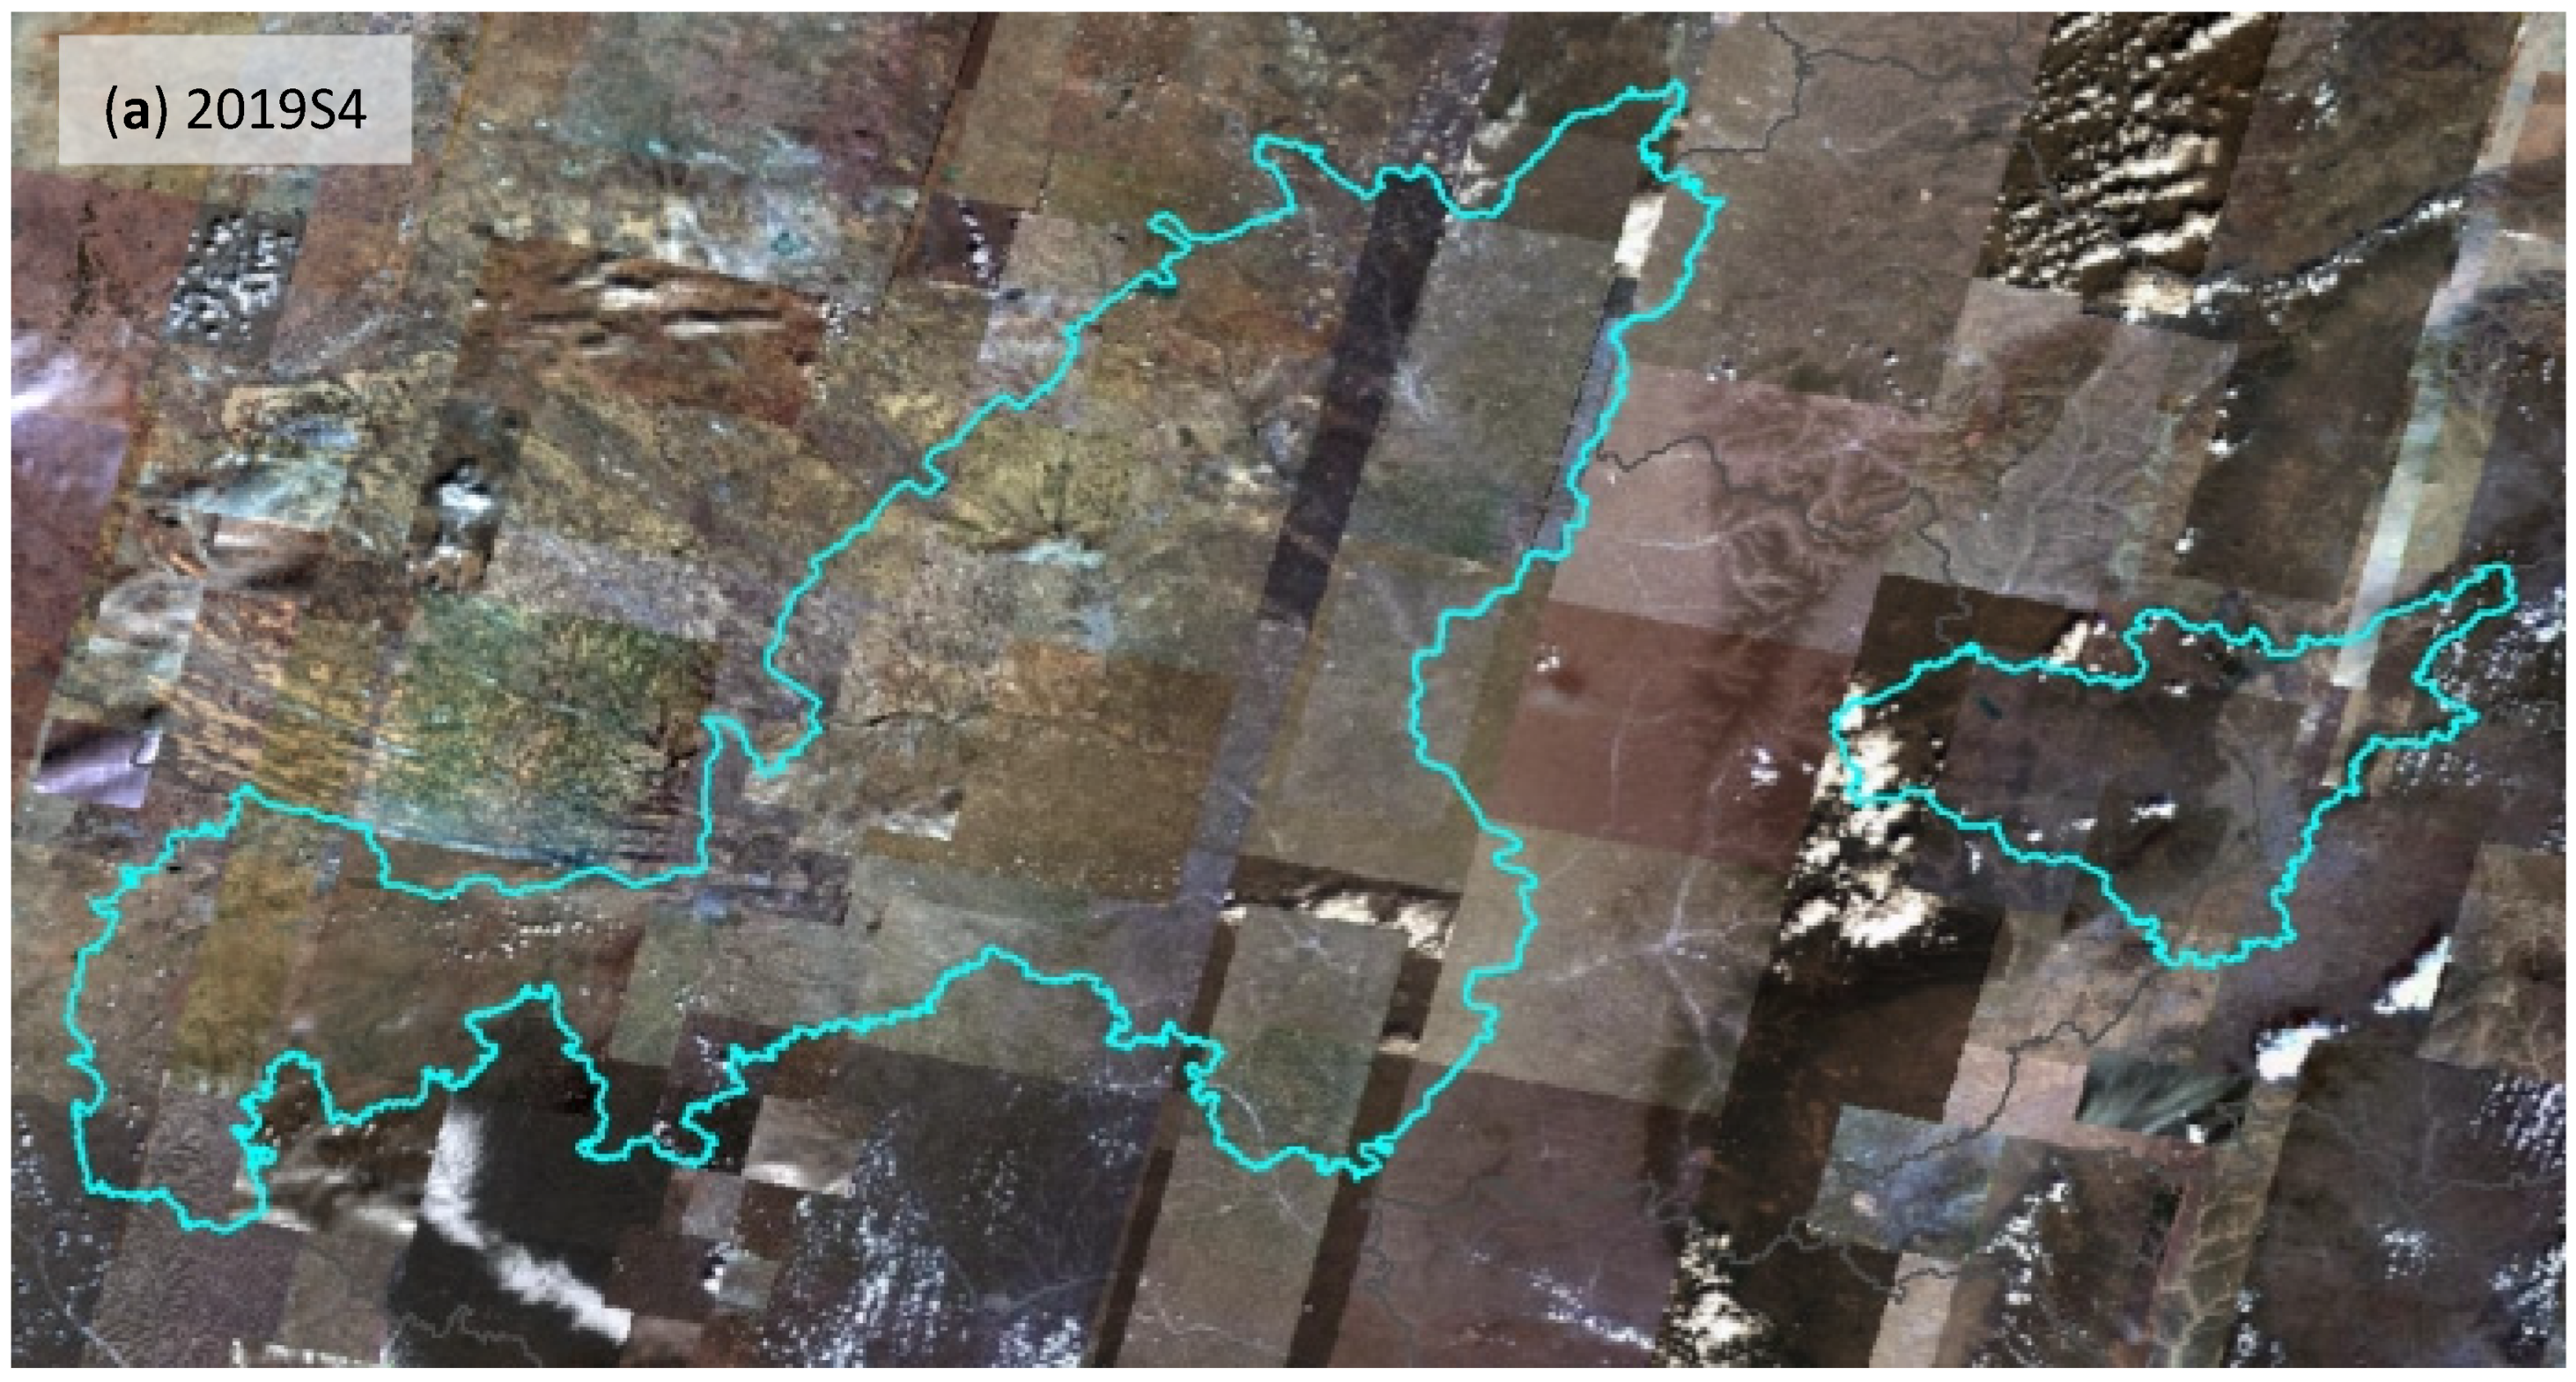
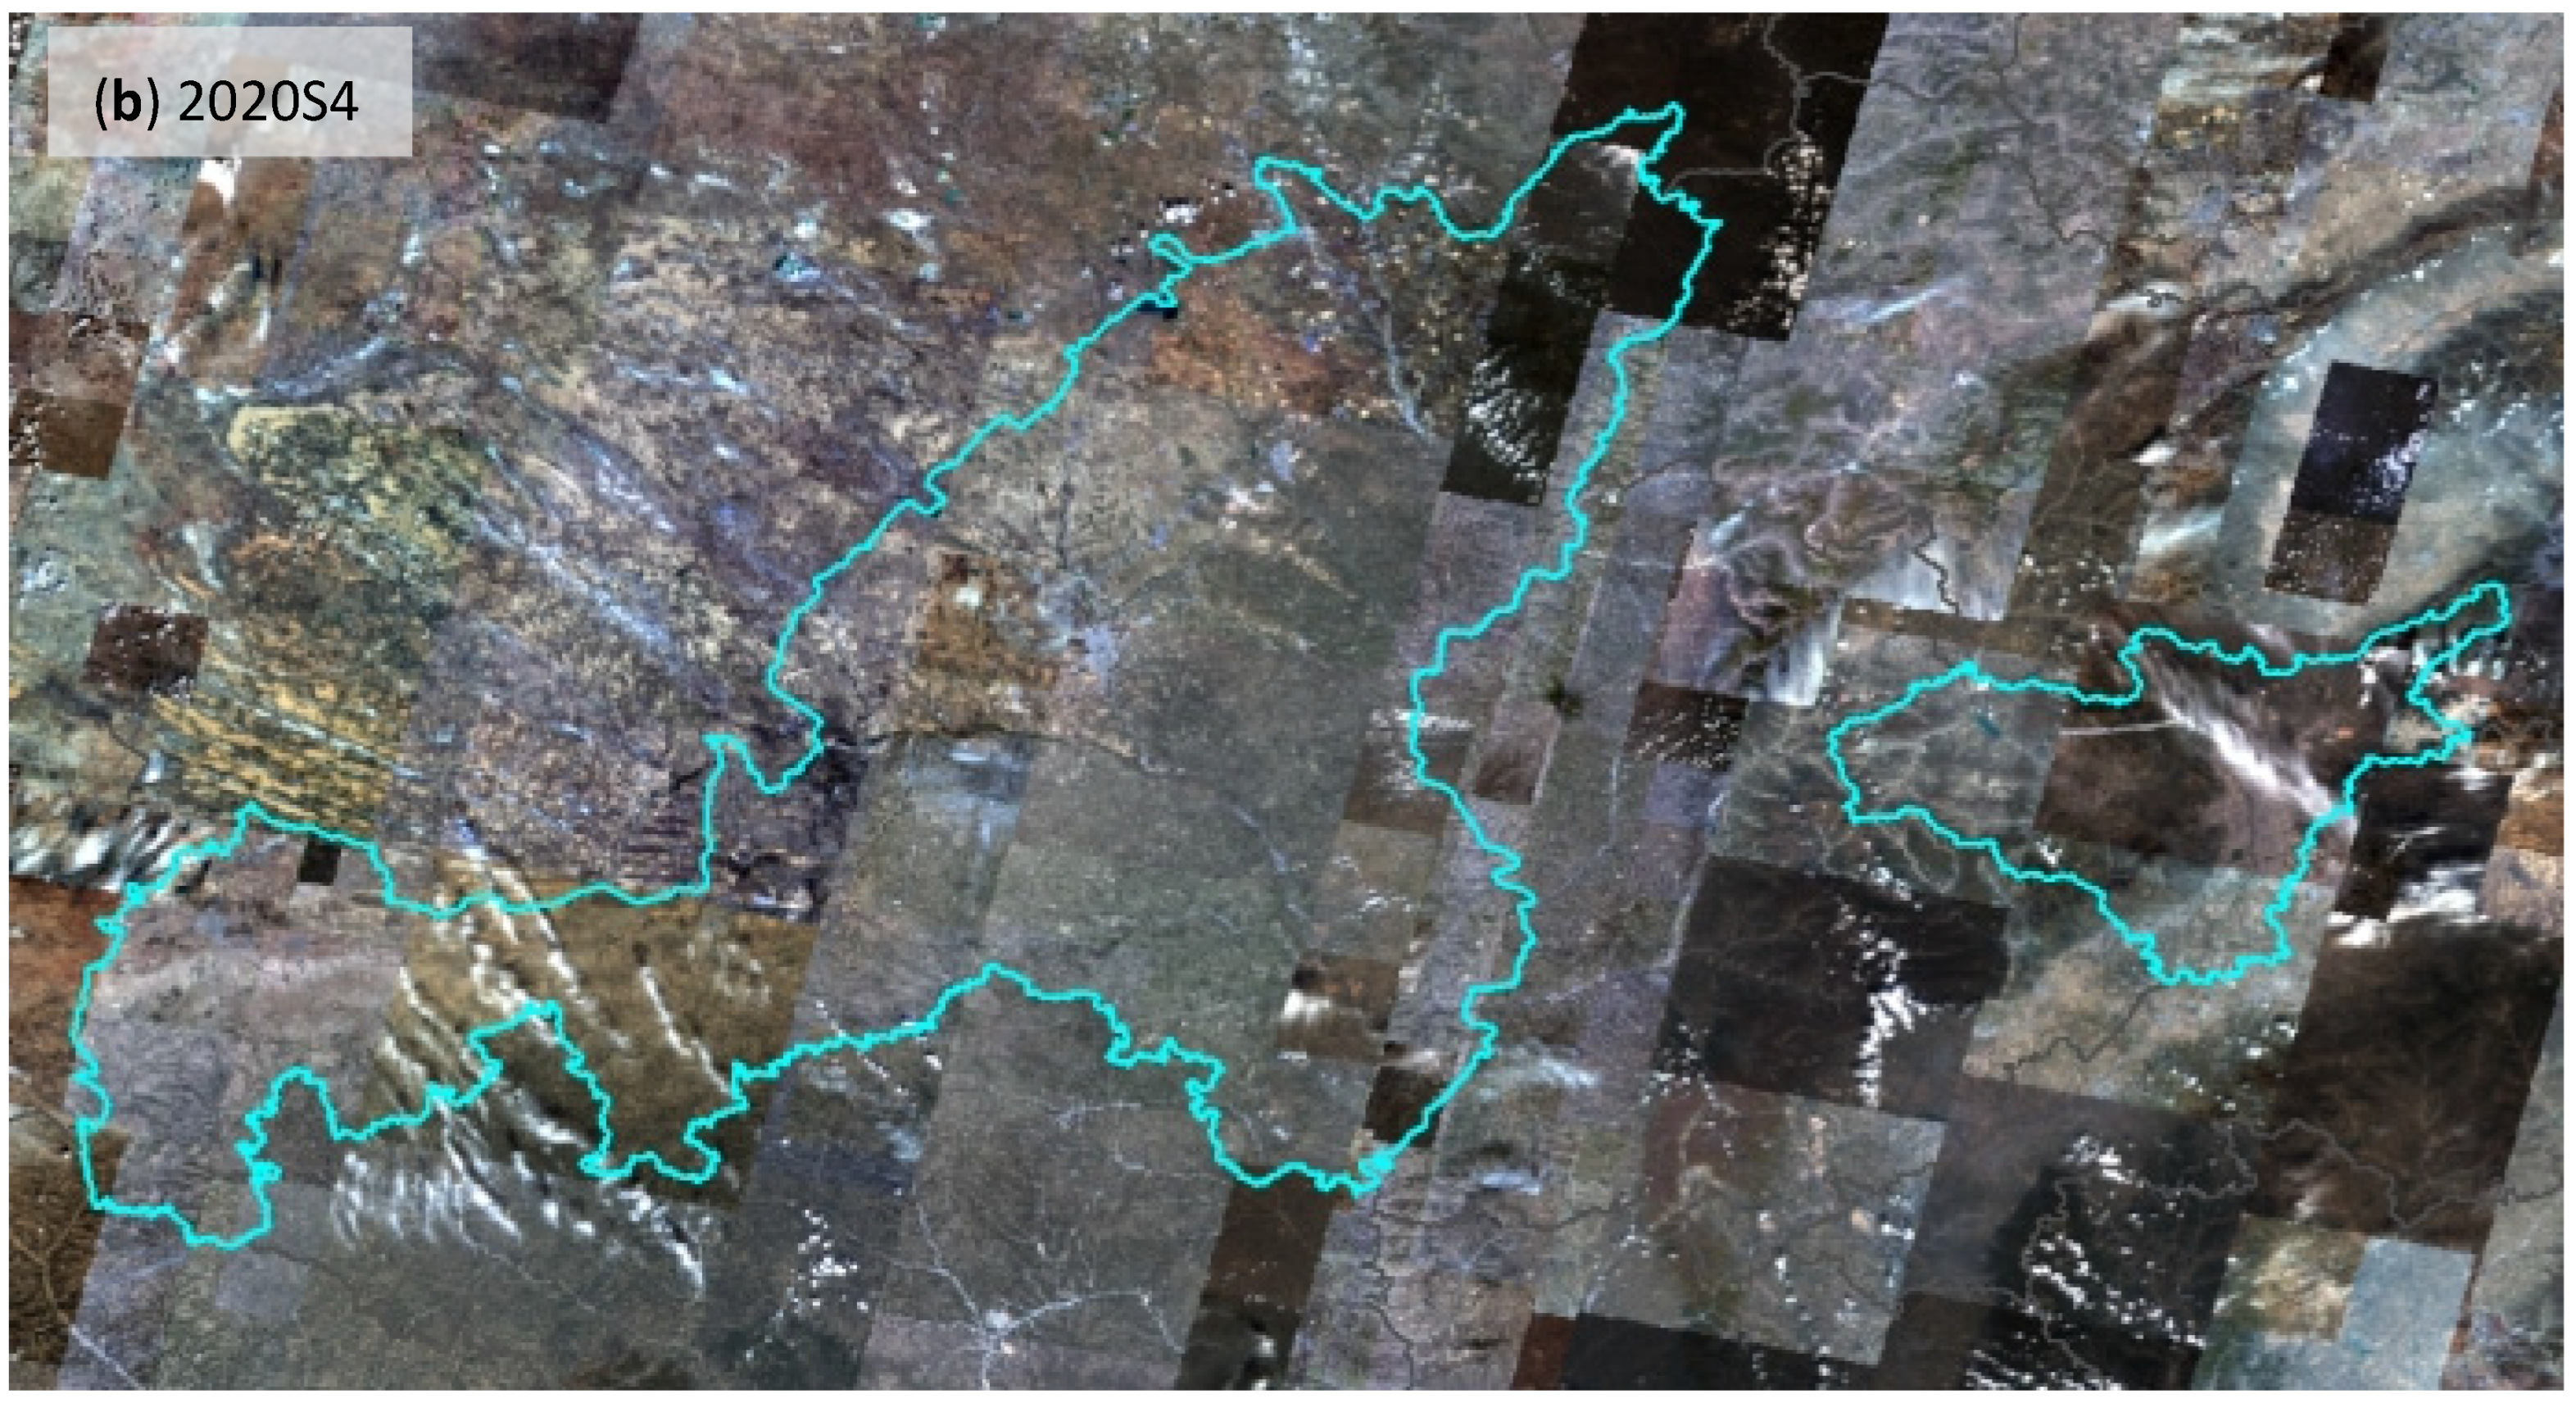
Figure 6). Based on pre-temporal and post-temporal remote sensing images from the fourth quarter of 2019 and 2020 in the experimental areas, a deep Siamese CNN change detection model was used to execute the automatic feature extraction of change information of the new bare land. The image data used in the experimental area are a mosaicking dataset of Chinese multi-sensor satellite remote sensing images (
Figure 7), including ZY3-02/03 optical stereo mapping satellites and the 2 m/8 m optical satellite constellation (GF-1 B, C, and D). The spatial resolution of the images is approximately 2 m.
As a large dataset is required to train the deep CNN change detection model, based on domestic multi-sensor satellite data with 2 m resolution, the training samples were collected and semi-automatically labeled based on the historical archives of land-use change parcels. The sample comprises a pre-temporal image, a post-temporal image, and a label.
As this study focuses on the automatic extraction of newly constructed bare land, the pre-temporal sample can be agricultural land, garden, forest, grass, buildings, or any other land type, whereas the post-temporal is fixed as constructed bare land. To maintain domain adaptation between the sample and test data, this experiment mainly selected sample data from the fourth quarter of recent years. In terms of sample diversity and balance, factors such as the target scale, image radiation, and distribution area were accounted for. The samples were sliced into 512 × 512 pixels, with the total number being 20,052, as shown in
Figure 8.
3.2. Experimental Setup
Based on the new collected bare land samples and image data of the experimental areas, the model training and change detection experiments were carried out firstly. In order to obtain relatively ideal initial change parcels, the efficiency and accuracy of the proposed deep Siamese CNN change detection model was evaluated from the aspects of backbone network selection, hyper-parameter adjustment, etc.
The change detection results of the CNN model are evaluated in the standard metric mean intersection over union (MIoU). As shown in (6), the MIoU is the ratio between the intersection and union of the two datasets, which represent the ground truth and predicted change area, respectively:
where
denotes the number of classes,
denotes a specific class,
represents the pixel number of TPs, and
and
denote FPs and FNs, respectively. Moreover, TP, FP, and FN are the number of true positives, false positives, and false negatives, respectively. The MIoU is calculated on a per-class basis and then averaged. In this paper, the change detection task is mainly divided into two classes, i.e., change and unchanged.
To verify the effects of the pre-processing and post-processing of new detected bare land parcels proposed in this study, experiments such as confidence calculation, proximity calculation and discrimination, and comprehensive post-processing were carried out, and then the results were analyzed. Furthermore, a comparison experiment between the proposed aggregation method and that of the ArcGIS aggregation tool was designed to analyze the effect of parcel aggregation and ascertain the advantages of the proposed proximity evaluation model and aggregation criteria.
To evaluate the improvement between the parcels processed by the proposed optimizing method and the original automatic extraction results in terms of accuracy and data volume, a comparison test between the experimental results and the true value from manually labeled was conducted. The number of parcels, false and missed detection rates before and after processing, were calculated to determine the final accuracy.
As shown in (7), the false detection rate is calculated as follows:
Additionally, the missed detection rate is calculated as follows:
where
denotes the number of change parcels in different processes output by the experiments,
denotes the number of manually labeled parcels, and
denotes the number of intersecting parcels between A and B.
4. Results
4.1. Automatic Extraction Results of New Bare Land
Based on the Siamese CNN change detection framework proposed in this paper, 20,052 samples were divided into training and validation sets in the ratio of 8:2 for model training. The samples were only enhanced with rotation, mirroring, and dithering. ResNet (Residual Network) was used as the model backbone, and the multi-layer feature merging strategy in the encoding and decoding process is consistent with that in deeplabv3+, which uses the first and last layers for feature merging.
The accuracy and speed of two different model versions of ResNet, ResNet101, and ResNet152 were comparatively analyzed. After 100 iterations of training, the overall training MIoU was approximately 78% using 6 V100 GPUs (32G memory). The training time of resnet101 and resnet152 was 41 and 55 h, respectively. As their accuracy levels are similar, this study selected resnet101, which has better training and prediction efficiency, as the backbone. Additionally, the hyper-parameters were adjusted to obtain the optimal training model for the prediction of new bare land parcels in the experimental area.
Based on the trained model, the automatic feature extraction of new bare land was performed in two experimental areas in Yulin and Taiyuan (with an area of approximately 50,000 km
2). The initial numbers of automatically extracted parcels were 17,733 and 2521 in Yulin and Taiyuan, respectively (
Figure 9). Part of the extraction results after the vectorization of parcels are shown in
Figure 10. Overall, the model can predict most new bare land types. The objects on pre-temporal images cover a variety of types, such as cultivated land, forest land, grassland, and buildings, it can be seen that the model is relatively robust. However, a large number of missed extractions, false extractions, and inaccurate target morphology have been revealed by manual visual interpretation. The number of automatically extracted parcels and manually identified parcels were counted, and the false detection rate (FDR) and missed detection rate (MDR) of automatically extracted parcels were calculated (Equations (7) and (8)) with a 50% overlap rate criterion. The results are shown in
Table 1. The initial FDR of the two experimental areas was relatively high, both above 70%, and the MDR did not exceed 30%.
The initial results of automatic extraction based on CNN are less than satisfactory for several reasons.
First, the number of samples was limited, and these samples cannot ensure the complete coverage of the texture, color, shape, and other features of bare land change parcels in the experimental area, which is the main reason for the missed extraction. Second, as shown in
Figure 7, for the multi-sensor mosaic images, local areas with cloud cover or large differences in radiation at the borders of the mosaic images may lead to false extraction. Third, the current change detection model based on deep learning mainly adopts supervised learning, which has several limitations. The model is usually strongly dependent on samples. Additionally, for the inconsistency of color, radiation and definition of multi-sensor remote sensing images in practical applications, the robustness of the model needs to be enhanced.
Therefore, in this paper, based on the automatically extracted parcels, we performed the optimization processing of the parcel morphology and topology to improve the initial extracted results.
4.2. Results of the Parcel Optimization Process
Based on the automatic extraction results of the two experimental areas, the confidence scores of all parcels were calculated according to the pre-processing methodology in
Section 2.2. Next, the post-processing of the change parcels was performed according to the steps in
Section 2.3. In the experiments, the edge simplification tolerance parameter was set to one pixel. When calculating the spatial proximity,
was set to a width of two pixels. When calculating the buffer overlap area ratio, the buffer radius was set to five pixels in width. In the parcel aggregation proximity model,
0.3, and
0.2, were used to calculate the
value for the proximity of two neighboring parcels.
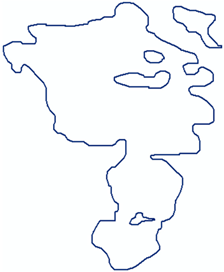
The results of each process of the parcel optimization are shown in
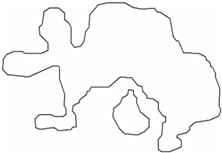
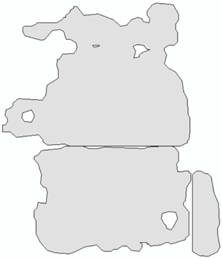
Table 2, namely pre-processed parcels, simplified parcels, aggregated results, and final results after hole-filling, removal of small parcels, and confidence filtering.
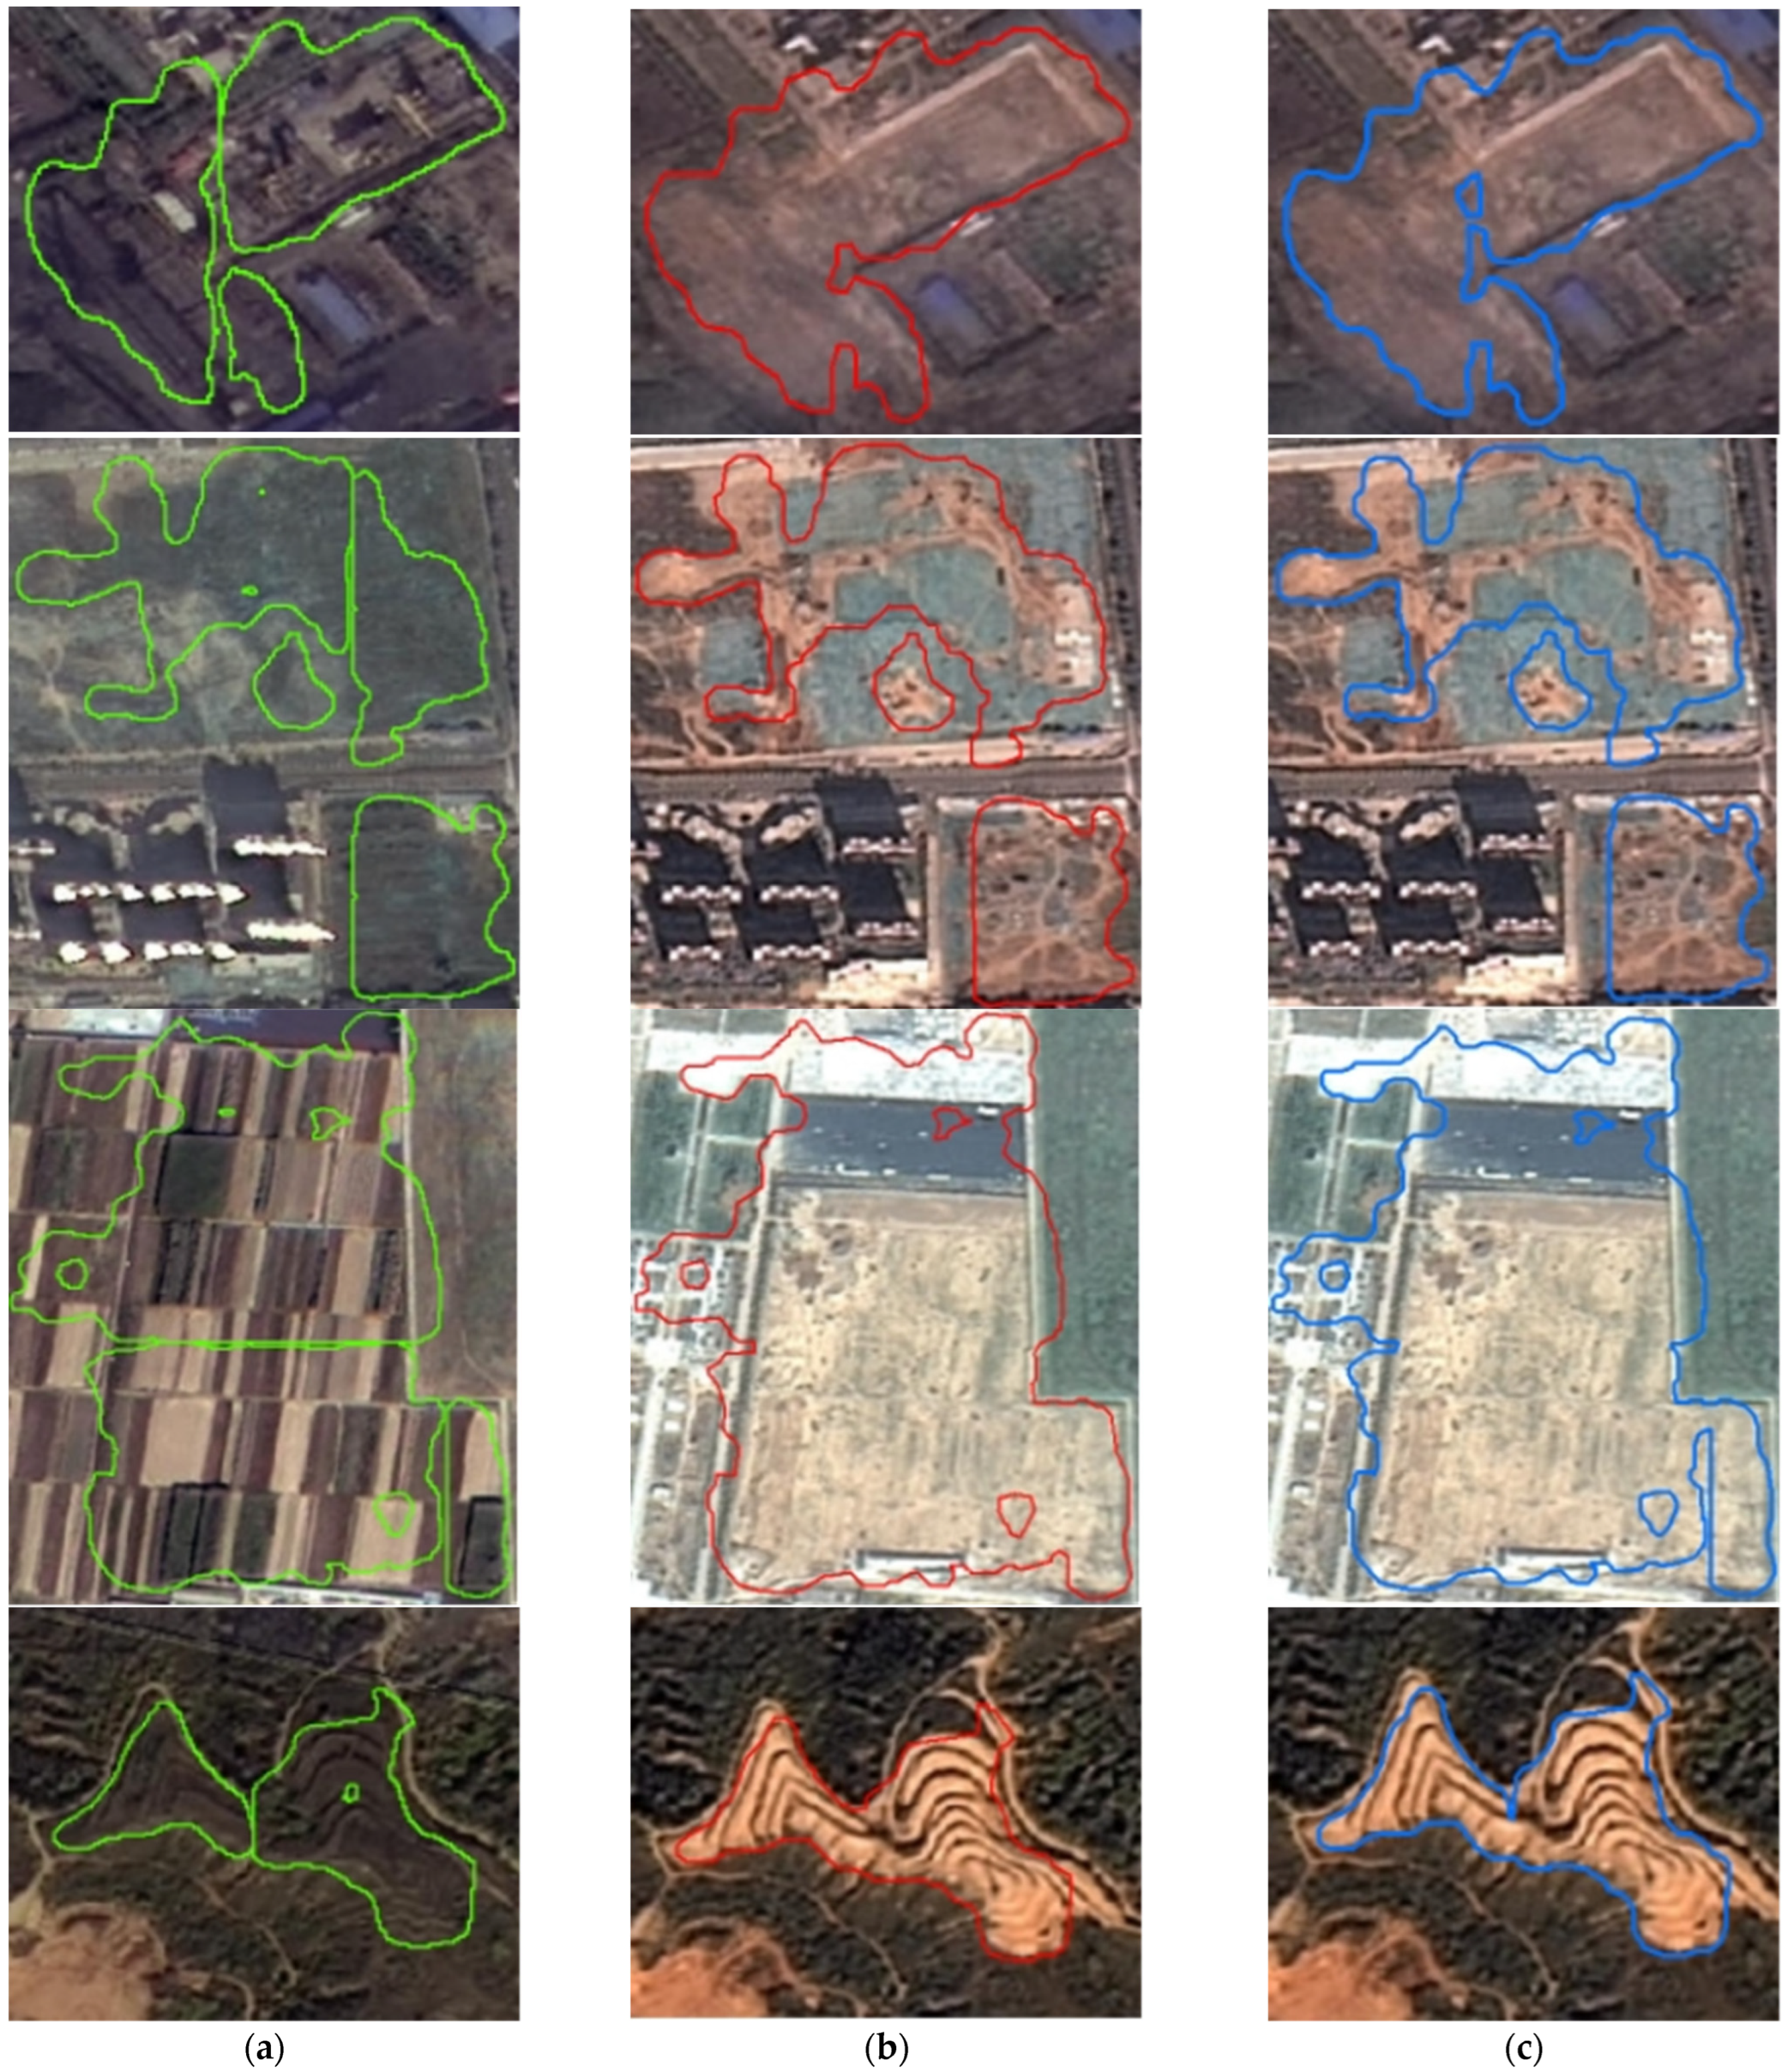
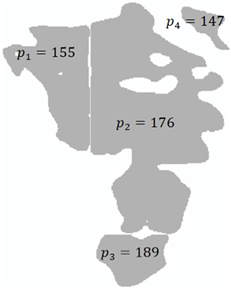
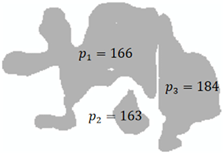
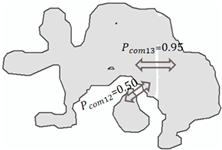
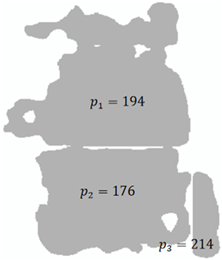
In the table above, the (a) column shows examples of the pre-processed parcel with three to four adjacent parcels in each example, and each of their confidence values (P1, P2, P3, and P4) are calculated. As shown in
Table 3 below, the proximity (
) was calculated only for pairs of adjacent parcels with intersecting buffers, and the aggregation threshold (
) was set to 0.65 in this experiment. The aggregated results are shown in column (c) of
Table 2. The final results of the optimization process are shown in
Table 2d after area filtering, hole-filling, and confidence filtering, where the area filter threshold (
) was set to
, and the confidence score filtering range
of the aggregated parcels was 165–255. Based on the processing results, the overall post-processing process proposed in this paper is reasonable and can effectively solve the problems of automatically extracted parcels being segmented, having holes or redundancy.
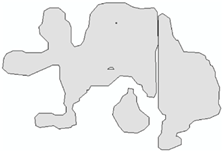
To verify the effectiveness of the aggregation method proposed in this paper, the last column in
Table 2 shows the results processed using the cartographic generalization tool in ArcGIS software. The AggregatePolygons function in ArcGIS was used for aggregation. In the experiment, the aggregation distance parameter
aggr_dis was set to a five-pixel width, and the parcel filtering area and size of the holes that were retained were consistent with the method in this paper. According to the post-processing examples in
Table 2 and several processed results in
Figure 11, the comparative analysis is as follows:
The ArcGIS processing results of Examples 1, 2, and 4 in
Table 2 are slightly different from the final results obtained using the method proposed in this paper in column (d). For the case of the uneven distance between two parcels, the aggregation probability of the method proposed in this study is high and the parcels can be easily aggregated. This is due to the proposed aggregation method incorporating semantic confidence within a certain buffer range (five pixel width), and the spatial proximity only considers the nearest distance between two parcels, which is relatively loose. The ArcGIS aggregation method does not consider the semantic information of the parcels and is restrictive for the distance evaluation, resulting in some fragmentation of the final new bare land parcels. As the connectivity of bare land types tends to be wide rather than narrow, the overall aggregation method proposed in this paper is targeted and effective.
Additionally, in Example 2, the confidence score of the top-right parcel is low and does not satisfy the aggregation condition. The method proposed in this paper can effectively eliminate such discrete distribution parcels with high error rates through confidence-based filtering.
5. Discussion
The number of automatically extracted parcels of the two test areas after aggregation, area filtering, confidence filtering, and other post-processing experiments is shown in
Figure 12. Aggregation processing mainly serves to reduce the degree of fragmentation of parcels, and the number is reduced by about 10%. Area filtering only removed less than 5% of the parcels, mainly due to the small number of bare land parcels with an area less than
in the experimental area. In addition, the proportion of small area parcels in the training samples is relatively low.
The final confidence filtering step can significantly reduce the redundant parcels, and the final numbers were 7216 and 1109 for Yulin and Taiyuan, respectively. Compared with the initial data volume, the total number of parcels decreased by more than 50%.
Compared with the manually labeled parcels, the false and missed detection rates of the two areas were calculated. As shown in
Table 4, compared with the initial extraction results in
Table 1, the FDR decreased by approximately 30%, and the MDR correspondingly increased by approximately 4–6% with a significant reduction in the total numbers of extracted parcels.
Statistical analysis results suggested that the optimization processing method proposed in this paper markedly reduces the false detection of automatically extracted parcels, which can solve the current problems of large data volume and high-FDR associated with automatically extracted change parcels using deep learning and other methods. This study improves the feasibility of using automatic change detection parcels in actual monitoring applications. Furthermore, the process of confidence filtering will inevitably delete some correct parcels, and it is necessary to select the optimal confidence value through a large number of experiments to balance the FDR and MDR of the final extraction results.
6. Conclusions
In this paper, a complete framework for the automatic feature extraction, parcel pre-processing, and comprehensive post-processing of new bare land from remote sensing images has been introduced. A general deep Siamese CNN change detection model was designed, which can perform the change detection of various land types. To address the problems of false extraction and segmented and large redundancy of automatically extracted parcels via deep learning, this paper focuses on the subsequent optimization of the processing of these parcels.
Combining the characteristics of the area distribution and shape connectivity of the bare land change parcels, a targeted aggregation model is proposed. The experimental results using the proposed method are better than those obtained by ArcGIS. A technical methodology for parcel optimization from “pixel-object” pre-processing to the comprehensive post-processing of vector parcels is proposed. The parcel statistical results revealed that the proposed method has significant effects on parcel aggregation, reducing parcel redundancy and false detection.
Although the method proposed in this paper can reduce the false detection, it erroneously removes a few correct parcels. The missed detection rates in the experiment are approximately 20–30%; thus, there is still a large room for further improvement. Further experiments will be performed to obtain the optimal parameter to balance the false and missed detection rates. Additionally, the domain adaptation study of the samples and images to be detected will be carried out to further improve the overall accuracy.
