Article

Coordinate Frames and Transformations in GNSS Ray-Tracing for Autonomous Driving in Urban Areas

Institut für Erdmessung, Leibniz Universität Hannover, 30167 Hannover, Germany
*
Author to whom correspondence should be addressed.
Remote Sens. 2023, 15(1), 180; https://doi.org/10.3390/rs15010180
Submission received: 22 November 2022 / Revised: 16 December 2022 / Accepted: 21 December 2022 / Published: 29 December 2022
(This article belongs to the Special Issue GNSS for Urban Transport Applications)

Abstract

:
3D Mapping-Aided (3DMA) Global Navigation Satellite System (GNSS) is a widely used method to mitigate multipath errors. Various research has been presented which utilizes 3D building model data in conjunction with ray-tracing algorithms to compute and predict satellites’ visibility conditions and compute delays caused by signal reflection. To simulate, model and potentially correct multipath errors in highly dynamic applications, such as, e.g., autonomous driving, the satellite–receiver–reflector geometry has to be known precisely in a common reference frame. Three-dimensional building models are often provided by regional public or private services and the coordinate information is usually given in a coordinate system of a map projection. Inconsistencies in the coordinate frames used to express the satellite and user coordinates, as well as the reflector surfaces, lead to falsely determined multipath errors and, thus, reduce the performance of 3DMA GNSS. This paper aims to provide the needed transformation steps to consider when integrating 3D building model data, user position, and GNSS orbit information. The impact of frame inconsistencies on the computed extra path delay is quantified based on a simulation study in a local 3D building model; they can easily amount to several meters. Differences between the extra path-delay computations in a metric system and a map projection are evaluated and corrections are proposed to both variants depending on the accuracy needs and the intended use.

1. Introduction

Quality requirements for positioning in terms of accuracy, continuity and integrity are very stringent for urban navigation applications, such as autonomous driving [1,2,3]. The GNSS sensor is the only navigation system providing absolute positioning, and is, therefore, indispensable in multi-sensor navigation systems. To enable accurate and precise GNSS positioning, various error sources need to be modeled and corrected. The GNSS error sources, such as orbit errors, satellite clock errors or errors from ionospheric and tropospheric refraction, as well as relativistic effects are well-known and can be modeled or estimated accurately in relative positioning approaches [4] and Precise Point Positioning (PPP) [5], respectively. However, in urban areas, multipath and non-line-of-sight (NLOS) signal propagation are remaining error sources. NLOS delays can reach up to twice the orthogonal distance to the reflector plane (e.g., tens of meters for small urban trenches in European inner cities [6,7] and up to hundreds of meters for urban canyons in metropolitan cities [8,9]).
The delay caused by a multipath depends on the extra path delay and the receiver settings and is typically assessed by the multipath envelope function for code observations yielding up to 30–50 m. For the carrier phase, the impact ranges from millimeters to a maximum of a quarter of the wavelength (typically around 5 cm) [10].
In order to mitigate multipath errors, 3DMA GNSS is a widely adopted method [11]. Furthermore, 3DMA GNSS can be divided into three specific categories: terrain height aiding, shadow matching and 3DMA ranging techniques. Firstly, terrain height aiding increases the horizontal accuracy in dense urban areas by constraining the positioning solution to a known surface height using a digital terrain model [12,13]. Secondly, shadow matching is a GNSS positioning technique which uses 3D building model data to determine the user position by exploiting the satellite visibility prediction [14] and comparing the predicted and measured signal-to-noise ratios [15,16].
In terms of 3DMA ranging techniques, various research has been presented which utilizes 3D building model data in conjunction with a ray-tracing algorithm to predict and detect satellites’ visibility conditions (line-of-sight (LOS), multipath, diffraction, NLOS) [17,18] and subsequent delays caused by signal reflection for GNSS multipath error correction [19,20,21]. This method is also used to realistically simulate GNSS signals in challenging environments [22]. The preceding approaches can be combined to further improve GNSS positioning in urban environments through machine learning [23].
In order to determine accurate extra path delays and subsequent multipath information, the satellite–user–reflector geometry must be given in a common metric coordinate system. However, in practice, this requirement can be violated since different coordinate systems are in use and the 3D building models are often given in a map projection such as Universal Transverse Mercator (UTM), which leads to distortions of distances [24,25].
Several cities across the world provide building models in CityGML using projected coordinate systems which are comparable to the 3D building model data provided by the city of Hannover [26]. Examples are the cities of Berlin [27], Amsterdam [28], or New York City [29]. In addition, building model data is becoming more accurate, including level of detail (LoD) 3 building information and photo-realistic textures [30] or point clouds from LiDAR sensors [31,32].
Using the precise height information of the GNSS antenna locations, the accurate multipath modeling of ground reflections can be performed. In [33,34], GNSS multipath errors are simulated and validated with simple, geometry-controlled experiments. They present that multipath signal amplitudes are modeled accurately when the antenna gain is given, and the geometry of the antenna environment is known precisely. To simulate, model and potentially correct multipath errors in dynamic applications, e.g., in autonomous driving, the surrounding geometry has to be known precisely even for GNSS code observations, since the error is sensitive w.r.t. the phase shift to the cm-level [35]. Hence, inconsistencies between the various coordinate frames lead to falsely determined multipath errors. A sound description of how ray-tracing techniques deal with different coordinate frames, i.e., the coordinate frames of given building model data and user and satellite coordinates, is still lacking.
The remainder of this paper is structured as follows. Firstly, we briefly introduce our ray classification algorithm and the computation of the extra path delays. Secondly, we introduce the coordinate systems and general transformation steps that are needed when using data from different coordinate representations. We illustrate their application in a case study from Hannover, Germany. We present the different data types as well as their coordinate systems and frames used for 3DMA ray-tracing, in our case, and describe the application of the aforementioned steps. Thirdly, we quantify the impact of the inconsistencies between the involved coordinate representations on the computed extra path delay based on a simulation study. In this context, minimizing the differences between the computations of the extra path delay in a metric and a projected representation is attempted.

2. Ray Classification Algorithm

In 3DMA applications, it is tested whether the ray between a satellite and antenna is free of obstructions by buildings or blocked, reflected or diffracted, as introduced in [36].

2.1. LOS/NLOS Classification

The LOS/NLOS classification needs a common coordinate basis, as the ray is spanned between the antenna position A and the satellite position S . The resulting ray is then checked for intersections with the 3D building model. More specifically, each building’s polygon needs to be tested for an intersection with the ray.
To increase the algorithm’s speed, we firstly determine which buildings are in the vicinity of the ray and, secondly, divide all polygons into triangles to perform a ray–triangle intersection check [7]. If any of the polygons are intersected by the ray, the satellite is classified as NLOS. Otherwise, it is classified as LOS.

2.2. Determination of Signal Reflections

In order to investigate if a signal is under the influence of multipath or experiences reflections on building surfaces, reflection points need to be determined. This, again, requires the vector of the ray between an antenna and satellite, as well as nearby building surfaces, to be in a common coordinate frame.
In Figure 1, the geometry of the reflection calculation is displayed. To find the reflection point R on the reflecting surface P, the antenna position A is mirrored w.r.t this plane. The projection of the antenna onto the reflection surface K is calculated using the normalized outer normal vector n of the reflection plane and any point P 0 on the plane. The point P 0 can be any vertex, and n can be calculated from three vertices of the surface. Next, the mirrored antenna point A is calculated.
K = A + ( P 0 A ) n · n ,
A = A + 2 · ( K A ) .
The intersection between the ray from the mirrored antenna point A to the satellite S will give the reflection point R .
R = A + ( K A ) n ( S A ) n · ( S A ) .
As a result, the ray can be classified into one of the four categories:
1.
LOS: rays without obstruction and without any possible reflection points;
2.
Multipath: satellite is in LOS and additionally a signal reflection is determined;
3.
NLOS: the direct LOS is obstructed by a building but the signal can be received via reflection on a building surface;
4.
Blocked: all other cases in which the direct LOS is obstructed and a single reflection does not suffice for the signal to reach the antenna.
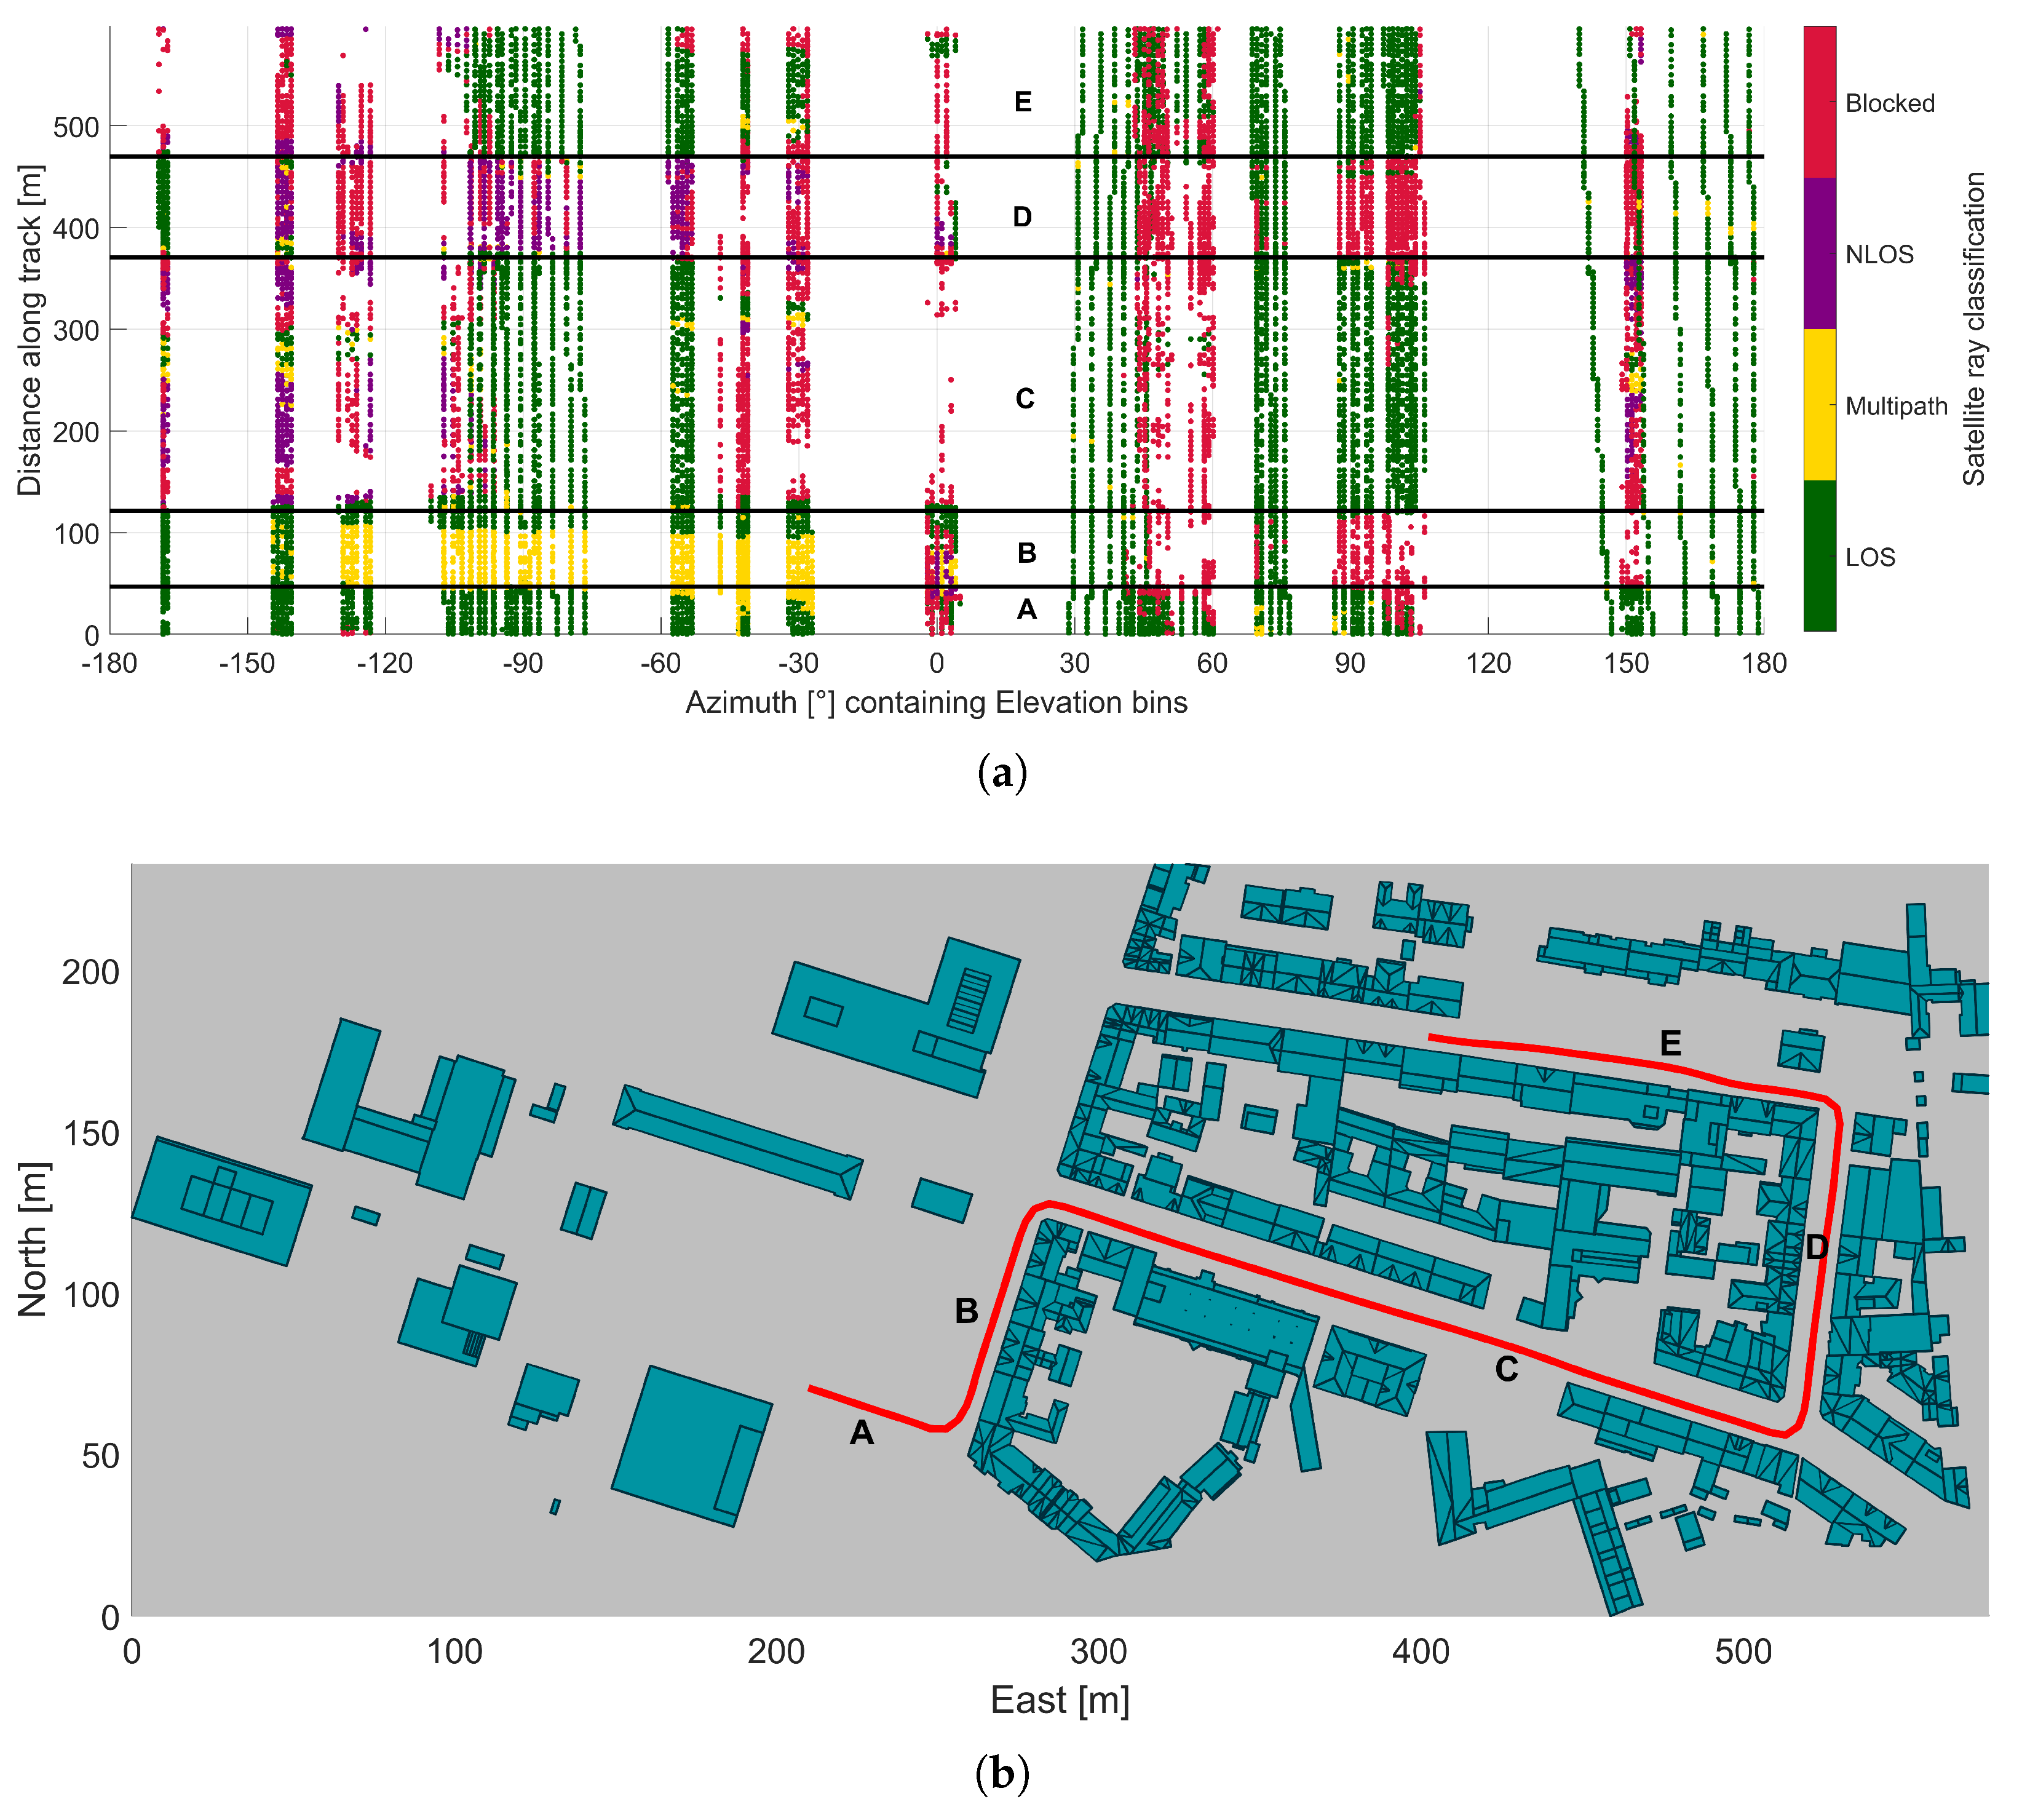
An example of the satellite ray classification of a kinematic trajectory is shown in Figure 2, where the ray-tracing results are displayed in a GNSS Feature Map [21]. The y-axis displays the distance travelled. At each epoch, i.e., travelled distance, the respective skyplot is projected onto one line and represented as such, i.e., the eastern part of the hemisphere is represented to the right of the center line while the western part is shown to the left. Figure 2a shows the classification of the visible satellites while travelling six times through the trajectory depicted in Figure 2b. Each almost vertical line is such a recorded and classified track.
It can be seen that ray-tracing in combination with the GNSS Feature Map is a useful tool to determine critical parts of a trajectory (street segments are separated by horizontal black lines) in terms of signal propagation characteristics. As an example, in segment B, a multipath is indicated for all satellites in the western part of the hemisphere which are reflected in the buildings to the right of the trajectory.

2.3. Extra Path-Delay Computation and Multipath Error

The calculation of the extra path delay δ in Equation (4) is based on information about the geometric conditions of a satellite–reflector–antenna scenario published in [37] and demands knowledge about the outer normal vector n of the reflection surface, the position of the antenna A and an arbitrary point P 0 on the reflection surface P,
δ = 2 · Δ x t cos α p cos ϵ p + Δ y t sin α p cos ϵ p + Δ z t sin ϵ p · cos ( α p α ) cos ϵ p cos ϵ + sin ϵ p sin ϵ .
The vector Δ x t represents the vector between the antenna and the arbitrary point P 0 in the topocentric system; α p and ϵ p denote the azimuth and elevation of the outer normal vector n , respectively; and α and ϵ are the azimuth and elevation of the satellite, respectively.
For NLOS conditions, the extra path delay represents the ranging error. In multipath conditions, the extra path delay is input to compute the multipath error. In case of the superposition of only one reflected signal path to the direct path, the multipath error can be expressed as
ρ MP = r δ cos 2 π δ λ 1 + r cos 2 π δ λ , Φ M P = arctan r sin 2 π δ λ 1 + r cos 2 π δ λ ,
for code ρ MP and carrier phase Φ M P , respectively. In the Equations (5), r denotes the amplitude ratio between the direct and reflected ray, which depends mainly on the material properties and antenna gain [8,38,39], and λ the wavelength of the respective carrier.
In Ref. [35], it was shown that small variations, by 1 cm of the horizontal distance to the reflection plane, can cause variations in the code multipath error of up to 20 cm for distances to the reflector of up to 3 m. This is due to the oscillating character of the multipath error with periods of the wavelength λ . Thus, small errors in the relative geometry will distort the computed multipath error significantly.

3. Coordinate Frames

For classifying the GNSS signal propagation condition (such as LOS, multipath, NLOS and blocked) and for computing the extra path delays, the satellite and user position as well as the reflector surface must be given in a common Cartesian coordinate frame; we summarize the respective relations in the following.

3.1. Coordinate Frames and Datum Definitions for GNSS Satellite Orbits

Various GNSS use specific Earth-Centered, Earth-Fixed (ECEF) 3D Cartesian reference frames to provide orbit information as broadcast ephemerides to the user. Examples are the realizations of the World Geodetic System 1984 (WGS84) for GPS, the Parametry Zemli-90 (PZ-90) for Global’naja Nawigatsionnaja Sputnikowaya Sistema (GLONASS), the Galileo Terrestrial Reference Frame (GTRF) for Galileo, or the China Geodetic Coordinate System 2000 (CGCS20) for BeiDou. The system providers are making continuous efforts to align the respective frame realization with the current version of the International Terrestrial Reference Frame (ITRF) [40,41]. Corresponding transformations can be found in, e.g., Ref. [42]. The ITRF reference frame is represented by a set of station coordinates and respective velocities given at a reference epoch, which allows to consider the station movements, e.g., by plate motion, which occurred between the epoch of coordinate definition and the epoch of measurement. The Geodetic reference system 1980 (GRS80) ellipsoid is associated with this frame.
In addition, for post-processing purposes, the precise ephemerides from the IGS Multi-GNSS Experiment (MGEX) project provide multi-GNSS satellite orbits in a common frame, the IGS frame is currently IGS14 [43], whose parameters are aligned to the ITRF.
Although the International GNSS Service (IGS) 14 frame and the ITRF2014 are not technically identical, the differences between them are in the mm range [44].

3.2. Coordinate Frames and Datum Definitions for 3D Building Models

Building models are often provided by regional public or private services. The coordinate frames are based on specific regional standards, such as the plate-fixed 3D Cartesian European Terrestrial Reference System 1989 (ETRS89) in Europe. It is derived from the ITRF global reference system, and was consistent with the ITRF at epoch 1989.0. Since it is fixed to the Eurasian tectonic plate and is co-moving with that plate (about 3 cm per year in the north-eastern direction), a drift compared to realizations of the International Terrestrial Reference System (ITRS) is introduced [45]. Associated ellipsoid heights, longitudes and latitudes refer to the GRS80. A similar situation can occur with the different realizations of WGS84 [42].
The horizontal coordinates of a 3D building model are provided in the coordinates of a map projection of the ellipsoidal coordinates. This is due to the frequent or even mandatory use of map projections in planning, surveying or cadastre [25], and the subsequent use of projected 2D coordinates, such as Northing and Easting, in UTM. For this purpose, a reference ellipsoid has to be selected. The height component is generally a physical height and, thus, refers to a different reference surface [46]. Consequently, for each application, it must be considered whether the height components are physical or ellipsoidal heights and whether respective conversions using suitable geoid undulations are required; see, also, the discussion in [25].
The 3D building model applied in this study is provided by the city of Hannover in LoD 2 using the CityGML format [26,47]. The data basis is the building contours from cadastral real-estate records combined with laser-scan point clouds to recognize the roof shape. Therefore, the 2D accuracy results from the accuracy of the building contours (cm-level), whereas the height accuracy of the roofs is given at mostly 1 m, depending on the complexity of the roof [48]. The 2D x and y coordinates of the 3D building model are given as the projected UTM values Easting and Northing. The UTM projection relies on the ETRS89 and the European Terrestrial Reference Frame (ETRF) 2000 with its realization of December 1st 2016, which corresponds to the official definition of the German cadastre. The physical height component is given according to the German Main Height Network 2016 (DHHN2016).

3.3. Coordinate Frames for User Positions

The coordinates of the user antenna position can be given in different coordinate systems. Typical situations are the determination of the user position by GNSS. In case of absolute position by Single Point Positioning (SPP) or PPP, the user position is given in the frame of the orbits introduced during the analysis. In case of relative positioning, the coordinates can refer to local frames, e.g., when using network real-time kinematic positioning (RTK). For user convenience, some receivers apply coordinate transformations internally.

4. Transformation between Different Frames

To resolve the geometric relations between the building model, the satellite position and the user position, it is required to convert all data to a common coordinate system at the same epoch. The most intuitive forms of representation would be the representation of the situation in local topocentric 3D Cartesian East, North, Up (ENU) coordinates or the map projecting environment of the building model at the required accuracy level. However, only the metric 3D Cartesian system, which represents the real positional relations between the objects, allows reality-true computations.
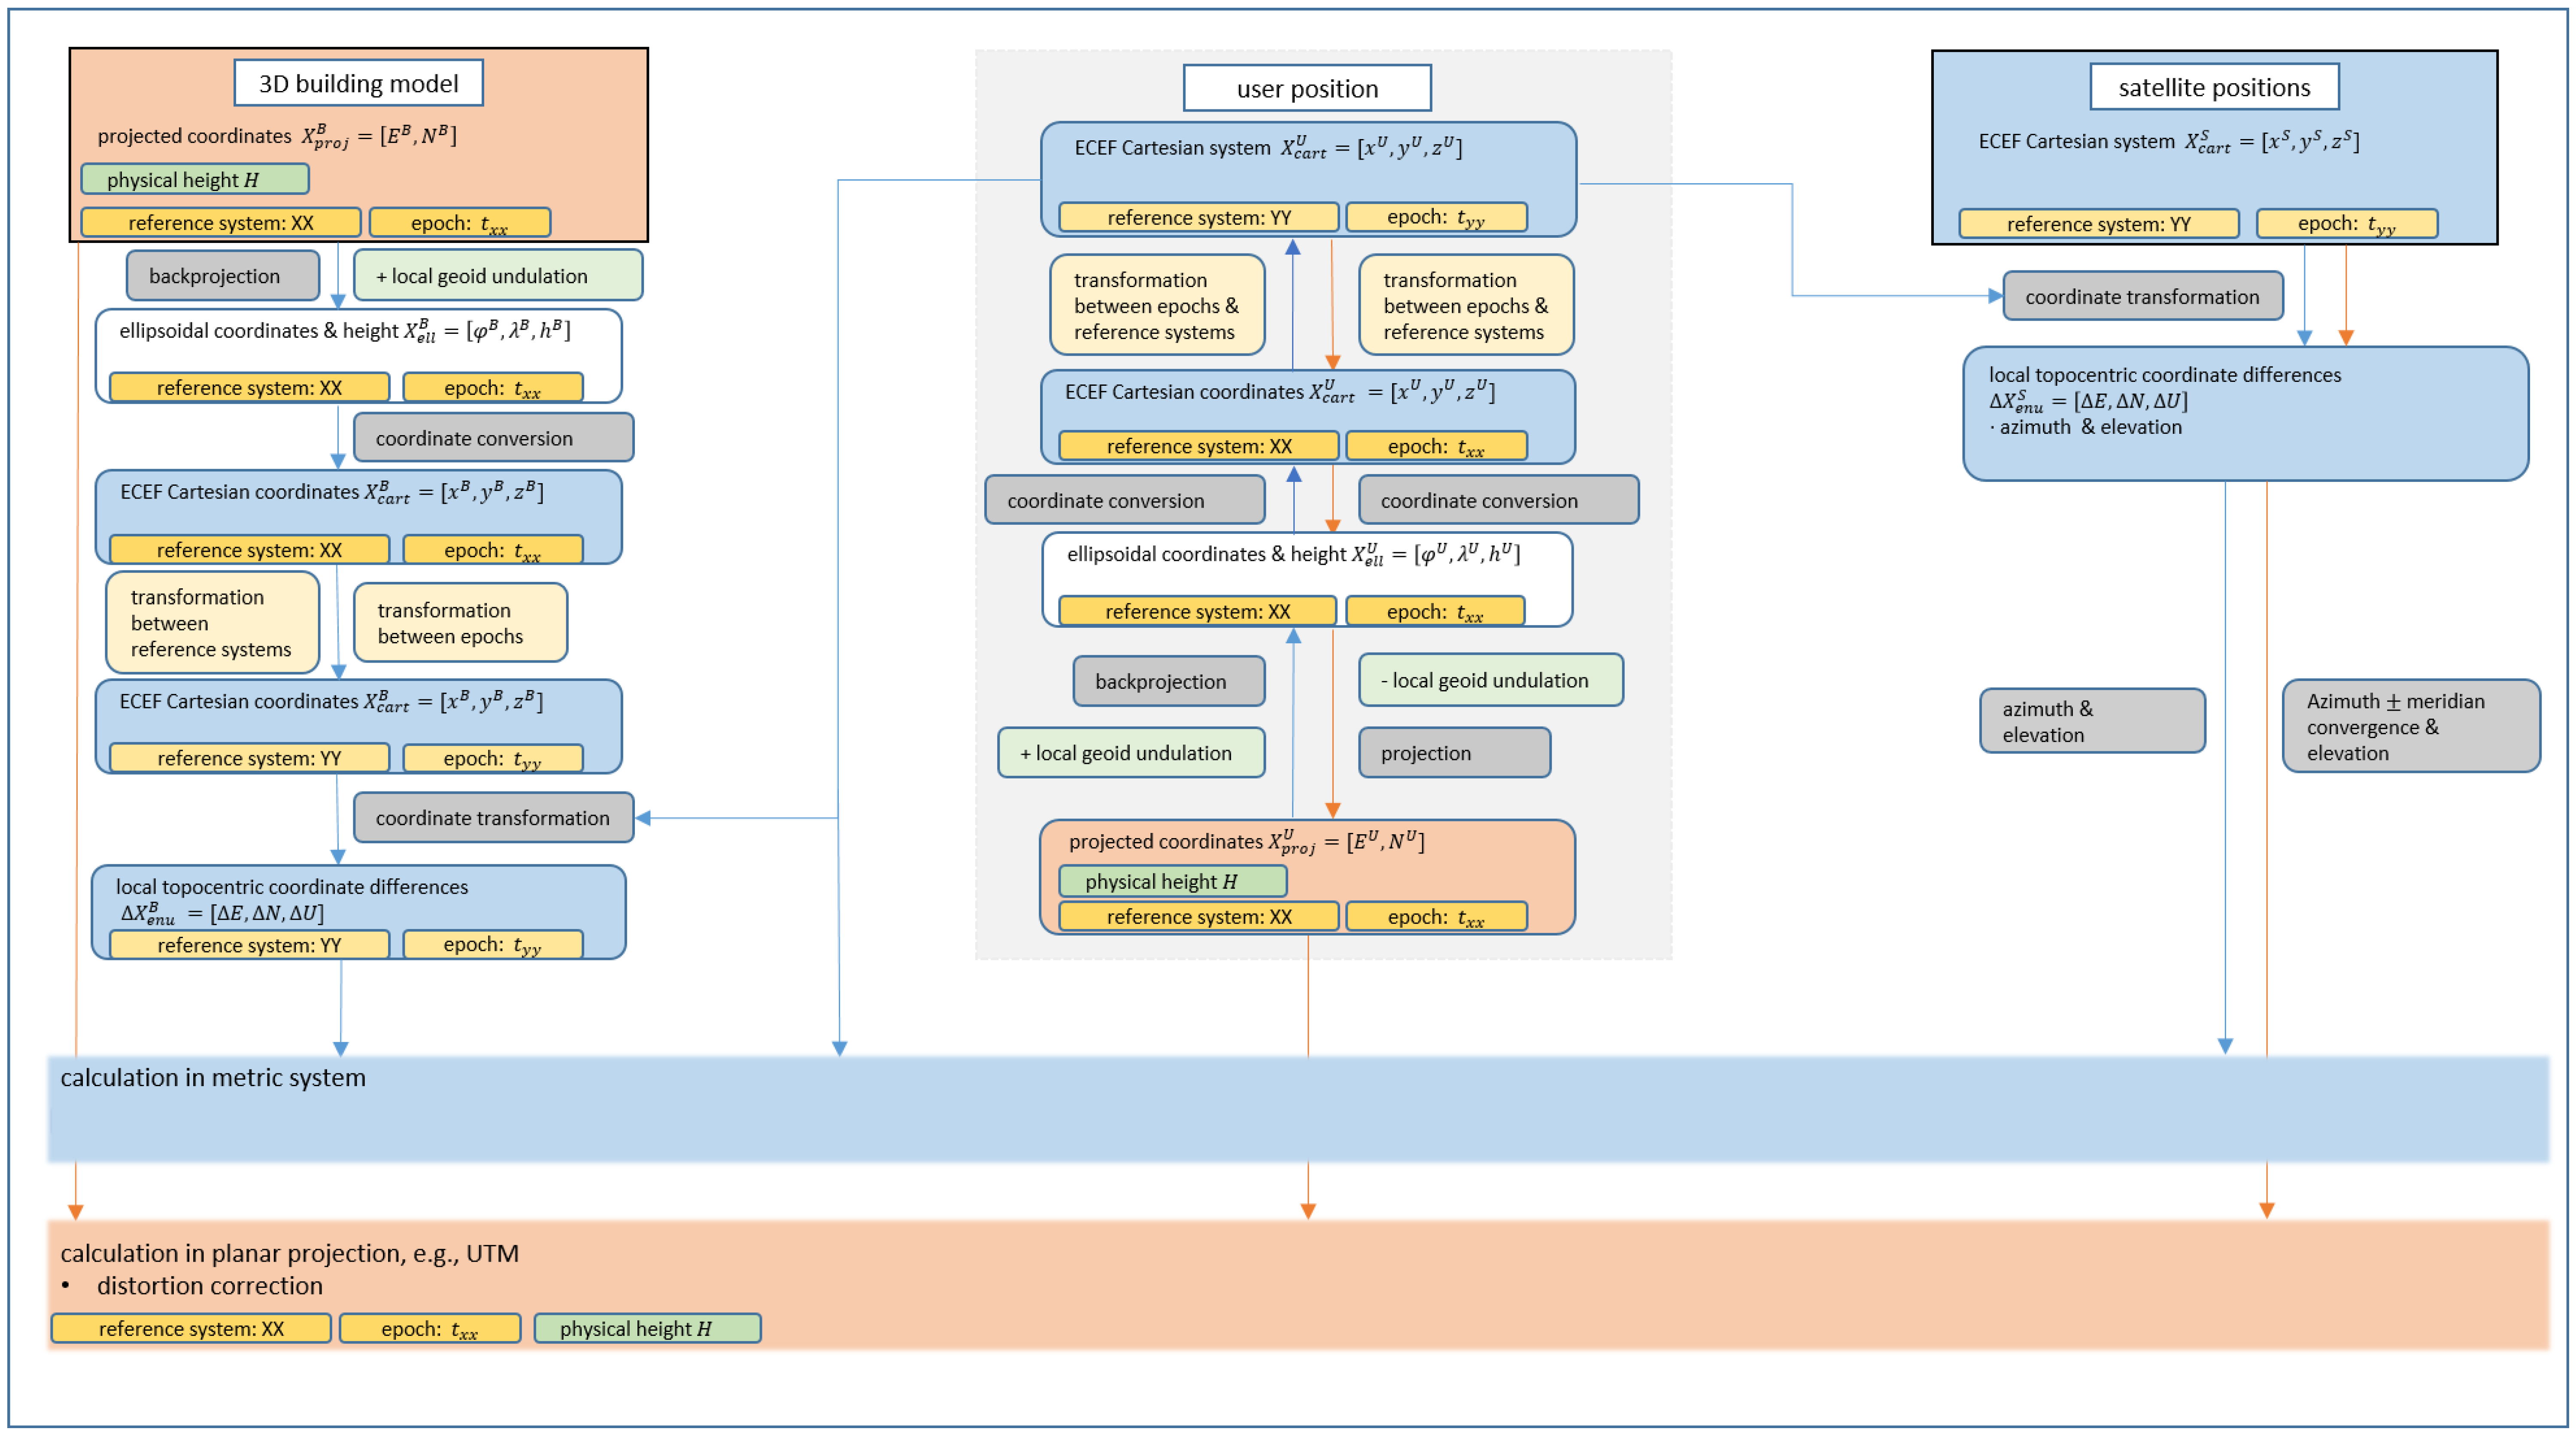
The required transformation process is exemplified in Figure 3.

4.1. Conversion from Map Projection into a 3D Cartesian System

The steps that have to be considered during the conversion of the available data into one metric system are shown in Figure 3 following the blue colored arrows. Taking the ellipsoid dimensions (i.e., semi-major axis a and flattening f) into account, the back projection of the UTM Easting and Northing coordinates into ellipsoidal coordinates ( φ , λ ) is applied as described in [49]:
φ = g φ Northing , Easting , a , f , ,
λ = g λ Northing , Easting , a , f , .
In parallel, the particular height properties of the building model have to be considered and eventually converted into an ellipsoidal height.
In our case, the heights of the building model are physical heights given in DHHN2016. The latest German official geoid, the German Combined Quasigeoid 2016, allows the conversion between ellipsoidal heights h in the ETRS89 realization of 2016 and physical heights H in the DHHN2016 [50]. The model’s accuracy is 1 cm in the lowlands, 2 cm in the high mountains and 2 to 6 cm on the shore. Due to the position of Hannover, we can consider an accuracy of 1 cm.
Using the geoid undulation ξ , the conversion can be computed
h = H + ξ .
Next, using the dimensional parameters of the ellipsoid, the ellipsoidal coordinate triplet (latitude, longitude, ellipsoidal height) is converted into 3D ECEF Cartesian coordinates in the ETRF frame at the epoch of definition of the building model,
x e = ( N ( φ ) + h ) c o s φ c o s λ ,
y e = ( N ( φ ) + h ) c o s φ s i n λ ,
z e = ( ( 1 e 2 ) ( N ( φ ) + h ) ) s i n φ ,
where N = a 1 e 2 s i n 2 φ is the radius of curvature in the prime vertical [51]. The eccentricity e reads e 2 = 2 f f 2 .

4.2. Transformation between Plate-Fixed and Earth-Fixed Frames, Datum Transformation

Now, it is possible to apply a transformation between the reference frames, considering the realizations and the respective epochs. The Reference Frame Sub-Commission for Europe (EUREF) provides transformation parameters and transformation rules between the ITRF and the ETRF (cf. Equation (12)) as well as between single realizations of the ITRF (cf. Equation (13)) [52]. Thus, the transformation from the ETRF2000 to the ITRF2014 reads
x I T R F 2000 ( t ) = x E T R F 2000 ( t ) t y y R ˙ · x E T R F 2000 ( t ) · ( t 1989 ) ,
x I T R F 2014 ( t ) = x I T R F 2000 ( t ) t ( t ) D ( t ) · x I T R F 2000 ( t ) R ( t ) · x I T R F 2000 ( t ) ,
with the translation vectors t and t y y , the scale factor D, the respective rotation matrix R and the rotation rate matrix R ˙ . The index t refers to the year of the measurement in Gregorian years. Using decimal notation and decimal digits, plate motions within one year can be considered. The respective values are dependent on the realization and the reference frame of the present and the desired datum. The values are determined and provided by the EUREF [45]. To realize an accurate transformation between coordinates, it is required to apply first the transformation between ETRF2000 and ITRF2000, and then the transformation between ITRF2000 and ITRF2014 [53]. The calculated coordinates are rounded to the fourth decimal place to prevent problems with the precision after the transformation. In addition, the truncation is to prevent inaccuracies when calculating the reflection points by a precision, which is not given in the original 3D building model.
For the inverse transformation, first, the frame in the respective realizations of the ITRS has to be matched to the one of the 3D building model. The transformation can be performed inverse to Equations (12) and (13). Similar considerations have to be made for the different realizations of the WGS84, see [42].

4.3. Representation of Coordinate Differences in a Topocentric System

For the representation of 3D Cartesian-coordinate differences in a local topocentric frame, it is necessary to select the global position of the topocenter, which could be the user position. Depending on the coordinate representation of the user position, it could be required to perform the same conversion steps as for the 3D building model.
Using ellipsoid parameters, the 3D Cartesian coordinates of the origin of the topocenter are converted into ellipsoidal longitude, latitude and height. For this, the iterative formula
λ = arctan y e x e ,
h ( j ) = p c o s φ ( j ) N ( j ) ,
φ ( j ) = arctan z e 1 e 2 N ( j ) N ( j ) + h ( j ) p ,
can be used with p = x 2 + y 2 and the starting value for the iteration
φ ( 0 ) = arctan z e 1 e 2 p .
Then, 3D ECEF Cartesian-coordinate differences Δ x e , Δ y e , Δ z e are computed w.r.t. the position of the origin of the topocenter. This can be the differences between the user antenna position and the satellite position, as well as the user antenna position and the vertices of the facade of the building modeled transformed to the same ECEF frame.
Finally, the transformation from ECEF to topocentric coordinates reads:
Δ x t = R ( φ , λ ) Δ x e .

4.4. Conversion from 3D ECEF Cartesian Coordinates to a Map Projection

Although only the metric Cartesian 3D system allows realistic calculations of the extra path delay, the calculation of the extra path delay in another system, such as the map projection of the building model, can be useful, e.g., to save computational effort, or when integrating local measurement sensors, such as laser scanners or cameras. Several characteristics have to be taken into consideration to achieve an accuracy that closely approximates the results of the 3D Cartesian calculation, such as the meridian convergence γ , the mapping distortion and a height correction. Distortions due to the curvature of the Earth may be neglected in the calculation of the extra path delay because of the comparatively small extra path delay compared to the Earth curvature.
First, the respective realizations, epochs and reference systems of the respective representations must be considered. Analogous to Section 4.2, the 3D ECEF Cartesian coordinates must be converted from the given realizations into the realization of the map projection. To start the map projection, the 3D coordinates are usually converted into ellipsoidal coordinates first, cf. Equations (9) to (11). The height components must be considered separately, and conversion into the reference height of the objects in the map projection must be applied if necessary. The relationship is given in Equation (8).
The satellite position is usually given in 3D ECEF Cartesian coordinates. Converted into topocentric coordinates and taking the meridian convergence  γ [54] into account, the line-of-sight unit vector to the satellite can be represented by the elevation and the corrected azimuth, then used in Equation (4):
γ ( λ A λ 0 ) sin ( φ A ) ,
with ( λ A λ 0 ) being the longitudinal difference of the investigated position A to the central meridian and φ A being the latitude of the investigated position [54]. Inaccuracies in the representation of the elevation are neglected.
A mapping correction k is required, due to a horizontal distance distortion resulting from the urge to minimize scale variations in a specific zone of a map projection. For UTM, each zone is leveled with the most favorable transverse Mercator projection. The projection cylinder intersects the surface, and a part of the surface, thus, emerges from the projection. As a result, the meridian in the center of the circles of contact between the cylinder and the Earth’s surface is shortened by a factor of 0.9996. This scale factor k is dependent on the geodetic latitude φ A and longitude λ A and increases by the distance from the reference meridian. It can be calculated by
k = k 0 + 1 + λ A 2 · cos ( φ A ) 2 2 ,
where k 0 is the scale factor at the reference meridian [55].
Distance distortion due to the height over the reference ellipsoid can be adjusted using the scale factor k s l [56].
k s l = 1 h e l l R ,
where h e l l denotes the mean ellipsoidal height of two respective measurement points and R denotes the radius of the Earth. The scale factors can be considered by dividing a respective length in the projection environment by the corresponding scale factors.
The distortion correction is applied within the computation of the extra path delay in Equation (4), which depends mainly on the relative geometry. The first parenthesis term denotes the horizontal distance between reflection surface and antenna and can be corrected by the scale factors.

5. Simulation Set Up

The simulation study aims to show the impact of the above-described conversion and transformation steps onto the computed extra path delays: namely, the impacts of (i) frame transformation between plate fixed and ECEF frames, (ii) meridian convergence, and (iii) distortion due to map projection.
The extra path delay is calculated according to Equation (4) and in the respective system. The conversion of the user position to the UTM environment and the computation of the extra path delay in the map projection is performed step wise to show the impact of the single steps. The involved coordinate frames in the Hannover use case are showcased in Table 1.
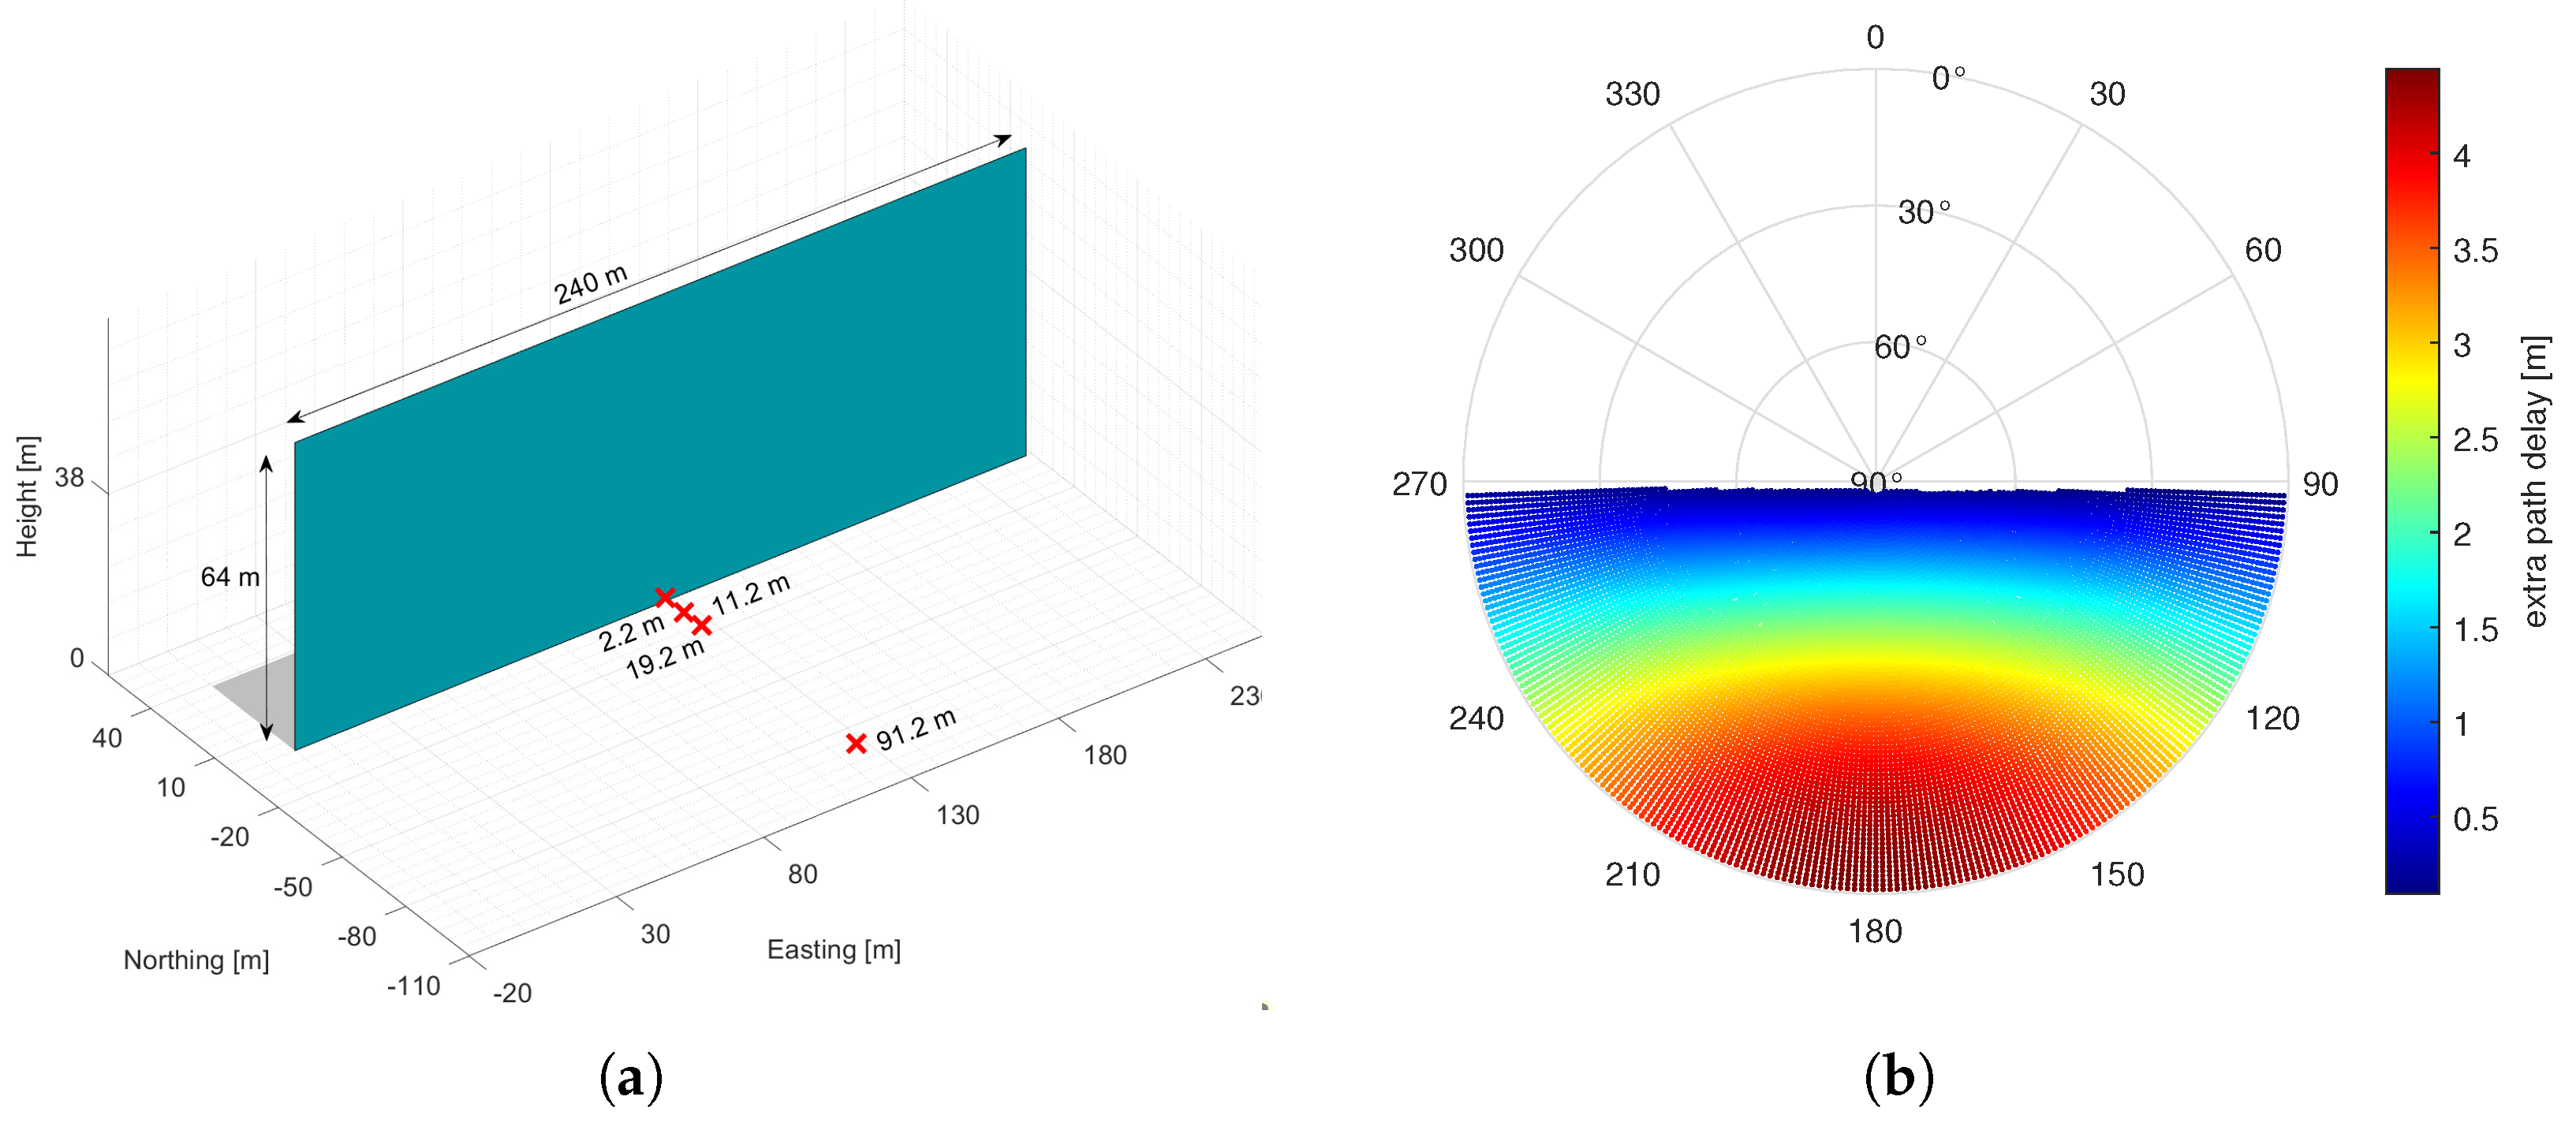
In order to cover all incidence angles, the simulated satellites are equally distributed over a 360 × 90 grid in 1 increments from 1 to 360 in azimuth and from 1 to 90 in elevation. The simulation was conducted on the 274th day of the year 2022. The reflection points are calculated for four antenna positions in front of a 240 m long and 64 m high wall. Its representation in the UTM environment can be seen in Figure 4a. The artificial wall is generated at the location of the university campus and the ellipsoidal coordinates of the closest antenna correspond to 52.2888° North and 9.7127° East. All four antennas are set to be at two meters height and are located orthogonal to the center of the wall. The antenna reflector spacing of the individual antennas is chosen so that they could represent typical situations in densely populated areas. For example, positioning on a pavement, the position of a car on roads of different widths, or relatively distant reflections along an urban canyon. In order to perform the calculations in the metric system, the wall is brought from the UTM coordinates into the metric environment. The steps in Figure 3 are followed. The second computation is performed in UTM in order to highlight the impact of the different corrections and transformation steps, cf. Figure 3. Figure 4b shows the origin of all signals that result in a reflection.

6. Results

6.1. Impact of Neglecting Different Reference Frames and Meridian Convergence

Figure 5 shows the differences in the extra path-delay computation for the scenario where neither the transformation between the different reference systems nor the meridian convergence is applied to the computation in the UTM environment. This indicates that the user position, given in the ITRF coordinate frame, and the 3D building model, given in the ETRF coordinate frame, are not aligned in one common frame. Additionally, the deviation in their north direction of the 3D building model from the geographic north direction is not considered. The differences are shown against the azimuth values of the satellites computed in the metric system and can be compared to the skyplot in Figure 4b. The color scale indicates the incidence angle, which refers to the angle between the ray incident on the surface and the line perpendicular to the reflection plane in the metric system. Higher incidence angles imply more distant reflection points, as the signals are reflected alongside the wall. The metric distances indicate the corresponding antenna reflector spacing. The single Root Mean Square Error (RMSE) for the different antenna reflector spacings can be seen in Table 2 and reach values up to 128 cm. The magnitude of the differences reaches maximum values of 2.13 m.
A dependence of the difference on the incidence angle and, thus, the distance to the reflection point can be seen, especially for a small antenna reflector spacing. However, the symmetrical dependence is skewed, especially at large antenna reflector spacings. The behavior of the differences concerning the azimuth angle of the satellite, as well as the positive offset of the differences, can be explained in comparison with Figure 6a,b.

6.2. Transformation to a Common Reference System

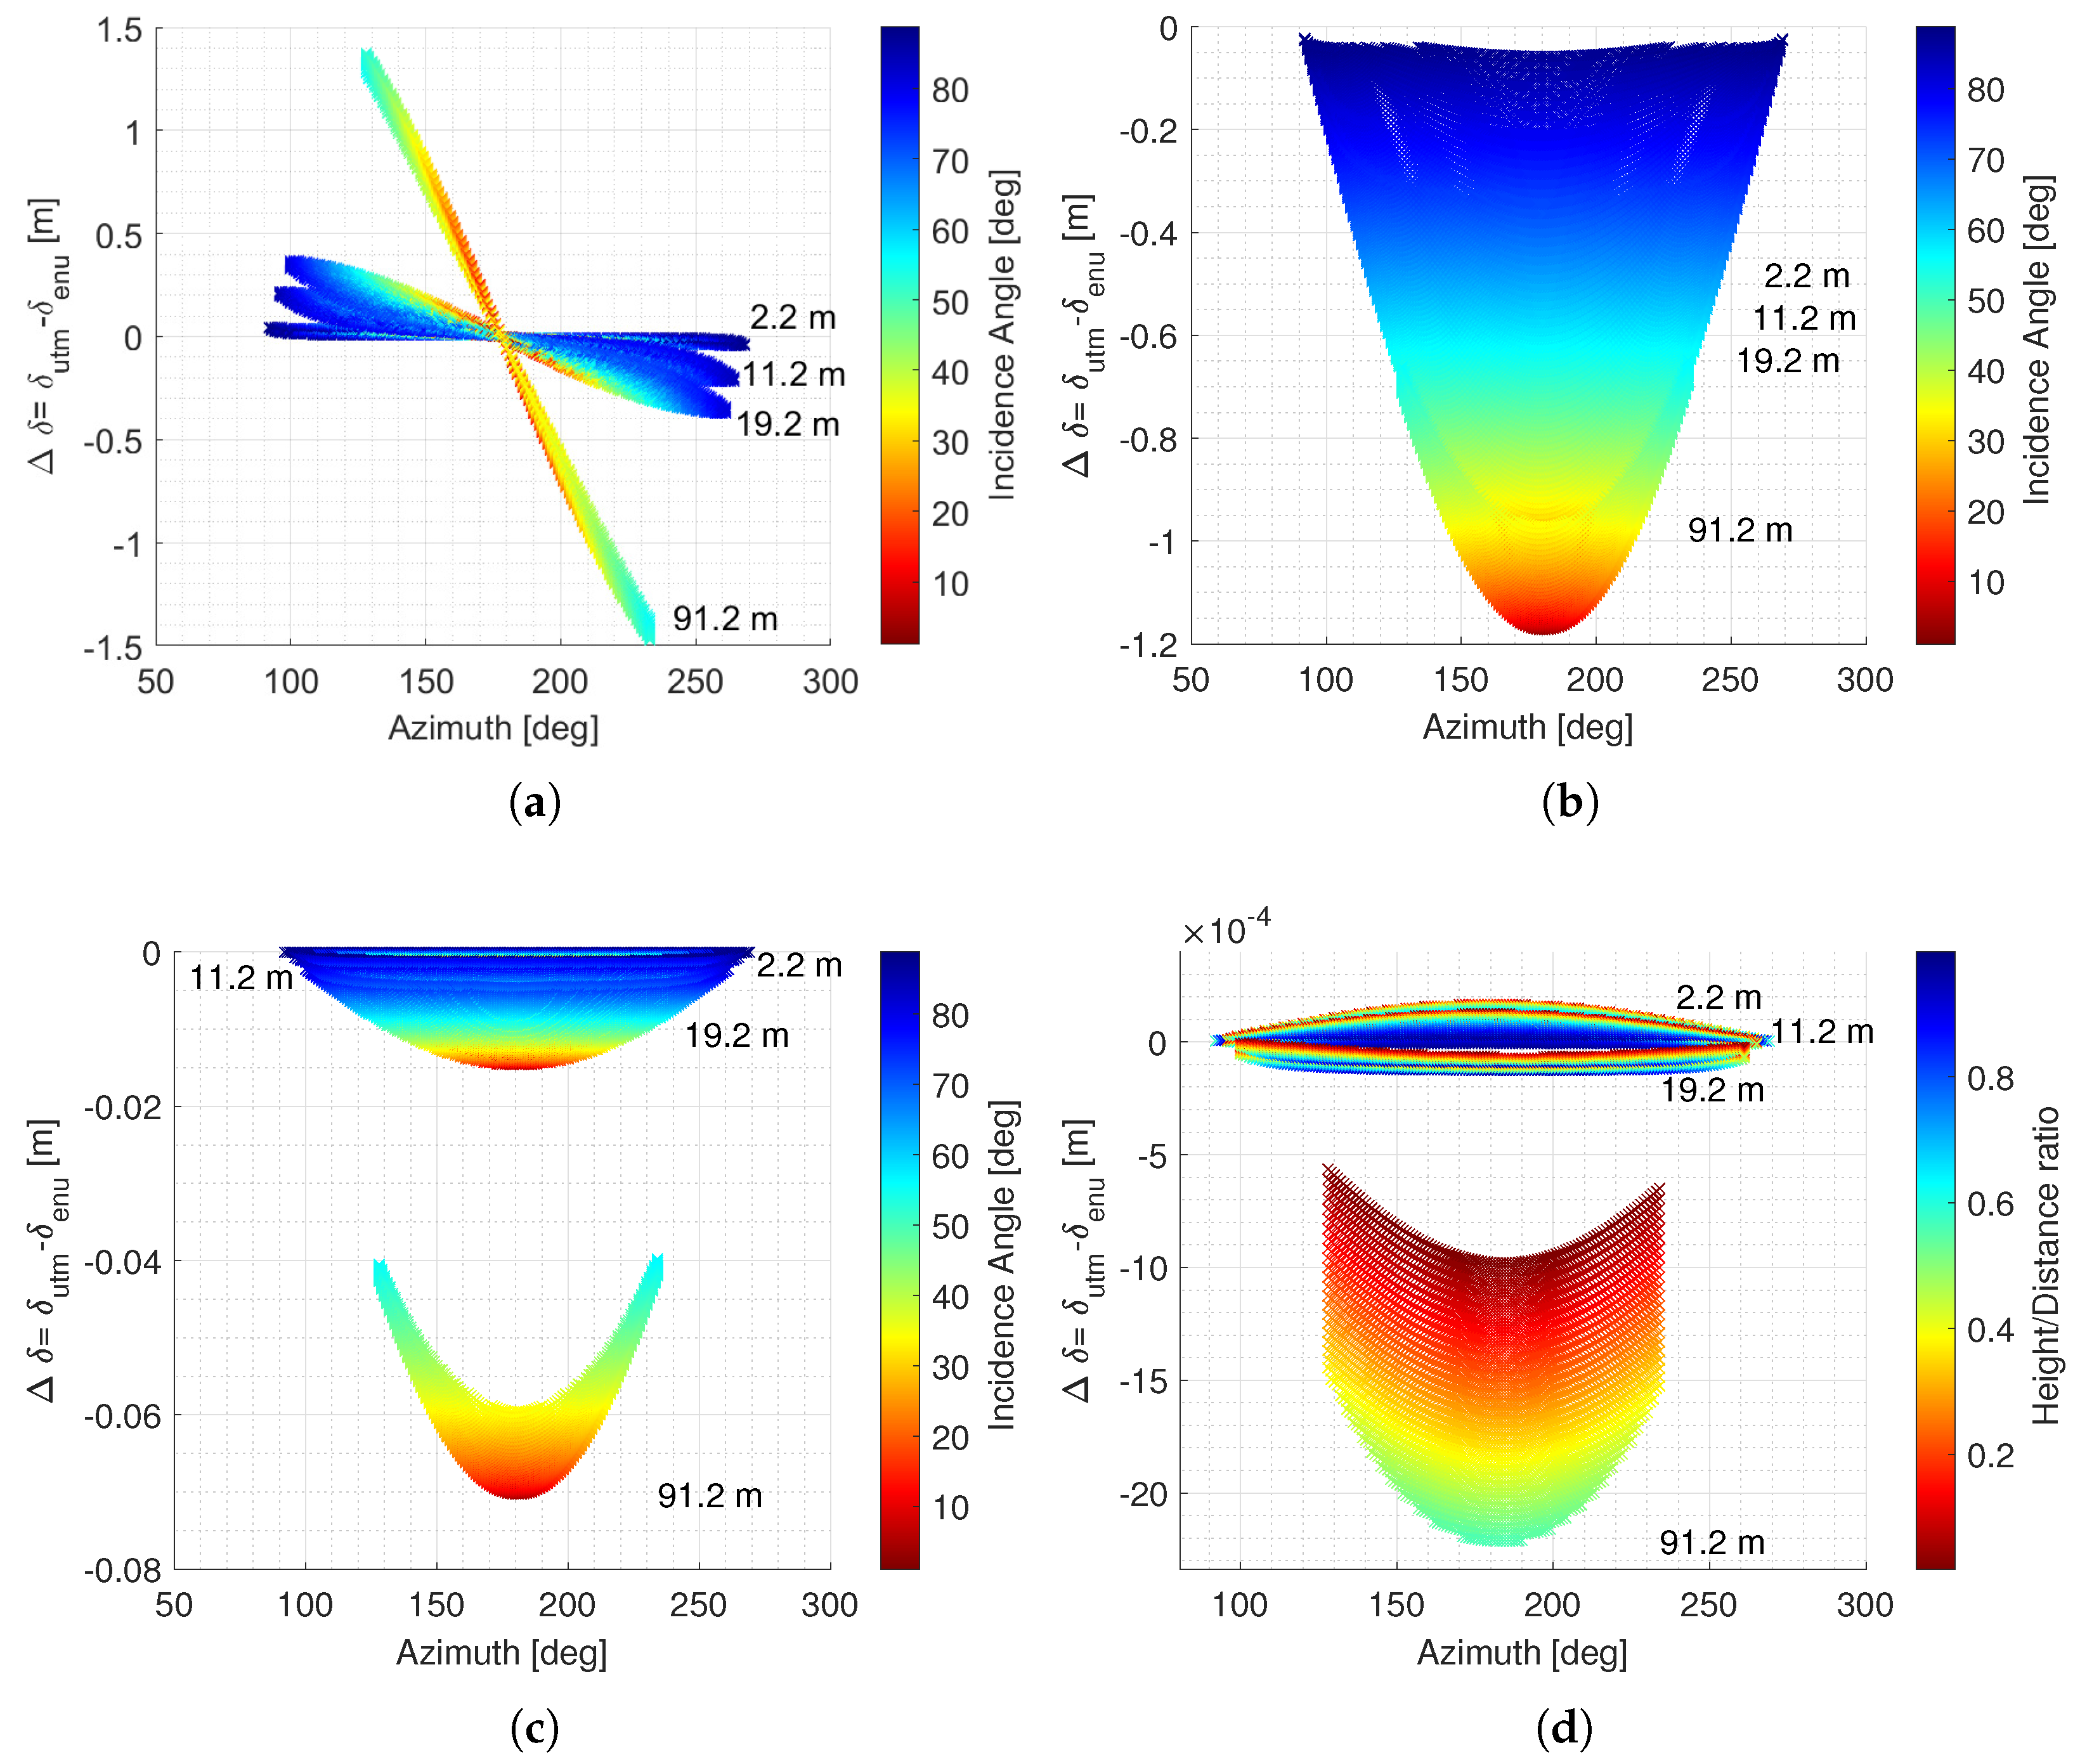
Figure 6a shows the differences between both computed extra path delays after the data given in the ITRF reference frame are aligned to the reference frame of the 3D building model. However, the difference between the grid and geographic north direction is not considered.
The impact of the transformation into a common reference system can be recognized by the negative offset visible in Figure 5 compared to Figure 6a. The offset visualizes that δ u t m is too small. The difference evolves from the temporal evolution of the ITRS2014 relative to the ETRS89. The distance between the reflection plane and antenna position decreases since the reflection plane is located north of the antenna positions, and the relative shift between both systems results in a north-east shift in the antenna position towards the reflection plane. The conversion to conformal systems ensured the uniformity of the differences. The differences are small for a signal origin perpendicular to the reflection wall, here an azimuth of 180 degrees. For azimuth angles smaller or larger than 180 degrees, i.e., opening incidence angles, the magnitudes of the differences grow approximately uniformly for the respective antenna reflector spacings. The distribution of negative and positive magnitudes over the azimuth angle indicates that the calculated δ u t m of signals originating from the west are calculated as too small. At the same time, the δ u t m of signals originating from the east are computed as too long. Responsible for that behavior is the neglected meridian convergence. The orientation of the reflection surface with respect to the direction vector of the satellite ray is misaligned. The misalignment results in extended or shortened reflection paths, depending on the relative geometry between the directional signal vector and the orientation of the reflection surface, as can be seen in Equation (4). Subsequently, reflection points that are close to the antenna projection on the reflection surface are not as strongly affected by the meridian convergence and its resulting shift as reflection points at the more eastern or western ends of the surface.

6.3. Different Frames but Consideration of the Meridian Convergence

Considering the respective meridian convergence at the satellite’s azimuth in the UTM representation, the results are shown in Figure 6b. Based on the origin of the satellite on the azimuth plane, the differences Δ δ are now symmetrically distributed around an orthogonal origin of the signal source. The differences increase in accordance with the decreasing incidence angles. This is due to the additional travel distance of the respective signals being up to twice the antenna reflector spacing, and, subsequently, the bigger impact of errors evolving from the neglected temporal evolution of the ITRS2014 relative to the ETRS89. The magnitude fits to the magnitude of the temporal drift between the reference frames, and is, therefore, independent of the horizontal antenna reflector spacing. This leads to the overlap of the data sets of the different antenna reflector spacings. The negative offset, resulting from the different reference frames, is clearly visible.
Both corrections are able to significantly reduce the overall RMSE, as shown in Table 2. However, the impact of both corrections varies with the antenna reflection spacing. The effect of the aligned reference systems is greatest at shorter spacing, while the effect of the considered meridian convergence increases with the spacing. This is very well visualized by the row-by-row evolution of the single RMSEs for the different antenna reflector spacing in Table 2.

6.4. Transformation to Common Reference Systems and Consideration of the Meridian Convergence

Figure 6c shows the results of the combined application of the meridian convergence and frame transformations. The magnitude of the differences can be drastically reduced and the RMSE values improve drastically compared to the use of different frames and no consideration of the meridian convergence. However, a general dependence on the antenna reflector spacing can be seen as Δ δ increases, the further the antenna positions are away from the reflection surface. Similar to Figure 6b, Δ δ increases with decreasing incidence angles for a fixed antenna position. This is due to the varying order of magnitude of the extra path, which depends on the incidence angle. For signals with a low incidence angle, the additional paths are longer, causing the error induced by the horizontal distortion to have a greater effect. Additionally, the distance distortion in the map projection leads to shortened horizontal distances, which is visible by the negative offset of the differences in Figure 6c.

6.5. Transformation to Common Reference Systems, Consideration of the Meridian Convergence and Distortion Correction

Figure 6d shows the differences Δ δ after the distortion correction. The magnitude of the difference decreases significantly for the different antenna positions compared to Figure 6c. The maximum magnitude is smaller than 2.3 mm for an antenna position 90 m distant from the reflection surface and smaller than 0.2 mm for closer antenna positions at a maximum distance of 20 m from the reflection surface. However, the positive differences for close antenna reflector spacings show that the distortion correction is too big in case of small antenna reflector spacings. In fact, the individual RMSE value for an antenna reflector spacing of 2.2 m is bigger than for an antenna reflector spacing of 11.2 m. Nevertheless, the individual RMSE values are in the lower single-digit cm range or in the mm range, as displayed in Table 2. Another error source becomes visible when introducing the impact of the component-wise distortion correction mentioned in Section 4. The color scaling in Figure 6d indicates the relation between the vertical and horizontal difference between user position and reflection point in the metric system. A high value corresponds to a large share of the vertical component in the total distance. It coincides with larger differences in Δ δ for the same antenna reflector spacing. The reason is that the distortion correction is applied to the horizontal distance only. Thus, a LOS vector between the user position and the reflection point in the projected environment contains a vertical component which is affected by vertical distortion if they are not parallel to the horizontal plane.

7. Conclusions

In this paper, 3DMA methods are used to improve GNSS-based positioning and navigation in severe multipath environments such as urban areas. The accuracy of the underlying ray-tracing in classifying the satellite signal (e.g., LOS or NLOS) and estimating extra path delays depends on the consistency of the relative geometry between satellite, receiver antenna and reflector. Due to the different coordinate systems of the 3D building models involved, the GNSS receiver antenna positions and the satellite geometry, the peculiarities may not be obvious in all applications or to all users.
We investigated and clarified the typical frames and definitions associated with the three quantities (3D building models, GNSS receiver antenna positions and satellite geometry) needed for ray tracing. The respective frame and datum transformations as well as corrections are summarized for the transformation from a building model in map coordinates such as UTM to 3D Cartesian topocentric coordinates. As a result, all three quantities are provided in the same Cartesian coordinate frame and the same datum, which is a prerequisite for error-free ray-tracing computations. Since it is computationally expensive to transform the building model in a 3D Cartesian frame, we developed a correction scheme for frame inconsistencies, meridian convergence and map distortions.
Using a simulation study, the impact of the different transformation and correction steps on the computation of the extra path delay is revealed. We showed that the application of the meridian convergence to the directions of the satellite and the frame transformations in case of a plate-fixed frame such as ETRF with a long accumulation time of plate motion w.r.t. an ECEF frame such as ITRF, have a large impact. Depending on the antenna reflector spacing, the error in the extra path delay can reach more than 200 cm for 120 m and more distant reflection points. The impact of distortion due to the UTM projection is at the cm-level.
Taking all frame definitions into account and applying all corrections accordingly, we showed that the extra path delay can also be accurately determined in 2D UTM coordinates completed with an independent height, as typically performed in 3D building models.

Author Contributions

Conceptualization, K.-N.B., L.I., F.R. and S.S.; methodology, K.-N.B., L.I., F.R. and S.S.; software, K.-N.B., L.I., F.R. and S.S.; formal analysis, K.-N.B., L.I., F.R. and S.S.; investigation, K.-N.B., L.I., F.R. and S.S.; writing—original draft preparation, K.-N.B., L.I., F.R. and S.S.; writing—review and editing, S.S.; visualization, K.-N.B., L.I., F.R. and S.S. All authors have read and agreed to the published version of the manuscript.

Funding

This work was funded by the German Research Foundation (DFG) as part of the Research Training Group i.c.sens [RTG 2159], the project KOMET, which is managed by TÜV-Rheinland (PT-TÜV) under the grant 19A20002C and is funded by the Federal Ministry for Economic Affairs and Climate Action (BMWK), as well as by the project 5GAPS under the grand 45FGU121_E, which is funded by the German Federal Ministry for Digital and Transport (BMDV) on the basis of a decision by the German Bundestag. The publication of this article was funded by the Open Access Fund of Leibniz Universität Hannover.

Data Availability Statement

Publicly available datasets were analyzed in this study. This data can be found here: www.opengeodata-hannover.de (acceseed on 21 November 2022).

Conflicts of Interest

The authors declare no conflict of interest. The funders had no role in the design of the study; in the collection, analyses, or interpretation of data; in the writing of the manuscript, or in the decision to publish the results.

References

  1. Reid, T.G.; Houts, S.E.; Cammarata, R.; Mills, G.; Agarwal, S.; Vora, A.; Pandey, G. Localization Requirements for Autonomous Vehicles. SAE Int. J. Connect. Autom. Veh. 2019, 173–190. [Google Scholar] [CrossRef] [Green Version]
  2. Zhu, N.; Betaille, D.; Marais, J.; Berbineau, M. Extended Kalman Filter (EKF) Innovation-Based Integrity Monitoring Scheme with C/N0 Weighting. In Proceedings of the 2018 IEEE 4th International Forum on Research and Technology for Society and Industry (RTSI), Palermo, Italy, 10–13 September 2018. [Google Scholar] [CrossRef]
  3. Gottschalg, G.; Leinen, S. Comparison and Evaluation of Integrity Algorithms for Vehicle Dynamic State Estimation in Different Scenarios for an Application in Automated Driving. Sensors 2021, 21, 1458. [Google Scholar] [CrossRef] [PubMed]
  4. Bisnath, S. Relative Positioning and Real-Time Kinematic (RTK). In Position, Navigation, and Timing Technologies in the 21st Century: Integrated Satellite Navigation, Sensor Systems, and Civil Applications; Morton, Y.J., van Diggelen, F., Spilker, J.J., Jr., Parkinson, B.W., Eds.; John Wiley & Sons, Inc.: Hoboken, NJ, USA, 2021; Chapter 19; pp. 481–502. [Google Scholar]
  5. Teunissen, P.J.G. Precise Point Positioning. In Position, Navigation, and Timing Technologies in the 21st Century: Integrated Satellite Navigation, Sensor Systems, and Civil Applications; Morton, Y.J., van Diggelen, F., Spilker, J.J., Jr., Parkinson, B.W., Eds.; John Wiley & Sons, Inc.: Hoboken, NJ, USA, 2021; Chapter 20; pp. 503–528. [Google Scholar]
  6. Betaille, D.; Peyret, F.; Ortiz, M.; Miquel, S.; Fontenay, L. A New Modeling Based on Urban Trenches to Improve GNSS Positioning Quality of Service in Cities. IEEE Intell. Transp. Syst. Mag. 2013, 5, 59–70. [Google Scholar] [CrossRef]
  7. Icking, L.; Kersten, T.; Schön, S. Evaluating the Urban Trench Model For Improved GNSS Positioning in Urban Areas. In Proceedings of the 2020 IEEE/ION Position, Location and Navigation Symposium (PLANS), Portland, OR, USA, 20–23 April 2020; pp. 631–638. [Google Scholar] [CrossRef]
  8. Icking, L.; Zhang, G.; Hsu, L.T.; Schön, S. Quantification of GNSS NLOS Spatial Correlation—A Case Study in Hong Kong’s Urban Canyon. In Proceedings of the 2022 International Technical Meeting of The Institute of Navigation, Long Beach, CA, USA, 19–23 September 2022; pp. 712–722. [Google Scholar] [CrossRef]
  9. Hsu, L.T. Analysis and modeling GPS NLOS effect in highly urbanized area. GPS Solut. 2017, 22, 7. [Google Scholar] [CrossRef] [Green Version]
  10. Braasch, M.S. Multipath. In Springer Handbook of Global Navigation Satellite Systems; Teunissen, P.J.G., Montenbruck, O., Eds.; Springer International Publishing: Berlin/Heidelberg, Germany, 2017; Chapter 15; pp. 443–468. [Google Scholar]
  11. McGraw, G.A.; Groves, P.D.; Ashman, B.W. Robust Positioning in the Presence of Multipath and NLOS GNSS Signals. In Position, Navigation, and Timing Technologies in the 21st Century: Integrated Satellite Navigation, Sensor Systems, and Civil Applications; Jade Morton, Y.T., van Diggelen, F., Spilker, J.J.B.W.P., Jr., Eds.; John Wiley & Sons, Inc.: Hoboken, NJ, USA, 2021; Chapter 22; pp. 551–589. [Google Scholar]
  12. Amt, J.H.; Raquet, J.F. Positioning for Range-Based Land Navigation Systems Using Surface Topography. In Proceedings of the 19th International Technical Meeting of the Satellite Division of The Institute of Navigation (ION GNSS 2006), Fort Worth, TX, USA, 26–29 September 2006; pp. 1494–1505. [Google Scholar]
  13. Groves, P.D.; Jiang, Z. Height Aiding, C/N0 Weighting and Consistency Checking for GNSS NLOS and Multipath Mitigation in Urban Areas. J. Navig. 2013, 66, 653–669. [Google Scholar] [CrossRef] [Green Version]
  14. Ng, H.F.; Zhang, G.; Hsu, L.T. Robust GNSS Shadow Matching for Smartphones in Urban Canyons. IEEE Sens. J. 2021, 21, 18307–18317. [Google Scholar] [CrossRef]
  15. Groves, P.D. Shadow Matching: A New GNSS Positioning Technique for Urban Canyons. J. Navig. 2011, 64, 417–430. [Google Scholar] [CrossRef]
  16. Groves, P.D.; Wang, L.; Adjrad, M.; Ellul, C. GNSS Shadow Matching: The Challenges Ahead. In Proceedings of the 28th International Technical Meeting of the Satellite Division of The Institute of Navigation (ION GNSS+ 2015), Tampa, FL, USA, 14–18 September 2015; pp. 2421–2443. [Google Scholar]
  17. Obst, M.; Bauer, S.; Wanielik, G. Urban multipath detection and mitigation with dynamic 3D maps for reliable land vehicle localization. In Proceedings of the 2012 IEEE/ION Position, Location and Navigation Symposium, Myrtle Beach, SC, USA, 23–26 April 2012; pp. 685–691. [Google Scholar] [CrossRef]
  18. Peyraud, S.; Bétaille, D.; Renault, S.; Ortiz, M.; Mougel, F.; Meizel, D.; Peyret, F. About Non-Line-Of-Sight Satellite Detection and Exclusion in a 3D Map-Aided Localization Algorithm. Sensors 2013, 13, 829–847. [Google Scholar] [CrossRef] [PubMed] [Green Version]
  19. Suzuki, T.; Kubo, N. Correcting GNSS Multipath Errors Using a 3D Surface Model and Particle Filter. In Proceedings of the 26th International Technical Meeting of the Satellite Division of The Institute of Navigation (ION GNSS+ 2013), Nashville, TN, USA, 16–20 September 2013; pp. 1583–1595. [Google Scholar]
  20. Hsu, L.T.; Gu, Y.; Kamijo, S. Sensor integration of 3D map aided GNSS and smartphone PDR in urban canyon with dense foliage. In Proceedings of the 2016 IEEE/ION Position, Location and Navigation Symposium (PLANS), Savannah, GA, USA, 11–14 April 2016. [Google Scholar] [CrossRef]
  21. Ruwisch, F.; Schön, S. GNSS Feature Map: Representation of Signal Propagation-related Features in Urban Trenches. In Proceedings of the 2022 International Technical Meeting of The Institute of Navigation, Long Beach, CA, USA, 19–23 September 2022; pp. 701–711. [Google Scholar] [CrossRef]
  22. Zhang, G.; Xu, B.; Ng, H.F.; Hsu, L.T. GNSS RUMS: GNSS Realistic Urban Multiagent Simulator for Collaborative Positioning Research. Remote Sens. 2021, 13, 544. [Google Scholar] [CrossRef]
  23. van Diggelen, F. End Game for Urban GNSS: Google’s Use of 3D Building Models. Inside GNSS 2021, 16, 42–49. [Google Scholar]
  24. Bugayevskiy, L.; Snyder, J.P. General Theory of Map Projections. In Map Projections—A Working Manual; CRC Press: Boca Raton, FL, USA, 1995; Chapter 1; pp. 1–49. [Google Scholar] [CrossRef]
  25. Jaud, Š.; Donaubauer, A.; Heunecke, O.; Borrmann, A. Georeferencing in the context of building information modelling. Autom. Constr. 2020, 118, 103211. [Google Scholar] [CrossRef]
  26. Landeshauptstadt Hannover, FB Planen und Stadtentwicklung, Bereich Geoinformation. In Produktinformation Digitales 3D-Stadtmodell, 3rd ed.; Landeshauptstadt Hannover: Hannover, Germany, 2017.
  27. Business Location Center. Berlin 3D—Download Portal. 2021. Available online: https://www.businesslocationcenter.de/en/economic-atlas/download-portal/ (accessed on 25 February 2022).
  28. van den Brink, L.; Stoter, J.E.; Zlatanova, S. Establishing a national 3D standard compliant to CityGML: Good practice of a national 3D SDI. Int. J. Geogr. Inf. Sci. 2013, 27, 92–113. [Google Scholar] [CrossRef]
  29. Department of Information Technology & Telecommunications (DoITT). NYC 3-D Building Model. Available online: https://www1.nyc.gov/site/doitt/initiatives/3d-building.page (accessed on 25 February 2022).
  30. Land Information Centre (LIC), Survey and Mapping Office (SMO), Lands Department. Information Sheet on 3D Spatial Data; Technical Report; The Government of the Hong Kong Special Administrative Region: Hong Kong, China, 2021.
  31. Wen, W.; Zhang, G.; Hsu, L.T. Correcting GNSS NLOS by 3D LiDAR and Building Height. In Proceedings of the 31st International Technical Meeting of the Satellite Division of The Institute of Navigation (ION GNSS+ 2018), Miami, FL, USA, 24 – 28 September 2018; pp. 3156–3168. [Google Scholar] [CrossRef]
  32. Wen, W.; Hsu, L.T. 3D LiDAR Aided GNSS Real-time Kinematic Positioning. In Proceedings of the 34th International Technical Meeting of the Satellite Division of The Institute of Navigation (ION GNSS+ 2021), St. Louis, MI, USA, 20 – 24 September 2021; pp. 2212–2220. [Google Scholar] [CrossRef]
  33. Hannah, B.M. Modelling and Simulation of GPS Multipath Propagation. Ph.D. Thesis, Queensland University of Technology, Brisbane, Australia, 2001. [Google Scholar]
  34. Smyrnaios, M. Carrier-Phase Multipath in Satellite-Based Positioning. Ph.D. Thesis, Leibniz Universität Hannover, Hanover, Germany, 2016. [Google Scholar]
  35. Icking, L.; Ruwisch, F.; Schön, S. Multipath Characterization using Ray-Tracing in Urban Trenches. In International Association of Geodesy Symposia; Springer: Berlin/Heidelberg, Germany, 2022; pp. 1–7. [Google Scholar] [CrossRef]
  36. Bradbury, J.; Ziebart, M.; Cross, P.; Boulton, P.; Read, A. Code Multipath Modelling in the Urban Environment Using Large Virtual Reality City Models: Determining the Local Environment. J. Navig. 2007, 60, 95–105. [Google Scholar] [CrossRef]
  37. Irsigler, M. Characterization of multipath phase rates in different multipath environments. GPS Solut. 2010, 14, 305–317. [Google Scholar] [CrossRef]
  38. Smyrnaios, M.; Schön, S.; Nicolàs, M.L. Multipath Propagation, Characterization and Model in GNSS. In Geodetic Sciences—Observations, Modeling and Applications; Jin, S., Ed.; License: CC BY 3.0—Open Access; Earth and Planetary Sciences, InTech: Rijeka, Croatia, 2013; Chapter 2; pp. 99–125. [Google Scholar] [CrossRef] [Green Version]
  39. Smyrnaios, M.; Schon, S.; Nicolas, M.L.; Kurner, T. Ray-tracing approach versus double difference, multipath characterization in a multiple ray scenario. In Proceedings of the 2012 6th ESA Workshop on Satellite Navigation Technologies (Navitec 2012) & European Workshop on GNSS Signals and Signal Processing, Noordwijk, The Netherlands, 5–7 December 2012. [Google Scholar] [CrossRef]
  40. Jekeli, C.; Montenbruck, O. Time and Reference Systems. In Springer Handbook of Global Navigation Satellite Systems; Teunissen, P.J.G., Montenbruck, O., Eds.; Springer: Berlin/Heidelberg, Germany, 2017; Chapter 2; pp. 25–58. [Google Scholar]
  41. Altamimi, Z.; Rebischung, P.; Métivier, L.; Collilieux, X. ITRF2014: A new release of the International Terrestrial Reference Frame modeling nonlinear station motions. J. Geophys. Res. Solid Earth 2016, 121, 6109–6131. [Google Scholar] [CrossRef] [Green Version]
  42. Kelly, K.M.; Dennis, M.L. Transforming between WGS84 realizations. J. Surv. Eng. 2022, 148, 04021031. [Google Scholar] [CrossRef]
  43. Montenbruck, O.; Steigenberger, P.; Prange, L.; Deng, Z.; Zhao, Q.; Perosanz, F.; Romero, I.; Noll, C.; Stürze, A.; Weber, G.; et al. The Multi-GNSS Experiment (MGEX) of the International GNSS Service (IGS) – Achievements, prospects and challenges. Adv. Space Res. 2017, 59, 1671–1697. [Google Scholar] [CrossRef]
  44. Liu, J.; Chen, J.; Liu, P.; Tan, W.; Dong, D.; Qu, W. Comparison and Assessment of Three ITRS Realizations. Remote Sens. 2021, 13, 2304. [Google Scholar] [CrossRef]
  45. Altamimi, Z. EUREF Technical Note 1: Relationship and Transformation between the International and the European Terrestrial Reference Systems; Technical Report; EUREF: Berlin, Germany, 2018. [Google Scholar]
  46. Torge, W.; Müller, J. Methods of Positioning and Gravity Field Modeling. In Geodesy; Walter de Gruyter: Berlin, Germany, 2012; Volume 3, Chapter 6; pp. 223–304. [Google Scholar]
  47. Gröger, G.; Kolbe, T.H.; Nagel, C.; Häfele, K.H. OGC City Geography Markup Language (CityGML) Enconding Standard; Open Geospatial Consortium, 2.0.0 ed.: Arlington, VA, USA, 2012. [Google Scholar]
  48. 3D-Gebäudemodelle, Level of Detail 2 (LoD2) Produkt- und Formatbeschreibung; Technical Report; Landesamt für Geoinformation und Landesvermessung Niedersachsen (LGLN): Hannover, Germany, 2018.
  49. Krakiwsky, E.J. Computations on a Conformal Map Projection Plane. In Conformal Map Projections in Geodesy; Department of Surveying Engineering, University of New Brunswick: Fredericton, NB, Canada, 1977; Chapter II; pp. 109–136. [Google Scholar]
  50. Quasigeoid of the Federal Republic of Germany: German Combined Quasigeoid 2016; Technical Report; Federal Agency for Cartography and Geodesy: Frankfurt, Germany, 2021.
  51. Seeber, G. Fundamentals. In Satellite Geodesy: Foundations, Methods and Applications, 2nd ed.; de Gruyter: Berlin, Germany, 2003; Chapter 2; pp. 10–61. [Google Scholar] [CrossRef]
  52. Boucher, C.; Altamimi, Z. Terrestrial Reference System and its first realizations. VeröFfentlichung Bayer. Komm. Für Die Int. Erdmess. Astron.-Geodätische Arb. 1992, 52, 205–213. [Google Scholar]
  53. Bruyninx, C. The EPN CB Coordinate Transformation Tool. In Proceedings of the EUREF Tutorial, Riga, Latvia, 14–17 June 2016. [Google Scholar]
  54. Hooijberg, M. Symbology. In Practical Geodesy: Using Computers; Springer: Berlin/Heidelberg, Germany, 1997; Chapter 5.3; p. 78. [Google Scholar] [CrossRef]
  55. Krakiwsky, E.J. Transverse Mercator Projection. In Conformal Map Projections in Geodesy; Department of Surveying Engineering, University of New Brunswick: Fredericton, NB, Canada, 1977; Chapter 6; pp. 51–80. [Google Scholar]
  56. Moffitt, F.; Bossler, J. Application of the State Coordinate System. In Surveying, 10th ed.; Addison-Wesley: Boston, MA, USA, 1998; p. 411. [Google Scholar]
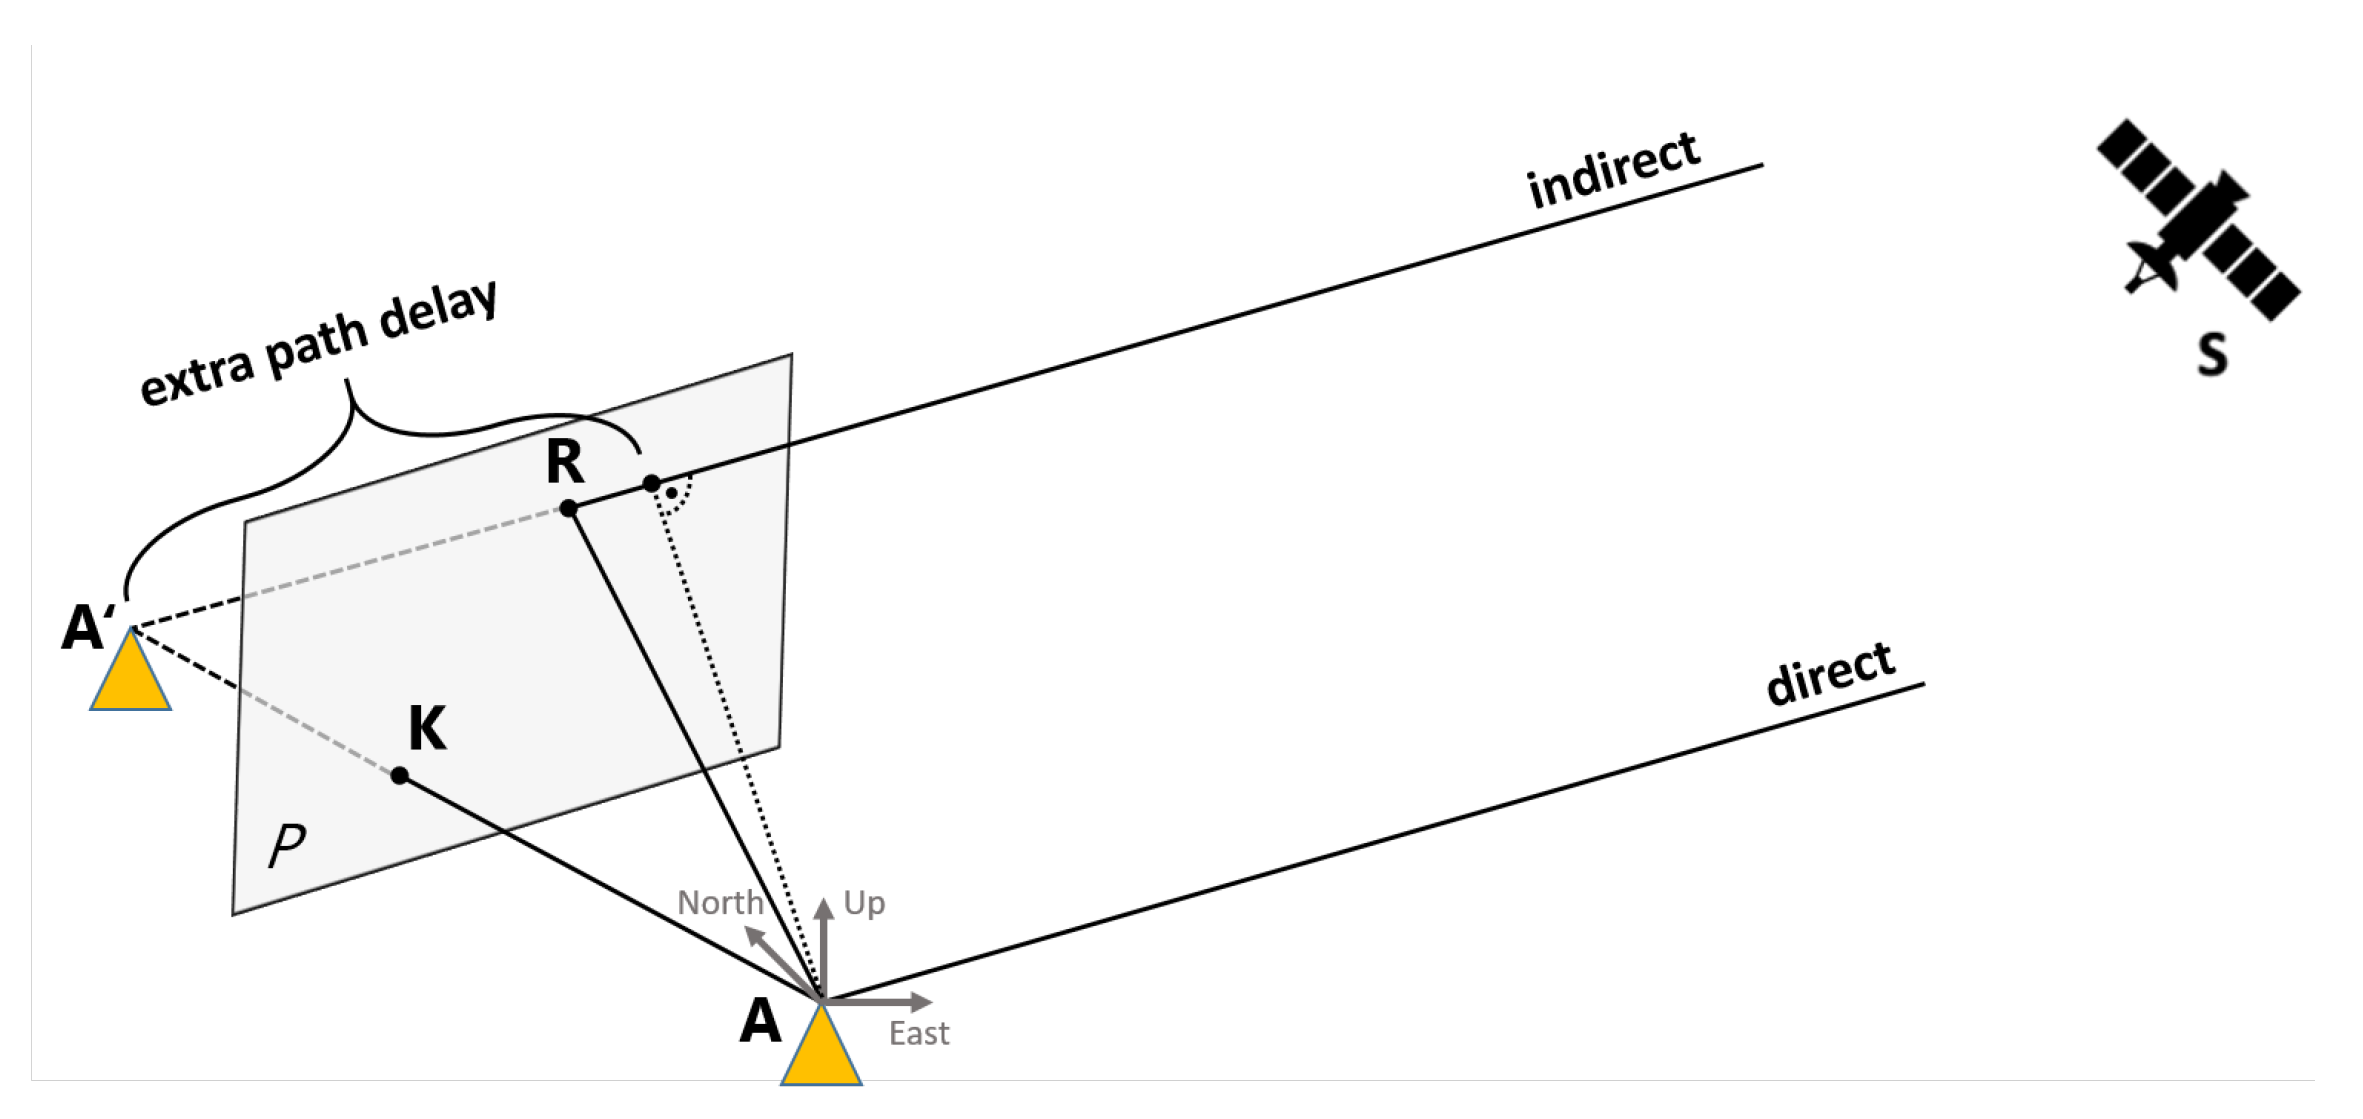
Figure 1. Reflection of a satellite signal on a building surface P at the reflection point R . The user position is denoted by A , its image w.r.t. P as A . The extra path delay is depicted as the difference in the distances between the satellite S and the mirrored antenna point A , as well as the satellite and antenna A .
Remotesensing 15 00180 g001
Figure 2. Visualization of satellite ray classification results. (a) Ray classification results of Global Positioning System (GPS) satellites in a GNSS Feature Map. The specific trajectory is shown together with used building model data in (b).
Remotesensing 15 00180 g002
Figure 3. General conversion scheme for building model data referring to a map projection, satellite-position data referring to ECEF coordinates and user-position data referring to a map projection or ECEF coordinates. Blue arrows indicates the transformation steps into a common topocentric system, orange ones into the coordinate system of the map projection.
Remotesensing 15 00180 g003
Figure 4. Simulation set up: Antenna positions and reflection surface, as well as distribution of signals affected by multipath. (a) Reflection surface and the four antenna positions indicated by a red cross, and (b) computed extra path delays in metric coordinates for the closest antenna position (2.2 m distance).
Remotesensing 15 00180 g004
Figure 5. Δ δ = δ u t m δ e n u vs. satellite azimuth, without any transformation to a common reference frame and no consideration of the meridian convergence to the δ u t m computation. The metric values refer to the horizontal antenna reflector spacing and thus identify the antenna to which the corresponding data set belongs.
Remotesensing 15 00180 g005
Figure 6. Differences in the computation of the extra path delay when applying different correction steps. (a) Section 6.2 transformation to a common reference system, (b) Section 6.3 different frames but consideration of the meridian convergence, (c) Section 6.4 transformation to common reference systems and consideration of the meridian convergence, (d) Section 6.5 transformation to common reference systems, consideration of the meridian convergence and distortion correction.
Remotesensing 15 00180 g006
Table 1. Input data for 3DMA ray-tracing and their corresponding coordinate system and frame.
Input DataCoordinate FrameCoordinates
GNSS satellite orbitsITRF20143D Cartesian
3D building modelETRF2000UTM, physical height
Antenna positionITRF20143D Cartesian
Table 2. RMSE of Δ δ for different distances between the antenna position and the reflection point after the application of the meridian convergence and the system transformation as well as the additional application of the distortion correction.
Distance to Reflector2.2 m11.2 m19.2 m91.2 m
Correction StepsRMSE [cm]
None576572128
Meridian convergence57646998
Conformal system2122081
Meridian convergence & conformal system0.080.50.96
Meridian convergence & conformal system
& distortion correction
0.00890.0060.00970.15
Disclaimer/Publisher’s Note: The statements, opinions and data contained in all publications are solely those of the individual author(s) and contributor(s) and not of MDPI and/or the editor(s). MDPI and/or the editor(s) disclaim responsibility for any injury to people or property resulting from any ideas, methods, instructions or products referred to in the content.