Article

Spectral Aerosol Radiative Forcing and Efficiency of the La Palma Volcanic Plume over the Izaña Observatory

1
TRAGSATEC, 28037 Madrid, Spain
2
Izaña Atmospheric Research Center (IARC), State Meteorological Agency of Spain (AEMET), 38001 Santa Cruz de Tenerife, Spain
3
Atmospheric Optics Group of Valladolid University (GOA–UVA), Valladolid University, 47002 Valladolid, Spain
4
Cimel Electronique, 75011 Paris, France
5
EKO INSTRUMENTS Europe B.V., 2521 The Hague, The Netherlands
*
Author to whom correspondence should be addressed.
Remote Sens. 2023, 15(1), 173; https://doi.org/10.3390/rs15010173
Submission received: 14 November 2022 / Revised: 23 December 2022 / Accepted: 24 December 2022 / Published: 28 December 2022
(This article belongs to the Section Atmospheric Remote Sensing)

Abstract

:
On 19 September 2021, a volcanic eruption began on the island of La Palma (Canary Islands, Spain). The eruption has allowed the assessment of an unprecedented multidisciplinary study on the effects of the volcanic plume. This work presents the estimation of the spectral direct radiative forcing ( Δ F) and efficiency ( Δ F E f f ) from solar radiation measurements at the Izaña Observatory (IZO) located on the island of Tenerife (∼140 km from the volcano). During the eruption, the IZO was affected by different types of aerosols: volcanic, Saharan mineral dust, and a mixture of volcanic and dust aerosols. Three case studies were identified using ground-based (lidar) data, satellite-based (Sentinel-5P Tropospheric Monitoring Instrument, TROPOMI) data, reanalysis data (Modern-Era Retrospective Analysis for Research and Applications, version 2, MERRA-2), and backward trajectories (Flexible Trajectories, FLEXTRA), and subsequently characterised in terms of optical and micro-physical properties using ground-based sun-photometry measurements. Despite the Δ F of the volcanic aerosols being greater than that of the dust events (associated with the larger aerosol load present), the Δ F E f f was found to be lower. The spectral Δ F E f f values at 440 nm ranged between −1.9 and −2.6 Wm 2 nm 1 AOD 1 for the mineral dust and mixed volcanic and dust particles, and between −1.6 and −3.3 Wm 2 nm 1 AOD 1 for the volcanic aerosols, considering solar zenith angles between 30 and 70 , respectively.

1. Introduction

On 19 September 2021 at 14:11 UTC, an eruption began on the island of La Palma (Canary Islands, Spain), ending on 13 December 2021 at 22:21 UTC. This volcanic eruption has been classified with a volcanic explosivity index (VEI) of 3, with an estimated emission of approximately 2 × 10 6 tons of sulfur dioxide (SO 2 ), and the lava flows covered an area of more than 1.200 ha [1,2,3], causing considerable damage to some infrastructure and villages in the area. In addition, during the 85 days of the eruption, the volcanic plume impacted the air quality around the eruption area [4], causing the cancellation of operations at La Palma airport for several days.
The impact of the 2021 volcanic eruption at La Palma on the atmospheric composition was strongly influenced by the magnitude of the volcanic emissions, injection height, vertical stratification of the atmosphere, and seasonal dynamics [4]. Although the volcanic column reached a maximum height of 8500 m a.s.l., which occurred hours before the end of the eruption, the average height of the plume throughout the volcanic eruption was ∼3500 m a.s.l. [5]. These moderated injection heights allowed interactions between the volcanic plume and other atmospheric aerosols present in the region such as Saharan mineral dust particles [6]. In addition, atmospheric circulation in the lower and middle troposphere caused volcanic ash and gas plumes to be dispersed over the Canary archipelago and the Atlantic Ocean, leading to volcanic signals being detected on the nearby islands (Tenerife, La Gomera, and El Hierro) and across Europe, North and Central Africa, and the Caribbean [7]. The eruption has allowed the undertaking of an unprecedented multidisciplinary on-site study on the effects of the volcanic plume [4,5,6,8] on the Canary Islands, which includes extensive atmospheric measurements carried out at the nearby Izaña Observatory (IZO; ∼140 km from the volcano).
Aerosol radiative forcing is used to quantify the potential impact of the various aerosol types on the climate, and expanding our knowledge of this is key to understanding climate change. It raises great uncertainties in climate models focused on explaining past and possible future climates [9]. Volcanic eruptions introduce natural forcing into the climate system through their primary emissions into the atmosphere, i.e., gases (H 2 O, CO 2 , N 2 , SO 2 , H 2 S) and solid particles (mostly silicate), usually referred to as volcanic ash (when diameters are <2 mm), as well as due to long-lived secondary sulfate aerosols, formed by the gas-to-particle conversion of SO 2 emissions [10,11,12,13]. Volcanic primary and secondary aerosols tend to cause a cooling of the climate system, acting over many time and space scales [9,10,14,15,16,17,18,19,20,21]. In particular, sulfate aerosol forcing has been proposed as one of the possible causes of the global warming hiatus observed [22,23].
The use of spectral measurements has led to an advance in climate modelling since they allow for the incorporation of greater detail on the effects of clouds, water vapour, and aerosols in climate models [24]. The same occurs with the radiative processes of atmospheric aerosols. The solar spectral irradiance components and their spectral variability under different atmospheric conditions have a marked impact on local and regional climate [25]. Dirnberger et al. [26] showed that spectral irradiance variability has an impact on the performance of different photovoltaic technologies, which is mainly modulated by the type and amount of aerosols present in the atmosphere. Moreover, knowledge of the spectral variations in aerosol radiative forcing is essential to understanding the impact of aerosols on the different components of the biosphere-surface system (e.g., photosynthesis and reflection/absorption of radiation by soil) [27]. However, direct observations of the spectral variations in aerosol radiative forcing are extremely limited in space and time and, therefore, studies on spectral radiative forcing in the literature are scarce.
The almost total absence of spectral observations of aerosol radiative forcing is due to the current instrumental limitation of using only broadband radiometers in most of the radiometric stations. This situation is due to the fact that spectroradiometers are more complex to operate and maintain and are more expensive than the traditional broadband radiometers used. The Baseline Surface Radiation Network (BSRN; [28,29]), which is the flagship network for the observation of solar and terrestrial radiation, is currently assessing the incorporation of spectral radiation measurement programs, but to date, there are no standardised measurement procedures, reference standards, or spectroradiometer calibration systems. For the moment, there are very few pilot initiatives aimed at routinely obtaining spectral measurements of solar radiation such as at the IZO. The current study makes use of the new spectral radiation monitoring capabilities at the IZO to provide unique, accurate information on the spectral radiative forcing and efficiency of the different types of aerosols that can be measured at the observatory.
Our study focuses on the experimental estimation of the spectral radiative forcing and efficiency during the volcanic eruption on La Palma from spectral radiation measurements obtained at the IZO [30] within the framework of the Commission for Instruments and Methods of Observation (CIMO) testbed for aerosols and water vapour remote sensing instruments, supported by the World Meteorological Organization (WMO). During the eruption, the IZO was affected by three types of aerosols. We have identified three different events: one affected by volcanic aerosols, a second affected by almost pure Saharan mineral dust, and a third characterised by a mixture of volcanic aerosols and Saharan dust.
This work is divided into five sections. Section 2 and Section 3 describe the main characteristics of the IZO, the instrumentation used in this study and the methodology applied. Section 4 shows the case studies selected and describes the optical and micro-physical aerosol properties and the spectral radiative forcing, efficiency, and heating rate associated with the three events. Finally, Section 5 presents the conclusions that can be drawn from this work.

2. Site Description and Instruments

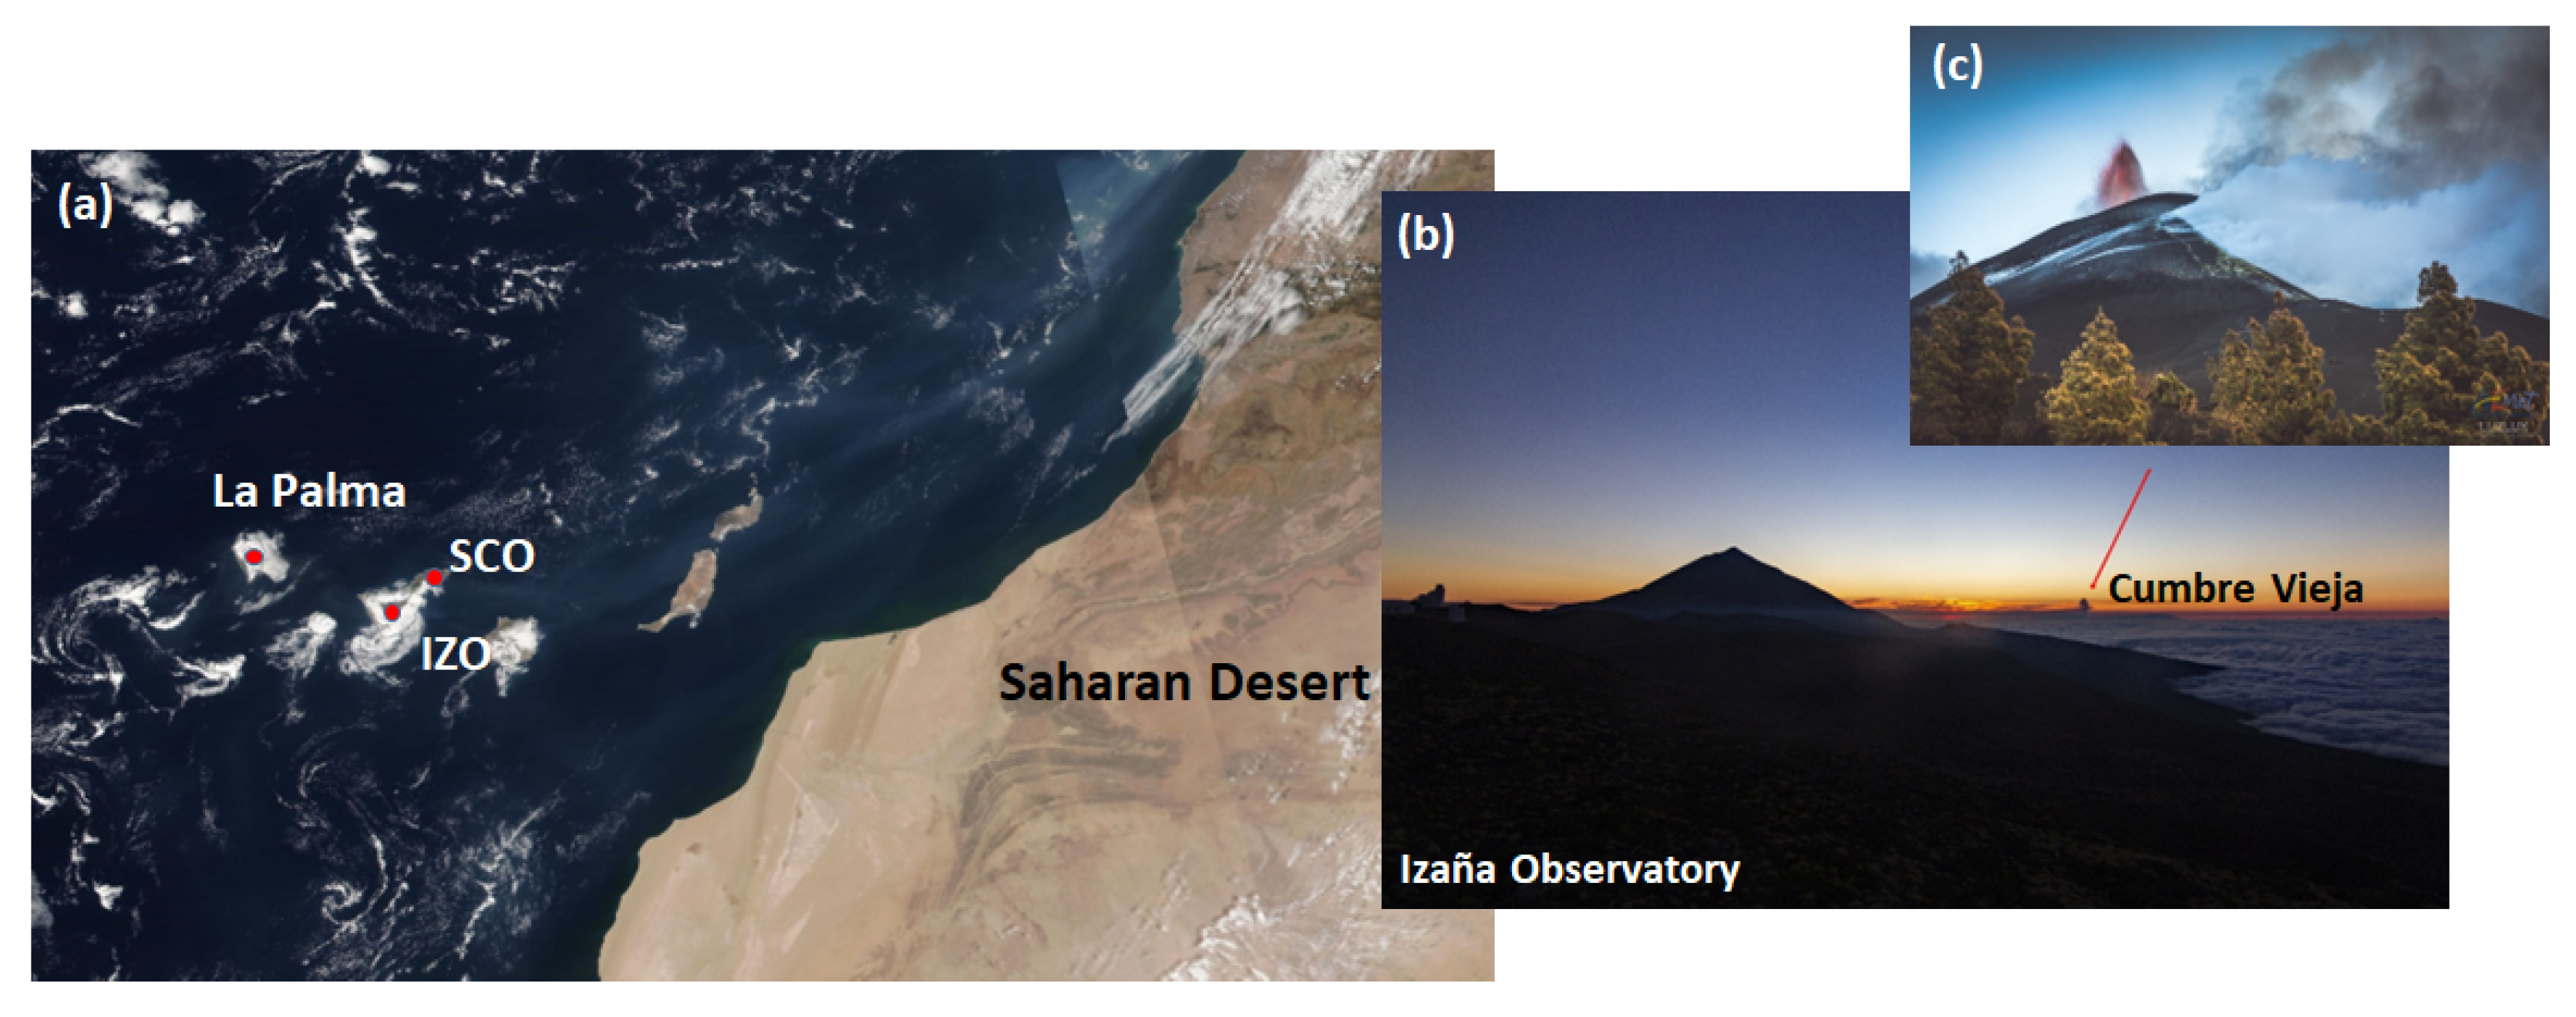
2.1. Site Description

The datasets used in this work were obtained at the IZO, managed by the Izaña Atmospheric Research Center (IARC) of the Spanish State Meteorological Agency (AEMET) (http://izana.aemet.es, accessed on 15 March 2022). The IZO is located on the island of Tenerife (Canary Islands, Spain, at 28.3 N, 16.5 W, and 2400 m a.s.l.).
The IZO joined the WMO Background Atmospheric Pollution Monitoring Network (BAPMoN) in 1984 and the WMO Global Atmosphere Watch (GAW) program in 1989. Moreover, the IZO has collaborated with different international atmospheric networks, e.g., the NDACC (Network for the Detection of Atmospheric Composite Change; http://ndsc.ncep.noaa.gov, accessed on 25 March 2022) since 1999 and the GAW-PFR (Precision Filter Radiometer Network; http://www.pmodwrc.ch/worcc, accessed on 25 March 2022) since 2001. The IZO has also been a part of the AERONET (Aerosol Robotic Network; http://aeronet.gsfc.nasa.gov, accessed on 28 February 2022) since 2004, and joined the BSRN (http://bsrn.awi.de, accessed on 2 March 2022) in 2009. In 2014, the IZO was appointed by the WMO as a CIMO testbed for aerosols and water vapour remote sensing instruments [31]. More details about the facilities and measurement programs can be found in Cuevas et al. [30].
The IZO is a high-mountain station at 2400 m a.s.l. and is located above what is mostly a quasi-permanent strong temperature inversion layer, which prevents the arrival of local pollution from the lower levels of the island. This meteorological feature favours measurements under free troposphere conditions [32]. However, given its proximity to the island of La Palma (≈140 km), during the volcanic eruption, the IZO was affected for several days by the volcanic plume (Figure 1).

2.2. Instruments

2.2.1. EKO MS-711 Spectroradiometer

In this work, we used the spectral direct normal irradiance (DNI) measurements performed with a collimated EKO MS-711 grating spectroradiometer assembled on a solar tracker (hereafter, EKO). The instrument measures solar spectral radiation for wavelengths between 300 and 1100 nm, with an average step of 0.4 nm and a bandpass of nominally <7 nm (defined as the full width at half maximum (FWHM)). EKO performs one spectrum per minute, with an exposure time ranging from 10 ms to 5 s depending on the intensity of the irradiance and sky conditions and a field of view of 5 . The EKO has been comprehensively tested in the IZO WMO-CIMO testbed activities (more details in García et al. [33] and García et al. [34]).

2.2.2. AERONET Cimel Sun Photometer

The aerosol optical depth (AOD) and Angström parameter (AE 440 870 nm , hereafter, AE) measurements used in this work were performed using a Cimel CE318-T sun photometer [35,36]. The photometer is an automatic sun–sky–lunar scanning filter radiometer (340, 380, 440, 500, 675, 870, 937, 1020, and 1640 nm), with an approximate field of view of ∼1.3 [35,37] and a 10 nm FWHM bandwidth, except for 340, 380, and 1640 nm, which have a 2, 4, and 25 nm FWHM, respectively. The IZO is a sun calibration site of AERONET reference instruments [38], and the AERONET AOD data series at the IZO are traceable to the GAW-PFR AOD world reference [30].
The particle volume size distribution, effective radius, and total-, fine-, and coarse-mode AODs at 500 nm retrieved with the spectral deconvolution algorithm (SDA) were also used in this study [39]. These parameters are described in Dubovik and King [40], Dubovik et al. [41], and Sinyuk et al. [42]. AERONET version 3.0 level 2.0 for the direct sun was selected, ensuring high-quality and cloud-screened data. However, due to the lack of level 2.0 retrievals, level 1.5 was used for the inversion products.

2.3. Ancillary Instruments

2.3.1. Lidar

IARC manages a micro-pulse lidar model MPL-4B [43,44] operating at the Santa Cruz Observatory (SCO), which is also located on the island of Tenerife (28.5 N, 16.3 W, and 52 m a.s.l.). The MPL system belongs to the NASA Micro-Pulse Lidar Network (MPLNet; https://mplnet.gsfc.nasa.gov, accessed on 28 March 2022) [45], with the Normalised Range Backscatter (NRB) signal at 532 nm, volume depolarisation ratios ( δ v o l ), aerosol depolarisation ratios ( δ a e r ), cloud and layer boundaries, or aerosol extinction and backscatter profiles (among others) as standard products. The MPLNET version 3 products have been used in this paper. The MPL at the SCO can be considered the only aerosol lidar in Northern Africa providing regular, long-term information about the vertical structure of the Saharan Air Layer over the North Atlantic (more information in Cuevas et al. [30] and Barreto et al. [46]).

2.3.2. Backward Trajectories

The backward trajectories were computed using the Flexible Trajectories (FLEXTRA; https://folk.nilu.no/~andreas/flextra.html, accessed on 27 May 2022) software [47,48] using ERA5 reanalysis from the European Centre for Medium-Range Weather Forecasts (ECMWF) [49] obtained through the flex-extract (v7.1) interface running in gateway mode as an ECMWF member-state user. FLEXTRA input data every 6 h were interpolated to a horizontal resolution of 1 × 1 , covering longitudes from −179 to 180 and latitudes from −10 to 90 , and 137 in the vertical resolution. FLEXTRA was configured to a destination coordinate of 16.5 W 28.3 N (IZO location) and to four pressure levels (500, 600, 770 (IZO typical ground pressure), and 900 hPa). We obtained a backward trajectory coordinate every 20 min with a 3D wind configuration. Horizontal (1 × 1 ) and vertical (±200 m) offset target backward trajectories were also computed to estimate uncertainties in the calculated trajectory.

2.3.3. Satellite Data

In the current work, we used Modern-Era Retrospective Analysis for Research and Applications version 2 (MERRA-2) AOD data at 550 nm. This version updates the NASA previous satellite-era (from 1980 onward) reanalysis system to include additional observations and improvements to the Goddard Earth Observing System version 5 (GEOS-5). The spatial resolution of the MERRA-2 AOD is 0.5 × 0.625 [50]. (More information at https://giovanni.gsfc.nasa.gov/giovanni/, accessed on 25 October 2022).
The volcanic SO 2 total column amounts were obtained from the Tropospheric Monitoring Instrument (TROPOMI) onboard the Copernicus Sentinel-5 Precursor (S-5P) platform. The S-5P has been orbiting in a sun-synchronous polar orbit with an equator crossing at 13:30 local solar time, with a high spectral covering from ultraviolet to shortwave infrared wavelengths and a spatial resolution of 5.5 × 3.5 km 2 since August 2019 [51]. (More information in https://maps.s5p-pal.com/so2/, accessed on 26 March 2022).

2.3.4. Meteorological Radiosonde

Since 2005, meteorological radiosondes (RS92) have been routinely launched twice daily at about 11:15 and 23:15 UTC from the Güimar station (105 m a.s.l.) located on the coastline approximately 15 km to the southeast of the IZO. The station, which is managed by the Santa Cruz de Tenerife Meteorological Center, belongs to the AEMET upper-air observation network (WMO GRUAN station N . 60018) and is part of the Global Climate Observing System (GCOS)–Upper-Air Network (GUAN) [30].

3. Methodology

3.1. Spectral Radiative Forcing and Efficiency

Changes in the energy budget available in the Earth-atmosphere system can be quantified by introducing the concept of surface radiative forcing ( Δ F ( λ , SZA)) [9], defined at a specific wavelength λ and a solar zenith angle (SZA) as follows:
Δ F ( λ , S Z A ) = ( F A ( λ , S Z A ) F C ( λ , S Z A ) ) ( 1 S A )
where F A is the energy measured on the Earth’s surface under the presence of aerosols, and F C is the energy under pristine day conditions simulated with a radiative transfer model. The arrows indicate the direction of the fluxes, where ↓ = the downward flux and ↑ = the upward flux, and S A is the surface albedo. This sign criterion implies that negative values of Δ F ( λ , SZA) are associated with aerosol cooling and positive values with aerosol warming effects at the surface.
Once Δ F ( λ , SZA) is computed, the spectral aerosol radiative forcing efficiency, Δ F E f f ( λ , SZA), can be defined as follows [52,53,54]:
Δ F E f f ( λ , S Z A ) = Δ F ( λ , S Z A ) A O D ( λ , S Z A )
To estimate F C ( λ , SZA), we used the LibRadtran radiative transfer model ([55,56]; more information at http://www.libradtran.org, accessed on 26 March 2022).
This model has been tested extensively at the IZO (e.g., [29,33,54]). The algorithm used in the radiative transfer equation (RTE) solver was the Discrete Ordinates Radiative Transfer (DISORT; [57]), which is based on the multi-stream discrete ordinates algorithm using 16 streams. The simulations were performed with the highly resolved absorption band parametrisation representative wavelength radiative transfer (REPTRAN; [58]) method, with a spectral resolution of 5 cm 1 . Furthermore, we considered the corrections for the Earth’s sphericity for an SZA > 60 [59]. For each simulation, the direct spectral irradiance was calculated in the spectral range of 300–1100 nm with a step of 1 nm, and the obtained spectra were convoluted with a triangular slit-function of 7 nm of FWHM. The atmosphere profile was taken from the long-term ozonosonde performed at the SCO between 1992 and 2011 [60,61]. The full list of the input parameters is shown in Table 1.

3.2. Heating Rate

The aerosol-induced net radiative heating/cooling rate (HR) within the troposphere is also important information when it comes to understanding aerosol–solar radiation and aerosol–cloud interactions since this magnitude exhibits significant changes in response to different aerosol vertical concentrations and optical properties [66,67].
The aerosol HR of a layer was determined following the equation presented in Foken [68] and Cochrane et al. [69]:
H R = H R ( λ ) d λ = 1 ρ C p Δ F n e t ( λ ) Δ z
where ρ is the air density, C p is the constant-pressure specific-heat capacity of air, Δ F n e t is the net flux leaving a layer of atmosphere of thickness Δ z [68,69,70,71,72,73]. The aerosol HR is computed as the difference in HR between the measurements under the presence of aerosols and those performed under pristine conditions.
In this work, the HR was simulated with the LibRadtran model, applying the same inputs used to determine F L ( λ , SZA) (see Table 1), in addition to the AOD vertical profile extracted from the MPL data at 523 nm at the SCO, and the pressure, temperature and relative humidity profiles obtained from the radiosonde dataset [46,69].

4. Results

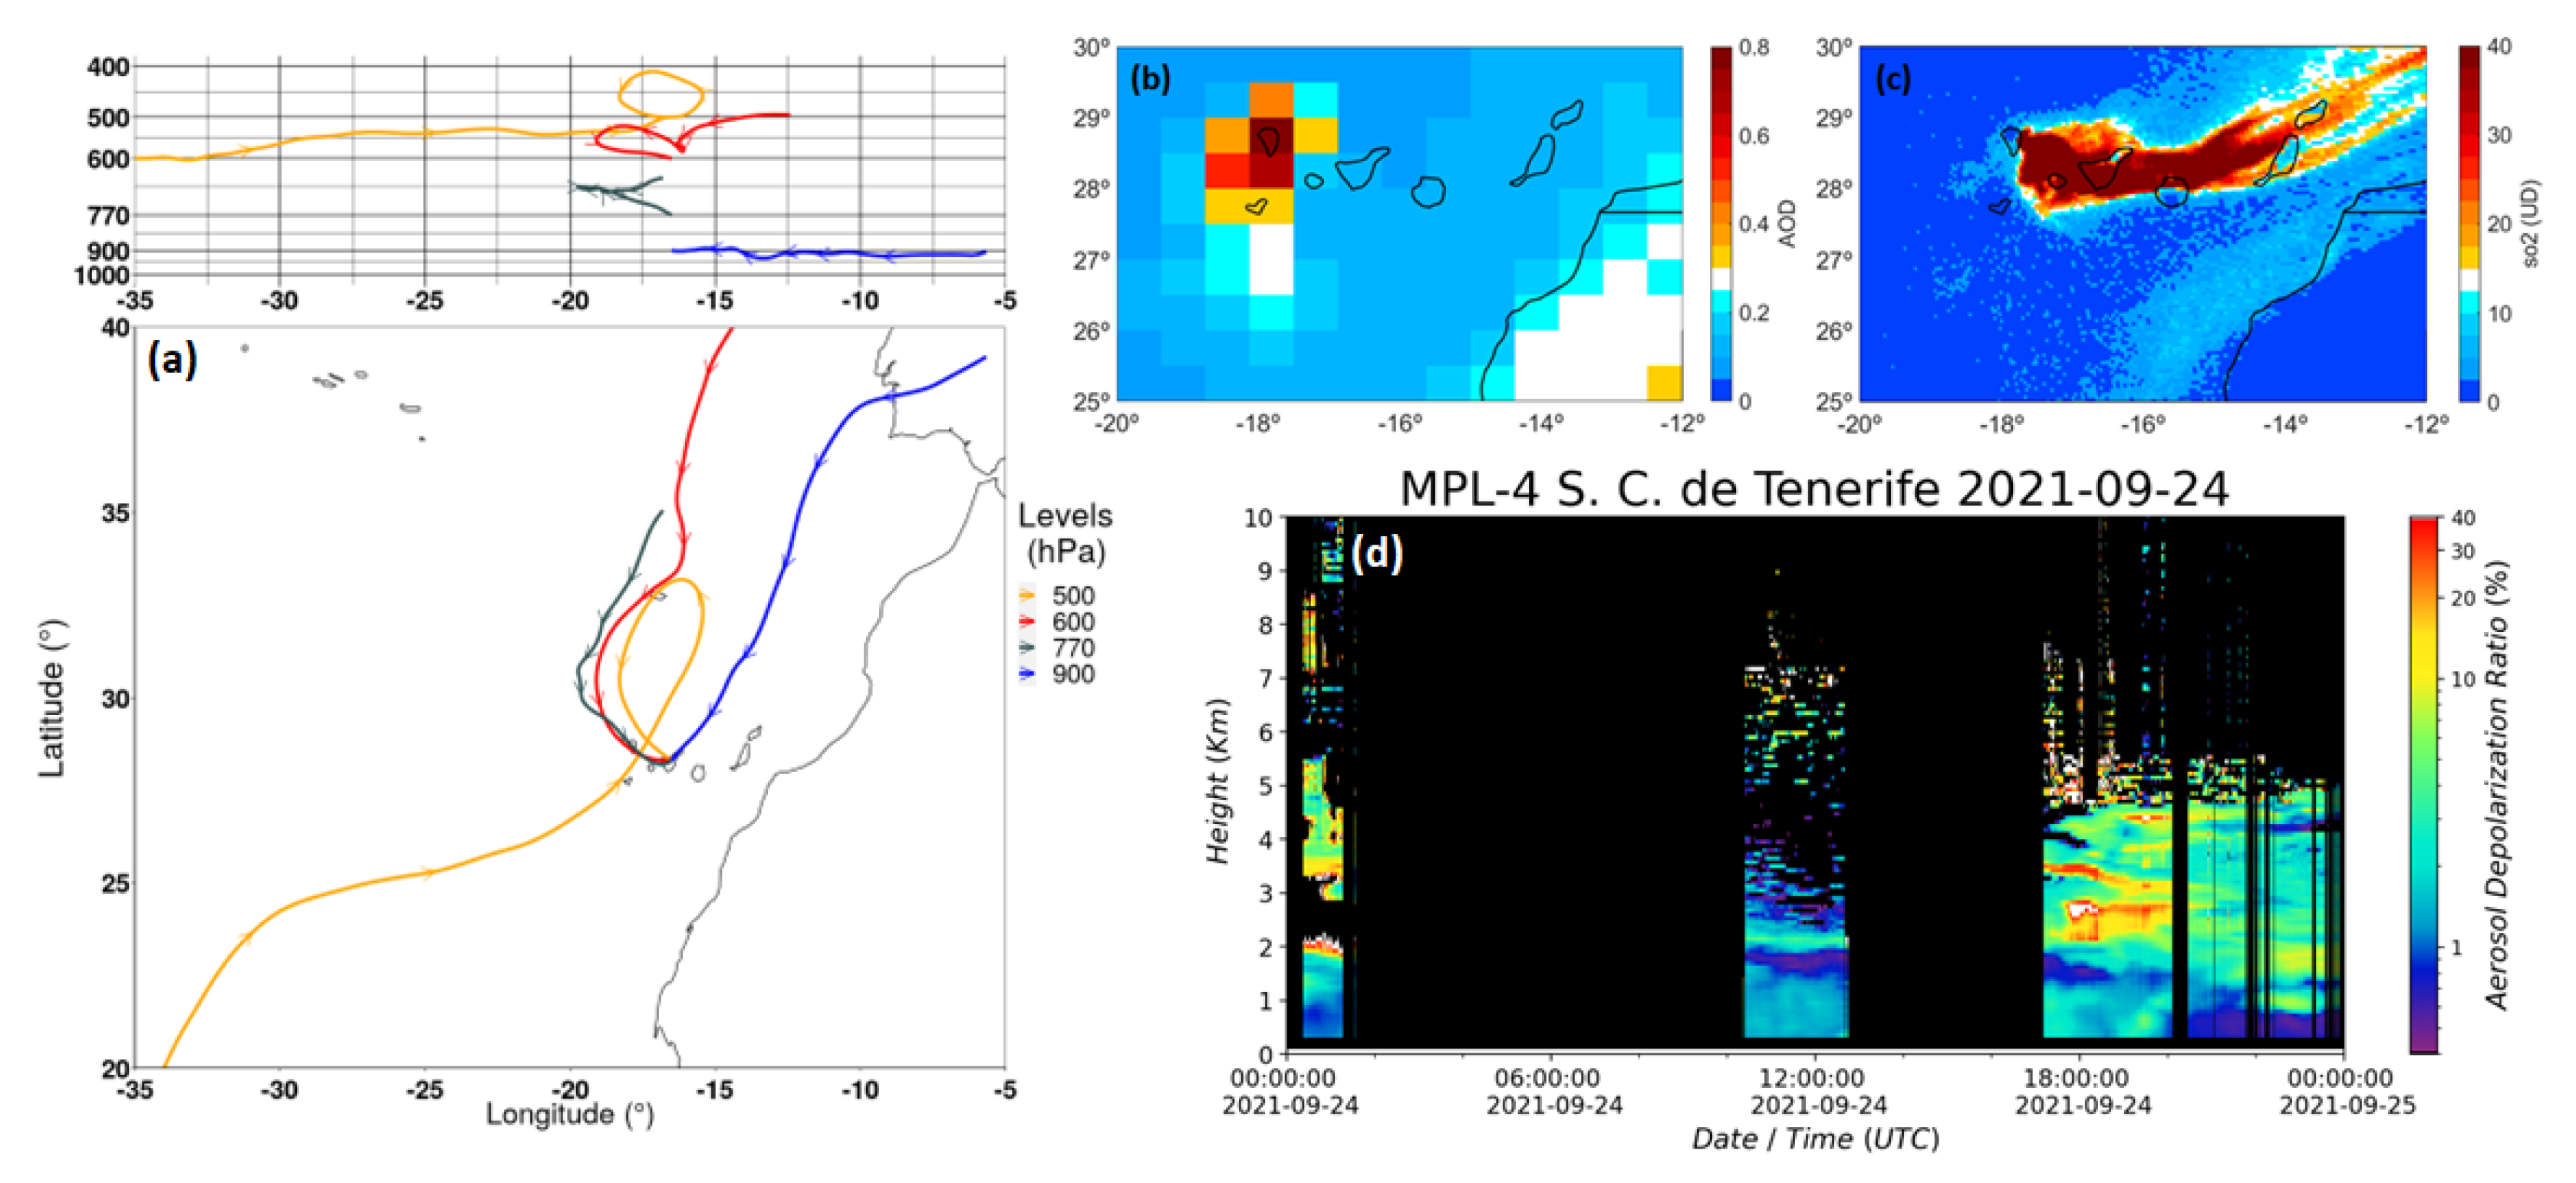
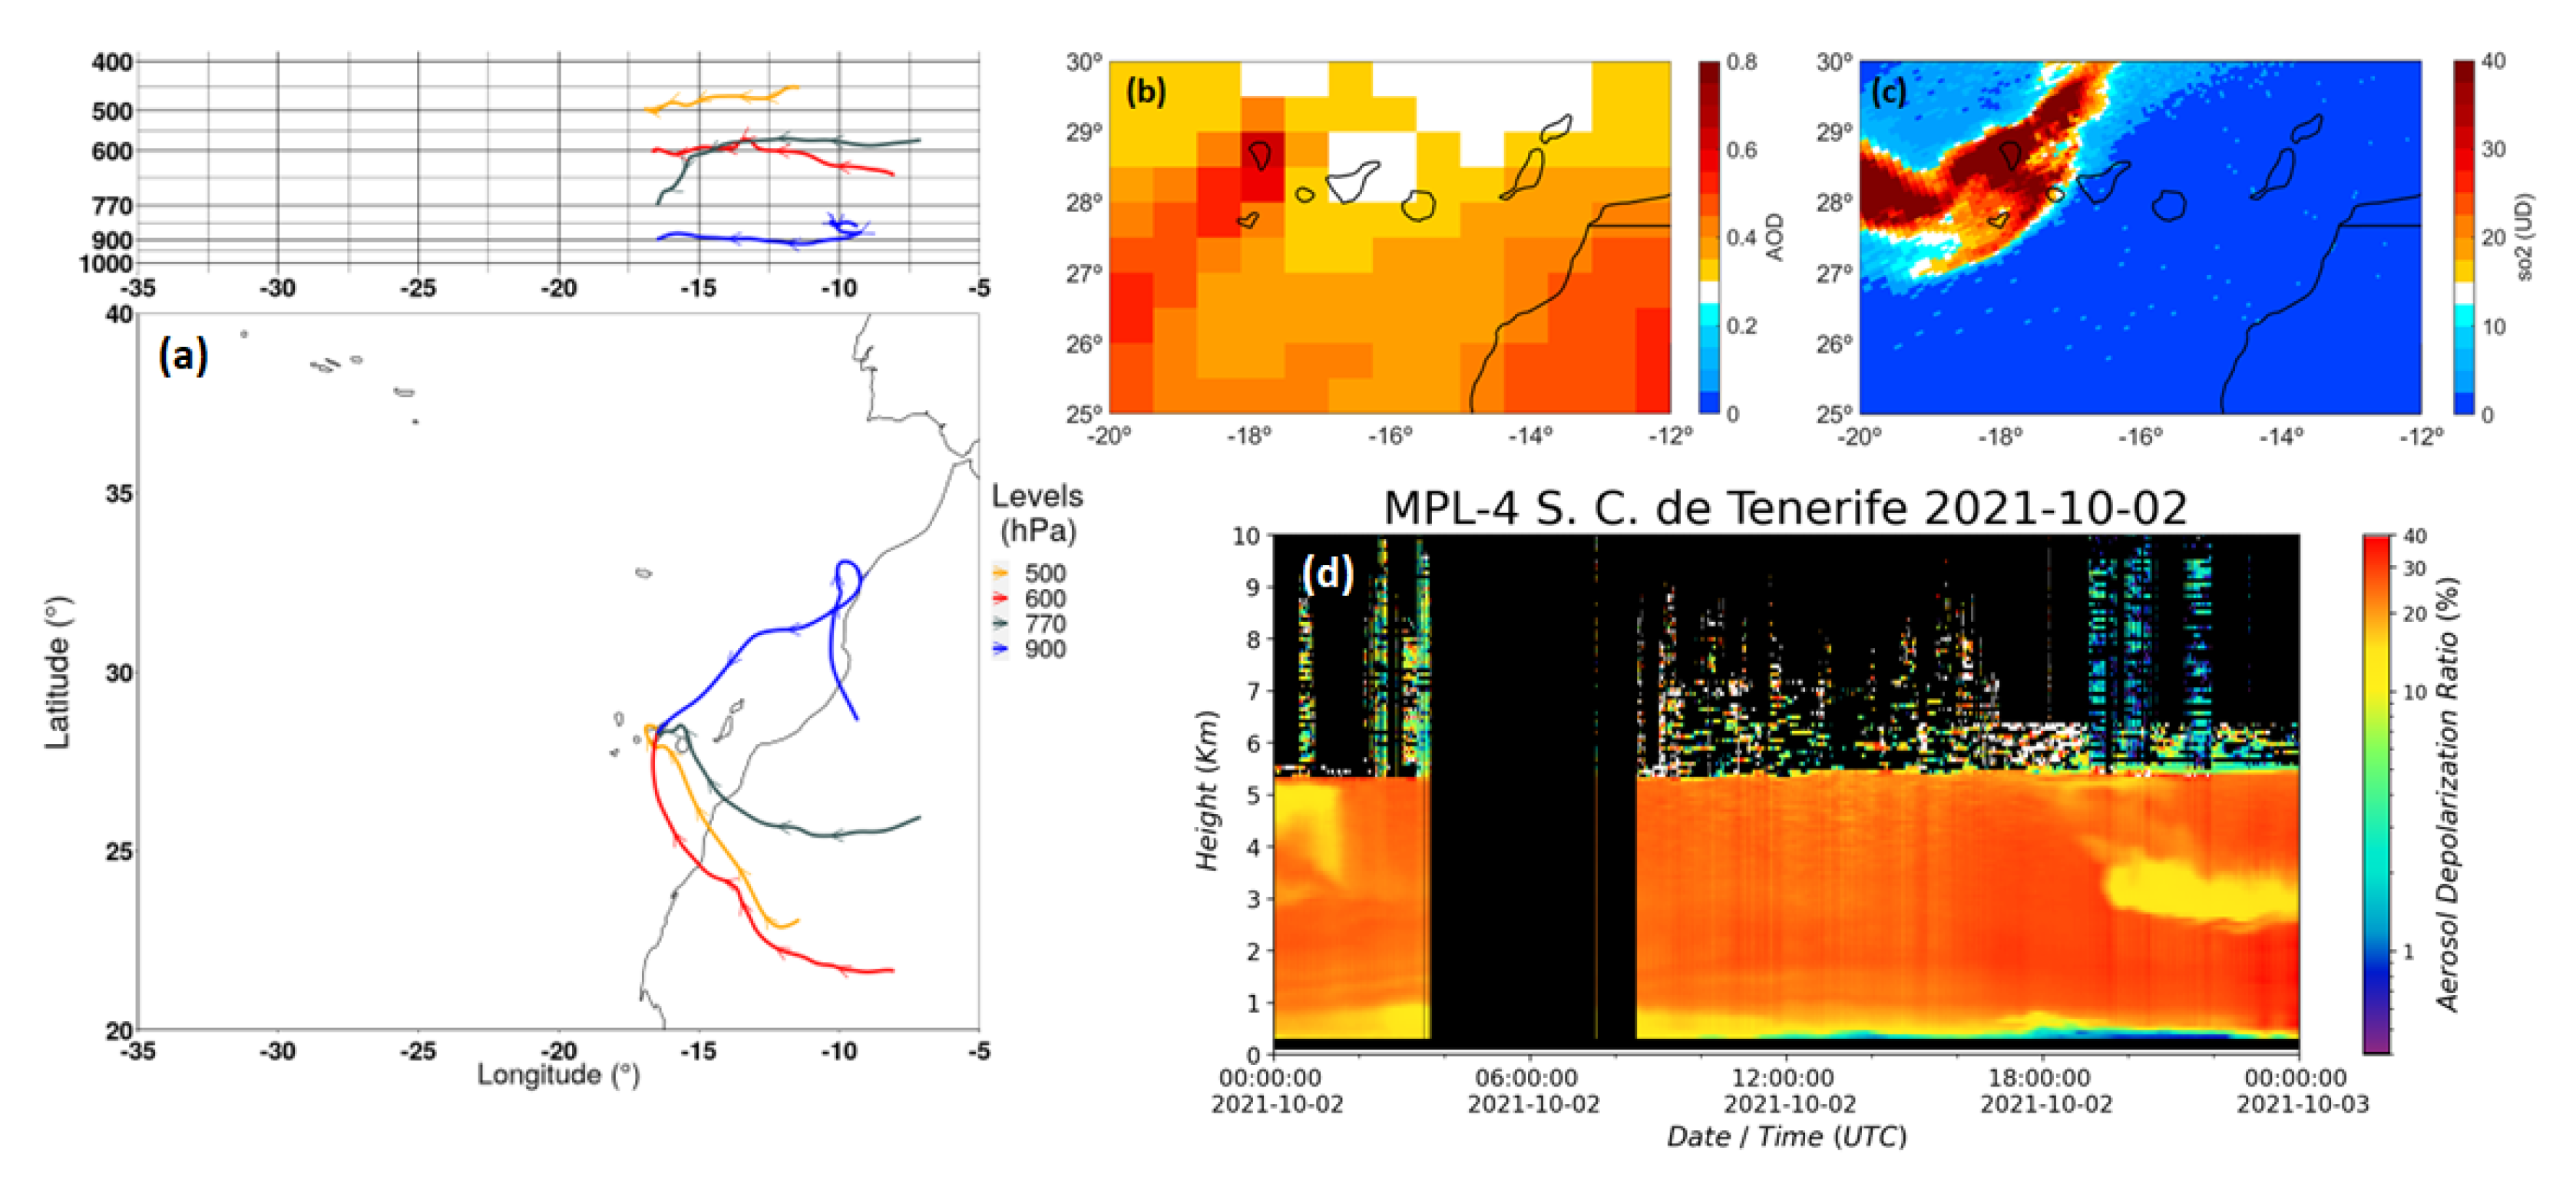
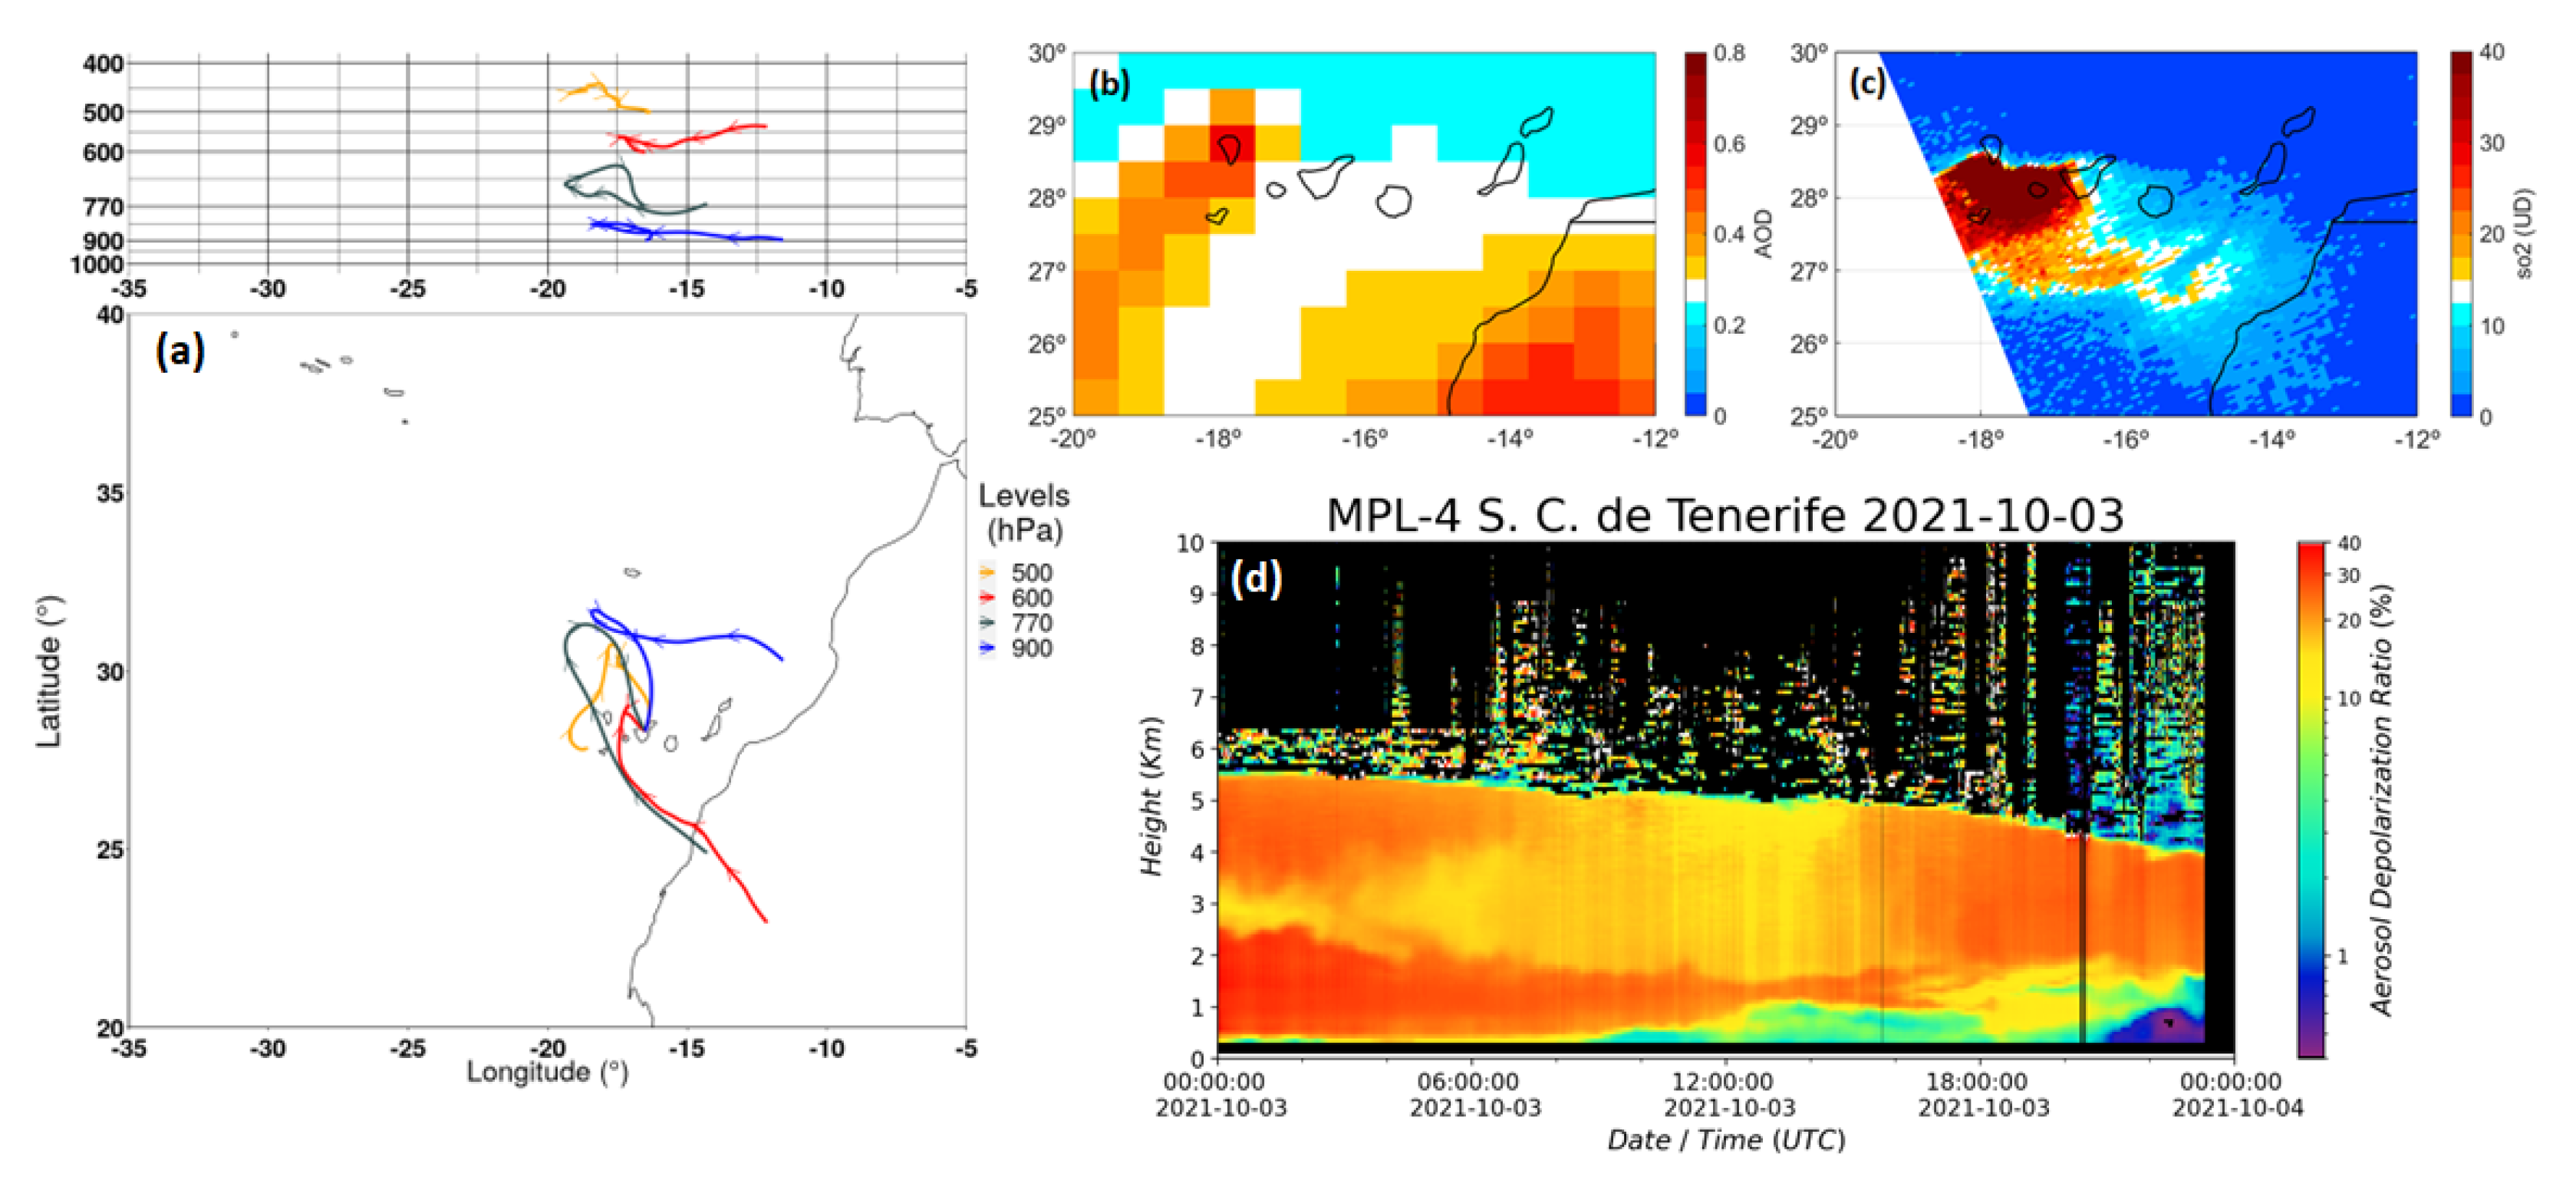
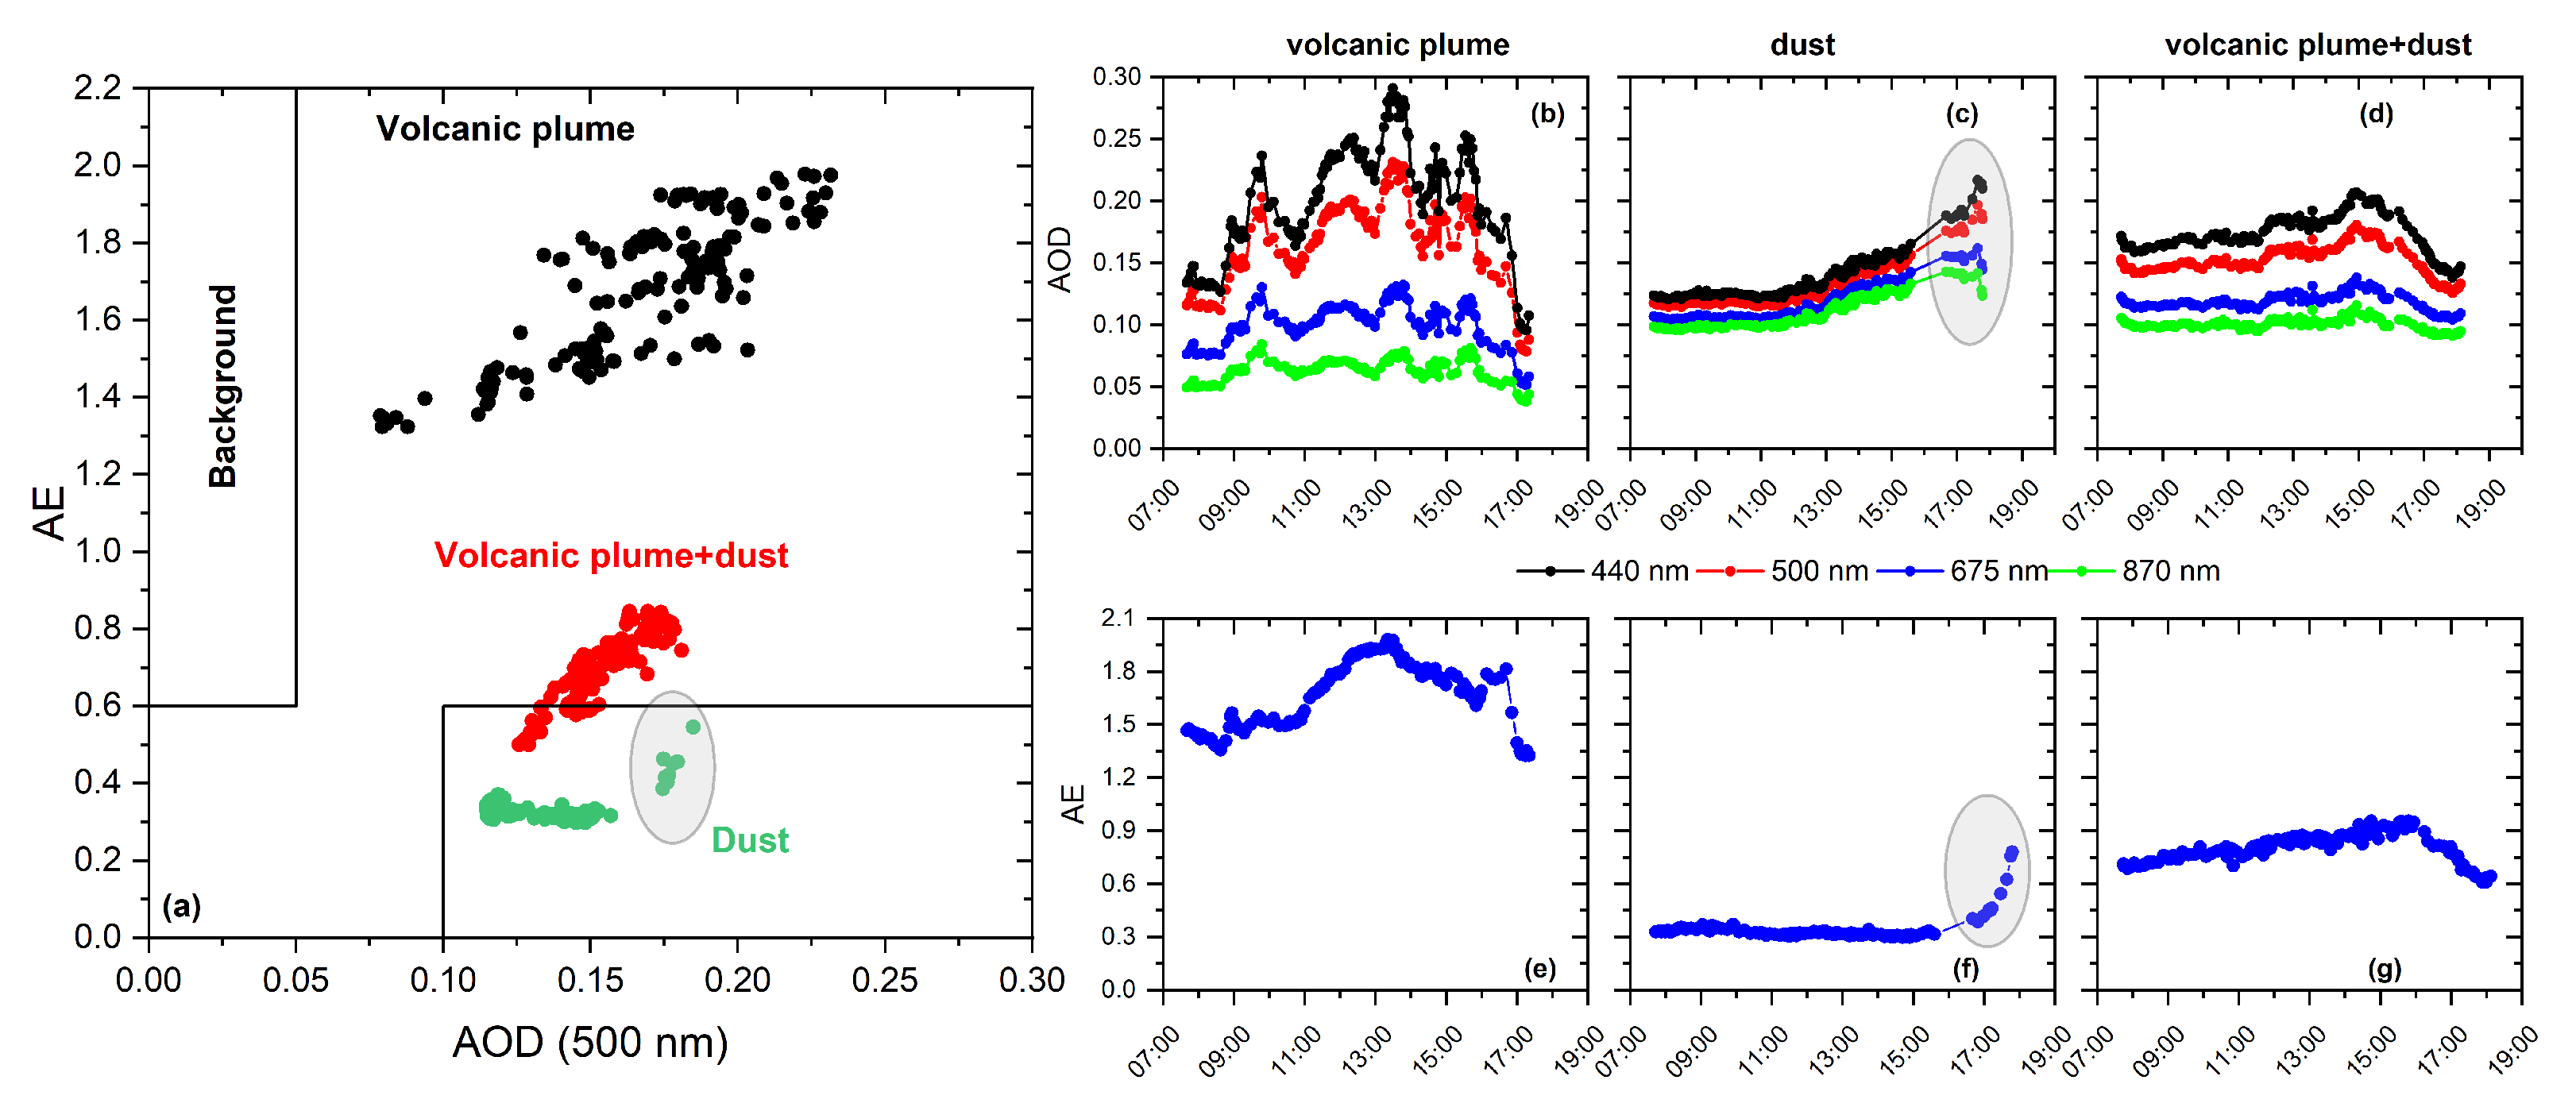
4.1. Selection of Case Studies

Three case studies were selected within the almost three-month period of the volcanic eruption on La Palma, taking the dominant aerosol in the atmosphere into account. Ground-based (MPL) data, satellite-based (Sentinel-5P TROPOMI) data, reanalysis (MERRA-2), and backward trajectories (FLEXTRA) were used to identify the source and type of aerosols arriving at Tenerife in the three case studies.
The first case study corresponds to a significant event of volcanic aerosols transported directly from the volcano on La Palma affecting Tenerife between 22 and 25 September [4,74], with a strong impact on 24 September (Figure 2). The backward trajectories in Figure 2a indicated the presence of air masses originating from the northwest having passed over La Palma in the previous 3 days at altitude levels > 900 hPa, with the consequent transport of volcanic aerosols to Tenerife at the IZO’s altitude (at approximately 770 hPa). The daily average MERRA-2 AOD at 550 nm displayed an increase in the AOD over the western part of the Canary Islands (AOD up to 0.60), attributed to the presence of volcanic aerosols (Figure 2b). The influence of the volcanic eruption over Tenerife was also evident from the TROPOMI-integrated SO 2 column (overpass time at 15:21 UTC), with a plume extending eastwards and affecting the majority of the islands (especially Tenerife). Figure 2d and Figure A1 show the δ a e r and δ v o l values, respectively, measured on 24 September with the presence of different aerosol layers in the column extending from 2 km to 6 km a.s.l., with δ a e r ranging from almost 0% to 40%. Near midday, coinciding with the backward trajectories and TROPOMI overpass, we observed the presence of non-light-depolarising aerosols ( δ a e r < 4%), with volcanic sulfates as the expected predominant contribution to the atmospheric column. A layer of aerosols of different properties was observed from 1.8 to 4.8 km after 16:00 UTC. These aerosols, probably ash particles mixed with sulfates, presented a higher depolarisation ( δ a e r between 0% and 40%) and a more marked coarse-mode influence in the size distribution (as discussed in the following section). The maximum δ a e r (up to 40%) was observed in some specific, thin layers with volcanic ash as the expected predominant aerosol. These δ a e r values measured at La Palma under the influence of volcanic aerosol agree with the values found by Ansmann et al. [75] for the Eyjafjallajökull volcano (34% for coarse particles and 2% for fine particles) and the values observed by Pisani et al. [76] for the eruption of Mount Etna ( δ a e r almost zero for non-light-depolarising particles and up to 45% for volcanic ash).
The second case study corresponds to a mineral dust intrusion over Tenerife on 2 October. Figure 3a shows that the origin of the air masses arriving at the IZO at different levels was the Western Sahara. The MERRA-2 AOD (Figure 3b) displayed AOD values of 0.43 near La Palma and AOD values up to 0.67 over North Africa, demonstrating the existence of the Saharan dust influence over the Canary Islands. The TROPOMI image (overpass time at 14:30 UTC) in Figure 3c shows the location of the volcanic plume west of Tenerife, therefore, demonstrating that mineral dust was the predominant aerosol during this event. This predominance was also confirmed using lidar data. Figure 3d shows an aerosol layer homogeneous in terms of δ a e r confined up to 5 km in height. The depolarisation values within this layer were found to be up to 32.7%, with a mean value of 24.7 ± 1.2% in the 7-h period between 09:00 and 16:00 UTC in the altitude range between 1 and 5 km a.s.l. The vertical profile and depolarisation values observed in this aerosol layer coincide with the structure of the Saharan Air Layer (SAL), with δ a e r values in agreement with previous studies of mineral dust aerosols (e.g., [75,77]). These studies found a desert dust depolarisation ratio of 31%, which is very close to the value measured during this second event. The homogeneous conditions attributed to the presence of mineral dust were ensured until about 17:00 UTC, when the presence of a different layer with lower δ a e r values was observed in the MPL profiles near 5 km. Another wider layer was observed after 19:00 UTC between 2.5 and 3.2 km, with δ a e r below 15%.
The third case study represents an event of mixed aerosols in the column on 3 October as a mixing of volcanic and mineral dust aerosols. In this event, we observed bi-component aerosols as a result of the mixture of the volcanic plume with mineral dust carried on the SAL. The origin of the air masses from North Africa and the subsequent transport over La Palma is apparent in Figure 4a. The influence of the mineral dust from North Africa can be seen in Figure 4b, where both the dusty air masses and volcanic plume (also observed in Figure 4c from TROPOMI, overpass time at 14:11 UTC) that affected Tenerife can be seen. The varied nature of the aerosols in comparison to the previous event (dominated by mineral dust) can be seen in Figure 4d. In this Figure, it can be seen that lower δ a e r values were observed from 1.8 km to 5 km a.s.l. These values ranged from 13.6% to 32.1%. The decrease in δ a e r observed in comparison to the second event was attributed to the arrival of the volcanic plume, observed from the afternoon of 2 October to the afternoon of 3 October, and the subsequent mixture of dust (depolarising aerosol) with non-light-depolarising volcanic sulfates, especially in the middle of the day (mean δ a e r of 16.4% between 10:00 and 14:00).

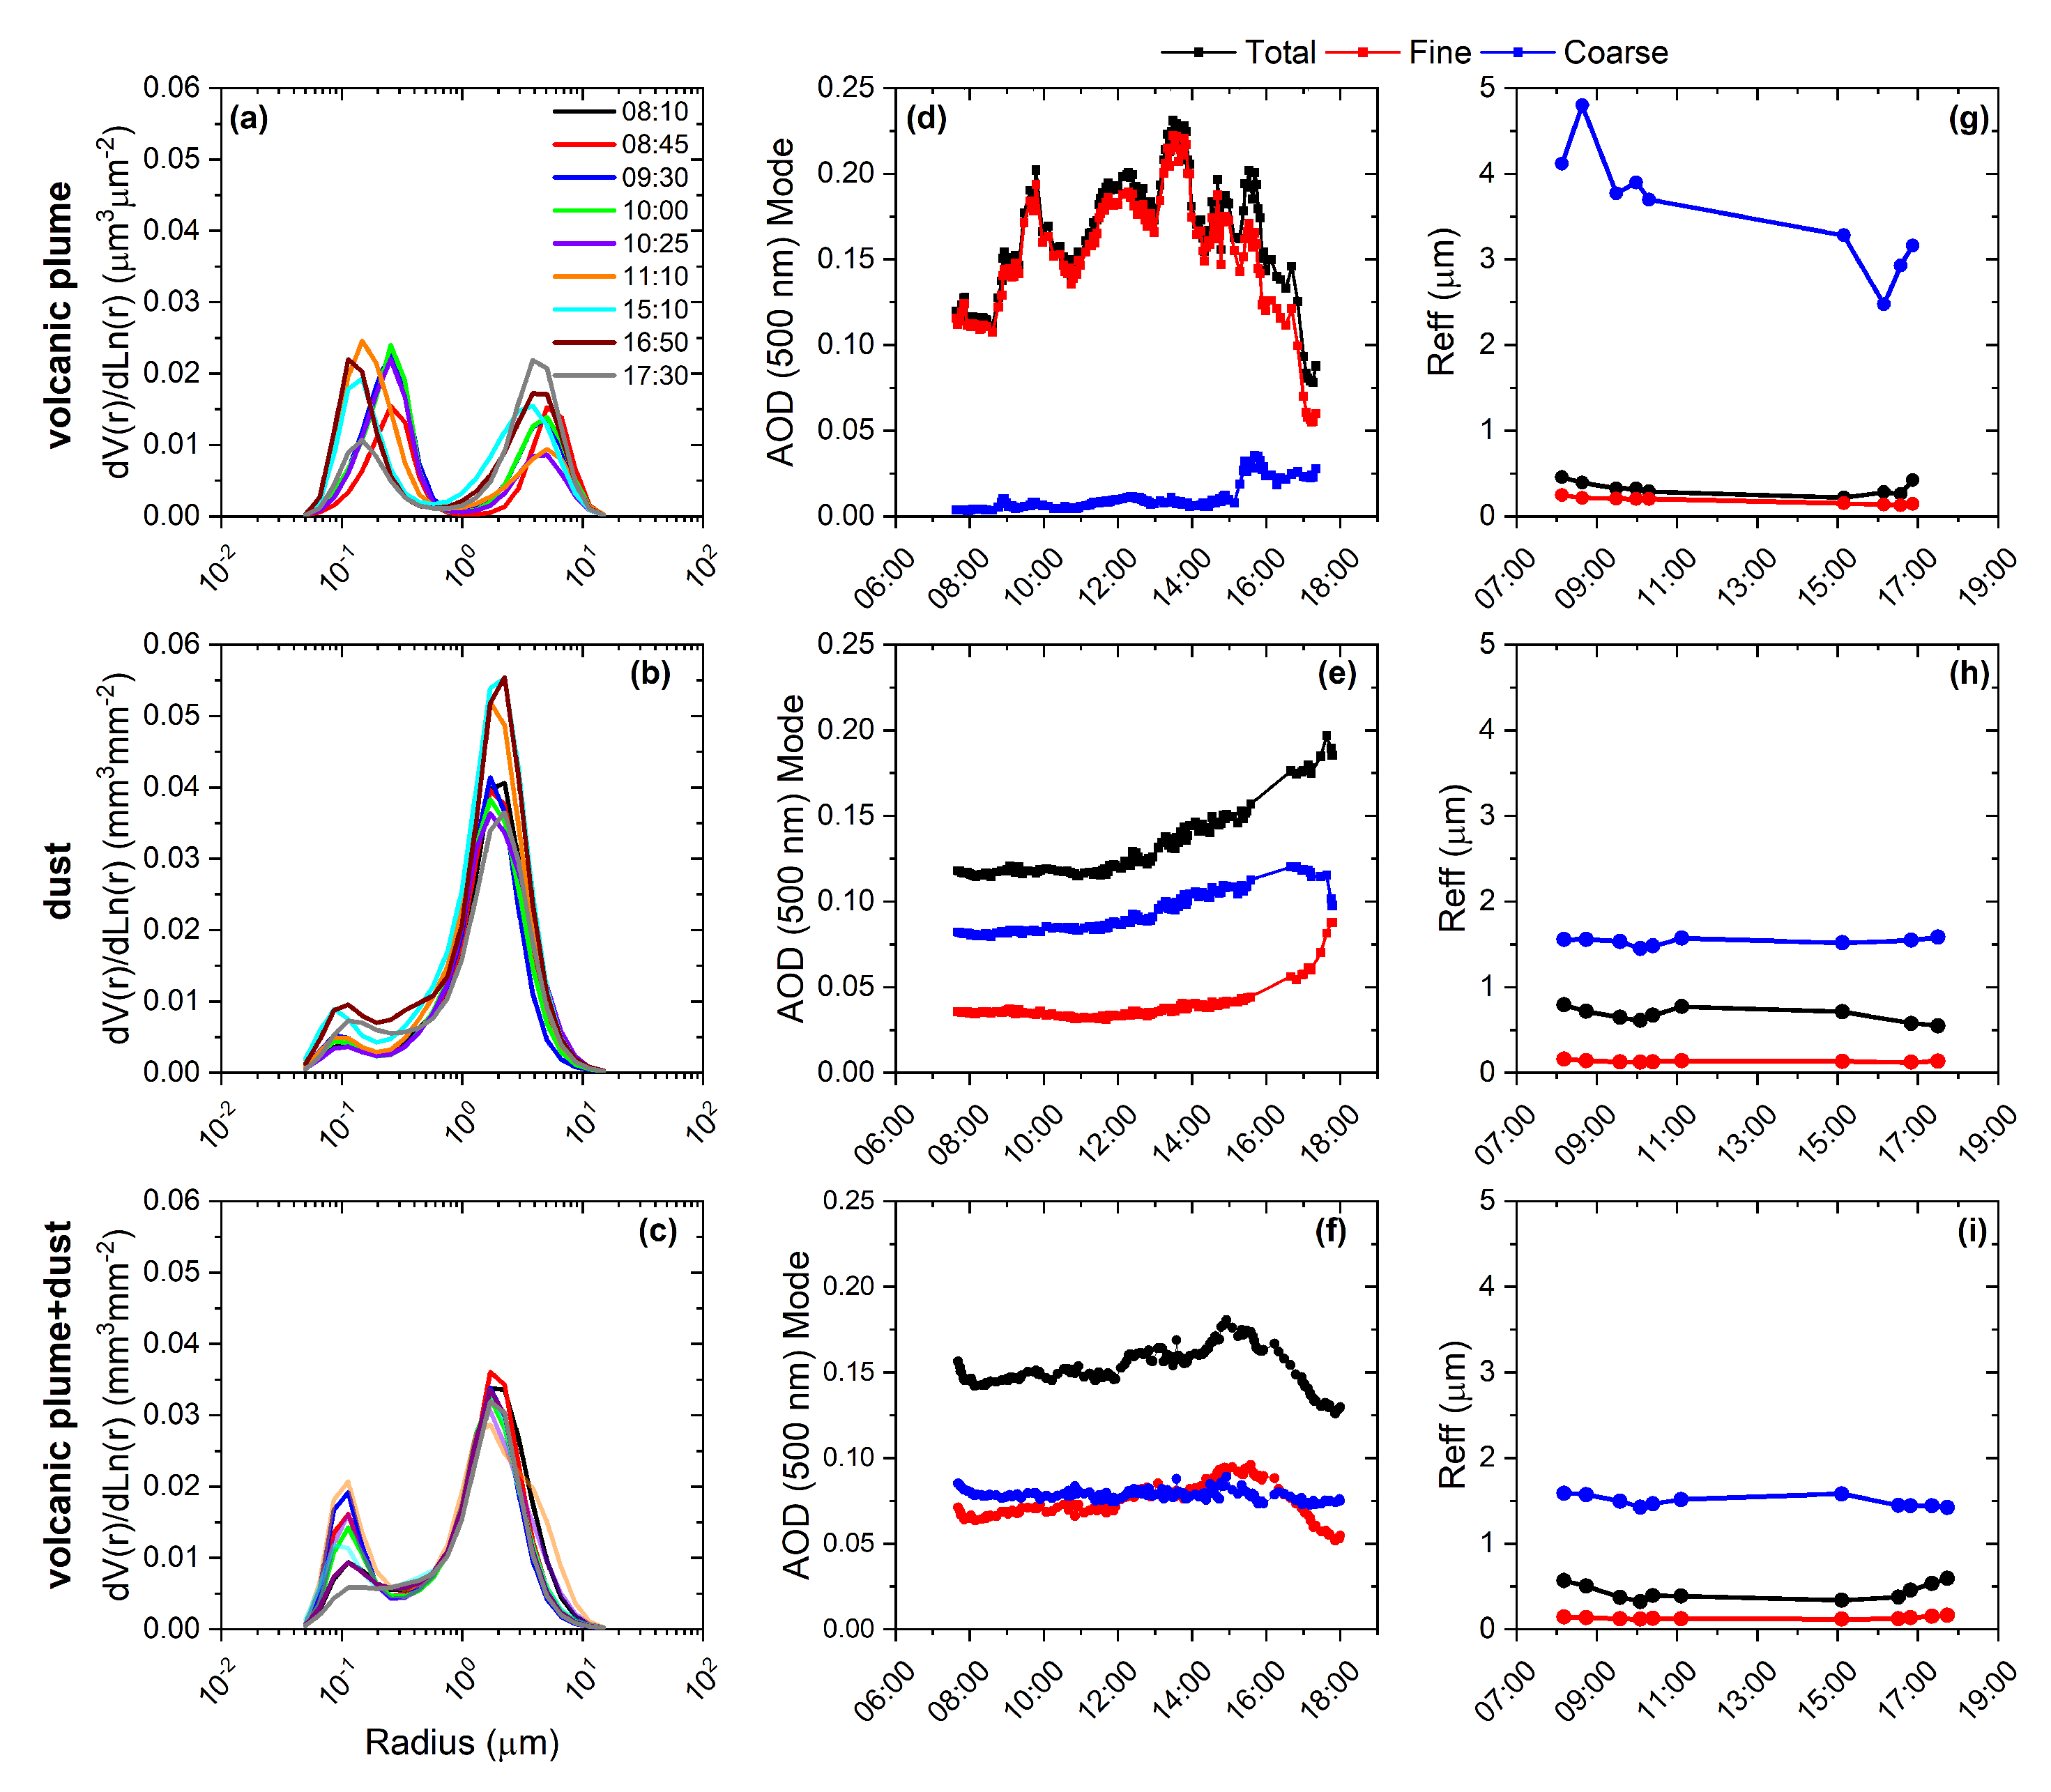
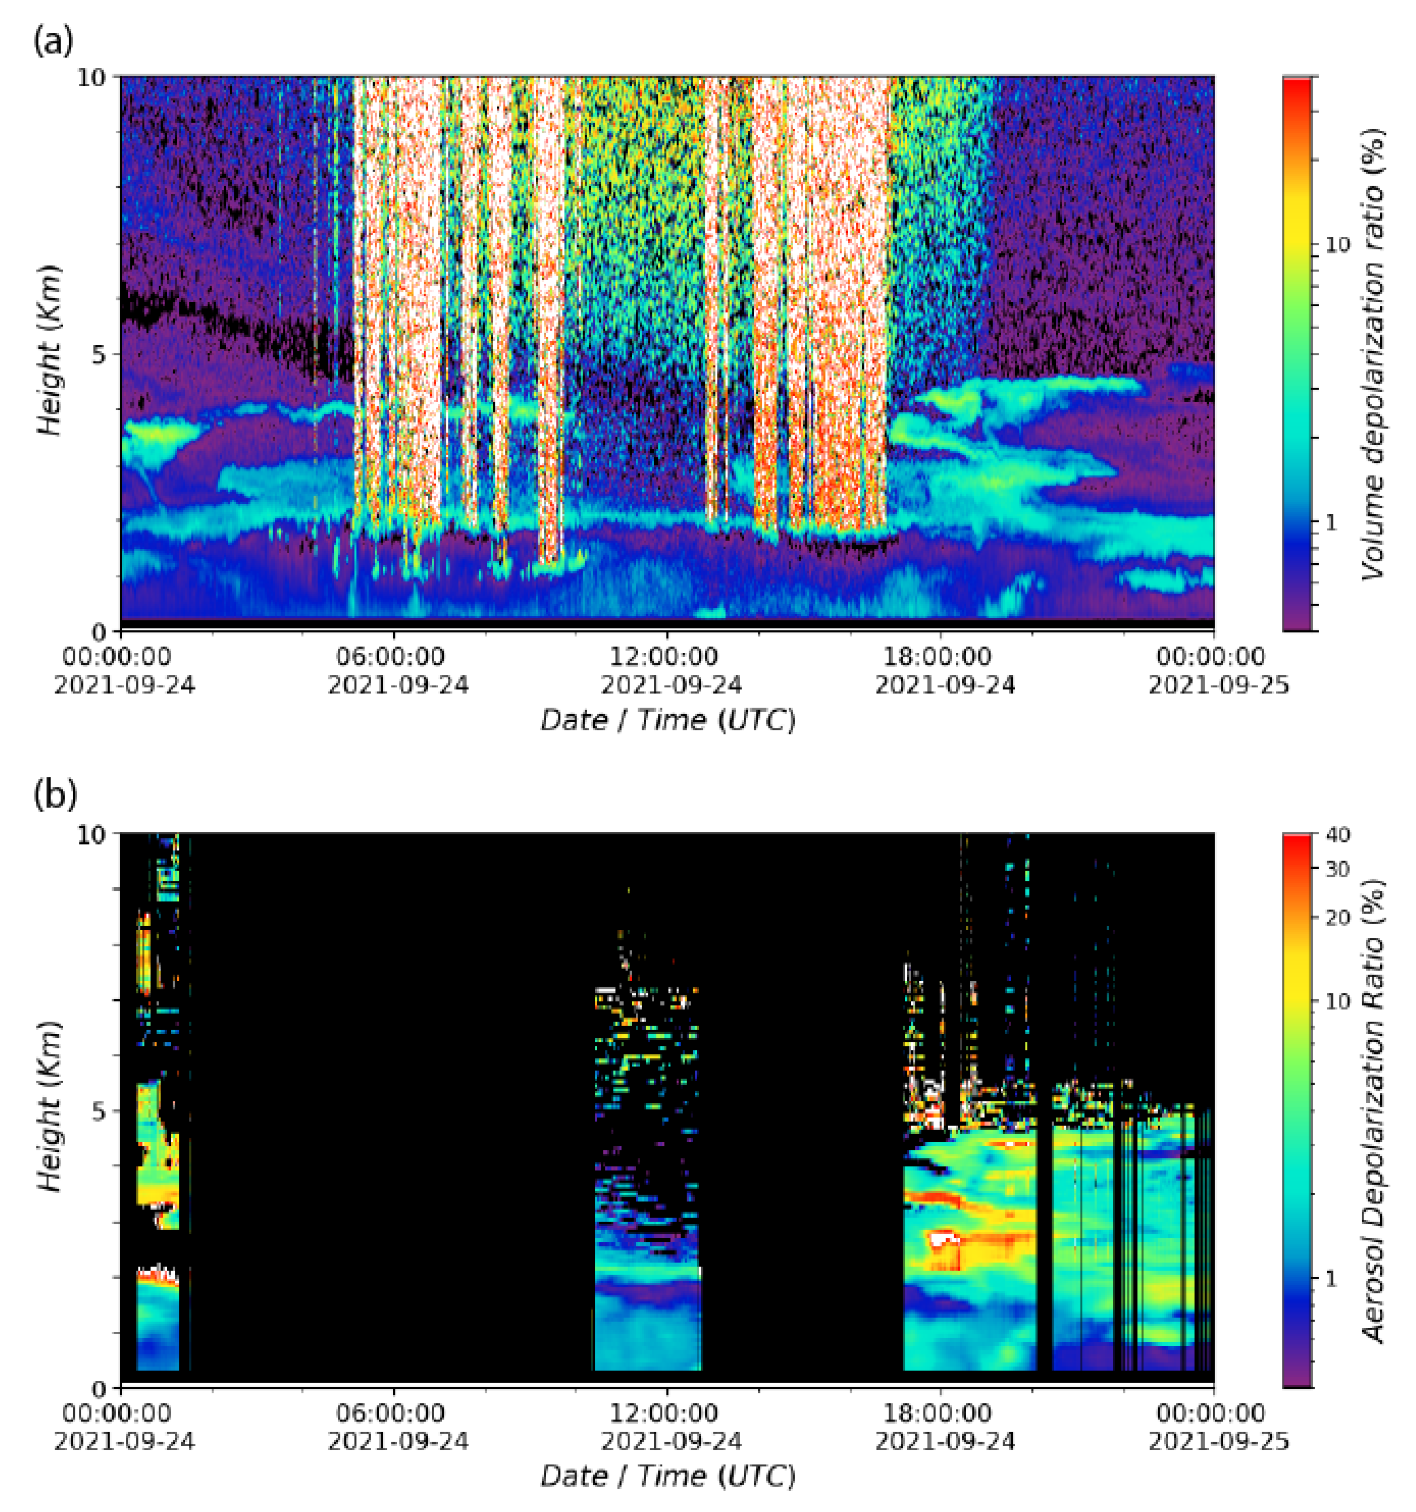
4.2. Characterisation of Optical and Micro-Physical Aerosol Properties

We studied the optical and micro-physical properties of the atmospheric aerosols from the previously defined case studies: volcanic, mineral dust, and the possible mixture of these two components in the atmospheric column. This analysis was performed using photometric information extracted from the CE318-T photometer installed at the IZO (see Section 2.2.2).
The joint analysis of the AOD and AE is a common procedure to roughly discriminate the type of aerosol measured (mineral dust, biomass burning/urban-industrial, background conditions, etc.) [78,79]. The joint analysis was complemented with threshold limits established for the background conditions (AOD 500 nm < 0.10 and AE > 0.60) and dust conditions (AOD 500 nm ≥ 0.10 and AE ≤ 0.60) at the IZO published by Barreto et al. [46]. This analysis is shown in Figure 5a, where the presence of the volcanic plume over the IZO on 24 September with AOD 500 nm > 0.10 and 1.2 ≤ AE ≤ 2.0 can be observed. Saharan dust was measured between 07:00 and 16:00 UTC on 2 October, with an AE < 0.4 and an AOD ranging from 0.11 to 0.16 (median of 0.12). These dust values agree with those in Barreto et al. [46] at the IZO. The grey circles in this figure indicate the arrival of the volcanic plume, and therefore, conditions which cannot be attributed to the presence of mineral dust. The arrival of aerosols of a different nature was already observed from the lidar analysis in Section 4.1. With regard to the mixture of volcanic aerosols and Saharan dust observed on 3 October, the AOD ranged between 0.13 and 0.18 (median of 0.15) and the AE increased to 0.61–0.96 (median of 0.81). The sequence of the spectral AODs (at AERONET channels of 440, 500, 675, and 870 nm) and AEs displayed in Figure 5b–g provides evidence of the presence of one event dominated by volcanic aerosols (Figure 5b,e) and another dominated by mineral dust (Figure 3c,f). The third event (Figure 5d,g) presented intermediate characteristics to those observed in the two previous events, which are in agreement with the previous study in Section 4.1. During the three case studies, the maximum AE values corresponded to the volcanic plume case, values five times higher than those for dust.
The evolution of the volume size distribution and the total-, fine-, and coarse-mode AODs and effective radii ( R e f f ) of the total, fine, and coarse modes are shown in Figure 6. In the case of the volcanic aerosols (24 September), bi-modal distribution with a dominant fine mode can clearly be seen in Figure 6a,d,g (sulfate-dominated plume). The exception to this pattern was found after 16:00 UTC, with the presence of coarser particles. This different aerosol regime was also discussed in Section 4.1 as a layer of aerosols observed from 1.8 to 4.8 km with higher δ a e r values. In this event, fine-mode aerosols presented an R e f f ranging from 0.13 to 0.24 μ m, similar to the values presented by Derimian et al. [80], whereas coarse-mode aerosols were characterised by an R e f f ranging from 2.48 to 4.80 μ m. The size of the coarse-mode aerosols measured in this event is higher than the values measured by Ansmann et al. [75] and Derimian et al. [80] over Europe corresponding to the volcanic plume from Eyjafjallajökull in 2010 (between 1.23 and 1.45 μ m). However, in our case, the proximity of the source plays an important role in minimising sedimentation processes.
In the second event on 2 October dominated by mineral dust, the greatest contribution was from coarse-mode aerosols (Figure 6b,e,h). A bi-modal log-normal size distribution was found, although there was a clear dominance of coarse mode centred at 1.55 μ m, similar to the values reported by Barreto et al. [81].
In the case of the mixture of volcanic aerosols and mineral dust on 3 October, the contribution of fine-mode aerosols increased, and therefore, the contribution to the total AOD was approximately 50% for fine mode and coarse mode (Figure 6c,f,i). In this case, we observed a predominant coarse mode centred at 1.49 μ m and higher variability in fine mode (0.11–0.16 μ m).

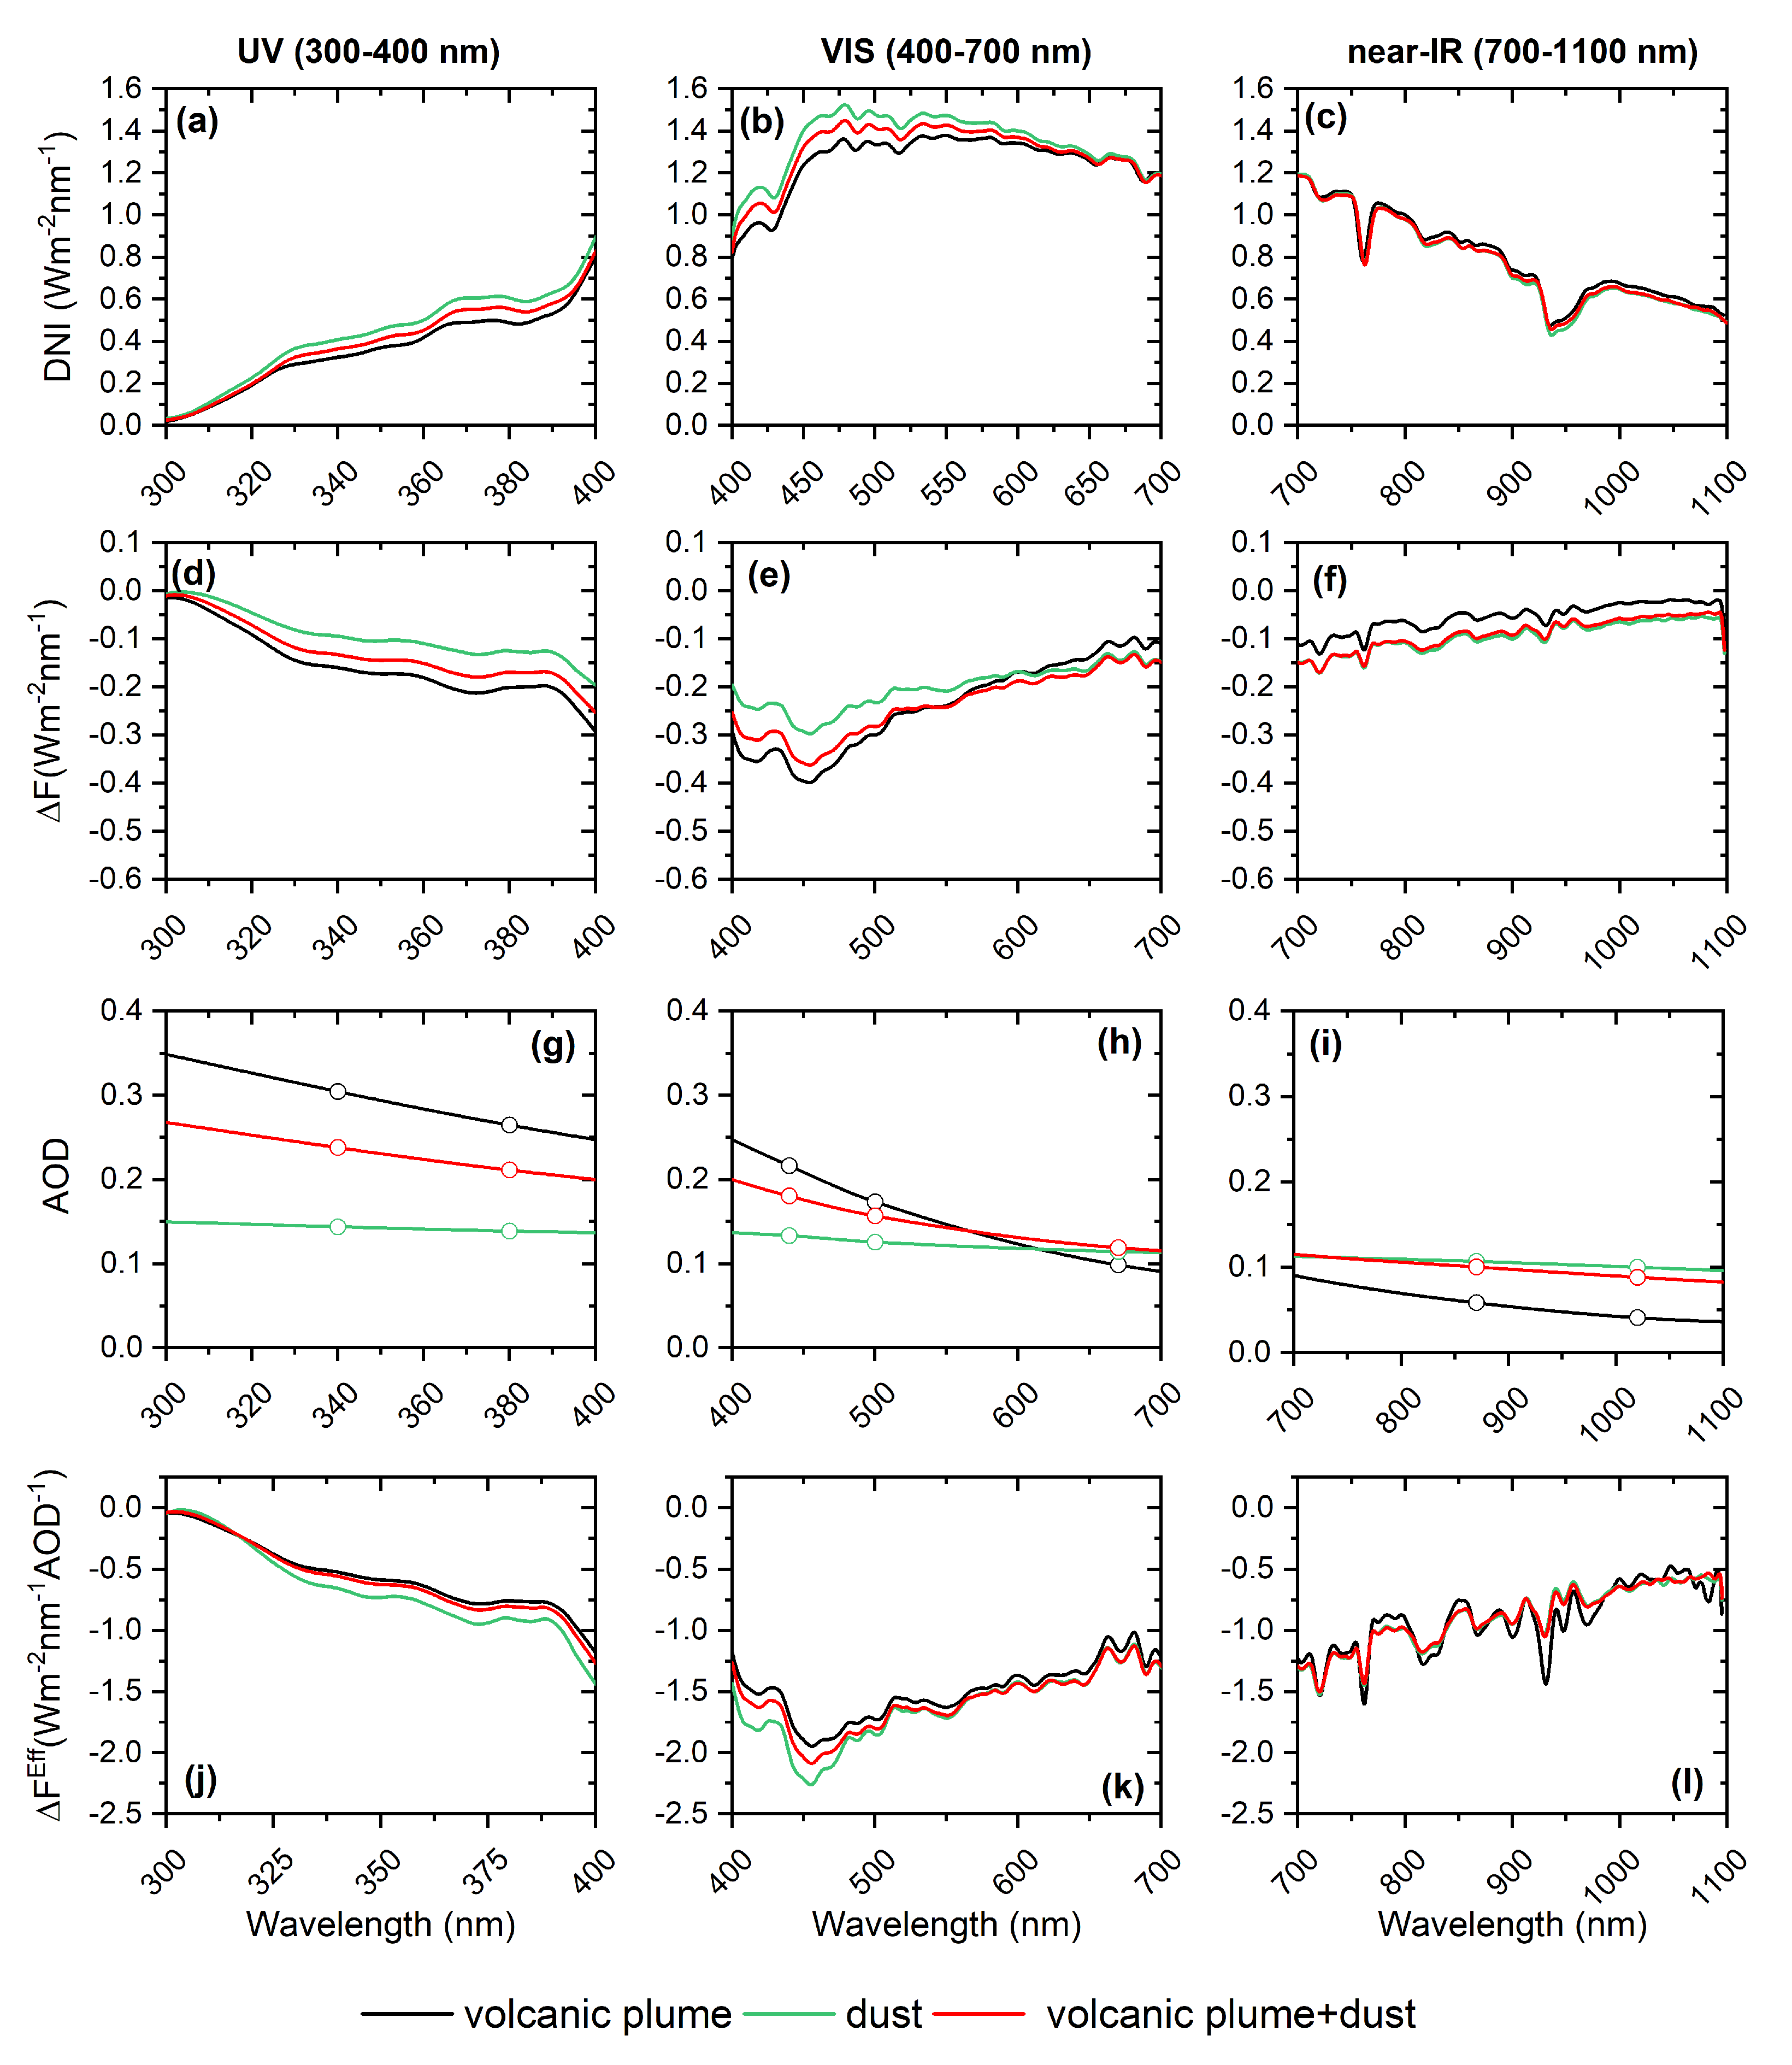
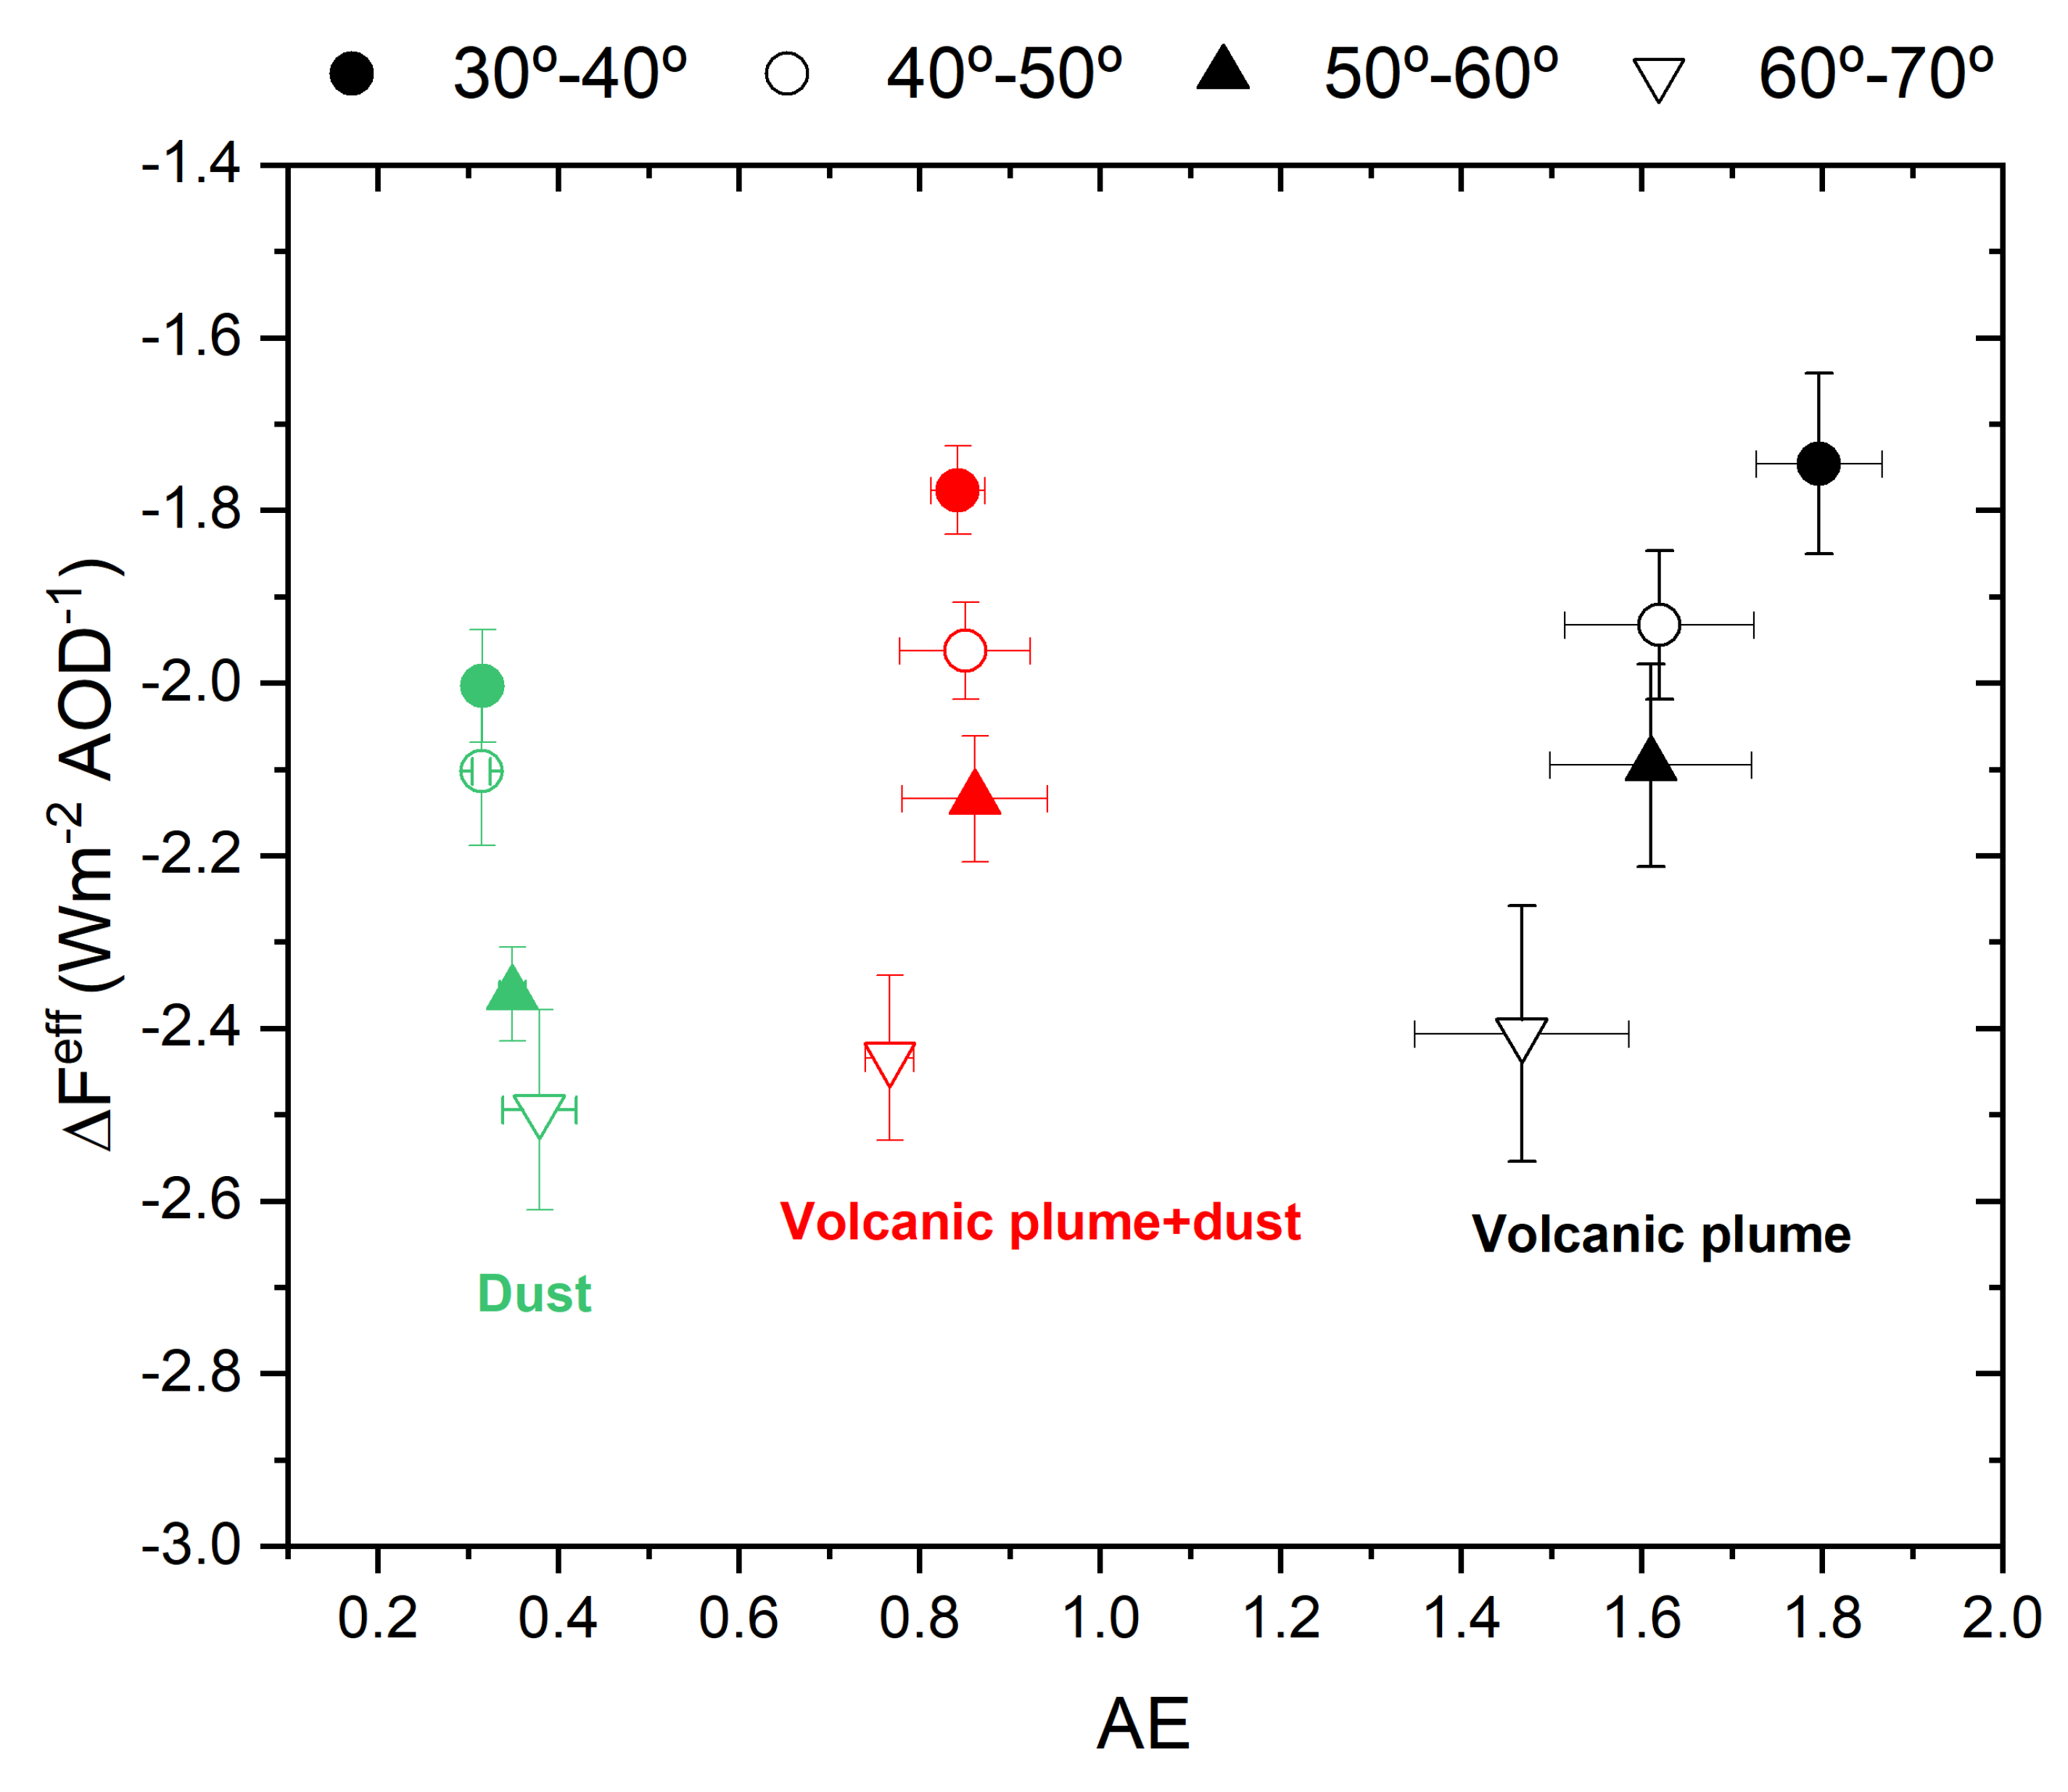
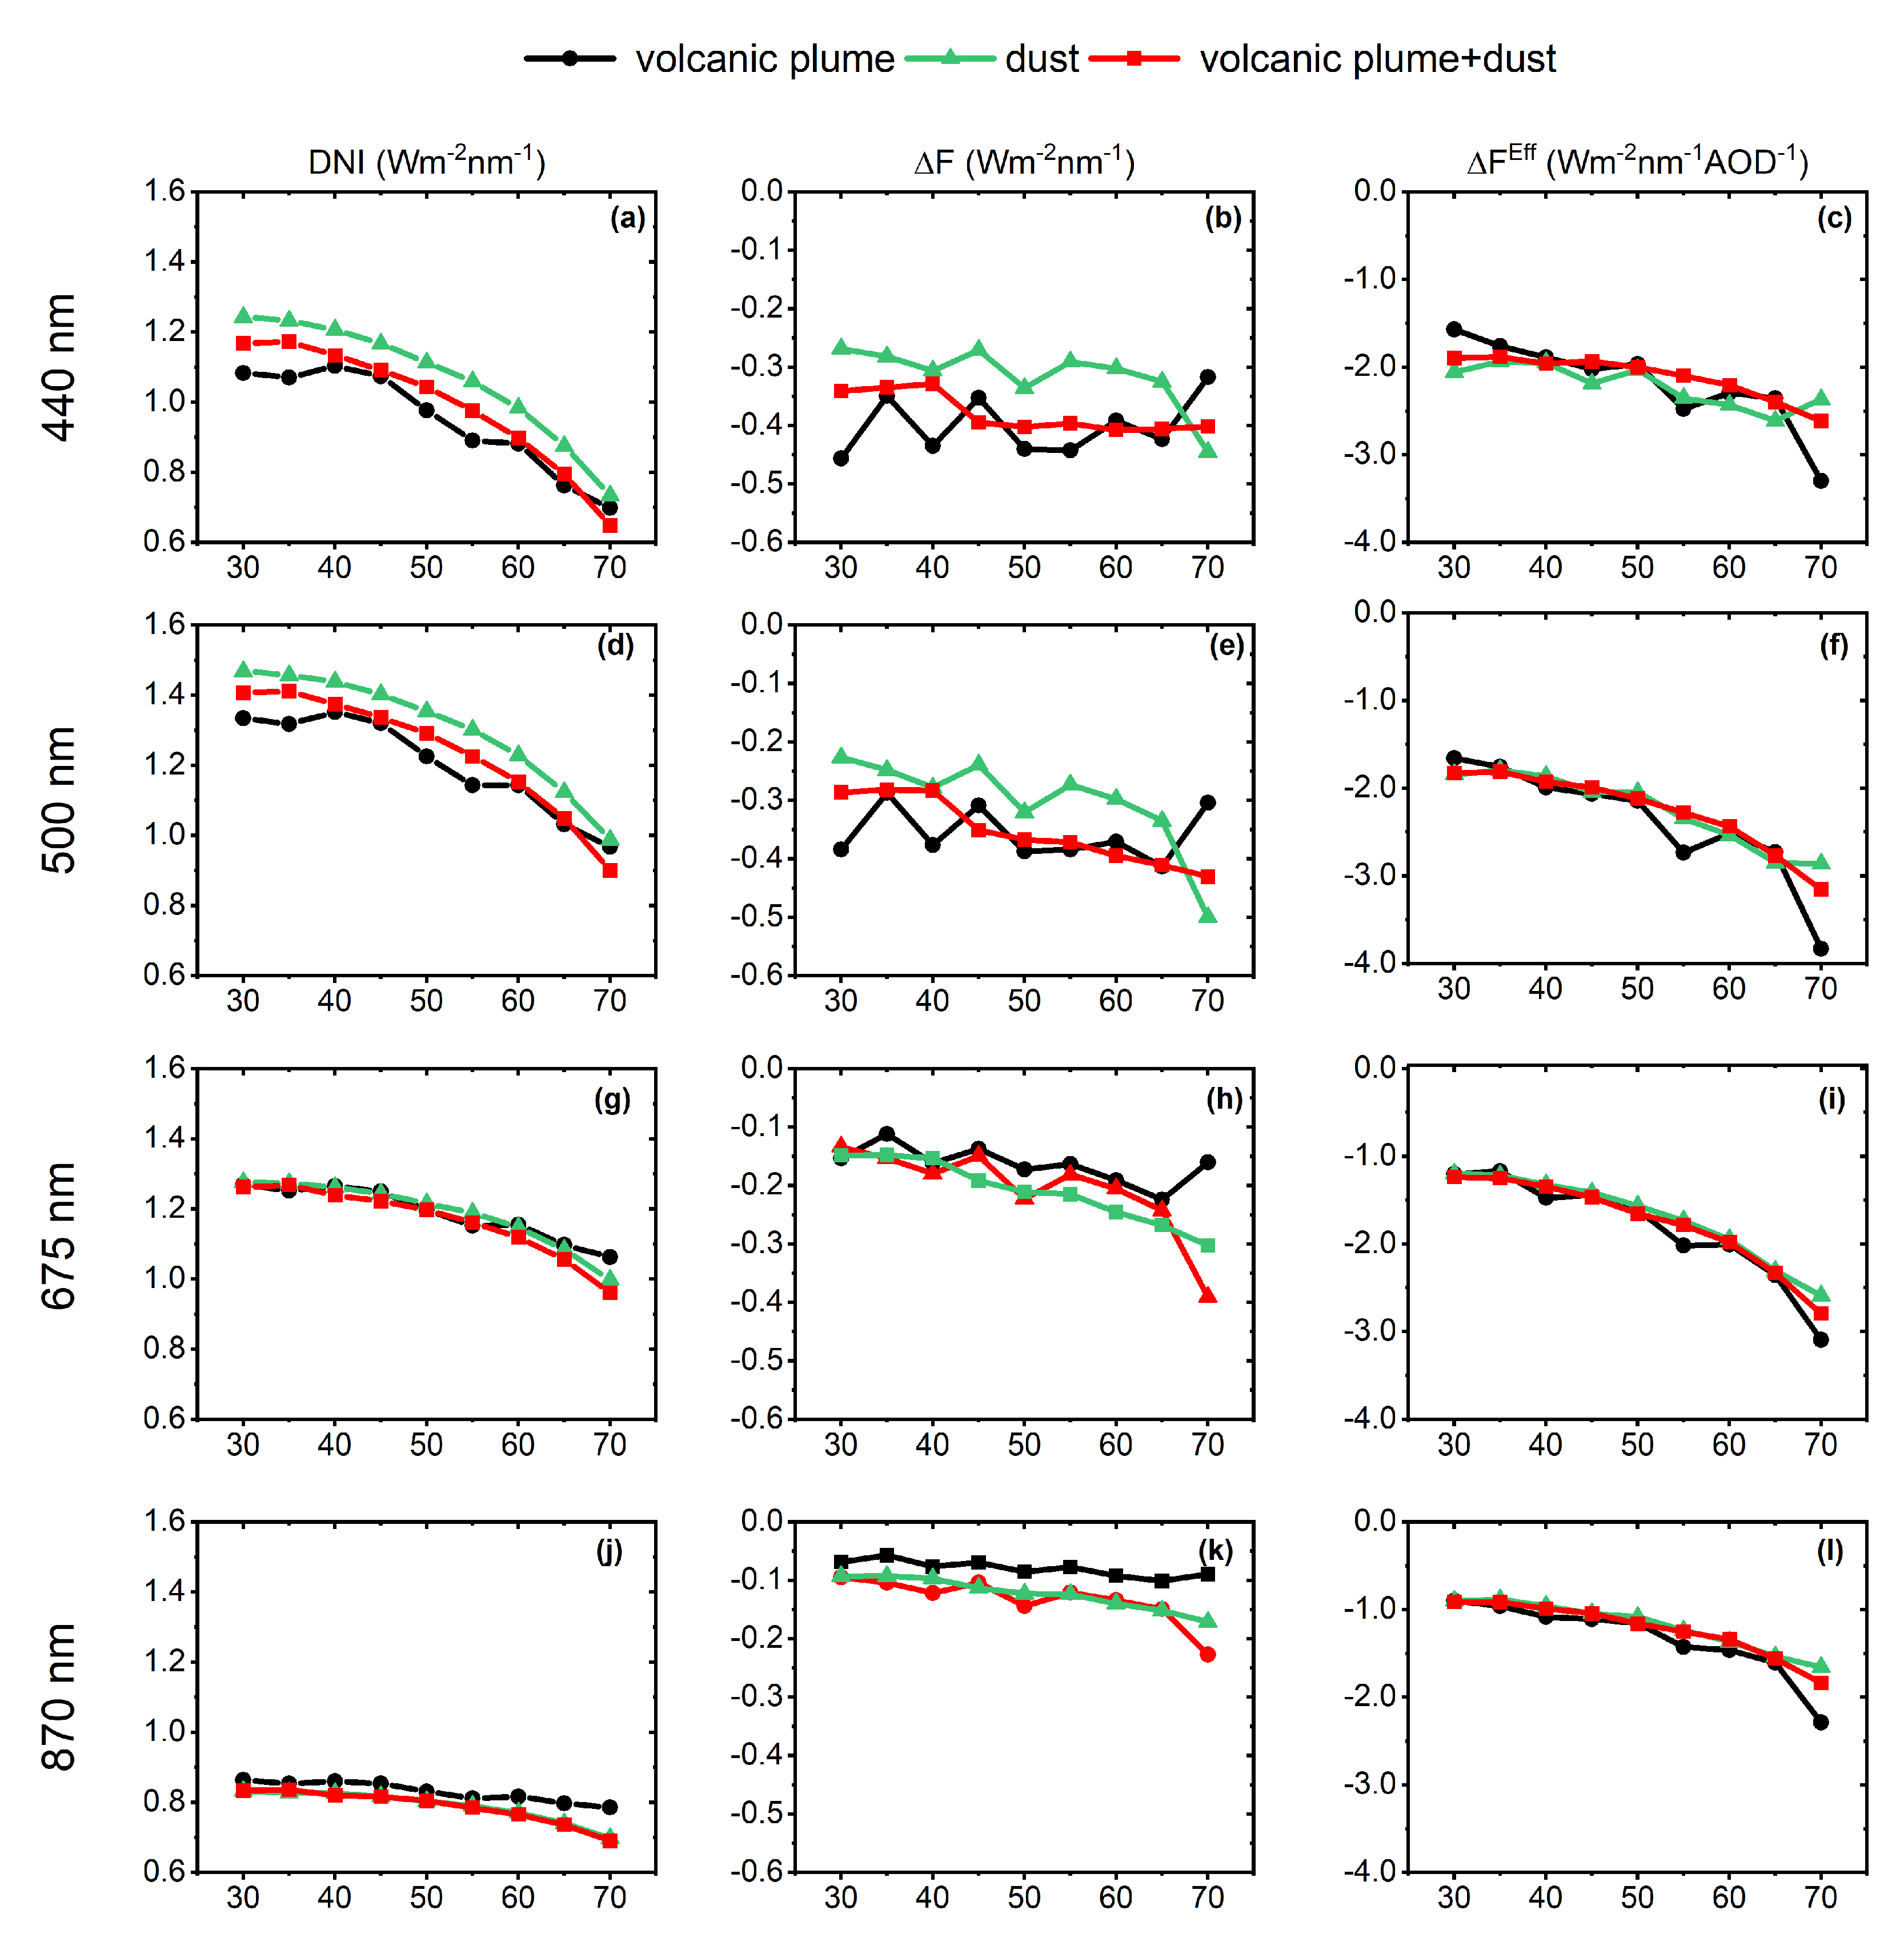
4.3. Spectral Aerosol Radiative Forcing and Efficiency
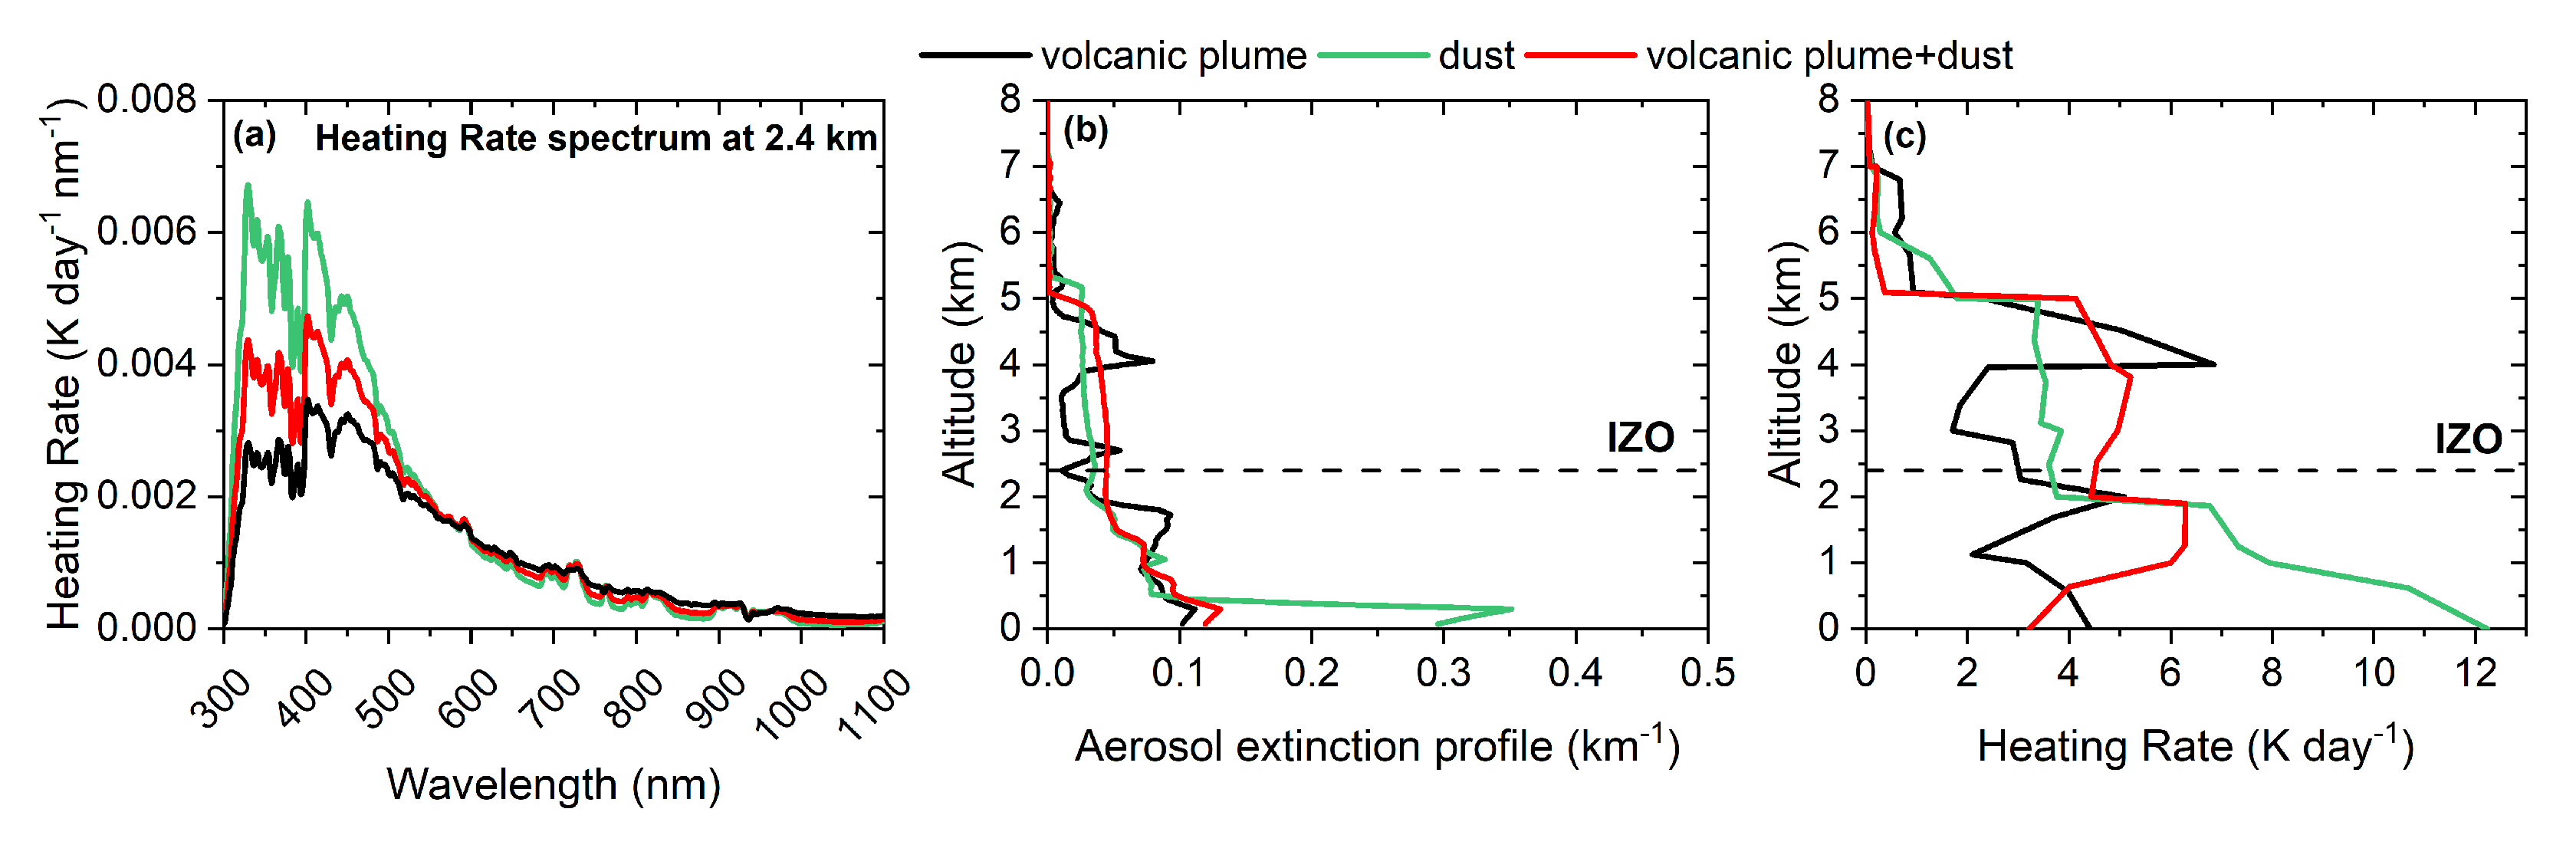
The DNI observations (Wm 2 nm 1 ) performed with the EKO for the three case studies and the corresponding Δ F (Wm 2 nm 1 ) and Δ F E f f (Wm 2 nm 1 AOD 1 ) are shown in Figure 7 for the UV (300–400 nm), VIS (400–700 nm), and near-IR (700–1100 nm) spectral ranges at an exemplary SZA of 30 . This SZA represents the typical measurement conditions at the IZO. Note that the Δ F E f f was computed from Equation (2) using the spectral AOD at the EKO’s wavelengths, which was determined by applying Angstrom’s law [82] considering the AERONET AOD data at the 340, 380, 440, 500, 675, and 870 nm spectral bands in a 2-min temporal window around each EKO measurement [33,83].
A preliminary analysis of the results depicted in Figure 7 shows a significant spectral variation in the Δ F and Δ F E f f estimates, with the strongest aerosol impact located in the VIS range and peak values around 440–460 nm. The Δ F of the volcanic aerosols was greater than those of the dust and mixed particles (volcanic and dust) for wavelengths λ 600 nm, whereas it was found to be smaller beyond this wavelength limit (Figure 7d–f). As illustrated in the spectral AOD values for the three events (Figure 7g–i), the spectral Δ F was determined by the joint effect of the higher aerosol load present for volcanic aerosols and its steeper spectral dependence. The latter was associated with the presence of smaller particles, i.e., the sulfate-dominated plume with larger AE values (see Section 4.2).
Nevertheless, when considering the aerosol radiative effect and ruling out the AOD influence and λ 600 nm, the maximum Δ F E f f was found for the mineral dust particles (Figure 7j,k). This pattern was consistently observed throughout the day, as illustrated in Figure 8, which displays the Δ F E f f values at 440 nm as a function of the AE and SZA for the three case studies. The Δ F E f f ranged between −2.0 and −2.5 Wm 2 nm 1 AOD 1 for the mineral dust, between −1.8 and −2.4 Wm 2 nm 1 AOD 1 for the mixed volcanic aerosols and dust particles, and between −1.7 and −2.4 Wm 2 nm 1 AOD 1 for the volcanic aerosols (Figure 8). The mineral dust particles showed a greater capability to extinguish the incoming solar radiation than the volcanic aerosols as a consequence of their more marked absorption properties (especially at shorter UV-VIS wavelengths). As shown in Barreto et al. [81] and the references therein, the climatological single-scattering albedo (SSA) values of mineral dust at the IZO are expected to be ∼0.94 at 440 nm, which is significantly lower than those expected for sulfate-dominated volcanic plumes, as in our case. The sulfate aerosols were mostly characterised by averaged SSA values close to 1.0 (at UV-VIS wavelengths), indicating very weakly absorbing particles (more reflective aerosols) [15,84]. As documented by Logothetis et al. [85] and in agreement with our findings, coarse absorbing aerosols such as mineral dust tend to be more efficient at extinguishing solar radiation at the surface than fine non-absorbing particles (sulfates).
It is worth highlighting that for the mixed aerosols event, the contribution of small and non-absorbing sulfates to the mineral dust particles led to a decrease in the Δ F E f f values for λ 500 nm. At higher wavelengths, the Δ F E f f did not exhibit significant spectral differences between the three types of aerosols, and the gas absorption bands present (oxygen at 670–685 and 754–780 nm, and water vapour at 820–840 and 900–1000 nm) mostly accounted for the observed variability (Figure 7k,l).
The characterisation of the diurnal variability of the spectral Δ F and Δ F E f f is relevant for assessing the local radiative balance [86] and, therefore, the spectral responses of different physical and biological systems at the surface [26,87]. Considering the radiative effect at 440, 500, 675, and 870 nm as a function of the SZA (Figure 9), we observed that the Δ F and Δ F E f f increased as the SZA increased for all cases. This angular dependence is well-known from theoretical radiative transfer computations (e.g., [80,86,88]) and depends on the diurnal evolution of solar fluxes at the surface and the aerosol optical properties. As a result, the SZA pattern also showed a spectral dependence, with the greatest difference observed between the three types of aerosols at shorter wavelengths. The Δ F E f f variation with respect to the SZA was ∼16% higher for the volcanic aerosols than for the dust particles at 440 nm, whereas it was limited to ∼5% at 870 nm.
As stated in the introduction, works addressing the spectral radiative effects of atmospheric aerosols are scarce in the literature. Nonetheless, our findings can be compared with those reported, for example, by Meywerk and Ramanathan [52] for polluted aerosols over the tropical Indian Ocean during INDOEX. They estimated a spectral Δ F E f f with a maximum of −1.2 Wm 2 nm 1 AOD 1 (considering AOD at 500 nm) at ∼460 nm and with asymptotically decreasing values for longer and shorter wavelengths. In addition, similar results were found by Bergstrom et al. [89] during the campaign SAFARI 2000 (Southern African Regional Science Initiative). In this context, and in order to estimate the impact of the different aerosols on the solar fluxes and provide a better comparison with previous works, the integrated shortwave global and direct Δ F and Δ F E f f from the solar radiation measurements taken in the framework of the BSRN at the IZO were computed and are included in Appendix B, where the Δ F and Δ F E f f estimates from the integrated EKO DNI observations can also be seen.

4.4. Heating Rate

In this section, we discuss the effect of the aerosol vertical profile on the radiative forcing, the so-called heating rate (HR), for the three case studies. To do so, we used Equation (3) and the aerosol extinction profiles at 532 nm extracted from the MPL at the SCO, together with the meteorological radiosondes from the G u ¨ imar station, and followed the methodology applied in Cochrane et al. [69] and Barreto et al. [46].
The aerosol HR spectra at 2.4 km a.s.l. (altitude of the IZO) for the three case studies are shown in Figure 10a. Similar to those documented for the Δ F E f f (Figure 7), the maximum HR was found at λ < 600 nm. The highest values were found for the dust event, whereas the lowest values were observed for the volcanic aerosols. In the case of the dust, the HR peaked at 330 nm (0.0067 K day 1 nm 1 ), whereas for the volcanic and mixed aerosols (volcanic and dust), the maxima were reached at 403 nm (0.0047 and 0.0034 K day 1 nm 1 , respectively). This corroborates that the dust particles produced a further cooling effect at the surface compared to the volcanic aerosols by increasing the atmospheric heating rate in the lower troposphere. Beyond 600 nm, the HR was similar for the three cases throughout the spectral range. Our results are comparable with those found by Cochrane et al. [69].
The comparison of the simulated HR for the three case studies, integrated between 300 and 1100 nm, is shown in Figure 10c. As expected, the HR vertical profiles reproduced the aerosol vertical distribution. The maximum HR obtained was associated with the dust aerosols with a value of 12.2 Kday 1 within the maritime boundary layer. For the mixture of volcanic and dust aerosols, the maximum HR was 6.3 Kday 1 obtained at ∼2 km a.s.l, whereas for the volcanic aerosols, the strongest HR, 6.8 Kday 1 , occurred in the middle troposphere at ∼4 km a.s.l., coinciding with the peak of aerosol extinction (Figure 10b). As reported by Felpeto et al. [5], the characteristic injection height of the La Palma volcano was ∼3.5 km a.s.l., although sporadic volcanic columns reached 8.5 km a.s.l.

5. Conclusions

Observations and modelling of spectral solar radiation are important for two main reasons: (1) they intrinsically contain the imprints of many relevant climate parameters [24], and (2) virtually all physical and biological systems are spectrally sensitive to solar or terrestrial radiation (e.g., [26,87]), whereby they are affected or respond very differently depending on the wavelength of the radiation received.
By injecting aerosols and gases into the atmosphere, volcanoes significantly affect global climate, force changes in atmospheric dynamics, and influence many distinct cycles such as hydrological, carbon, and biogeochemical cycles. However, the irregular temporal and spatial distributions of volcanic processes and their effects are still poorly characterised. The volcanic eruption on La Palma (Canary Islands, Spain), which occurred in the autumn of 2021, presented an outstanding opportunity to improve the current understanding of these natural phenomena. The special conditions at the IZO and its proximity to La Palma (∼140 km) make it a strategic site for the comprehensive study of the almost unperturbed volcanic plume including the climate effects.
In this context, the present work deals with the experimental estimation of the spectral Δ F and Δ F E f f during the volcanic eruption based on spectral direct radiation measurements performed with an EKO MS-711 grating spectroradiometer during three events characterised by the presence of different types of aerosols: fresh volcanic aerosols, Saharan mineral dust, and a mixture of volcanic and Saharan dust aerosols.
The optical properties of the volcanic aerosols show a marked spectral dependence of the AOD, leading to AE values five times higher than those of the dust aerosols. Intermediate AE values were found in the mixture of volcanic and dust aerosols. With regard to the micro-physical properties of the volcanic aerosols, the volume size distribution was a bi-modal distribution with a dominant contribution of fine-mode aerosols (R e f f ranging from 0.13 to 0.24 μ m), whereas the dust and mixed aerosols (volcanic and dust) presented bi-modal log-normal distributions with clear a dominance of coarse-mode aerosols centred at 1.55 μ m and 1.49 μ m, respectively.
When focusing on the Δ F E f f (Figure 8), the volcanic aerosols were the least efficient aerosol of the three cases for an SZA between 30 and 40 . The Δ F E f f peaked at around 440–460 nm. The spectral Δ F E f f values at 440 nm ranged between −1.9 and −2.6 Wm 2 nm 1 AOD 1 for the mineral dust and mixed volcanic and dust particles and between −1.6 and −3.3 Wm 2 nm 1 AOD 1 for the volcanic aerosols, considering solar zenith angles between 30 and 70 , respectively.
On the other hand, for λ > 600 nm, no significant spectral differences were found between the three types of aerosols, and the strong gas absorption bands present in this spectral range accounted for the spectral signatures observed in the Δ F and Δ F E f f .
The aerosol heating-rate (HR) estimates integrated between 300 and 1100 nm corroborated that the dust particles produced a further cooling effect at the surface compared to the volcanic aerosols by increasing the atmospheric heating in the lower troposphere. The maximum HR obtained for the mineral dust was 12.2 Kday 1 , whereas for the volcanic aerosols and mixed aerosols (volcanic and dust) within the maritime boundary layer, the HR values were half that at 6.8 Kday 1 (at 4 km a.s.l.) and 6.3 Kday 1 (at 2 km a.s.l.), respectively.

Author Contributions

R.D.G., Á.B., E.C.-A. and O.E.G. designed the structure and methodology of the paper. R.D.G. computed all the calculations performed in the paper. R.D.G., Á.B., O.E.G. and F.A. discussed the aerosol optical properties. R.D.G., O.E.G. and V.E.C. discussed the radiative forcing studied in the work. C.M. determined the background trajectory. R.R. performed the maintenance and daily checks on the EKO MS-711 spectroradiometer and BSRN instruments. M.P. provided detailed technical information on the EKO MS-711 spectroradiometer. R.D.G., Á.B., E.C.-A., O.E.G., V.E.C., F.A., C.M., R.R. and M.P. discussed the results and participated in the retrieval analysis. All authors discussed the results and contributed to the final paper. All authors have read and agreed to the published version of the manuscript.

Funding

This research received no external funding.

Data Availability Statement

The EKO MS-711 data are available on request from the Izaña WMO-CIMO testbed. The BSRN Izaña radiation measurements are available at https://doi.org/10.1594/PANGAEA.882526 (accessed on 23 December 2022). Data from AERONET used in the present study can be obtained from https://aeronet.gsfc.nasa.gov (accessed on 23 December 2022). The vertical soundings can be downloaded from http://weather.uwyo.edu/upperair/sounding.html (accessed on 23 December 2022). The lidar MPL images used in this study can be downloaded from https://mplnet.gsfc.nasa.gov/ (accessed on 23 December 2022).

Acknowledgments

This work is part of the activities of the World Meteorological Organization (WMO) Commission for Instruments and Methods of Observations (CIMO) Izaña testbed for aerosols and water vapour remote sensing instruments. The authors thank the BSRN for providing quality control tools and maintaining a centralised quality-assured database. We gratefully acknowledge the data provided by the AERONET and MPLNet networks. The AERONET sun photometers at Izaña were calibrated through the AEROSPAIN Central Facility (https://aerospain.aemet.es/, accessed on 23 December 2022). The libRadtran radiative transfer model was used to estimate the radiative forcing. This study is a contribution to the Barcelona Dust Forecast Centre (https://dust.aemet.es/, accessed on 23 December 2022). The authors also acknowledge the support of ACTRIS, Ministerio de Ciencia e Innovación of Spain, through the projects SYNERA: PID2020-118793GA-I00 and RT2018-097864-B-I00, and Junta de Castilla y León grant N . VA227P20.

Conflicts of Interest

The authors declare that they have no conflict of interest.

Abbreviations

The following abbreviations are used in this manuscript:
Δ FRadiative forcing
Δ F e f f Radiative forcing efficiency
IZOIzaña Observatory
TROPOMITropospheric Monitoring Instrument
MERRA-2Modern-Era Retrospective Analysis for Research and Applications version 2
FLEXTRAFlexible Trajectories
HRHeating rate
VEIVolcanic explosivity index
BSRNBaseline Surface Radiation Network
CIMOCommission for Instruments and Methods of Observation
WMOWorld Meteorological Organisation
IARCIzaña Atmospheric Research Center
AEMETState Meteorological Agency of Spain
BAPMoNPollution Monitoring Network
GAWGlobal Atmospheric Watch
NDACCNetwork for the Detection of Atmospheric Composite Change
GAW-PFRPrecision Filter Radiometer Network
AERONETAerosol Robotic Network
MODISModerate Resolution Imaging Spectroradiometer
NASANational Aeronautics and Space Administration
SCOSanta Cruz Observatory
DNIDirect normal irradiance
FWHMFull width at half maximum
AODAerosol optical depth
AEAngström parameter
SDASpectral deconvolution algorithm
MPLNetMicro-Pulse Lidar Network
NRBNormalised Range Backscatter
ECMWFEuropean Centre for Medium-Range Weather Forecast
GEOSGoddard Earth Observing System
GCOSGlobal Climate Observing System
GUANGlobal Upper-Air Network
SZASolar zenith angle
SASurface albedo
DIRDirect radiation
RTERadiative transfer equation
DISORTDiscrete Ordinates Radiative Transfer
REPTRANRepresentative wavelength radiative transfer method
SALSaharan Air Layer
R e f f Effective radius
SSASingle-scattering albedo
Δ DFDiurnally average aerosol radiative forcing

Appendix A

The evolution of the volcanic plume in the first case study (Section 4.1) was described in terms of backward trajectories, the MERRA-2 AOD, TROPOMI S O 2 total columns, and aerosol depolarisation ratio ( δ a e r ) from the MPL at the SCO (Figure 2). However, due to the poor data availability of the δ a e r product for this specific day, the evolution of the δ v o l has been included to track and identify the different layers observed in the case study.
Figure A1. (a) Volume depolarization ratio ( δ v o l ) and (b) aerosol depolarization ratio ( δ a e r ) determined from the MPL at 532 nm at the SCO for 24 September.
Remotesensing 15 00173 g0a1

Appendix B

Since 2009, the IZO has been a part of the BSRN (IZA station n #61), contributing with global shortwave, direct, and diffuse radiation measurements. Shortwave global radiation is performed with a high-precision EKO MS-802F pyranometer with a 285–3000 nm bandwidth. Direct radiation is performed with an EKO MS-56 pyrheliometer with a full operating view angle of 5 and a slope angle of 1 . This pyrheliometer covers wavelengths from 200 to 4000 nm (more details can be found in García et al. [29] and at http://bsrn.aemet.es, accessed on 3 November 2022).
The integrated shortwave global and direct radiative forcing ( Δ DF) at the surface for a time period between t 1 and t 2 was determined by the following equation:
Δ D F = 1 t 2 t 1 t 1 t 2 Δ F ( t ) · d t
The Δ F e f f was calculated using Equation (2), but considering the above definition of Δ DF and the mean AOD for the period between t 1 and t 2 . The averaged aerosol Δ DF and Δ DF e f f for the EKO and BSRN direct and shortwave global radiation measurements for the three case studies are shown in Table A1. Note that for a better comparison with the literature, Table A1 also includes the daily estimates of the Δ DF and Δ DF e f f considering that t 2 t 1 is 24 h in Equation (A1).
Although the integrated direct irradiances showed an important gap between the UV-NIR and the entire solar spectral ranges of about 200 Wm 2 , the averaged Δ DF and Δ DF e f f showed comparable values, especially for the volcanic event ( Δ DF of −134.1 and −135.9 Wm 2 for the EKO and BSRN data, respectively, resulting in a ratio of only ∼1% between the two estimates). This points to the fact that the radiative effect of the volcanic aerosols was mainly concentrated below ∼1000 nm. However, for the dust and mixed aerosols (volcanic and dust), a remarkable difference between the UV-NIR and broadband Δ F and Δ F e f f was found. The broadband BSRN Δ F and Δ F E f f values corroborated that mineral dust particles produced a further cooling effect at the surface compared to the volcanic aerosols injected at similar altitudes into the lower-middle troposphere.
Table A1. Summary of averaged aerosol radiative forcing ( Δ DF, Wm 2 ) and aerosol radiative forcing efficiency ( Δ DF e f f , Wm 2 AOD 1 with AOD at 500 nm) for the EKO direct radiation (300–1100 nm), BSRN direct radiation (200–4000 nm), and BSRN shortwave global radiation (300–2600 nm) at the IZO for the volcanic plume, dust, and volcanic plume + dust between textitt 1 and textitt 2 (volcanic plume: t 1 = 07:43 and t 2 = 14:38 UTC; dust: t 1 = 07:42 and t 2 = 14:32 UTC; and volcanic plume + dust: t 1 = 07:44 and t 1 = 14:53 UTC). In brackets, we indicate the daily values of the Δ DF and Δ DF e f f considering that t 1 t 2 is 24 h in Equation (A1). The median values of the AOD at 500 nm and the AE are also included (the error is the ±SEM).
Volcanic PlumeDustVolcanic Plume + Dust
EKO Direct Δ DF−134.1 (−27.9)−124.4 (−36.3)−135.2 (−28.2)
Δ DF e f f −807.7 (−168.3)−947.8 (−276.4)−884.4 (−184.2)
BSRN Direct Δ DF−135.9 (−28.3)−145.0 (−42.3)−167.5 (−48.8)
Δ DF e f f −761.3 (−158.6)−1231.5 (−359.2)−1095.8 (−319.6)
BSRN Global Δ DF−20.0 (−4.2)−30.4 (−8.9)−34.5 (−10.5)
Δ DF e f f −111.9 (−23.3)−258.1 (−75.3)−225.6 (−65.8)
AOD 500 nm 0.18 ± 0.010.12 ± 0.010.15 ± 0.01
AE 1.69 ± 0.050.33 ± 0.010.81 ± 0.02
The results for the volcanic particles reported in the current study are consistent with previous works focusing on shortwave global radiation. For example, Derimian et al. [80] documented daily values of Δ F e f f at the surface of −93 ± 12 Wm 2 AOD 1 for an ash plume from the Eyjafjallajökull volcanic eruption over Lille (northern France). For Mount Etna (Italy), Sellitto and Briole [15] simulated the Δ F e f f for the volcanic plumes with different optical characterization (mostly dominated by ash, sulfate aerosols, or mixed conditions), estimating daily values of Δ F e f f at the surface between −12 (sulfate-dominated plumes) and −118 (ashy plumes) Wm 2 AOD 1 . In addition, for the Mount Etna eruption of 25–27 October 2013, Sellitto et al. [17] estimated the daily values of Δ F e f f at the surface between −66 and −49 Wm 2 AOD 1 depending on the absorbing properties assumed. Instantaneous Δ F e f f values can be much larger such as those also observed for the Mount Etna volcano (−146 Wm 2 AOD 1 ) associated with a sulfate-dominated plume [18]. The greatest similarity between the daily values found in the volcanic plumes of La Palma and Mount Etna and those observed for the Eyjafjallajökull plume points to the major role of sulfates in our volcanic case study, in agreement with the analysis of its optical and micro-physical properties (see Section 4.2). A summary of Δ F and Δ F e f f values obtained by previous studies during volcanic events is given in Table A2.
Table A2. Summary of diurnally averaged radiative forcing efficiency at the surface obtained by previous studies during volcanic events.
ReferenceVocanPeriod Δ F Δ F eff
(Wm 2 AOD 1 )
Derimian et al. [80]Eyjafjallajökull
(Iceland)
17 April
2010
−93 ± 12
Flanner et al. [90]Eyjafjallajökull
(Iceland)
2010−1.9 (−7.3 to +2.8)
(mWm 2 )
Sellitto et al. [17]Mount Etna
(Sicily, Italy)
25–27 October
2013
−66 to −49
Romano et al. [18]Mount Etna
(Sicily, Italy)
3 December
2015
−10 to −145
This studyLa Palma
(Spain)
24 September
2021
−4.2
(Wm 2 )
−23.3
Regarding Saharan dust aerosols, Li et al. [91] found a diurnal Δ DF e f f of −65 ± 3 Wm 2 AOD 1 for mineral dust events in the tropical Atlantic region for global radiation, Di Sarra et al. [92] estimated the daily average Δ DF e f f of −79 Wm 2 AOD 1 for global radiation on the island of Lampedusa due to desert dust events, and García et al. [54] estimated daily Δ DF e f f values of −59 ± 6 and −495 ± 11 Wm 2 AOD 1 for global and direct radiation, respectively, between 2009 and 2012 at the IZO. Instantaneous dust Δ F e f f values are relatively similar to those reported for volcanic aerosols. For example, Di Biagio et al. [93] found an Δ F e f f of −136 ± 12 Wm 2 AOD 1 for an SZA between 35 and 45 associated with dust events on the island of Lampedusa. For an SZA between 55 and 65 , García et al. [94] reported Δ F e f f averages of −160 Wm 2 AOD 1 , and more recently, Logothetis et al. [85] estimated −131 ± 18 Wm 2 AOD 1 during dust outbreaks affecting the subtropical northern Atlantic region.
It should be highlighted that when analysing and comparing Δ F e f f values among different types of aerosols, the AOD range should be taken into account. The aerosol Δ F is a nonlinear function of the AOD. This nonlinear relationship is caused by the fact that in the first approximation, Δ F is proportional to the aerosol transmittance, which is a nonlinear function of the AOD [86]. Therefore, in a region where the AOD is small, the aerosol Δ F e f f is larger, even when the aerosol optical properties are the same, whereas the increase in the AOD leads to a reduction or moderation of the aerosol Δ F e f f . The latter is mostly due to the increase in the multiple scattering effects and attenuation of transmitted radiation for large AODs [94] and references therein. Consequently, Δ F e f f values will be slightly different in the case of a different range of AOD variability, even when aerosol properties are the same.

References

  1. Comité Científico (CC) PEVOLCA. Informe del Comité Científico del PEVOLCA (25/11/2021). Technical Report, PEVOLCA, 2021. Available online: https://info.igme.es/eventos/Erupcion-volcanica-la-palma/pevolca (accessed on 23 December 2022).
  2. Lopez, C.; Blanco, M.J.; Team, I. Instituto Geográfico Nacional Volcano Monitoring of the 2021 La Palma Eruption (Canary Islands, Spain). Technical Report, EGU General Assembly 2022, Vienna, Austria, 23–27 May 2022, EGU22-11549, 2022. Available online: https://doi.org/10.5194/egusphere-egu22-11549 (accessed on 23 December 2022).
  3. Bedoya-Velásquez, A.E.; Hoyos-Restrepo, M.; Barreto, A.; García, R.D.; Romero-Campos, P.M.; García, O.; Ramos, R.; Roininen, R.; Toledano, C.; Sicard, M.; et al. Estimation of the Mass Concentration of Volcanic Ash Using Ceilometers: Study of Fresh and Transported Plumes from La Palma Volcano. Remote Sens. 2022, 14, 5680. [Google Scholar] [CrossRef]
  4. Milford, C.; Torres, C.; Vilches, J.; Gossmanc, A.; Weisc, F.; Suárez-Molina, D.; García, O.E.; Prats, N.; Barreto, A.; García, R.D.; et al. Impact of the 2021 La Palma volcanic eruption on air quality: Insights from a multidisciplinary approach. Submitt. Sci. Total Environ. 2022. [Google Scholar]
  5. Felpeto, A.; Molina-Arias, A.J.; Quirós, F.; Pereda, J.; Díaz-Suárez, E.A. Measuring the height of the eruptive column during the 2021 eruption of Cumbre Vieja (La Palma Island, Canary Islands). In Proceedings of the EGU General Assembly 2022, Vienna, Austria, 23–27 May 2022. [Google Scholar] [CrossRef]
  6. Sicard, M.; Córdoba-Jabonero, C.; Barreto, A.; Welton, E.J.; Gil-Díaz, C.; Carvajal-Pérez, C.V.; Comerón, A.; García, O.; García, R.; López-Cayuela, M.-Á.; et al. Volcanic Eruption of Cumbre Vieja, La Palma, Spain: A First Insight to the Particulate Matter Injected in the Troposphere. Remote Sens. 2022, 14, 2470. [Google Scholar] [CrossRef]
  7. Copernicus Tracks Ongoing Emissions from La Palma Volcano across Europe and the Caribbean. Technical Report, Copernicus Atmosphere Monitoring Service (CAMS), 2021. Available online: https://atmosphere.copernicus.eu/copernicus-tracks-ongoing-emissions-la-palma-volcano-across-europe-and-caribbean (accessed on 23 December 2022).
  8. Weiser, F.; Baumann, E.; Jentsch, A.; Medina, F.M.; Lu, M.; Nogales, M.; Beierkuhnlein, C. Impact of Volcanic Sulfur Emissions on the Pine Forest of La Palma, Spain. Forests 2022, 13, 299. [Google Scholar] [CrossRef]
  9. Arias, P.; Bellouin, N.; Coppola, E.; Jones, R.; Krinner, G.; Marotzke, J.; Naik, V.; Palmer, M.; Plattner, G.K.; Rogelj, J.; et al. Climate Change 2021: The Physical Science Basis. Contribution of Working Group14 I to the Sixth Assessment Report of the Intergovernmental Panel on Climate Change; Technical Summary. The Intergovernmental Panel on Climate Change AR6. In Climate Change 2021: The Physical Science Basis. Contribution of Working Group I to the Sixth Assessment Report of the Intergovernmental Panel on Climate Change; Masson-Delmotte, V., Zhai, P., Pirani, A., Connors, S., Péan, C., Berger, S., Caud, N., Chen, Y., Goldfarb, L., Gomis, M., et al., Eds.; Cambridge University Press: Cambridge, UK; New York, NY, USA, 2021. [Google Scholar]
  10. Robock, A. Volcanic eruptions and climate. Rev. Geophys. 2000, 38, 191–219. [Google Scholar] [CrossRef]
  11. Solomon, S.; Daniel, J.S.; Neely, R.R.; Vernier, J.P.; Dutton, E.G.; Thomason, L.W. The Persistently Variable “Background” Stratospheric Aerosol Layer and Global Climate Change. Science 2011, 333, 866–870. [Google Scholar] [CrossRef] [Green Version]
  12. Monerie, P.A.; Moine, M.P.; Terray, L.; Valcke, S. Quantifying the impact of early 21st century volcanic eruptions on global-mean surface temperature. Environ. Res. Lett. 2017, 12, 054010. [Google Scholar] [CrossRef] [Green Version]
  13. Schmidt, A.; Mills, M.J.; Ghan, S.; Gregory, J.M.; Allan, R.P.; Andrews, T.; Bardeen, C.G.; Conley, A.; Forster, P.M.; Gettelman, A.; et al. Volcanic Radiative Forcing From 1979 to 2015. J. Geophys. Res. Atmos. 2018, 123, 12491–12508. [Google Scholar] [CrossRef]
  14. Arfeuille, F.; Weisenstein, D.; Mack, H.; Rozanov, E.; Peter, T.; Brönnimann, S. Volcanic forcing for climate modeling: A new microphysics-based data set covering years 1600–present. Clim. Past 2014, 10, 359–375. [Google Scholar] [CrossRef] [Green Version]
  15. Sellitto, P.; Briole, P. On the radiative forcing of volcanic plumes: Modelling the impact of Mount Etna in the Mediterranean. Ann. Geophys. 2015, 58. [Google Scholar] [CrossRef]
  16. Aubry, T.J.; Jellinek, A.M.; Degruyter, W.; Bonadonna, C.; Radić, V.; Clyne, M.; Quainoo, A. Impact of global warming on the rise of volcanic plumes and implications for future volcanic aerosol forcing. J. Geophys. Res. Atmos. 2016, 121, 13326–13351. [Google Scholar] [CrossRef] [Green Version]
  17. Sellitto, P.; di Sarra, A.; Corradini, S.; Boichu, M.; Herbin, H.; Dubuisson, P.; Sèze, G.; Meloni, D.; Monteleone, F.; Merucci, L.; et al. Synergistic use of Lagrangian dispersion and radiative transfer modelling with satellite and surface remote sensing measurements for the investigation of volcanic plumes: The Mount Etna eruption of 25–27 October 2013. Atmos. Chem. Phys. 2016, 16, 6841–6861. [Google Scholar] [CrossRef] [Green Version]
  18. Romano, S.; Burlizzi, P.; Kinne, S.; de Tomasi, F.; Hamann, U.; Perrone, M. Radiative impact of Etna volcanic aerosols over south eastern Italy on 3 December 2015. Atmos. Environ. 2018, 182, 155–170. [Google Scholar] [CrossRef]
  19. Yang, W.; Vecchi, G.A.; Fueglistaler, S.; Horowitz, L.W.; Luet, D.J.; Muñoz, Á.G.; Paynter, D.; Underwood, S. Climate Impacts From Large Volcanic Eruptions in a High-Resolution Climate Model: The Importance of Forcing Structure. Geophys. Res. Lett. 2019, 46, 7690–7699. [Google Scholar] [CrossRef]
  20. Sellitto, P.; Salerno, G.; la Spina, A.; Caltabiano, T.; Scollo, S.; Boselli, A.; Leto, G.; Zanmar Sanchez, R.; Crumeyrolle, S.; Hanoune, B.; et al. Small-scale volcanic aerosols variability, processes and direct radiative impact at Mount Etna during the EPL-RADIO campaigns. Sci. Rep. 2020, 10, 15224. [Google Scholar] [CrossRef]
  21. Fyfe, J.C.; Kharin, V.V.; Santer, B.D.; Cole, J.N.S.; Gillett, N.P. Significant impact of forcing uncertainty in a large ensemble of climate model simulations. Proc. Natl. Acad. Sci. USA 2021, 118, e2016549118. [Google Scholar] [CrossRef]
  22. Santer, B.D.; Bonfils, C.; Painter, J.F.; Zelinka, M.D.; Mears, C.; Solomon, S.; Schmidt, G.A.; Fyfe, J.C.; Cole, J.N.; Nazarenko, L.; et al. Volcanic contribution to decadal changes in tropospheric temperature. Nat. Geosci. 2014, 7, 185–189. [Google Scholar] [CrossRef] [Green Version]
  23. Stenchikov, G. Chapter 29—The role of volcanic activity in climate and global changes. In Climate Change, 3rd ed.; Letcher, T.M., Ed.; Elsevier: Amsterdam, The Netherlands, 2021; pp. 607–643. [Google Scholar] [CrossRef]
  24. Brindley, H.; Bantges, R. The spectral signature of recent climate change. Curr. Clim. Change Rep. 2016, 2, 112–126. [Google Scholar] [CrossRef] [Green Version]
  25. Kaskaoutis, D.; Kambezidis, H.; Toth, Z. Investigation about the dependence of spectral diffuse-to-direct-beam irradiance ratio on atmospheric turbidity and solar zenith angle. Theor. Appl. Climatol. 2007, 89, 245–256. [Google Scholar] [CrossRef]
  26. Dirnberger, D.; Blackburn, G.; Müller, B.; Reise, C. On the impact of solar spectral irradiance on the yield of different PV technologies. Sol. Energy Mater. Sol. Cells 2015, 132, 431–442. [Google Scholar] [CrossRef]
  27. Mishra, M.K.; Rajeev, K. Spectral dependence of aerosol radiative forcing at surface over a tropical coastal station. In Proceedings of the Multispectral, Hyperspectral, and Ultraspectral Remote Sensing Technology, Techniques and Applications VI, New Delhi, India, 4–7 April 2016; SPIE: Bellingham, WA, USA, 2016; Volume 9880, pp. 48–54. [Google Scholar] [CrossRef]
  28. Driemel, A.; Augustine, J.; Behrens, K.; Colle, S.; Cox, C.; Cuevas-Agulló, E.; Denn, F.M.; Duprat, T.; Fukuda, M.; Grobe, H.; et al. Baseline Surface Radiation Network (BSRN): Structure and data description (1992–2017). Earth Syst. Sci. Data 2018, 10, 1491–1501. [Google Scholar] [CrossRef] [Green Version]
  29. García, R.D.; Cuevas, E.; Ramos, R.; Cachorro, V.E.; Redondas, A.; Moreno-Ruiz, J.A. Description of the Baseline Surface Radiation Network (BSRN) station at the Izaña Observatory (2009–2017): Measurements and quality control/assurance procedures. Geosci. Instrum. Methods Data Syst. 2019, 8, 77–96. [Google Scholar] [CrossRef] [Green Version]
  30. Cuevas, E.; Milford, C.; Bustos, J.J.; García, O.E.; García, R.D.; Gómez-Peláez, A.J.; Guirado-Fuentes, C.; Marrero, C.; Prats, N.; Ramos, R.; et al. Izaña Atmospheric Research Center Activity Report 2017–2018. Technical Report WMO/GAW No. 247, World Meteorological Organization & Izaña Atmospheric Resear Center (AEMET), 2019. Available online: https://izana.aemet.es/wp-content/docs/Izana_Report_2017_2018.pdf (accessed on 23 December 2022).
  31. Commission for Instruments and Methods of Observation. Sixteenth Session. Technical Report WMO No. 1138, World Meteorological Organization, 2014. Available online: https://library.wmo.int/doc_num.php?explnum_id=5576 (accessed on 23 December 2022).
  32. Cuevas, E.; González, Y.; Rodríguez, S.; Guerra, J.C.; Gómez-Peláez, A.J.; Alonso-Pérez, S.; Bustos, J.; Milford, C. Assessment of atmospheric processes driving ozone variations in the subtropical North Atlantic free troposphere. Atmos. Chem. Phys. 2013, 13, 1973–1998. [Google Scholar] [CrossRef] [Green Version]
  33. García, R.D.; Cuevas, E.; Barreto, Á.; Cachorro, V.E.; Pó, M.; Ramos, R.; Hoogendijk, K. Aerosol retrievals from the EKO MS-711 spectral direct irradiance measurements and corrections of the circumsolar radiation. Atmos. Meas. Tech. 2020, 13, 2601–2621. [Google Scholar] [CrossRef]
  34. García, R.; Cuevas, E.; Cachorro, V.; García, O.; Barreto, A.; Almansa, A.F.; Romero-Campos, P.; Ramos, R.; Pó, M.; Hoogendijk, K.; et al. Water Vapor Retrievals from Spectral Direct Irradiance Measured with an EKO MS-711 Spectroradiometer—Intercomparison with Other Techniques. Remote Sens. 2021, 13, 350. [Google Scholar] [CrossRef]
  35. Holben, B.; Eck, T.; Slutsker, I.; Tanré, D.; Buis, J.; Setzer, A.; Vermote, E.; Reagan, J.; Kaufman, Y.; Nakajima, T.; et al. AERONET—A Federated Instrument Network and Data Archive for Aerosol Characterization. Remote Sens. Environ. 1998, 66, 1–16. [Google Scholar] [CrossRef]
  36. Barreto, A.; Cuevas, E.; Granados-Muñoz, M.J.; Alados-Arboledas, L.; Romero, P.M.; Gröbner, J.; Kouremeti, N.; Almansa, A.F.; Stone, T.; Toledano, C.; et al. The new sun-sky-lunar Cimel CE318-T multiband photometer—A comprehensive performance evaluation. Atmos. Meas. Tech. 2016, 9, 631–654. [Google Scholar] [CrossRef] [Green Version]
  37. Torres, B.; Toledano, C.; Berjón, A.; Fuertes, D.; Molina, V.; Gonzalez, R.; Canini, M.; Cachorro, V.E.; Goloub, P.; Podvin, T.; et al. Measurements on pointing error and field of view of Cimel-318 Sun photometers in the scope of AERONET. Atmos. Meas. Tech. 2013, 6, 2207–2220. [Google Scholar] [CrossRef]
  38. Toledano, C.; González, R.; Fuertes, D.; Cuevas, E.; Eck, T.F.; Kazadzis, S.; Kouremeti, N.; Gröbner, J.; Goloub, P.; Blarel, L.; et al. Assessment of Sun photometer Langley calibration at the high-elevation sites Mauna Loa and Izaña. Atmos. Chem. Phys. 2018, 18, 14555–14567. [Google Scholar] [CrossRef] [Green Version]
  39. O’Neill, N.T.; Eck, T.F.; Smirnov, A.; Holben, B.N.; Thulasiraman, S. Spectral discrimination of coarse and fine mode optical depth. J. Geophys. Res. Atmos. 2003, 108, 4559. [Google Scholar] [CrossRef]
  40. Dubovik, O.; King, M.D. A flexible inversion algorithm for retrieval of aerosol optical properties from Sun and sky radiance measurements. J. Geophys. Res. Atmos. 2000, 105, 20673–20696. [Google Scholar] [CrossRef] [Green Version]
  41. Dubovik, O.; Sinyuk, A.; Lapyonok, T.; Holben, B.N.; Mishchenko, M.; Yang, P.; Eck, T.F.; Volten, H.; Muñoz, O.; Veihelmann, B.; et al. Application of spheroid models to account for aerosol particle nonsphericity in Remote Sensing of desert dust. J. Geophys. Res. Atmos. 2006, 111. [Google Scholar] [CrossRef] [Green Version]
  42. Sinyuk, A.; Holben, B.N.; Eck, T.F.; Giles, D.M.; Slutsker, I.; Korkin, S.; Schafer, J.S.; Smirnov, A.; Sorokin, M.; Lyapustin, A. The AERONET Version 3 aerosol retrieval algorithm, associated uncertainties and comparisons to Version 2. Atmos. Meas. Tech. 2020, 13, 3375–3411. [Google Scholar] [CrossRef]
  43. Campbell, J.R.; Hlavka, D.L.; Welton, E.J.; Flynn, C.J.; Turner, D.D.; Spinhirne, J.D.; Scott, V.S.; Hwang, I.H. Full-Time, Eye-Safe Cloud and Aerosol Lidar Observation at Atmospheric Radiation Measurement Program Sites: Instruments and Data Processing. J. Atmos. Ocean. Tech. 2002, 19, 431–442. [Google Scholar] [CrossRef]
  44. Flynn, C.; Mendoza, A.; Zheng, Y.; Mathur, S. Novel polarization-sensitive micropulse lidar measurement technique. Opt. Express 2007, 15, 2785–2790. [Google Scholar] [CrossRef]
  45. Welton, E.J.; Campbell, J.R.; Berkoff, T.A.; Valencia, S.; Spinhime, J.D.; Holben, B.; Tsay, S.C. The NASA Micro-Pulse Lidar NETWORK (MPLNET): Co-location of lidars with aeronet sunphotometers and related earth science applications. In Proceedings of the 85th AMS Annual Meeting, San Diego, CA, USA, 9–13 January 2005; American Meteorological Society: San Diego, CA, USA, 2005; pp. 5165–5169. [Google Scholar]
  46. Barreto, A.; Cuevas, E.; García, R.D.; Carrillo, J.; Prospero, J.M.; Ilić, L.; Basart, S.; Berjón, A.J.; Marrero, C.L.; Hernández, Y.; et al. Long-term characterisation of the vertical structure of the Saharan Air Layer over the Canary Islands using lidar and radiosonde profiles: Implications for radiative and cloud processes over the subtropical Atlantic Ocean. Atmos. Chem. Phys. 2022, 22, 739–763. [Google Scholar] [CrossRef]
  47. Stohl, A.; Wotawa, G.; Seibert, P.; Kromp-Kolb, H. Interpolation Errors in Wind Fields as a Function of Spatial and Temporal Resolution and Their Impact on Different Types of Kinematic Trajectories. J. Appl. Meteorol. Climatol. 1995, 34, 2149–2165. [Google Scholar] [CrossRef]
  48. Stohl, A.; Seibert, P. Accuracy of trajectories as determined from the conservation of meteorological tracers. Q. J. R. Meteorol. Soc. 1998, 124, 1465–1484. [Google Scholar] [CrossRef]
  49. Hersbach, H.; Bell, B.; Berrisford, P.; Hirahara, S.; Horányi, A.; Muñoz-Sabater, J.; Nicolas, J.; Peubey, C.; Radu, R.; Schepers, D.; et al. The ERA5 global reanalysis. Q. J. R. Meteorol. Soc. 2020, 146, 1999–2049. [Google Scholar] [CrossRef]
  50. Gelaro, R.; McCarty, W.; Suárez, M.J.; Todling, R.; Molod, A.; Takacs, L.; Randles, C.A.; Darmenov, A.; Bosilovich, M.G.; Reichle, R.; et al. The modern-era retrospective analysis for research and applications, version 2 (MERRA-2). J. Clim. 2017, 30, 5419–5454. [Google Scholar] [CrossRef]
  51. Theys, N.; de Smedt, I.; Yu, H.; Danckaert, T.; van Gent, J.; Hörmann, C.; Wagner, T.; Hedelt, P.; Bauer, H.; Romahn, F.; et al. Sulfur dioxide retrievals from TROPOMI onboard Sentinel-5 Precursor: Algorithm theoretical basis. Atmos. Meas. Tech. 2017, 10, 119–153. [Google Scholar] [CrossRef] [Green Version]
  52. Meywerk, J.; Ramanathan, V. Observations of the spectral clear-sky aerosol forcing over the tropical Indian Ocean. J. Geophys. Res. Atmos. 1999, 104, 24359–24370. [Google Scholar] [CrossRef]
  53. Bush, B.C.; Valero, F.P.J. Surface aerosol radiative forcing at Gosan during the ACE-Asia campaign. J. Geophys. Res. Atmos. 2003, 108D23, 8660. [Google Scholar] [CrossRef]
  54. García, R.D.; García, O.E.; Cuevas, E.; Cachorro, V.E.; Romero-Campos, P.M.; Ramos, R.; de Frutos, A.M. Solar radiation measurements compared to simulations at the BSRN Izaña station. Mineral dust radiative forcing and efficiency study. J. Geophys. Res. Atmos. 2014, 119, 179–194. [Google Scholar] [CrossRef]
  55. Mayer, B.; Kylling, A. Technical note: The libRadtran software package for radiative transfer calculations—Description and examples of use. Atmos. Chem. Phys. 2005, 5, 1855–1877. [Google Scholar] [CrossRef] [Green Version]
  56. Emde, C.; Buras-Schnell, R.; Kylling, A.; Mayer, B.; Gasteiger, J.; Hamann, U.; Kylling, J.; Richter, B.; Pause, C.; Dowling, T.; et al. The libRadtran software package for radiative transfer calculations (version 2.0.1). Geosci. Model Dev. 2016, 9, 1647–1672. [Google Scholar] [CrossRef] [Green Version]
  57. Stamnes, K.; Tsay, S.C.; Wiscombe, W.; Jayaweera, K. Numerically stable algorithm for discrete-ordinate-method radiative transfer in multiple scattering and emitting layered media. Appl. Opt. 1988, 27, 2502–2509. [Google Scholar] [CrossRef]
  58. Gasteiger, J.; Emde, C.; Mayer, B.; Buras, R.; Buehler, S.; Lemke, O. Representative wavelengths absorption parameterization applied to satellite channels and spectral bands. J. Quant. Spectrosc. Radiat. Transf. 2014, 148, 99–115. [Google Scholar] [CrossRef]
  59. Dahlback, A.; Stamnes, K. A new spherical model for computing the radiation field available for photolysis and heating at twilight. Planet. Space Sci. 1991, 39, 671–683. [Google Scholar] [CrossRef]
  60. Rodriguez-Franco, J.J.; Cuevas, E. Characteristics of the subtropical tropopause region based on long-term highly resolved sonde records over Tenerife. J. Geophys. Res. Atmos. 2013, 118, 10–754. [Google Scholar] [CrossRef] [Green Version]
  61. Carrillo, J.; Guerra, J.; Cuevas, E.; Barrancos, J. Characterization of the marine boundary layer and the trade-wind inversion over the sub-tropical North Atlantic. Bound. Layer Meteorol. 2016, 158, 311–330. [Google Scholar] [CrossRef]
  62. Stamnes, K.; Tsay, S.C.; Wiscombe, W.; Laszlo, I. DISORT, a General-Purpose Fortran Program for Discrete-Ordinate-Method Radiative Transfer in Scattering and Emitting Layered Media: Documentation of Methodology; Technical Report; Stevens Institute of Technology: Hoboken, NJ, USA, 2000. [Google Scholar]
  63. Gueymard, C.A. The sun’s total and spectral irradiance for solar energy applications and solar radiation models. Sol. Energy 2004, 76, 423–453. [Google Scholar] [CrossRef]
  64. Bass, A.; Paur, R. The ultraviolet cross-sections of ozone: I. The measurements. In Atmospheric Ozone; Springer: Berlin/Heidelberg, Germany, 1985; pp. 606–610. [Google Scholar]
  65. León-Luis, S.F.; Redondas, A.; Carreño, V.; López-Solano, J.; Berjón, A.; Hernández-Cruz, B.; Santana-Díaz, D. Internal consistency of the Regional Brewer Calibration Centre for Europe triad during the period 2005–2016. Atmos. Meas. Tech. 2018, 11, 4059–4072. [Google Scholar] [CrossRef] [Green Version]
  66. Boucher, O.; Randall, D.; Artaxo, P.; Bretherton, C.; Feingold, G.; Forster, P.; Kerminen, V.M.; Kondo, Y.; Liao, H.; Lohmann, U.; et al. Clouds and Aerosols. In Climate Change 2013: The Physical Science Basis. Contribution of Working Group I to the Fifth Assessment Report of the Intergovernmental Panel on Climate Change; Stocker, T., Qin, D., Plattner, G.K., Tignor, M., Allen, S., Boschung, J., Nauels, A., Xia, Y., Bex, V., Midgley, P., Eds.; Cambridge University Press: Cambridge, UK; New York, NY, USA, 2013; Section 7; pp. 571–658. [Google Scholar] [CrossRef]
  67. Ramachandran, S.; Rupakheti, M.; Lawrence, M. Aerosol-induced atmospheric heating rate decreases over South and East Asia as a result of changing content and composition. Sci. Rep. 2020, 10, 20091. [Google Scholar] [CrossRef]
  68. Foken, T. Springer Handbook of Atmospheric Measurements; Springer: Berlin/Heidelberg, Germany, 2021. [Google Scholar] [CrossRef]
  69. Cochrane, S.P.; Schmidt, K.S.; Chen, H.; Pilewskie, P.; Kittelman, S.; Redemann, J.; LeBlanc, S.; Pistone, K.; Segal Rozenhaimer, M.; Kacenelenbogen, M.; et al. Biomass burning aerosol heating rates from the ORACLES (ObseRvations of Aerosols above CLouds and their intEractionS) 2016 and 2017 experiments. Atmos. Meas. Tech. 2022, 15, 61–77. [Google Scholar] [CrossRef]
  70. Carlson, T.N.; Benjamin, S.G. Radiative Heating Rates for Saharan Dust. J. Atmos. Sci. 1980, 37, 193–213. [Google Scholar] [CrossRef]
  71. Kim, S.W.; Yoon, S.C.; Jefferson, A.; Won, J.G.; Dutton, E.G.; Ogren, J.A.; Anderson, T.L. Observation of enhanced water vapor in Asian dust layer and its effect on atmospheric radiative heating rates. Geophys. Res. Lett. 2004, 31, L18113. [Google Scholar] [CrossRef] [Green Version]
  72. Gutleben, M.; Groß, S.; Wirth, M.; Emde, C.; Mayer, B. Impacts of Water Vapor on Saharan Air Layer Radiative Heating. Geophys. Res. Lett. 2019, 46, 14854–14862. [Google Scholar] [CrossRef] [Green Version]
  73. Gutleben, M.; Groß, S.; Wirth, M.; Mayer, B. Radiative effects of long-range-transported Saharan air layers as determined from airborne lidar measurements. Atmos. Chem. Phys. 2020, 20, 12313–12327. [Google Scholar] [CrossRef]
  74. García, O.; Cuevas, E.; Rivas, P.; Torres, C.; León-Luis, S.; Taquet, N. Synergy between Surface and Column Measurements at Izaña Global Atmospheric Watch Station: Application to the Volcanic Eruption on La Palma; Technical Report, Information Note ICOS-Spain Nº2; Izaña Atmospheric Research Center: Santa Cruz de Tenerife, Spain, 2022. [Google Scholar]
  75. Ansmann, A.; Tesche, M.; Seifert, P.; Groß, S.; Freudenthaler, V.; Apituley, A.; Wilson, K.M.; Serikov, I.; Linné, H.; Heinold, B.; et al. Ash and fine-mode particle mass profiles from EARLINET-AERONET observations over central Europe after the eruptions of the Eyjafjallajökull volcano in 2010. J. Geophys. Res. Atmos. 2011, 116, D00U02. [Google Scholar] [CrossRef]
  76. Pisani, G.; Boselli, A.; Coltelli, M.; Leto, G.; Pica, G.; Scollo, S.; Spinelli, N.; Wang, X. Lidar depolarization measurement of fresh volcanic ash from Mt. Etna, Italy. Atmos. Environ. 2012, 62, 34–40. [Google Scholar] [CrossRef]
  77. Freudenthaler, V.; Esselborn, M.; Wiegner, M.; Heese, B.; Tesche, M.; Ansmann, A.; Müller, D.; Althausen, D.; Wirth, M.; Fix, A.; et al. Depolarization ratio profiling at several wavelengths in pure Saharan dust during SAMUM 2006. Tellus B Chem. Phys. Meteorol. 2009, 61, 165–179. [Google Scholar] [CrossRef] [Green Version]
  78. Holben, B.N.; Tanré, D.; Smirnov, A.; Eck, T.F.; Slutsker, I.; Abuhassan, N.; Newcomb, W.W.; Schafer, J.S.; Chatenet, B.; Lavenu, F.; et al. An emerging ground-based aerosol climatology: Aerosol optical depth from AERONET. J. Geophys. Res. Atmos. 2001, 106, 12067–12097. [Google Scholar] [CrossRef]
  79. Giles, D.M.; Holben, B.N.; Eck, T.F.; Sinyuk, A.; Smirnov, A.; Slutsker, I.; Dickerson, R.R.; Thompson, A.M.; Schafer, J.S. An analysis of AERONET aerosol absorption properties and classifications representative of aerosol source regions. J. Geophys. Res. Atmos. 2012, 117, D17203. [Google Scholar] [CrossRef] [Green Version]
  80. Derimian, Y.; Dubovik, O.; Tanre, D.; Goloub, P.; Lapyonok, T.; Mortier, A. Optical properties and radiative forcing of the Eyjafjallajökull volcanic ash layer observed over Lille, France, in 2010. J. Geophys. Res. Atmos. 2012, 117, D00U25. [Google Scholar] [CrossRef] [Green Version]
  81. Barreto, A.; García, R.D.; Guirado-Fuentes, C.; Cuevas, E.; Almansa, A.F.; Milford, C.; Toledano, C.; Expósito, F.J.; Díaz, J.P.; León-Luis, S.F. Aerosol characterization in the Subtropical Eastern North Atlantic region derived from long-term AERONET measurements. Atmos. Chem. Phys. Discuss. 2022, 2022, 1–28. [Google Scholar] [CrossRef]
  82. Ångström, A. Techniques of determinig the turbidity of the atmosphere. Tellus 1961, 13, 214–223. [Google Scholar] [CrossRef] [Green Version]
  83. Cuevas, E.; Romero-Campos, P.M.; Kouremeti, N.; Kazadzis, S.; Räisänen, P.; García, R.D.; Barreto, A.; Guirado-Fuentes, C.; Ramos, R.; Toledano, C.; et al. Aerosol optical depth comparison between GAW-PFR and AERONET-Cimel radiometers from long-term (2005–2015) 1 min synchronous measurements. Atmos. Meas. Tech. 2019, 12, 4309–4337. [Google Scholar] [CrossRef]
  84. Takemura, T.; Nakajima, T.; Dubovik, O.; Holben, B.N.; Kinne, S. Single-Scattering Albedo and Radiative Forcing of Various Aerosol Species with a Global Three-Dimensional Model. J. Clim. 2002, 15, 333–352. [Google Scholar] [CrossRef]
  85. Logothetis, S.A.; Salamalikis, V.; Kazantzidis, A. The impact of different aerosol properties and types on direct aerosol radiative forcing and efficiency using AERONET version 3. Atmos. Res. 2021, 250, 105343. [Google Scholar] [CrossRef]
  86. Markowicz, K.; Flatau, P.; Remiszewska, J.; Witek, M.; Reid, E.; Reid, J.; Bucholtz, A.; Holben, B. Observations and Modeling of the Surface Aerosol Radiative Forcing during UAE 2. J. Atmos. Sci. 2008, 65, 2877–2891. [Google Scholar] [CrossRef]
  87. Konatham, S.; Martín-Torres, J.; Zorzano, M.P. The Impact of the Spectral Radiation Environment on the Maximum Absorption Wavelengths of Human Vision and Other Species. Life 2021, 11, 1337. [Google Scholar] [CrossRef]
  88. Boucher, O.; Tanré, D. Estimation of the aerosol perturbation to the Earth’s radiative budget over oceans using POLDER satellite aerosol retrievals. Geophys. Res. Lett. 2000, 27, 1103–1106. [Google Scholar] [CrossRef]
  89. Bergstrom, R.W.; Pilewskie, P.; Schmid, B.; Russell, P.B. Estimates of the spectral aerosol single scattering albedo and aerosol radiative effects during SAFARI 2000. J. Geophys. Res. Atmos. 2003, 108, 8474. [Google Scholar] [CrossRef]
  90. Flanner, M.G.; Gardner, A.S.; Eckhardt, S.; Stohl, A.; Perket, J. Aerosol radiative forcing from the 2010 Eyjafjallajökull volcanic eruptions. J. Geophys. Res. Atmos. 2014, 119, 9481–9491. [Google Scholar] [CrossRef]
  91. Li, F.; Vogelmann, A.M.; Ramanathan, V. Saharan Dust Aerosol Radiative Forcing Measured from Space. J. Clim. 2004, 17, 2558–2571. [Google Scholar] [CrossRef]
  92. Di Sarra, A.; Fuà, D.; Meloni, D. Estimate of surface direct radiative forcing of desert dust from atmospheric modulation of the aerosol optical depth. Atmos. Chem. Phys. 2013, 13, 5647–5654. [Google Scholar] [CrossRef] [Green Version]
  93. Di Biagio, C.; di Sarra, A.; Meloni, D. Large atmospheric shortwave radiative forcing by Mediterranean aerosols derived from simultaneous ground-based and spaceborne observations and dependence on the aerosol type and single scattering albedo. J. Geophys. Res. 2010, 115, D10209. [Google Scholar] [CrossRef] [Green Version]
  94. García, O.E.; Díaz, J.P.; Expósito, F.J.; Díaz, A.M.; Dubovik, O.; Derimian, Y.; Dubuisson, P.; Roger, J.C. Shortwave radiative forcing and efficiency of key aerosol types using AERONET data. Atmos. Chem. Phys. 2012, 12, 5129–5145. [Google Scholar] [CrossRef]
Figure 1. (a) Image captured by the Moderate Resolution Imaging Spectroradiometer (MODIS) sensor onboard the National Aeronautics and Space Administration (NASA)’s Terra satellite (https://worldview.earthdata.nasa.gov, accessed on 12 March 2022) on 24 September 2021, where the locations of the Izaña Observatory (IZO), Santa Cruz Observatory (SCO) and the volcano on La Palma are indicated with red dots. (b) Image of the volcano taken from Izaña Observatory. (c) Image of the volcano on La Palma (LuzLux/AEMET).
Remotesensing 15 00173 g001
Figure 2. (a) Backward trajectories (72 h), ending point at the IZO at 12:00 UTC from FLEXTRA using ERA5 reanalysis at four pressure levels (900 (blue line), 770 (black line), 600 (red line), and 500 (orange line) hPa). (b) Daily average MERRA-2 AOD at 550 nm on 24 September 2021. (c) Satellite SO 2 total columns from Copernicus Sentinel-5P TROPOMI over the Canary Islands on 24 September 2021. (d) Aerosol depolarisation ratio ( δ a e r ) determined from the MPL at 532 nm at the SCO.
Remotesensing 15 00173 g002
Figure 3. Backward minus trajectories (72 h), ending point at the IZO at 12:00 UTC from FLEXTRA using ERA5 reanalysis at four pressure levels (900 (blue line), 770 (black line), 600 (red line), and 500 (orange line) hPa). (b) Daily average MERRA-2 AOD at 550 nm on 2 October 2021. (c) Satellite SO 2 total columns from Copernicus Sentinel-5P TROPOMI over the Canary Islands on 2 October 2021. (d) Aerosol depolarisation ratio ( δ a e r ) determined from the MPL at 532 nm at the SCO.
Remotesensing 15 00173 g003
Figure 4. Backward minus trajectories (72 h), ending point at the IZO at 12:00 UTC from FLEXTRA using ERA5 reanalysis at four pressure levels (900 (blue line), 770 (black line), 600 (red line), and 500 (orange line) hPa). (b) Daily average MERRA-2 AOD at 550 nm on 3 October 2021. (c) Satellite SO 2 total columns from Copernicus Sentinel-5P TROPOMI over the Canary Islands on 3 October 2021. (d) Aerosol depolarisation ratio ( δ a e r ) determined from the MPL at 532 nm at the SCO.
Remotesensing 15 00173 g004
Figure 5. (a) Scatterplots of AE versus AOD 500 nm for the three case studies: volcanic plume (black dots), dust (green dots), and volcanic plume + dust (red dots) at the IZO. The black lines indicate the threshold limits established for the background and dust conditions at the IZO. Right panels display the evolution of the AOD (bd) and AE (eg) for the three case analyses: volcanic plume, dust, and volcanic plume + dust at the IZO. The AOD is shown at AERONET channels of 440 nm (black), 500 nm (red), 675 nm (blue), and 870 nm (green). Grey circles indicate the arrival of a volcanic plume in the event dominated by mineral dust.
Remotesensing 15 00173 g005
Figure 6. (ac) Volume particle size distribution. The colours indicate the times of the measurements. (df) Time series of total-, fine-, coarse-mode AODs at 500 nm and (gi) effective radii ( R e f f ) of total, fine, and coarse modes for the three case studies at the IZO: volcanic plume, dust, and volcanic plume + dust.
Remotesensing 15 00173 g006
Figure 7. Spectral direct normal irradiance (DNI, Wm 2 nm 1 ) (ac), aerosol direct radiative forcing ( Δ F, Wm 2 nm 1 ) (df), and aerosol direct radiative forcing efficiency ( Δ F E f f , Wm 2 nm 1 AOD 1 ) (jl), considering the AOD at each measured wavelength of the EKO (gi), for the UV (300–400 nm), VIS (400–700 nm), and near-IR (700–1100 nm) spectral ranges at an SZA of 30 and for the three case studies at the IZO: volcanic plume (black), dust (green), and volcanic plume + dust (red). The circles in (gi) represent the AOD performed by CIMEL-AERONET.
Remotesensing 15 00173 g007
Figure 8. Δ F E f f (Wm 2 nm 1 AOD 1 ) at 440 nm versus AE as a function of the SZA ( ) for the three case studies at the IZO: volcanic plume, dust, and volcanic plume + dust. The dots represent the Δ F E f f and AE mean values for SZA intervals of 30–40 , 40–50 , 50–60 , and 60–70 . Error bars indicate standard deviations.
Remotesensing 15 00173 g008
Figure 9. Spectral direct normal irradiance (DNI, Wm 2 nm 1 ) (a,d,g,j), aerosol direct radiative forcing ( Δ F, Wm 2 nm 1 ) (b,e,h,k), and aerosol direct radiative forcing efficiency ( Δ F E f f , Wm 2 nm 1 AOD 1 ) (c,f,i,l) at 440, 500, 675, and 870 nm, respectively, as a function of the SZA ( ) for the three case studies at the IZO: volcanic plume (black), dust (green), and volcanic plume + dust (red).
Remotesensing 15 00173 g009
Figure 10. (a) Aerosol heating-rate spectrum (Kday 1 nm 1 ) at 2.4 km a.s.l. (IZO altitude). Vertical profile of (b) aerosol extinction coefficient (km 1 ) extracted from the MPL at 523 nm at the SCO and (c) heating rate (Kday 1 ), integrated between 300 and 1100 nm, for the volcanic plume (black), dust (green), and volcanic plume + dust (red). The dashed line indicates the IZO altitude.
Remotesensing 15 00173 g010
Table 1. Input parameters to the LibRadtran model, their sources, and corresponding references.
InputSourceReferences
RTEDisort2Stamnes et al. [57,62]
Solar fluxGueymardGueymard [63]
O 3 cross-sectionBass and PaurBass and Paur [64]
Absorption parameterisationREPTRANGasteiger et al. [58]
Surface albedoAERONETSinyuk et al. [42]
O 3 total columnBrewer spectrophotometerLeón-Luis et al. [65]
H 2 O total columnAERONETHolben et al. [35]
Number of streams16García et al. [54]
Disclaimer/Publisher’s Note: The statements, opinions and data contained in all publications are solely those of the individual author(s) and contributor(s) and not of MDPI and/or the editor(s). MDPI and/or the editor(s) disclaim responsibility for any injury to people or property resulting from any ideas, methods, instructions or products referred to in the content.

