Abstract
Currently, Building Information Modeling (BIM) is increasingly entering the operational level in terms of creating a model for newly constructed facilities. For existing objects, and objects of Culture Heritage (CH), the creation of coherent and qualitative BIM models depends on the quality of the data constituting the basis for modelling. What’s more, BIM of CH is not only a challenge to obtain high-quality three-dimensional data, but also a time-consuming study of object documentation and photographic documentation in order to create a faithful library of parametric objects. In the article, the authors presented the synergy of spatial data with TLS and UAV as the basis for creating a BIM model for two CH objects. The aim of the article was to make such a synergy of TLS and UAV data that the geospatial database, developed for the needs of modelling historic objects in the HBIM trend, would have a specific amount of information without the frequently used redundancy. In principle, the acquired 3D database should be expressed in a global reference system with the degree of georeferencing accuracy for situational and altitude measurements and should be consistent to provide comprehensive information about the object. The analyses led to conclusions in which the authors assign superior importance to the accuracy of measurement information and the integration of individual data groups in the process of developing the HBIM model with the desired accuracy in opposition to the appropriate selection of the level of detail, which is usually assigned a superior role, which in turn results from the quality of the data geospatial modelling.
1. Introduction
In the era of universal computerisation, preserving cultural heritage (CH) is a measure of economic and intellectual development of nations [1,2]. What is more, The European Commission recommends that by 2030 at least 50% of the most-visited sites and monuments at risk be digitized in 3D [3]. The consequence of widespread computerisation in the field of measurement systems is the popularisation of capturing good quality 3D data. The use of 3D measurement techniques and Building Information Modeling (BIM) offers promising opportunities to faithfully preserve buildings of CH in virtual space. So why not use the synergy of remote sensing data acquisition to create a virtual prototype of a real historical object together with an object database about its past and present state using historical information?
1.1. Building Information Modeling for CH
The last decade of work on IT systems dedicated to BIM has proved that intelligent parametric modelling of building objects is not only a solution for newly constructed buildings, but also for existing ones [4], for which models are most often obtained by modelling from a point cloud. Although BIM for new investments in many countries reaches the operational level (it is more and more often included in building permits) [5], its use for historic buildings is still sporadic and carried out mainly by research and development units [6,7,8].
The creation of Historical BIM (HBIM) is a complex process, mainly due to the amount and scope of acquired 3D data of an object, as well as the time-consuming nature and difficulty of modelling non-standard historical shapes which are more often than not damaged [6,8]. HBIM requires the operator not only to be able to obtain three-dimensional data of the existing facility with a relatively high degree of accuracy LOA (Level of Accuracy), which translates directly into the accuracy of the model, but also to combine various measurement techniques, mainly in the field of scanning and photogrammetry [6,9,10,11,12,13]. The very process of modelling a monument, for which three-dimensional data with high accuracy was obtained, is preceded by the identification of historical details and by examining the existing documentation of the object or literature sources [6,14]. Thanks to them, a library of parametric objects is usually created, to which many researchers [15] assign a superior role in the process of creating a coherent model. The modelling of a monument itself is a meticulous, often manual [7] process of mapping cloud backgrounds with parametric objects [16] with the simultaneous expansion of the database about the object, taking into account, e.g., information on the state of preservation of materials, the scale of damage to the reconstructed elements in the modelling process or architectural documentation [6]. The HBIM process completes the model management stage, thanks to which historic objects should ensure their survival through optimised and sustainable management and maintenance [6,15] in the preventive conservation trend [17].
1.2. Terrestrial Laser Scanning and Unmanned Aerial Vehicle for HBIM
The primary factor in the process of successive development of the HBIM model is the acquisition of reliable three-dimensional data. The accuracy of the replication of the historic object in the model space in the case of modelling a monument proves not only the quality of the geometric base, but is often the basis for the expertise on the degree of damage and degradation. In this context, Murphy et al. [13] propose the use of remote sensing methods for capturing data, enabling the creation of exact digital replicas of the building and its unique, age-related features. In the capturing of the 3D data process, however, one should take into account such technological solutions that will complement each other, not only duplicating the acquired geometry of the object. The described solution may be provided by the synergy of terrestrial and aerial measurement techniques, the potential of which was noticed and announced by Bruno and Roncella [10].
Terrestrial Laser Scanning (TLS) for 3D data of CH has become a common practice mainly due to the increasing availability of scanning technology and results in the form of dense models of cloud objects [18]. The actual mapping of a monument in virtual space, thanks to a point cloud of high resolution and topological accuracy, has become the main tool in archiving architectural details [19], historic buildings [20,21] and their complexities [22,23]. Apart from the archiving of cultural heritage, TLS data allow for examining the technical conditions of monuments [24,25,26] and constitute the basis for their management and popularisation in the global network by creating a virtual reality [27,28]. In HBIM, TLS data are the absolute basis for creating a model, outclassing the less frequently used Personal Laser Scanning (PLS) or Mobile Laser Scanning (MLS) systems [29]. However, 3D data obtained thanks to TLS requires supplements for areas not visible from the ground level and for roof slopes. These gaps successfully complement the data obtained from the Unmanned Aerial Vehicle (UAV), which thanks to the aero solution provide better imaging geometry than, for example, data from digital terrestrial photogrammetry [10]. It is also worth mentioning here the use of TLS or BIM in combination with geophysical methods to create a complete above and below image of the CH [30].
Data integration for the purposes of geomatics and photogrammetry gives enormous possibilities of modelling and three-dimensional visualisation of all kinds of architectural objects and their surroundings. In the case of technical, logistic or time limitations of the equipment used, the aspect of having spatial data from another source turns out to be very valuable. By integrating geospatial data from laser scanning and photogrammetric data, it is possible for precise reconstruction of 3D models of places and objects, area mapping and texturing of their components [31]. The results from different sources can provide the information on which to build a geospatial base in a variety of ways. A laser scanning point cloud is a product obtained during direct field measurements and is usually the basis for the development of bases. Photogrammetric data, in the form of photos and digital images, are subject to prior processing before being transformed into point clouds with given parameters locating the object. The variety of information means that they are often duplicated, jammed, and sometimes the results of measurements from different sources are contradictory to each other. The problem arises when the measurement results representing one object are obtained in different ways. It is therefore important that the resulting geospatial database becomes homogeneous in terms of data type. It should have a certain amount of information to be a reliable and comprehensive data source without redundant information duplicating existing elements. A big problem related to the integration of this type of data is defining and assigning a common frame of reference, which is also a georeference for the examined object. This involves giving an external frame of reference for all types of data, as well as matching internal systems to individual systems and measurement systems. The solution to the problem is to use the transformation matrix of each of the sources to one parametrically defined system or to precede the process by giving a common mutual orientation [32,33]. The limitations of the method, as well as the possibility of using data from different measurements, directly affect the accuracy of synergy and common orientation of different types of data. This has the effect of limiting the precision of determining the location of homological points, which translates into a reduction in the level of correctness of mutual orientation [33]. The TLS point cloud allows you to register and recreate visible (within the scope of the scanner’s operation) details of the terrain and building facades. On the other hand, UAV photos allow you to generate a cloud showing other missing elements and field details (not available for field measurements). By combining these two data sets, we can obtain data enabling comprehensive modelling, reconstruction and 3D visualisation of places and objects [34,35]. In the case of integration of other measurement data, it is necessary to use GCP target points, i.e., points that are clearly identifiable in the field [36]. Most often, they are the basis for linking databases from different sources, ensuring a common frame of reference (integration with the use of a common georeference) [37]. The Integrated survey of TLS and UAV for HBIM has so far been appreciated by, inter alia, Costantino et al. in the case study of San Nicola in Montedoro church [38], Alshawabkeh et al. in the case study of Ain Historical Village [39] or Currà et.al in the case of Villa Palma-Guazzaroni in Terni [40]. In scan-to-BIM studies, mainly for historic buildings, UAVs are increasingly becoming an alternative to TLS technology, because thanks to the combination of nadiral and oblique photographs, it is possible to avoid the grey areas that are characteristic of TLS [41,42].
1.3. Gap in Research on the Application of TLS and UAV for HBIM. Scientific Goal
Scientific work on the integration of ground and aerial data to obtain a coherent geospatial database still shows significant gaps in terms of data homogeneity. Moreover, the gap in research is also a problem of high-quality georeferencing of data from various sources. The aim of the article was to achieve such synergy of TLS and UAV data so that the geospatial database, developed for the needs of modelling historic objects in the HBIM trend, would have a certain amount of information without the frequently used redundancy. Moreover, the target geospatial database would be expressed in an external reference system with the degree of georeferencing accuracy set for situational and altitude measurements. Another important factor was the continuity and consistency of data from various sources and integrated into one geospatial database, constituting comprehensive information about the research facility.
1.4. The Paper Structure
The paper structure consists of five points. After the introduction, explaining the issues of HBIM and the acquisition of cloud data for modelling of CH objects using ground-based and aero techniques, we come to the second part describing the research methodology. In this part, we look at the characteristics of research objects, procedures for obtaining data about objects and post-processing of measurement data. In the third part, we presented the results of TLS and UAV data synergy for HBIM in two case studies for two research facilities. The fourth and fifth parts concern the discussion of results and conclusions.
2. Materials and Methods
2.1. Research Facility
The research facility is a complex of historic sacred buildings located in Kurzelów (Świętokrzyskie Province, Poland) Figure 1a. The buildings consist of the Chapel of St. Anna (Figure 1a,b) and the belfry (Figure 1c,d).
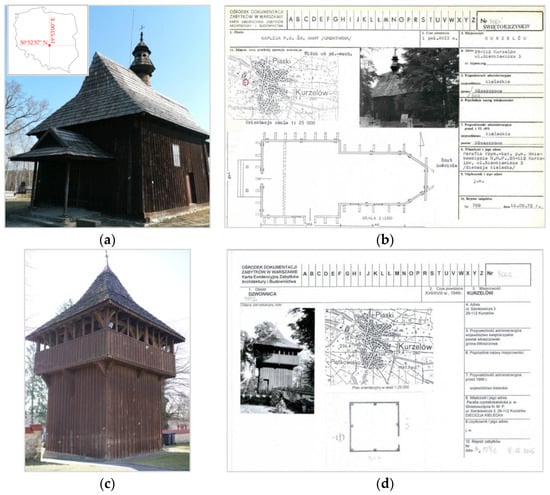
Figure 1.
The complex of historic religious buildings (a) Chapel of St. Anna; (b) A fragment of the—monument card for the chapel [43]; (c) The belfry; (d) A fragment of the monuments card for the belfry [44].
The buildings belong to the Roman Catholic Parish of the Assumption of the Blessed Virgin Mary in Kurzelów (Diocese of Kielce Poland). The Baroque Church of St. Anna was built in the first half of the 17th century, while the belfry was built at the turn of the 17th and 18th centuries [43,44]. The structure of both buildings, as well as their external wall formwork and roof covering, were made of larch wood. From the moment of their creation to the present day, the objects are used and perform their sacred functions. They are subject to ongoing renovation and conservation works, in order to preserve their original condition. After World War II (in the 40–50 s of the 20th century), a general renovation was carried out due to the damage. The objects were entered on the list of monuments by the Monuments Documentation Centre in Warsaw (Poland) and the Historical Monuments of Architecture and Construction Register Cards are kept for them (Figure 1c,d).
Research objects are unique monuments both in terms of their age and degree of preservation. The cultural heritage of the complex of objects required preserving it for future generations through 3D measurement tools and HBIM, as such objects in Central and Eastern Europe usually either did not survive the test of time or were destroyed during World War II. Conducting scientific research for them made it possible to transfer them to the 3D dimension while maintaining features that are usually not preserved for this type of objects. Digitization of the sacral complex is the preservation of this object for future generations.
2.2. Field Work TLS, UAV, GNSS Data Acquisition
The capturing of geospatial data was made with a set of measuring equipment, composed of the following:
- Terrestrial laser scanner: Leica ScanStation P40 (Figure 2a) with a linear measurement range accuracy of ±1.2 mm + 10 ppm and an angular accuracy of 8‘‘ for the horizontal and vertical axis. The scanner parameters translate into the accuracy of determining the 3D position of the measurement point at the level of ±3 mm at a scanning distance of 50 m.
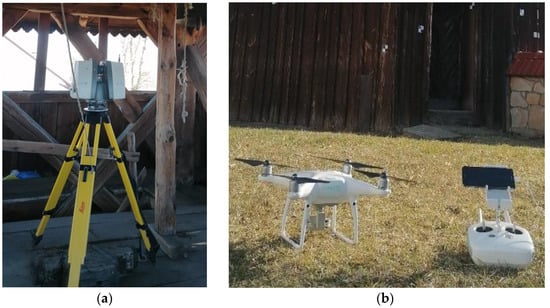 Figure 2. Measuring equipment (a) Leica ScanStation P40; (b) DJI Phantom 4 Pro with mounted digital camera.
 - Unmanned Aerial Vehicle: DJI Phantom 4 Pro (Figure 2b) with a mounted digital camera with a 1-inch 20Mpx CMOS sensor,
- GNSS Receive GNSS RTK Measurement: Trimble R8.
Acquiring TLS data was carried out in such a way that capturing 3D data for the entire interior of the building and its external facades would be possible. The resolution of scanning the object in the measurement was 2 mm/10 m. As a supplementary measurement, a UAV raid was performed in order to obtain digital photos for grey fields from TLS data parts of the external facades of buildings and roofs. As a result, scan data was obtained from 12 positions inside the buildings and seven positions outside the facility for the belfry and 12 positions for the interior of the facilities and nine positions outside the facility for the chapel. As a result of UAV raids, 154 digital images were acquired for the bell tower and 167 for the chapel. During data capture with the UAV, a flight was designed for each object to obtain orthogonal images (for the roof of the objects), for the following parameters: flight altitude 30 m, image overlapping 80% and vertical images (orthogonal images). Then, a series of photos was taken manually (around the object) at a camera angle of 30 degrees and a height of 30 m. These images served as supplementary information.
2.3. Post Processing of Measurement Data
Processing of TLS point clouds was carried out in Leica Cyclone software, while the process of UAV image processing was carried out in Agisoft Metashape Professional software.
In order to give a georeference common to both measurements (TLS and UAV), the values of the (X, Y, H) of Ground Control Points (GCP) coordinates were used, located on the research objects in the form of target plates (Figure 3a,c) and specially prepared reference spheres with a spatial mark on a levelling base (Figure 3b,d). The reference spheres used in the measurement procedure constitute the author’s solution of the article [45]. A GNSS-RTK receiver (Figure 4a) was used to determine the values of the coordinates of the centres of gravity of the reference spheres, the pin of which was each seated in the groove of the sphere (with a known off-set in terms of height relative to the centre of gravity of the sphere (Figure 4b).
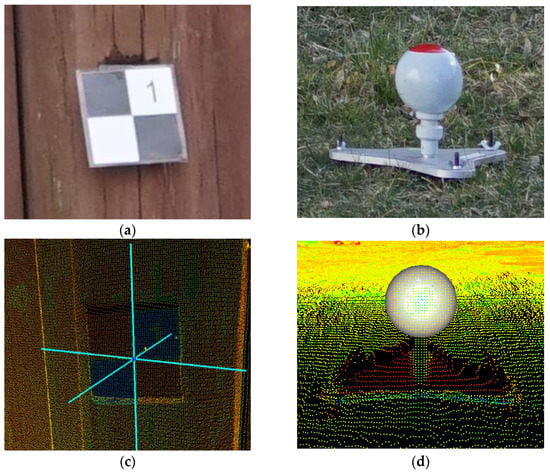
Figure 3.
Georeference Control Points (a) Black and white target plate temporarily attached to the surface of the scanned chapel; (b) Reference ball stabilised in the test area; (c) Black and white target plate in model space; (d) Reference sphere in the model space.
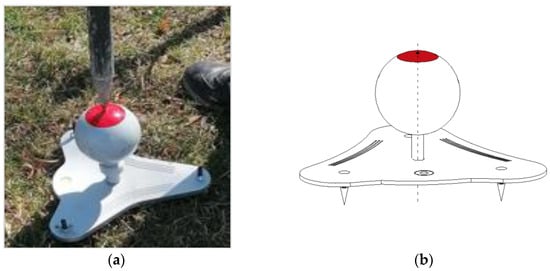
Figure 4.
Author’s reference sphere for TLS and UAV measurements (a) Reference sphere during measurements (b) Construction of the proprietary reference sphere.
3. Results
3.1. Development of Geospatial Databases
Point clouds were respectively acquired as source data from TLS and data derived from digital photos from the UAV deck. As part of generating a point cloud from photos, photogrammetric studies were carried out in Agisoft Metashape Professional software. Photopoints with known coordinate values were used to perform the study and georeference for the research object (Figure 3). The accuracy of the photo-grametric study for the belfry was achieved with the accuracy of generating studies at the level of 0.030 m, measured at photopoints, and the accuracy at the control points (assessment of the accuracy of the study made) at the level of 0.033 m. On the other hand, for the church, the accuracy of the study (measured on the photopoints used from the alignment) was 0.027 m, while the average accuracy measured at the control points was 0.040 m. The elaboration of the TLS measurement results was carried out in the Leica Cyclone software. The obtained point clouds from individual measurement stations were combined into one cloud for the entire facility. Both for the belfry and the church, with the simultaneous joining of all scans together and giving georeference (fitting to the measurement matrix), the accuracy level of the assembly was 0.003 m. However, the most important in these studies is the object, its coherence and the preservation of geometry without inclusion of additional errors, e.g., the accuracy of determining the coordinate values in the adopted reference system. Therefore, in order to ensure the preservation of geometric correctness for the objects, in the first stage of connecting individual measurement stations, photo points and reference spheres were used only as points connecting individual stations. For the first object (the belfry), the level of precision of assembling the point clouds behind it was 0.002 m. Then, the coordinate values of the network points were entered and the transformation (fitting) was performed to the global coordinate system of the point cloud. 0.007 m the level of granting geo-references. In this way, the geometry of the object was preserved and then for the whole (uniform) object the cloud of the network was fitted. A similar procedure was carried out for the church building. The level of precision of assembling a uniform point cloud for the object was 0.002 m. On the other hand, the accuracy level of fitting the object into the global coordinate system was 0.009 m.
The data was integrated into a common geospatial database thanks to the use of common georeferencing, implemented in the global coordinate system PL-2000, zone 7 (EPSG: 2178). Due to the saving and orientation of all cloud points in one common geospatial database, each point has real geospatial coordinates. The results of TLS-UAV data integration were presented as measurement data obtained with the help of TLS and UAV the integration made it possible to compensate for gaps in obtaining data for individual sensors. Data synergy made it possible to generate a uniform, coherent and comprehensive point cloud for research objects (Figure 5).
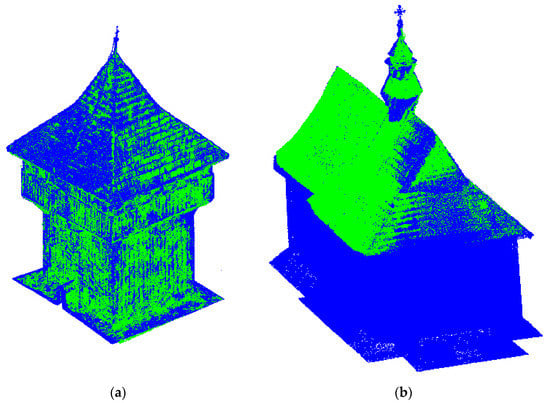
Figure 5.
TLS (blue) and UAV (green) geospatial data integration for: (a) belfry, (b) St. Anna.
3.2. Data Consistency and Continuity Testing after TLS-UAV Integration
In order to assess the consistency of TLS-UAV data, a differential model of cloud data obtained from ground and aerial measurements was developed. From the 3D data, three test fields with dimensions of 1 × 1 m were extracted for each of the objects that represented the spatial position of the three-dimensional data: on the roof of the object, on the wall of the building and on the site (artificial object pavement). Using the C2C algorithm in the Cloud Compare program space, the compatibility analysis of point clouds obtained with TLS and UAV was carried out by generating difference models for them (Figure 6). As a result of differentiating the 3D data, the average distance of the points to the TLS-UAV point clouds was 0.03 cm.
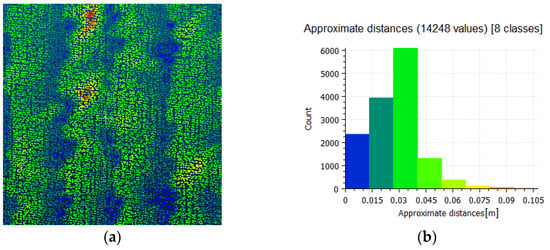
Figure 6.
Data consistency analysis (a) Differential model of the test field located on the wall of the research facility (b) histogram of the distance distribution between the corresponding points on the TLS-UAV cloud planes for the test field.
3.3. Generating a BIM Model (HBIM)
3.3.1. Completed Data Analysis Building BIM Object Databases
Using measurement data (a geospatial database saved in the form of a point cloud after TLS-UAV integration), photographic documentation, and descriptive information contained in monument cards, a database of objects, families and components used in the process of creating a BIM model was prepared. The point cloud provided information on the following: the geometry of the objects, the layout and form of the structure, any damage and deformations occurring on the object and the finishing elements (Figure 7).
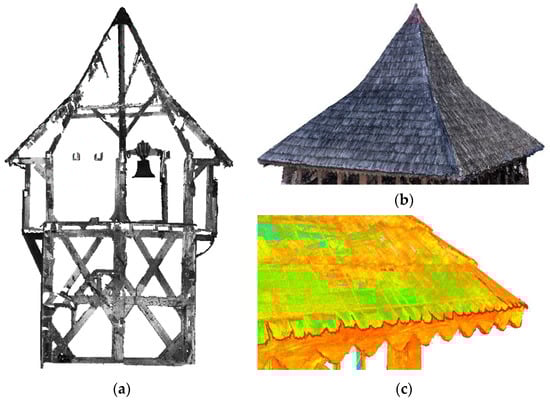
Figure 7.
Identification of objects on a point cloud: construction of building (a), deformations and gaps on the roof (b), finishing, e.g., decorations (c).
Photographic documentation made with the use of ground-based photogrammetry and from the UAV deck facilitated the identification of materials and raw materials used in the construction of the facility and its equipment, as well as the preservation and reconstruction of architectural details and decorations, and the identification of characteristic elements, i.e., cracks and damage (Figure 8).
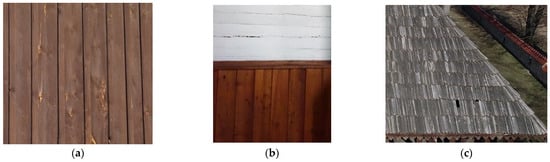
Figure 8.
Identification of objects on photos: (a) formwork material, (b) walls, (c) architectural details roof with a crack.
The descriptive documentation contained in the Monument’s Charter made it possible to determine the features of the object (origin, construction period, any changes, renovations and renovations carried out over the centuries), identification of the materials from which the structure of the object was made (often invisible on the point cloud due to the use of formwork for walls and ceilings), the structural system of the roof truss beams (Figure 9).
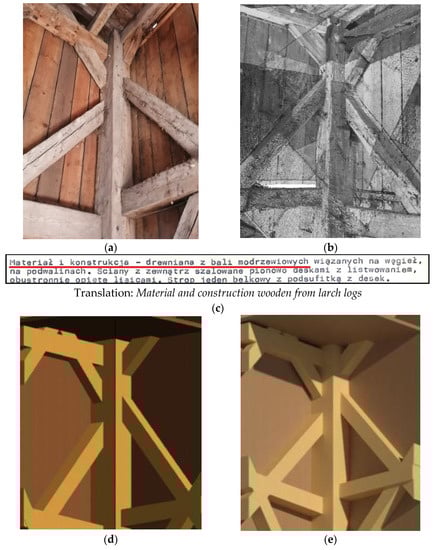
Figure 9.
Generating a BIM model (structure column and beams): (a) real state (photo), (b) Identification of an element on a point cloud, (c) Identification of the construction material (description from the Monument Card), (d) part of the model BIM, (e) visualization of the object (reconstruction).
Creating families of parametric objects for the modelling of the church and chapel has brought satisfactory results only thanks to the synergy of 3D data with photographic and descriptive documentation. The lack of any source of information about objects for the purpose of their modelling would be a direct cause of the decline in the quality of HBIM objects.
3.3.2. Visualisation of the HBIM Model
Object modelling was performed in the Autodesk Revit software. Created families of individual components, families and types of components of the 3D building model object in BIM technology were used. The basis for generating the model of individual buildings were point clouds after the integration of TLS-UAV-GNSS data, as well as relic cards and photographic documentation made in the field. As part of the study, the visualisation and presentation of HBIM historic buildings with the use of rendering tools was performed (Figure 10 and Figure 11).
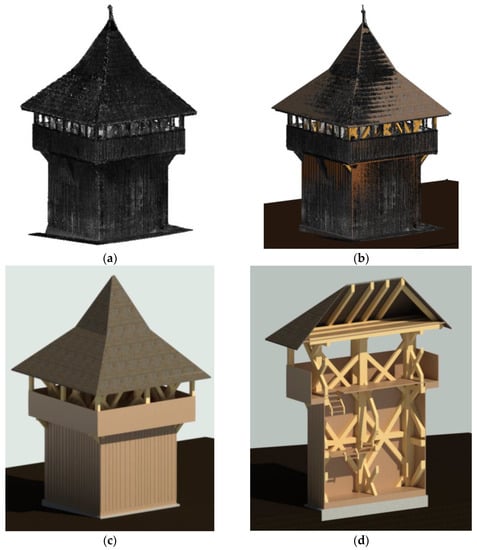
Figure 10.
Work results for the belfry: (a) comprehensive point cloud with TLS-UAV integration; (b) generated model based on a point cloud; (c) visualization of the HBIM model; (d) visualization of the cross-section (interior) of the building.
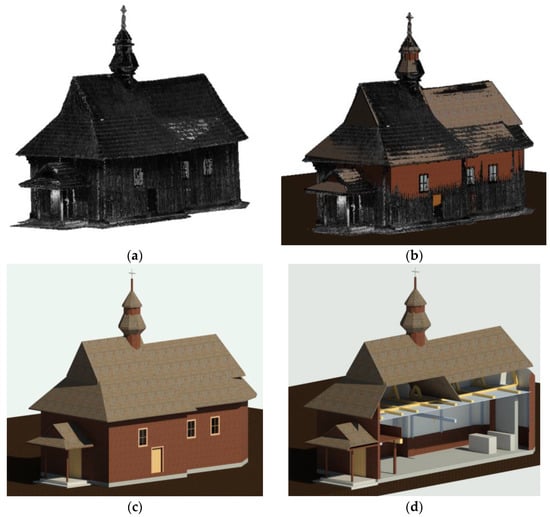
Figure 11.
Work results for the chapel: (a) comprehensive point cloud with TLS-UAV integration; (b) generated model based on a point cloud; (c) visualization of the HBIM model; (d) visualization of the cross-section (interior) of the building.
4. Discussion
High-quality measurement data is the absolute basis for a good-quality HBIM model. Researchers from all over the world agree on this aspect, led by Murphy et al. [13], indicating capturing of 3D data as a starting point, preferably using ground and air techniques [10]. The integration of geospatial data from various sources ensures the complexity of 3D information about the object; however, it requires the use of GCP points as a basis for connecting two data sources and controlling their synergy. This opinion is shared by Klapa et al. [36] or Abdullah et al. [37].
The level of LOD detail in CityGML ((City Geography Markup Language) corresponds to the level to which the 3D model reflects its counterpart in the real world [46]. Therefore, in order to standardise (unify) the quality of the 3D models made, the Open Geospatial Consortium team published the so-called Standard OpenGIS, which describes the principles of defining and presenting five individual levels of detail [47,48]. As part of the BIM technology, levels of detail have also been adopted for five levels of LOD1-LOD5 [49]. All elements of the HBIM model of objects tests were made in the appropriate thickness, height, width and length, taking into account and accentuating the materials from which its individual construction and finishing elements were made. The remaining structural and architectural elements of matching the appropriate elements is consistent with the accuracy of the points cloud points (0.01 m). The model also presents finishing elements and decorations (modelled in a simplified way with modelling accuracy higher than 2–3 cm). The model allows you to carry out measurements in all three dimensions and to make a full inventory of the condition of the existing facility. Each structural element of the building has been presented with the help of a single geometric object or a group of objects, faithfully reflecting their real geometry. Based on the results obtained and the nature of the model, it should be assumed that the model was made to a high standard of the level of detail in accordance with the LOD level 4. The level of detail of the LOD of the HBIM model depends on many factors, such as the following: the purpose and requirements for model complexity, data source for its generation, software and IT tools used, as well as the skills of the person making the model [50]. In addition to high-quality geospatial data of the object, in the BIM modelling process and at the stage of creating a library of parametric objects, it is valuable to have archival and photographic documentation. These factors, apart from the quality of 3D data, are decisive determinants of the quality of the obtained model. It is worth pointing out here that the importance of archival and photographic documentation in the process of building libraries of parametric objects was one of the first to be indicated by a research team from Great Britain and Saudi Arabia [15], who developed Jeddah Historical Building Information Modelling. This sentence is also confirmed by Ullah et. al. in a publication that broadly analyses BIM in terms of the BIM-Based Building Permit Process [5]. The synergy of information sources about the object, in which the superior role is played by 3D good quality data capturing, determines the quality of the model and influences the final effect the applied LOD of the model.
When assessing the BIM (HBIM) model, one should also assess the level of graphics detail, the level of saturation of information on the model, the possibility of its boiling in a multidimensional space and for the needs of costing and facility management based on the model. This is why the Level of In-formation (LOI) is often found in the LOD fraternity. The level of saturation of the model with the LOI information is the same as the LOD level, because the more advanced and detailed the model, the more information it can convey about the object. LOI is a non-geometric part of the model information where the model itself is its carrier, where each successive information constitutes its additional attribute [51]. By adopting the LOI level assessment rules as the quantity and quality of the collected information on individual components of the facilities, the minimum, low, medium, high and maximum saturation levels can be distinguished [49]. The completed HBIM model contains information on all types of structural and architectural elements, along with a description of the types of building components, the assignment of appropriate components and the identified and characterised materials from which they were made, and also have information on the location of their occurrence in the project assigned to the model (object). Thanks to the use of visualisation methods and presentation of the actual colours and textures of the elements’ finishing, a high LOI level was assigned for the models made. A high level also requires the addition of attributes regarding the specification of the manufacturer of structural elements and building finishing, as well as attributes specifying the method of servicing and evaluation of the durability of structural elements which in the case of historic buildings is irrelevant information (impossible to implement). A collection of information on the structure of the facility is provided thanks to the Monuments Cards [49]. This level is in line with the LOD4 of the objects. The LOI level is particularly important in the case of historic buildings and the generation of the HBIM model due to the need to prepare a description of complex geometry and to link detailed information about the object to it. The introduction of the LOI level supports the process of conservation and preparation of documentation of the existing state and facilitates the management of a historic object [52,53].
Another aspect of the accuracy assessment of the BIM model is the analysis of the geometric details of individual building elements within the LOG (Level of Geometry). LOD includes both semantic information (containing the level of LOI information) and geometric information of the model (LOG), which reflects the geometry of a real spatial object. As part of the LOG, all elements of the model geometry should be analysed, concerning both the general shapes of the building and structural elements [50]. Within the LOG, five divisions have been defined, which are identical to the LOD levels. LOG100 as a conceptual model, including only a general (approximate) representation of the building, without the shapes and geometry of the object. LOG200 defines the approximate geometry of the object, presented in the form of the general object model (defining only the range of the building occurrence). LOG300, as the exact geometry, presents shapes of structural elements, while maintaining the properties of their types. LOG350 includes the possibility of generating construction documentation based on the model. LOG 400 marks components and their interconnection including very detailed information on all components. LOG500 represents the state of the model which is an ideal reflection of the object, verified in the field [54,55]. According to [55], in some cases the required (expected) level of geometry may not apply to all structural and architectural elements, due to the specificity of HBIM and its reflection of historic buildings, often constituting centuries-old buildings and architectural structures. In this aspect, the HBIM models made by the authorities at the LOG350 level should be specified, due to the precise mapping of the geometry of the object, while maintaining the shape of the object and defining the types of its individual components. Additionally, as part of the prepared studies, it is possible to generate technical documentation, constituting an inventory of the current condition of the facility.
A very important aspect of the HBIM model assessment is not only qualitative assessment, but also the accuracy of its implementation, expressed with the use of LOA (Level from Accuracy). This parameter determines the accuracy range of the model presentation in relation to the real dimensions of the object [52]. The level of accuracy reflects the precision of obtaining, processing and using measurement data to build the BIM model of an object, as well as the compliance of this model with its actual counterpart. As part of the assessment, the range determined by the levels from LOA in the range LOA10-LOA50, where LOA10 applies to models consistent with reality in the range worse than 5 cm, LOA20 in the accuracy range 5 cm–15 mm, LOA30: 15–5 mm, LOA40: 5–1 mm and LOA50: less than 1 mm [56]. The data source used for modelling the objects were point clouds, the accuracy of which was in the range of 10 mm. However, the error of identifying and fitting the model into the point cloud should also be taken into account, which may be even 2 (or even 3) times higher; therefore, in accordance with the adopted assumptions [56], the LOA level of the generated HBIM models should be determined at the LOA20 level. This level is due to the fact that historical objects whose age is estimated at 300–400 years and due to damage that took place during World War II, as well as deformations caused by the passage of time and the ageing of construction materials, which required repairs and replacement of some elements [43,44], this level is high and sufficient for objects of this type (HBIM).
5. Conclusions
BIM is a digital record in the form of three-dimensional 3D spatial objects with associated technical and descriptive documentation. The BIM model is usually created at the design stage of an object; however, it is possible to generate it for existing buildings through their careful inventory. Very helpful in obtaining information for the needs of generating models are the following: TLS measurement and information from the UAV deck due to the accuracy and quality of the acquired geospatial data, which is a reliable source of information about places and objects. TLS and UAV allow you to obtain detailed information for almost any type of facility, including historic buildings. The BIM model of such an object along with the reconstruction of damaged elements is the implementation of HBIM. It is a virtual prototype of a real historical object with an object database of its past and present state, taking into account historical and archaeological information. To make the HBIM model, a precise, accurate and comprehensive inventory of all the components and construction elements of the facility is necessary. Due to the limitations of the scope and type of work for each of the measuring instruments used, it is necessary to use several tools and measurement methods and then to integrate them.
The process of generating and processing geospatial data used to build the HBIM model consists of many stages. In each of them, various types of errors may arise, the values of which affect the final accuracy of the prepared study. Usually, this error is determined using the so-called pro-pagination of the mean error. Depending on the nature of the data, the scale and type of the study performed, the techniques of obtaining information about the objects, as well as the available funds, geospatial data is generated at various levels of precision both qualitative and quantitative. After the integration of data from different sources (e.g., TLS/UAV), one (common) geospatial database is created. This approach makes it impossible to accurately estimate the impact of individual component errors on the final result of the study. When performing the error propagation analysis, the accuracy of the LOD detail level and the position error are considered, combining both types of these errors. In fact, the position error and accuracy of the data acquisition is more important than the influence of the LOD level selection. Consequently, it is unjustified to generate geoinformation for the implementation of the HBIM model with a high LOD level, if the methods of data acquisition and processing are too imprecise and insufficiently reliable. It is important to focus on the accuracy of the generated measurement information and integration of individual data groups rather than on the selection of the level of detail, which depends directly on the quality and quantity of the input data [57]. Therefore, it is recommended to use high-quality measurement data from TLS to create the HBIM model, especially in the aspect of historic buildings, containing numerous architectural details, and to supplement their grey areas data from UAV technology.
In the process of generating a BIM model (HBIM) based on a point clouds, it is important to select the appropriate level of accuracy and density (qualitative and quantitative) of geospatial data obtained using TLS or UAV.
The HBIM model has a broad spectrum of applications, mainly in the construction, architecture and management of historic buildings. The model is also a source of information for historians and conservators due to its faithful representation of the existing condition of a spatial object. Based on this type of information, it is possible to assess its technical condition, as well as to expose defects or deformations resulting from the degradation of the object, especially with the use of data from TLS, UAV and photographic documentation made during the site visit. The authors in the following research will undertake the possibility of using TLS data and photogrammetry in the construction of a HBIM model representing the reconstruction of heritage objects. The research will include the possibility of generating a model based on residual geospatial data supplemented with technical and descriptive documentation in order to visualise (reconstruct) buildings combined with an attempt to analyse (assess) the causes of building degradation and its effects, as well as the possibilities of preventing this process.
Author Contributions
Conceptualization, P.K. and P.G.; methodology, P.K. and P.G.; software, P.K. and P.G.; validation, P.K. and P.G.; formal analysis, P.K. and P.G; resources, P.K.; data curation, P.K.; writing—original draft preparation, P.K. and P.G.; writing—review and editing, P.K. and P.G.; visualization, P.K. and P.G.; supervision, P.K.; project administration, P.K.; funding acquisition, P.K. and P.G. All authors have read and agreed to the published version of the manuscript.
Funding
This research was funded in part by National Science Centre, Poland; Grant number: 2021/05/X/ST10/00582 (Klapa Przemysław, Grant: Synergy of geospatial data from UAV and TLS for Heritage Building Information Model (HBIM). For the purpose of Open Access, the author has applied a CC-BY public copyright licence to any Author Accepted Manuscript (AAM) version arising from this submission. In part of this research was also funded and Ministry of Education and Science from a subsidy for the University of Agriculture in Krakow (Department of Land Surveying).
Data Availability Statement
The data used in the study are available from the corresponding author upon reasonable request.
Acknowledgments
We thank the manager of the facilities (chapel and belfry), priest J. Bonio—parish priest of the Assumption of the Blessed Virgin Mary in Kurzelów (diocese of Kielce, Poland) for enabling access to buildings and carrying out all necessary measurement works.
Conflicts of Interest
The authors declare no conflict of interest.
References
- Aigwi, I.E.; Egbelakin, T.; Ingham, J. Efficacy of adaptive reuse for the redevelopment of underutilised historical buildings: Towards the regeneration of New Zealand’s provincial town centres. Int. J. Build. Pathol. Adapt. 2018, 36, 385–407. [Google Scholar] [CrossRef]
- Guzmán, P.; Roders, A.P.; Colenbrander, B. Measuring links between cultural heritage management and sustainable urban development: An overview of global monitoring tools. Cities 2017, 60, 192–201. [Google Scholar] [CrossRef]
- European Commission. How Digital Will Help Us Preserve Our Cultural Heritage; Commission Recommendation of 10.11.2021 on a Common European Data Space for Cultural Heritage; European Commission: Brussels, Belgium, 2021; Available online: https://digital-strategy.ec.europa.eu/en/news/commission-proposes-common-european-data-space-cultural-heritage (accessed on 23 December 2022).
- Volk, R.; Stengel, J.; Schultmann, F. Building Information Modeling (BIM) for existing buildings—Literature review and future needs. Autom. Constr. 2014, 38, 109–127. [Google Scholar] [CrossRef]
- Ullah, K.; Witt, E.; Lill, I. The BIM-Based Building Permit Process: Factors Affecting Adoption. Buildings 2022, 12, 45. [Google Scholar] [CrossRef]
- Rodrigues, F.; Teixeira, J.; Matos, R.; Rodrigues, H. Development of a web application for historical building management through BIM technology. Adv. Civ. Eng. 2019, 2019, 9872736. [Google Scholar] [CrossRef]
- Yang, X.; Grussenmeyer, P.; Koehl, M.; Macher, H.; Murtiyoso, A.; Landes, T. Review of built heritage modelling: Integration of HBIM and other information techniques. J. Cult. Herit. 2020, 46, 350–360. [Google Scholar] [CrossRef]
- Nicu, I.C.; Rubensdotter, L.; Stalsberg, K.; Nau, E. Coastal Erosion of Arctic Cultural Heritage in Danger: A Case Study from Svalbard, Norway. Water 2021, 13, 784. [Google Scholar] [CrossRef]
- Tommasi, C.; Fiorillo, F.; Jiménez Fernández-Palacios, B.; Achille, C. Access and web-sharing of 3D digital documentation of environmental and architectural heritage. Int. Arch. Photogramm. Remote Sens. Spat. Inf. Sci. 2019, XLII-2/W9, 707–714. [Google Scholar] [CrossRef]
- Bruno, N.; Roncella, R. A restoration oriented HBIM system for cultural heritage documentation: The case study of Parma Cathedral. Int. Arch. Photogramm. Remote Sens. Spat. Inf. Sci. 2018, 42, 171–178. [Google Scholar] [CrossRef]
- Yilmaz, H.M.; Yakar, M.; Gulec, S.A.; Dulgerler, O.N. Importance of digital close-range photogrammetry in documentation of cultural heritage. J. Cult. Herit. 2007, 8, 428–433. [Google Scholar] [CrossRef]
- Murphy, M.; McGovern, E.; Pavia, S. Historic building information modelling (HBIM). Struct. Surv. 2009, 27, 311–327. [Google Scholar] [CrossRef]
- Murphy, M.; McGovern, E.; Pavia, S. Historic Building Information Modelling–Adding intelligence to laser and image based surveys of European classical architecture. ISPRS J. Photogramm. Remote Sens. 2013, 76, 89–102. [Google Scholar] [CrossRef]
- Williamson, J.; Nicu, I.C. Photogrammetric Measurement of Erosion at the Sabbath Point Beothuk Site in Central Newfoundland, Canada. Sustainability 2020, 12, 7555. [Google Scholar] [CrossRef]
- Baik, A.; Yaagoubi, R.; Boehm, J. Integration of Jeddah historical BIM and 3D GIS for documentation and restoration of historical monument. Int. Arch. Photogramm. Remote Sens. Spat. Inf. Sci. 2015, XL–5/W7, 29–34. [Google Scholar] [CrossRef]
- Guarnieri, A.; Fissore, F.; Masiero, A.; Vettore, A. From TLS survey to 3D solid modeling for documentation of built heritage: The case study of Porta Savonarola in Padua. Int. Arch. Photogramm. Remote Sens. Spat. Inf. Sci. 2017, 42, 303–308. [Google Scholar] [CrossRef]
- Mora, R.; Sánchez-Aparicio, L.J.; Maté-González, M.Á.; García-Álvarez, J.; Sánchez-Aparicio, M.; González-Aguilera, D. An historical building information modelling approach for the preventive conservation of historical constructions: Application to the Historical Library of Salamanca. Autom. Constr. 2021, 121, 103449. [Google Scholar] [CrossRef]
- Shanoer, M.M.; Abed, F.M. Evaluate 3D laser point clouds registration for cultural heritage documentation. Egypt. J. Remote Sens. Space Sci. 2018, 21, 295–304. [Google Scholar] [CrossRef]
- De Naeyer, A.; Arroyo, S.; Blanco, J. Krakow Charter 2000: Principles for Conservation and Restoration of Built Heritage; Bureau: Krakow, Poland, 2000. [Google Scholar]
- Grussenmeyer, P.; Landes, T.; Voegtle, T.; Ringle, K. Comparison methods of terrestrial laser scanning, photogrammetry and tacheometry data for recording of cultural heritage buildings. Int. Arch. Photogramm. Remote Sens. Spat. Inf. Sci. 2008, 37, 213–218. [Google Scholar]
- Bayram, B.; Nemli, G.; Özkan, T.; Oflaz, O.; Kankotan, B.; Çetin, İ. Comparison of laser scanning and photogrammetry and their use for digital recording of cultural monument case study: Byzantine land walls-istanbul. ISPRS Ann. Photogramm. Remote Sens. Spat. Inf. Sci. 2015, II-5/W3, 17–24. [Google Scholar] [CrossRef]
- Majid, Z.; Lau, C.; Yusoff, A. Three-Dimensional Recording of Bastion Middleburg Monument Using Terrestrial Laser Scanner. Int. Arch. Photogramm. Remote Sens. Spat. Inf. Sci. 2016, XLI-B5, 323–326. [Google Scholar] [CrossRef]
- Korumaz, S.; Tucci, G.; Korumaz, M.; Bonara, V. Opportunities of geometric documentation of historic buildings with terrestrial laser scanner, examples from Aksaray/Turkey. ICONARP Int. J. Archit. Plan. 2018, 6, 246–273. [Google Scholar]
- Georgopoulos, G.; Telioni, E.; Tsontzou, A. The contribution of laser scanning technology in the estimation of ancient Greek monuments’ deformations. Surv. Rev. 2016, 48, 303–308. [Google Scholar] [CrossRef]
- Hess, M.; Petrovic, V.; Yeager, M.; Kuester, F. Terrestrial laser scanning for the comprehensive structural health assessment of the Baptistery di San Giovanni in Florence, Italy: An integrative methodology for repeatable data acquisition, visualization and analysis. Struct. Infrastruct. Eng. 2018, 14, 247–263. [Google Scholar] [CrossRef]
- Takhirov, S.; Gilani, A.; Quigley, B.; Myagkova, L. Structural Health Monitoring and Assessment of Seismic Vulnerability of Historic Monuments on the Great Silk Road Based on Laser Scanning. In Structural Analysis of Historical Constructions; Springer: Berlin/Heidelberg, Germany, 2019; pp. 2254–2263. [Google Scholar]
- Kersten, T.P.; Tschirschwitz, F.; Deggim, S.; Lindstaedt, M. Virtual Reality for Cultural Heritage Monuments–from 3D Data Recording to Immersive Visualisation. In Proceedings of the Euro-Mediterranean Conference, Limassol, Cyprus, 4–5 October 2018; pp. 74–83. [Google Scholar]
- Kersten, T.P.; Tschirschwitz, F.; Lindstaedt, M.; Deggim, S. The historic wooden model of Solomon’s Temple: 3D recording, modelling and immersive virtual reality visualisation. J. Cult. Herit. Manag. Sustain. Dev. 2018, 8, 448–464. [Google Scholar] [CrossRef]
- Moyano, J.; Justo-Estebaranz, Á.; Nieto-Julián, J.E.; Barrera, A.O.; Fernández-Alconchel, M. Evaluation of records using terrestrial laser scanner in architectural heritage for information modeling in HBIM construction: The case study of the La Anunciación church (Seville). J. Build. Eng. 2022, 62, 105190. [Google Scholar] [CrossRef]
- Trinks, I.; Wallner, M.; Kucera, M.; Verhoeven, G.; Torrejón, V.; Löcker, K.; Nau, E.; Severa, C.; Aldrian, L.; Neubauer, E.; et al. Documenting bronze age Akrotiri on Thera using laser scanning, image-based modelling and geophysical prospection. The International Archives of the Photogrammetry, Remote Sensing and Spatial Information Sciences. In Proceedings of the 3D Virtual Reconstruction and Visualization of Complex Architectures, Nafplio, Greece, 1–3 March 2017. [Google Scholar]
- Agnello, F.; Brutto, M.L. Integrated surveying techniques in cultural heritage documentation. ISPRS Ann. Photogramm. Remote Sens. Spat. Inf. Sci. 2007, II–5/W3, 17–24. [Google Scholar]
- Nettley, A.; Anderson, K.; DeSilvey, C.; Caseldine, C. Using terrestrial laser scanning and lidar data for photo-realistic visualization of climate impacts at heritage sites. Int. Arch. Photogramm. Remote Sens. Spat. Inf. Sci. 2011, XXXVIII-5/W16, 223–229. [Google Scholar] [CrossRef]
- Markiewicz, J. Aspects of photogrammetric data integration for generation 3D models of the selected objects located in the urban space. Arch. Fotogram. Kartogr. I Teledetekcji 2012, 24, 199–209. [Google Scholar]
- Persad, R.A.; Armenakis, C. Alignment of point cloud DSMs from TLS and UAV platforms. Int. Arch. Photogramm. Remote Sens. Spat. Inf. Sci. 2015, XL–1/W4, 369–373. [Google Scholar] [CrossRef]
- Klapa, P.; Mitka, B.; Zygmunt, M. Integration of TLS and UAV data for the generation of a three-dimensional basemap. Adv. Geod. Geoinf. 2022, 71, e27. [Google Scholar]
- Klapa, P.; Mitka, B.; Zygmunt, M. Study into point cloud geometric rigidity and accuracy of TLS-based identification of geometric bodies. In IOP Conference Series: Earth and Environmental Science; IOP Publishing: Bristol, UK, 2017; p. 032008. [Google Scholar]
- Abdullah, C.C.K.; Baharuddin, N.; Ariff, M.; Majid, Z.; Lau, C.; Yusoff, A.; Idris, K.; Aspuri, A. Integration of point clouds dataset from different sensors. Int. Arch. Photogramm. Remote Sens. Spat. Inf. Sci. 2017, 42, 9–15. [Google Scholar] [CrossRef]
- Costantino, D.; Pepe, M.; Restuccia, A. Scan-to-HBIM for conservation and preservation of Cultural Heritage building: The case study of San Nicola in Montedoro church (Italy). Appl. Geomat. 2021, 1–15. [Google Scholar] [CrossRef]
- Alshawabkeh, Y.; Baik, A.; Fallatah, A. As-Textured As-Built BIM Using Sensor Fusion, Zee Ain Historical Village as a Case Study. Remote Sens. 2021, 13, 5135. [Google Scholar] [CrossRef]
- Currà, E.; D’Amico, A.; Angelosanti, M. Representation and knowledge of historic construction: HBIM for structural use in the case of villa Palma Guazzaroni in Terni. TEMA Technol. Eng. Mater. Arch. 2021, 7, 1–20. [Google Scholar]
- Martínez-Carricondo, P.; Carvajal-Ramírez, F.; Yero-Paneque, L.; Agüera-Vega, F. Combination of nadiral and oblique UAV photogrammetry and HBIM for the virtual reconstruction of cultural heritage. Case study of Cortijo del Fraile in Níjar, Almería (Spain). Build. Res. Inf. 2020, 48, 140–159. [Google Scholar] [CrossRef]
- Sanseverino, A.; Messina, B.; Limongiello, M.; Guida, C.G. An HBIM Methodology for the Accurate and Georeferenced Reconstruction of Urban Contexts Surveyed by UAV: The Case of the Castle of Charles V. Remote Sens. 2022, 14, 3688. [Google Scholar] [CrossRef]
- Monument Card for the Chapel of St. Anna in Kurzelów, National Heritage Institute, Poland. Available online: https://zabytek.pl/pl/obiekty/g-275040 (accessed on 8 October 2022).
- Monument Card for the Belfry, National Heritage Institute, Poland. Available online: https://zabytek.pl/pl/obiekty/g-256433 (accessed on 8 October 2022).
- Mitka, B.; Klapa, P.; Makuch, M. Measuring Instrument for Integration of Data Coming from the Terrestrial Laser Scanning (TLS) and Unmanned Aerial Vehicles (UAV). Patent no. P.424402; (Patent Office of the Republic of Poland), 2020. [Google Scholar]
- Tang, L.; Li, L.; Ying, S.; Lei, Y. A full level-of-detail specification for 3D building models combining indoor and outdoor scenes. ISPRS Int. J. Geo-Inf. 2018, 7, 419. [Google Scholar] [CrossRef]
- Gröger, G.; Kolbe, T.H.; Czerwinski, A.; Nagel, C. OGC Document No. 08-007r1; OpenGIS City Geography Markup Language (CityGML) Encoding Standard, Version 1.0. 0; Open Geospatial Consortium: Arlington, VA, USA, 2008. [Google Scholar]
- Gröger, G.; Kolbe, T.H.; Nagel, C.; Häfele, K.-H. OGC Document No. 12-019; mOGC City Geography Markup Language (CityGML) Encoding Standard; Open Geospatial Consortium: Arlington, VA, USA, 2012. [Google Scholar]
- Polski Związek Pracodawców Budownictwa. BIM Standard PL: Warszawa, Poland, 2020.
- Klapa, P. TLS point cloud as a data source for multi-LOD of 3D models. Geomat. Landmanagement Landsc. 2022, 2, 63–73. [Google Scholar] [CrossRef]
- Maiezza, P. As-built reliability in architectural HBIM modeling. Int. Arch. Photogramm. Remote Sens. Spat. Inf. Sci. 2019, 42, 461–466. [Google Scholar] [CrossRef]
- Brumana, R.; Della Torre, S.; Previtali, M.; Barazzetti, L.; Cantini, L.; Oreni, D.; Banfi, F. Generative HBIM modelling to embody complexity (LOD, LOG, LOA, LOI): Surveying, preservation, site intervention—The Basilica di Collemaggio (L’Aquila). Appl. Geomat. 2018, 10, 545–567. [Google Scholar] [CrossRef]
- Brumana, R.; Della Torre, S.; Oreni, D.; Cantini, L.; Previtali, M.; Barazzetti, L.; Banfi, F. SCAN to HBIM-post earthquake preservation: Informative model as sentinel at the crossroads of present, past, and future. In Proceedings of the Euro-Mediterranean Conference, Limassol, Cyprus, 4–5 October 2018; pp. 39–51. [Google Scholar]
- Abualdenien, J.; Borrmann, A. Ensemble-learning approach for the classification of Levels of Geometry (LOG) of building elements. Adv. Eng. Inform. 2022, 51, 101497. [Google Scholar] [CrossRef]
- Brumana, R.; Stanga, C.; Banfi, F. Models and scales for quality control: Toward the definition of specifications (GOA-LOG) for the generation and re-use of HBIM object libraries in a Common Data Environment. Appl. Geomat. 2022, 14, 151–179. [Google Scholar] [CrossRef]
- US. Institute of Building Documentation. USIBD Level of Accuracy (LOA) Specification Guide: Level of Accuracy (LOA) Specification for Building Documentation; U.S. Institute of Building Documentation: Denver, CO, USA, 2016. [Google Scholar]
- Biljecki, F.; Heuvelink, G.B.; Ledoux, H.; Stoter, J. The effect of acquisition error and level of detail on the accuracy of spatial analyses. Cartogr. Geogr. Inf. Sci. 2018, 45, 156–176. [Google Scholar] [CrossRef]
Disclaimer/Publisher’s Note: The statements, opinions and data contained in all publications are solely those of the individual author(s) and contributor(s) and not of MDPI and/or the editor(s). MDPI and/or the editor(s) disclaim responsibility for any injury to people or property resulting from any ideas, methods, instructions or products referred to in the content. |
© 2022 by the authors. Licensee MDPI, Basel, Switzerland. This article is an open access article distributed under the terms and conditions of the Creative Commons Attribution (CC BY) license (https://creativecommons.org/licenses/by/4.0/).