Article

Satellite Multi-Sensor Data Analysis of Unusually Strong Polar Lows over the Chukchi and Beaufort Seas in October 2017

Far Eastern Branch, V.I. Il’ichev Pacific Oceanological Institute, Russian Academy of Sciences, 43, Baltiyskaya, 690041 Vladivostok, Russia
*
Author to whom correspondence should be addressed.
Remote Sens. 2023, 15(1), 120; https://doi.org/10.3390/rs15010120
Submission received: 25 October 2022 / Revised: 16 December 2022 / Accepted: 19 December 2022 / Published: 26 December 2022
(This article belongs to the Special Issue Remote Sensing of Changing Arctic Sea Ice)

Abstract

:
Polar lows (PLs) are intense mesoscale weather systems that often cause severe storm winds in the Nordic Seas but were considered as being exceedingly rare in the Pacific Arctic region before sea ice decline. Here, we explore four PLs observed on 18–22 October 2017 in the Chukchi and Beaufort Seas—an area with an exceptionally sparse observation network. The study is based on the combined use of the satellite microwave measurements, as well as infrared imagery, the ERA5, MERRA-2 and NCEP-CFSv2 reanalysis data sets. An unusually strong PLs pair developed near the marginal ice zone during a marine-cold air outbreak in anomalously low sea ice extent conditions. PLs pair moved southward as a mesocyclonic system called the “merry-go-round”, under the upper-level tropospheric vortex with a cold core. Multi-sensor satellite measurements show that, in the mature stage, a PL pair had near-surface wind speeds (W) close to hurricane force—over 30 m/s. Comparison analysis of W distributions within the strongest PL showed that all reanalysis data sets reasonably reproduce the PL median wind speed but underestimate its extreme values by 15–23%. The reanalysis data sets detected only two PLs with horizontal scales of over 220 km. Tracks of identified PLs for all data sets are in good agreement with the ones obtained from satellite images capturing the main features of the mesoscale weather system propagation. For the track of the strongest PL event, ERA5 exhibited the most accordance with satellite observations with a tracking error of 50–60 km.

Graphical Abstract

1. Introduction

Polar lows (PLs) are convective mesocyclones with a spiraliform or “comma cloud” signature and nearly cloud-free central area (eye), which are formed in the cold air masses over the open water of mid-high-latitudes poleward from the main tropospheric front (polar or arctic). Due to the explosive cyclogenesis, intense PLs are often called Arctic hurricanes or “Arctic bombs” [1]. These mesoscale systems—with lifetime ranging from several hours to 3 days and horizontal sizes up to 1000 km (with predominant sizes of 200–600 km)—are often accompanied by storm and hurricane-force winds, high waves, heavy precipitations and vessel icing. Because of the small size and short lifecycle, the PLs are not always resolved by weather charts and numerical weather prediction models [1]. However, their cloud signatures are clearly identified on satellite visible and infrared (IR) images. Satellite observations that began in the 1960s gave a start to the systematic study of marine mesoscale weather systems.
One of the trigger mechanisms for convective and mesocyclonic activity is the intensification of air–sea interaction during cold air outbreaks (CAO) at the rear of synoptic-scale cyclones when dry cold air mass moves over the relatively warm sea surface. As the air–sea interaction intensifies, deep convection, cloud cells and mesovortices are developed [1]. The main regions of mesoscale cyclogenesis in the Northern Hemisphere are the North Atlantic/Nordic Seas [2,3,4,5] and the North Pacific [6,7,8,9,10,11]. In the Pacific Arctic (PA) region, the PL formation conditions were previously considered unfavorable because of a predominance of non-seasonal sea ice cover and the absence of warm ocean currents. Therefore, there is a lack of systematic studies of mesoscale cyclogenesis in this area. Only a few works [1,12] have reported the development of mesocyclones with storm winds over the Beaufort Sea which can be classified as PLs. In addition, Zimich [13] detected “local mesocyclones” (with a diameter of 100 km) over the Eurasian Arctic and Bering Sea coastal zones, which developed under the influence of orography on the oncoming airflow.
Since the 21st century, the rapid Arctic sea ice retreat has led to a more variable seasonality of ice cover and a stronger meridionality of the atmospheric circulation [14,15,16]. It resulted in the earlier onset of sea ice melting [17] or its later autumn freeze-up [18] and, consequently, the intensification of mesocyclonic activity in the PA [19,20,21]. However, without systematic studies and sufficient PL statistics, we cannot conclude whether climate change in the Arctic affects the frequency of severe PLs in the PA. Meanwhile, such studies are encouraged by the intensified exploitation of the Northern Sea Route, the development of offshore platforms on the Arctic shelf and the expansion of new fishery areas.
In this work, we examine unusually strong PLs observed over the Chukchi and Beaufort seas on 18–22 October 2017 combining multi-sensor satellite measurements, ERA5, MERRA-2 and CFSv2 reanalysis datasets. The study addresses the following questions:
  • Can a multi-sensor approach provide insights into the development of strong PLs?
  • How accurately do the ERA5, MERRA-2 and CFSv2 reanalysis datasets capture the development of the PLs in comparison with satellite observations?
  • What are reanalyzes strengths and weaknesses in the PLs identification, tracking and representation of its intensity?
Section 2 describes the satellite measurements, MERRA-2, CFSv2 and ERA5 reanalysis datasets used in the study and the methods applied. Section 3 gives a synoptic review and analysis of the PLs evolution and presents a comparative analysis of near sea surface wind speed. Finally, a summary and conclusions are given in Section 4.

2. Data and Analysis Methods

2.1. Satellite Measurements

The PLs were identified from the cloud signatures on the IR images of the spectroradiometers MODIS onboard the Aqua and Terra satellites, VIIRS onboard the Suomi NPP satellite, and AHVRR onboard the NOAA series and MetOp-A/B satellites. The sensors record the Earth’s radiation in the thermal spectral range of 10.2–12.4 μm, which characterizes the temperature of the underlying surface and representing the cloud top temperature in the presence of clouds. Using IR images from seven satellites allowed for observing the PLs centers and cloud structures with a time discreteness of approximately 70 min with a spatial resolution of 375 m (VIIRS) and 1000 m (MODIS and AVHRR). The PL tracks obtained from the IR images served as verification.
From a series of IR images of cyclonic cloud vortex, we estimated the location, duration and size of PLs from genesis to decay. PL genesis (dissipation) corresponds to the first (last) image with a clearly formed cloud vortex. PL size is defined during its mature phase by the minimal diameter of a circle that encompasses the cloud vortex. The criterion of 15 m/s was selected as the lower threshold of the near sea surface wind speed in the PL [22].
Several atmospheric parameters were derived from the measurements of the Advanced Microwave Scanning Radiometer (AMSR2) onboard the GCOM-W1 satellite. In particular, we used measurements of the brightness temperature at 89 GHz frequency in the horizontal polarization—Tb(89H). In addition, we retrieved the near-surface wind speed (W), atmospheric total water vapor content (V) and total cloud liquid water content (Q) using algorithms based on physical modeling of the brightness temperature of the ocean-atmosphere system outgoing radiation [23,24,25,26]. We apply a lower frequency (LF) wind speed retrieval algorithm that uses four brightness temperatures at following AMSR2 channels: 6.9 and 10.65 GHz, horizontal and vertical polarizations. Comparison of AMSR2 wind speed and in situ measurements from eight platform automatic weather stations in the North and Norwegian Seas showed a high correlation (0.9) with the root-mean-square error of 1.6 m/s [27].
We used the brightness temperature from the AMSR2 Level 1R data. The footprint resolution varies from 35 km × 61 km on 6.925 GHz to 3 km × 5 km on 89.0 GHz. The sampling interval is 10 km × 10 km for all bands except two channels at 89 GHz, for which it is 5 km × 5 km. For a more reliable analysis of the wind fields, we masked an area at a distance of about 50 km from the ice edge (the trace resolution used in the algorithm for the lowest frequency of 6.9 GHz).
We also used surface wind speed estimates derived from the measurements of the Advanced Scatterometer (ASCAT) onboard the MetOp-A/B satellites with a spatial resolution of 12.5 km and the polarimetric microwave radiometer WindSat onboard the Coriolis satellite [28] mapped to a 0.25-degree grid. These datasets, combined with the AMSR2 measurements, provided 11 wind speed fields per day, enabling PL detection and analysis of their intensity and evolution.
The satellite observations were filtered for rain, as precipitation degrades the quality of both radiometer and scatterometer wind speeds. However, in PLs, most precipitation falls as snow due to the extremely cold environment. Moreover, satellite-based total cloud liquid water content in the study area showed values less than 0.3 kg/m2. Such atmospheric conditions result in reliable satellite wind retrievals [29].
The mean and extreme (95th percentile) wind speeds within the 300 km radius of the PL center were calculated to compare satellite and reanalyzes representations of the PL development. Note that the coastal and near ice edge zones of 50 km wide were excluded from the analysis because of technical limitations of the sensors.
It is known that there is significant uncertainty and inconsistency of high wind speed (above 15 m/s) estimates in different satellite products. The difference can exceed 20% or more, especially with intense rainfall [30,31]. However, in high latitudes, the satellite-derived wind speed up to 30 m/s agrees with the anemometer measurements on oil platforms within the error of the satellite wind retrieval algorithms [29].
The vertical structure of the PL cloud system was analyzed using the Cloud Profiling Radar (CPR) measurements at 94 GHz frequency from the CloudSat satellite launched in 2006 as part of the “A-Train” satellite constellation [32], which also includes Aqua and GCOM-W1 satellites. The CPR is the first satellite radar designed to measure vertical structure of the macro- and microphysical characteristics of clouds. A distribution of droplets and crystals in the PL clouds was obtained by a joint analysis of nearly synchronous CPR measurements and the Q and Tb(89H) fields derived from the AMSR2 data. The CPR data were successfully used for analysis of the PL vertical structure over the water surface at the middle [33,34] and high [35,36] latitude areas.

2.2. ERA5, MERRA-2 and CFSv2 Reanalysis Data Sets

Hourly fields of sea level pressure (SLP), zonal and meridional components of wind speed, geopotential height and temperature were obtained from the ERA5 reanalysis—the latest climate reanalysis produced by the European Center for Medium-Range Weather Forecasts (ECMWF) using the Integrated Forecasting System Cy41r2 with 4D-Var data assimilation. The ERA5 has T639 spectral resolution (corresponds to 31-km horizontal resolution) and provides data at 0.25° × 0.25° regular latitude-longitude grid for 137 levels from the Earth’s surface up to 0.01 hPa [37]. We used the ERA5 data set to track PLs and analyze the atmospheric environment and wind conditions.
PLs activity was also considered from The National Centers for Environmental Prediction (NCEP) Climate Forecast System version 2 (CFSv2) operational analysis. The CFSv2 is an advanced coupled atmosphere–ocean–land dynamical climate forecast system [38] that was made operational at NCEP in March 2011. The hourly CFSv2 analysis is based on the improved Climate Data Assimilation System version 2 (CDASv2) with an increased resolution of 27 km (T574) and available with the horizontal grid resolution of about 0.2° × 0.2° (for near-surface wind speed) and of 0.5° × 0.5° (for the other parameters). In this study, the term CFSv2 is referred to as the CDASv2 data set.
We used the Modern Era Retrospective Analysis for Research and Applications (MERRA-2) [39] generated with the Goddard Earth Observing System, Version 5.12.4 (GEOS-5) atmospheric model and Global Statistical Interpolation (GSI) analysis scheme. The MERRA-2 data set has an approximate spatial resolution of 0.5° latitude by 0.625° longitude and comprises assimilations of hourly meteorological diagnostic parameters, including wind speed and sea level pressure.
It is assumed that the satellite estimates of near-surface wind speed in combination with assimilated reanalysis data sets aid to diagnose the influence of mesoscale atmospheric circulations and orographic effects on wind distribution in coastal zones. However, we take into account that reanalysis data sets systematically underestimate high wind speeds in polar lows [21,40,41].

2.3. PL Detection and Tracking Algorithms

Here, we applied two methods for the detection and tracking of PLs based on different atmospheric parameters—sea level pressure (SLP) and relative vorticity at 850 hPa ( ζ 850 ). The first procedure, developed by Zahn and Storch [42] and Chen and Storch [11], searches for the minima in the band-pass filtered hourly SLP fields and concatenates the minima in consecutive time steps to tracks. From the criteria proposed by the authors, we excluded a north-to-south average direction of the track and land mask limitation. The second procedure is mostly identical to one developed by Zappa et al. [40] which is based on the detection of local maxima in the filtered ζ 850 fields. We modified some parameters to obtain a good match with the satellite observations. The modification affected:
  • a low stability criterion, defined as the difference between the sea surface temperature (SST) and the temperature at 500 hPa (T500) ≥ 39 K;
  • ζ 850 ≥ 10 × 10−5 s−1; such threshold exhibits good agreement between a vorticity-tracking-based and a satellite-based PL data sets [40].
A Gaussian band-pass filter is applied in both methods with wavelengths 100 and 800 km to focus on the mesoscale nature of PLs and remove synoptic- and micro-scale variabilities. We converted a grid spacing from degree to km because of the longitudes convergence towards the pole, and linearly interpolated it to 25 km × 25 km resolution for all reanalysis datasets.

3. Results and Discussion

3.1. Review of Synoptic and Sea Ice Conditions

Anomalously low sea ice coverage observed in the Chukchi Sea during both autumn and early winter 2017 [43] definitely contributed to the intensification of the mesocyclonic activity in this region. The sea ice concentration map, obtained from the University of Bremen on 19 October 2017, exhibits a significant retreat of sea ice compared to September (Figure 1a, red dotted line) and October (Figure 1a, black dotted line) climatological sea ice edge. A notable increase in the ice-free area in October 2017 led to the favorable conditions for mesoscale cyclogenesis over the Chukchi and Beaufort Seas and adjacent open water areas from the north. The high SST (more than 4 °C) along the coast of Alaska (Figure 2) can also contribute to PL development.
Favorable conditions for the mesocyclogenesis were defined by: low-level baroclinic instability in the marginal zone between the sea ice edges or cold coast land areas and relatively warm sea surface; convective instability expressed as the differences between the sea surface temperature (SST) and the air temperature at the 500 hPa level (T500) that should exceed the threshold. Here, we use 40 °K for ΔT = SST − T500 criterion [44]. Figure 1b illustrates the frequency of conditions with ΔT ≥ 40 °K in October 2017, which for most of the study domain exceeds 10%. The areas with a recorded historical maximum frequency of PL favorable conditions since 1979 (marked with crosses) cover a significant part of the Chukchi Sea and the ice-free waters of the Beaufort Sea.
From 18 to 24 October, mesocyclones series were observed in this region. Four mesocyclones with wind speeds ≥15 m/s were classified as PLs. Their origin locations—derived from MODIS, VIIRS, and AVHRR satellite images—are shown in Figure 1b. One of them (marked as PL1) occurred over the Beaufort Sea on 18 October 2017 and existed for over 24 h. According to ASCAT and AMSR2 data, wind speed in the PL1 reached 18 m/s.
The PL4 occurred on October 22 over the Chukchi Sea in the northeastern sector of the upper-level low centered over the Norton Bay. It was weaker and with a noticeably shorter lifetime—approximately 10 h—and moved south to the coast of Chukotka, where it dissipated. Wind speed in the PL4 was reaching 15–16 m/s by ASCAT data.
The most intense of this series was a PL pair—containing the PL2 and PL3—which occurred on the border of the Chukchi and Beaufort seas on October 19. In the mature stage, the wind speed in the PL2 exceeded 25 m/s and in the most intense PL3 reached near hurricane values—over 30 m/s. Both interacting PLs moved under the upper-level vortex with the cold core along the northwest coast of Alaska to the Bristol Bay.
The PL3 was developed as the vortex of a multicenter mesocyclonic system like the “merry-go-round” [1] and was unusually strong for the PLs in the northern part of the PA region. By the end of October 19—when the PL3 was located to the west of the Lisburn Peninsula—it began to dissipate, whereas the less intense PL2 intensified.
The peak intensity of the mesocyclonic system is associated with the PL3, which moved over the Chukchi Sea on 19–20 October with the SLP minimum of around 990 hPa. The highest wind speed is observed in the northwestern sector of the mesocyclonic system in the high-pressure gradient area. As the mesocyclonic system moves into the Bering Sea, the PL3 cloud system quickly degraded (not shown). While SLP in its center decreased slightly, the winds were weakening under the lee of the Seward Peninsula.

3.2. Detecting and Tracking PLs

Figure 2 shows the tracks of four PLs as detected from the cloud structures on satellite images and derived from the reanalysis data sets. In all three data sets, only the track of the most intense PL3 is reproduced in both the vorticity (Figure 2a) and SLP fields (Figure 2b). The PL1 track is also reproduced in the vorticity field from all reanalysis data sets, but in the SLP fields CFSv2 could not identify it. PL2 were not reproduced by any reanalysis data set, despite its significant intensity (wind speed up to 25 m/s). We assume that PL2 and PL3 developed as a unified mesocyclonic system, in which the horizontal size of the PL2 did not exceed 200 km. However, the CFSv2 dataset could detect the PL4 near the coast of Chukotka despite its small scale (about 100 km).
Separately, it should be noted that the CFSv2 in the vorticity fields falsely detected two PLs with a lifetime of over 12 h that were not identified either on satellite images or in the ASCAT vector winds. We suspect that, under certain conditions, the atmospheric model component in the CFSv2 analysis generates non-existent mesoscale low-level circulations.
We calculated the PL track errors as the average distances between the centers identified from each reanalysis data set and close in time (less than 30 min) to satellite images. Table 1 shows the calculations performed for ERA5, MERRA-2 and CFSv2 datasets using two methods of tracking—based on SLP and 850-hPa relative vorticity (see Section 2.3). For both PLs tracking algorithms, ERA5 showed the best correspondence with satellite observations in detecting the PLs center with track errors of 50–60 km.
The CFSv2 exhibits slightly worse results for the vorticity-based tracking algorithm (compared to ERA5), and, in the SLP fields, this operational analysis retrieved only the most intense PL3. Note that CFSv2, unlike the others, could detect a small-scale PL4 with life-time less than 12 h. Finally, MERRA-2 showed the largest track errors (80–90 km) for both PL1 and PL3, regardless of the tracking algorithm used.

3.3. A Severe PL Pair

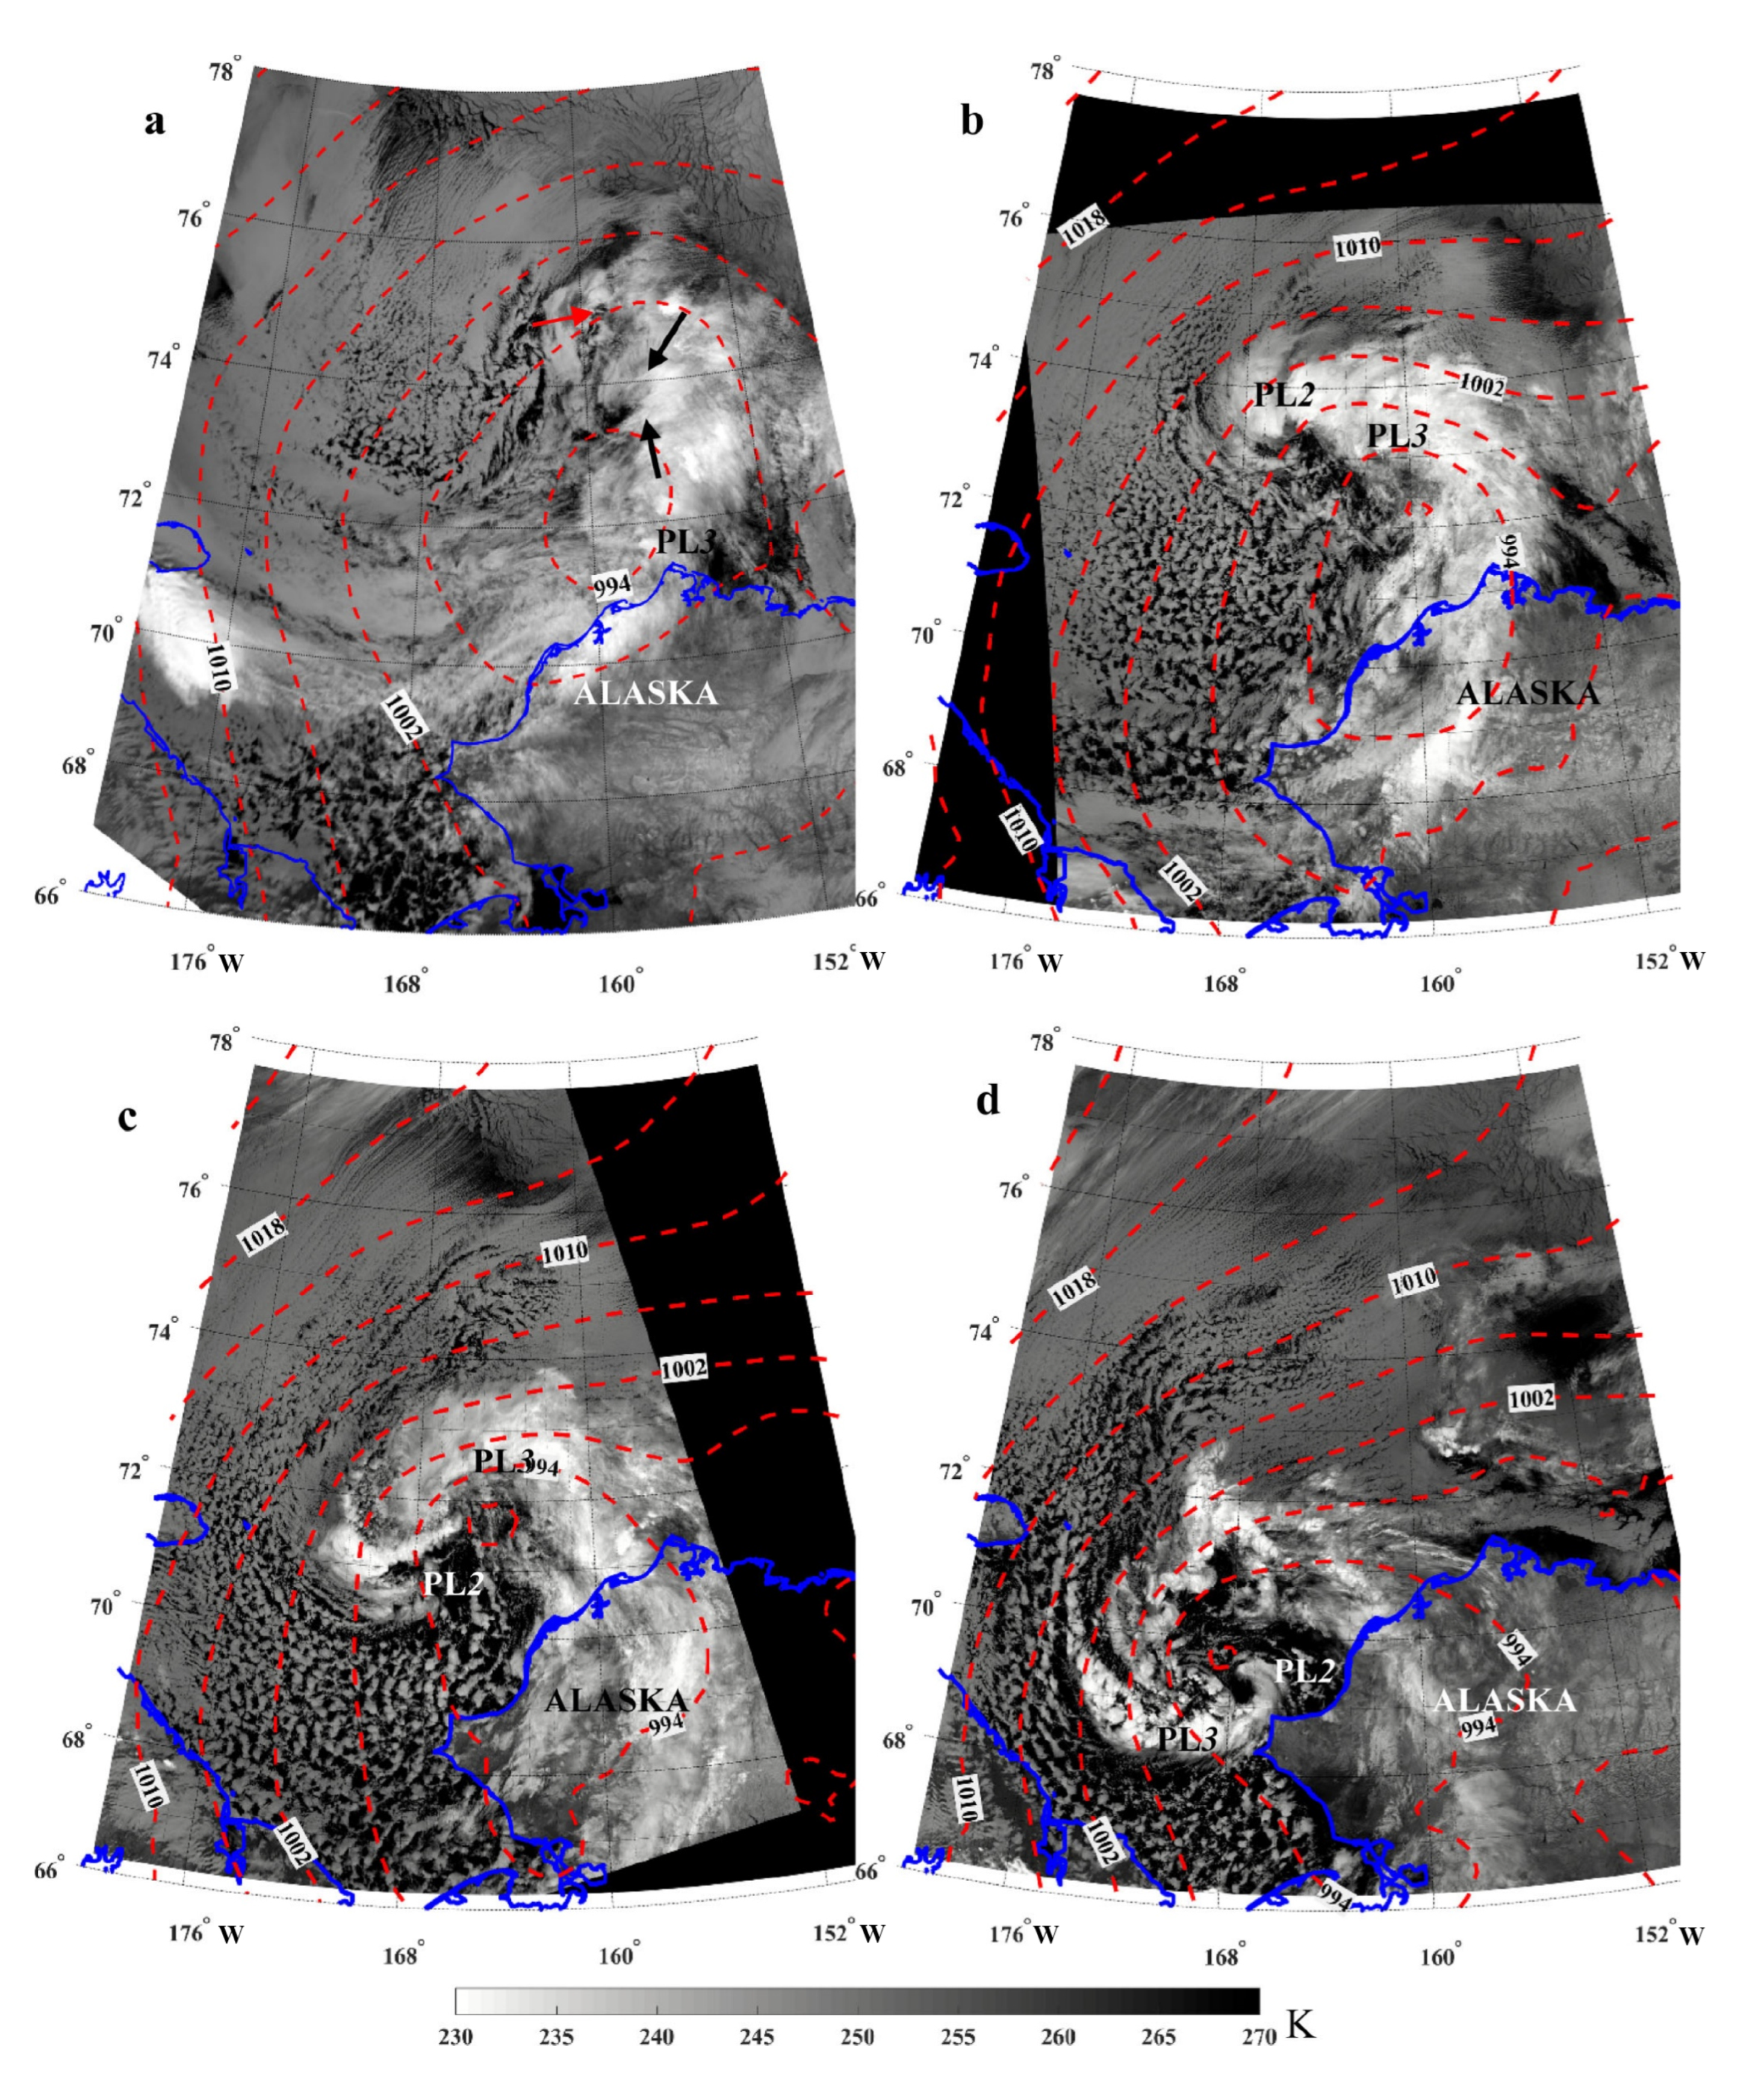
The movement of the strong polar lows (PL2 and PL3), discussed in more detail, was influenced by the upper level low with a cold core (Figure 3), providing a high temperature contrast between the sea surface and the atmosphere. This severe weather system was registered as part of the mesocyclonic system at 04:45 UTC on 19 October on the AVHRR satellite image (Figure 4a).
The mesocyclonic system was formed in a shallow baroclinic zone at a distance of 200 km from the sea ice edge (Figure 1), under the southern part of the upper-level low—within the area of ΔT ≥ 40 °K (outlined by red dotted line in Figure 3a). As the upper-level low was moving to the south–southwest toward areas with higher SST (Figure 3d,f), ΔT increased to values ≥45 °K (Figure 3c,e), resulting in rapid evolution and intensification of the PL2 and PL3 pair. At the initial stage of the PL3 development, a lower troposphere in the mesocyclogenesis area is characterized by the high horizontal temperature gradient (4 °K/100 km) at the 850 hPa level (Figure 3b). At the mature stage, the PL2 and PL3 were the two-center mesocyclonic system with the storm force wind (≥25 m/s). In more intense PL3, the wind speed observed within the period 14–20 UTC on October 19, as noted above, was about 30 m/s.
Figure 4 illustrates the PL2 and PL3 cloud systems evolution on 19 October. At the initial stage (Figure 4a), the PL2 cloud structure is not yet distinctly formed, but the central part with an almost cloud-free area and relatively high brightness temperature (Tb = of 255–260 K) is detected. Configuration of the cloud spirals around the PL3 center (black arrows) indicates the development of the mesocyclonic circulation. The spirals comprise cloud clusters that have shallow vertical extent, and the Tb at the cloud tops is approximately 20 K lower than in the center. ASCAT near-surface wind speed at the initial stage of the PL3 development was 8–11 m/s (not shown). The mesocyclogenesis area can be delineated by the closed isobar of 998 hPa in the ERA5 SLP field (Figure 4a).
At 12:05 UTC, in the matured PL3, the SLP minimum of 990 hPa was about 50 km south of the cloud field, evidencing good agreement between the ERA5 reanalysis and satellite data (Figure 4b). As compared to the initial stage of the PL3, the cloud top temperature of about 230 K is 20–25 K lower, indicating rapid development of convection. The analysis of cloud structures on satellite images shows that the two-center mesocyclonic system (formed by 12:05 UTC) further evolved to a multicenter system, like the “merry-go-round” [1]. The narrow cloud streets are the signature of cold air advection from the sea ice areas located to the north and northwest. Convective cells covering the vast area indicate the cold air mass expanded over the entire Chukchi Sea. A cloud top temperature of about 250 K evidences that the convective penetration in the cells is lower than in the PL2 and PL3.
At 17:05 UTC on 19 October, the PL3 was still at the mature stage with the SLP minimum in the center of 990 hPa (Figure 4c). After the next five hours (at 22:05 UTC on 19 October) the PL3 almost dissipated, while the PL2 intensified and further moved southward as the main vortex of the multicenter mesocyclonic system along with two new vortices formed over the northwestern periphery of this system (Figure 4d).
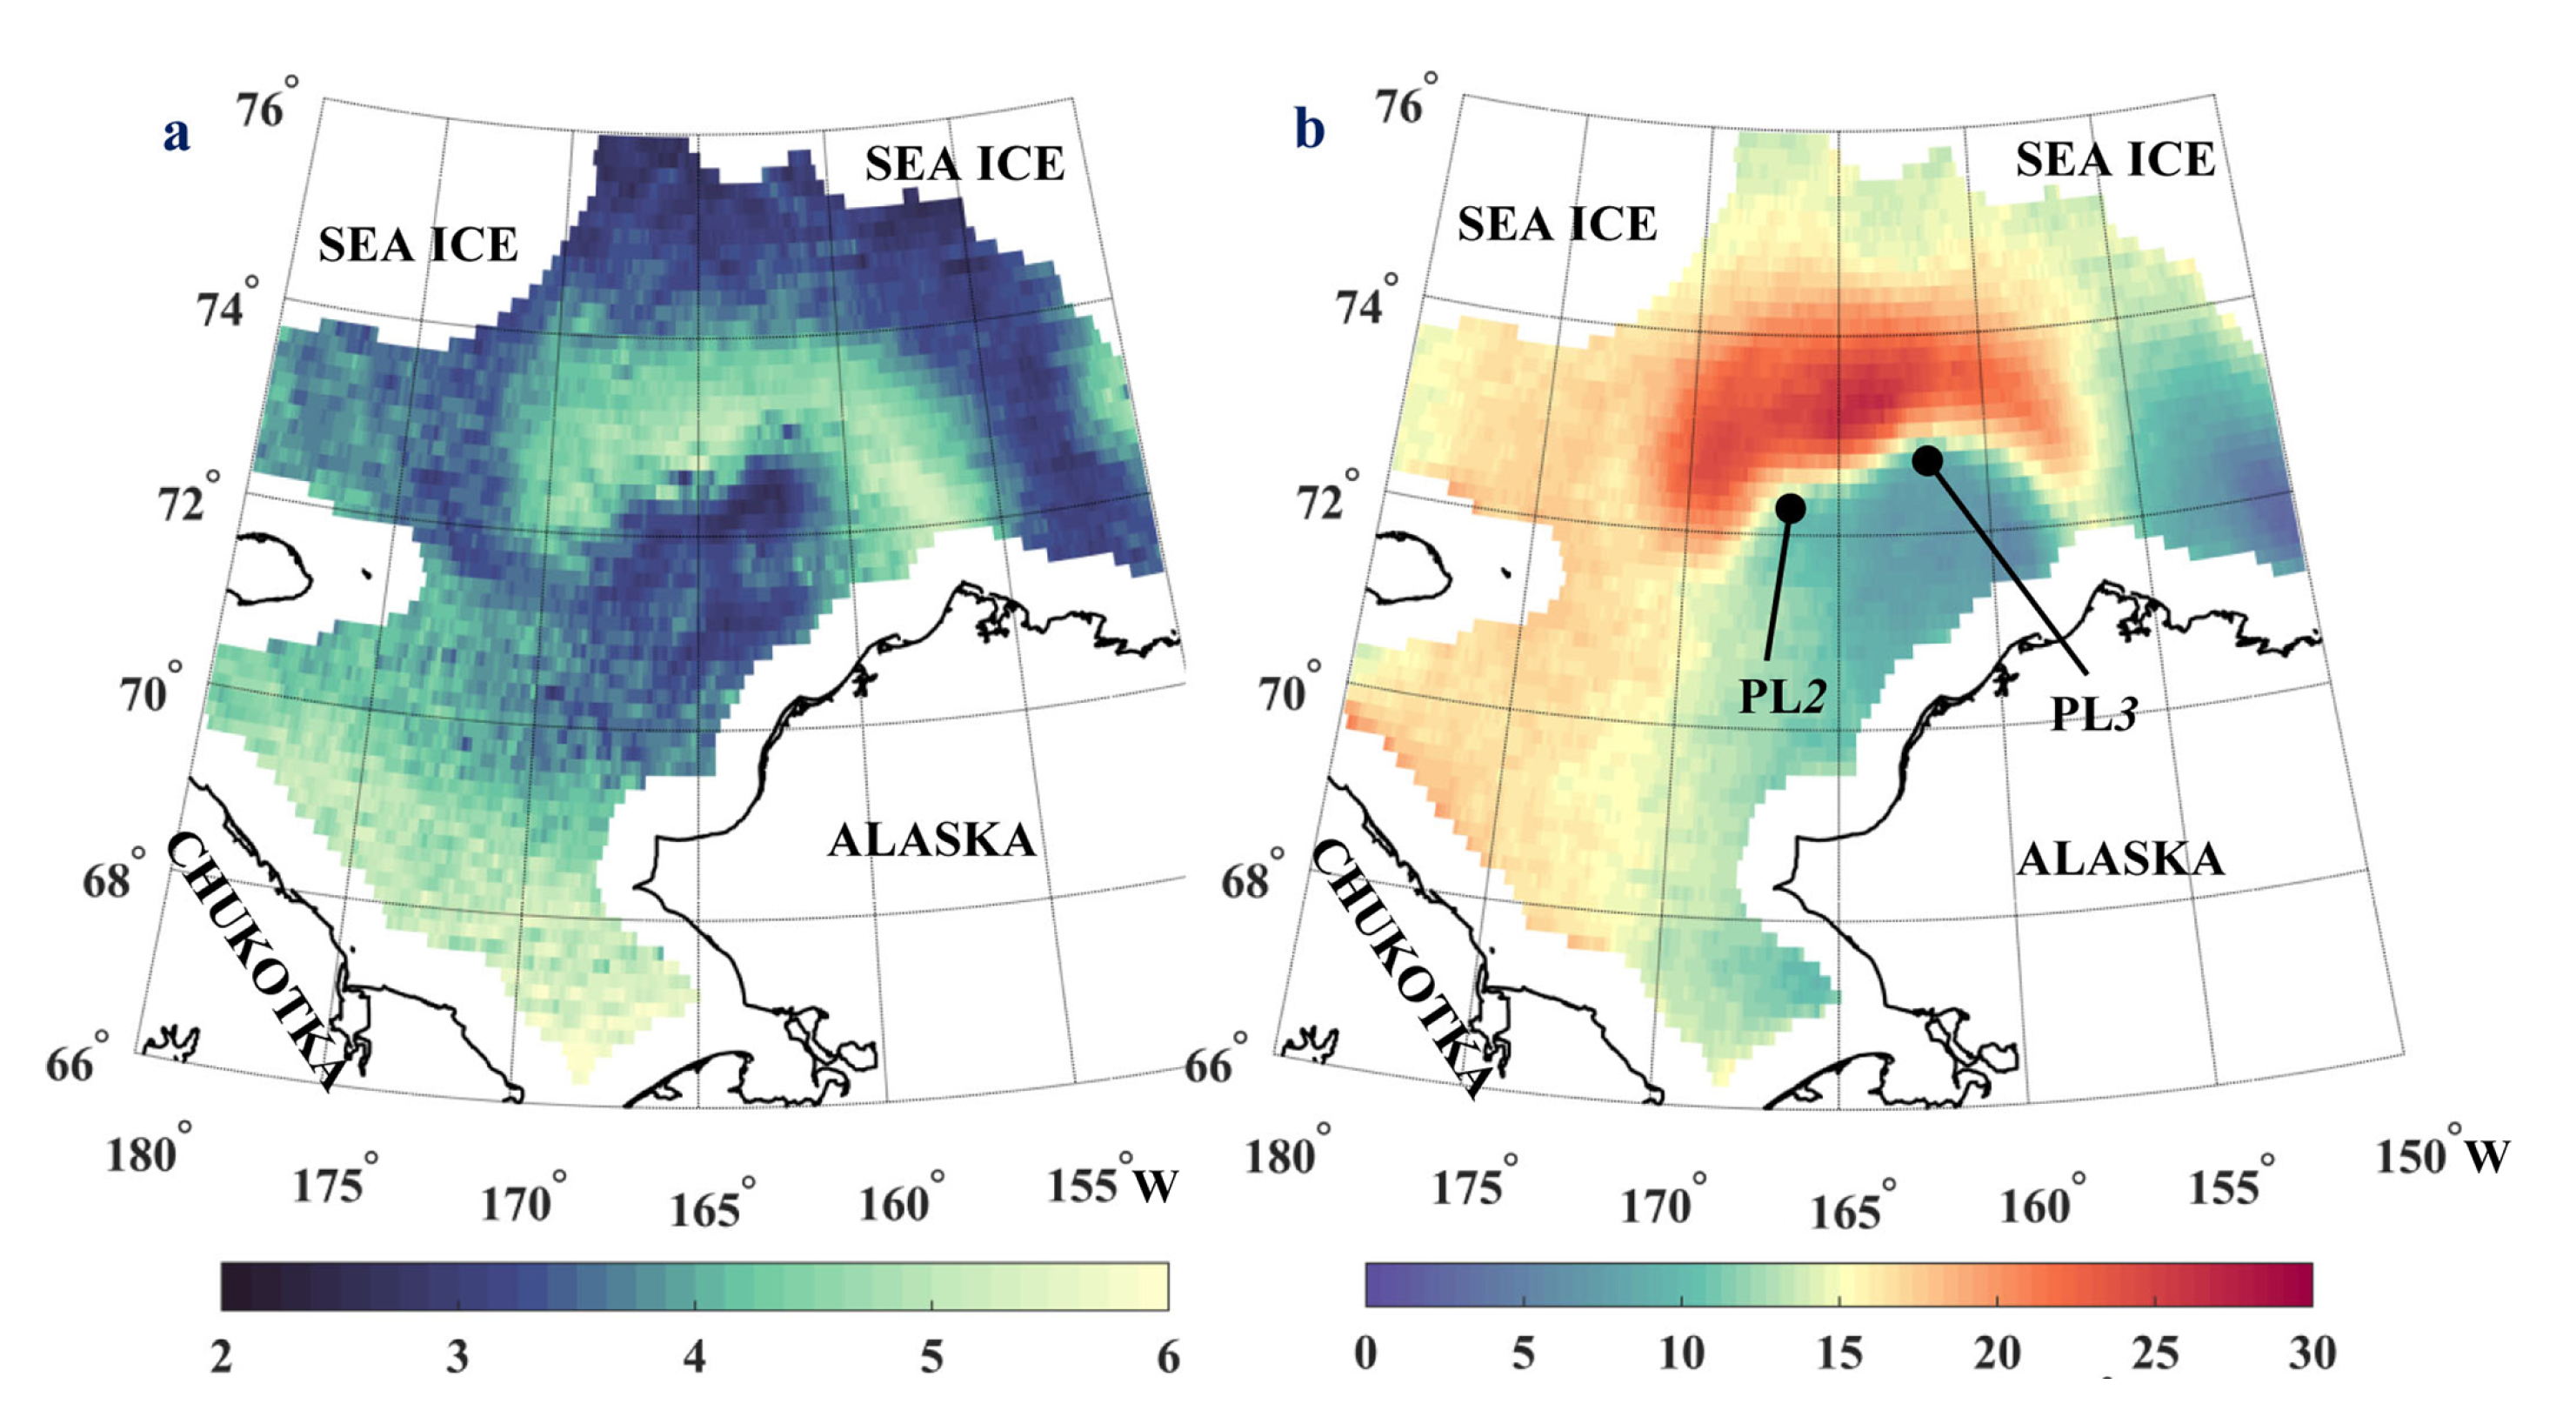
The matured PL2 and PL3 are clearly distinguished in atmospheric total water vapor content fields (V) with higher (relative to background) values up to 4–5 kg/m2 (Figure 5a), which allows V to be used in a PLs detection [45]. The maximum near-surface wind speed in the PL3 was 26–28 m/s, as retrieved from the AMSR2 measurements at 14:25 UTC (Figure 5b), and over 30 m/s as measured by the WindSAT at 18:50 UTC on October 19 (not shown). Convective cells associated with the cold-air outbreak over the Chukchi Sea in the rear of the mesocyclonic system evolved at the north winds of 13–18 m/s and increasing V: from 2–3 kg/m2—near the sea ice edge—to 5–6 kg/m2—off the coast of Chukotka. Enhanced values of V to the south are likely associated with the higher SST, providing increased latent heat fluxes from the sea surface to the atmosphere.

3.4. PL Vertical Structure from CloudSat Measurements

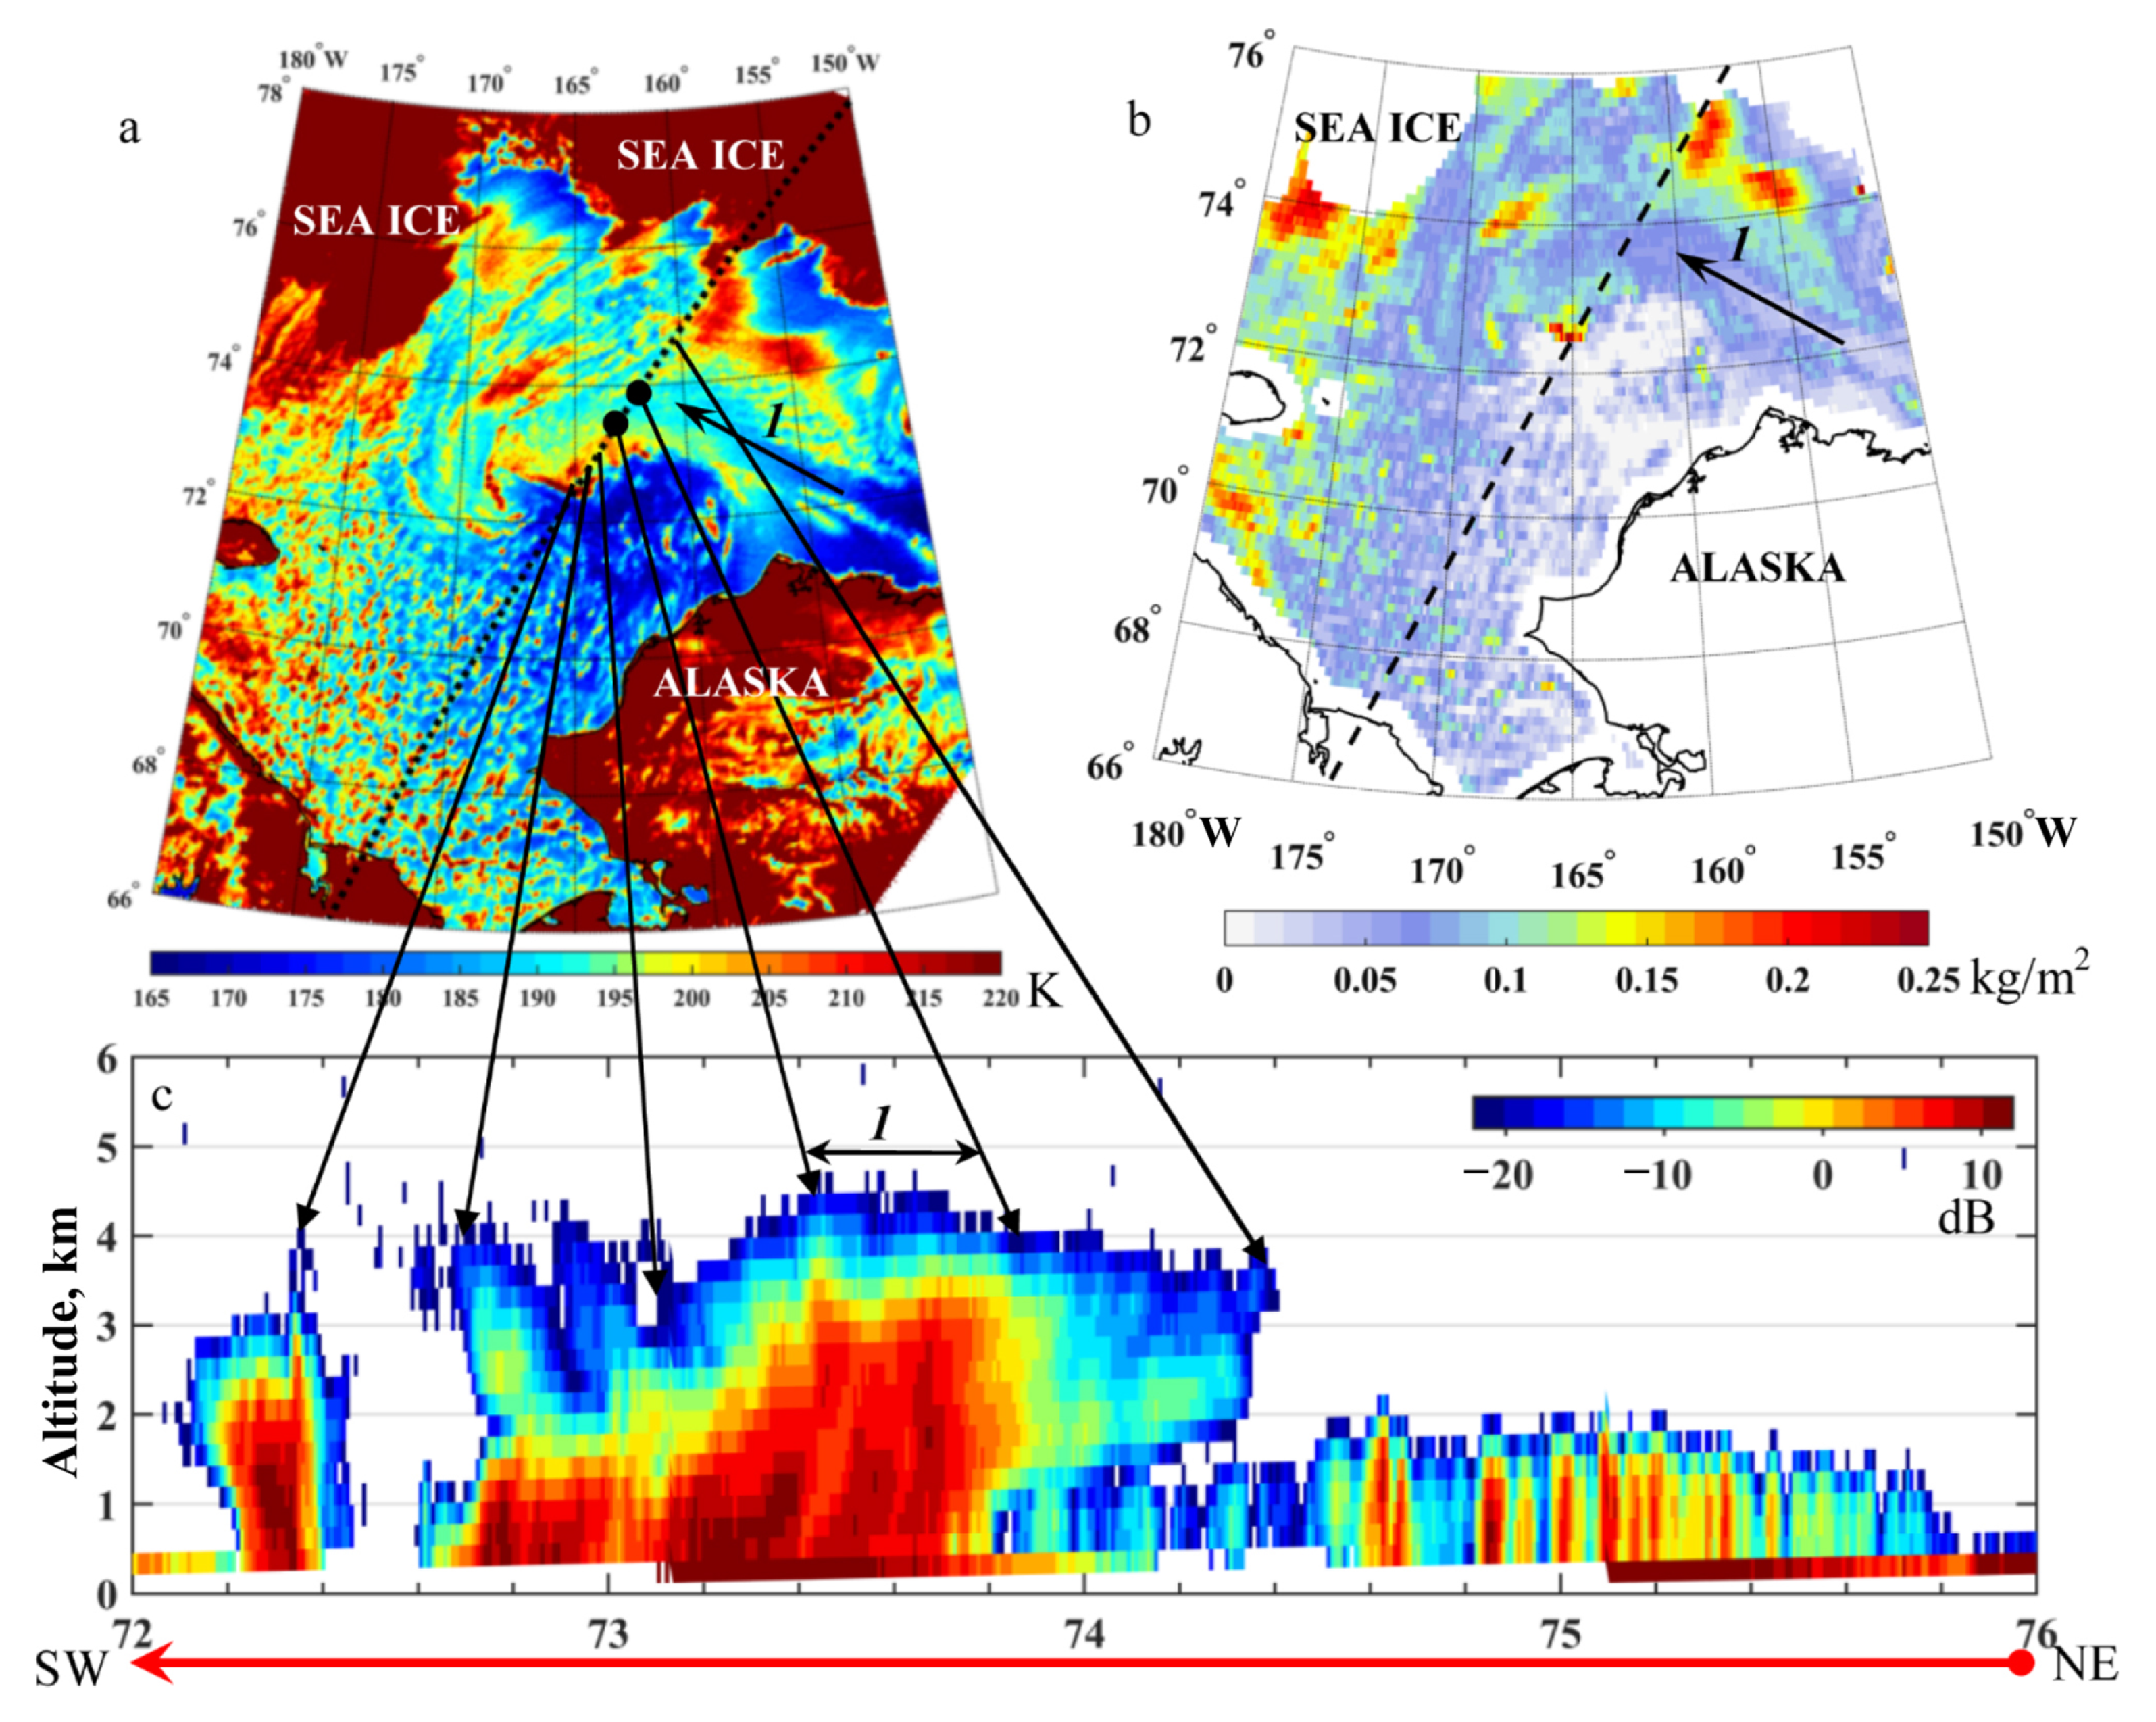
Detailed vertical structure of the PL3 cloudiness is illustrated by a cross-section of clouds radar reflectivity measured by the CPR radar onboard the CloudSat satellite at 14:34 UTC on 19 October (Figure 6c). The CPR sampled the PL3 from northeast to southwest about 25 km west of its center through the area of scattered clouds between two cloud spirals. CPR measurements are nearly synchronous with AMSR2 data at 14:25 UTC (Figure 5 and Figure 6a,b) on 19 October. The location of the cross-section line is plotted on the fields of brightness temperature Tb(89H) and total cloud liquid water content Q (Figure 6a,b). Due to the higher spatial resolution (4 km × 6 km) and the sensitivity of the measurements at a frequency of 89 GHz to variations in geophysical parameters, the Tb(89H) field provides the detailed structure of mesoscale atmospheric processes.
In the Tb(89H) and Q fields (Figure 6a,b), as well as on satellite images, two PLs and the wave structure of the PL3 inner boundary are clearly visible. The high Tb(89H) values of 200–220 K along this boundary within the 20–50 km swath correspond to vertically developed convective clouds. The Tb(89H) and Q fields illustrate the high correlation due to the sensitivity of the former to the areas of the PLs and convective cells with increased liquid water content and/or precipitations.
The CloudSat measurements show that the PL3 clouds are as high as 3 km in the south (about 72.2–72.4 N) and about 4 km in the north (72.7–74.4 N) of the cross-section (Figure 6c). It corresponds to the CloudSat measurements over the Okhotsk [33,34] and Labrador [36] Seas, where the cloud top height of 4 km was observed in the PLs. In the Sea of Japan [34], in contrast, the higher SST results in penetration of convection up to 5–6 km.
Across almost the entire vertical extent of heavy cumulus clouds, the radar echo varies from 5 to ≥10 dB, except at the cloud top, where it sharply decreases to negative values. Within the swath of ≈45 km from the inner boundary of the northern part of the PL3 (between 72.7–73.1N) cloud spiral, the maximum CPR reflectivity is concentrated below the height of ≈1.5 km with a cloud height of 4 km. Further north along the cross-section, the cloud height remained roughly the same, but the reflectivity values sharply increased to 5–10 dB up to the height of 3 km up to 73.8N. High reflectivity values correspond to the increased Tb(89H) values of 200–220 K and Q of 0.1–0.25 kg/m2. The only exception is observed for the swath marked by arrow 1 in Figure 6. Here, low values of the Tb(89H) and Q correspond to increased total water vapor content V (Figure 5b), high CPR reflectivity (≥8–10 dB) and heavy convective clouds. A similar combination of the Tb(89H), Q and CPR reflectivity values was also found in the PL over the Sea of Japan [34] and can be explained by the predominance of ice crystals in the clouds with specific microphysics properties [46,47].

3.5. Near-Surface Wind Speed Inter-Comparisons

To examine the distribution of near-surface wind speed (W) in the mesocyclonic system (PL2 and PL3) considered in this study, we compared the estimates derived from the ERA5, MERRA-2 and CFSv2 data sets with satellite observations. Using measurements of passive (AMSR2 and WindSat microwave radiometers) and active (ASCAT-A/B scatterometers) sensors enabled achieving a combined temporal resolution of fewer than 3 h for satellite data.
The time series of the median and extreme (95th percentile) wind speeds are plotted for 19 October within a 300-km radius of the PL3 center tracked from the ERA5, MERRA-2 and CFSv2 relative vorticity at 850 hPa (Figure 7). The wind speed increase corresponds to the rapid deepening of the mesocyclonic system when the SLP minimum by ERA5 representing of it core decreased to the value of 989 hPa. Figure 7a demonstrates a good agreement for the median wind speed across all reanalysis data sets. The discrepancies between the median wind speed by reanalyzes and satellites lie in the range of 2–3 m/s, which is close to satellite measurement error. Note that MERRA-2 detected PL3 only from 10:00 UTC.
The extreme wind speed is in reasonable agreement with satellite measurements in the initial and decay phases of the mesocyclonic system development. However, during the PLs mature stage from 12:00 UTC to 22:00 UTC (Figure 7a)—when the storm winds were observed—the ERA5 and MERRA-2 extreme wind speeds were significantly underestimated (up to 8 m/s) compared to satellite measurements. Simultaneously, the CFSv2 analysis reproduced the PL3 intensification in extreme wind values well. The exception is the PL’s peak intensity, for which the CFSv2 and satellite-based extreme winds discrepancy reached 5 m/s.
The ERA5, MERRA-2 and CFSv2 extreme wind speed underestimations are also identified in the probability density functions (PDFs) presenting wind speed distribution over the area within a 300-km radius of the mesocyclonic system center (Figure 7b). The wind speed corresponding to the PDF peak varies for all datasets within the range of 15–18 m/s and the highest for the satellite-based (SAT) and ERA5 winds. In the wind speed range over 22 m/s, the SAT winds have much higher probabilities than all the other data sets. The ERA5 and CFSv2 PDFs have similar distributions for values above 20 m/s with a slight shift, while the MERRA-2 has the lowest speeds in the tail of its distribution.

4. Conclusions

This work examines a series of polar lows (PLs) identified over the Chukchi and Beaufort Seas in the second half of October 2017 under anomalously low sea ice extent conditions. We combined multi-sensor satellite active and passive measurements to study the life-cycle and tracks of the PLs, the vertical and horizontal structure of cloud systems and wind conditions at various stages of its evolution. A significant part of this work is devoted to assessing the capabilities of ERA5, MERRA-2 and NCEP-CFSv2 reanalysis data sets in the PL detecting and tracking, as well as representing their intensity. This study is motivated by the fact that deriving PL climatology from multi-satellite measurements is challenging, as it would require a long record of regular, continuous and homogeneous satellite observations. With the advance of high-resolution reanalyzes, it will become possible to better reproduce the observed PLs (including severe events) and analyze their climatology.
In October 2017, the predominantly ice-free Pacific Arctic (PA) region exhibited a highest frequency of favorable conditions for PLs since 1979. The sea ice concentration map as of 19 October 2017 showed a significant northward retreat of the sea ice edge to its median position in September and October for 1981–2010. The high SST along the northwest coast of Alaska also contributed to the mesoscale cyclogenesis.
Throughout October 2017, on the visible and IR MODIS, VIIRS and AVHRR images, varying intensity mesoscale cyclones were detected over the Chukchi-Beaufort seas and the adjacent Arctic Ocean area. From 18 to 22 October, a series of mesocyclones were observed in this region, four of which, with wind speeds ≥ 15 m/s, were classified as PLs.
On 19 October 2017, the most intensive PL pair originated near the marginal ice zone north of the 73rd parallel during a marine-cold air outbreak from the central Arctic. Both PLs moved southward as a mesocyclonic system called the “merry-go-round” under the influence of the upper level low with a cold core. Multi-sensor satellite measurements indicated that, in the mature stage, the strongest PL was characterized by high winds (W) of close to hurricane force over 30 m/s, which is extremely rare for the Chukchi and Beaufort Seas. It is possible that, over the coming decades, such mesoscale processes will be observed more frequently in the PA region because of the predicted northward shift in the cold-air outbreak activity as the sea ice extent decreases [44].
A three-dimensional structure of the strongest PL (marked as PL3) was also obtained from collocated measurements of AMSR2 (GCOM-W1) and CPR (CloudSat) sensors constituting an “A-Train” satellite constellation. In the mature stage, the vertical extent of the PL3 exceeded 4 km, which is close to the typical cloud top altitude (5 km) observed for 82 PL cases in the Nordic seas [48]. Additionally, we detected a cloud band north of the PL3 eye with high CPR radar reflectivity but low retrieved cloud liquid water content. The predominance of ice crystals with specific microphysics properties may cause these discrepancies.
We compared tracks of four PLs detected from the cloud structures on satellite images and obtained from the reanalysis data sets applying two methods—based on sea level pressure and relative vorticity at 850 hPa level. All three reanalyses identified only PLs with a scale of over 220 km (PL1 and PL3). ERA5 showed the best correspondence with satellite observations in detecting the PLs center with track errors of 50–60 km. Moreover, ERA5 shows almost the same results for both PL tracking methods. The CFSv2 exhibits slightly worse results for the vorticity-based tracking algorithm (compared to the ERA5 data set), but in the SLP fields, this operational analysis represents only the most intense PL3. CFSv2, unlike the others, was able to detect a small-scale PL4 with a life-time less than 12 h in the vorticity fields, but it falsely detected two PLs with a lifetime of over 12 h that were not identified either on satellite images or in the satellite-based vector winds. We suspect that, under certain conditions, the atmospheric model component in the CFSv2 analysis generates non-existent mesoscale low-level circulations.
Near-surface wind speed distributions within the intense mesocyclonic system (PL2 and PL3) showed that the ERA5, MERRA-2 and CFSv2 data sets well reproduce the PLs median wind speed compared to satellite measurements. The extreme wind speed (95th percentile) is in reasonable agreement with satellite-based estimates in the initial and decay phases of the mesocyclonic system development. However, during the PLs mature stage—when the storm winds were observed—the ERA5 and MERRA-2 extreme winds are significantly underestimated (up to 8 m/s). CFSv2 reproduced the PL3 intensification in extreme wind values well, but at the PL’s peak intensity, the CFSv2 and satellite-based extreme winds discrepancy reached 5 m/s.
We believe that the use of the new generation reanalysis data sets for the assessment of intensity and development of PLs over the Chukchi and Beaufort Seas is conditionally justified, but the accurate and reliable representation of severe PLs is still a challenge for both weather and climate services. The advance may lie in the development of a regional reanalysis, taking into account mesoscale atmospheric and oceanic processes in the PA region.

Author Contributions

Conceptualization and design experiments, M.P. and I.G.; processing and visualization of satellite data, A.B.; I.G. analyzed the data and wrote the paper; M.P. and A.B. visualized and analyzed the data; M.P. edited and reviewed the paper. All authors have read and agreed to the published version of the manuscript.

Funding

This work was supported by the Russian state budget theme 121021500054-3 in the development of technology for multi-sensor satellite sensing of atmospheric and oceanic phenomena and by the Federal Science and Technology Program of the Russian Federation in the areas of environmental improvement and climate change for 2021–2030 (FSTP) within the project «Rationale for the Climate Monitoring System of the Far Eastern seas and Development of Methods for Monitoring Extreme Weather and Climate Ocean-Related Phenomena Based on Stationary and Mobile Measuring Complexes, as well as Multi-Sensor Satellite Sensing».

Data Availability Statement

Operational AMSR2 products are available on the Web GIS at http://siows.com/ (accessed on 15 August 2022). The AMSR2 Level 1R brightness temperatures are available on the Japan Aerospace Exploration Agency global portal system at https://gportal.jaxa.jp (accessed on 12 June 2022). The measurements of the Advanced Scatterometer (ASCAT) onboard the MetOp- A/B satellites can be accessed at https://podaac-tools.jpl.nasa.gov/drive/files (accessed on 12 June 2022). ERA5, CFSv2 and MERRA-2 hourly fields can be found at https://cds.climate.copernicus.eu/ (accessed on 12 June 2022), https://nomads.ncdc.noaa.gov/modeldata/ (accessed on 12 June 2022) and https://gmao.gsfc.nasa.gov/reanalysis/MERRA-2/data_access/ (accessed on 12 June 2022), respectively. An archive of satellite images and other processed datasets produced by the authors are available upon request.

Acknowledgments

We thank Thomas S. Spengler for useful feedback. The various remarks and comments by Kirill S. Khvorostovsky have improved this manuscript. This research was supported in part through computational resources provided by the Pacific Oceanological Institute, Vladivostok.

Conflicts of Interest

The authors declare no conflict of interest.

References

  1. Rasmussen, E.A.; Turner, J. Polar Lows: Mesoscale Weather Systems in the Polar Regions; Cambridge University Press: Cambridge, UK, 2003; p. 612. [Google Scholar]
  2. Blechschmidt, A.M.; Bakan, S.; Grabl, H. Large-scale atmospheric circulation patterns during polar low events over the Nordic seas. J. Geophys. Res. 2009, 114, D06115. [Google Scholar] [CrossRef] [Green Version]
  3. Kolstad, E.W. A global climatology of favorable conditions for polar lows. Q. J. R. Meteorol. Soc. 2011, 137, 1749–1761. [Google Scholar] [CrossRef]
  4. Condron, A.; Renfrew, I.A. The impact of polar mesoscale storms on northeast Atlantic Ocean circulation. Nat. Geosci. 2013, 6, 34–37. [Google Scholar] [CrossRef]
  5. Zahn, M.; Storch, H.V. Investigation of past and future polar low frequency in the North Atlantic. Geophys. Monogr. Ser. 2012, 196, 99–110. [Google Scholar]
  6. Ninomiya, K. Polar low development over the east coast of the Asian continent on 9–11 December 1985. J. Meteorol. Soc. Jpn. 1991, 69, 669–685. [Google Scholar] [CrossRef] [Green Version]
  7. Fu, G. Polar Lows: Intense Cyclones in Winter; China Meteorological Press: Beijing, China, 2001; p. 218. [Google Scholar]
  8. Chen, F.; Geyer, B.; Zahn, M.; Storch, H.V. Toward a Multi-Decadal Climatology of North Pacific Polar Lows Employing Dynamical Downscaling. Atmos. Ocean. Sci. 2012, 23, 291–301. [Google Scholar] [CrossRef] [Green Version]
  9. Chen, F.; Storch, H.V.; Ya, D.; Wu, L. Polar Low genesis over North Pacific under different scenarios of Global Warming. Clim. Dyn. 2014, 43, 3449–3456. [Google Scholar] [CrossRef]
  10. Yanase, W.; Niino, H.; Shun.-Ichi, I.W.; Hodges, K.; Zahn, M.; Spengler, T.; Gurvich, I. Climatology of polar lows over the Sea of Japan using the JRA-55 reanalysis. J. Clim. 2016, 29, 419–437. [Google Scholar] [CrossRef]
  11. Chen, F.; Storch, H.V. Trends and Variability of North Pacific Polar Lows. Adv. Meteorol. 2013, 2013, 1–11. [Google Scholar] [CrossRef] [Green Version]
  12. Parker, M. Polar lows in the Beaufort Sea. In Polar and Arctic Lows; Twitchell, P., Rasmussen, E., Davidson, K.L., Eds.; A. Deepak: Hampton, NY, USA, 1989; pp. 323–330. [Google Scholar]
  13. Zimich, P.I. Atmospheric Processes and Weather Eastern Arctic; Dal’nauka: Vladivostok, Russia, 1998; p. 236. (In Russian) [Google Scholar]
  14. Wang, M.; Yang, Q.; Overland, J.E.; Stabeno, P. Sea-ice cover timing in the Pacific Arctic: The present and projections to mid-century by selected CMIP5 models. Deep. Sea Res. Part II Top. Stud. Oceanogr. 2018, 152, 22–34. [Google Scholar] [CrossRef] [Green Version]
  15. Ivanov, V.V.; Alexeev, V.A.; Alexeeva, T.A.; Koldunov, N.V.; Repina, I.A.; Smirnov, A.V. Does Arctic Ocean Ice Cover Become Seasonal? Earth Obs. Remote Sens. 2013, 50–65. (In Russian) [Google Scholar]
  16. Vihma, T. Effects of Arctic Sea Ice Decline on Weather and Climate: A Review. Surv. Geophys. 2014, 35, 1175–1214. [Google Scholar] [CrossRef]
  17. Ballinger, T.J.; Lee, C.C.; Sheridan, S.C.; Crawford, A.D.; Overland, J.E.; Wang, M. Subseasonal atmospheric regimes and ocean background forcing of Pacific Arctic sea ice melt onset. Clim. Dyn. 2019, 52, 5657–5672. [Google Scholar] [CrossRef]
  18. Johnson, M.; Eicken, H. Estimating Arctic sea-ice freeze-up and break-up from the satellite record: A comparison of different approaches in the Chukchi and Beaufort Seas. Elem. Sci. Anthr. 2016, 4, 4248–4261. [Google Scholar] [CrossRef] [Green Version]
  19. Zabolotskikh, E.V.; Gurvich, I.A.; Chapron, B. New areas of polar lows over the Arctic as a result of the decrease in sea ice extent. Izv. Atmos. Ocean. Phys. 2015, 51, 1021–1033. [Google Scholar] [CrossRef]
  20. Zabolotskikh, E.V.; Gurvich, I.A.; Chapron, B. Polar Lows over the Eastern Part of the Eurasian Arctic: The Sea-Ice Retreat Consequence. Geosci. Remote Sens. Lett. 2016, 13, 1492–1496. [Google Scholar] [CrossRef] [Green Version]
  21. Pichugin, M.K.; Gurvich, I.A.; Zabolotskikh, E.V. Severe Marine Weather Systems During Freeze-Up in the Chukchi Sea: Cold-Air Outbreak and Mesocyclone Case Studies From Satellite Multisensor Measurements and Reanalysis Datasets. IEEE J. Sel. Top. Appl. Earth Obs. Remote Sens. 2019, 12, 3208–3218. [Google Scholar] [CrossRef]
  22. Heinemann, G.; Claud, C. Report of a Workshop on Theoretical and Observational Studies of Polar Lows” of the European Geophysical Society Polar Lows Working Group. Bull. Am. Meteorol. Soc. 1997, 78, 2643–2658. [Google Scholar] [CrossRef] [Green Version]
  23. Zabolotskikh, E.V.; Mitnik, L.M.; Chapron, B. New approach for severe marine weather study using satellite passive microwave sensing. Geophys. Res. Lett. 2013, 40, 3347–3350. [Google Scholar] [CrossRef] [Green Version]
  24. Mitnik, L.M.; Mitnik, M.L.; Zabolotskikh, E.V. Japan satellite GCOM-W1: Simulation, calibration and first results of the retrievals of atmospheric and oceanic parameter. Curr. Probl. Remote Sens. Earth Space 2013, 10, 135–141. [Google Scholar]
  25. Zabolotskikh, E.V.; Mitnik, L.M.; Reul, N.; Chapron, B. New possibilities for geophysical parameter retrievals opened by GCOM-W1AMSR2. IEEE J. Sel. Top. Appl. Earth Observ. Remote Sens. 2015, 8, 4248–4261. [Google Scholar] [CrossRef] [Green Version]
  26. Zabolotskikh, E.V.; Khvorostovsky, K.S.; Chapron, B. An Advanced Algorithm to Retrieve Total Atmospheric Water Vapor Content From the Advanced Microwave Scanning Radiometer Data Over Sea Ice and Sea Water Surfaces in the Arctic. IEEE Trans. Geosci. Remote Sens. 2020, 58, 3123–3135. [Google Scholar] [CrossRef]
  27. Zabolotskikh, E.; Mitnik, L.; Chapron, B. GCOM-W1 AMSR2 and MetOp-A ASCAT wind speeds for the extratropical cyclones over the North Atlantic. Remote Sens. Environ. 2014, 147, 89–98. [Google Scholar] [CrossRef]
  28. Wentz, F.J.; Ricciardulli, L.; Gentemann, C.; Meissner, T.; Hilburn, K.A.; Scott, J. Remote Sensing Systems Coriolis WindSat. 2013. Available online: https://www.remss.com/missions/windsat (accessed on 1 June 2022).
  29. Manaster, A.; Ricciardulli, L.; Meissner, T. Validation of High Ocean Surface Winds from Satellites Using Oil Platform Anemometers. J. Atmos. Ocean. Technol. 2019, 36, 803–818. [Google Scholar] [CrossRef]
  30. Portabella, M.; Stoffelen, A.; Lin, W.; Turiel, A.; Verhoef, A.; Verspeek, J.; Ballabrera-Poy, J. Rain effects on ASCAT-retrieved winds: Toward an improved quality control. IEEE Trans. Geosci. Remote Sens. 2012, 50, 2495–2506. [Google Scholar] [CrossRef]
  31. Pineau-Guillou, L.; Ardhuin, F.; Bouin, M.N.; Redelsperger, J.L.; Chapron, B.; Bidlot, J.R.; Quilfen, Y. Strong winds in a coupled wave-atmosphere model during a North Atlantic storm event: Evaluation against observations. Q. J. R. Meteorol. Soc. 2018, 144, 317–332. [Google Scholar] [CrossRef] [Green Version]
  32. Stephens, G.L.; Coauthors. The CloudSat mission: Performance and early science after the first year of operation. J. Geophys. Res. 2008, 113, D00A18. [Google Scholar] [CrossRef]
  33. Gurvich, I.A.; Mitnik, L.M.; Mitnik, M.L.; Pichugin, M. Multisensory satellite study of mesoscale cyclones over the Northern Pacific. In Proceedings of the 92nd American Meteorological Society Annual Meeting, New Orleans, LA, USA, 22–26 January 2012; pp. 13–22. Available online: https://ams.confex.com/ams/92Annual/webprogram/Manuscript/Paper195196/AMS_manuscrip_22Feb.pdf (accessed on 1 January 2020).
  34. Gurvich, I.A.; Pichugin, M.K. Research of characteristics of intensive mesoscale cyclones over the Far Eastern Seas on the basis of satellite multisensor sounding. Curr. Probl. Remote Sens. Earth Space 2013, 10, 51–59. [Google Scholar]
  35. Forsythe, J.M.; Haynes, J.M. CloudSat observes a Labrador Sea polar low. Bull. Am. Meteorol. Soc 2015, 96, 1229–1231. [Google Scholar] [CrossRef]
  36. Sergeev, D.E.; Renfrew, J.A.; Spengler, T.; Dorling, S.R. Structure of a shear. J. R. Meteorol. Soc. 2017, 143, 12–26. [Google Scholar] [CrossRef] [Green Version]
  37. Hersbach, H.; Bell, B.; Berrisford, P. The ERA5 global reanalysis. Q. J. R. Meteorol. Soc. 2020, 146, 1999–2049. [Google Scholar] [CrossRef]
  38. Saha, S.; Coauthors. The NCEP Climate Forecast System Version 2. J. Clim. 2014, 27, 2185–2208. [Google Scholar] [CrossRef]
  39. Gelaro, R.; Moorthi, S.; Wu, X.; Wang, J.; Nadiga, S.; Tripp, P.; Behringer, D.; Hou, Y.; Chuang, H.; Iredell, M.; et al. The Modern-Era Retrospective Analysis for Research and Applications. J. Clim. 2017, 30, 5419–5454. [Google Scholar] [CrossRef] [PubMed]
  40. Zappa, G.; Shaffrey, L.; Hodges, K. Can polar lows be objectively identified and tracked in the ECMWF operational analysis and the ERA-Interim reanalysis? Mon. Weather Rev. 2014, 142, 2596–2608. [Google Scholar] [CrossRef]
  41. Verezemskaya, P.; Tilinina, N.; Gulev, S.; Renfrew, I.A.; Lazzara, M. Southern Ocean mesocyclones and polar lows from manually tracked satellite mosaics. Geophys. Res. Lett. 2017, 44, 7985–7993. [Google Scholar] [CrossRef] [Green Version]
  42. Zahn, M.; Storch, H.V. Tracking polar lows in CLM. Meteorol. Z. 2008, 17, 445–453. [Google Scholar] [CrossRef]
  43. Tachibana, Y.; Komatsu, K.K.; Alexeev, V.A.; Cai, L.; Ando, Y. Warm hole in Pacific Arctic sea ice cover forced mid-latitude Northern Hemisphere cooling. Sci. Rep. 2019, 9, 5567. [Google Scholar] [CrossRef] [Green Version]
  44. Landgren, O.A.; Seierstad, I.A.; Iversen, T. Projected future changes in Marine Cold-Air Outbreaks associated with Polar Lows in the Northern North-Atlantic Ocean. Clim. Dyn. 2019, 53, 2573–2585. [Google Scholar] [CrossRef] [Green Version]
  45. Smirnova, J.E.; Golubkin, P.A.; Bobylev, L.P.; Zabolotskikh, E.V.; Chapron, B. Polar low climatology over the Nordic and Barents seas based on satellite passive microwave data. Geophys. Res. Lett. 2015, 42, 5603–5609. [Google Scholar] [CrossRef] [Green Version]
  46. Matrosov, S.Y. Potential for attenuation-based estimations of rainfall rate from CloudSat. Geophys. Res. Lett. 2007, 34, 5817. [Google Scholar] [CrossRef] [Green Version]
  47. Matrosov, S.Y. Observations of wintertime U.S. West Coast precipitating systems with W-Band Satellite Radar and other spaceborne instruments. J. Hydrometeorol. 2012, 13, 223–238. [Google Scholar] [CrossRef]
  48. Listowski, C.; Rojo, M.; Claud, C.; Delanoë, J.; Rysman, J.F.; Cazenave, Q.; Noer, G. New insights into the vertical structure of clouds in Polar Lows, using Radar-Lidar satellite observations. Geophys. Res. Lett. 2020, 47, e2020GL088785. [Google Scholar] [CrossRef]
Figure 1. Sea ice concentration on 19 October 2017 (a): September (red dotted line) and October (black dotted line) median sea ice edge for 1981–2010 obtained from the National Snow and Ice Data Center (NSIDC) Sea Ice Index, version 3; frequency of favorable conditions for mesoscale cyclogenesis in October 2017 (as a percentage of the month length) (b). Hatching areas recorded the highest frequency since 1979. The red circles on (b) indicate the location of the PLs formation areas as detected on satellite images: 1—20:16 UTC, October 17, 2—1:59 UTC, October 19, 3—4:23 UTC, October 19, 4—5:02 UTC, October 22.
Remotesensing 15 00120 g001
Figure 2. PL1 (circles), PL2 (triangles), PL3 (asterisks) and PL4 (diamonds) tracks: obtained from satellite measurements (black); derived from ERA5 (red), MERRA-2 (yellow) and CFSv2 (blue) relative vorticity at 850 hPa (a) and SLP (b) fields. The sea surface temperature field (color) is for 19 October 2017.
Remotesensing 15 00120 g002
Figure 3. The geopotential heights (dm; black dotted lines) and air temperature (°C, shading) from the ERA5 reanalysis for 500 hPa (left column) and 850 hPa (right column) at 23:00 UTC, 18 October (a,b), 14:00 UTC (c,d) and 23:00 UTC (e,f) of 19 October 2017. Red dotted lines outline areas with a difference of 40 °K and 45 °K between the SST and air temperature at the 500 hPa level.
Remotesensing 15 00120 g003
Figure 4. PLs evolution on IR images obtained from: the AVHRR at 04:45 UTC (a) and VIIRS at 12:05 UTC (b), 17:05 UTC (c) and 22:05 UTC (d) on 19 October 2017. The red dotted lines are the SLP fields by ERA5. The red and black arrows indicate the genesis areas of PL2 and PL3, respectively.
Remotesensing 15 00120 g004
Figure 5. PL pair in the fields of (a) atmospheric total water vapor content (kg/m2) and (b) near-surface wind speed (m/s) retrieved from the AMSR2 measurements at 14:25 UTC on 19 October 2017. Black dots on (b) indicate the PL2 and PL3 centers.
Remotesensing 15 00120 g005
Figure 6. The brightness −175 temperature fields at the 89 GHz frequency in horizontal polarisation (a) and the total cloud liquid water content (b) from the AMSR2 measurements at 14:25 UTC, and vertical cross-section of the clouds close to the PL3 center from the CPR measurements at 14:34 UTC (c) on 19 October 2017. The arrows on (a) indicate segments of the cross-section on (c).
Remotesensing 15 00120 g006
Figure 7. The surface wind speed (m/s) in the mature PL3 derived from the satellite measurements and ERA5 (red), MERRA-2 (green) and the CFSv2 (blue) data sets for the median (solid lines) and extreme (dotted lines) winds (a); probability density function and box plots of the ERA5 (red), MERRA-2 (green), CFSv2 (blue) and satellite-based (black) wind speed within a 300-km radius of the PL center (b). Black circles and triangles on (a)—the median and extreme values of the satellite wind, respectively. The whiskers indicate the 5th–95th percentile range; the median and average are marked in the boxes with vertical bars and plus signs, respectively.
Remotesensing 15 00120 g007
Table 1. PL track errors (km) for ERA5, MERRA-2 and CFSv2 data sets compared to satellite observations. *—the “+” symbol indicates that the PL4 has been identified, but the track error is omitted because of the limited number of points matched in time.
PLsERA5CFSv2MERRA-2
ζ 850 -based tracking algorithm
PL1506090
PL2---
PL3607080
PL4-+ *-
SLP-based tracking algorithm
PL160-90
PL2---
PL3609090
PL4---
Disclaimer/Publisher’s Note: The statements, opinions and data contained in all publications are solely those of the individual author(s) and contributor(s) and not of MDPI and/or the editor(s). MDPI and/or the editor(s) disclaim responsibility for any injury to people or property resulting from any ideas, methods, instructions or products referred to in the content.