
Landslide Susceptibility Assessment Model Construction Using Typical Machine Learning for the Three Gorges Reservoir Area in China

 ,
,  , , , ,
Abstract
:1. Introduction
2. Materials
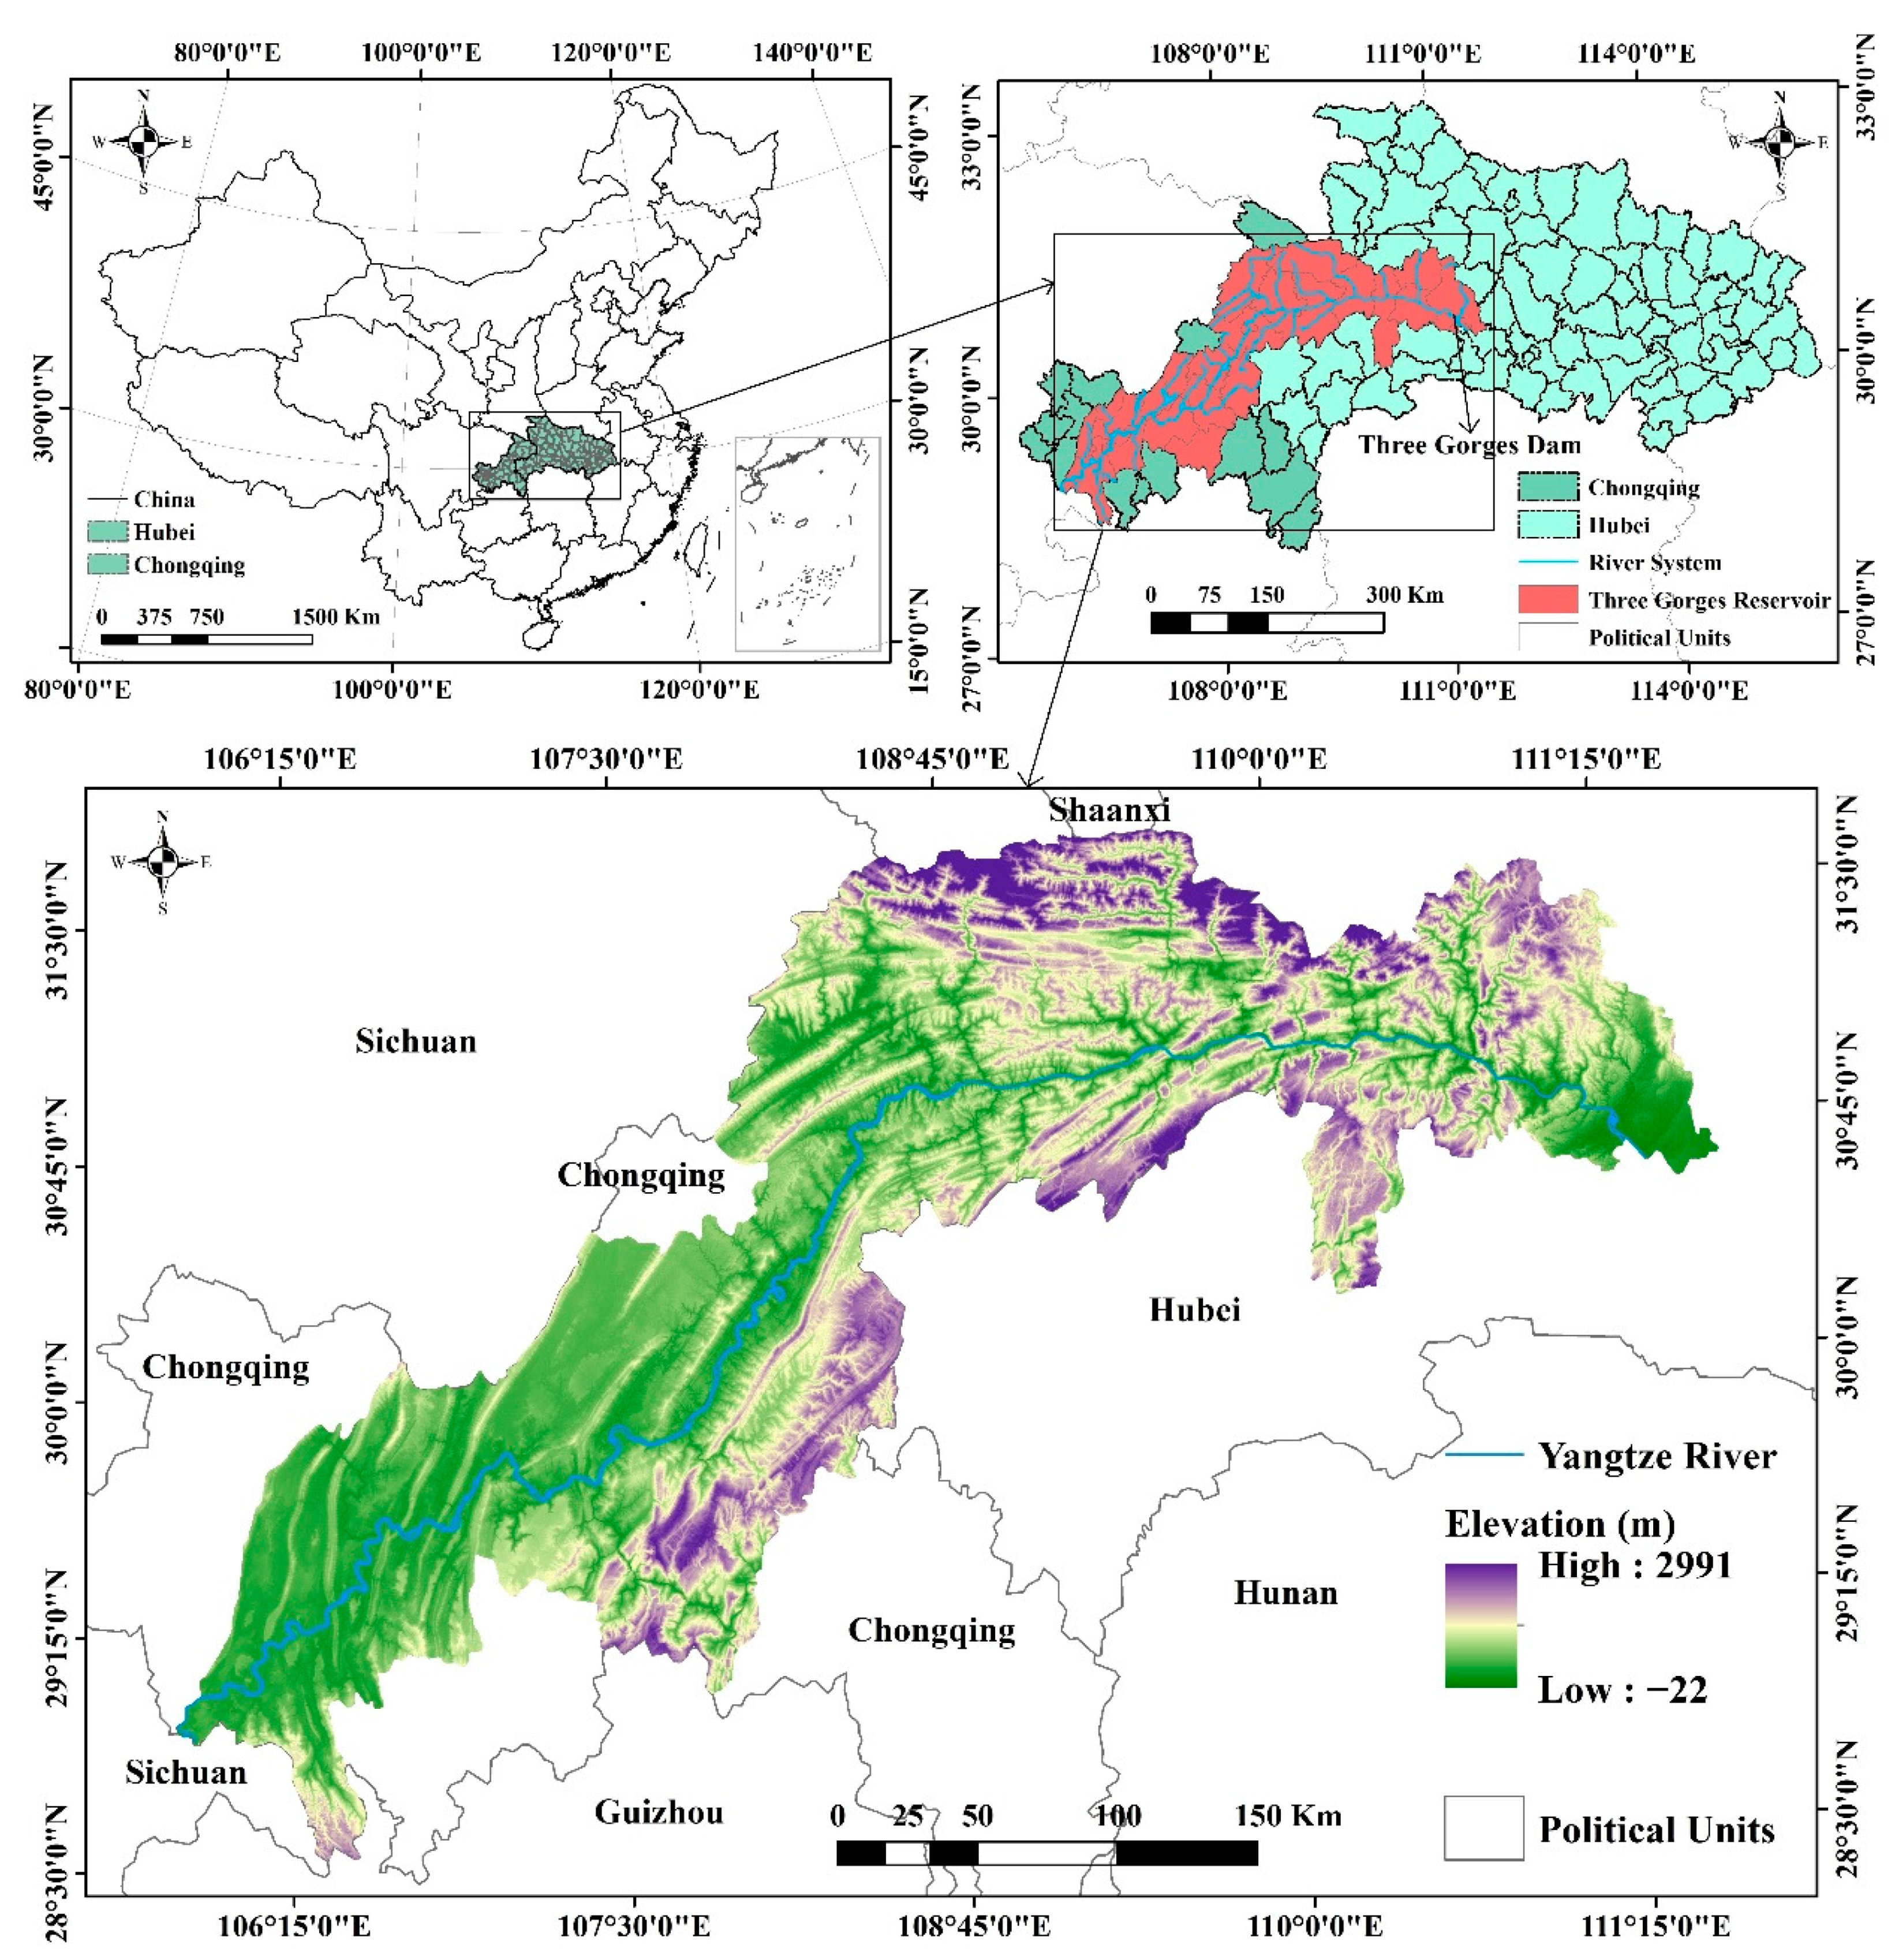
2.1. Study Area
2.2. Database
2.2.1. Landslide Dataset
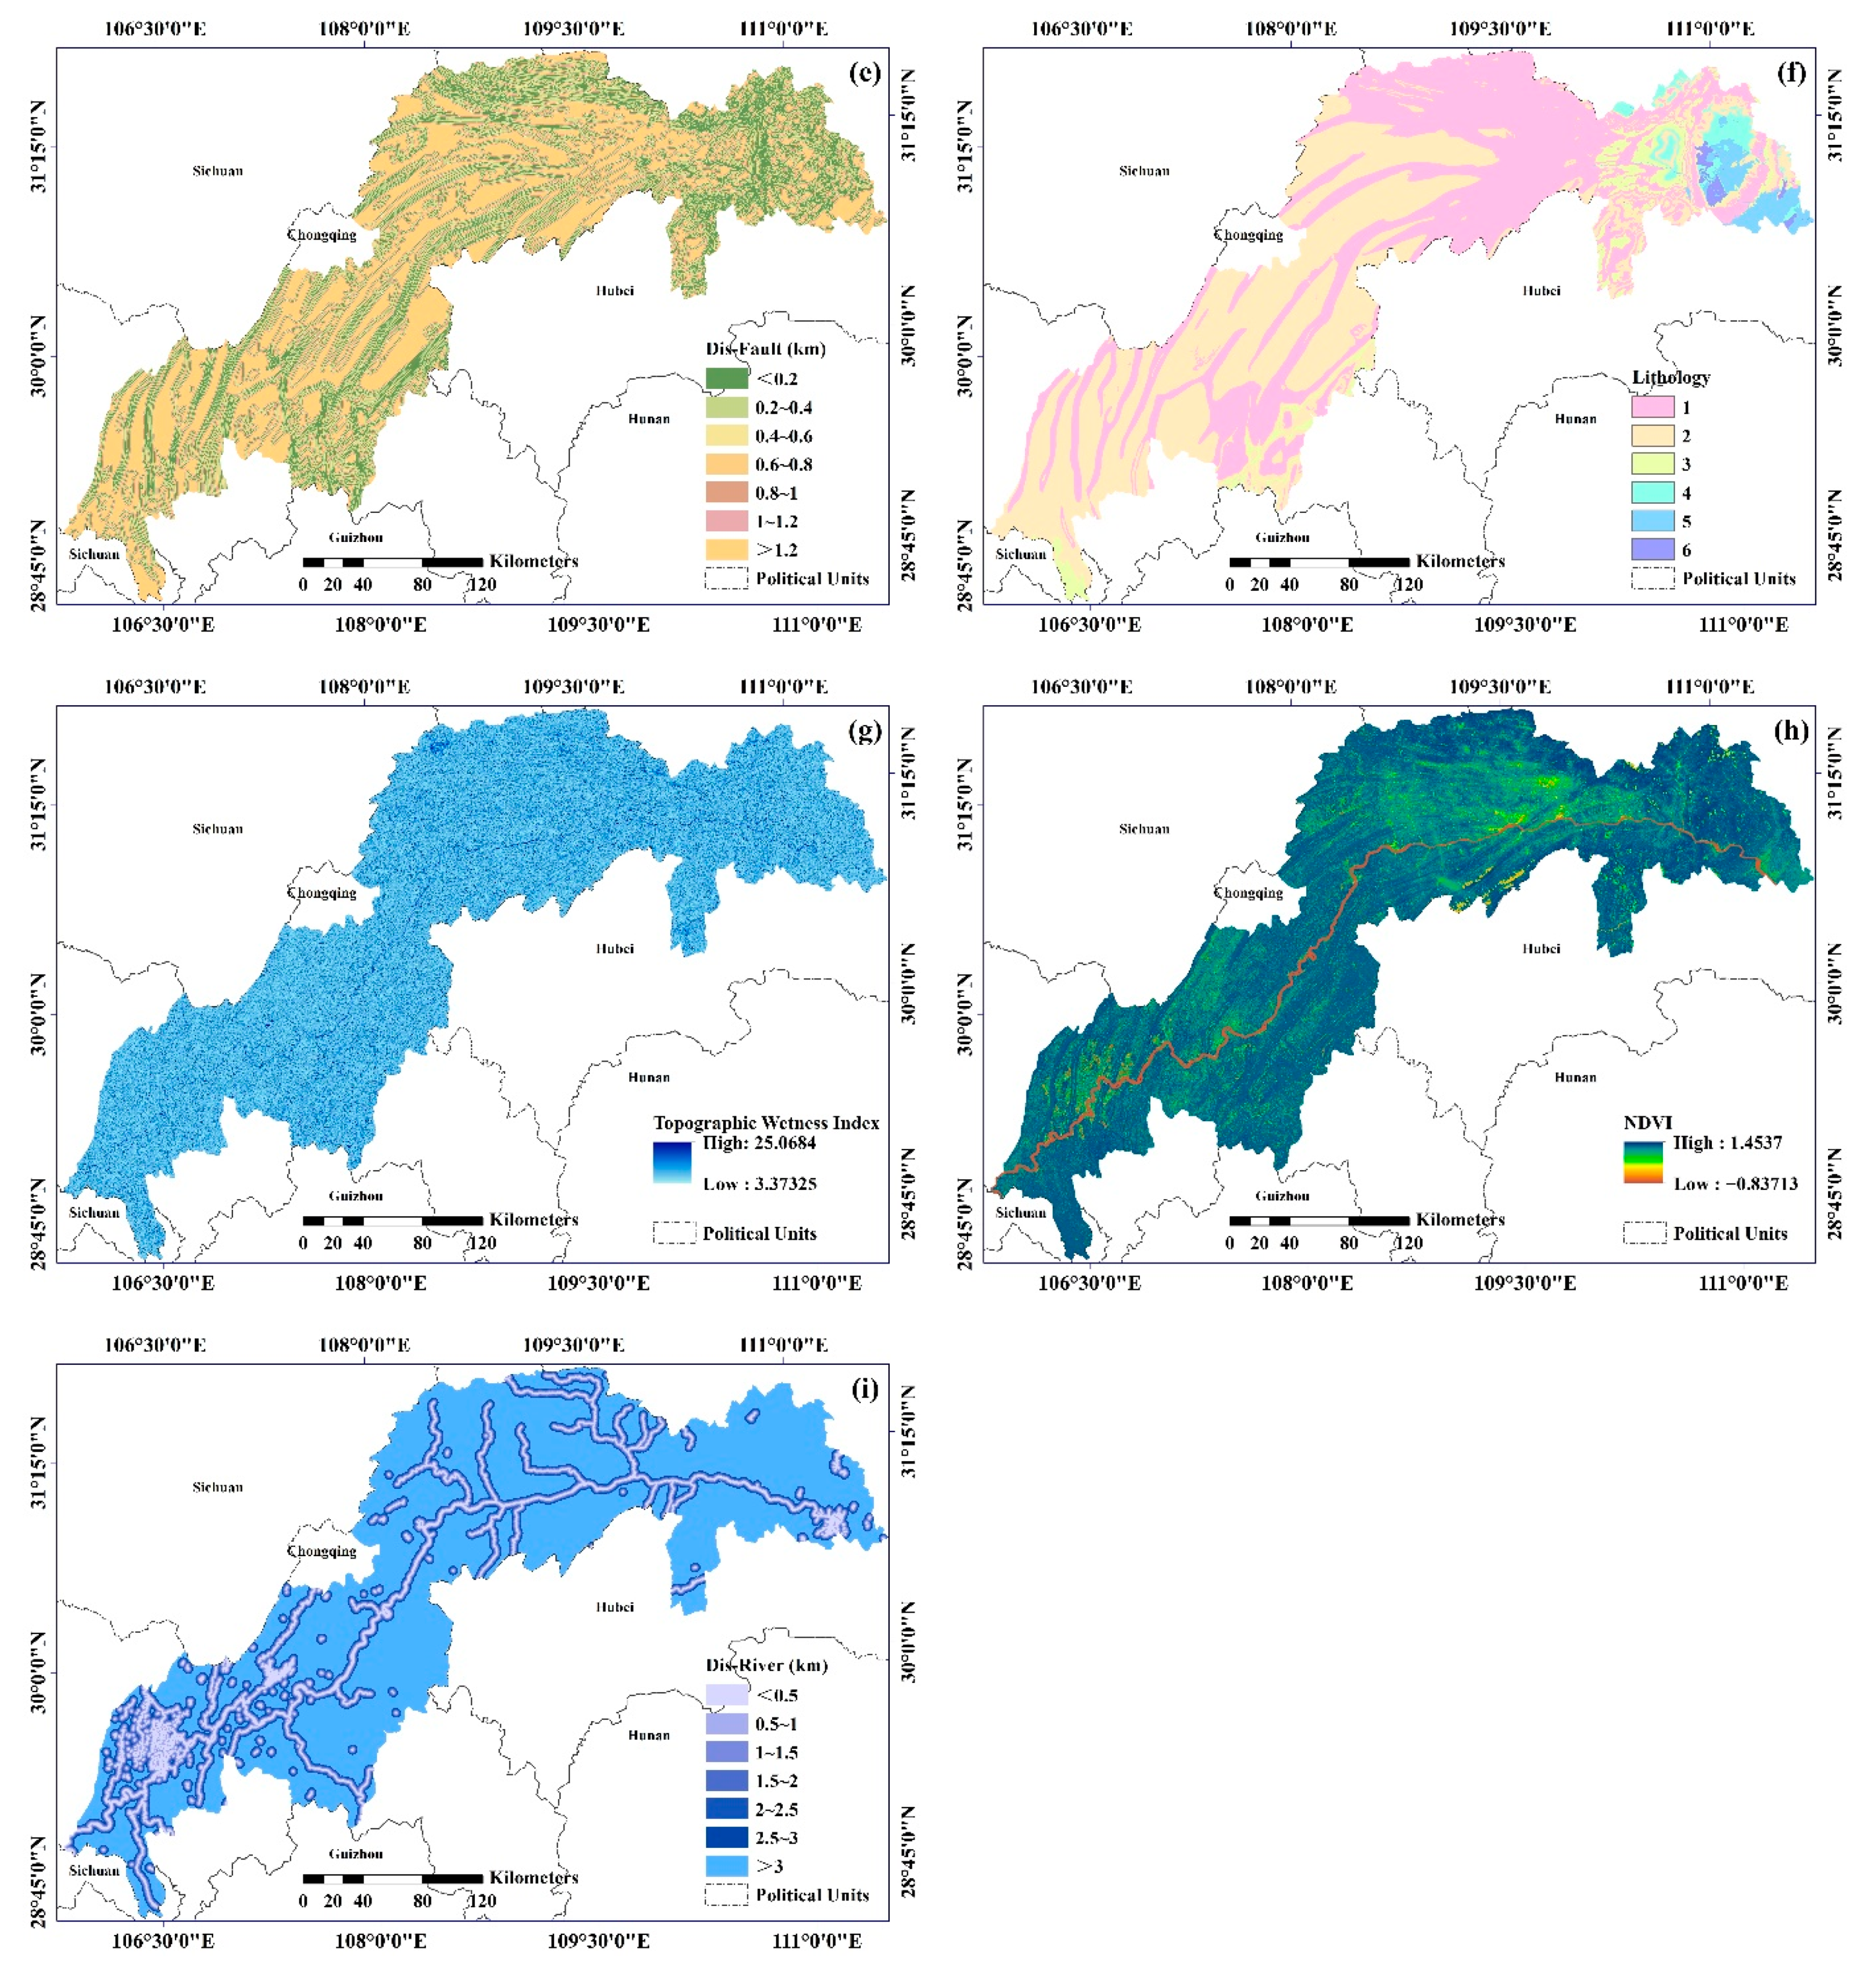
2.2.2. Assessment Indicator Data of Landslide Susceptibility

| Data Type | Factors | Causes of Selecting the Parameters |
|---|---|---|
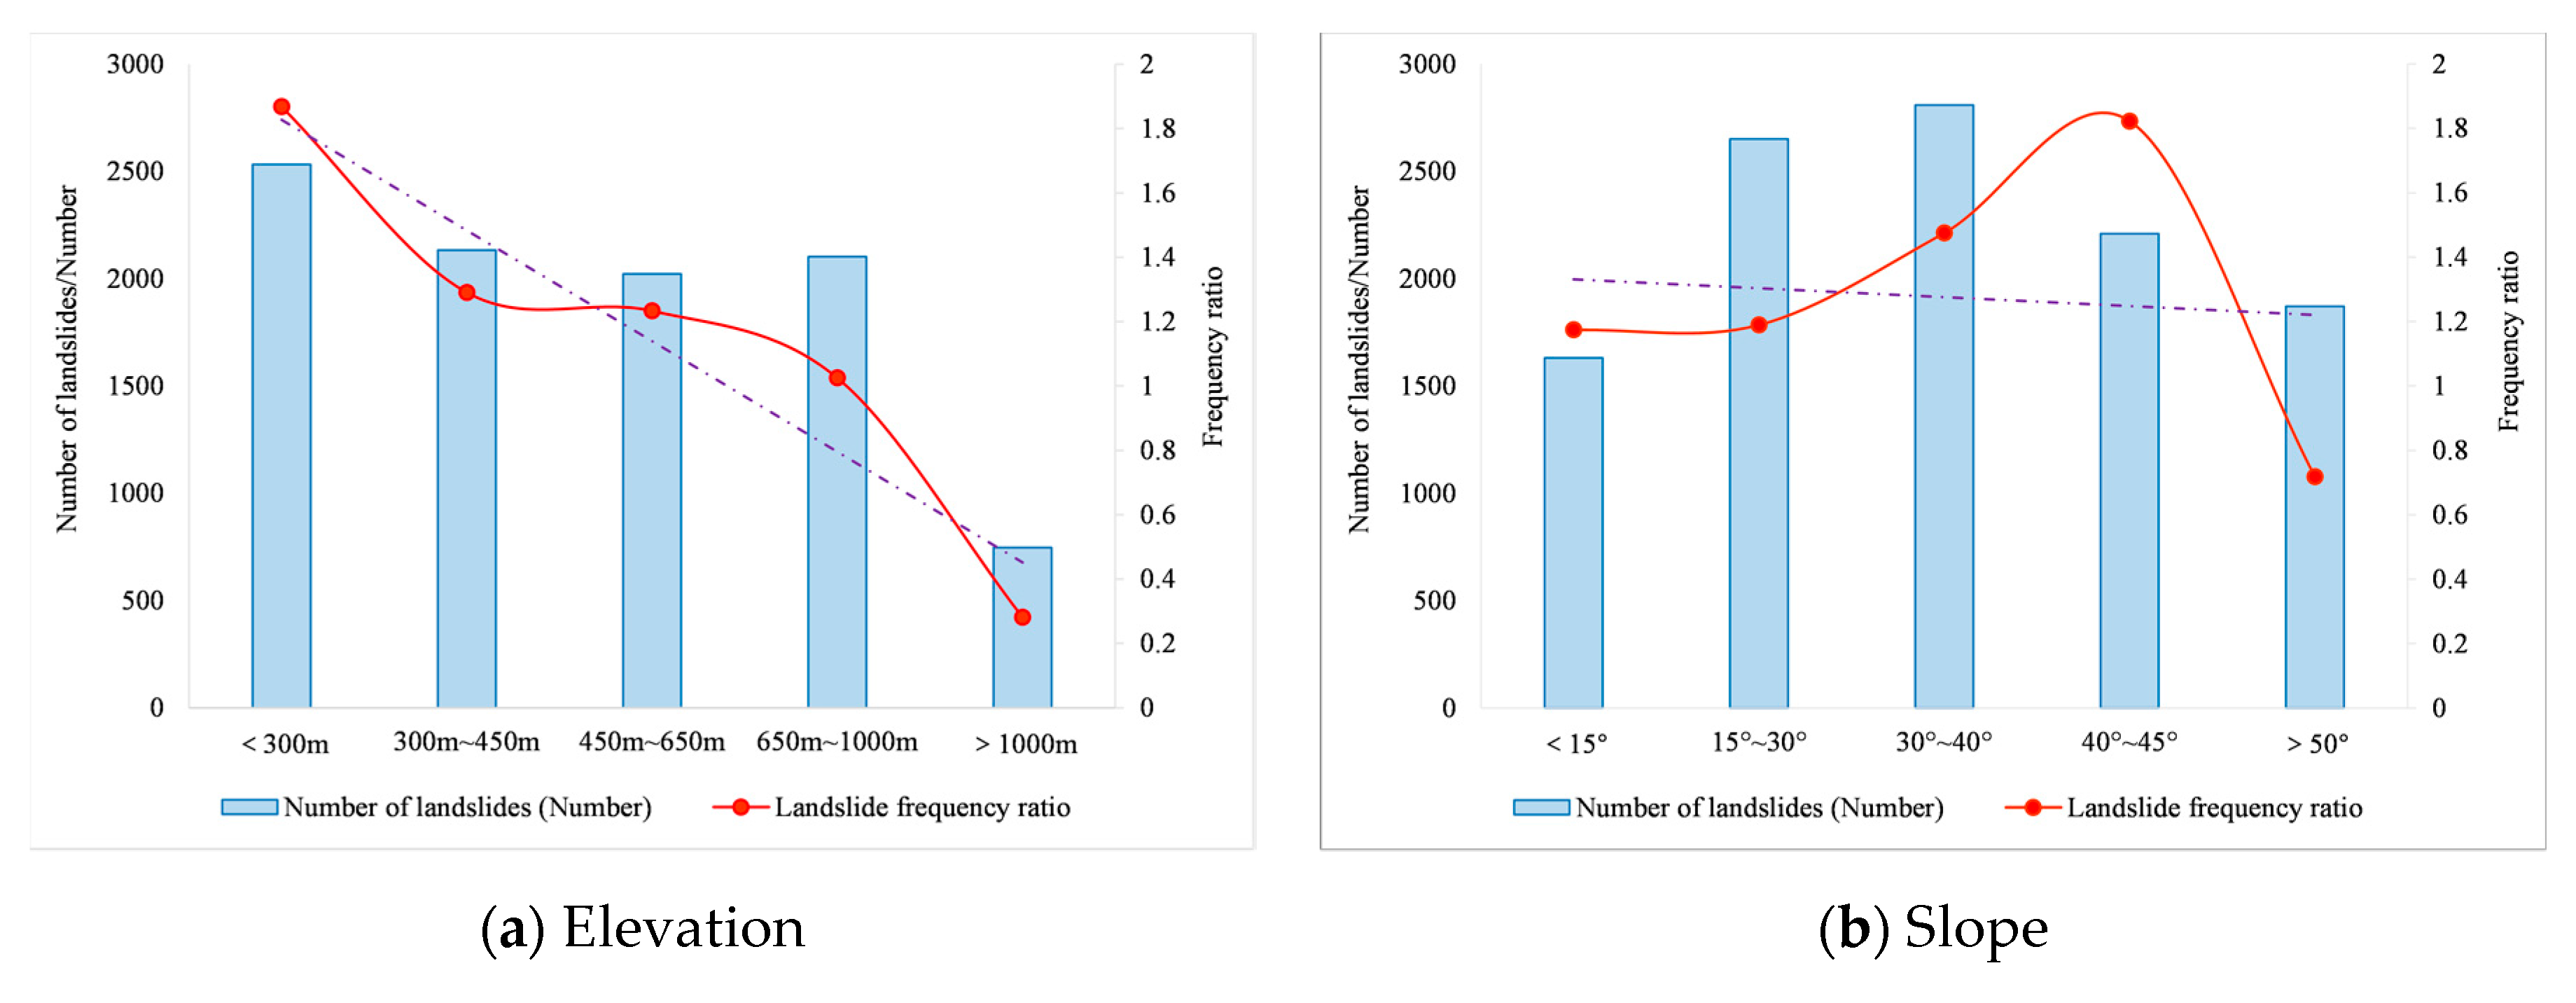
| Topographic | Elevation | Landslides are more probable on high slopes than on low slopes in mountainous landscapes [53]. |
| Slope | Slope is crucial in preventing landslides in a given location. The susceptibility to landslides is very high in areas with steep slopes [54]. | |
| Terrain Ruggedness Index (TRI) | The TRI reflects changes in surface relief and erosion [55]. | |
| Slope Length (LS) | Different slope length indicators have varying degrees of influence on landslide incidence [54]. | |
| Curvature | The chances of landslides decrease as the curvature value decreases [56]. | |
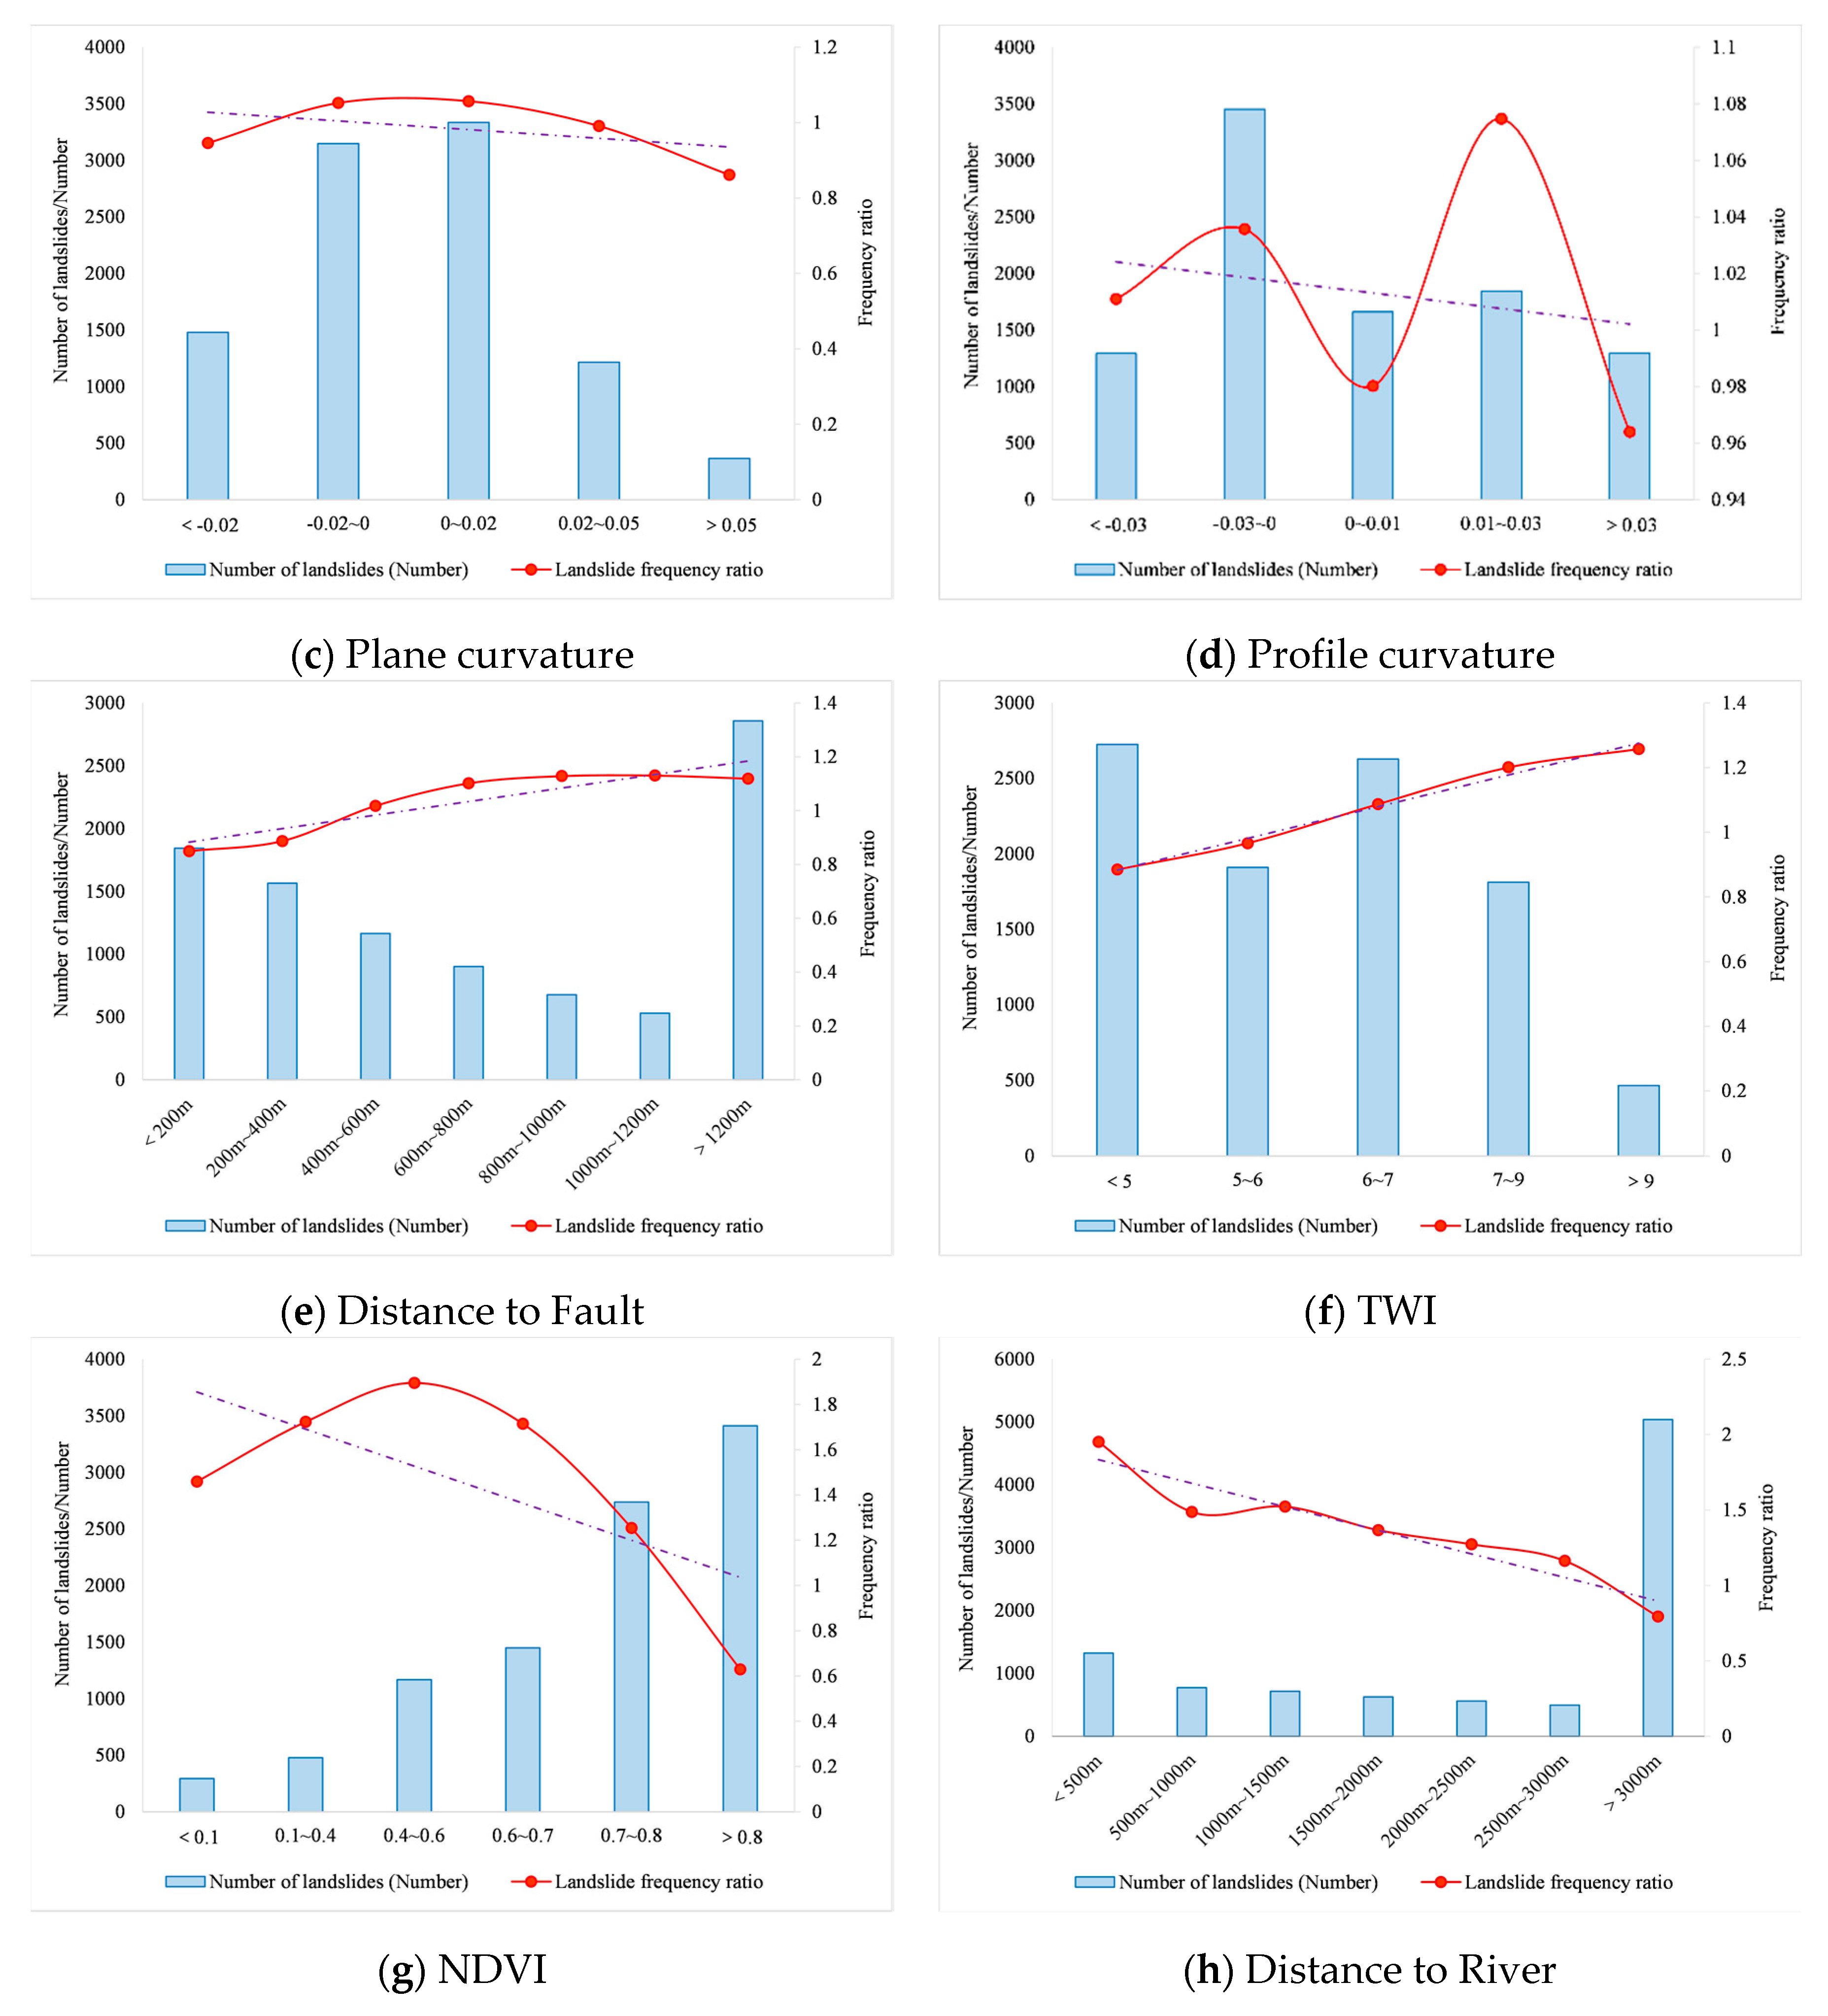
| Plan Curvature | The amount of divergence and convergence in the direction of water flow on the slope determines the plan curvature. It impacts the rate at which water flows downward, erosion and deposition processes, and consequently the occurrence of landslides. | |
| Profile Curvature | Profile curvature directs the water flow in the slope, converging or diverging, and impacts the landslide sliding. | |
| Topographic Wetness Index (TWI) | TWI indicates the moisture content of the soil. Areas with high humidity and suitable conditions are prone to landslides [57,58]. | |
| Geological | Distance to Fault | The frequency of landslides is relatively high around extremely active fracture zones [59]. |
| Lithology | Landslide sensitivity varies based on the lithological character of the area [60]. | |
| Distance to River | The more distant the area from the river, the less frequent the landslides [61]. | |
| Ecological | Normalized Difference Vegetation Index (NDVI) | It directly affects the degree of slope transformation and soil erosion [62]. |
| Meteorological | Precipitation | Precipitation is one of the critical triggering factors that induce landslides. Heavy precipitation effectively separates soil and rock, increasing the risk of landslides [53]. |
| Human Engineering Activity | Distance to Road | Road construction makes the side slopes unstable and is one of the primary triggers of landslides [63] |
3. Method
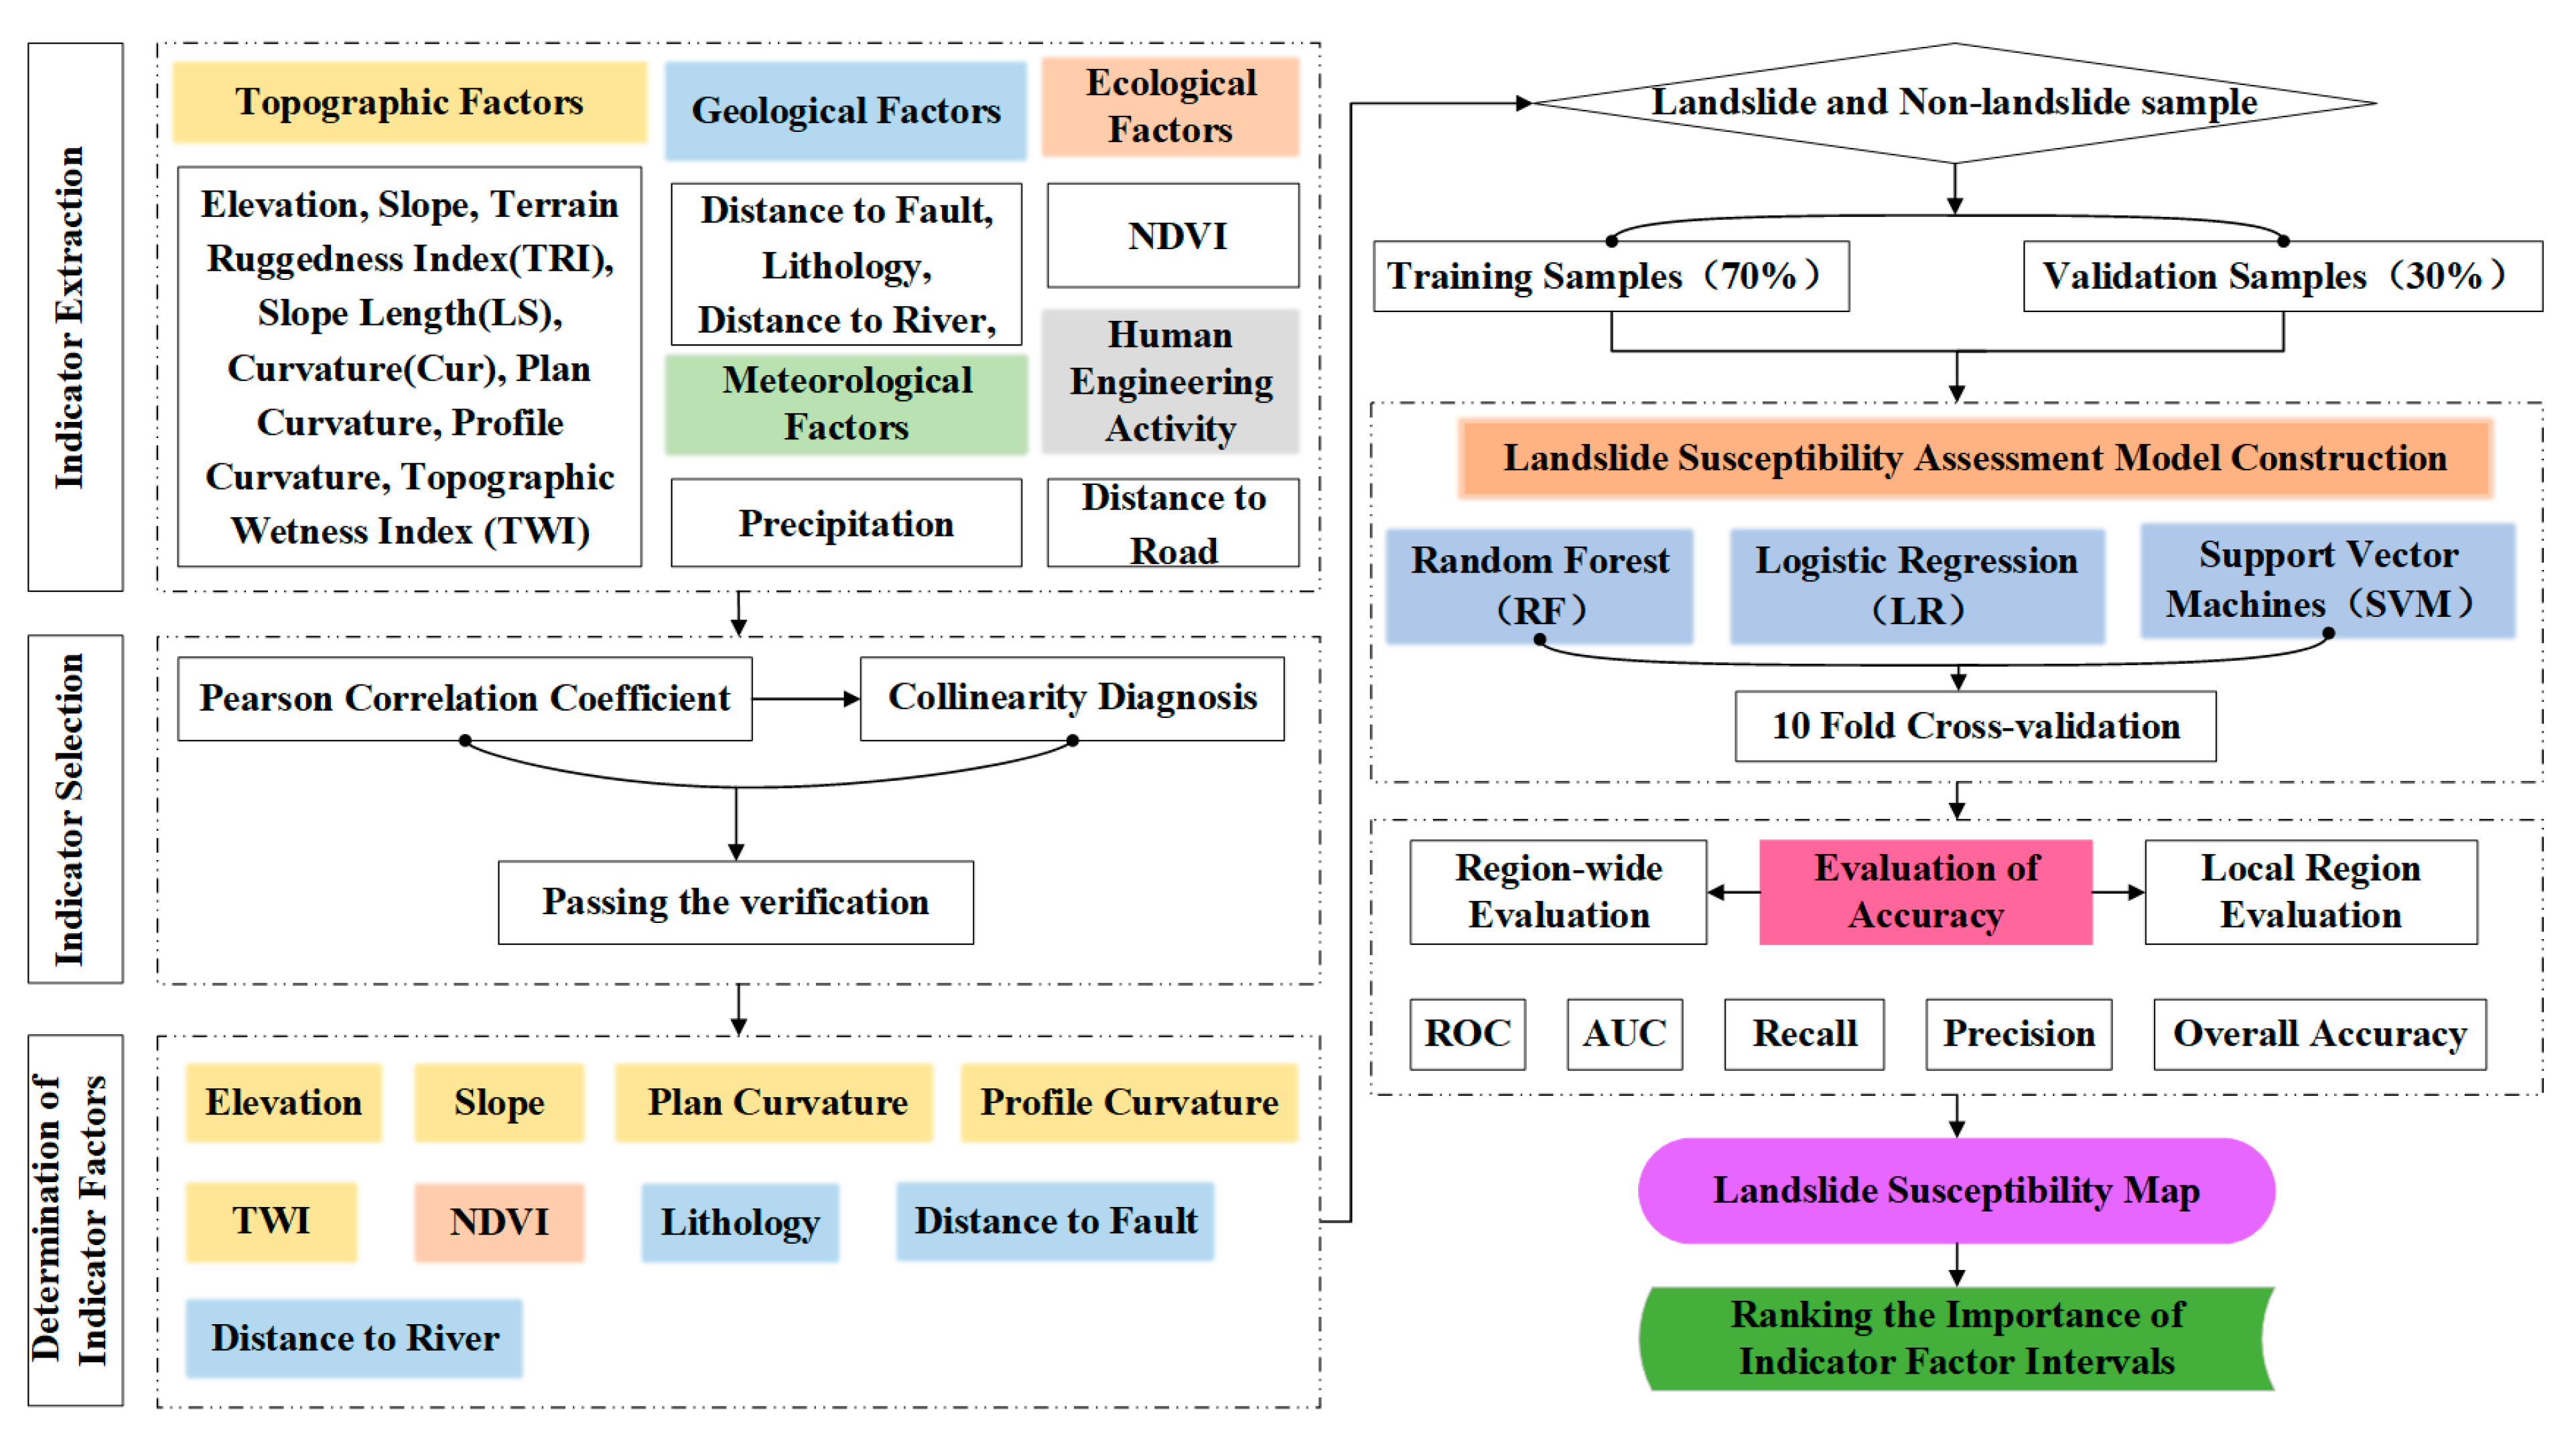
3.1. Methodology
3.2. Assessment Indicator Screening Methods
3.2.1. Pearson Correlation Coefficient
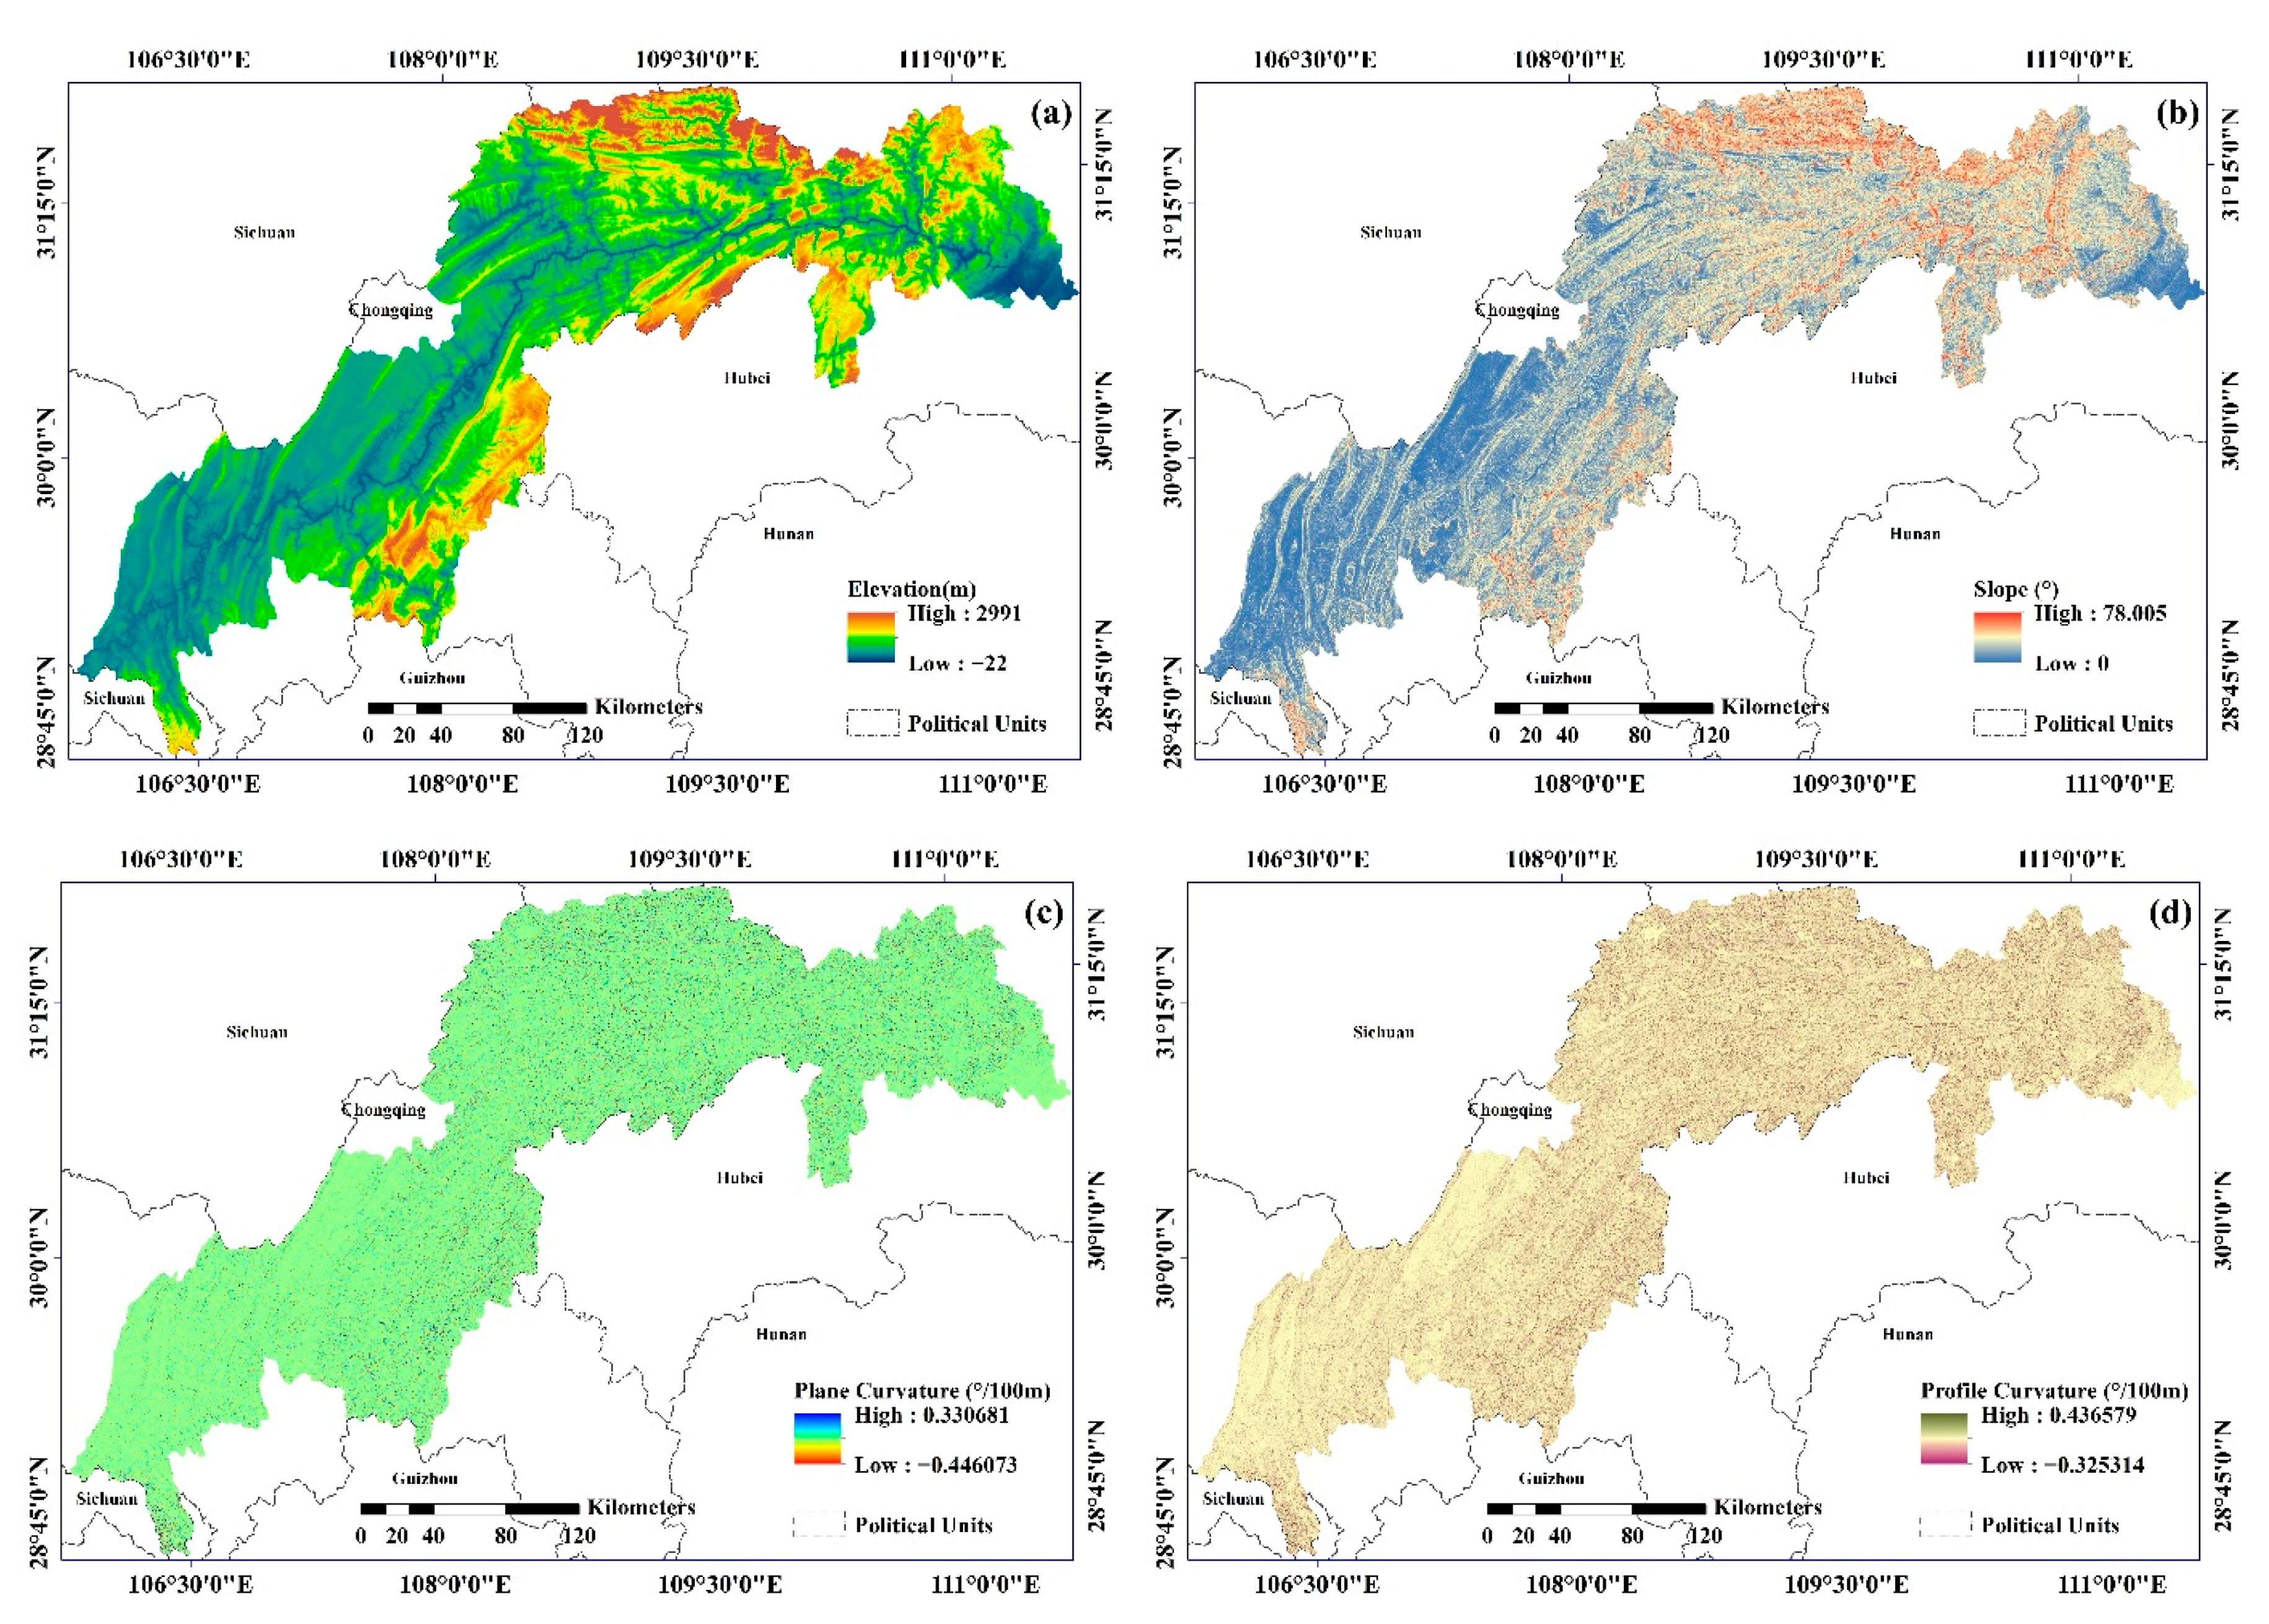
3.2.2. Extraction of Indicator Factors
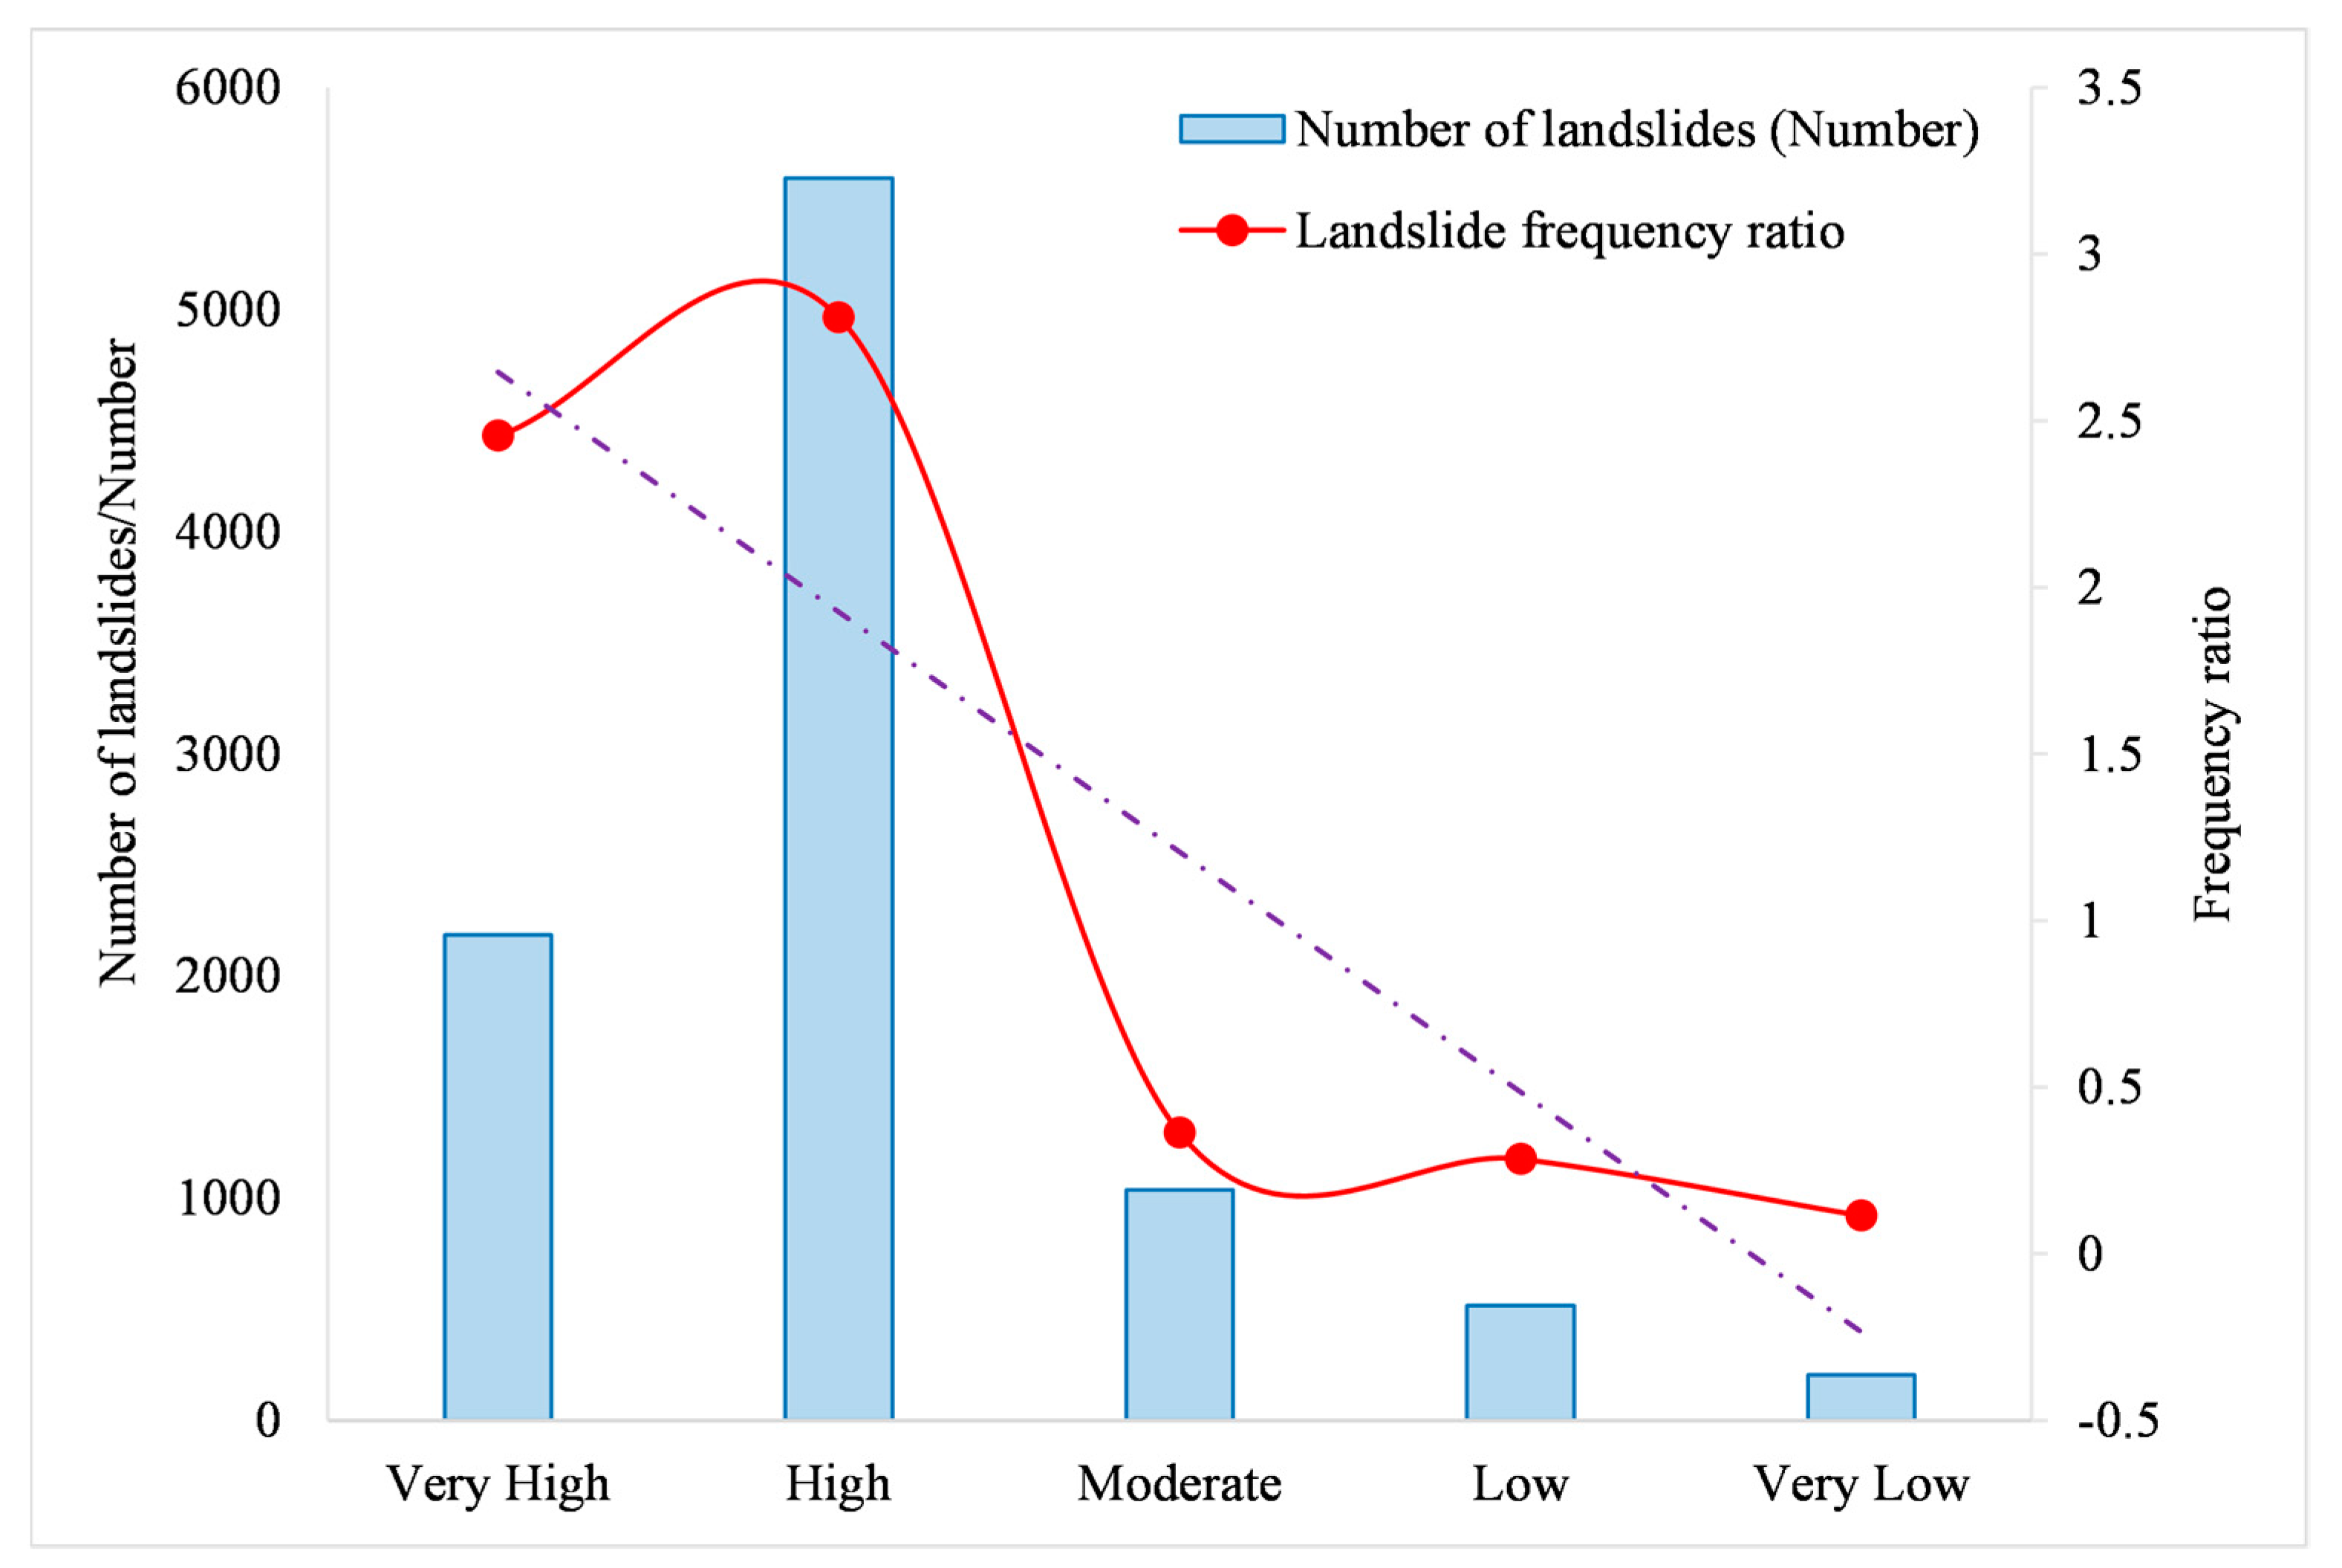
3.2.3. Landslide Frequency of Different Indicator Factors
3.3. Machine Learning Models
3.3.1. Logistic Regression
3.3.2. Random Forest
3.3.3. Support Vector Machine
3.4. Model Accuracy Assessment Criteria
3.4.1. Accuracy Analysis
3.4.2. Receiver Operating Characteristic
4. Results
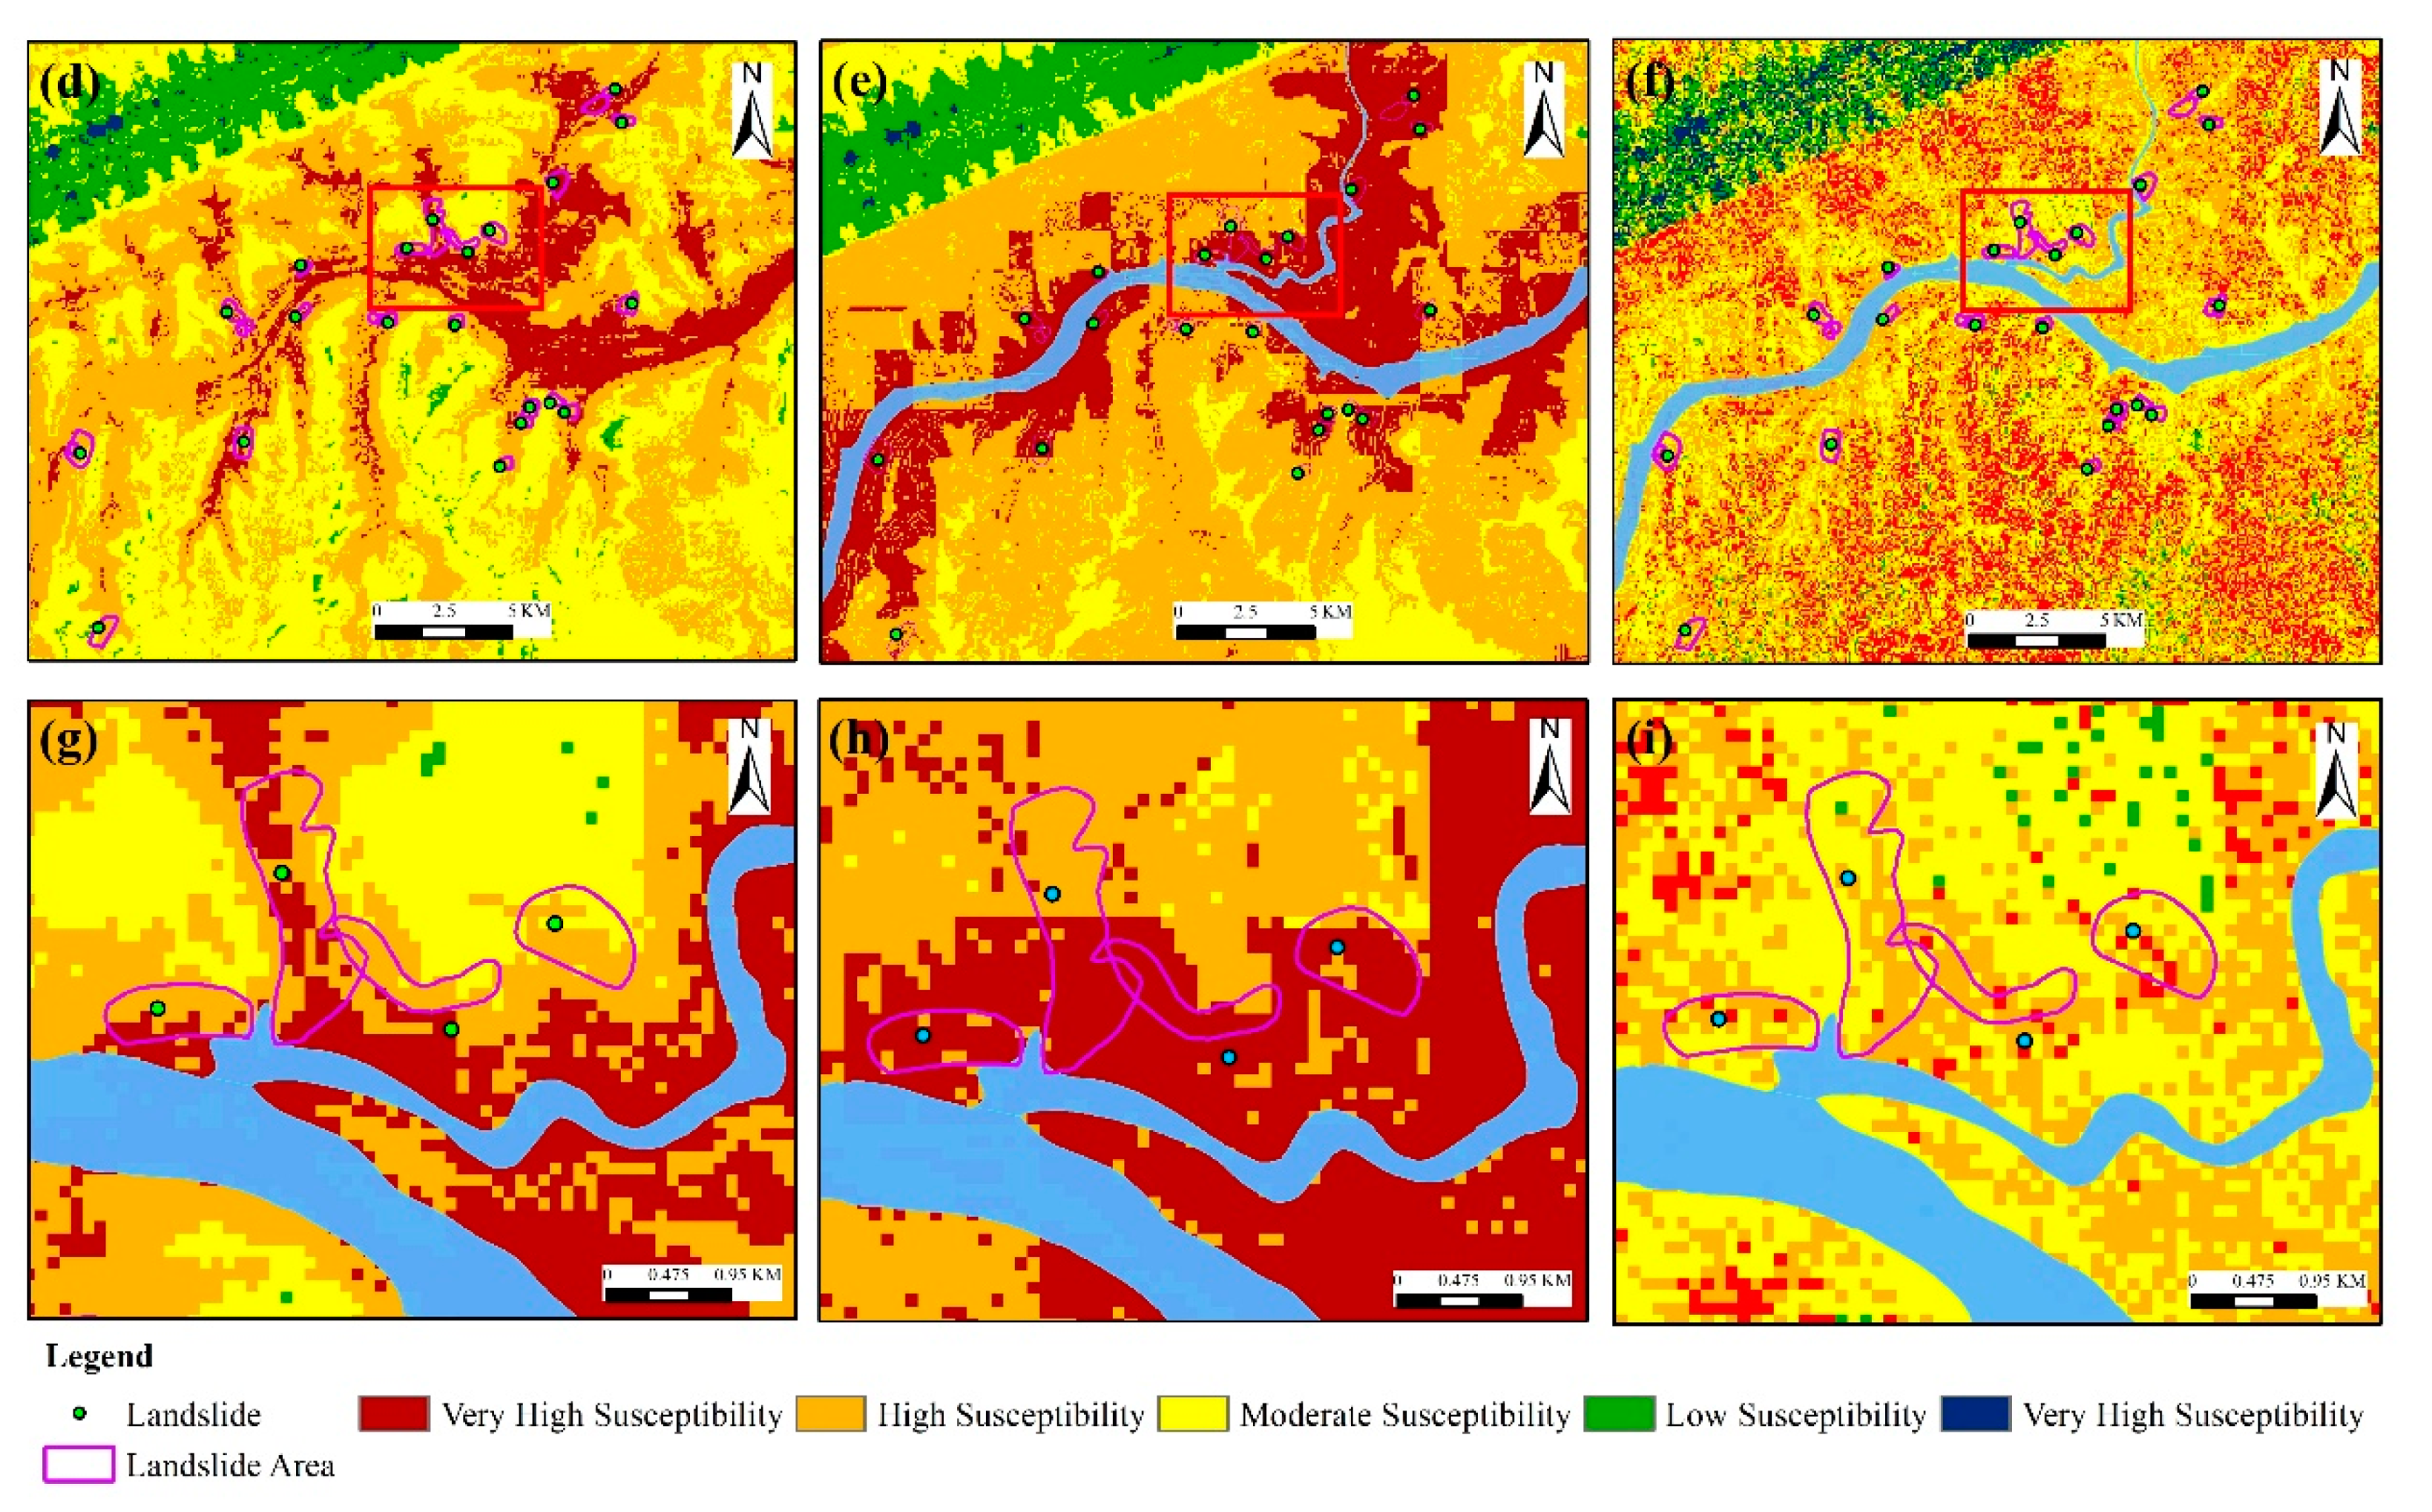
4.1. Landslide Susceptibility Assessment Maps for Different Models
4.2. Model Accuracy Evaluation
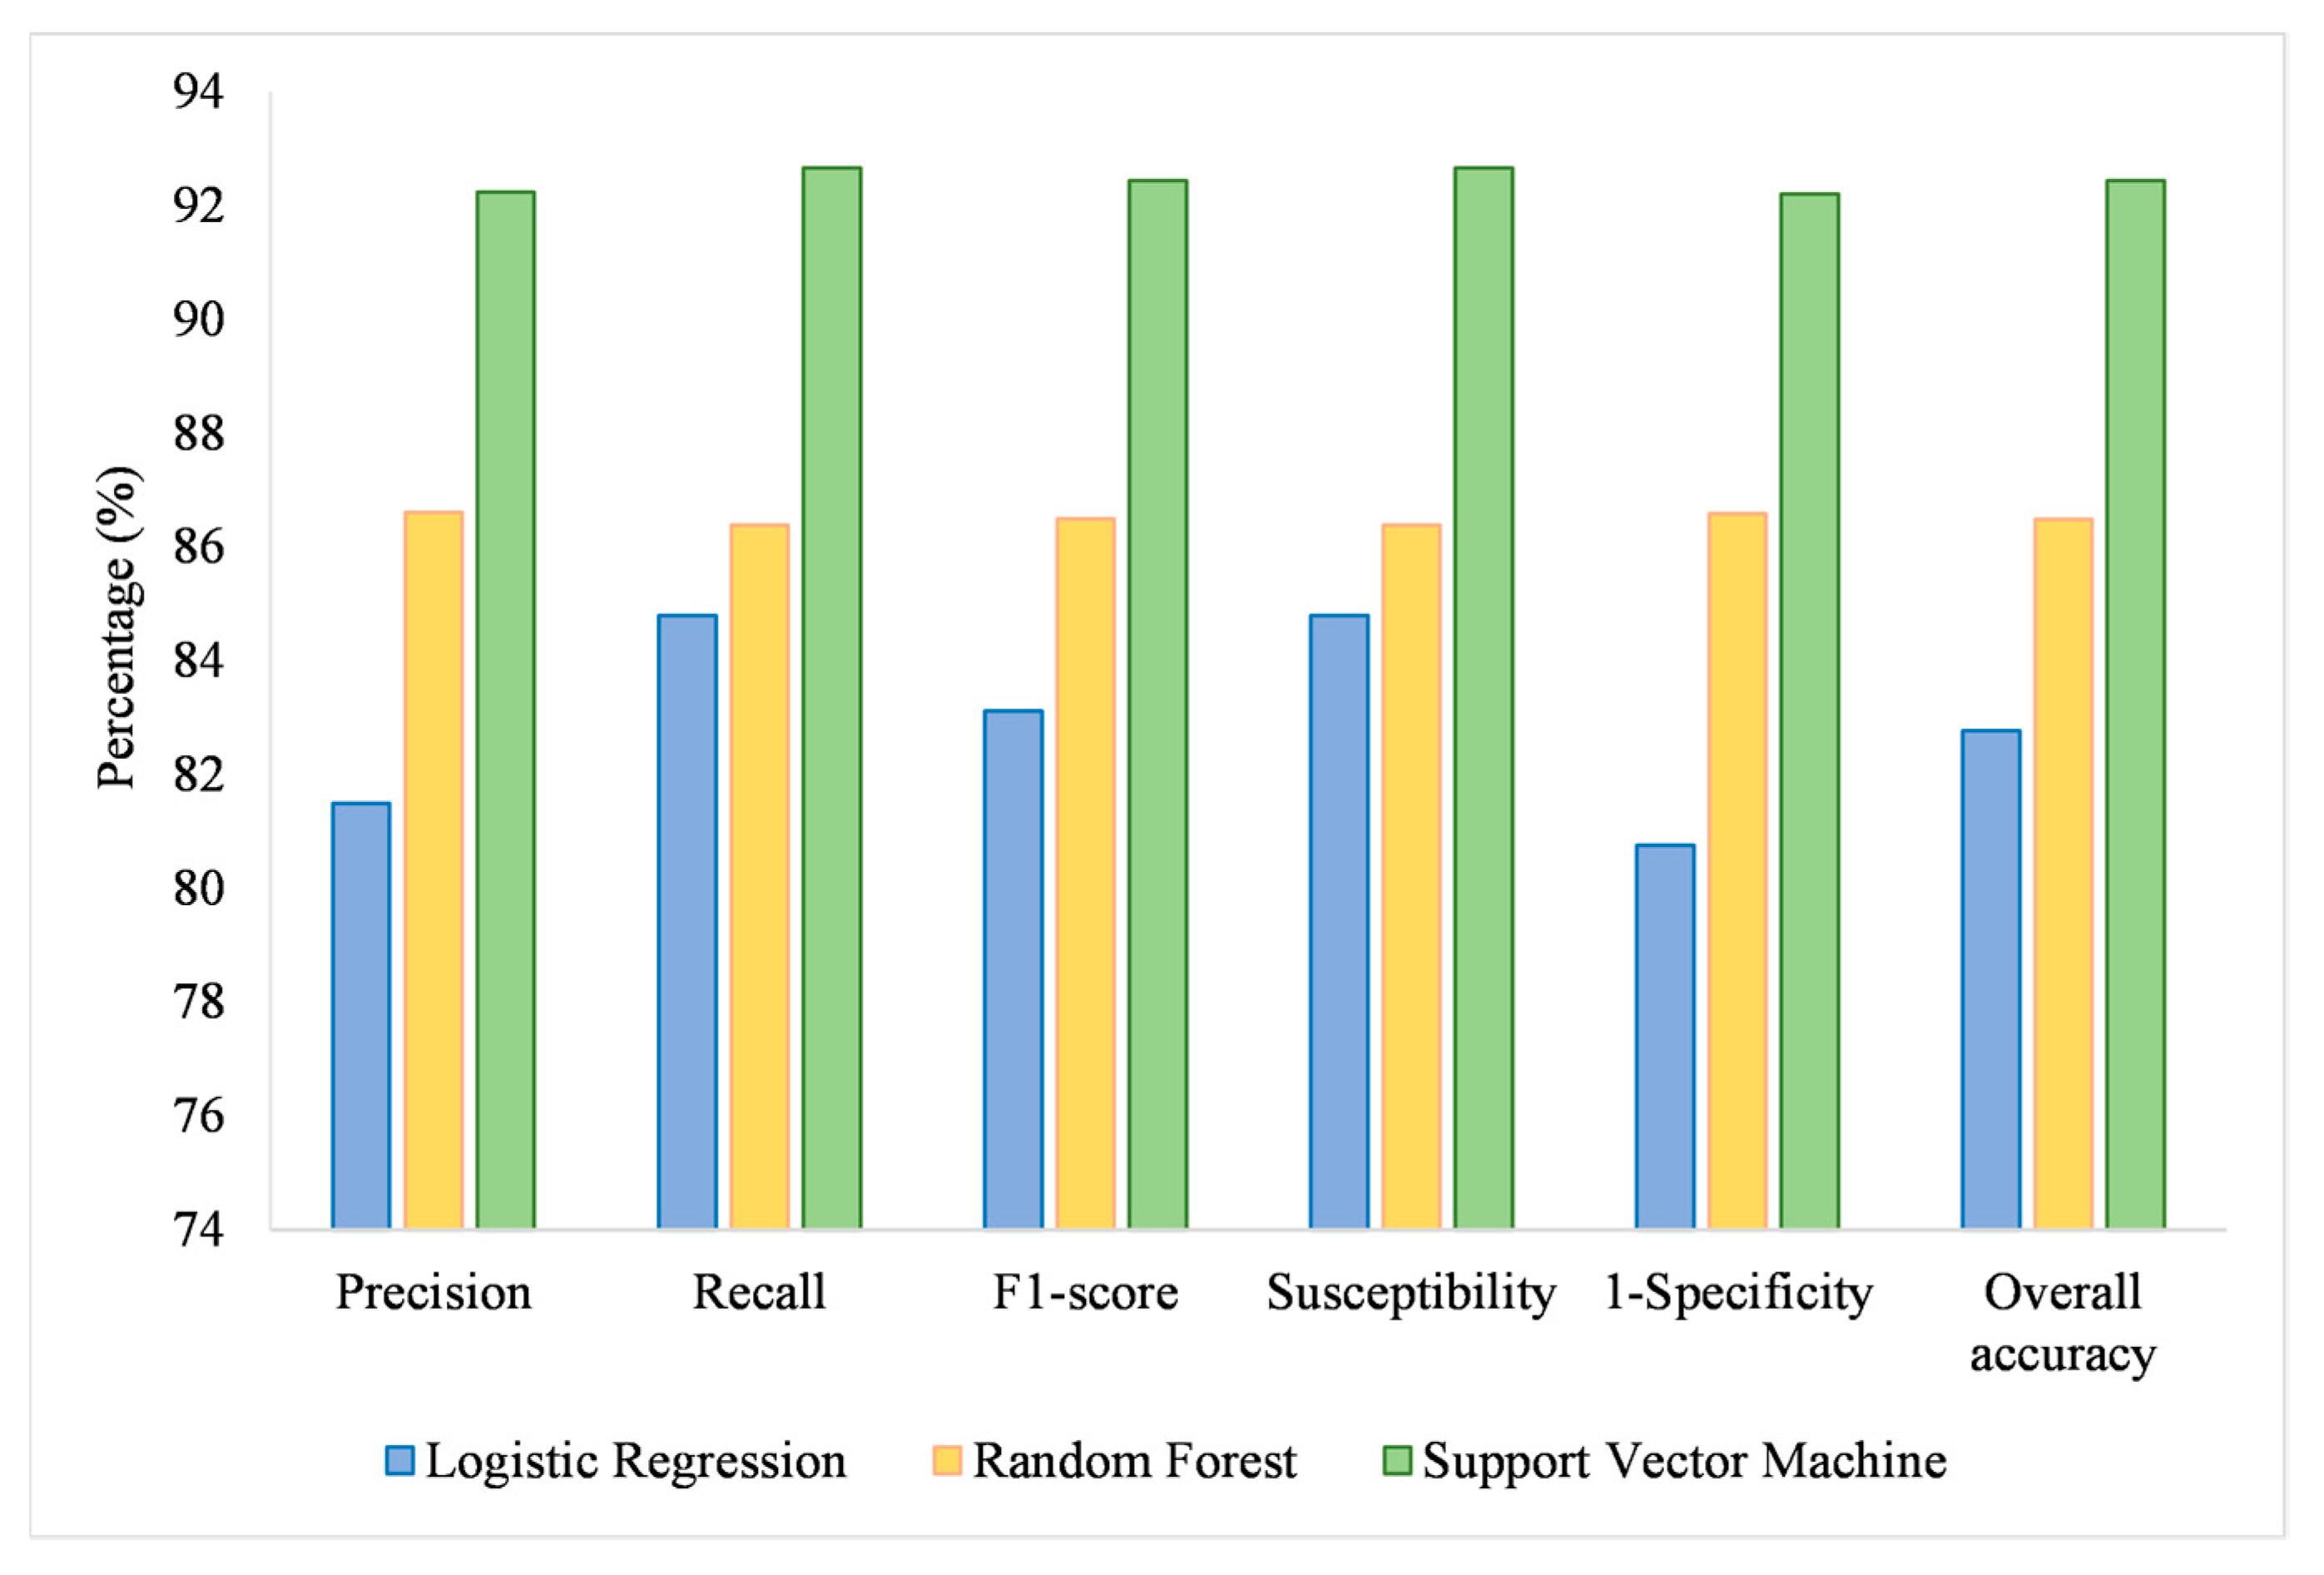
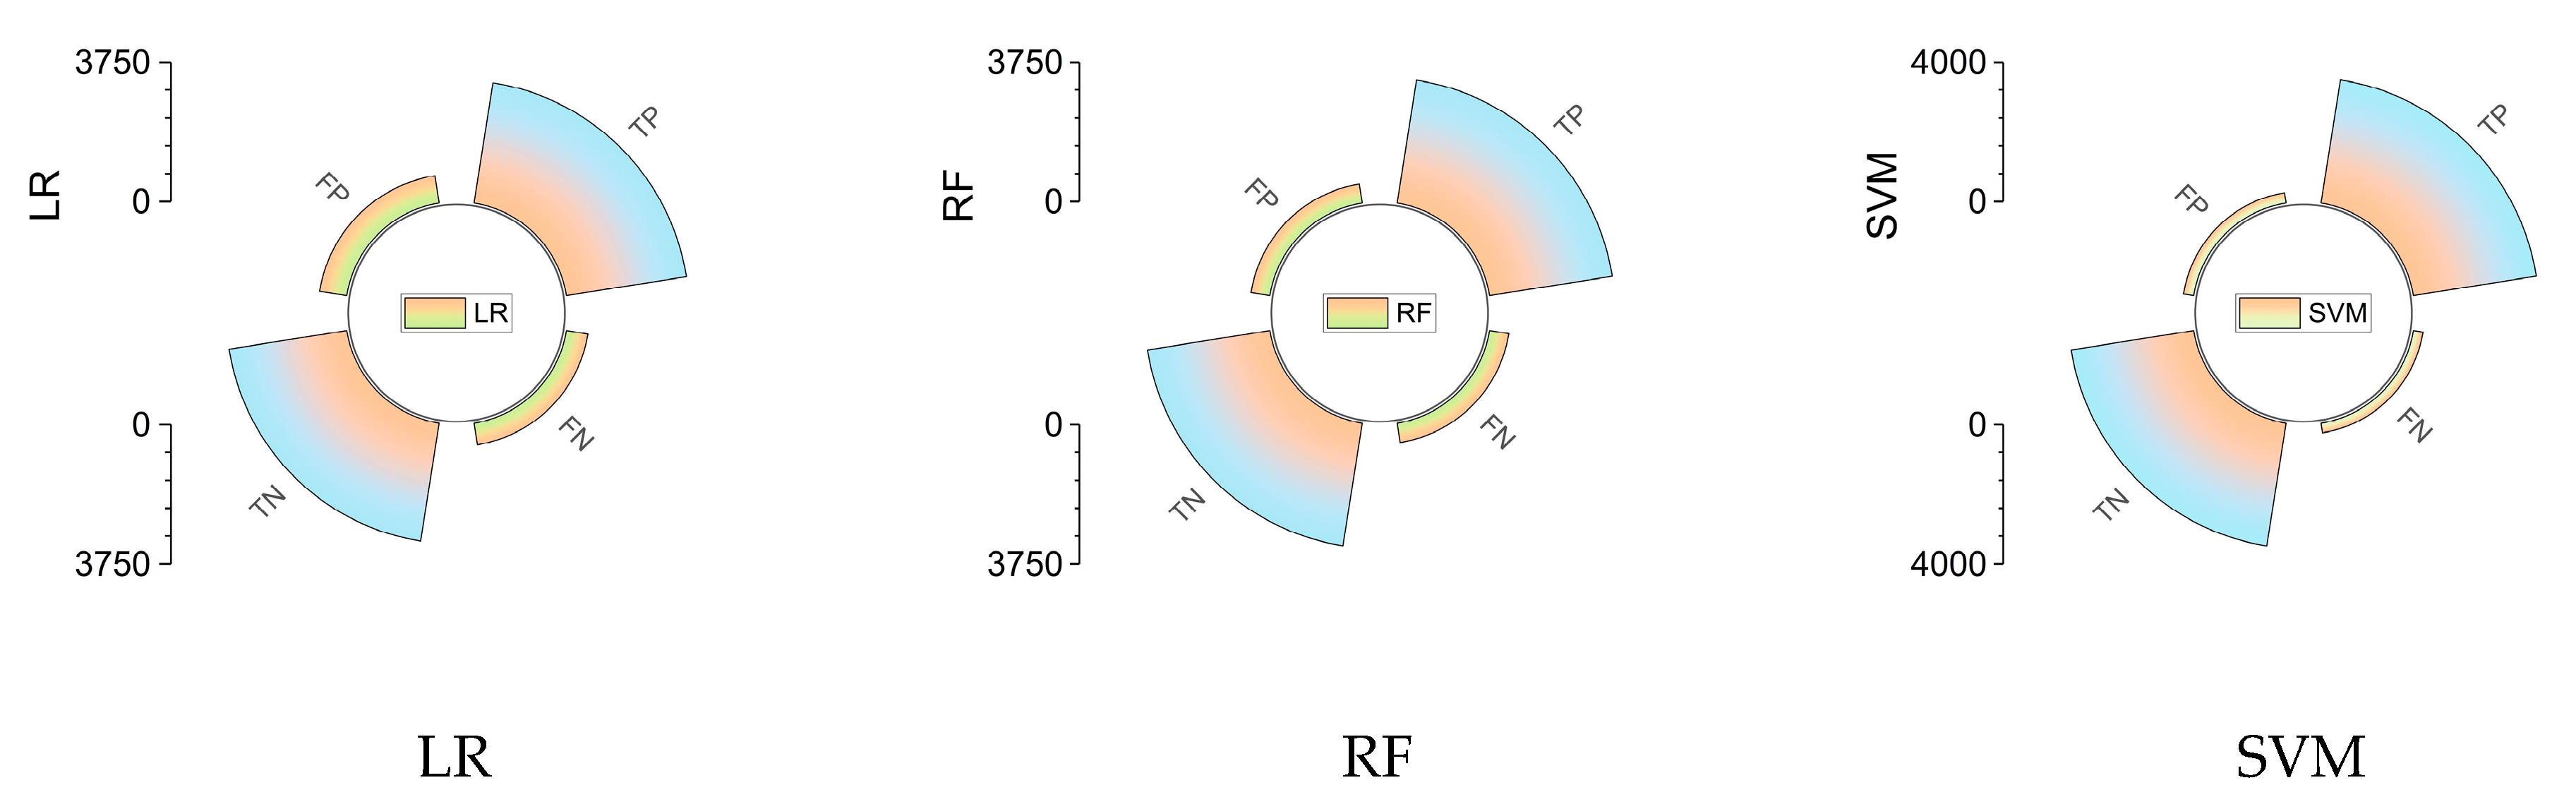
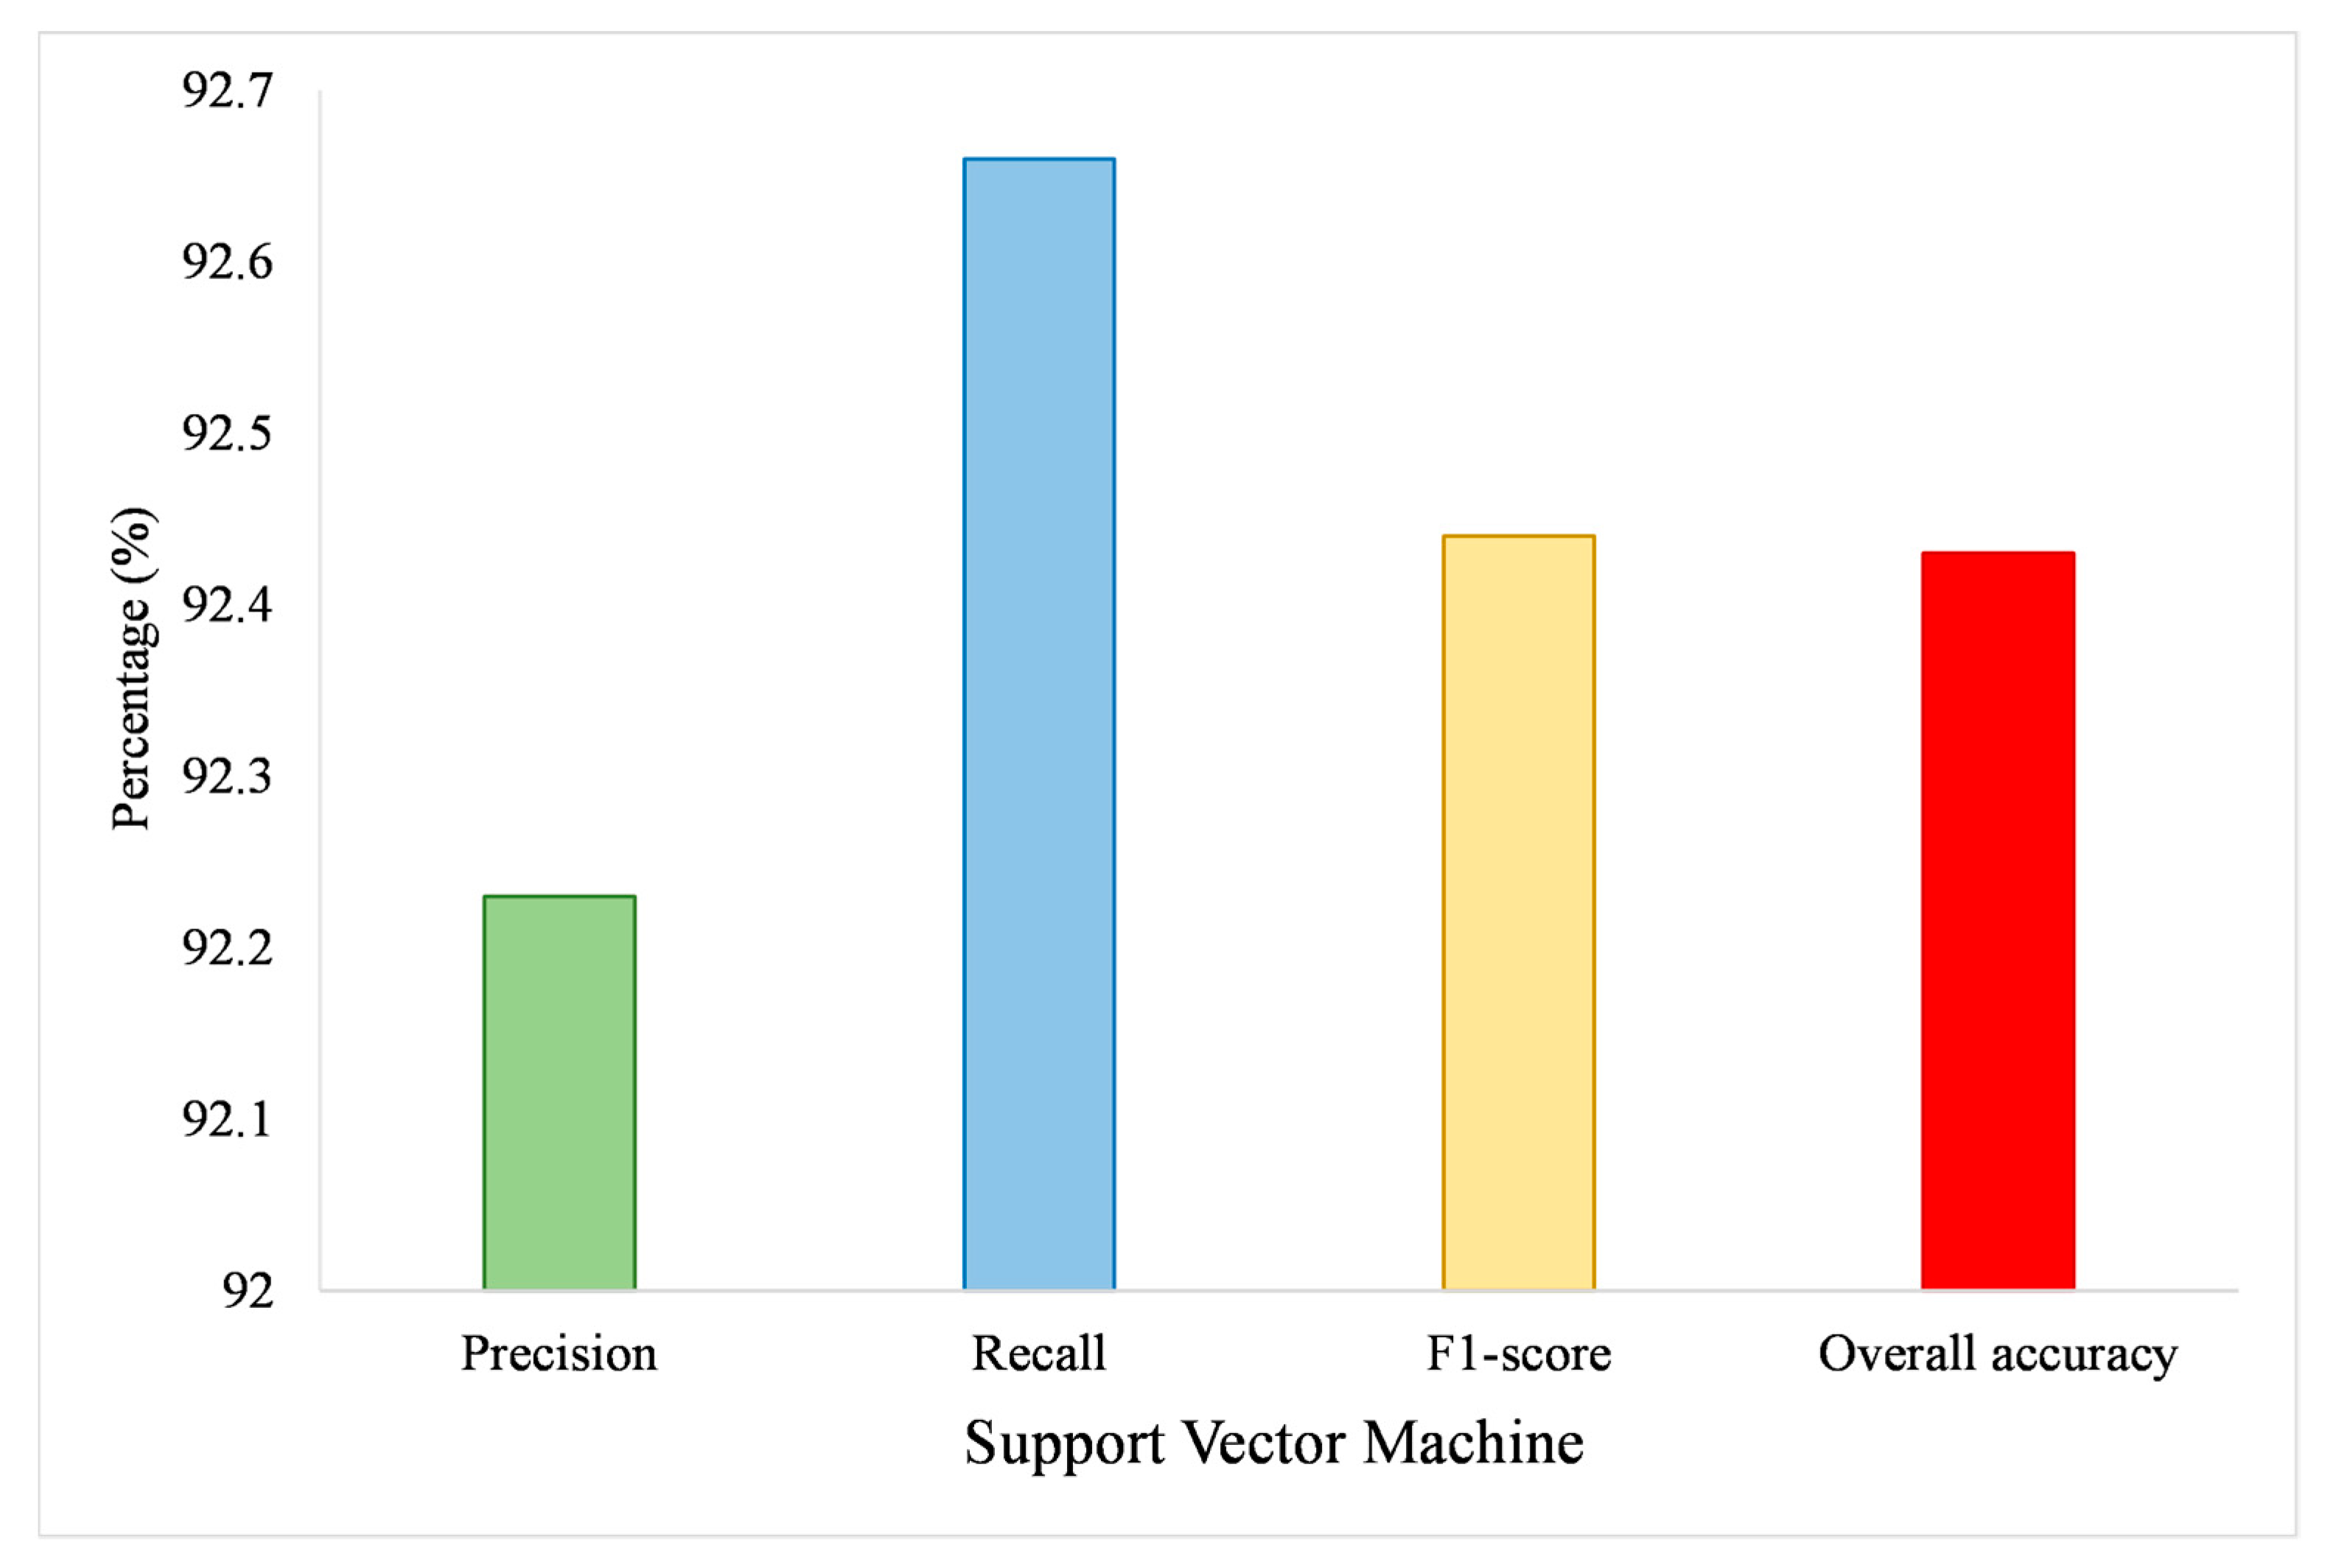
4.2.1. Accuracy Verification Parameter Evaluation
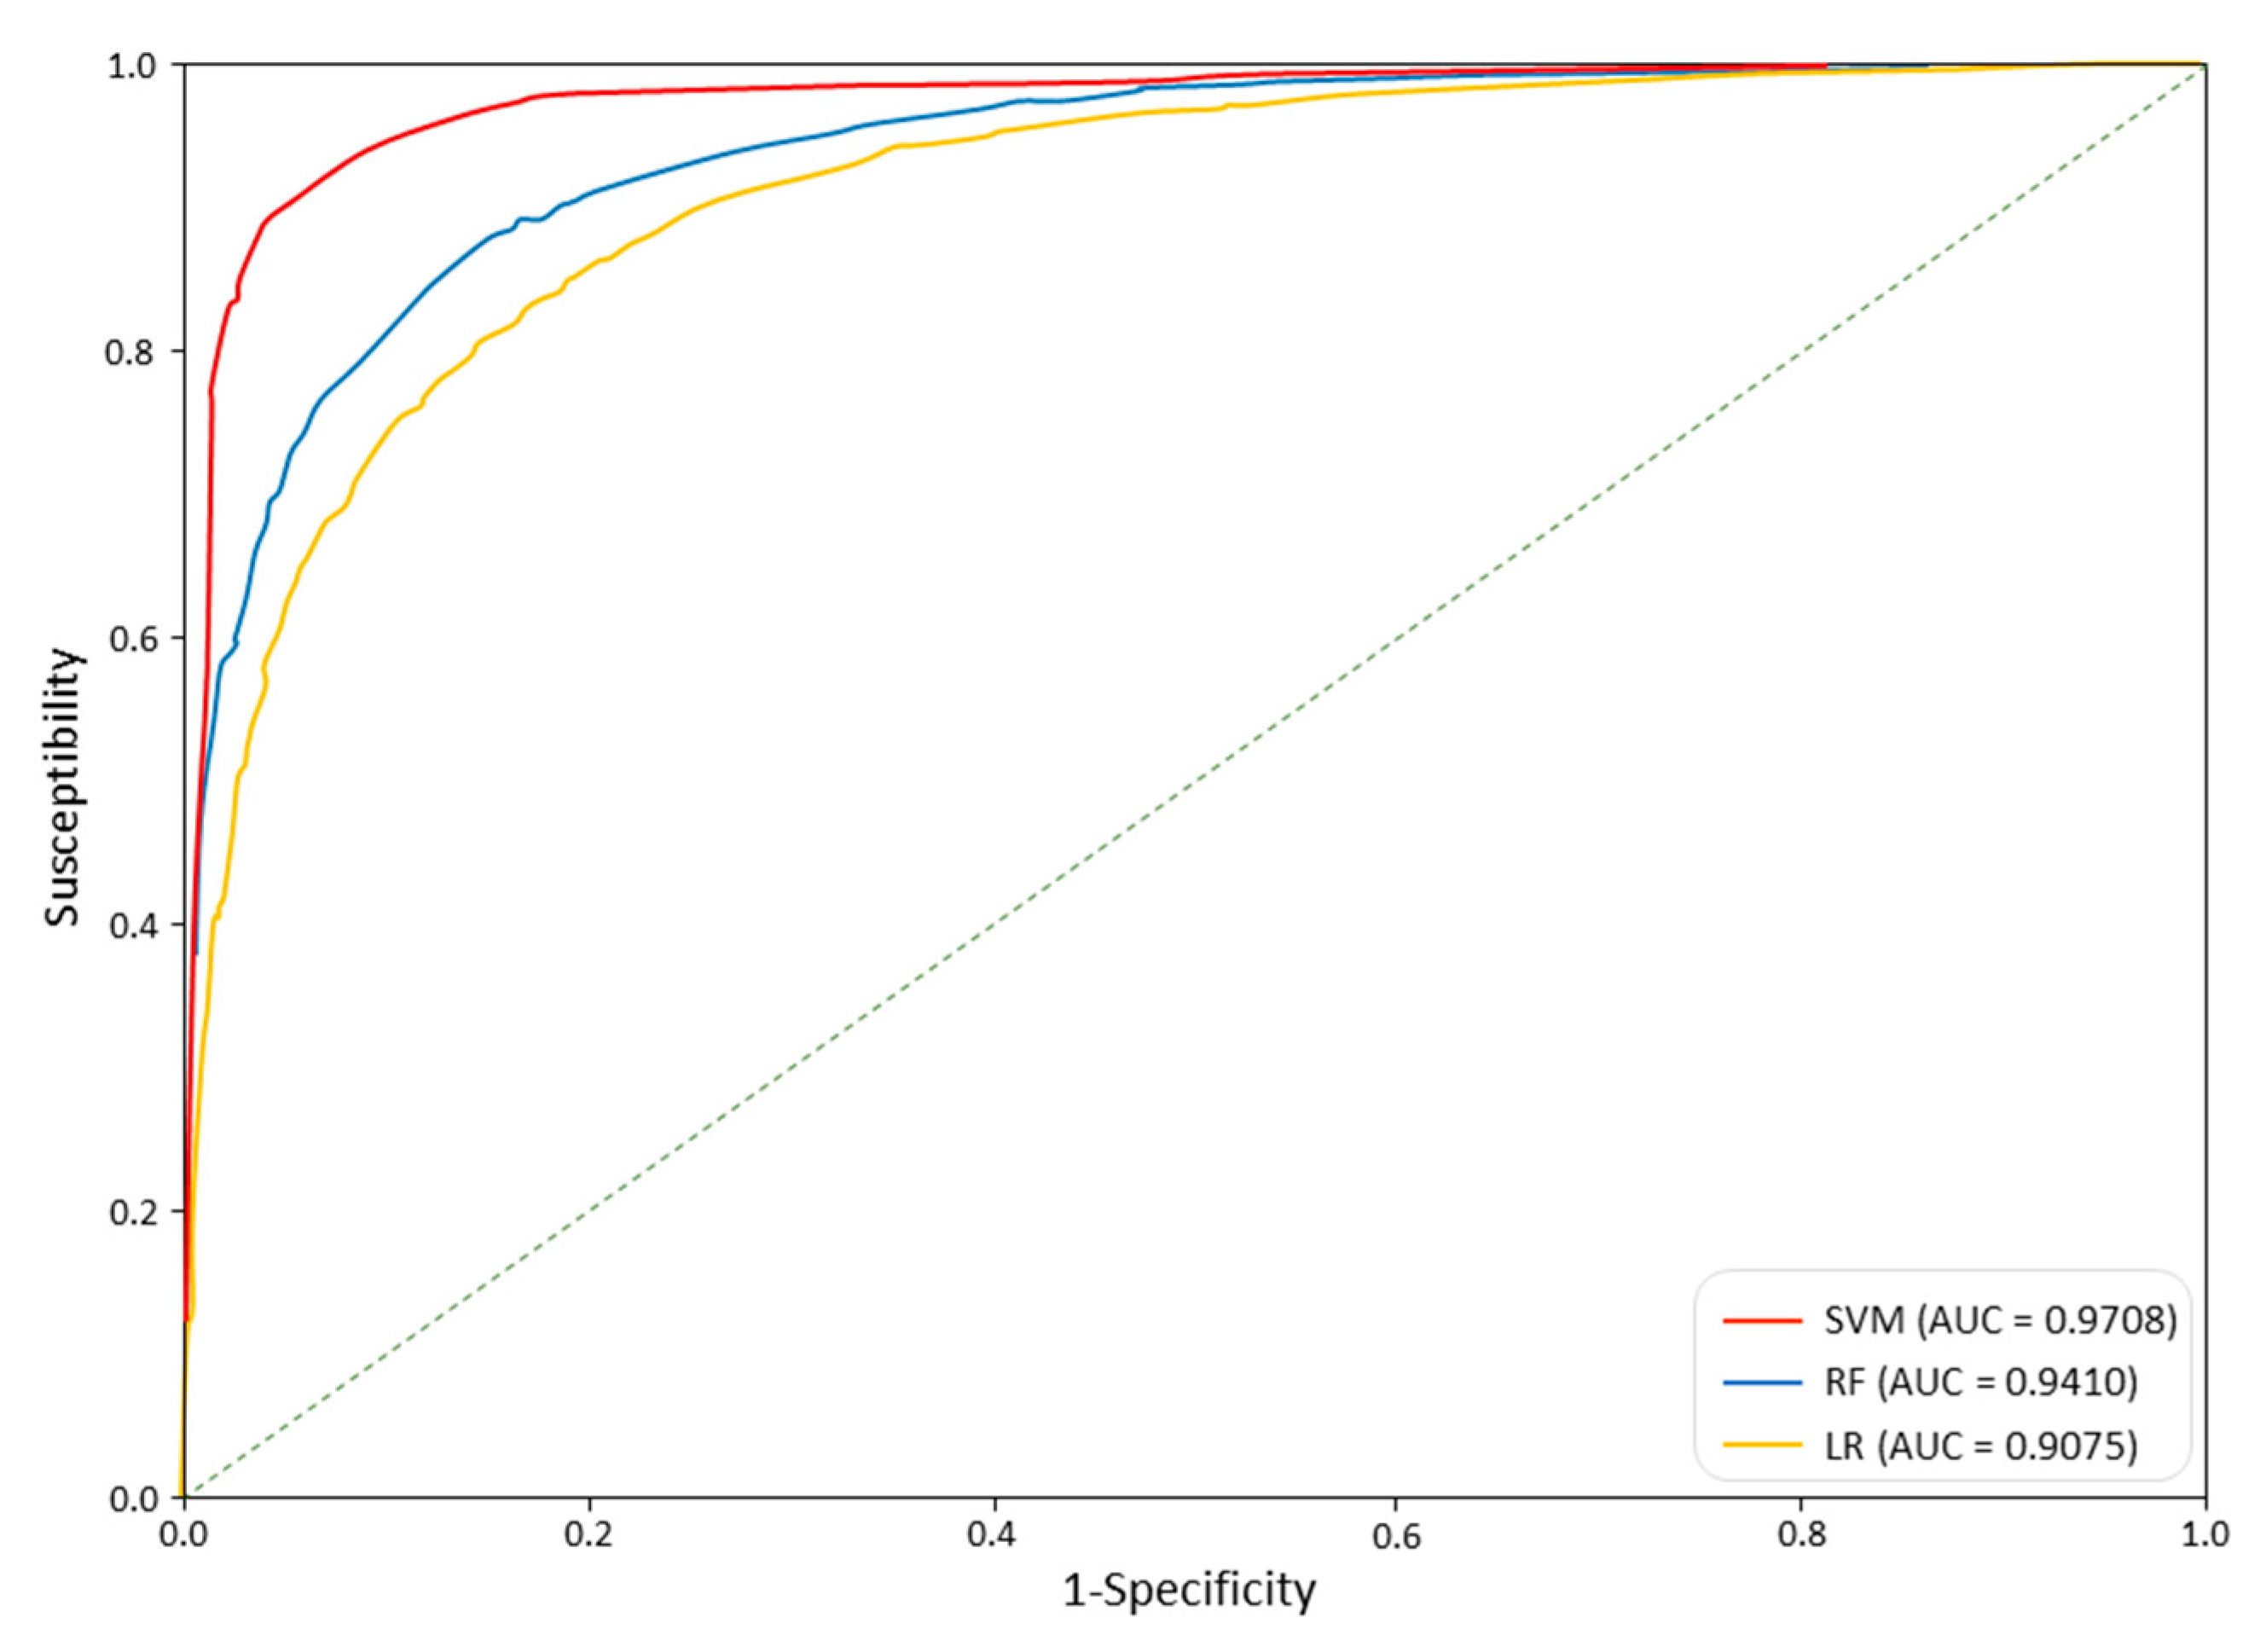
4.2.2. Comparison of ROC and AUC Results
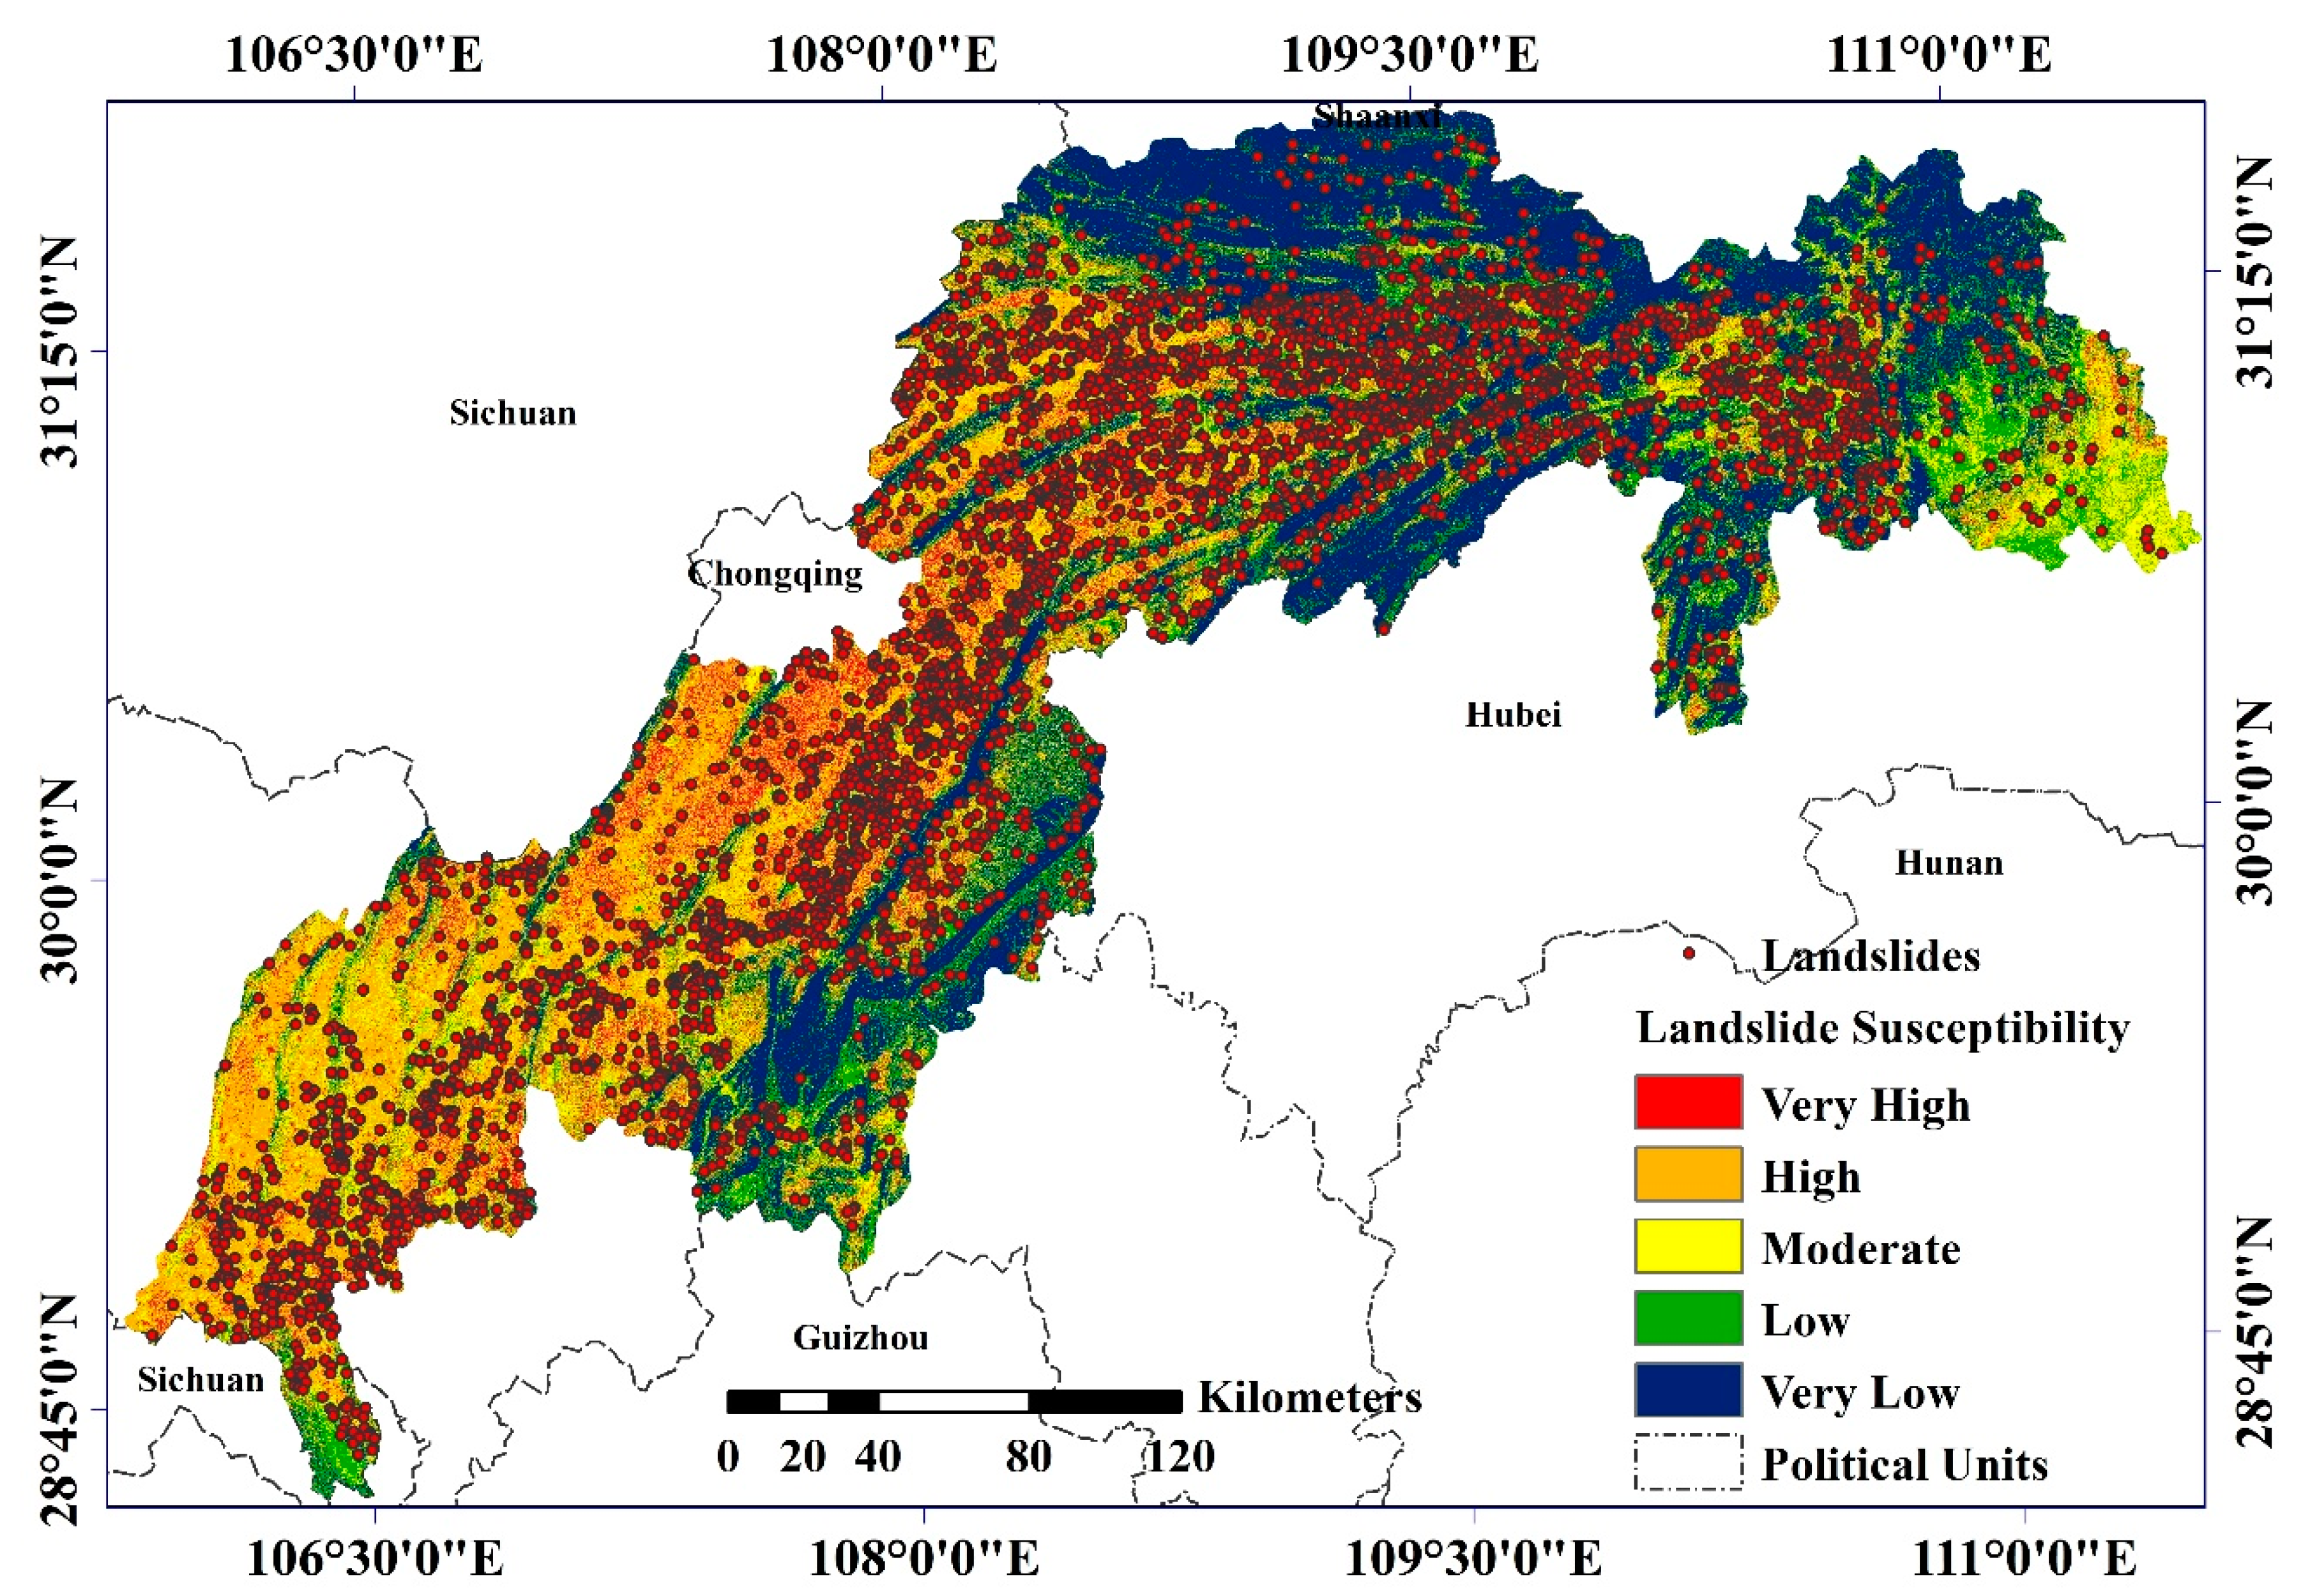
4.3. Comparison of Prediction Results of Models
5. Discussion
5.1. Comparative Analysis of Local Areas
5.2. Comparing the Spatial Generalization Ability of the Models
5.3. Support Vector Machine Space Generalization Capability
| Authors | Study Area | Accuracy of SVM (%) |
|---|---|---|
| Phong et al. [81] | The Muong Lay district, Vietnam | 87.00 |
| Roy et al. [53] | Darjeeling and Kalimpong Districts, West Bengal, India | 90.00 |
| Xianyu et al. [82] | The Wanzhou of the Three Gorges Area, China | 91.10 |
| Faming et al. [83] | Nantian area in southeastern hilly area, China | 93.17 |
| Bordoni et al. [84] | Oltrepò Pavese (northern Italy) | 97.75 |
5.4. Ranking of Relative Importance of Factors
5.5. Assessment Results and Discussion
6. Conclusions
Author Contributions
Funding
Data Availability Statement
Acknowledgments
Conflicts of Interest
References
- Paúl, C.; Néstor, M.; Fernando, M.; Adolfo, Q.; Boris, A. Worldwide Research Trends in Landslide Science. Int. J. Environ. Res. Public Health 2021, 18, 9445. [Google Scholar] [CrossRef]
- Froude, M.J.; Petley, D.N. Global fatal landslide occurrence from 2004 to 2016. Nat. Hazards Earth Syst. Sci. 2018, 18, 2161–2181. [Google Scholar] [CrossRef] [Green Version]
- Segoni, S.; Piciullo, L.; Gariano, S.L. A review of the recent literature on rainfall thresholds for landslide occurrence. Landslides 2018, 15, 1483–1501. [Google Scholar] [CrossRef]
- Piciullo, L.; Calvello, M.; Cepeda, J.M. Territorial early warning systems for rainfall-induced landslides. Earth Sci. Rev. 2018, 179, 228–247. [Google Scholar] [CrossRef]
- Wang, J.-J.; Liang, Y.; Zhang, H.-P.; Wu, Y.; Lin, X. A loess landslide induced by excavation and rainfall. Landslides 2013, 11, 141–152. [Google Scholar] [CrossRef]
- Zhuang, J.; Peng, J.; Wang, G.; Javed, I.; Wang, Y.; Li, W. Distribution and characteristics of landslide in Loess Plateau: A case study in Shaanxi province. Eng. Geol. 2018, 236, 89–96. [Google Scholar] [CrossRef]
- Sun, D. Mapping Landslide Susceptibility Based on Machine Learning and Forecast Warning of Landslide Induced by Rainfall; East China Normal University: Shanghai, China, 2019. [Google Scholar]
- Genqi, X.; Zongzhou, W.; Limin, L.; Hongwei, Z.; Ma, J.; Shaokang, C.; Ning, C.; Yinxing, L.; Xiaowen, R.; Yajuan, J. A Landslide Occurrence Probability and Scale Forecasting Method; Xi’an T.E. Institute: Xi’an, China, 2020; p. 20. [Google Scholar]
- Sheng, H.; Mingming, G.; Ting, L.; Haijun, Q.; Zhongwang, Z.; Quanquan, L.; Yubin, B. Danger Assessment of Earthquake-induced Geological Disasters in Shanxi Province Based in AHP and GIS. Quat. Sci. 2014, 34, 336–345. [Google Scholar]
- Li, D.; Huang, F.; Yan, L.; Cao, Z.; Chen, J.; Ye, Z. Landslide Susceptibility Prediction Using Particle-Swarm-Optimized Multilayer Perceptron: Comparisons with Multilayer-Perceptron-Only, BP Neural Network, and Information Value Models. Appl. Sci. 2019, 9, 3664. [Google Scholar] [CrossRef] [Green Version]
- Chen, T.; Zhu, L.; Niu R-q Trinder, C.J.; Peng, L.; Lei, T. Mapping landslide susceptibility at the Three Gorges Reservoir, China, using gradient boosting decision tree, random forest and information value models. J. Mt. Sci. 2020, 17, 670–685. [Google Scholar] [CrossRef]
- Jing, H.; Qiang, L.; Dingyou, X.; Qiankun, L.; Yukun, M.; Chao, W.; Xiao, W. Landslide Susceptibility Assessment for Guangyuan City Based on Clustering-information Value Coupling Model. Geomat. Spat. Inf. Technol. 2020, 43, 25–31. [Google Scholar]
- Wenyan, L.; Xile, W. Application and comparison of frequency ratio and information value model for evaluating landslide susceptibility of loess gully region. J. Nat. Disasters 2020, 29, 213–220. [Google Scholar] [CrossRef]
- Liu, H.; Li, X.; Meng, T.; Liu, Y. Susceptibility mapping of damming landslide based on slope unit using frequency ratio model. Arab. J. Geosci. 2020, 13, 790. [Google Scholar] [CrossRef]
- Hepdeniz, K. Using the analytic hierarchy process and frequency ratio methods for landslide susceptibility mapping in Isparta-Antalya highway (D-685), Turkey. Arab. J. Geosci. 2020, 13, 795. [Google Scholar] [CrossRef]
- Niandong, D.; Yangyang, C.; Youjin, G. Frequency ratio-random forest-model-based landslide susceptibility assessment. Sci. Technol. Eng. 2020, 20, 13990–13996. [Google Scholar]
- Ayalew, L.; Yamagishi, H. The application of GIS-based logistic regression for landslide susceptibility mapping in the Kakuda-Yahiko Mountains, Central Japan. Geomorphology 2005, 65, 15–31. [Google Scholar] [CrossRef]
- Riegel, R.P.; Alves, D.D.; Schmidt, B.C.; De Oliveira, G.G.; Haetinger, C.; Osório, D.M.M.; Rodrigues, M.A.S.; De Quevedo, D.M. Assessment of susceptibility to landslides through geographic information systems and the logistic regression model. Nat. Hazards 2020, 103, 497–511. [Google Scholar] [CrossRef]
- Sun, D.; Wen, H.; Zhang, Y.; Xue, M. An optimal sample selection-based logistic regression model of slope physical resistance against rainfall-induced landslide. Nat. Hazards 2020, 105, 1255–1279. [Google Scholar] [CrossRef]
- Soma, A.S.; Kubota, T.; Mizuno, H. Optimization of causative factors using logistic regression and artificial neural network models for landslide susceptibility assessment in Ujung Loe Watershed, South Sulawesi Indonesia. J. Mt. Sci. 2019, 16, 383–401. [Google Scholar] [CrossRef]
- Tao, H.; Xin, F.; Shuo, W.; Zizheng, G.; Aichang, L.; Faming, H. Landslide Susceptibility Evaluation of Sinan County Using Logistics Regression Model and 3S Technology. Bull. Geol. Sci. Technol. 2020, 39, 113–121. [Google Scholar]
- Liu, R.; Li, L.; Pirasteh, S.; Lai, Z.; Yang, X.; Shahabi, H. The performance quality of LR, SVM, and RF for earthquake-induced landslides susceptibility mapping incorporating remote sensing imagery. Arab. J. Geosci. 2021, 14, 259. [Google Scholar] [CrossRef]
- Heming, H.; Bin, S.; Lei, Z. Prediction of landslide sharp increase displacement by SVM with considering hysteresis of groundwater change. Eng. Geol. 2021, 280, 105876. [Google Scholar] [CrossRef]
- Zhou, Z.G.; Guang, Z.Z.; Binbin, C.; Ziyang, L.; Chuanrong, L. The Use of LSTM-Based RNN and SVM Models to Detect Ludian Coseismic Landslides in Time Series Images. J. Physics. Conf. Ser. 2020, 1631, 012085. [Google Scholar] [CrossRef]
- Wang, Q.; Yun, X.; Wei, Z.; Yuehong, L.; Songlin, Z. Landslide susceptibility mapping based on support vector machine models. J. Hunan City Univ. Nat. Sci. 2021, 30, 22–28. [Google Scholar]
- Zhao, L.; Wu, X.; Niu, R.; Wang, Y.; Zhang, K. Using the rotation and random forest models of ensemble learning to predict landslide susceptibility. Geomat. Nat. Hazards Risk 2020, 11, 1542–1564. [Google Scholar] [CrossRef]
- Zheng, Y.; Chen, J.; Wang, C.; Chen, T. Application of certainty factor and random forest model in landslide susceptibility evaluation in Mangshi City, Yunnan Province. Bull. Geol. Sci. Technol. 2020, 39, 131–144. [Google Scholar]
- Wang, S.; Zhuang, J.; Zheng, J.; Fan, H.; Kong, J.; Zhan, J. Application of Bayesian Hyperparameter Optimized Random Forest and XGBoost Model for Landslide Susceptibility Mapping. Front. Earth Sci. 2021, 9, 712240. [Google Scholar] [CrossRef]
- Rongfu, L.; Jiping, L.; Shenghua, X.; Mengmeng, L.; Meng, Z.; EnJie, L. Evaluation method of landslide susceptibility based on random forest weighed information. Sci. Surv. Mapp. 2020, 45, 131–138. [Google Scholar]
- Quevedo, R.P.; Maciel, D.A.; Uehara, T.D.T.; Vojtek, M.; Rennó, C.D.; Pradhan, B.; Vojteková, J.; Pham, Q.B. Consideration of spatial heterogeneity in landslide susceptibility mapping using geographical random forest model. Geocarto Int. 2021, 1–24. [Google Scholar] [CrossRef]
- Karakas, G.; Kocaman, S.; Gokceoglu, C. Comprehensive performance assessment of landslide susceptibility mapping with MLP and random forest: A case study after Elazig earthquake (24 Jan 2020, Mw 6.8), Turkey. Environ. Earth Sci. 2022, 81, 1–22. [Google Scholar] [CrossRef]
- Karakas, G.; Can, R.; Kocaman, S.; Nefeslioglu, H.A.; Gokceoglu, C. Landslide Susceptibility Mapping with Random Forest Model for Ordu, Turkey. ISPRS—Int. Arch. Photogramm. Remote Sens. Spat. Inf. Sci. 2020, XLIII-B3-2, 1229–1236. [Google Scholar] [CrossRef]
- Jian, L.; Lin, L.; Tao, C. Landslide Susceptibility Assessment Based on Optimized Random Forest Model. Geomat. Inf. Sci. Wuhan Univ. 2018, 43, 1085–1091. [Google Scholar] [CrossRef]
- Deliang, S.; Jiahui, X.; Haijia, W.; Yue, W. An Optimized Random Forest Model and Its Generalization Ability in Landslide Susceptibility Mapping: Application in Two Areas of Three Gorges Reservoir, China. J. Earth Sci. 2020, 31, 1068–1086. [Google Scholar]
- Akinci, H.; Kilicoglu, C.; Dogan, S. Random Forest-Based Landslide Susceptibility Mapping in Coastal Regions of Artvin, Turkey. ISPRS Int. J. Geo-Inf. 2020, 9, 553. [Google Scholar] [CrossRef]
- Zare, N.; Hosseini, S.A.O.; Hafizi, M.K.; Najafi, A.; Majnounian, B.; Geertsema, M. A Comparison of an Adaptive Neuro-Fuzzy and Frequency Ratio Model to Landslide-Susceptibility Mapping along Forest Road Networks. Forests 2021, 12, 1087. [Google Scholar] [CrossRef]
- Razavi-Termeh, S.V.; Shirani, K.; Pasandi, M. Mapping of landslide susceptibility using the combination of neuro-fuzzy inference system (ANFIS), ant colony (ANFIS-ACOR), and differential evolution (ANFIS-DE) models. Bull. Eng. Geol. Environ. 2021, 80, 2045–2067. [Google Scholar] [CrossRef]
- Paryani, S.; Neshat, A.; Pradhan, B. Spatial landslide susceptibility mapping using integrating an adaptive neuro-fuzzy inference system (ANFIS) with two multi-criteria decision-making approaches. Arch. Meteorol. Geophys. Bioclimatol. Ser. B 2021, 146, 489–509. [Google Scholar] [CrossRef]
- Murat, E.; Candan, G. Assessment of landslide susceptibility for a landslide-prone area (north of Yenice, NW Turkey) by fuzzy approach. Environ. Geol. 2002, 41, 720–730. [Google Scholar] [CrossRef]
- Jaafari, A.; Panahi, M.; Pham, B.T.; Shahabi, H.; Bui, D.T.; Rezaie, F.; Lee, S. Meta optimization of an adaptive neuro-fuzzy inference system with grey wolf optimizer and biogeography-based optimization algorithms for spatial prediction of landslide susceptibility. Catena 2019, 175, 430–445. [Google Scholar] [CrossRef]
- Nath, R.R.; Sharma, M.L.; Goswami, A.; Sweta, K.; Pareek, N. Landslide Susceptibility Zonation with Special Emphasis on Tectonic Features for Occurrence of Landslides in Lower Indian Himalaya. J. Indian Soc. Remote Sens. 2021, 49, 1221–1238. [Google Scholar] [CrossRef]
- Lucchese, L.V.; de Oliveira, G.G.; Pedrollo, O.C. Mamdani fuzzy inference systems and artificial neural networks for landslide susceptibility mapping. Nat. Hazards 2021, 106, 2381–2405. [Google Scholar] [CrossRef]
- Liu, F.; Wang, L.; Xiao, D.; Wang, J. Evaluation of landslide susceptibility in Ningnan County based on fuzzy comprehensive evaluation. J. Nat. Disasters 2021, 30, 237–246. [Google Scholar]
- Cengiz, L.D.; Ercanoglu, M. A novel data-driven approach to pairwise comparisons in AHP using fuzzy relations and matrices for landslide susceptibility assessments. Environ. Earth Sci. 2022, 81, 1–23. [Google Scholar] [CrossRef]
- Ali, S.A.; Parvin, F.; Vojteková, J.; Costache, R.; Linh, N.T.T.; Pham, Q.B.; Vojtek, M.; Gigović, L.; Ahmad, A.; Ghorbani, M.A. GIS-based landslide susceptibility modeling: A comparison between fuzzy multi-criteria and machine learning algorithms. Geosci. Front. 2020, 12, 857–876. [Google Scholar] [CrossRef]
- Orhan, O.; Bilgilioglu, S.S.; Kaya, Z.; Ozcan, A.K.; Bilgilioglu, H. Assessing and mapping landslide susceptibility using different machine learning methods. Geocarto Int. 2020, 1–26. [Google Scholar] [CrossRef]
- Yu, L.; Cao, Y.; Zhou, C.; Wang, Y.; Huo, Z. Landslide Susceptibility Mapping Combining Information Gain Ratio and Support Vector Machines: A Case Study from Wushan Segment in the Three Gorges Reservoir Area, China. Appl. Sci. 2019, 9, 4756. [Google Scholar] [CrossRef] [Green Version]
- Xie, W.; Li, X.S.; Jian, W.B.; Yang, Y.; Liu, H.W.; Robledo, L.F.; Nie, W. A Novel Hybrid Method for Landslide Susceptibility Mapping-Based GeoDetector and Machine Learning Cluster: A Case of Xiaojin County, China. ISPRS Int. J. Geo-Inf. 2021, 10, 93. [Google Scholar] [CrossRef]
- Luo, L.; Pei, X.; Cui, S.; Huang, R.; Zhu, L.; He, Z. Combined selection of susceptibility assessment factors for Jiuzhaigou earthquake-induced landslides. Chin. J. Rock Mech. Eng. 2021, 40, 2306–2319. [Google Scholar]
- Thai, P.B.; Biswajeet, P.; Dieu, T.B.; Indra, P.; Mb, D. A comparative study of different machine learning methods for landslide susceptibility assessment: A case study of Uttarakhand area (India). Environ. Model. Softw. 2016, 84, 240–250. [Google Scholar] [CrossRef]
- Chen, W.; Peng, J.; Hong, H.; Shahabi, H.; Pradhan, B.; Liu, J.; Zhu, A.-X.; Pei, X.; Duan, Z. Landslide susceptibility modelling using GIS-based machine learning techniques for Chongren County, Jiangxi Province, China. Sci. Total Environ. 2018, 626, 1121–1135. [Google Scholar] [CrossRef]
- Huang, F.; Cao, Z.; Guo, J.; Jiang, S.-H.; Li, S.; Guo, Z. Comparisons of heuristic, general statistical and machine learning models for landslide susceptibility prediction and mapping. Catena 2020, 191, 104580. [Google Scholar] [CrossRef]
- Roy, J.; Saha, S.; Arabameri, A.; Blaschke, T.; Bui, D.T. A Novel Ensemble Approach for Landslide Susceptibility Mapping (LSM) in Darjeeling and Kalimpong Districts, West Bengal, India. Remote Sens. 2019, 11, 2866. [Google Scholar] [CrossRef] [Green Version]
- Hong, H.; Shahabi, H.; Shirzadi, A.; Chen, W.; Chapi, K.; Bin Ahmad, B.; Roodposhti, M.S.; Hesar, A.Y.; Tian, Y.; Bui, D.T. Landslide susceptibility assessment at the Wuning area, China: A comparison between multi-criteria decision making, bivariate statistical and machine learning methods. Nat. Hazards 2018, 96, 173–212. [Google Scholar] [CrossRef]
- Yuanbo, L.; Ruiqing, N.; Yu, Y.X.; Kaixiang, Z. Application of the Rotation Forest Model in Landslide Susceptibility Assessment. Geomat. Inf. Sci. Wuhan Univ. 2018, 43, 959–964. [Google Scholar] [CrossRef]
- Nefeslioglu, H.A.; Gokceoglu, C.; Sonmez, H. An assessment on the use of logistic regression and artificial neural networks with different sampling strategies for the preparation of landslide susceptibility maps. Eng. Geol. 2008, 97, 171–191. [Google Scholar] [CrossRef]
- Senem, T. Completeness of landslide inventory and landslide susceptibility mapping using logistic regression method in Ceyhan Watershed (southern Turkey). Arab. J. Geosci. 2021, 14, 1706. [Google Scholar] [CrossRef]
- Sørensen, R.; Zinko, U.; Seibert, J. On the calculation of the topographic wetness index: Evaluation of different methods based on field observations. Hydrol. Earth Syst. Sci. 2006, 10, 101–112. [Google Scholar] [CrossRef] [Green Version]
- Dan, F. Spatial Distribution Characteristics Analysis and Susceptibility Evaluation of Earthquake-Induced Landslide in Beichuan County Based on GIS; Capital Normal University: Beijing, China, 2012. [Google Scholar]
- Xi, C. Detecting Ground Deformation and Assessing Landslide Susceptibility in Qinzhou District Based on SBAS-InSAR Technique; Lanzhou University: Gansu, China, 2018. [Google Scholar]
- Park, S.; Choi, C.; Kim, B.; Kim, J. Landslide susceptibility mapping using frequency ratio, analytic hierarchy process, logistic regression, and artificial neural network methods at the Inje area, Korea. Environ. Earth Sci. 2013, 68, 1443–1464. [Google Scholar] [CrossRef]
- DU, G.; Zhang, Y.-S.; Iqbal, J.; Yang, Z.-H.; Yao, X. Landslide susceptibility mapping using an integrated model of information value method and logistic regression in the Bailongjiang watershed, Gansu Province, China. J. Mt. Sci. 2017, 14, 249–268. [Google Scholar] [CrossRef]
- Ghosh, T.; Bhowmik, S.; Jaiswal, P.; Ghosh, S.; Kumar, D. Generating Substantially Complete Landslide Inventory using Multiple Data Sources: A Case Study in Northwest Himalayas, India. J. Geol. Soc. India 2020, 95, 45–58. [Google Scholar] [CrossRef]
- Xiaoxia, Z.; Li, Z.; Shuwen, Y. Characteristics of rainfall-induced loess landslides and their threshold rainfall in Lanzhou. Chin. J. Geol. Hazard Control. 2019, 30, 24–31. [Google Scholar]
- Bui, D.T.; Tuan, T.A.; Klempe, H.; Pradhan, B.; Revhaug, I. Spatial prediction models for shallow landslide hazards: A comparative assessment of the efficacy of support vector machines, artificial neural networks, kernel logistic regression, and logistic model tree. Landslides 2015, 13, 361–378. [Google Scholar] [CrossRef]
- Tanyas, H.; Rossi, M.; Alvioli, M.; van Westen, C.J.; Marchesini, I. A global slope unit-based method for the near real-time prediction of earthquake-induced landslides. Geomorphology 2018, 327, 126–146. [Google Scholar] [CrossRef]
- Das, I.; Sahoo, S.; Van Westen, C.; Stein, A.; Hack, H. Landslide susceptibility assessment using logistic regression and its comparison with a rock mass classification system, along a road section in the northern Himalayas (India). Geomorphology 2010, 114, 627–637. [Google Scholar] [CrossRef]
- Bai, S.-B.; Wang, J.; Lü, G.-N.; Zhou, P.-G.; Hou, S.-S.; Xu, S.-N. GIS-based logistic regression for landslide susceptibility mapping of the Zhongxian segment in the Three Gorges area, China. Geomorphology 2010, 115, 23–31. [Google Scholar] [CrossRef]
- Christian, J.H. Applied Logistic Regression Analysis. J. R. Stat. Soc. Ser. D Stat. 1996, 45, 534–535. [Google Scholar] [CrossRef]
- Breiman, L. Random Forests. Mach. Learn. 2001, 45, 5–32. [Google Scholar] [CrossRef] [Green Version]
- Kausar, N.; Majid, A. Random forest-based scheme using feature and decision levels information for multi-focus image fusion. Pattern Anal. Appl. 2015, 19, 221–236. [Google Scholar] [CrossRef]
- Crippen, R.E. Calculating the vegetation index faster. Remote Sens. Environ. 1990, 34, 71–73. [Google Scholar] [CrossRef]
- Vapnik, V.N. The Nature of Statistical Learning Theory. Technometrics 1997, 38, 409. [Google Scholar]
- Vapnik, V.N. An overview of statistical learning theory. IEEE Trans. Neural Netw. 1999, 10, 988–999. [Google Scholar] [CrossRef] [Green Version]
- Yao, X.; Tham, L.G.; Dai, F.C. Landslide susceptibility mapping based on Support Vector Machine: A case study on natural slopes of Hong Kong, China. Geomorphology 2008, 101, 572–582. [Google Scholar] [CrossRef]
- Chong, X.; Fuchu, D.; Xiwei, X.; Hsi, L.Y. GIS-based support vector machine modeling of earthquake-triggered landslide susceptibility in the Jianjiang River watershed, China. Geomorphology 2012, 145, 70–80. [Google Scholar] [CrossRef]
- Abe, S. Support Vector Machines for Pattern Classification; Springer: London, UK, 2005. [Google Scholar]
- Do, H.; Mordukhovich, B.S.; Sarabi, M.E. Criticality of Lagrange multipliers in extended nonlinear optimization. Optimization 2021, 70, 511–544. [Google Scholar] [CrossRef] [Green Version]
- Kalantar, B.; Pradhan, B.; Naghibi, S.A.; Motevalli, A.; Mansor, S. Assessment of the effects of training data selection on the landslide susceptibility mapping: A comparison between support vector machine (SVM), logistic regression (LR) and artificial neural networks (ANN). Geomat. Nat. Hazards Risk 2017, 9, 49–69. [Google Scholar] [CrossRef]
- Yesilnacar, E.; Topal, T. Landslide susceptibility mapping: A comparison of logistic regression and neural networks methods in a medium scale study, Hendek region (Turkey). Eng. Geol. 2005, 79, 251–266. [Google Scholar] [CrossRef]
- Van Phong, T.; Phan, T.T.; Prakash, I.; Singh, S.K.; Shirzadi, A.; Chapi, K.; Ly, H.-B.; Ho, L.S.; Quoc, N.K.; Pham, B.T. Landslide susceptibility modeling using different artificial intelligence methods: A case study at Muong Lay district, Vietnam. Geocarto Int. 2019, 36, 1685–1708. [Google Scholar] [CrossRef]
- Yu, X.Y.; Wang, Y.; Niu, R.Q.; Hu, Y.J. A Combination of Geographically Weighted Regression, Particle Swarm Optimization and Support Vector Machine for Landslide Susceptibility Mapping: A Case Study at Wanzhou in the Three Gorges Area, China. Int. J. Environ. Res. Public Health 2016, 13, 487. [Google Scholar] [CrossRef] [Green Version]
- Huang, F.; Yin, K.; Huang, J.; Gui, L.; Wang, P. Landslide susceptibility mapping based on self-organizing-map network and extreme learning machine. Eng. Geol. 2017, 223, 11–22. [Google Scholar] [CrossRef]
- Bordoni, M.; Bittelli, M.; Valentino, R.; Chersich, S.; Persichillo, M.G.; Meisina, C. Soil Water Content Estimated by Support Vector Machine for the Assessment of Shallow Landslides Triggering: The Role of Antecedent Meteorological Conditions. Environ. Model. Assess. 2017, 23, 333–352. [Google Scholar] [CrossRef]
- Zhice, F.; Yi, W.; Gonghao, D.; Ling, P. Landslide Susceptibility Mapping Using Rotation Forest Ensemble Technique with Different Decision Trees in the Three Gorges Reservoir Area, China. Remote Sens. 2021, 13, 238. [Google Scholar] [CrossRef]
- Peng, L.; Niu, R.; Huang, B.; Wu, X.; Zhao, Y.; Ye, R. Landslide susceptibility mapping based on rough set theory and support vector machines: A case of the Three Gorges area, China. Geomorphology 2014, 204, 287–301. [Google Scholar] [CrossRef]
- Chen, T.; Niu, R.; Du, B.; Wang, Y. Landslide spatial susceptibility mapping by using GIS and remote sensing techniques: A case study in Zigui County, the Three Georges reservoir, China. Environ. Earth Sci. 2014, 73, 5571–5583. [Google Scholar] [CrossRef]
- Runqing, Y.; Shiyao, L.; Fei, G.; Xiaolin, F.; Ruiqing, N. RS and GIS analysis on relationship between landslide susceptibility and land use change in Three Gorges Reservoir area. J. Eng. Geol. 2021, 29, 724–733. [Google Scholar]
- Ye, H.; Xianmin, W.; Yongwei, L.; Peiyun, X.; Wenxiang, X. Dynamic development of landslide susceptibility based on slope unit and deep neural networks. Landslides 2020, 18, 281–302. [Google Scholar] [CrossRef]

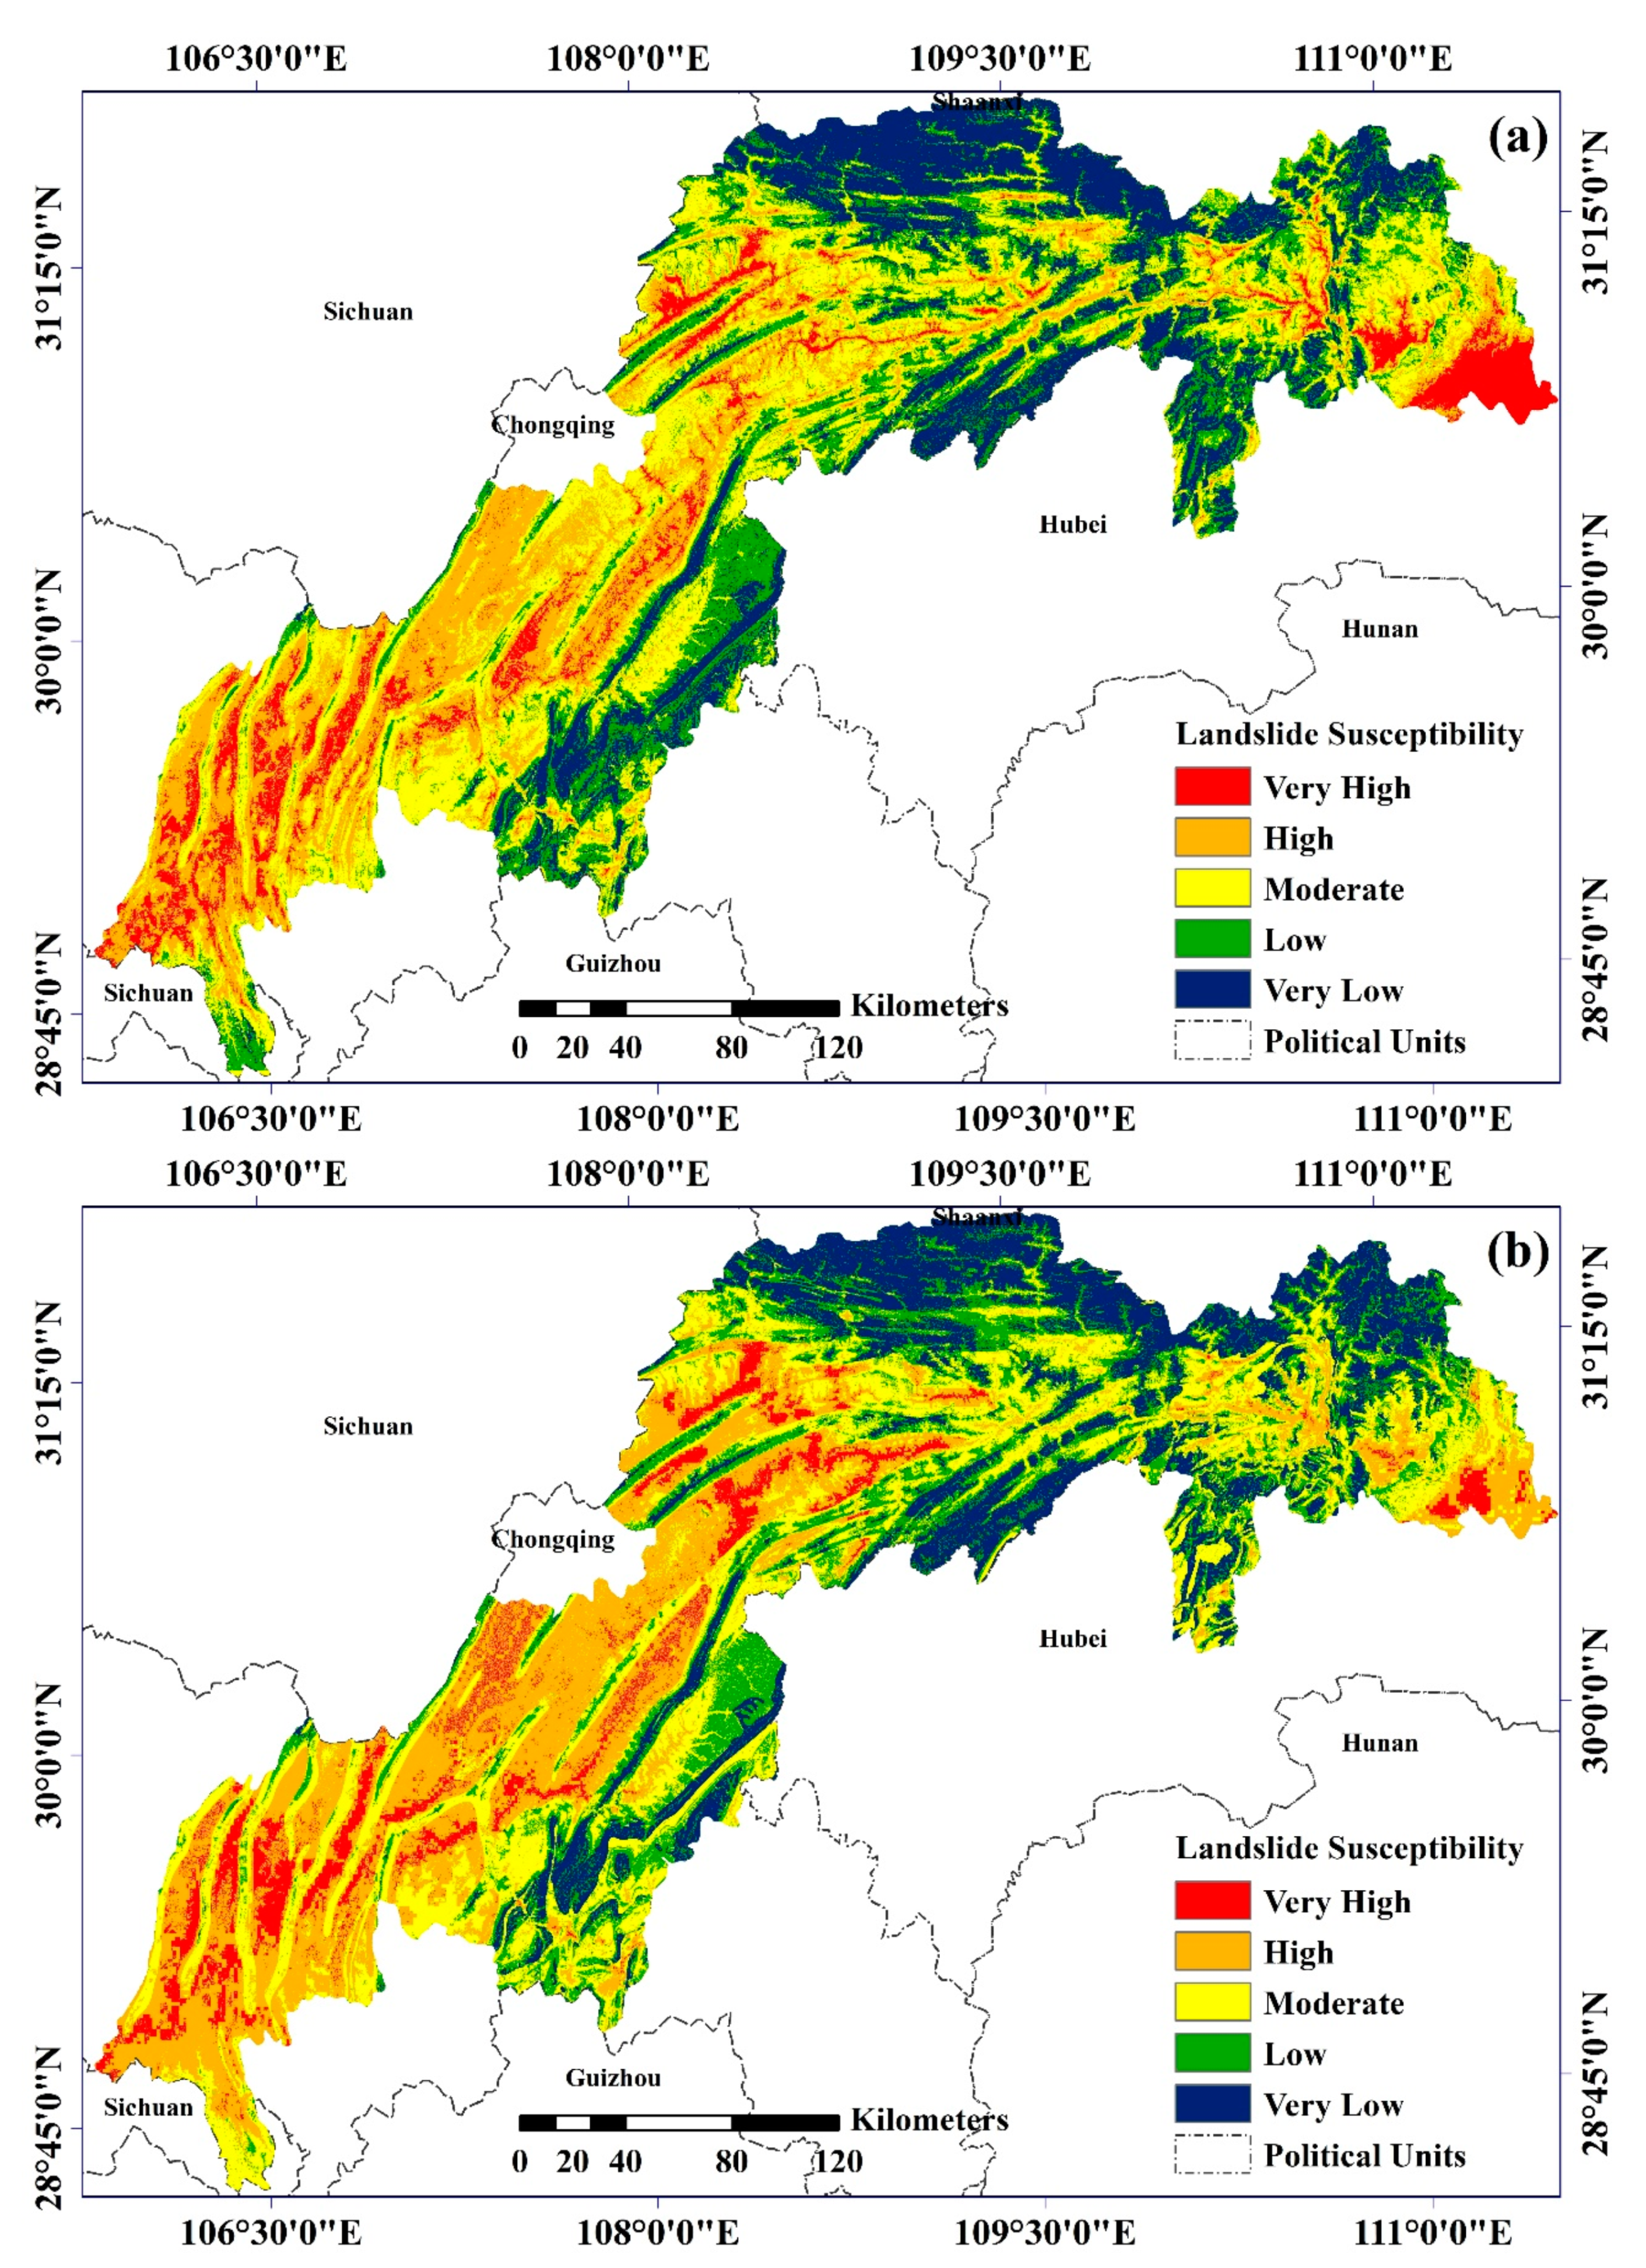
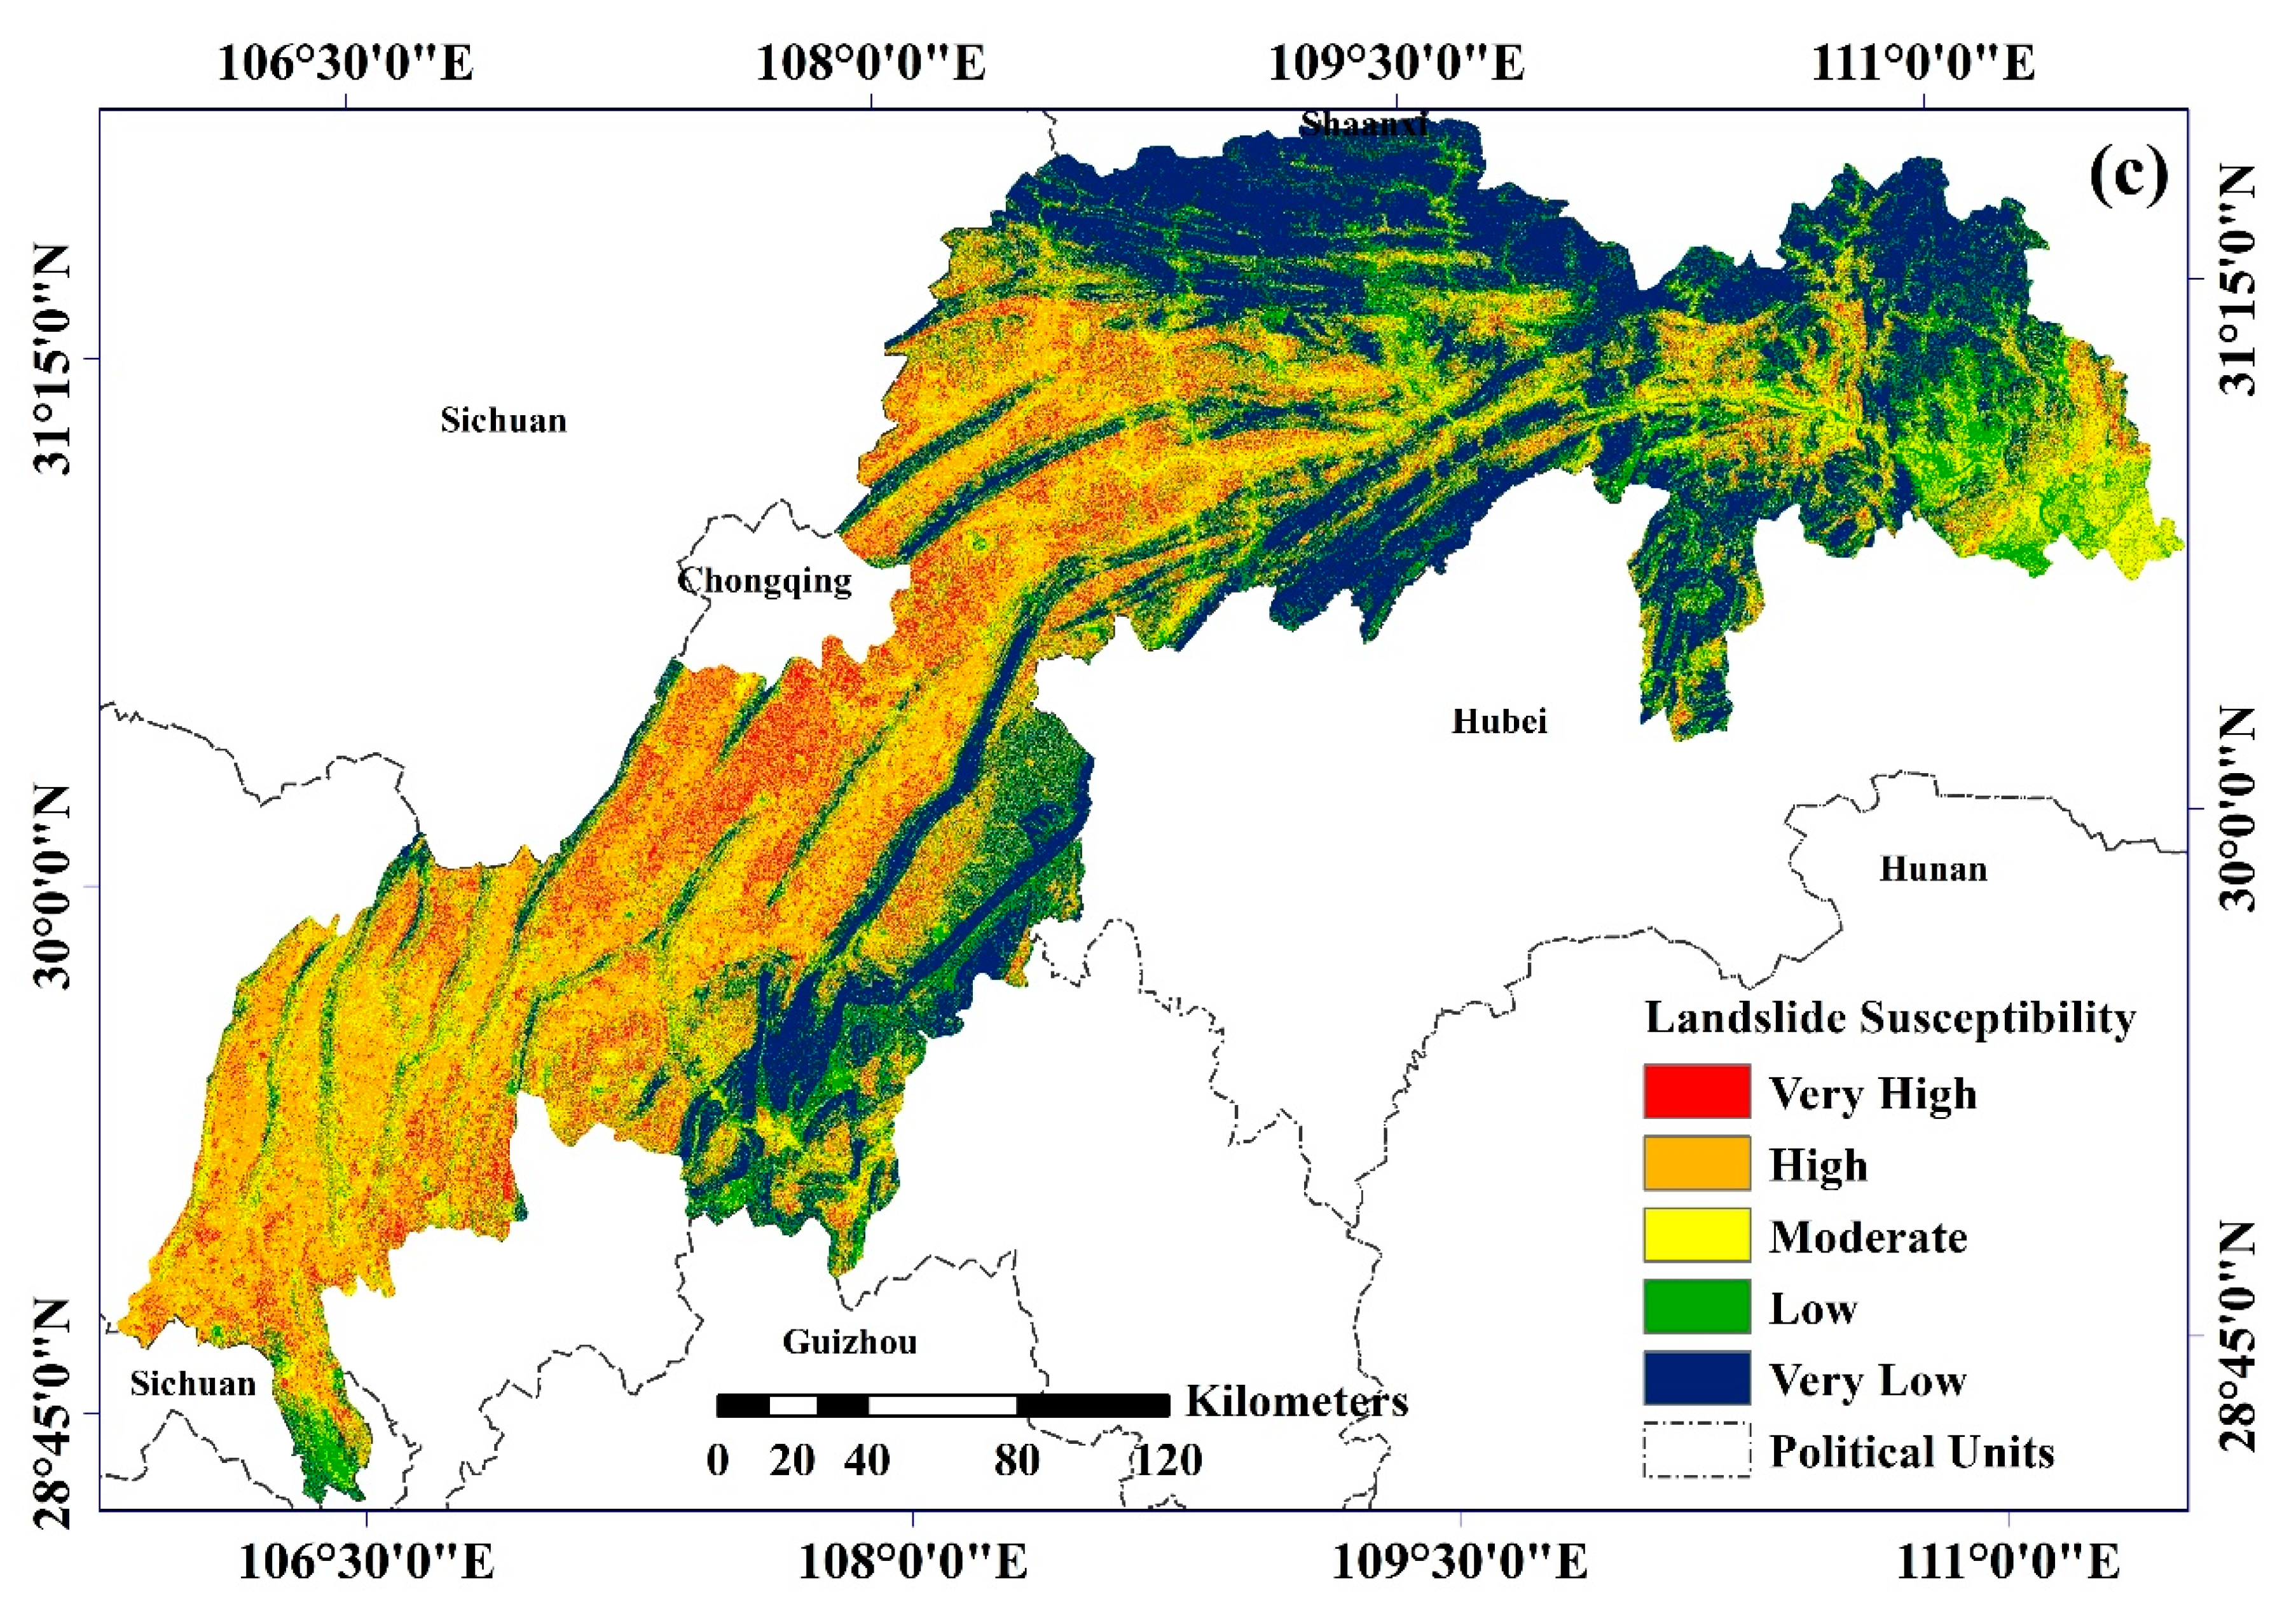

| Landslide Susceptibility Grade | LR | RF | SVM |
|---|---|---|---|
| Very High | 8.42 | 12.09 | 12.35 |
| High | 37.03 | 35.55 | 69.17 |
| Moderate | 38.01 | 37.26 | 10.90 |
| Low | 11.43 | 12.21 | 5.41 |
| Very Low | 5.12 | 2.89 | 2.17 |
| LR | RF | SVM | |
|---|---|---|---|
| Precision (%) | 81.49 | 86.60 | 92.23 |
| Recall (%) | 84.79 | 86.38 | 92.66 |
| F1-score (%) | 83.11 | 86.49 | 92.44 |
| Susceptibility (%) | 84.79 | 86.38 | 92.66 |
| 1-Specificity (%) | 80.75 | 86.58 | 92.20 |
Publisher’s Note: MDPI stays neutral with regard to jurisdictional claims in published maps and institutional affiliations. |
© 2022 by the authors. Licensee MDPI, Basel, Switzerland. This article is an open access article distributed under the terms and conditions of the Creative Commons Attribution (CC BY) license (https://creativecommons.org/licenses/by/4.0/).
Share and Cite
Cheng, J.; Dai, X.; Wang, Z.; Li, J.; Qu, G.; Li, W.; She, J.; Wang, Y. Landslide Susceptibility Assessment Model Construction Using Typical Machine Learning for the Three Gorges Reservoir Area in China. Remote Sens. 2022, 14, 2257. https://doi.org/10.3390/rs14092257
Cheng J, Dai X, Wang Z, Li J, Qu G, Li W, She J, Wang Y. Landslide Susceptibility Assessment Model Construction Using Typical Machine Learning for the Three Gorges Reservoir Area in China. Remote Sensing. 2022; 14(9):2257. https://doi.org/10.3390/rs14092257
Chicago/Turabian StyleCheng, Junying, Xiaoai Dai, Zekun Wang, Jingzhong Li, Ge Qu, Weile Li, Jinxing She, and Youlin Wang. 2022. "Landslide Susceptibility Assessment Model Construction Using Typical Machine Learning for the Three Gorges Reservoir Area in China" Remote Sensing 14, no. 9: 2257. https://doi.org/10.3390/rs14092257
APA StyleCheng, J., Dai, X., Wang, Z., Li, J., Qu, G., Li, W., She, J., & Wang, Y. (2022). Landslide Susceptibility Assessment Model Construction Using Typical Machine Learning for the Three Gorges Reservoir Area in China. Remote Sensing, 14(9), 2257. https://doi.org/10.3390/rs14092257