Article

Monitoring Lightning Location Based on Deep Learning Combined with Multisource Spatial Data

1
Collaborative Innovation Center on Forecast and Evaluation of Meteorological Disasters, Nanjing University of Information Science & Technology, Nanjing 210044, China
2
Geographic Science College, Nanjing University of Information Science & Technology, Nanjing 210044, China
3
Key Laboratory of Virtual Geographic Environment, Nanjing Normal University, Ministry of Education, Nanjing 210023, China
4
Department of Geography, The Pennsylvania State University, University Park, PA 16802, USA
*
Author to whom correspondence should be addressed.
Remote Sens. 2022, 14(9), 2200; https://doi.org/10.3390/rs14092200
Submission received: 24 February 2022 / Revised: 23 April 2022 / Accepted: 1 May 2022 / Published: 4 May 2022

Abstract

:
Lightning is an important cause of casualties, and of the interruption of power supply and distribution facilities. Monitoring lightning locations is essential in disaster prevention and mitigation. Although there are many ways to obtain lightning information, there are still substantial problems in intelligent lightning monitoring. Deep learning combined with weather radar data and land attribute data can lay the foundation for future monitoring of lightning locations. Therefore, based on the residual network, the Lightning Monitoring Residual Network (LM-ResNet) is proposed in this paper to monitor lightning location. Furthermore, comparisons with GoogLeNet and DenseNet were also conducted to evaluate the proposed model. The results show that the LM-ResNet model has significant potential in monitoring lightning locations. In this study, we converted the lightning monitoring problem into a binary classification problem and then obtained weather radar product data (including the plan position indicator (PPI), composite reflectance (CR), echo top (ET), vertical integral liquid water (VIL), and average radial velocity (V)) and land attribute data (including aspect, slope, land use, and NDVI) to establish a lightning feature dataset. During model training, the focal loss function was adopted as a loss function to address the constructed imbalanced lightning feature dataset. Moreover, we conducted stepwise sensitivity analysis and single factor sensitivity analysis. The results of stepwise sensitivity analysis show that the best performance can be achieved using all the data, followed by the combination of PPI, CR, ET, and VIL. The single factor sensitivity analysis results show that the ET radar product data are very important for the monitoring of lightning locations, and the NDVI land attribute data also make significant contributions.

1. Introduction

Lightning is a phenomenon of intense electric discharges among clouds, the air, the ground, or various parts of clouds. Cloud-to-ground (CG) lightning often produces immense destructive effects in an instant. CG is an important cause of casualties, of the interruption of power supply and distribution facilities and computer information systems, and of burning or even explosions in storage, oil refineries, and oil fields [1,2,3]. The documented number of lightning fatalities worldwide is presently greater than 4000 each year [4], and the economic loss comprises hundreds of millions of dollars. In addition, fire hazard studies have shown the risk of lightning-induced fires, which may ultimately cause tanks to boil over, thus threatening petroleum storage facilities [5]. Moreover, due to the small spatial scale and short life cycle of lightning, it is difficult to accurately observe and predict.
The monitoring of CG lightning mostly uses lightning location systems that measure the sound, light, and electromagnetic field information of lightning radiation to determine the spatial position and discharge parameters of lightning discharge [6]. Many lightning location studies have been carried out. Among these lightning location methods, time of arrival technology is an approach for determining the location of lightning radiation, which depends on the different arrival times of the gauging sensor [7]. However, this approach uses waveform, cross-correlation processing, and complex signal filtering, which requires a large amount of calculation and slow positioning speeds. Another lighting location method is direction finding (DF), which is defined as the crossing of messages accepted from at least three sensors to ascertain the strike spot [8] and to estimate the electric field associated with the signal to understand its polarity [9]. Time reversal technology is employed for the three-dimensional positioning of lightning discharges [10]; however, it takes a long time to optimize the space using the TR method, and it is difficult to locate the entire thunderstorm process in real time.
Recently, artificial intelligence and machine learning techniques have become increasingly mature. Data mining models, including classification trees, chi-squared automatic interaction detectors, induction of decision trees and neural network radial basis functions, multilayer perceptrons, and support vector machines, are used to evaluate and forecast the probability of lightning occurrence [11,12]. A five-category classification model for the raw lightning waves in VLF/LF bands was proposed with a deep convolutional neural network [13]. The striking scope was determined from high-speed videos and currents were measured in negative CG lightning [9]. The characteristic values of overvoltage are extracted by wavelet transform and classified by a support vector machine [14]. An original approach using deep learning, coding feature matching, was proposed, which not only greatly improves the positioning speed but also has greater precision. The method also has a strong positioning and anti-interference ability for maintaining high-quality lightning locations under low signal-to-noise ratio conditions [15]. These studies show that some nonobvious feature information can be obtained through machine learning. However, it is difficult to directly predict lightning using the lightning location data obtained through these methods.
A weather radars has high temporal and spatial resolution and is one of the best apparatuses for thunderstorm observations. Weather radars can provide characteristic parameters of echoes that characterize the dynamics and microphysics of thunderstorm clouds during electrification. The calculation of the relationship between lightning frequency and other thundercloud parameters shows that lightning frequency is correlated with radar reflectivity, precipitation rate, updraft velocity, cloud radius, ice crystal concentration, and shotgun particles [16]. More importantly, significant progress has been made in radar extrapolation, which can show weather conditions from one to two hours into the future [17,18]. Lightning location data combined with radar product data can provide better lightning monitoring and early warning. Furthermore, some studies have shown that land properties (elevation, slope, land uses, and soil type) also exert a certain influence on the occurrence of CG lightning [19,20]. It has become possible to utilize deep learning to detect lightning using multiple data sources (radar product data and land attributes).
In this study, the lightning location monitoring problem is converted into a binary classification problem. Lightning location data and multiple data are applied to establish a lightning feature dataset by a sliding window. Subsequently, deep learning is employed to monitor lightning locations. Based on the residual network, the Lightning Monitoring Residual Network (LM-ResNet) is proposed in this paper for lightning location monitoring. To further evaluate these constructed models, the model results were compared with GoogLeNet and DenseNet. When training the models, we use the focal loss function as the loss function to address the constructed imbalanced lightning feature dataset. Moreover, the relative importance of each input variable in monitoring lightning locations was evaluated based on stepwise and single sensitivity analyses. This work monitors lightning locations based on multiple data points and carries out a stepwise and single sensitivity analysis. This study is anticipated to provide a basis for new exploration to mitigate and prevent lightning catastrophes, and to lay the foundation for lightning location prediction.
The main contributions of this study are presented as follows:
(1)
Multiple datasets (lightning location data, radar product data and land attribute data) are utilized to construct lightning feature datasets, especially considering the impact of land attribute data on the results of monitoring lightning locations.
(2)
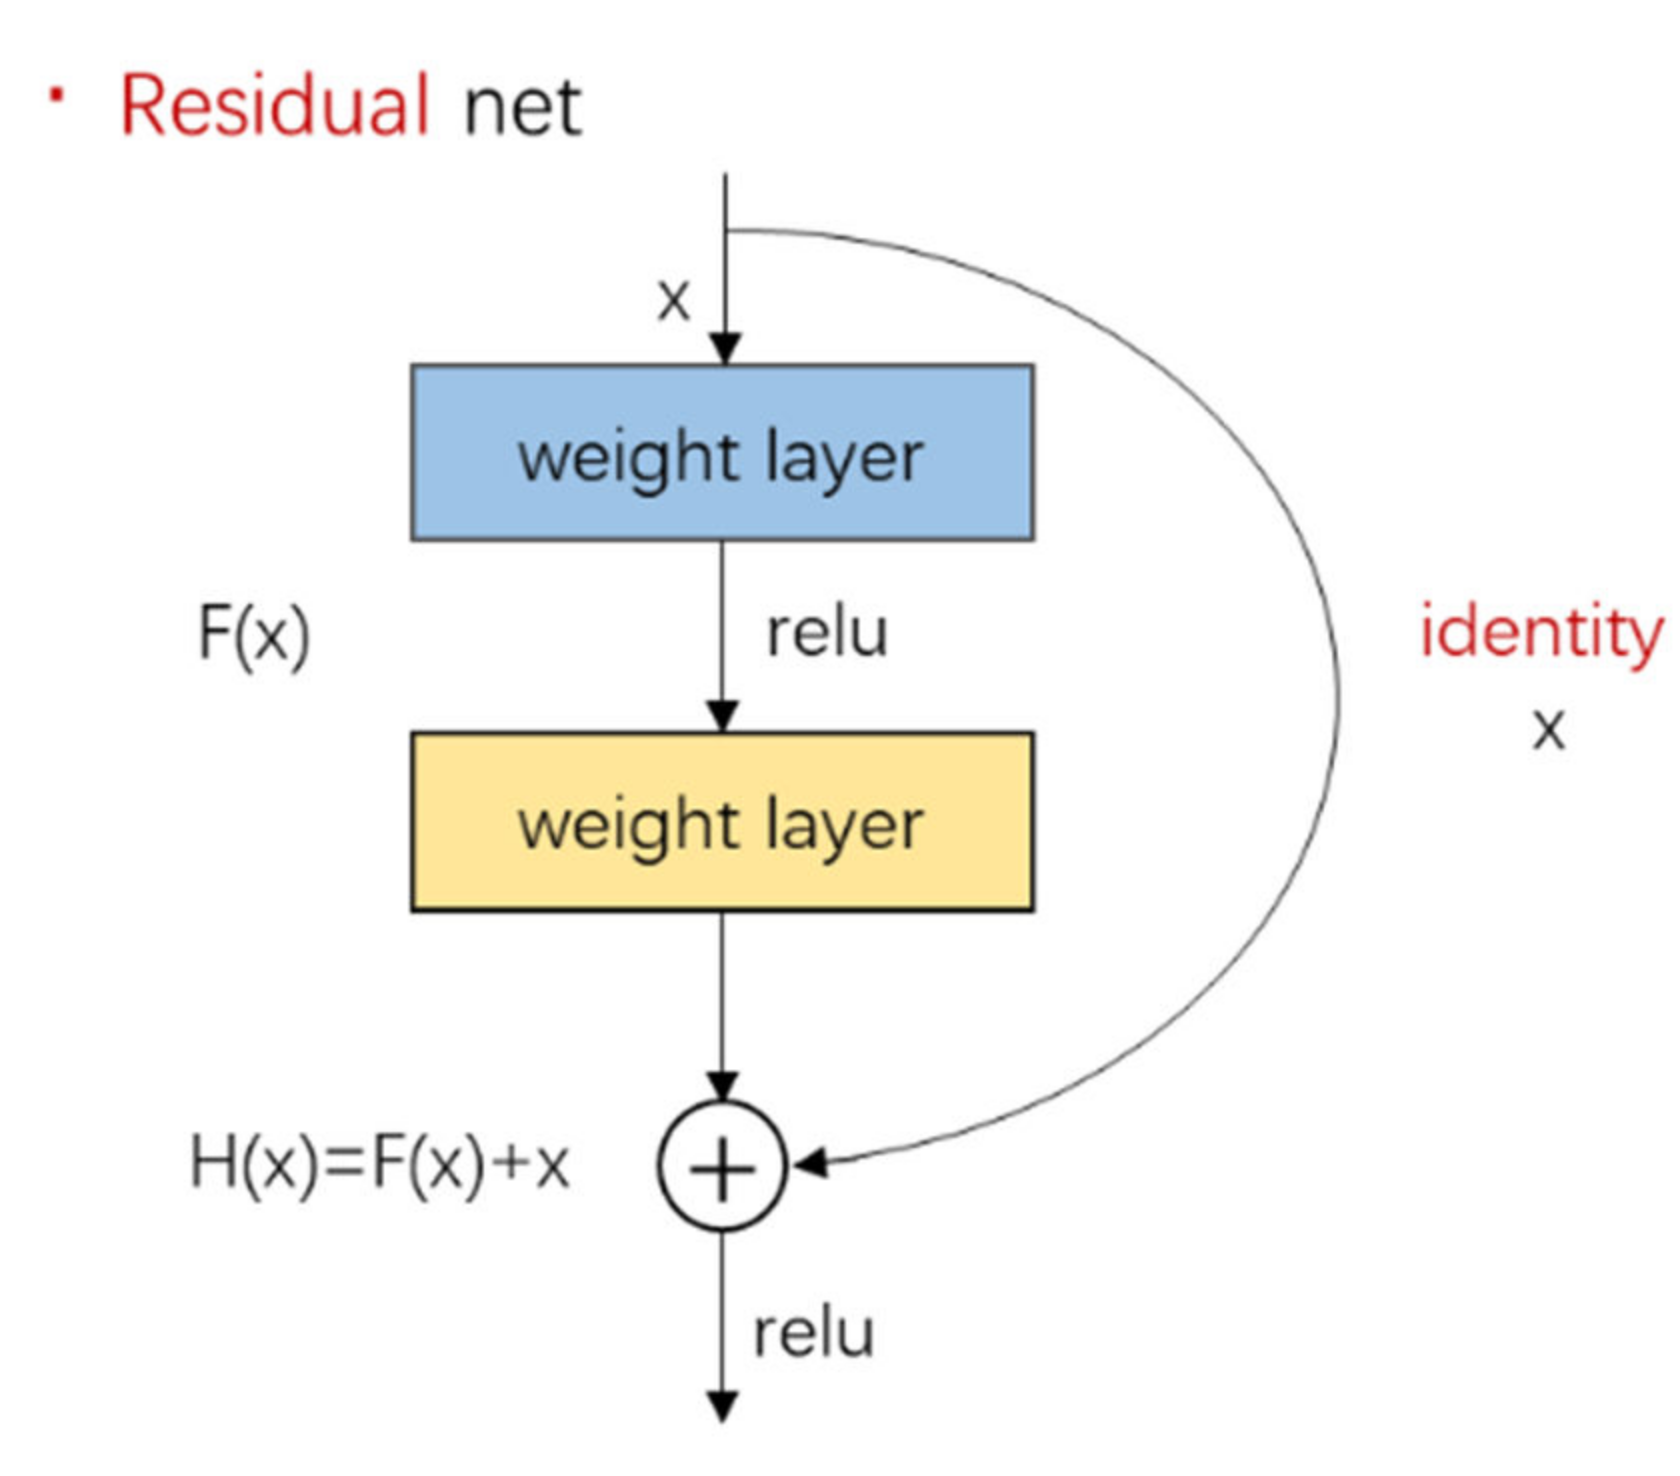
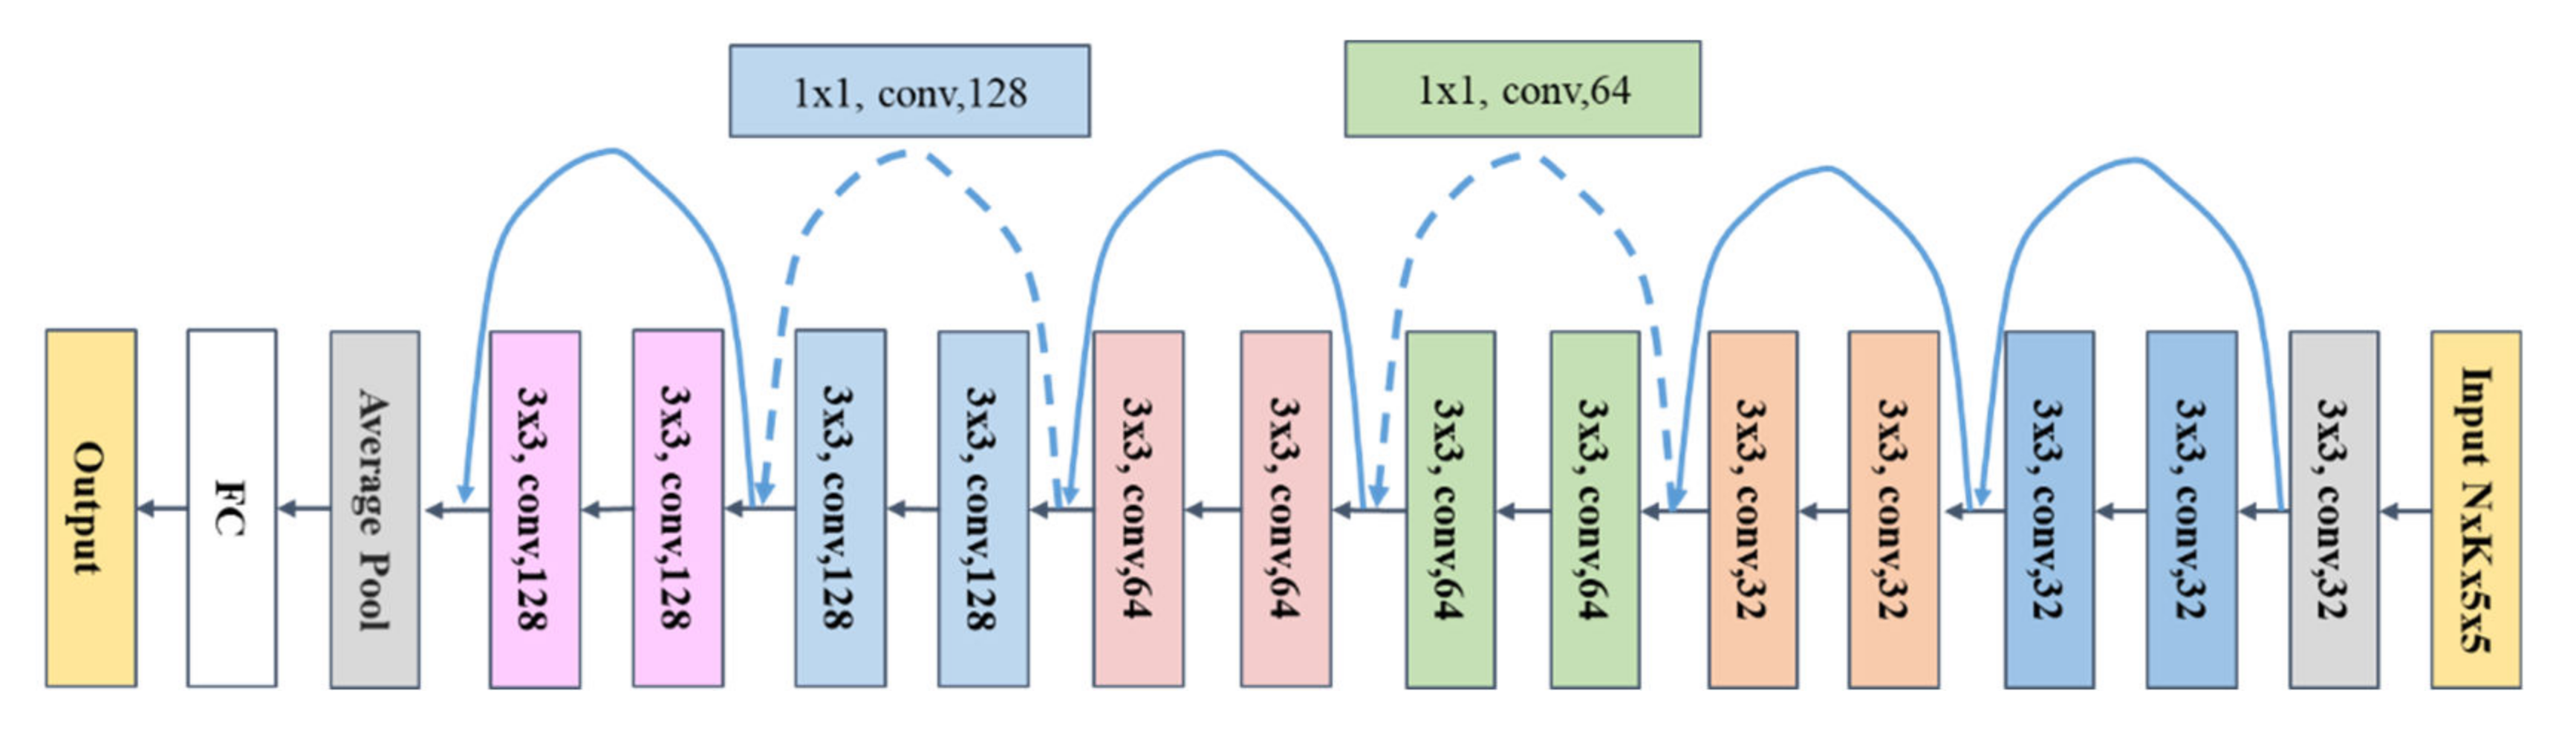
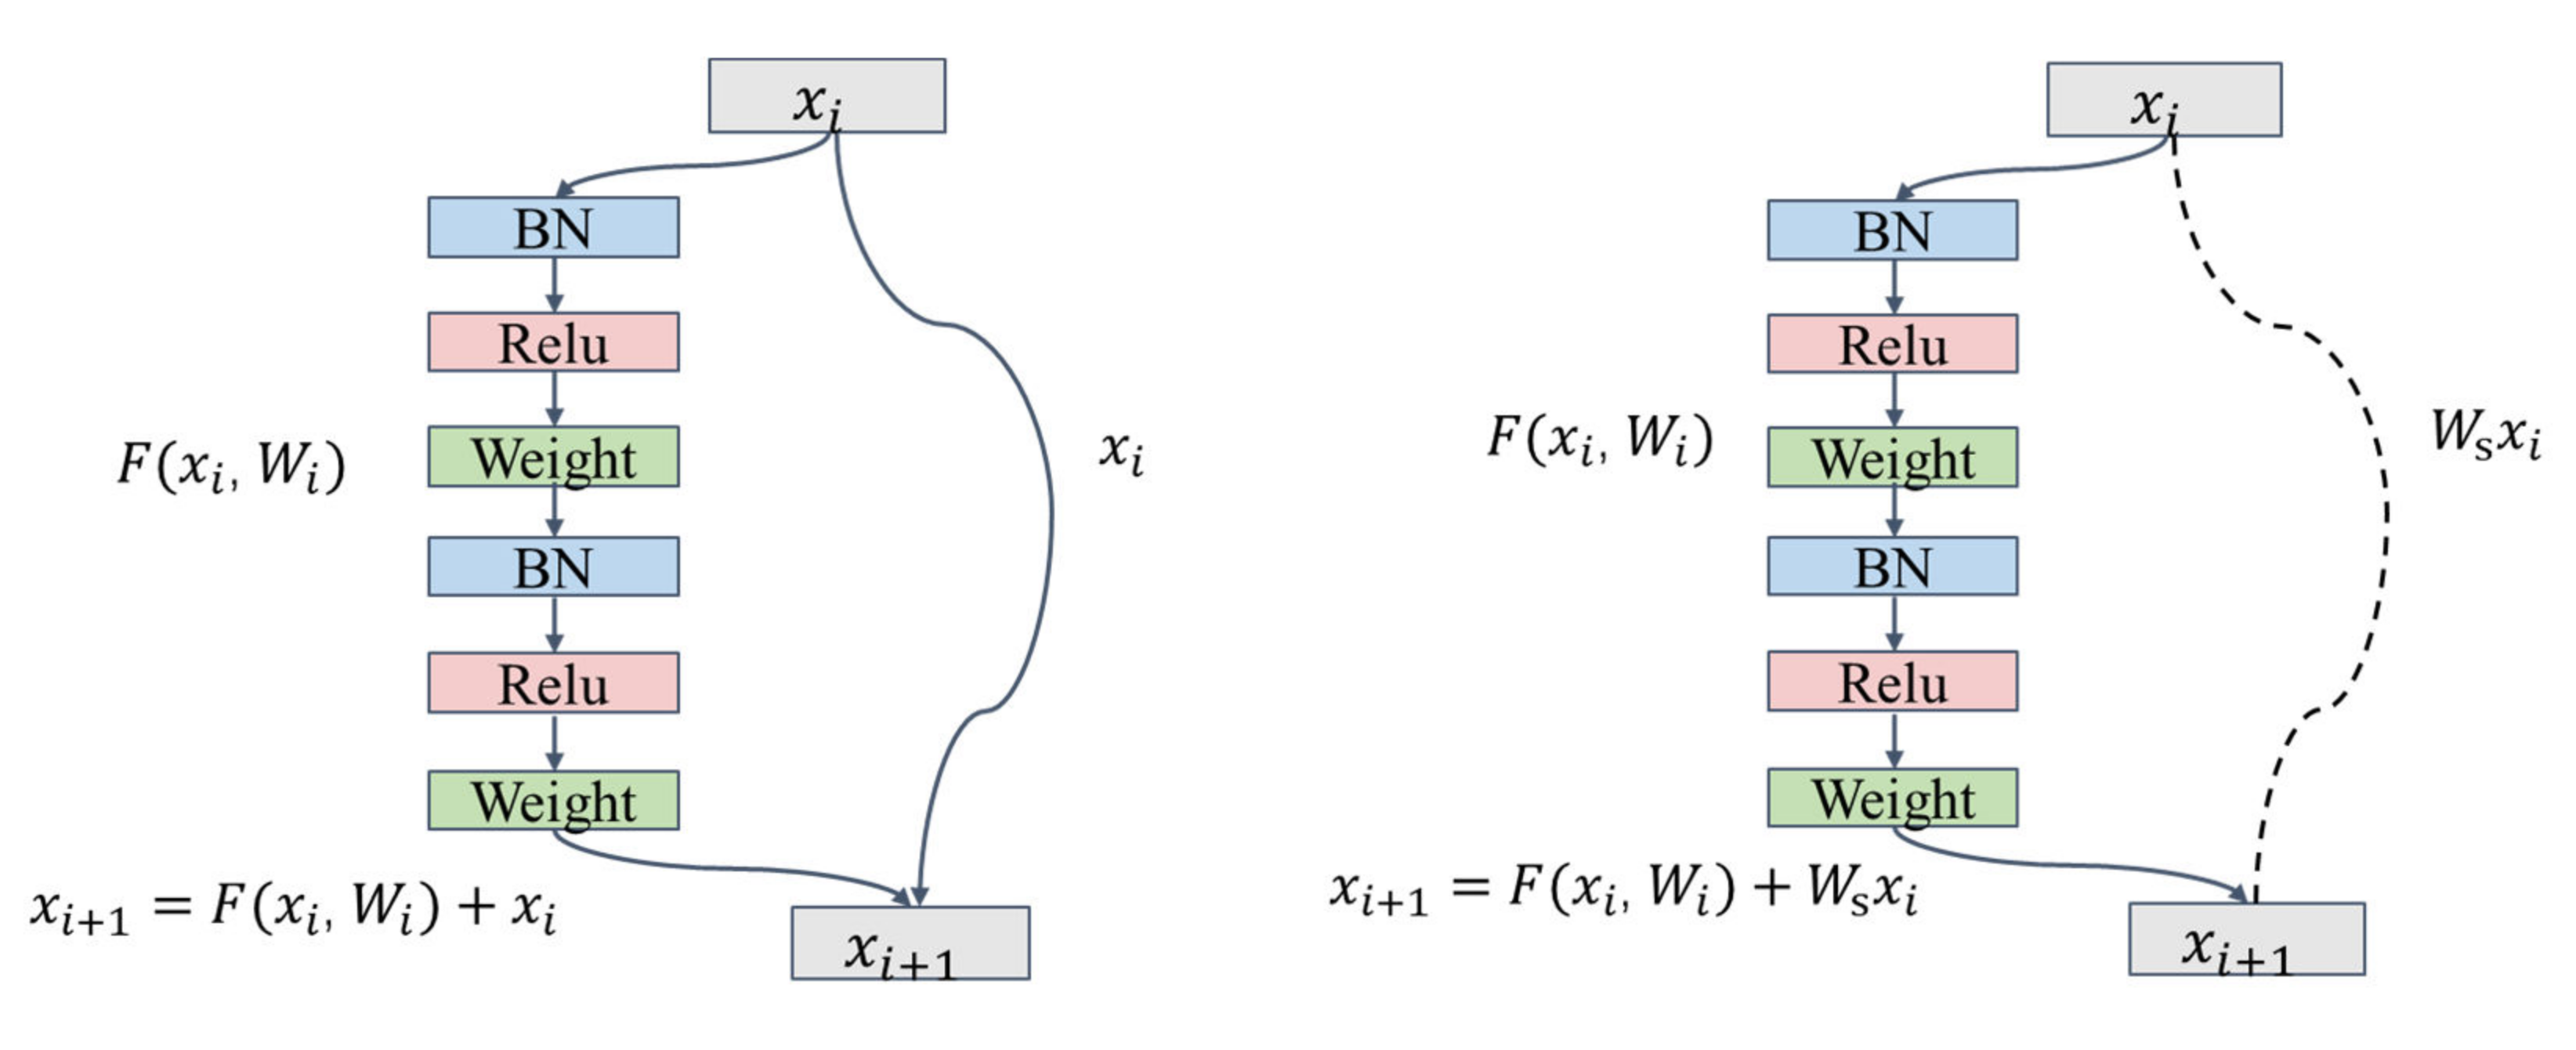
Based on ResNet, LM-ResNet is proposed for lightning location monitoring, and the model result is compared with GoogLeNet and DenseNet.
(3)
The relative significance of each input variable in observing lightning locations is determined based on stepwise and single sensitivity analyses to provide support for subsequent practical application.

2. Materials and Methods
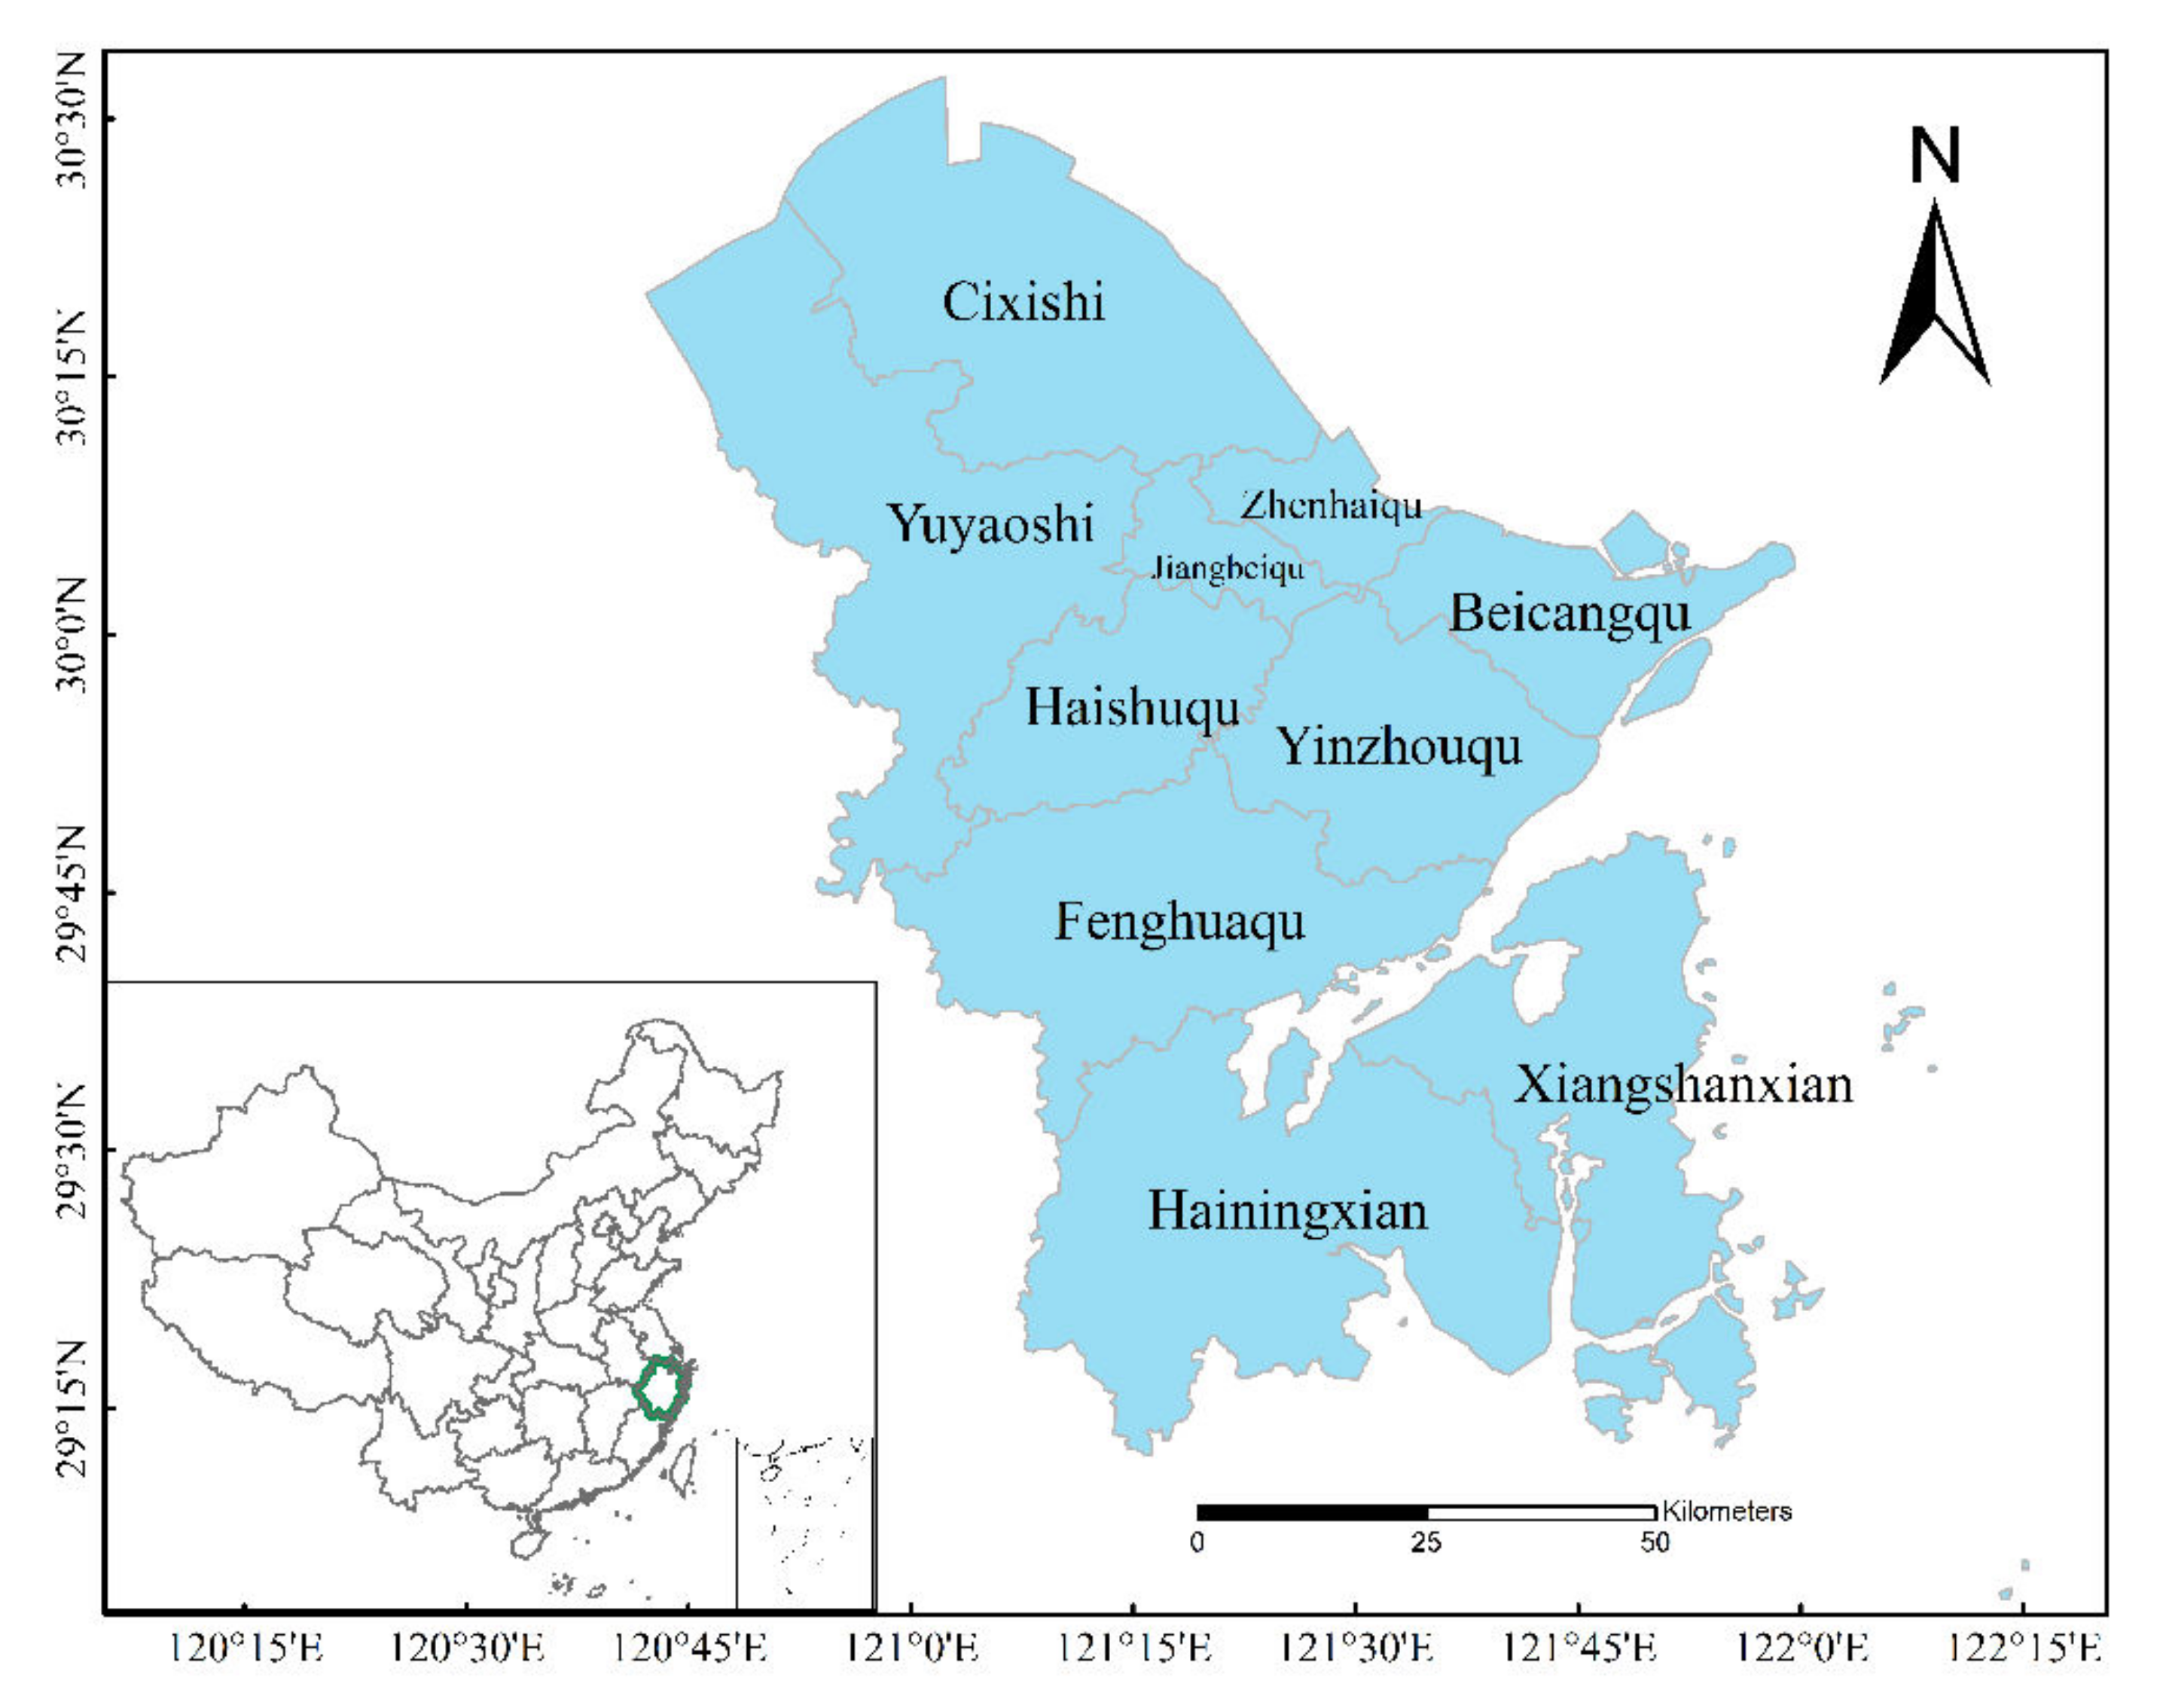
2.1. Study Area

The study area is Ningbo, which is a sub-provincial city located in northeastern Zhejiang Province, as shown in Figure 1. The study area extends from 120°55′E to 122°16′E and from 28°51′N to 30°33′N. The modest latitude has a mild and humid subtropical monsoon climate with four distinct seasons. Its terrain is steep in the southwest and low in the northeast. The entire administrative area of Ningbo City has a population of 9.4 million (9,404,283). The GDP is approximately CNY 1240 billion; it was ranked 12th among 300 cities in China. The climate in the study area is complex and changeable with a high incidence of lightning. In the past five years, more than 480 lightning disasters have occurred. Direct economic losses amount to millions of dollars every year.

2.2. Data

2.2.1. Lightning Location Data

The Ningbo Meteorological Bureau provides lightning location data with ADTD lightning location systems. The ADTD [21] systems are ground-based advanced time of arrival and direction systems with CG lightning detection sensors. The detection radius of an individual station is approximately 300 km [22]. The error is normally from hundreds of meters to kilometers, and the efficiency ranges between 80% and 90%. The lightning data include fields denoting the time, polarity effect, location, peak intensity, and other information of the ground flash return process. In this study, lightning location data with an intensity of less than 10 KA/m were removed. The lightning data and radar reflectivity data are spatially matched. If the radar reflectivity is less than 10 dBz, the corresponding lightning location data are eliminated. After data processing, the lightning location data are regarded as real lightning observation data.

2.2.2. Weather Radar Data

A weather radar is an efficient instrument for supervising microscale and mesoscale strong convective systems. Weather radar data not only provide information involving the position, intensity, and movement of precipitation particles, but also has high spatial and temporal resolution (1 km/6 min). Many studies [23,24,25] have shown that the elevation of the radar echo top and echo intensity have a distinct correlation with the occurrence of lightning. In this article, the Ningbo Meteorological Bureau provides S-band Doppler weather radar system scans, generates basic data, and then calculates the radar product data using a meteorological algorithm that includes the plan position indicator (PPI), composite reflectance (CR), echo top (ET), vertical integral liquid water (VIL), and average radial velocity (V).
The PPI is a radar product that is derived from different distances to the radar at different elevations above the ground [26,27,28]. The PPI starts scanning from the bottommost angle and continuously augments the scanning height. Next, nine elevation angle datapoints are provided on the basis of a particular scanning strategy. A complete body scan of data is performed every 5–6 min. Every elevation scan forms a cone and outputs two-dimensional rasters of identical size. All two-dimensional raster data generated at disparate elevation angles form vertically aligned, PPI raster data. The CR is a product that projects the maximum reflectivity onto a Cartesian grid in the radar volume scan [29,30]. The strength of the echo can be determined, and the structure of a storm and a strong snow belt can be determined. Its change over time can be utilized to determine the future trend of the precipitation echo movement. ET represents the height of the echo top based on the highest elevation angle and the mean sea level (MSL) as the reference (without interpolation) when the reflectance factor ≥18 dBz (adjustable threshold) is detected [31,32]. The formation of a horizontal, two-dimensional distribution of numerical image products can be used identify convective storms by locating the highest summit, which is an important indicator of the strength of convective weather, and indirectly reflects the strength of vertical updrafts in a cloud. VIL [16,33] is defined as a suspending perceptible quality in unit volume over the cloud bottom. VIL is a kind of new product material that is obtained by processing the radar scanning material to obtain a general distribution of the echo value from each observing layer by way of radar, from which a three-dimensional distribution of aqueous material within the radar detection range is obtained by inversion. VIL applies the Doppler effect as the basic principle to calculate the average radial velocity of the precipitation target in each volume [34,35]. VIL can determine the wind speed relative to the ground, detect the atmospheric structure, and define the low-level or middle-level jet stream according to the change in wind speed with altitude. Moreover, not only can the wind direction rotating clockwise or counterclockwise with height be determined, but also the cold and warm advection of each layer, and the storm structure can be detected. In addition, VIL can be employed to determine the convergence of boundaries (density discontinuities), such as fronts, trunks, and outflow boundaries.

2.2.3. Land Attributes Data

Many studies [36,37] have shown that land attributes affect the occurrence of CG lightning. The relationship between lightning activity and landform features shows a strong correlation between lightning activity and terrain slope. Research on the relationship among convective weather, vegetation, and lightning activity shows significant differences in the distribution of CG lightning strokes on various covers of vegetation. Therefore, the land attribute data applied in this study were DEM, slope, aspect, land use data, and normalized vegetation index data (NDVI).
DEM data are derived from the Shuttle Radar Topography Mission (SRTM) data of the United States space shuttle Endeavour. This dataset is generated based on the latest SRTM V4.1 data after resampling. The remote sensing monitoring spatial distribution data of land use (https://www.resdc.cn/ (accessed on 24 July 2021)) are based on the Landsat TM image achieved by human visual interpretation. The land use data include 6 essential types and 25 subordinate types of cultivated land, forestland, residential land, grassland, water area, and unused. NDVI accurately reflects the vegetation coverage on the ground. The original data were downloaded from SPOT/VEGETATION PROBA-V 1 KM PRODUCTS (http://www.vito-eodata.be/ (accessed on 24 July 2021)) with a spatial resolution of 1 km. After mosaic and projection transformation, NDVI data were obtained, which effectively reflect the distribution and changes in vegetation coverage on a ten-year scale at a spatial and temporal scale in all regions of the country.
In order to match the weather radar data, the spatial resolution of the data that we utilized was 1 km, and was strictly reduced to the same size as the weather radar data. Furthermore, the trimmed DEM data were utilized to extract the slope and aspect data. The DEM, land use data, and NDVI with a resolution of 1 km that we used were obtained from RESDC (Resources and Environmental Science and Data Center) (https://www.resdc.cn/Default.aspx/ (accessed on 26 July 2021)).

2.3. Methods

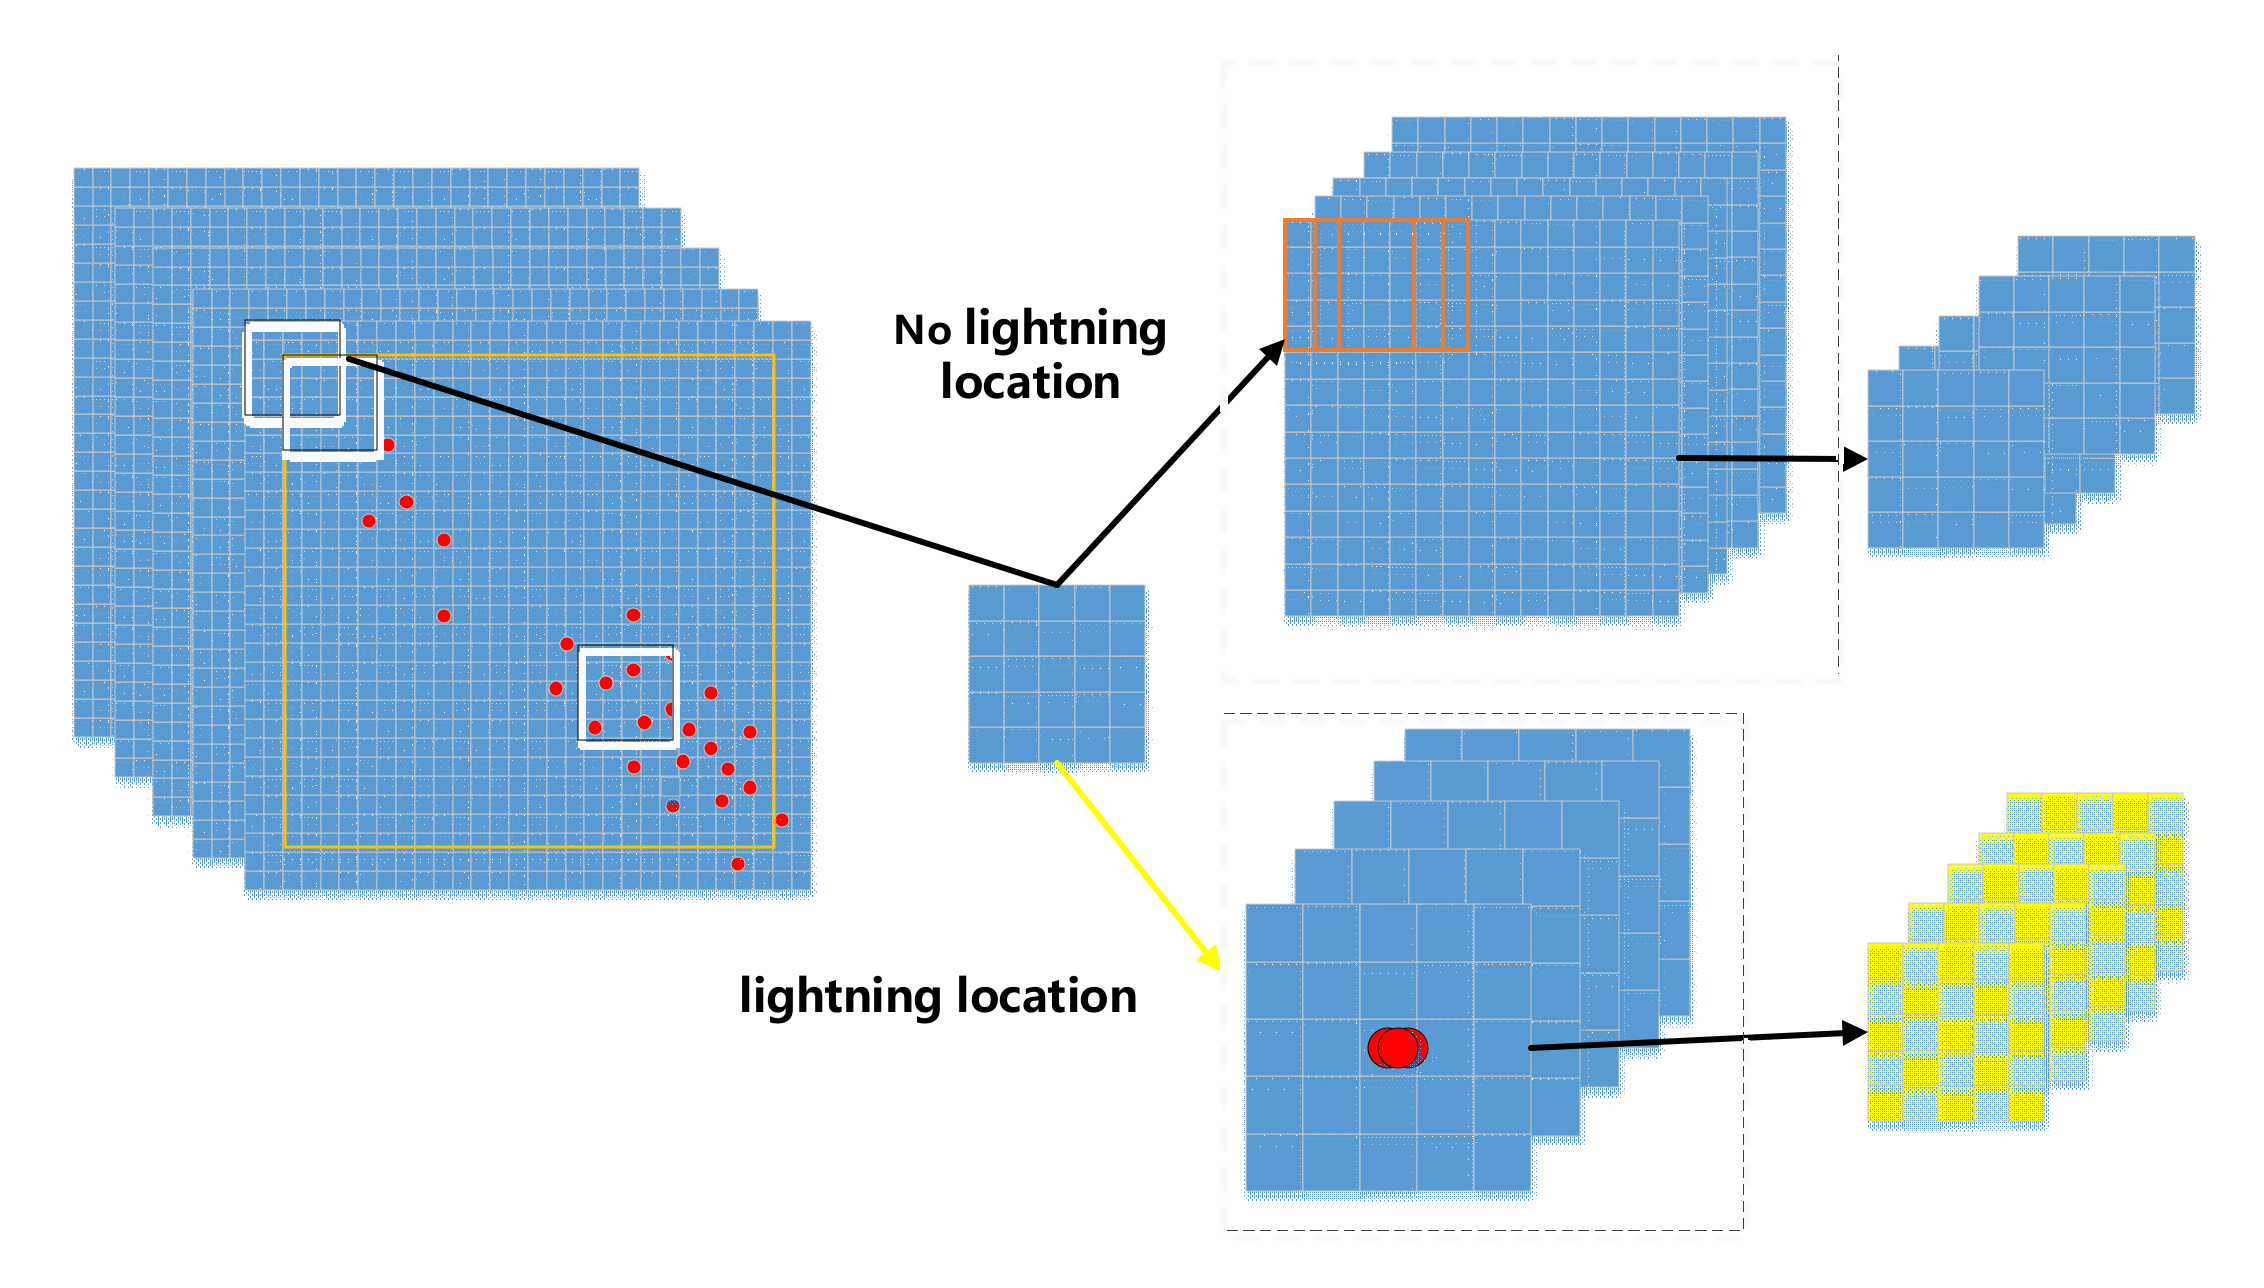
2.3.1. Establishing the Dataset

The occurrence of lightning is closely related to the activity of particles in the atmosphere. Radar products around lightning can represent evidence of lightning instance activity, whereas land attribute data can influence lightning occurrence. There is also a correlation between lightning activity and terrain, and the distribution of lightning location varies in different vegetation cover layers. Therefore, lightning location data, radar product data (PPI, ET, VIL, and V), and land attribute data (DEM, slope, aspect, and NDVI) were used to construct a lightning feature dataset for Ningbo city in the summer of 2018.
Firstly, the spatio-temporal matching of multi-source data was carried out. A full radar scan generates one complete set of radar volume data, representing approximately 6 min. Thus, for a specific complete radar product data source, the lightning data that occur during the period of the radar data scan are selected. Moreover, those beyond the spatial extent of the specific radar data are removed to ensure spatial consistency. The land attribute data is further matched with the lightning and radar data based on the latitude, longitude, and time information. Finally, lightning data, specific radar data, and land attribute data form one group in which they are well matched spatially and temporally. As shown in Figure 2, we set a sliding window to extract lightning feature data, and the specific process is described as follows:
(1)
Set the size of the sliding window M ∗ N (the window size in this article is 5 ∗ 5).
(2)
Use the set window to slide the matched data. If the center position of the window contains lightning location data, the data have lightning features, and the position is marked as 1. In contrast, data without lightning features are marked as 0.
(3)
Combining the obtained data, we obtain N lightning feature datasets with size M ∗ N.
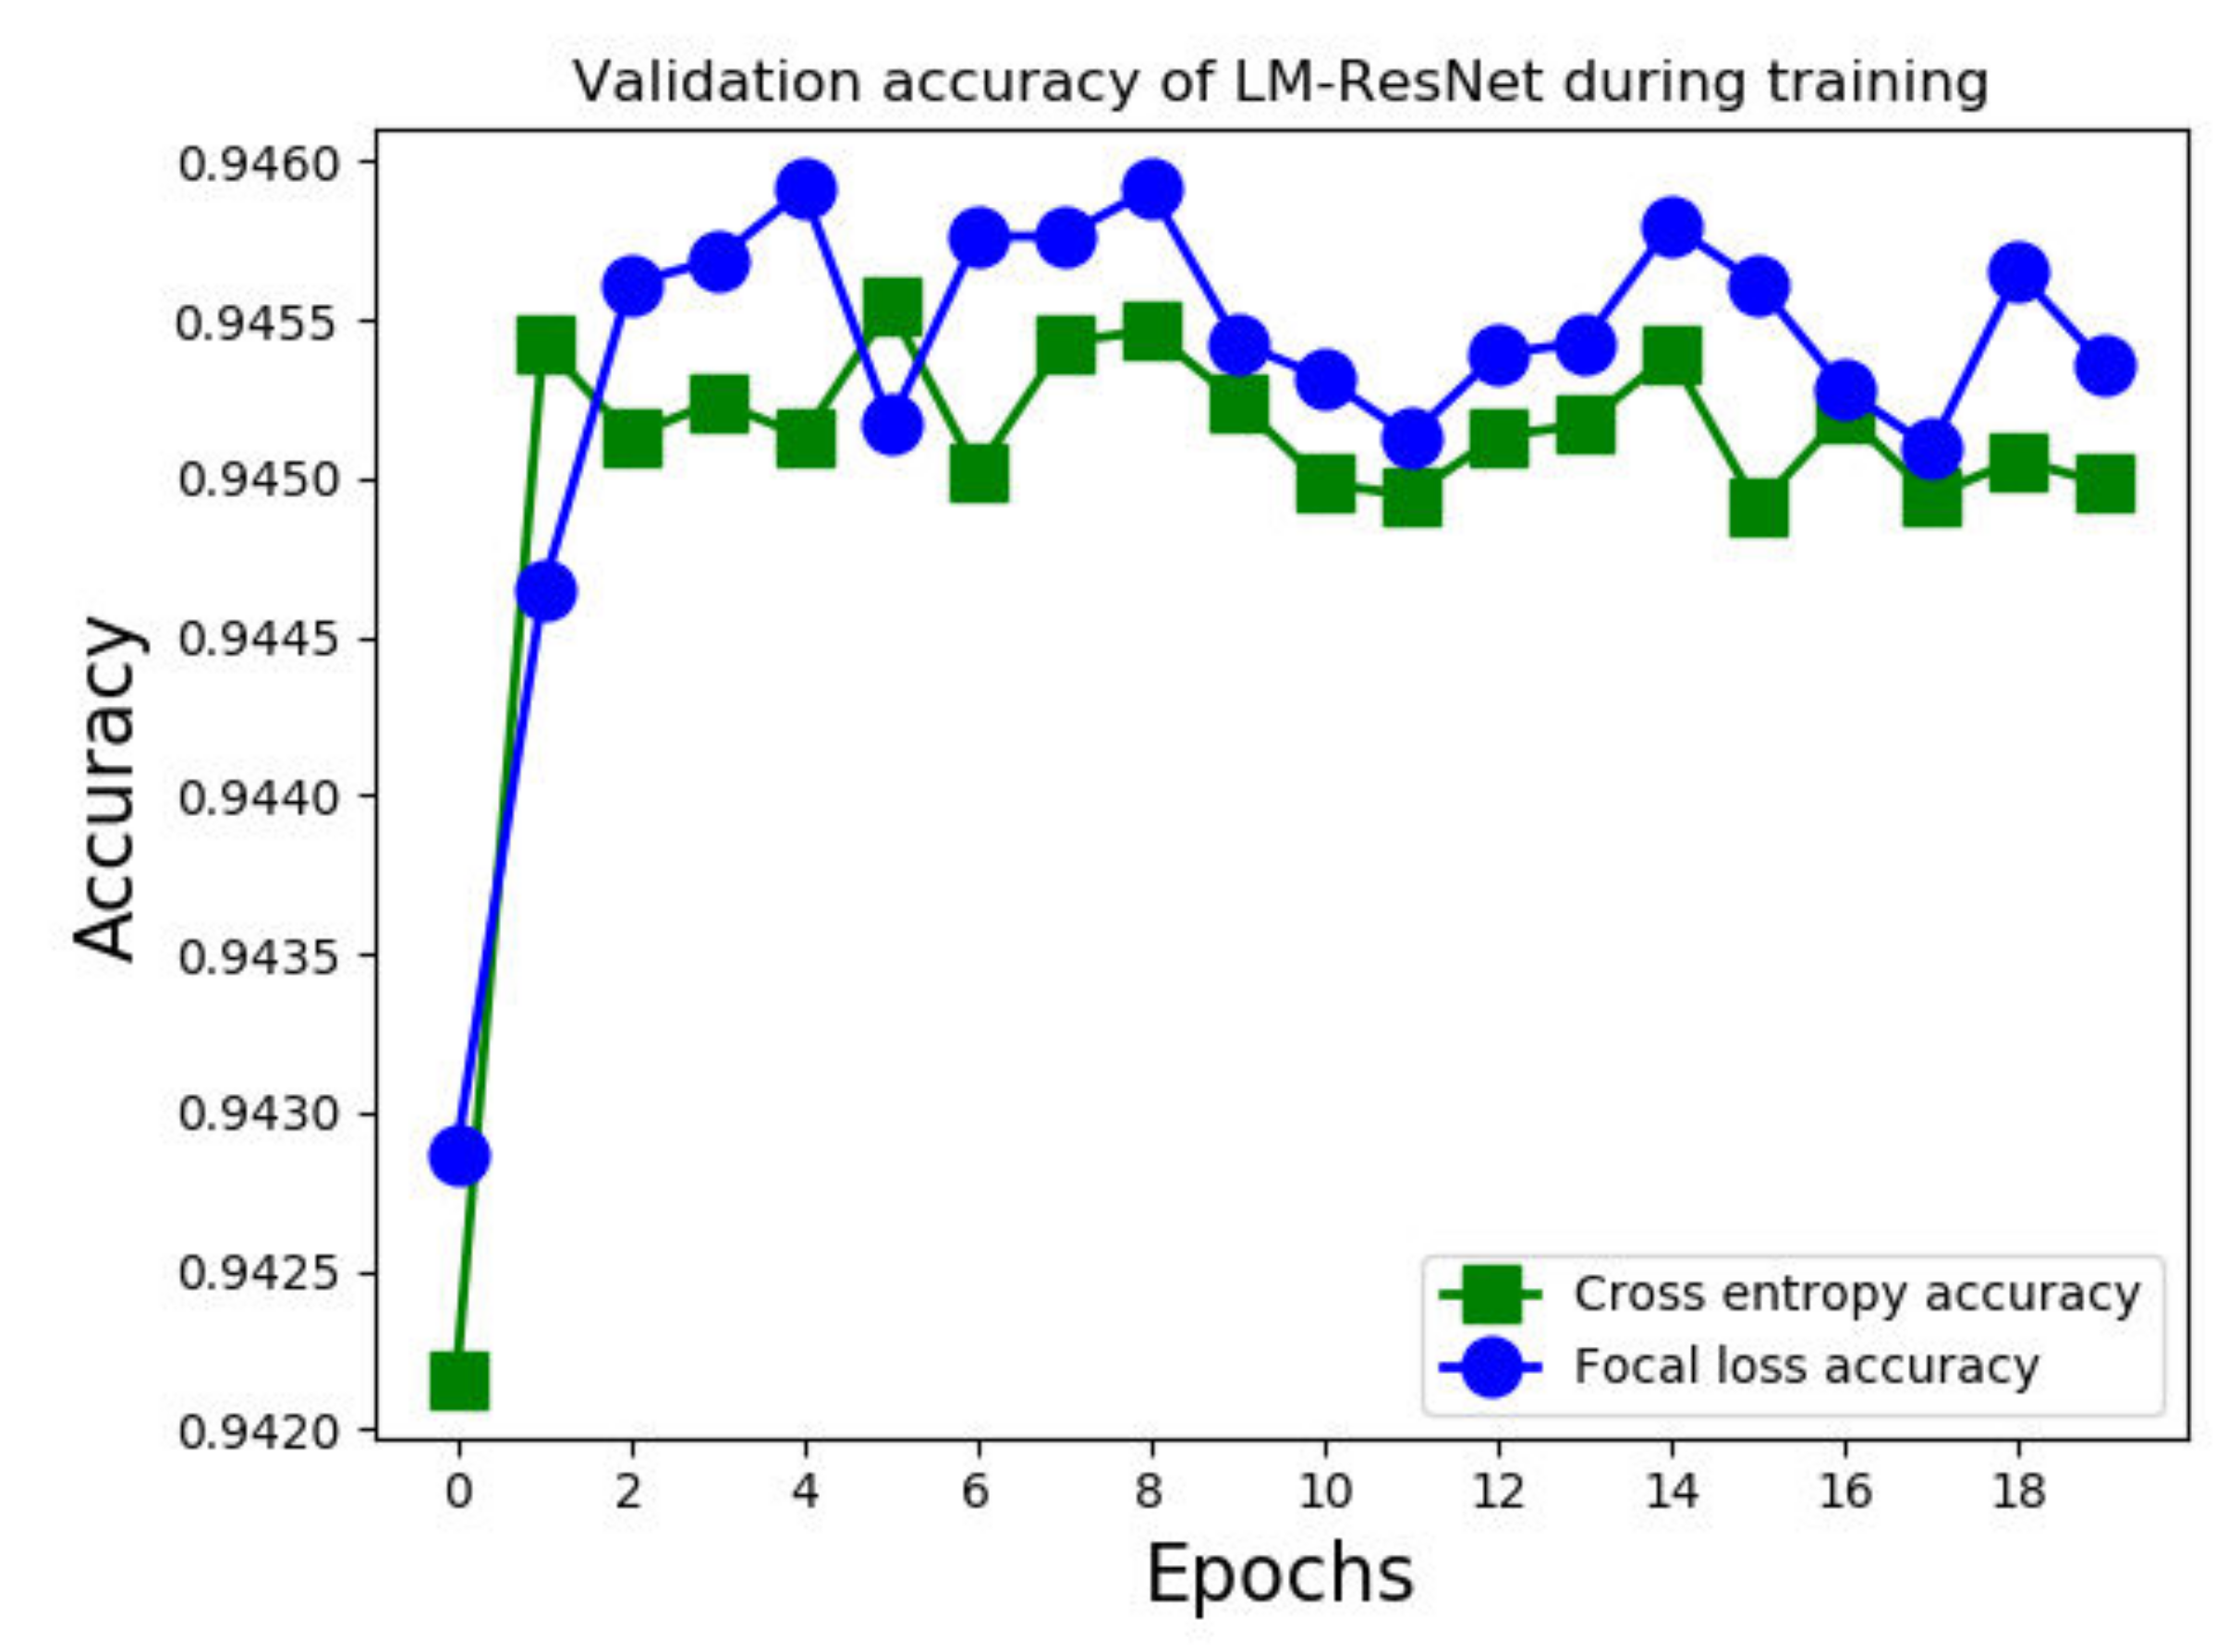
Finally, we collected 30,447 samples marked 1 and 7,742,979 samples marked 0 for a total of 7,773,426 samples from July to September 2018. The extracted data was significantly imbalanced because the number of samples marked 0 was much larger than that of sample 1. Therefore, the under-sampling method was selected to enhance the data for the 0 samples. The data having label 0 were randomly discarded 10 times. In this way, the data was balanced to a certain extent while saving computing resources. In fact, we did not balance the data completely. The data were processed randomly and disordered, and we split the dataset according to the ratio 6:2:2 to obtain a training set, test set, and validation set.

2.3.2. Focal Loss

Imbalanced datasets can negatively impact the overall performance of classification problems. The focal loss function has been applied to a variety of imbalanced classification problems, such as electrocardiogram heartbeats and lung nodules [38,39]. Using the focus loss function can improve the classification accuracy. Initially, the purpose of the focal loss function was to solve the issue of the lack of balance between the foreground class and the background class in object detection scenes [40]. Focal loss considers the dedication per sample to the loss grounded on the classification mistake. Utilizing this function, the loss is reduced when a sample is properly classified, and the classification imbalance problem is addressed by ensuring that the loss indirectly focuses on the challenging classes. In this study, the focal loss function was used to increase the importance of sample 1 with lightning features.
The starting point for focal loss is the cross-entropy loss function for binary classification, which is determined as follows:
CE p , y = log p ,               i f   y = 1 , log 1 p ,     otherwise
y∈ {±1} is lightning location or no lightning location, and p ∈ [0, 1] refers to the model being evaluated for the lightning location possibility with the label y = 1. More concisely, p t is expressed as follows:
p t = p ,                       i f   y = 1 ,     1 p ,               otherwise  
To balance the significance of positive and negative samples, that is, the significance of the presence or absence of a lightning location, a weighting α ∈ factor [0, 1] is presented in a similar notation:
α t = α ,           if   α = 1 , 1 α ,     otherwise
There are many easy-to-distinguish samples that do not have a lightning location; the entire training process revolves around these samples, which in turn overwhelms the lightning location samples, resulting in greater losses. Thus, a regulatory factor γ is introduced here, where γ ≥ 0. This is used to focus on samples that are difficult to classify, that is, samples with a lightning location:
m = 1 p t γ  
Taking into account these two new factors in Equation (1), the presented focal loss function is:
FL p t = α t 1 p t γ log p t
Note that α and γ are two parameters that indicate how sensitive the function is to the easily classified samples.

2.3.3. Deep Learning Classification Algorithm

In this study, the problem of monitoring lightning locations was first transformed into a binary classification problem. Based on ResNet, a deep learning model named LM-ResNet was designed to monitor lightning locations. GoogLeNet and DenseNet are very successful classification models. GoogLeNet adopts the inception structure, which not only extends the depth, but also extends the width of the network to obtain more features. DenseNet is a relatively novel deep learning classification model. It goes beyond the fixed thinking of deepening the number of network layers and widening the network structure to improve network performance. To compare the performance of the constructed LSM-ResNet model, we used GoogLeNet and DenseNet for comparison. A concise presentation of these methods is provided here.
ResNet has accomplished great success in the field of image classification [41]. The characteristic of ResNet is that it is simple to optimize and to increase accuracy by adding a crucial depth. An internal residual block is set by a jump connection to moderate the issue of gradient disappearance generated by building depth in a deep neural network. As shown in Figure 3, the residual learning unit constitutes the mapping relationship between x and F(x), and then x is acquired rapidly with identity mapping. When the residual F(x) is 0, the residual learning unit is equivalent to processing ordinary identity mapping, which does not weaken the network performance. Nonetheless, the residual F(x) is not 0, so the residual learning unit can obtain new ground characteristics as inputs and upgrade the network performance.
Since the size of the multidimensional lightning feature dataset that we constructed in this study was small, the structure of ResNet was reduced to build the LM-ResNet network. The LM-ResNet includes an input layer, convolutional layer, pooling layer, fully connected layer, and output layer. Figure 4 shows the LM-ResNet model structure. The LSM-ResNet model contains 17 layers. The first layer is the input layer, which inputs the constructed lightning feature dataset. The input data shape is (N, K, 5, 5). N is the number of multidimensional characteristic lightning data sources input into model, and K is the type of lightning feature data. The default K of the current model is 19, including weather radar and land attribute data. The model channel can be changed according to the input lightning feature type to adapt to multi-dimensional lightning feature data. The number 5 in the data shape is the size of the dataset. The second layer is the convolution layer; the size of the kernel is 3 × 3, and the number of channels is set to 32, which is used to obtain multidimensional spatial data features. The third and fourth layers connected by the blue curve form a residual block; the LSM-ResNet network has a total of 6 residual blocks. Because the input of the residual F(x) and x is calculated by adding the channel dimension to the residual unit, two residual blocks of different structures are deployed in the LSM-ResNet network, corresponding to the blue solid line and the dotted line in the figure. Each residual block consists of two convolutional layers, and the size of the kernel is 3 × 3. The input of the residual block is connected to the output. As the network continues to learn new features, the number of corresponding network channels also increases. Since the model has expanded channels in the third residual block from 32 to 64, feature data output by the second residual block are subjected to a 1 × 1 convolution to increase the channel dimension. Similarly, the fifth residual block also increases the grid channel dimension through a 1 × 1 convolution operation. Following the residual block is the pooling layer, which reduces the dimension of the lightning feature data learned by the model through the average pooling pair and reduces the amount of data computation. The next layer of the pooling layer is a fully connected layer, which outputs the probability of a there being a lightning location through the fully connected layer.
In Figure 4, each residual block contains BN, Relu, and weight layers. The BN layer permits a higher learning rate, markedly enhances the speed of training, and, in particular, prevents gradient vanishing or divergence. To train LSM-ResNet, a Relu activation function neural network is used. Weight layers perform the convolution operation. Furthermore, the solid line and the dashed line correspond to two different residual blocks. In the solid line, the block is the same as the number of channels in the previous connection layer, and the residual calculation is directly executed.
In the figure, x i is the input of the residual block and x i + 1 is the output of the residual block. x i performs two convolution operations W i ; then, the residual function is F ( x i , W i ) :
x i + 1 = F ( x i ,   W i ) + x i
Due to changes in data size and the number of channels in the dotted line block, the residual calculation needs to be performed after linear transformation. x i needs to perform an operation with a convolution kernel size of 1 × 1 to increase the number of network channels, because the final F ( x i , W i ) and x i need to perform an addition operation, that is:
x i + 1 = F ( x i ,   W i ) + W s x i
GoogLeNet is a deep learning structure developed by Google in 2014 [42]. To address overfitting, gradient disappearance, and gradient explosion resulting from the improvement in the number of network layers, GoogLeNet adopts a new inception structure, which can more efficiently use computing resources and retrieve further information by an equal number of computations to enhance the training results. Under this structure, the lightning feature data pass through the convolutional layer, maximum pooling layer, and inception layer to extract the implicit lightning features. The feature map is compressed into a one-dimensional vector and classified by the softmax function to obtain the probability of the output monitoring the location of the lightning.
DenseNet was proposed in 2017 and won the best paper award of CVPR in that year, is one of the best depth models [43]. DenseNet is a densely connected convolutional neural network that surpasses the fixed thinking of deepening the number of network layers and widening the network structure to enhance network performance. DenseNet not only greatly reduces the number of network parameters through feature reuse and bypass settings, but also alleviates the generation of vanishing gradient problems to a certain extent. Furthermore, any two layers of DenseNet are directly connected, and the input of each subsequent layer of the network, which is the union of the outputs of all the former layers, passes its consistent feature map to all subsequent layers. These short connections between two layers near the input and output allow the previous features to be effectively passed to the back for automatic feature reuse. Therefore, this structure can be employed to extract more global and critical features, and is more precise and efficient to train.

2.3.4. Sensitivity Analysis

Sensitivity analysis is an uncertainty analysis technique for determining the degree of influence of certain key indices or groups of key indicators when a certain change occurs in the relevant factors from the perspective of quantitative analysis [44]. We conducted stepwise and single factor sensitivity analyses based on the deep learning model to analyze the relative significance of each input variable for monitoring the location of lightning. Stepwise sensitivity analysis rejects one input variable at a time from the constructed lightning feature dataset and observes the impact on the monitoring results. When a variable does not play a vital role in the outcome, a high correlation remains in the model after the variable is omitted. Utilizing single factor analysis, a set of input variables is fixed as a benchmark and kept unchanged, and then different variables are input each time to analyze the influence of different variables on the results of monitoring lightning locations.

3. Results and Analysis

3.1. Performance Criteria

We used the contingency table method to assess the results of lightning monitoring because it is regularly employed by the weather forecasting community. The probability of detection (POD), false positive rate (FPR), false negative rate (FNR), and equitable threat score (ETS) were calculated. The POD is the ability of the classifier to monitor lightning. The FNR is the proportion of positive samples that are predicted to be negative samples, to the total number of positive samples, and is the probability of lightning being underreported. The FPR is the proportion of negative samples that are predicted to be positive samples to the total number of negative samples, and is the probability of lightning being falsely reported. For unfamiliar events, such as severe weather warnings, the ETS is the better choice because it measures the skill of a forecast relative to chance. In addition, we also calculated the F-measure and area under the curve (AUC) to evaluate the model. The lower FNR and FPR, the better the performance of the models. In addition, the higher the performance, the better the model.
All the metrics were computed on the basis of the confusion matrix, which consists of true positives, false positives, true negatives, and false negatives. The formulas of the metrics are shown here:
Accuracy = T P + T N T P + F N + F P + T N
POD = Recall = T P T P + F N
FPR = F P F P + T P
F measure = 2 p r e c i s i o n r e c a l l p r e c i s i o n + r e c a l l
where TP, FP, TN, and FN refer to true positives, false positives, true negatives, and false negatives, respectively.

3.2. Results Analysis
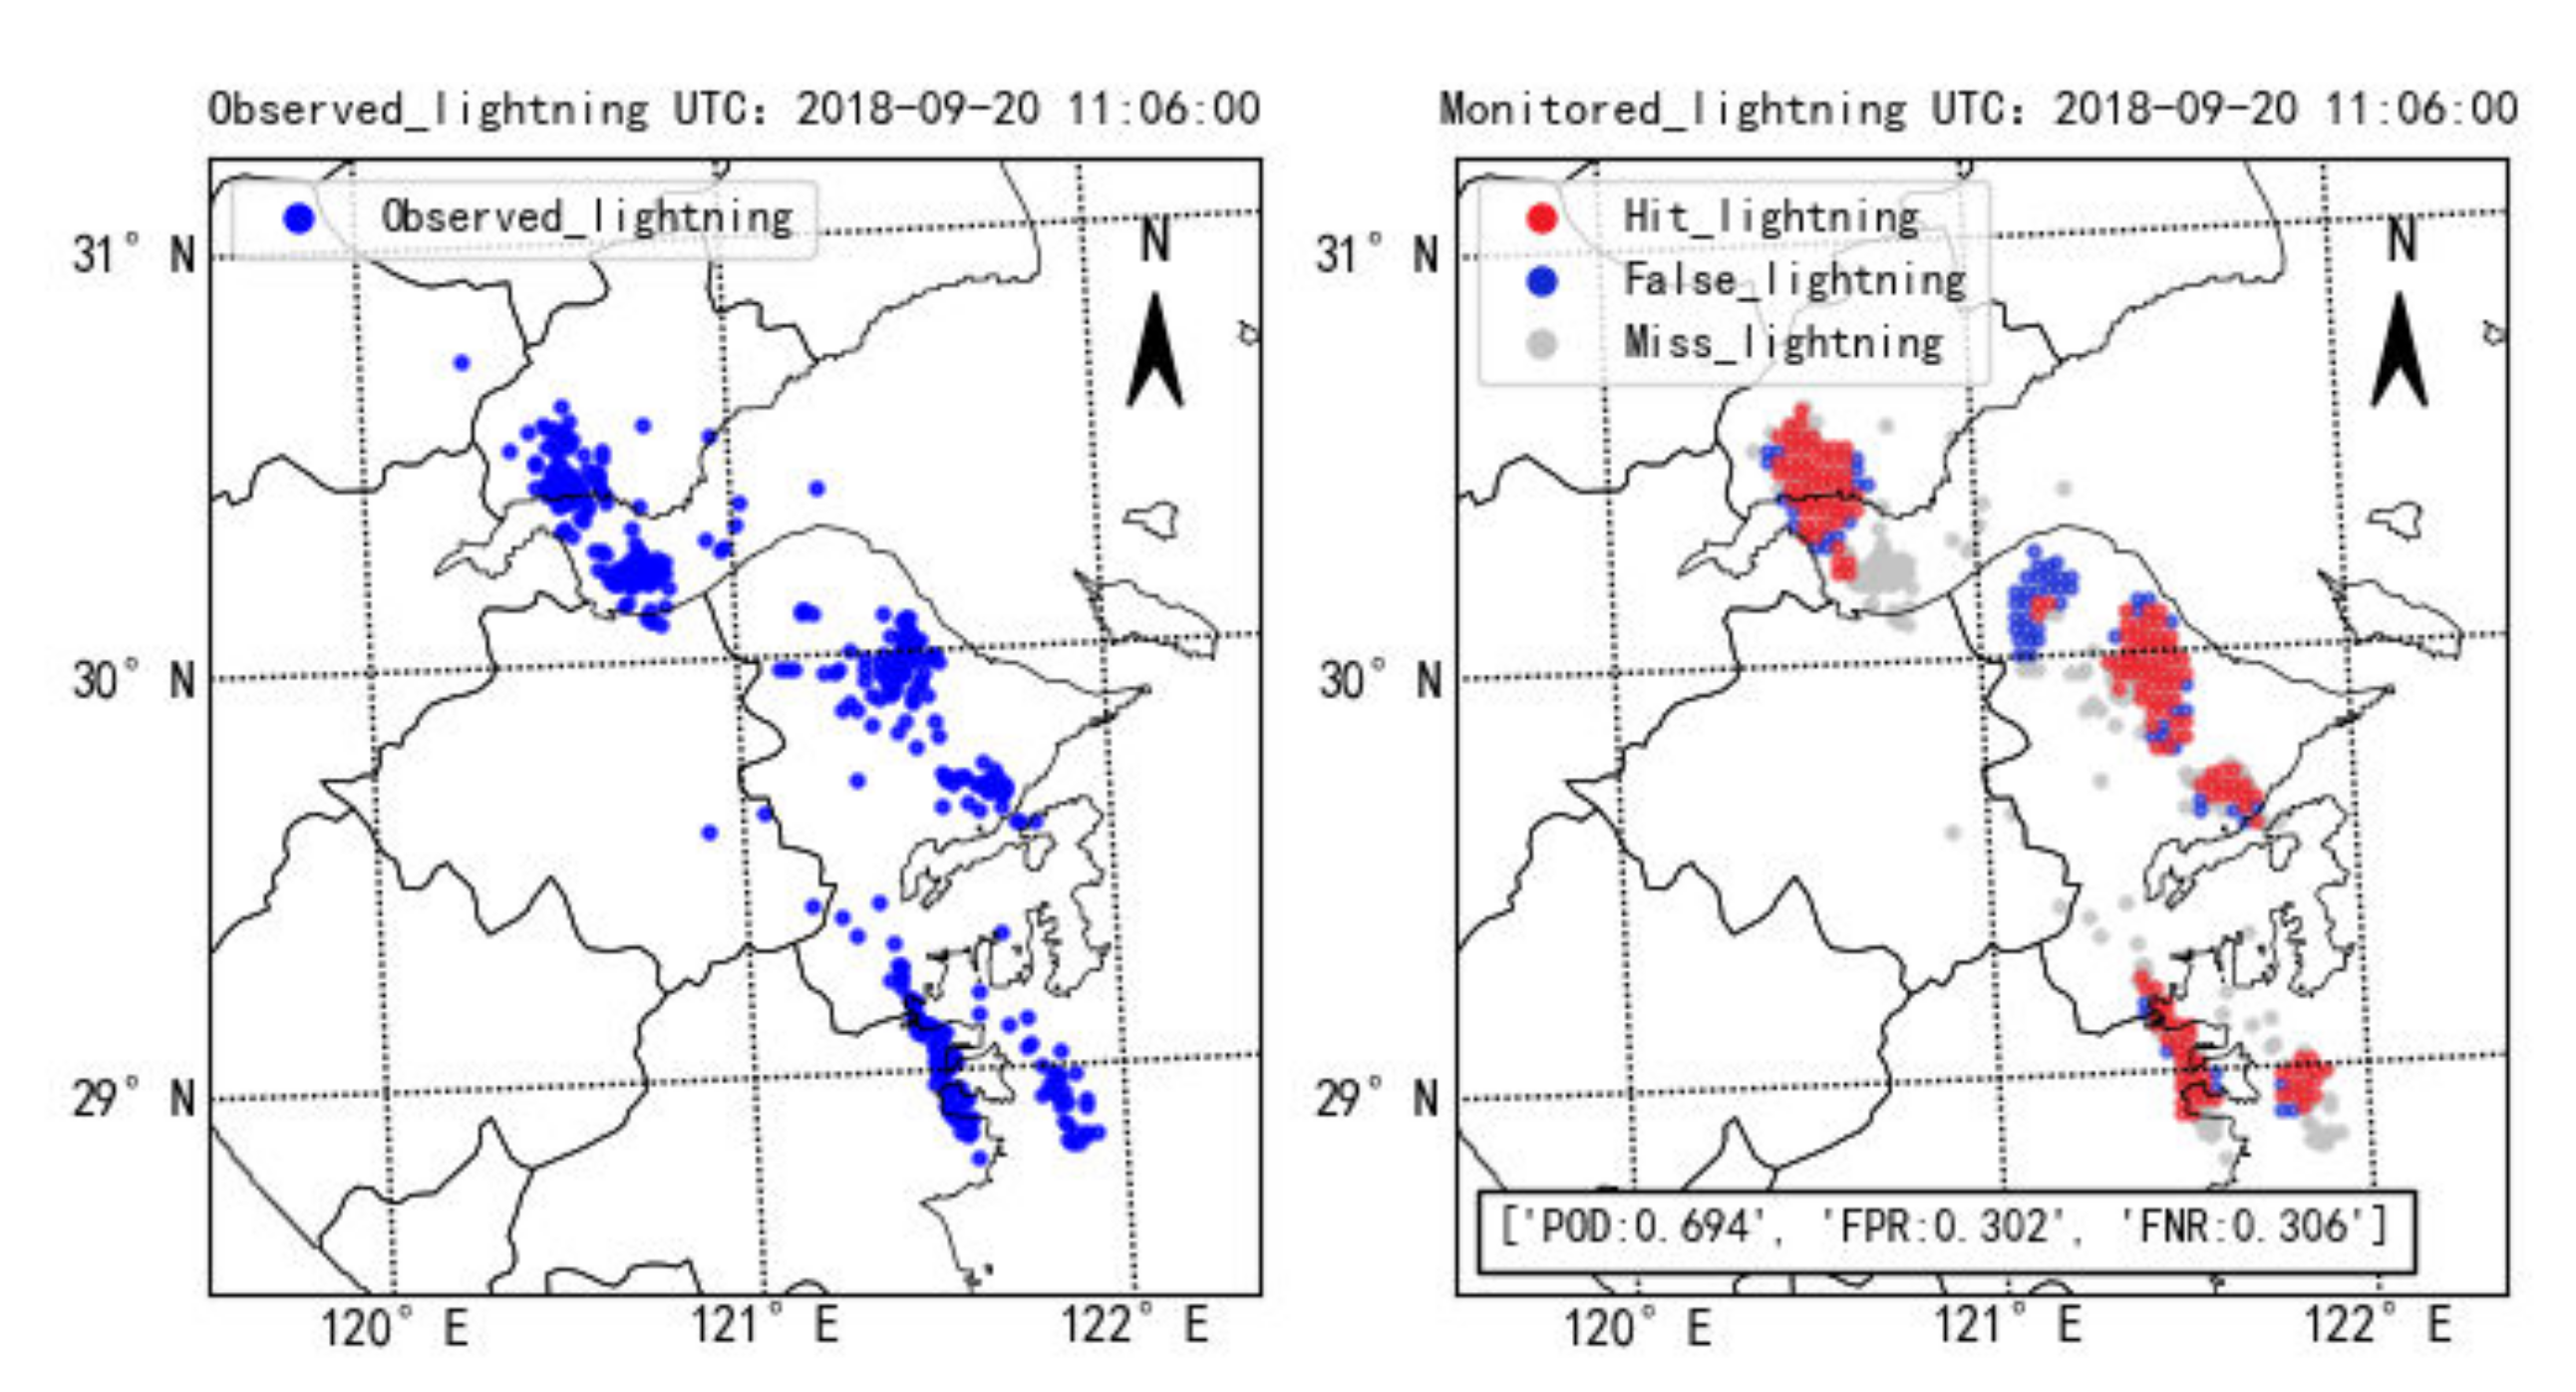
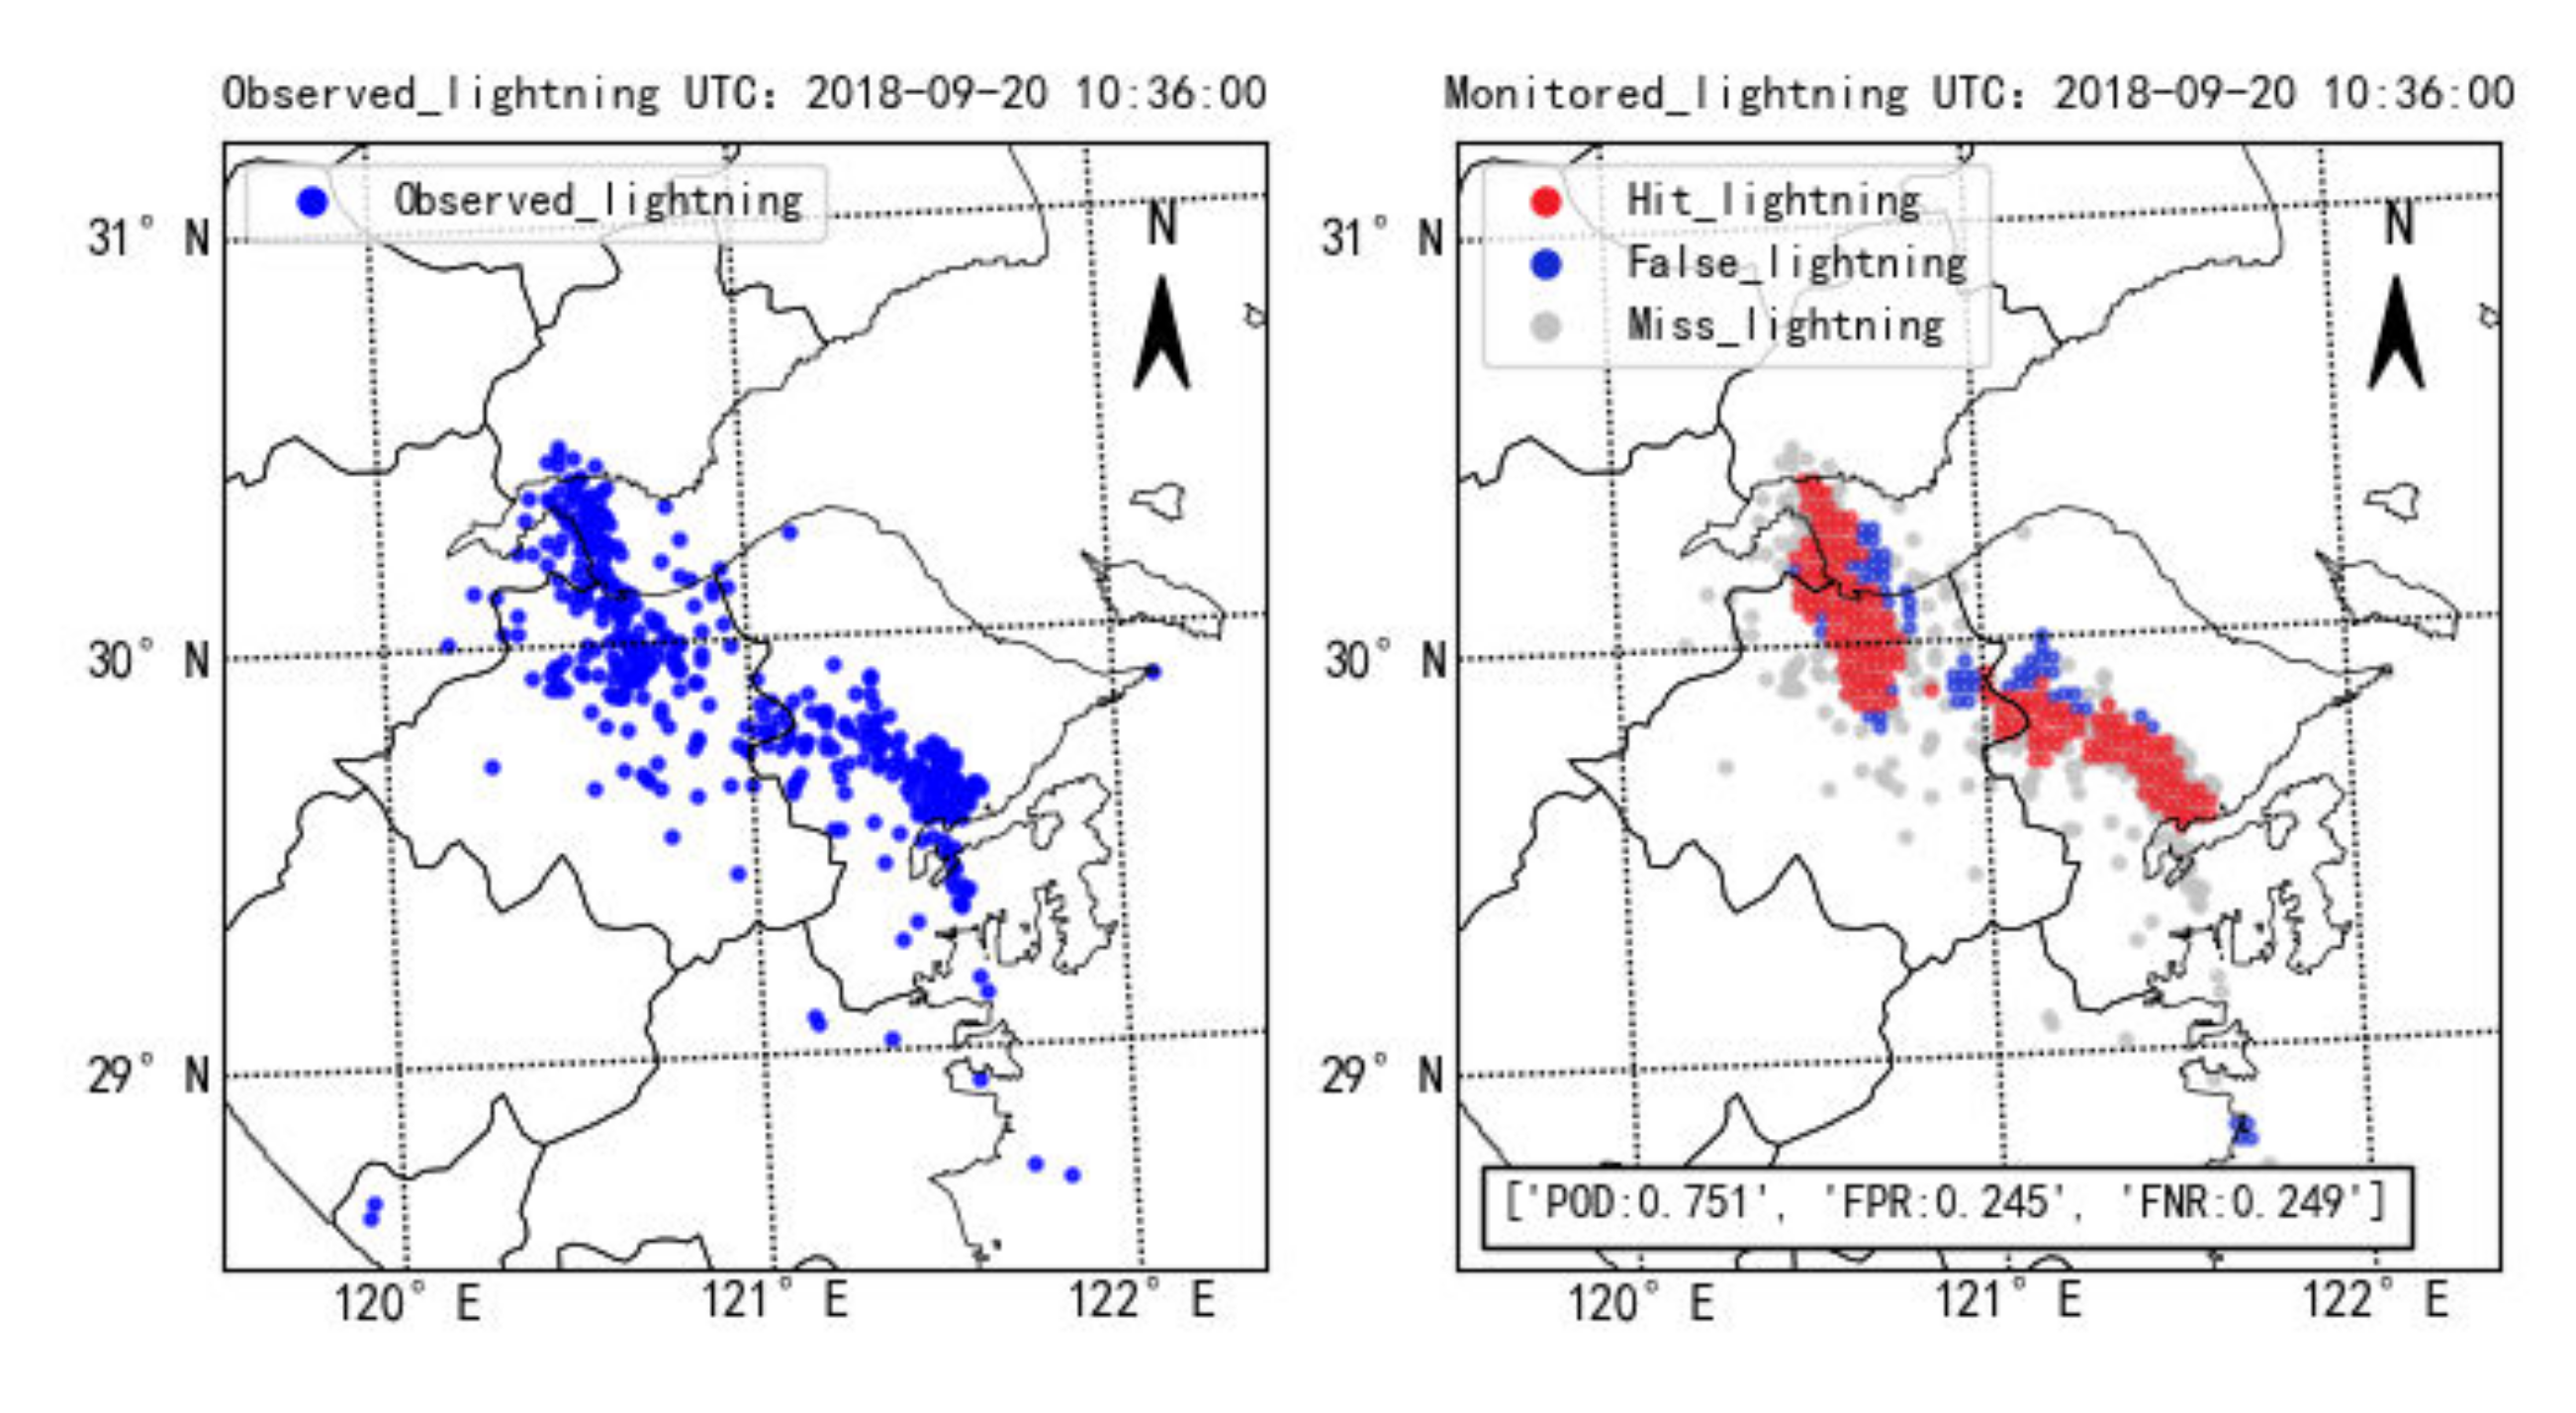
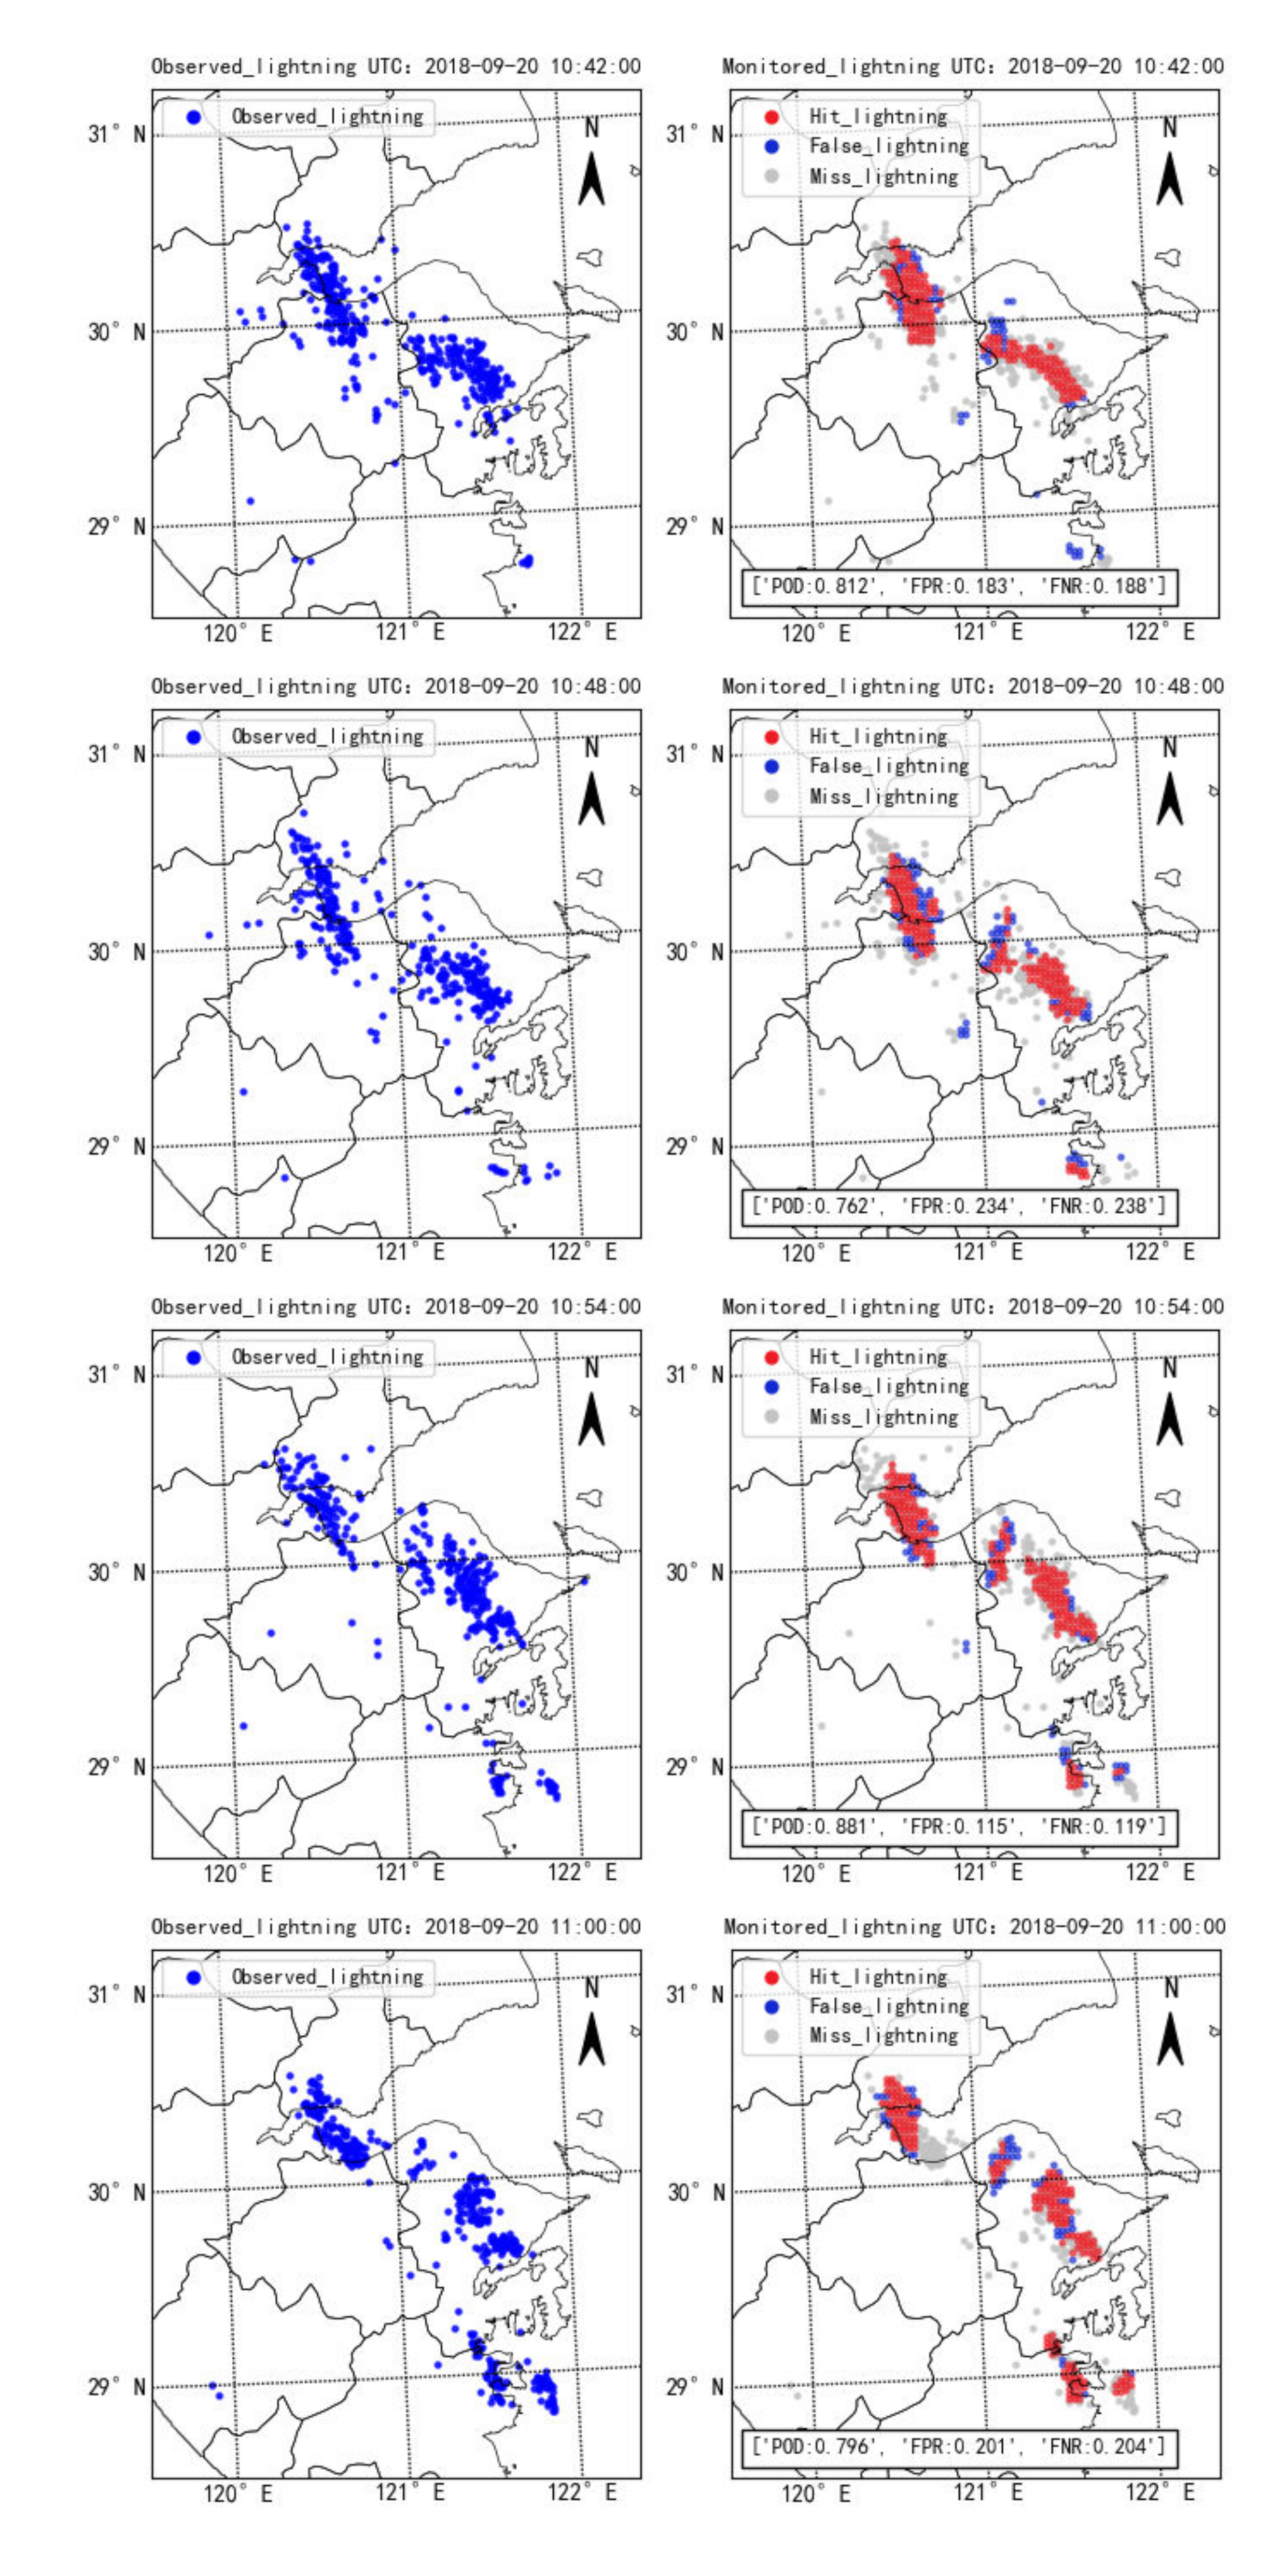
In this study, we developed comparative experiments with the constructed multidimensional lightning dataset. The training set is used for model training, the validation set adjusts the model, and the test set verifies the monitoring lightning location results. The deep learning models involved were built using the Python programming language based on the PyTorch 1.7.1 + cu110 framework and employing a GPU to improve the calculation. The hardware environment included a Core i9-10900 CPU, and the graphics card was a RTX3080. In our research, each network was set with 20 epochs, and each epoch contained 3360 iterations. The premier learning rate of the model was 0.1. In terms of optimization, the SGD optimizer was utilized to train the network with a batch size of 64. Momentum and weight attenuation were set to 0.9 and 0.0004, respectively, to accelerate the learning process of the network and avoid overfitting.
The loss function was utilized to describe the disparity between the monitoring value and the observation lightning, and to estimate the adaptive capacity of networks. A cross-entropy loss function and focal loss function were used to conduct a comparative experiment based on the LM-ResNet model. Figure 5 shows the results of training using the LM-ResNet model, including the loss value of the cross entropy and focality, and their corresponding accuracy. The result shows that both loss functions were trained for five batches and started to converge. The overall verification set accuracy of focal loss is higher than that of the cross-loss entropy function. The model accuracy after training with the focal loss function is 0.946, whereas that of the cross-loss entropy function is 0.945. These results show that focal loss is more suitable for our data. In subsequent experiments, the focal loss function was applied.
We utilized the constructed lightning dataset for comparison experiments, including GoogLeNet, LM-ResNet, DenseNet. Accuracy, POD, FNR, FPR, F-measure, AUC, and ETS, which were employed as evaluation indicators to compare models. These evaluation indicators are only FAR and FNR; the smaller the better, and the larger the better, respectively. Table 1 shows the comparison results. The accuracies of the three deep learning methods are not significantly different, and are approximately 0.945. The highest accuracy is 0.9456 for LM-ResNet, 0.9447 for DenseNet, and 0.9445 for GoogLeNet. This finding indicates that the monitoring of lightning locations has a certain effect. However, the indicators of the GoogLeNet model are worse overall. For example, the POD of GoogLeNet is only 0.636; the POD of the other models is approximately 0.727; and the results of the F-measure, AUC, and ETS are inferior to those of the other models. The POD and FNP indicators of LM-ResNet and DenseNet are relatively close; that of POD is approximately 0.727 and that of FNR is 0.273. The FRP of DenseNet is 0.333 higher than that of LM-ResNet, and the F-measure, AUC, and ETS are slightly lower than that of LM-ResNet, at 0.696, 0.853, and 0.511, respectively. The LM-ResNet performs best. We applied LM-ResNet for subsequent experiments.

3.3. Case Study

To further verify the LM-ResNet model, we used a period of lightning observation data to perform a comparison with the monitored lightning location results. The China Meteorological Service Centre issued thunderstorm warnings on 20 September 2018. Affected by drastic convective cloud clusters, violent lightning activity occurred in Ningbo. Radar products around lightning can represent the evidence of lightning instance activity, and land attribute data have an influence on lightning occurrence. We selected radar data (PPI, CR, ET, VIL, and V) and corresponding land attribute data (DEM, slope, aspect, land use, and NDVI) from 10:36 to 11:06 for monitoring. Under normal circumstances, lightning is not very stable, and there is some drift during the discharge process. According to previous studies [45], it is believed that the lightning location within 1 km around the monitor is efficient. POD, FPR, and FNR were utilized to analyze the model results.
Figure 6 shows the observation of lightning data and model monitoring results at six times from 10:36 to 11:06. The left half of the figure is the observed lightning location. The right half of the figure is the lightning location monitored by the model that corresponds to each time, including the POD, FPR, and FNR. Red represents properly detected lightning (Hit_lightning); blue represents false alarm lightning (False_lightning); and gray represents miss lightning (Miss_lightning). According to the figure, the model can roughly monitor the distribution of lightning positions. Overall, the probability that the model correctly monitored lightning is about 0.75, that is, POD is about 0.75. In some cases of dense lightning distribution, the probability of correct monitoring can exceed 0.8, such as the situation corresponding to 10:54. The FPR is roughly distributed at approximately 0.25, indicating that the false alarm probability of the model is approximately 0.25 and that the optimal distribution of lightning can be 0.18. The FNR is approximately 0.26, which is similar to the trend of the FPR. In addition, when the lightning is dissipating, the hit rate of the model decreases, and the false alarm rate and miss rate increase, such as at 11:06:00. This shows that the model needs to strengthen the recognition of many pairs of weak lightning.

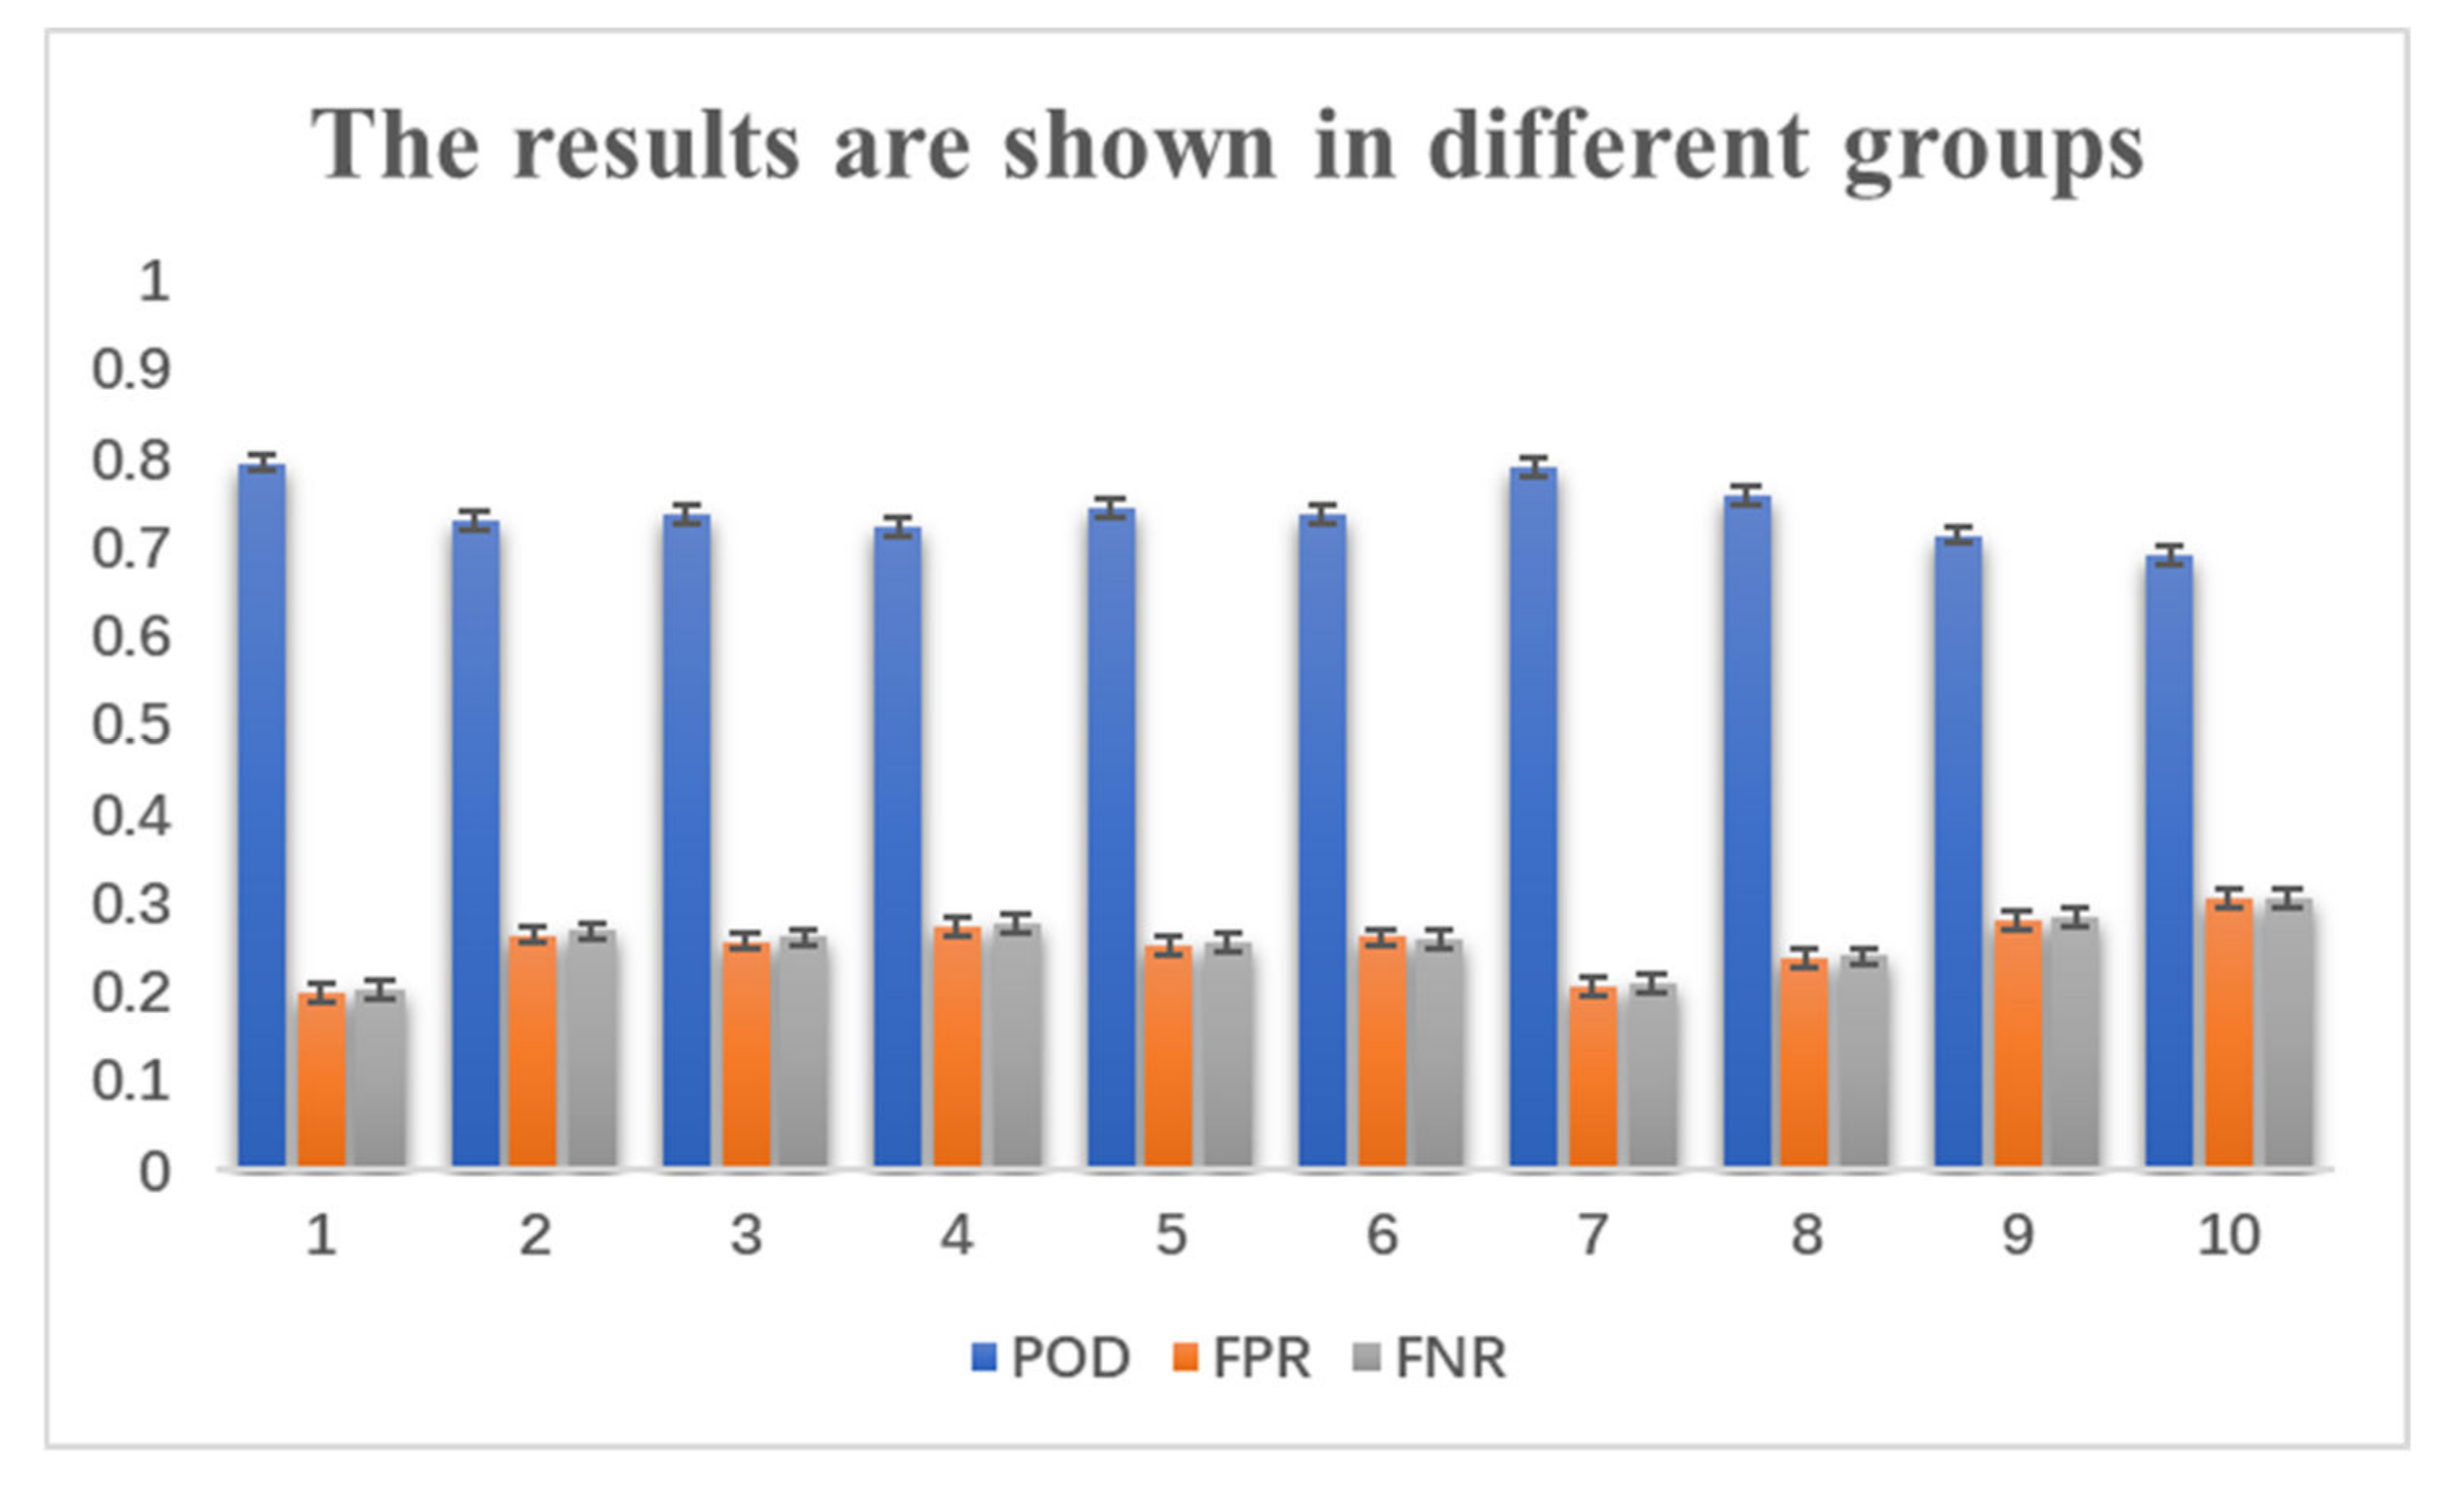
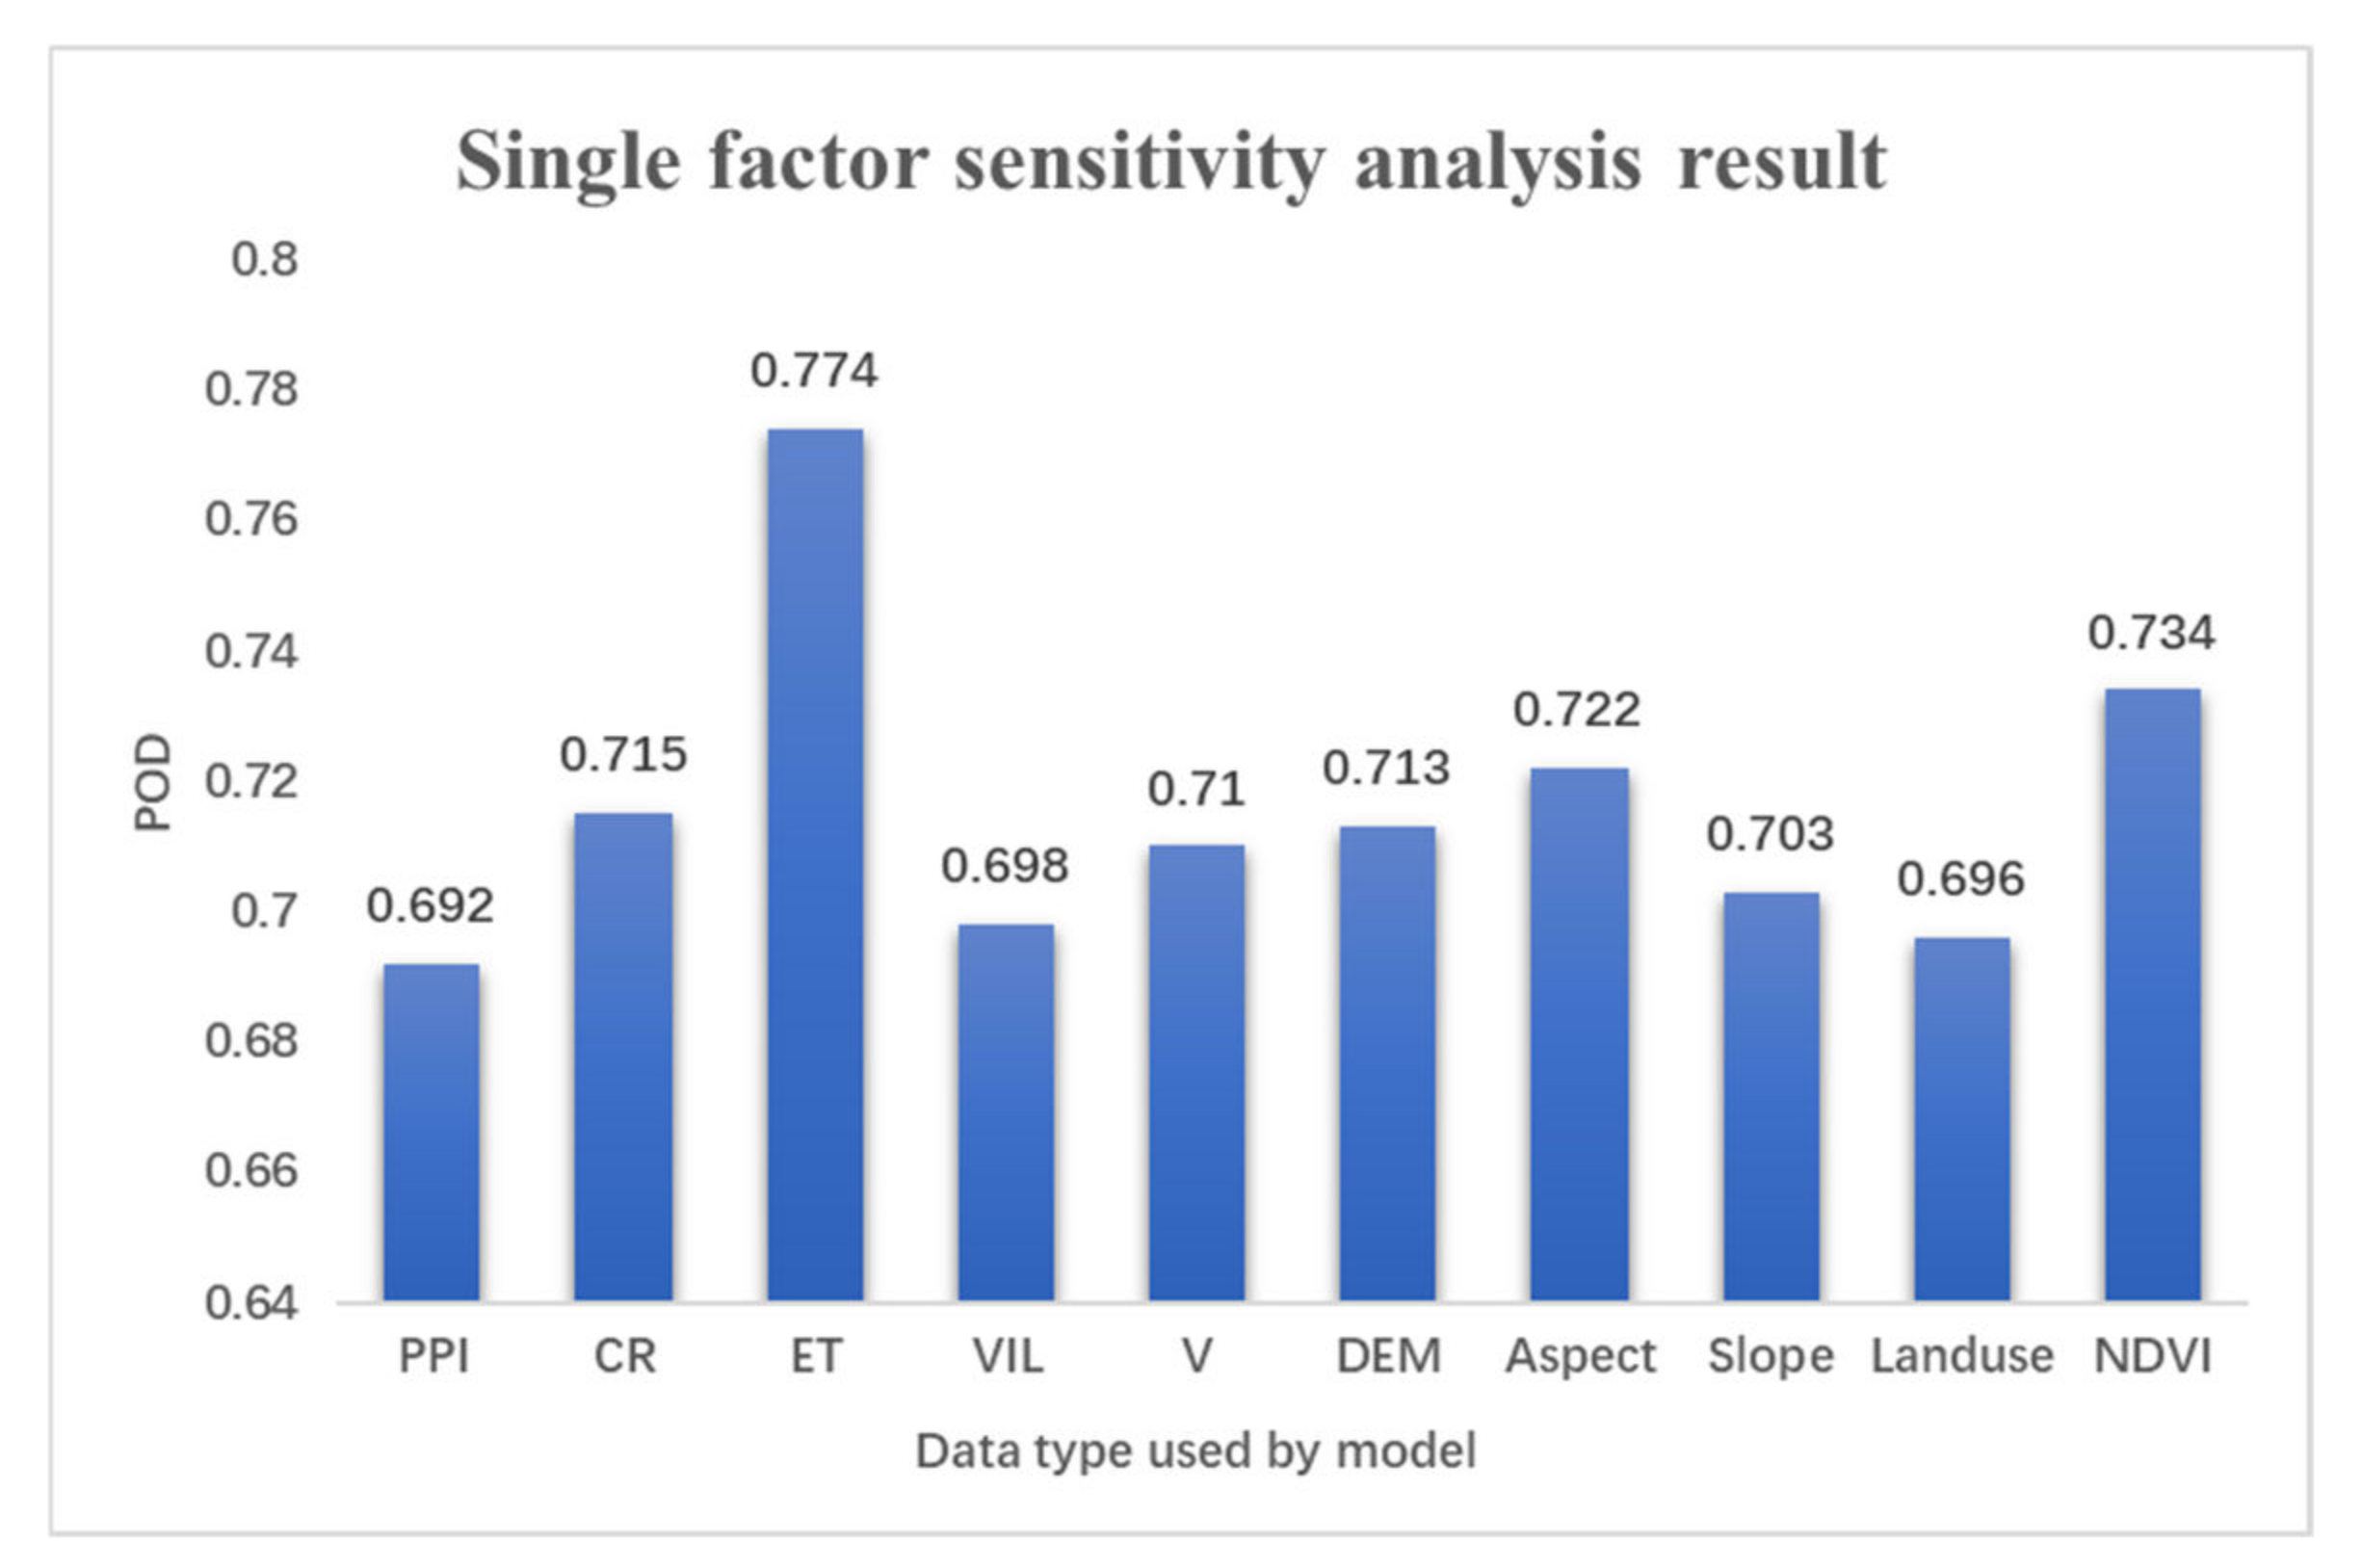
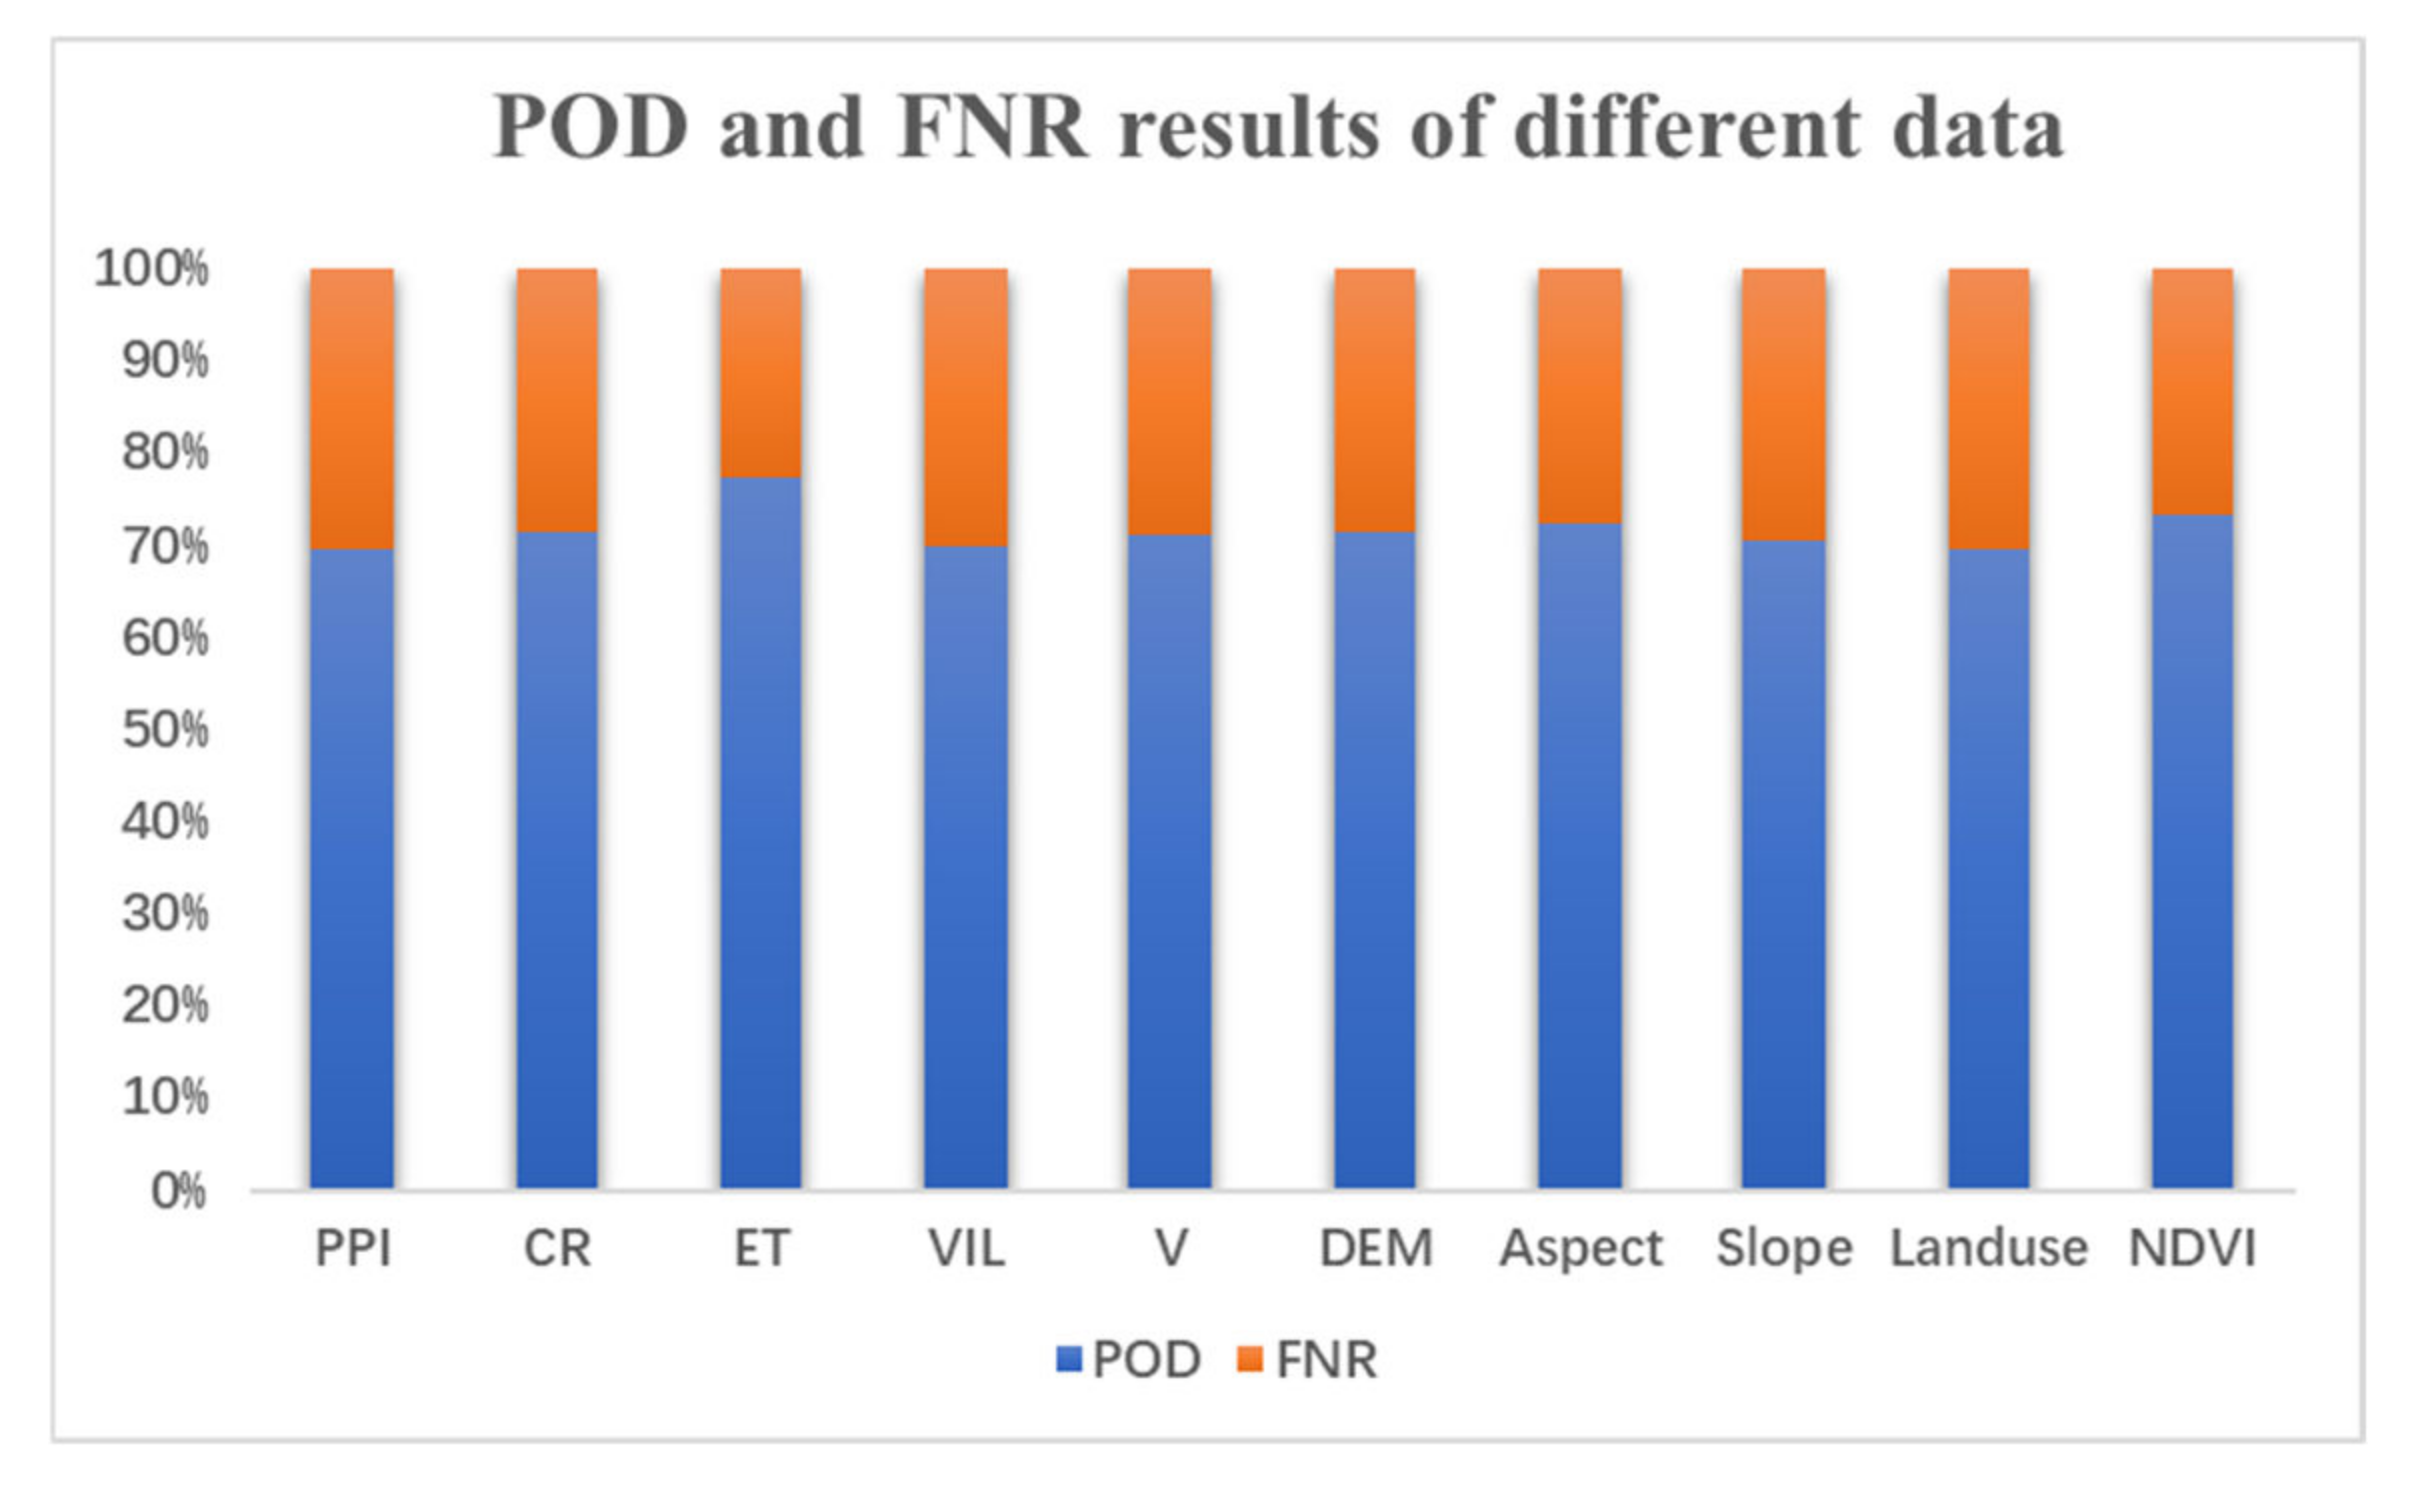
3.4. Sensitivity Analysis of LM-ResNet Model Accuracy

To explore the impact of different characteristic factors on the lightning monitoring results, stepwise sensitivity analysis was employed to evaluate the significance of various input variables on the lightning monitoring results. The data in the abovementioned case ware applied to verify the results of all our experiments. In the experiment, we paid attention to POD, FNR, and FPR. We list the data employed by each group in Table 2, including PPI, CR, ET, VIL, V, DEM, aspect, slope, land use, and NDVI. We reduce the input to one data source per experiment.
Figure 7 shows the lightning monitoring results of different groups. Group 1, using all data, has the highest POD and the lowest FNR and FPR. Following Group 7 (PPI, CR, ET, VIL), the result was very similar to that of Group 1. The POD of Group 8 (PPI, CR, ET) was lower than that of Group 1, but the FRP and FNR were higher than those of Group 1. The results of the remaining groups were not large, but they were better than the results of Groups 9 (PPI, CR) and 10 (PPI). This finding shows that ET data may have a greater impact on the lightning monitoring results.
To further discuss the impact of different characteristic factors on the lightning monitoring results, we performed single factor analysis to evaluate the impact of each input variable on the lightning monitoring results. POD, as an important indicator that represents the occurrence of lightning, was utilized for the next analysis. Based on PPI data, CR, ET, VIL, V, DEM, aspect, slope, land use, and NDVI were applied as single factor variables for grouping experiments. Figure 8 shows the results of the experiment. We found that the combination of PPI and ET has the greatest impact on the hit rate of lightning monitoring. Their POD is 0.774, indicating that ET and lightning are closely related. Lightning activity was positively correlated with changes in ET. When the echo tops in a cloud region increase, so does the lightning activity [46]. Empirical evidence has shown that weak updrafts cannot produce the intense electrification needed to generate lightning [47]. In addition, NDVI’s POD of 0.734 also has a large impact on the monitoring results of the model, indicating that vegetation may affect the location of lightning. There are significant differences in the distribution of lightning strike location on different vegetation cover layers. The undulations of the terrain affect the lightning strike. Within a certain elevation, the greater the altitude, slope, and aspect, the denser the lightning [48]. Moreover, the lightning monitoring results have a certain relationship with the DEM, slope, and aspect. The topography may affect the lightning location. The lightning activity was found to be positively correlated with the elevation slope. CR can monitor the structure of storms, and V can determine the wind relative to the ground and detect the structure of the atmosphere. All of these factors contribute to our model. Although the POD of V is less than 0.71, it is still an important factor in a real environment. It seems that the influence of land use on POD is not particularly large. We drew a stacked graph of POD and FNR in Figure 9 and found that ET and VIL have the greatest impact on the lightning monitoring model.

4. Conclusions and Discussion

In this study, we utilized multiple data sources combined with deep learning methods to carry out lightning monitoring research. First, the lightning monitoring problem was converted to a binary classification problem. Radar product data (PPI, CR, ET, and V) and land attribute data (DEM, aspect, slope, land use, and NDVI) were employed to construct a multisource lightning feature dataset, and the focal loss function was applied as the loss function during model training. Subsequently, based on the residual network model, the LM-ResNet was proposed for lightning location monitoring. In a comparison of the three deep learning methods of GoogLeNet, LM-ResNet, and DenseNet, we found that all methods have some benefits for lightning monitoring. However, the performance of GoogLeNet is inferior to that of LM-ResNet and DenseNet. The best model is LM-ResNet. The LM-ResNet model effectively performs monitoring of lightning locations. This may be because of the small size of our data, which is only 5 ∗ 5. A relatively simple model is more suitable for this small size. In addition, we also conducted a stepwise sensitivity analysis and single factor analysis. During the stepwise sensitivity analysis, all radar product data and land attribute data were divided into 10 groups, and one type of data was removed each time. Group 1 applies all radar product data and land attribute data to achieve the best performance. Simultaneously, Group 7 (PPI, CR, ET, and VIL) performed very well, with excellent POD and the lowest FNR and FPR. Based on the results of stepwise sensitivity analysis, ET data may have an important role in lightning monitoring. In single factor analysis, PPI data were employed as the basis and the remaining data (CR, ET, V, DEM, aspect, slope, land use, and NDVI) were combined as a single factor variable for the model input. The results show that only employing PPI and ET data as input variables can yield the best POD of 0.774, illustrating that the echo peak height information obtained by ET data is primarily related to the occurrence of lightning. Furthermore, PPI and NDVI also yield better results as inputs, having a POD of 0.734, indicating that vegetation may affect lightning locations. Other data also contribute to the model. This research is anticipated to provide a basis for new exploration for mitigating and preventing lightning disasters, and laying the foundation for forecasting of lightning locations.
Compared with previous studies [45], the LM-ResNet constructed in this paper has a certain effect on the monitoring of lightning locations. However, the results of lightning location recognition for discrete distributions are not optimal. Notably, when the lightning is dissipating, the hit rate of the model decreases, and the false alarm rate and miss rate increase. It must be admitted that the error of ADTD is usually from hundreds of meters to kilometers, and the efficiency ranges between 80% and 90%. In particular, some weak lightning may be missed, which will also reduce the hit rate of lightning to a certain extent. Monitoring and predicting the location of lightning strikes is still a particularly complex task; in particular, discretely distributed lightning is currently difficult to identify and predict. We hope to resolve this issue in future research. In addition, although we used stepwise sensitivity analysis and one-factor sensitivity analysis to analyze the data used in the model training, the interpretation of the correlation analysis between the actual physical variables and lightning is not clear enough. The interoperability of the LM-ResNet model still needs to be strengthened.

Author Contributions

Conceptualizations, M.L., M.Y. and M.C.; methodology, M.L., M.Y., Y.Z. and M.C.; software, Y.Z. and M.L.; validation, M.L., Y.Z. and M.W.; formal analysis, Y.Z.; investigation, Y.Z.; resources, M.L. and M.Y.; data curation, Y.Z.; writing-original draft preparation, Y.Z.; writing-review and editing, M.L., M.Y. and M.C.; visualization, M.W.; supervision, M.L. and M.Y.; project administration, Y.Z.; funding acquisition, M.L. All authors have read and agreed to the published version of the manuscript.

Funding

This paper was supported by the NSCF Project (41871285).

Institutional Review Board Statement

The study did not involve humans or animals.

Informed Consent Statement

The study did not involve humans.

Data Availability Statement

Some data, models, or code that support the findings of this study are available from the corresponding author upon reasonable request.

Acknowledgments

Many thanks to anonymous reviewers for their valuable comments.

Conflicts of Interest

The authors declare that they have no known competing financial interests or personal relationships that could have appeared to influence the work reported in this paper.

References

  1. Zhao, F.; Liu, Y. Important meteorological predictors for long-range wildfires in China. For. Ecol. Manag. 2021, 499, 119638. [Google Scholar] [CrossRef]
  2. Holle, R.L.; Dewan, A.; Said, R.; Brooks, W.A.; Hossain, M.F.; Rafiuddin, M. Fatalities related to lightning occurrence and agriculture in Bangladesh. Int. J. Disaster Risk Reduct. 2019, 41, 101264. [Google Scholar] [CrossRef]
  3. Spano, S.J.; Campagne, D.; Stroh, G.; Shalit, M. A Lightning Multiple Casualty Incident in Sequoia and Kings Canyon National Parks. Wilderness Environ. Med. 2015, 26, 43–53. [Google Scholar] [CrossRef] [PubMed] [Green Version]
  4. Cooper, M.A.; Holle, R.L. Current Global Estimates of Lightning Fatalities and Injuries. In Reducing Lightning Injuries Worldwide; Springer: Berlin/Heidelberg, Germany, 2019; pp. 65–73. [Google Scholar] [CrossRef]
  5. Adekitan, A.I.; Rock, M. Analytical calculation of lightning strike probability for floating roof tanks. J. Physics Conf. Ser. 2021, 1878, 012001. [Google Scholar] [CrossRef]
  6. Johari, D.; Amir, M.F.A.M.; Hashim, N.; Baharom, R.; Haris, F.A. Positive Cloud-To-Ground Lightning Observed in Shah Alam, Malaysia based on SAFIR 3000 Lightning Location System. In Proceedings of the 2021 IEEE International Conference in Power Engineering Application (ICPEA), Virtual, 8–9 March 2021; pp. 178–182. [Google Scholar] [CrossRef]
  7. Dowden, R.L.; Brundell, J.B.; Rodger, C.J. VLF lightning location by time of group arrival (TOGA) at multiple sites. J. Atmos. Solar-Terrestrial Physics 2002, 64, 817–830. [Google Scholar] [CrossRef]
  8. Fata, A.L.; Tosi, I.; Brignone, M.; Procopio, R.; Delfino, F. A Review of Lightning Location Systems: Part I-Methodologies and Techniques. In Proceedings of the 2020 IEEE International Conference on Environment and Electrical Engineering and 2020 IEEE Industrial and Commercial Power Systems Europe (EEEIC/I&CPS Europe), Madrid, Spain, 9–12 June 2020. [Google Scholar]
  9. Visacro, S.; Guimaraes, M.; Vale, M.H.M. Striking Distance Determined From High-Speed Videos and Measured Currents in Negative Cloud-to-Ground Lightning. J. Geophys. Res. Atmos. 2017, 122, 356–369. [Google Scholar] [CrossRef] [Green Version]
  10. Mora, N.; Rachidi, F.; Rubinstein, M. Application of the time reversal of electromagnetic fields to locate lightning discharges. Atmos. Res. 2012, 117, 78–85. [Google Scholar] [CrossRef]
  11. Ghasemi, A.; Amanollahi, J. Evaluating and Forecasting the Probability of Lightning Occurrence in Rasht City. Geogr. Sustain. Environ. 2020, 10, 21–35. [Google Scholar] [CrossRef]
  12. Zhu, Y.; Bitzer, P.; Rakov, V.; Ding, Z. A Machine-Learning Approach to Classify Cloud-to-Ground and Intracloud Lightning. Geophys. Res. Lett. 2021, 48, 1–8. [Google Scholar] [CrossRef]
  13. Peng, C.; Liu, F.; Zhu, B.; Wang, W.; Peng, C.; Liu, F.; Zhu, B.; Wang, W. Lightning Waveform Classification Based on Deep Convolutional Neural Network. AGUFM 2018, 2018, AE11B-2705. [Google Scholar]
  14. Wang, J. Identification technology of substation lightning overvoltage based on wavelet transform research and application. In Proceedings of the 2020 5th Asia Conference on Power and Electrical Engineering (ACPEE), Chengdu, China, 4–7 June 2020; pp. 1746–1750. [Google Scholar] [CrossRef]
  15. Wang, J.; Zhang, Y.; Tan, Y.; Chen, Z.; Zheng, D.; Zhang, Y.; Fan, Y. Fast and Fine Location of Total Lightning from Low Frequency Signals Based on Deep-Learning Encoding Features. Remote Sens. 2021, 13, 2212. [Google Scholar] [CrossRef]
  16. Baker, M.B.; Christian, H.J.; Latham, J. A computational study of the relationships linking lightning frequency and other thundercloud parameters. Q. J. R. Meteorol. Soc. 1995, 121, 1525–1548. [Google Scholar] [CrossRef]
  17. Wang, C.; Wang, P.; Wang, P.; Xue, B.; Wang, D. Using Conditional Generative Adversarial 3-D Convolutional Neural Network for Precise Radar Extrapolation. IEEE J. Sel. Top. Appl. Earth Obs. Remote Sens. 2021, 14, 5735–5749. [Google Scholar] [CrossRef]
  18. Zheng, K.; Liu, Y.; Zhang, J.; Luo, C.; Tang, S.; Ruan, H.; Tan, Q.; Yi, Y.; Ran, X. A Generative Adversarial Model for Radar Echo Extrapolation Based on Convolutional Recurrent Units. Geosci. Model Dev. Discuss. 2022, 15, 1467–1475. [Google Scholar] [CrossRef]
  19. Cha, D.; Wang, X.; Kim, J.W. Assessing Lightning and Wildfire Hazard by Land Properties and Cloud to Ground Lightning Data with Association Rule Mining in Alberta, Canada. Sensors 2017, 17, 2413. [Google Scholar] [CrossRef] [Green Version]
  20. Biswasharma, R.; Roy, P.; Samanta, D.; Pramanik, G.P.; Sharma, S. Regional variation of electrical and lightning properties of thunderclouds during the pre-monsoon season over the north-eastern and eastern part of India. Atmos. Res. 2021, 260, 105683. [Google Scholar] [CrossRef]
  21. Wan, X.; Liu, F.; Tang, Y.; Liu, Y.; Xue, M. Study on measurement error analysis and correction method of ground flash data in Hunan. In Proceedings of the 2021 2nd International Conference on Artificial Intelligence and Information Systems, Chongqing, China, 28–30 May 2021. [Google Scholar] [CrossRef]
  22. Zhou, K.; Zheng, Y.; Dong, W.; Wang, T. A Deep Learning Network for Cloud-to-Ground Lightning Nowcasting with Multisource Data. J. Atmos. Ocean. Technol. 2020, 37, 927–942. [Google Scholar] [CrossRef]
  23. Yoshikawa, E.; Horishita, S.; Ushio, T. Aircraft Lightning Potential Area Detection Enhanced by Echo Top Height and its Evaluation with Winter Lightning Cases. J. Atmos. Electr. 2021, 39, 70–78. [Google Scholar] [CrossRef]
  24. Yin, W.; Jin, W.; Zhou, C.; Liu, Y.; Tang, Q.; Liu, M.; Chen, G.; Zhao, Z. Lightning Detection and Imaging Based on VHF Radar Interferometry. Remote Sens. 2021, 13, 2065. [Google Scholar] [CrossRef]
  25. Salvador, A.; Pineda, N.; Montanyà, J.; López, J.A.; Solà, G. Thunderstorm charge structures favouring cloud-to-ground lightning. Atmos. Res. 2021, 257, 105577. [Google Scholar] [CrossRef]
  26. Payne-Scott, R. The Visibility of Small Echoes on Radar PPI Displays. Proc. IRE 1948, 36, 180–196. [Google Scholar] [CrossRef]
  27. Franco, M.; Sánchez-Diezma, R.; Sempere-Torres, D. Article Improvements in weather radar rain rate estimates using a method for identifying the vertical profile of reflectivity from volume radar scans. Meteorol. Zeitschrift 2006, 15, 521–536. [Google Scholar] [CrossRef]
  28. Lu, M.; Chen, M.; Wang, X.; Yu, M.; Jiang, Y.; Yang, C. 3D modelling strategy for weather radar data analysis. Environ. Earth Sci. 2018, 77, 804. [Google Scholar] [CrossRef]
  29. Raghavan, S. Weather Radar Signal Processing and Display. In Radar Meteorology; Springer: Berlin/Heidelberg, Germany, 2003; pp. 93–160. [Google Scholar] [CrossRef]
  30. Cică, R.; Burcea, S.; Bojariu, R. Assessment of severe hailstorms and hail risk using weather radar data. Meteorol. Appl. 2015, 22, 746–753. [Google Scholar] [CrossRef] [Green Version]
  31. Lakshmanan, V.; Hondl, K.; Potvin, C.K.; Preignitz, D. An Improved Method for Estimating Radar Echo-Top Height. Weather Forecast. 2013, 28, 481–488. [Google Scholar] [CrossRef]
  32. Delobbe, L.; Holleman, I. Uncertainties in radar echo top heights used for hail detection. Meteorol. Appl. 2006, 13, 361–374. [Google Scholar] [CrossRef]
  33. Boudevillain, B.; Andrieu, H. Assessment of vertically integrated liquid (VIL) water content radar measurement. J. Atmos. Ocean. Technol. 2003, 20, 807–819. [Google Scholar] [CrossRef] [Green Version]
  34. Yanovsky, F.J.; Lekhovytskiy, D.I.; Atamanskiy, D.V. Advanced algorithm of velocity measurement for modern meteorological radar. In Proceedings of the 2012 9th European Radar Conference, Amsterdam, The Netherlands, 31 October–2 November 2012; pp. 134–137. [Google Scholar]
  35. Doviak, R.J.; Zrnic, D.S.; Sirmans, D.S. Doppler Weather Radar. Proc. IEEE 1979, 67, 1522–1553. [Google Scholar] [CrossRef]
  36. Han, W.; Zhang, D.; Zhao, H.; Wei, S.; Pang, S.; Pan, W. Research on the Variation of Lightning Activity Parameters with Land Types Based on Lightning Location System. In Proceedings of the 2021 IEEE 4th International Electrical and Energy Conference (CIEEC), Wuhan, China, 28–30 May 2021. [Google Scholar] [CrossRef]
  37. Nath, A.; Manohar, G.K.; Dani, K.K.; Devara, P.C.S. A study of lightning activity over land and oceanic regions of India. J. Earth Syst. Sci. 2009, 118, 467–481. [Google Scholar] [CrossRef] [Green Version]
  38. Tran, G.S.; Nghiem, T.P.; Nguyen, V.T.; Luong, C.M.; Burie, J.C.; Levin-Schwartz, Y. Improving Accuracy of Lung Nodule Classification Using Deep Learning with Focal Loss. J. Healthc. Eng. 2019, 2019, 5156416. [Google Scholar] [CrossRef]
  39. Romdhane, T.F.; Alhichri, H.; Ouni, R.; Atri, M. Electrocardiogram heartbeat classification based on a deep convolutional neural network and focal loss. Comput. Biol. Med. 2020, 123, 103866. [Google Scholar] [CrossRef] [PubMed]
  40. Lin, T.-Y.; Goyal, P.; Girshick, R.; He, K.; Dollar, P. Focal Loss for Dense Object Detection. IEEE Trans. Pattern Anal. Mach. Intell. 2020, 42, 318–327. [Google Scholar] [CrossRef] [PubMed] [Green Version]
  41. He, K.; Zhang, X.; Ren, S.; Sun, J. Deep Residual Learning for Image Recognition. In Proceedings of the 2016 IEEE Conference on Computer Vision and Pattern Recognition (CVPR), Las Vegas, NV, USA, 27–30 June 2016; pp. 770–778. [Google Scholar]
  42. Szegedy, C.; Reed, S.; Sermanet, P.; Vanhoucke, V.; Rabinovich, A. Going deeper with convolutions. In Proceedings of the 2015 IEEE Conference on Computer Vision and Pattern Recognition (CVPR), Boston, MA, USA, 7–12 June 2015; pp. 1–12. [Google Scholar]
  43. Huang, G.; Liu, Z.; van der Maaten, L.; Weinberger, K.Q. Densely Connected Convolutional Networks. arXiv 2017, arXiv:1608.06993, 4700–4708. [Google Scholar]
  44. Tian, H.; Wang, P.; Tansey, K.; Han, D.; Zhang, J.; Zhang, S.; Li, H. A deep learning framework under attention mechanism for wheat yield estimation using remotely sensed indices in the Guanzhong Plain, PR China. Int. J. Appl. Earth Obs. Geoinf. 2021, 102, 102375. [Google Scholar] [CrossRef]
  45. Lu, M.; Zhang, Y.; Ma, Z.; Yu, M.; Chen, M.; Zheng, J.; Wang, M. Lightning Strike Location Identification Based on 3D Weather Radar Data. Front. Environ. Sci. 2021, 0, 329. [Google Scholar] [CrossRef]
  46. Caicedo, J.A.; Uman, M.A.; Pilkey, J.T. Lightning Evolution In Two North Central Florida Summer Multicell Storms and Three Winter/Spring Frontal Storms. J. Geophys. Res. Atmos. 2018, 123, 1155–1178. [Google Scholar] [CrossRef] [Green Version]
  47. Yang, Y.H.; King, P. Investigating the potential of using radar Echo reflectivity to nowcast cloud-to-ground lightning initiation over southern Ontario. Weather Forecast. 2010, 25, 1235–1248. [Google Scholar] [CrossRef]
  48. Smorgonskiy, A.; Rachidi, F.; Rubinstein, M.; Diendorfer, G. On the relation between lightning flash density and terrain elevation. In Proceedings of the 2013 International Symposium on Lightning Protection (XII SIPDA), Belo Horizonte, Brazil, 7–11 October 2013; pp. 62–66. [Google Scholar] [CrossRef]
Figure 1. Geographical locations of Ningbo.
Remotesensing 14 02200 g001
Figure 2. Extraction of feature data with lightning.
Remotesensing 14 02200 g002
Figure 3. Residual learning unit.
Remotesensing 14 02200 g003
Figure 4. LM-ResNet model structure.
Remotesensing 14 02200 g004aRemotesensing 14 02200 g004b
Figure 5. Results of training with cross entropy and focal loss by the LM-ResNet model.
Remotesensing 14 02200 g005
Figure 6. Results of observations of lightning data and model monitoring results.
Remotesensing 14 02200 g006aRemotesensing 14 02200 g006bRemotesensing 14 02200 g006c
Figure 7. The results are shown in different groups.
Remotesensing 14 02200 g007
Figure 8. Single factor sensitivity analysis by the LM-ResNet model.
Remotesensing 14 02200 g008
Figure 9. POD and FNR results of different data sources.
Remotesensing 14 02200 g009
Table 1. The results are shown in different models.
AccuracyPODFNRFPRF-MeasureAUCETS
GoogLeNet0.94450.6360.3640.3010.7140.8090.487
LM-ResNet0.94560.7280.2720.2720.7280.8550.551
DenseNet0.94470.7270.2730.3330.6960.8530.511
Table 2. Data are shown in different groups.
GroupData
1PPI, CR, ET, VIL, V, DEM, aspect, slope, land use, NDVI
2PPI, CR, ET, VIL, V, DEM, aspect, slope, land use
3PPI, CR, ET, VIL, V, DEM, aspect, slope
4PPI, CR, ET, VIL, V, DEM, aspect
5PPI, CR, ET, VIL, V, DEM
6PPI, CR, ET, VIL, V
7PPI, CR, ET, VIL
8PPI, CR, ET
9PPI, CR
10PPI
Publisher’s Note: MDPI stays neutral with regard to jurisdictional claims in published maps and institutional affiliations.

