R-IMNet: Spatial-Temporal Evolution Analysis of Resource-Exhausted Urban Land Based on Residual-Intelligent Module Network
Abstract
:1. Introduction
2. Materials and Methods
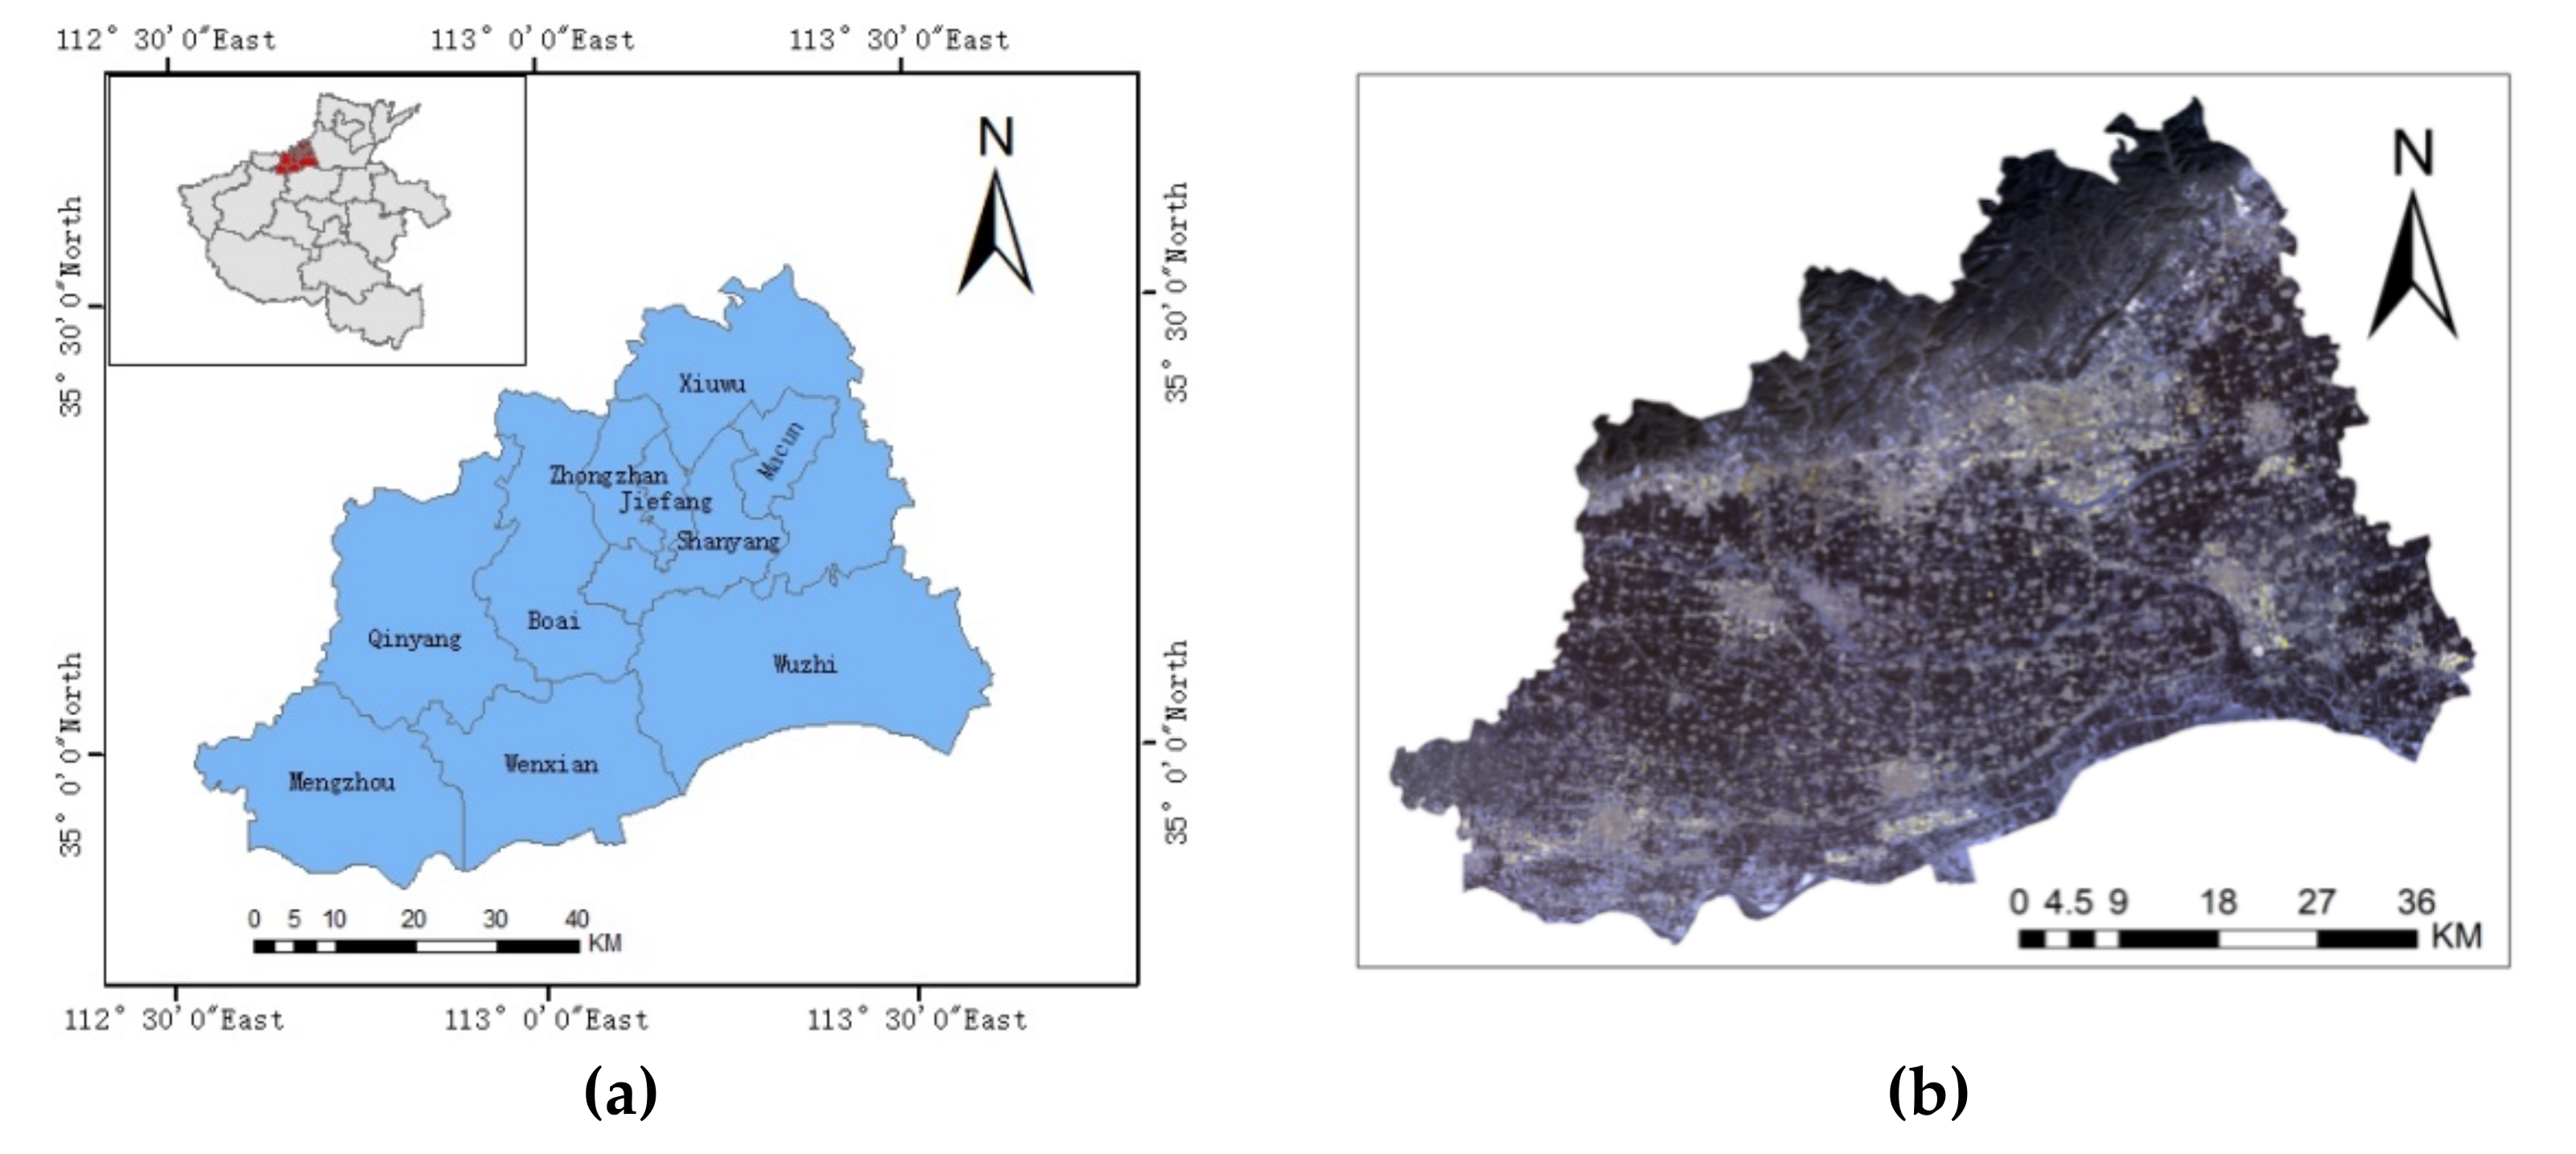
2.1. Study Area
2.2. Data Source
2.3. Methods
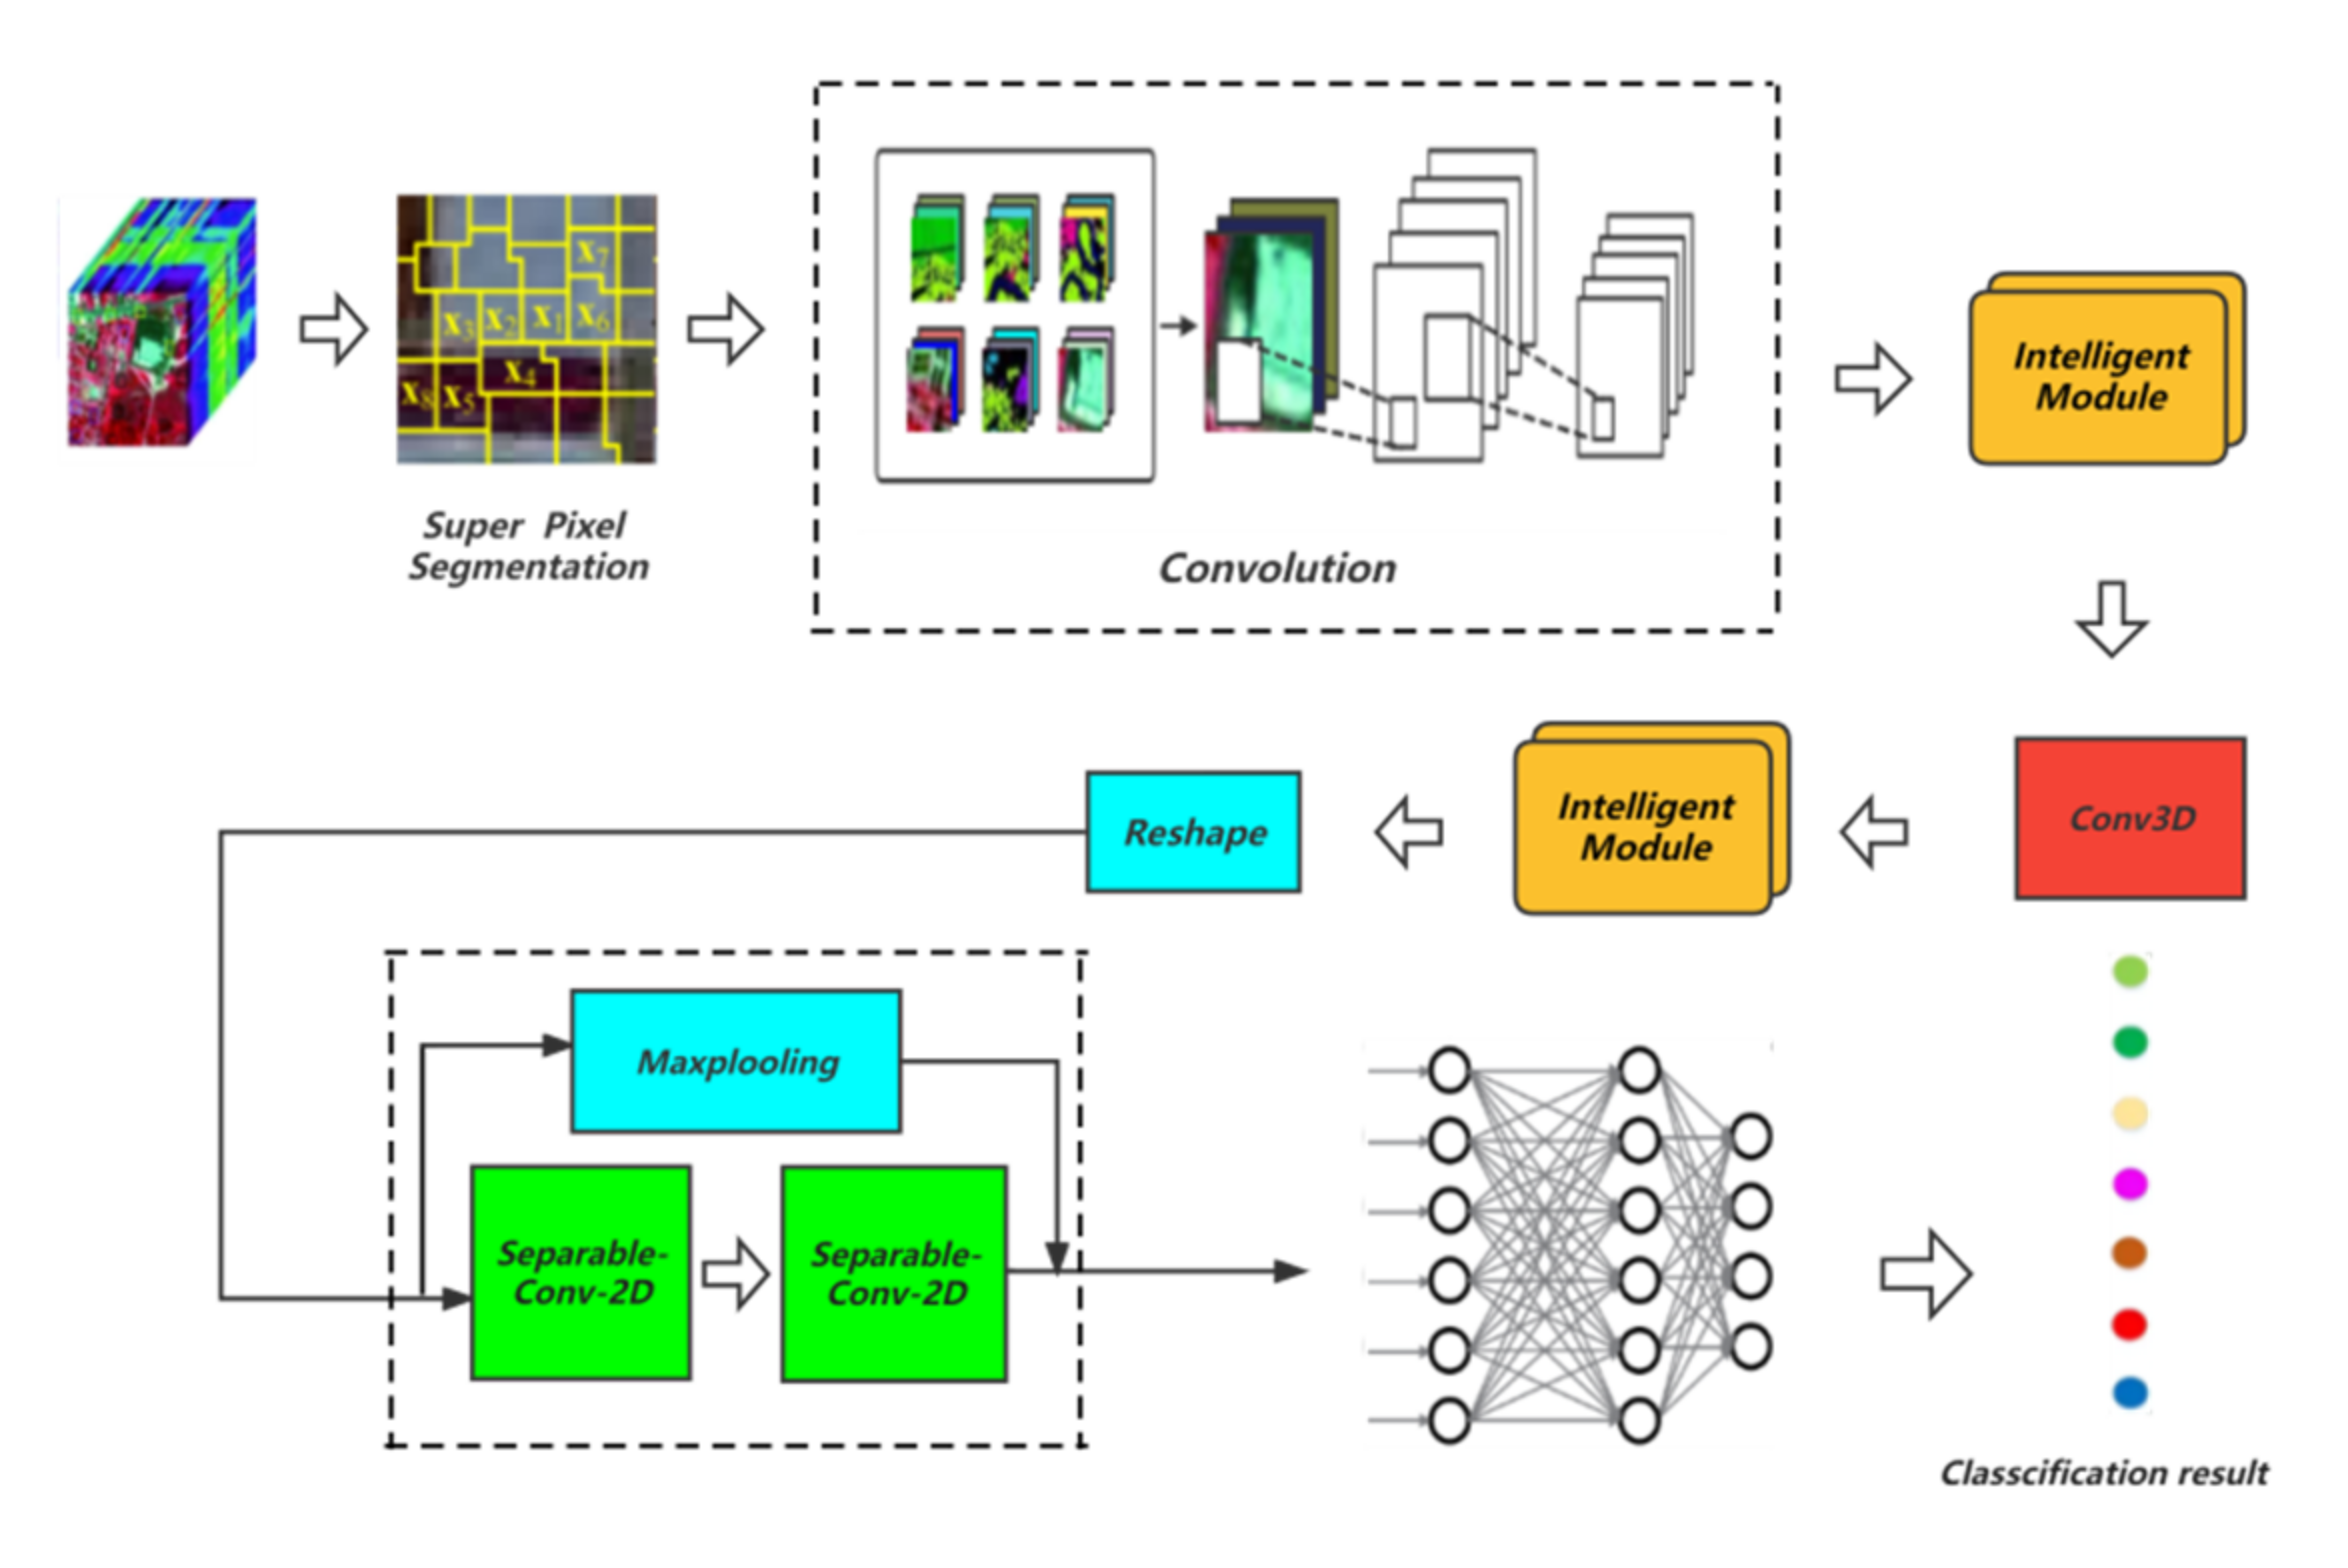
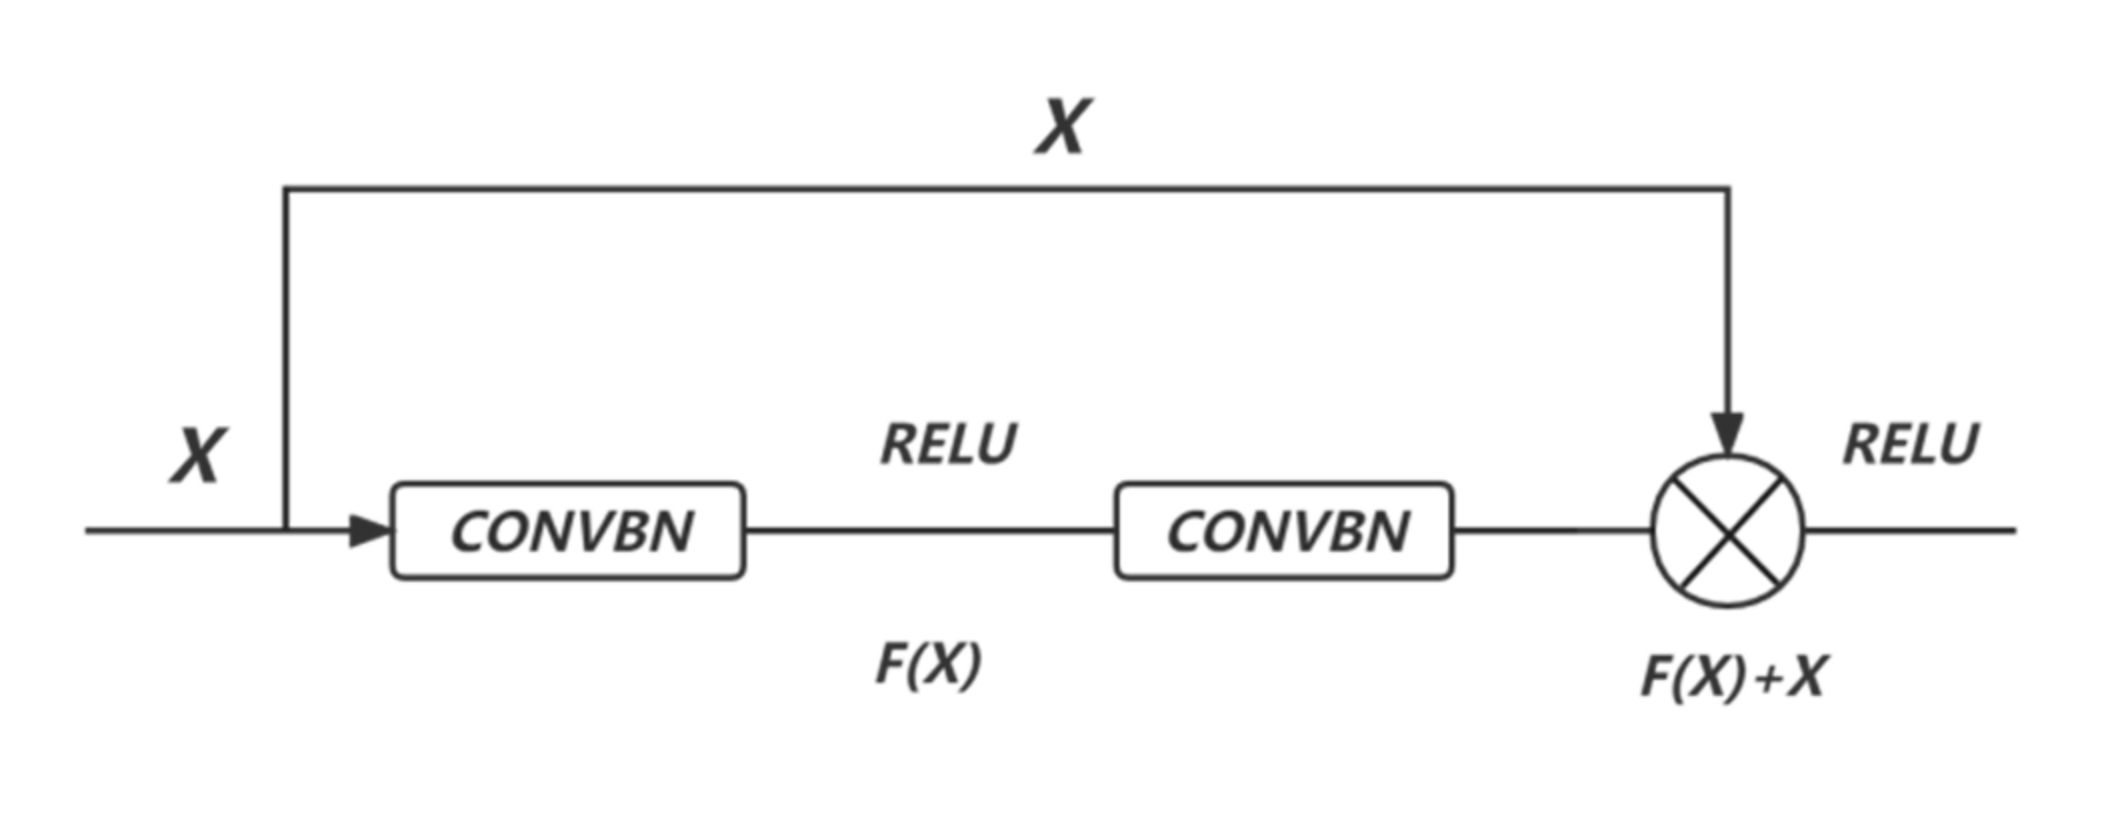
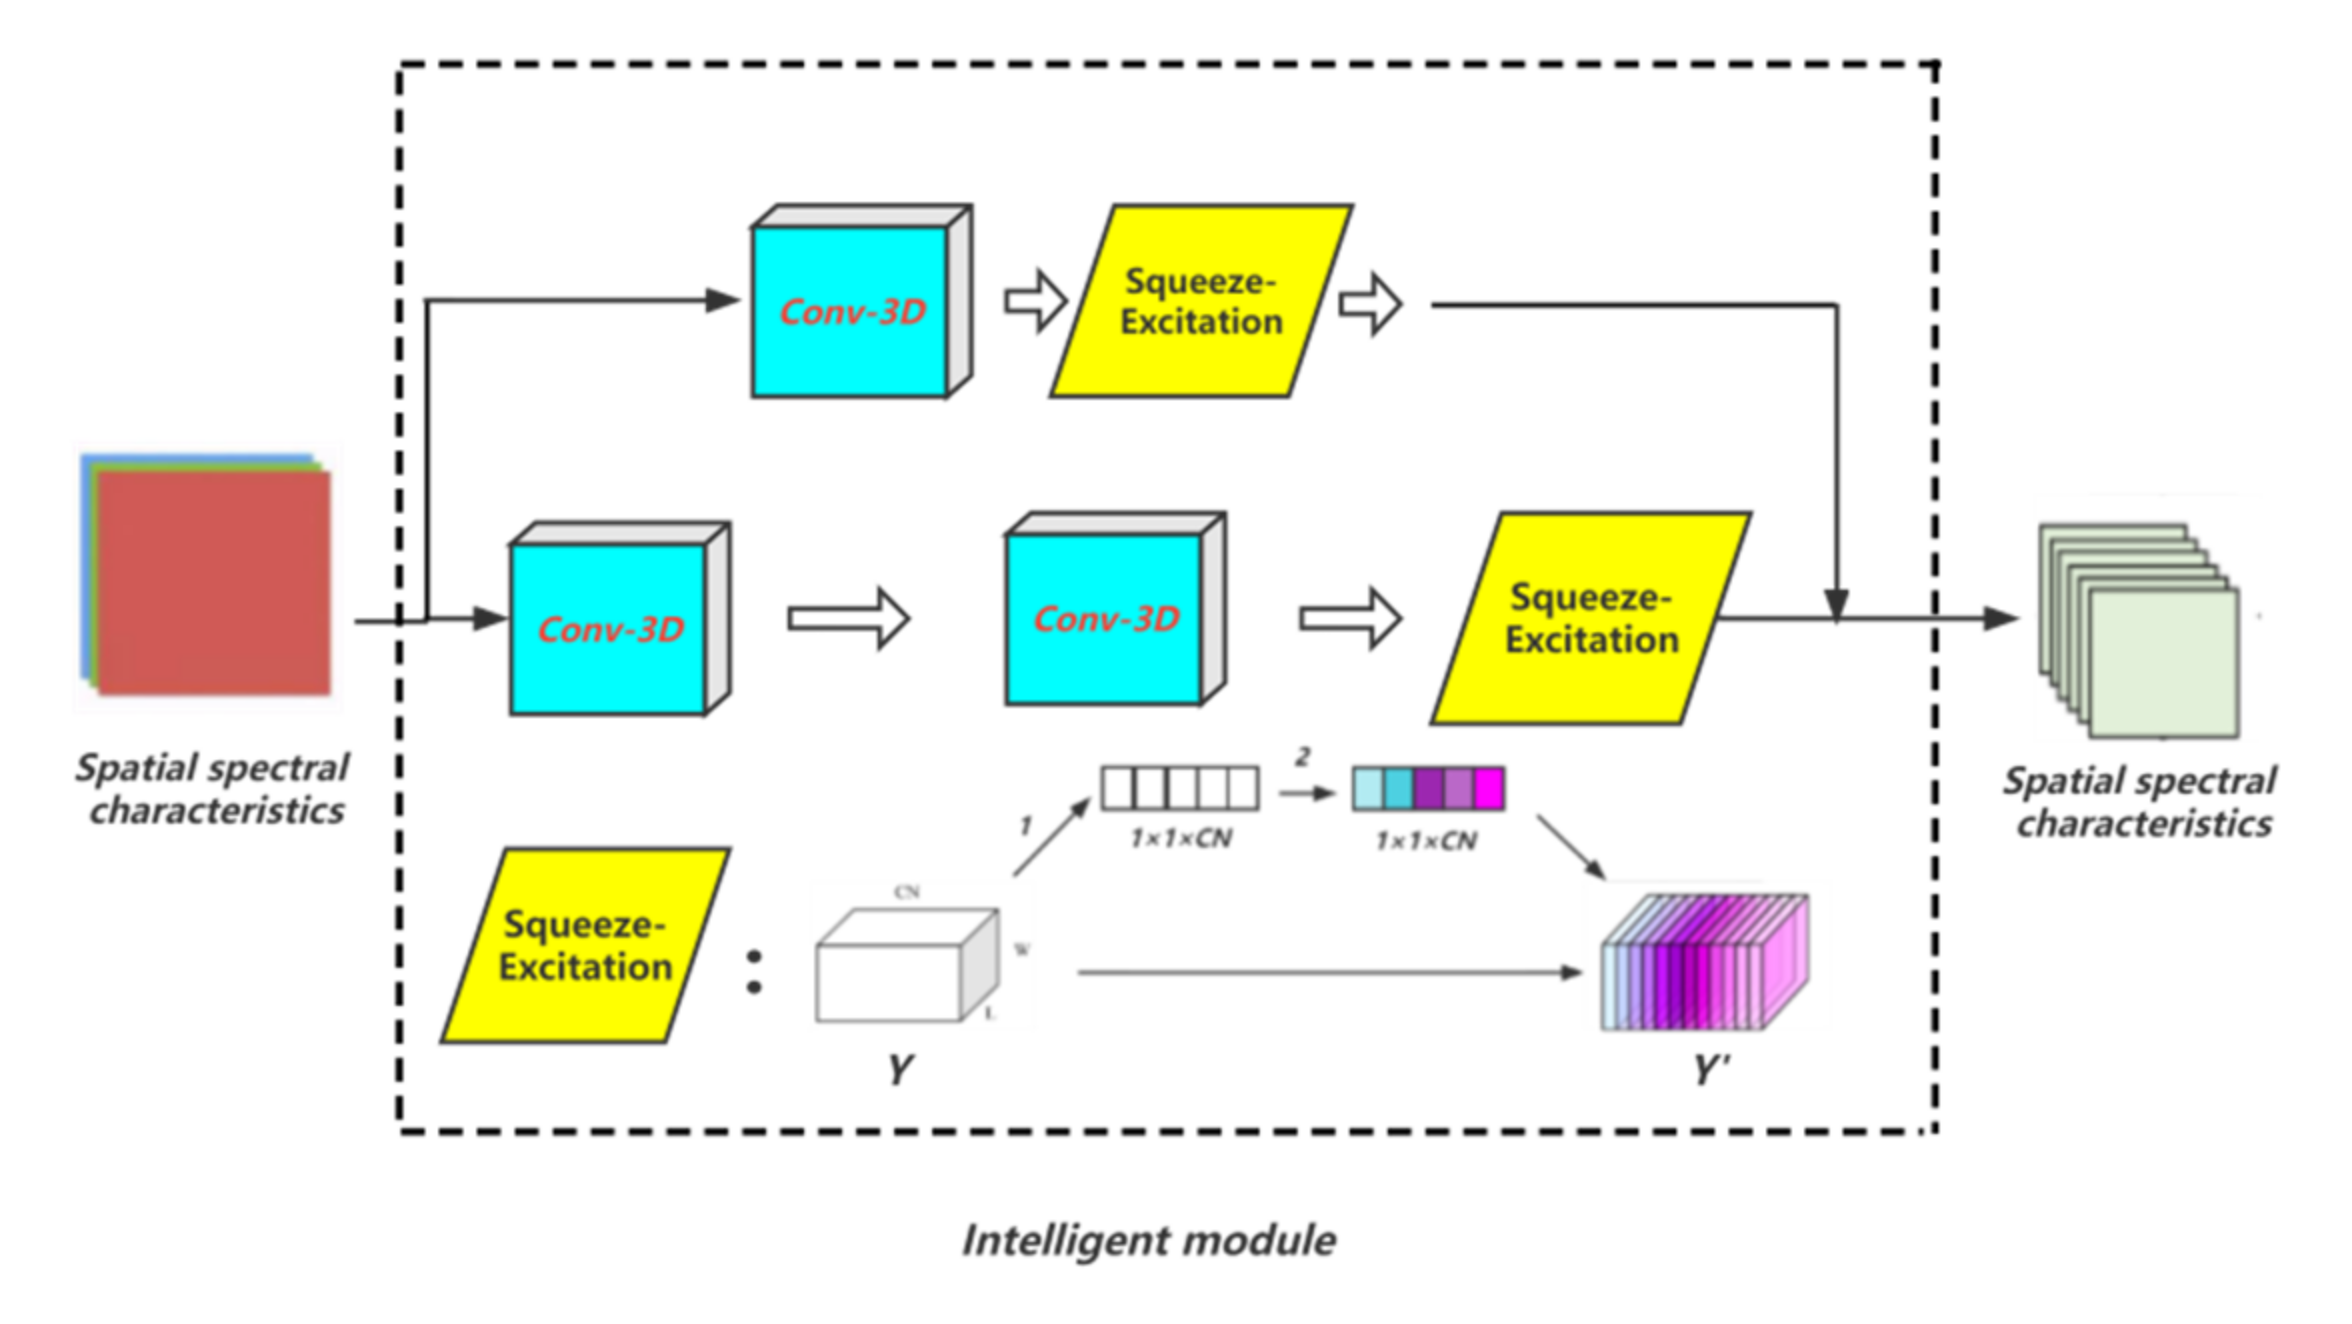
2.3.1. Hybrid Convolution Network Incorporating Super-pixel Segmentation
2.3.2. Other Related Methods
3. Results
3.1. Land Use Change
3.2. Land Use Change Maps and Transfer Matrix
3.3. Driving Force Analysis
3.3.1. Principal Component Analysis
3.3.2. Linear Regression Analysis
4. Discussion
5. Conclusions and Prospects
Author Contributions
Funding
Data Availability Statement
Acknowledgments
Conflicts of Interest
References
- Zhang, K.; Yu, Z.; Li, X. Land use change and land degradation in China from 1991 to 2001. Land Degrad. Dev. 2007, 18, 209–219. [Google Scholar] [CrossRef]
- Ellis, E.C. Anthropogenic transformation of the terrestrial biosphere. Philos. Trans. R. Soc. A Math. Phys. Eng. Sci. 2011, 369, 1010–1035. [Google Scholar] [CrossRef] [PubMed]
- González, M.; Martínez, M.G.; Lithgow, D. Land use change and its effects on the value of ecosystem services along the coast of the Gulf of Mexico. Ecol. Econ. 2012, 82, 23–32. [Google Scholar] [CrossRef]
- Portela, R.; Rademacher, I. A dynamic model of patterns of deforestation and their effect on the ability of the Brazilian Amazonia to provide ecosystem services. Ecol. Model. 2001, 143, 115–146. [Google Scholar] [CrossRef]
- Verburg, P.H.; Overmars, K.P. Combining top-down and bottom-up dynamics in land use modeling: Exploring the future of abandoned farmlands in Europe with the Dyna-CLUE model. Landsc. Ecol. 2009, 24, 1167. [Google Scholar] [CrossRef]
- Zhang, W.L.; Liu, Q.; Wu, C.B. Annual change detection of land use status based on twin neural networks. Mapp. Bull. 2021, 0, 91–95, 104. [Google Scholar]
- Randazzo, G.; Cascio, M.; Fontana, M.; Gregorio, F.; Lanza, S.; Muzirafuti, A. Mapping of Sicilian Pocket Beaches Land Use/Land Cover with Sentinel-2 Imagery: A Case Study of Messina Province. Land 2021, 10, 678. [Google Scholar] [CrossRef]
- Waśniewski, A.; Hościło, A.; Chmielewska, M. Can a Hierarchical Classification of Sentinel-2 Data Improve Land Cover Mapping? Remote Sens. 2022, 14, 989. [Google Scholar] [CrossRef]
- Rozenstein, O.; Karnieli, A. Comparison of methods for land-use classification incorporating remote sensing and GIS inputs. Appl. Geogr. 2011, 31, 533–544. [Google Scholar] [CrossRef]
- Zhang, Y.; Yang, H.; Yuan, C. A review of remote sensing image classification methods. J. Arms Equip. Eng. 2018, 39, 108–112. [Google Scholar]
- Farid, M.; Lorenzo, B. Classification of hyperspectral remote sensing images with support vector machines. IEEE Trans. Geosci. Remote Sens. 2004, 42, 1778–1790. [Google Scholar]
- Liu, H.J.; Yang, H.X.; Xu, M.Y. Soil classification based on multi-temporal remote sensing image features and maximum likelihood method during bare soil period. J. Agric. Eng. 2018, 34, 132–139, 304. [Google Scholar]
- Hou, M.J.; Yin, J.P.; Ge, J. A remote sensing classification method for land cover in alpine wetland areas based on random forest. J. Agric. Mach. 2020, 51, 220–227. [Google Scholar]
- Mariana, B.; Lucian, D. Random forest in remote sensing: A review of applications and future directions. ISPRS J. Photogramm. Remote Sens. 2016, 114, 24–31. [Google Scholar]
- Mana, S.; Robert, B. Land-use scene classification: A comparative study on bag of visual word framework. Multimed. Tools Appl. 2017, 76, 23059–23075. [Google Scholar]
- Bhabesh, D.; Helal, M.; Avv, P. Fast Multispectral Image Super-resolution via Sparse Representation. IET Image Process. 2020, 14, 2833–2844. [Google Scholar]
- Zou, Q.; Ni, L.H.; Zhang, T. Deep learning based feature selection for remote sensing scene classification. IEEE Geosci. Remote Sens. Lett. 2015, 12, 2321–2325. [Google Scholar] [CrossRef]
- Zhang, L.; Zhang, L.; Du, B. Deep learning for remote sensing data: A technical tutorial on the state of the art. IEEE Geosci. Remote Sens. Mag. 2016, 4, 22–40. [Google Scholar] [CrossRef]
- Zhu, X.X.; Tuia, D.; Mou, L. Deep learning in remote sensing: A comprehensive review and list of resources. IEEE Geosci. Remote Sens. Mag. 2017, 5, 8–36. [Google Scholar] [CrossRef] [Green Version]
- Kussul, N.; Lavreniuk, M.; Skakun, S. Deep learning classification of land cover and crop types using remote sensing data. IEEE Geosci. Remote Sens. Lett. 2017, 14, 778–782. [Google Scholar] [CrossRef]
- Wang, B.; Fan, D.L. Summary of research progress of deep learning in remote sensing image classification and recognition. Bull. Surv. Mapp. 2019, 2, 99–102. [Google Scholar]
- Li, S.T.; Song, W.W.; Fang, L.Y.; Chen, Y.; Ghamisi, P.; Benediktsson, J.A. Deep learning for hyperspectral image classification: An overview. IEEE Trans. Geosci. Remote Sens. 2019, 57, 6690–6709. [Google Scholar] [CrossRef] [Green Version]
- Li, X.J.; Yang, G.H. Adaptive fault-tolerant synchronization control of a class of complex dynamical networks with general input distribution matrices and actuator faults. IEEE Trans. Neural Netw. Learn. Syst. 2017, 28, 559–569. [Google Scholar] [CrossRef] [PubMed]
- Han, X.P.; Zhong, Y.F.; Zhao, B. Scene classification based on a hierarchical convolutional sparse auto encoder for high spatial resolution imagery. Int. J. Remote Sens. 2016, 38, 514–536. [Google Scholar] [CrossRef]
- Maggiori, E.; Tarabalka, Y.; Charpiat, G. Fully convolutional neural networks for remote sensing image classification. In Proceedings of the 2016 IEEE International Geoscience and Remote Sensing Symposium (IGARSS), Beijing, China, 10–15 July 2016; pp. 5071–5074. [Google Scholar]
- Zhang, Y.; Zhang, E.; Chen, W.J. Deep neural network for halftone image classification based on sparse autoencoder. Eng. Appl. Artif. Intell. 2016, 50, 245–255. [Google Scholar] [CrossRef]
- Mou, L.C.; Bruzzone, L.; Zhu, X.X. Learning spatial-temporal features via a recurrent convolutional neural network for change detection in multispectral imagery. IEEE Trans. Geosci. Remote Sens. 2019, 57, 924–935. [Google Scholar] [CrossRef] [Green Version]
- Zhang, M.Y.; Xu, G.L.; Chen, K. Triplet-based semantic relation learning for aerial remote sensing image change detection. IEEE Geosci. Remote Sens. Lett. 2019, 16, 266–270. [Google Scholar] [CrossRef]
- Liu, R.C.; Cheng, Z.H.; Zhang, L.L. Remote sensing image change detection based on information transmission and attention mechanism. IEEE Access. 2019, 7, 156349–156359. [Google Scholar] [CrossRef]
- Gong, M.G.; Zhao, J.J.; Liu, J. Change detection in synthetic aperture radar images based on deep neural networks. IEEE Trans. Neural Netw. Learn. Syst. 2017, 27, 125–138. [Google Scholar] [CrossRef]
- Lee, H.; Kwon, H. Going Deeper with Contextual CNN for Hyperspectral Image Classification. IEEE Trans. Image Process. 2017, 26, 4843–4855. [Google Scholar] [CrossRef] [Green Version]
- Swalpa, K.R.; Shiv, R.D.; Subhrasankar, C. FuSENet: Fused squeeze-and-excitation network for spectral-spatial hyperspectral image classification. IET Image Process. 2020, 14, 1653–1661. [Google Scholar]
- Yang, M. Hyperspectral Image Classification Based on Attention and Feature Convolutional Neural Network. Ph.D. Thesis, Xidian University, Xi’an, China, 2020. [Google Scholar]
- Qin, A.Y.; Zhao, W. Spectral–Spatial Graph Convolutional Networks for Semi-supervised Hyperspectral Image Classification. IEEE Geosci. Remote Sens. Lett. 2018, 16, 241–245. [Google Scholar] [CrossRef]
- Wan, S.; Gong, C.; Zhong, P. Multi-scale Dynamic Graph Convolutional Network for Hyperspectral Image Classification. IEEE Trans. Geosci. Remote Sens. 2019, 58, 3162–3177. [Google Scholar] [CrossRef] [Green Version]
- Fang, J.J.; Sha, J.M.; Zhou, Z.L. Random forest based land use change and urban driven analysis. Comput. Syst. Appl. 2021, 30, 12–20. [Google Scholar]
- Yang, H.Y.; Zhu, X. Impact of metro construction on spatial and temporal changes of urban land use. Intell. Build. Smart Cities 2020, 37, 31–34. [Google Scholar]
- Jiang, W.J.; Lin, M.H.; Weng, P.Y. Analysis of spatial and temporal land use evolution patterns and their key drivers in Anxi County, Fujian Province. J. Ecol. 2022, 42, 513–527. [Google Scholar]
- Yu, C.L.; Wang, C.C.; Liu, D. Evolutionary process and driving force analysis of natural wetlands in West Liaoning River Basin based on SWAT model. J. Agric. Eng. 2020, 36, 286–297. [Google Scholar]
- Kamwi, J.M.; Cho, M.A.; Kaetsch, C. Assessing the Spatial Drivers of Land Use and Land Cover Change in the Protected and Communal Areas of the Zambezi Region, Namibia. Land 2018, 7, 131. [Google Scholar] [CrossRef] [Green Version]
- Kamwi, J.M.; Chirwa, P.W.C.; Manda, S.O.M. Livelihoods, land use and land cover change in the Zambezi Region, Namibia. Popul. Environ. 2015, 37, 207–230. [Google Scholar] [CrossRef] [Green Version]
- Imbernon, J. Pattern and development of land-use changes in the Kenyan highlands since the 1950. Agric. Ecosyst. Environ. 1999, 76, 67–73. [Google Scholar] [CrossRef]
- Huang, H.; Zhou, Y.; Qian, M. Land Use Transition and Driving Forces in Chinese Loess Plateau: A Case Study from Pu County, Shanxi Province. Land 2021, 10, 67. [Google Scholar] [CrossRef]
- Jiaozuo People’s Government Website. Available online: http://www.jiaozuo.gov.cn/ (accessed on 18 July 2019).
- Wang, X.P.; Qi, H.W.; Xie, H. A preliminary investigation on the development pattern of geological environmental problems of mines in resource-depleted cities in Jiaozuo. China Resour. Compr. Util. 2020, 38, 144–146. [Google Scholar]
- Lu, D.; Weng, Q. A survey of image classification methods and techniques for improving classification performance. Int. J. Remote Sens. 2007, 28, 823–870. [Google Scholar] [CrossRef]
- Liu, J.Y.; Zhang, Z.X.; Xu, X.L. Spatial patterns and driving forces of land use change in China during the early 21st century. J. Geogr. Sci. 2010, 20, 483–494. [Google Scholar] [CrossRef]
- Song, W.; Deng, X.Z. Land-use/land-cover change and ecosystem service provision in China. Sci. Total Environ. 2017, 576, 705–719. [Google Scholar] [CrossRef]
- Guo, Z.S.; Li, C.H.; Wang, Z.M. Road extraction from ZY-3 remote sensing image based on U-Net like convolution architecture. Sci. Surv. Mapp. 2020, 45, 51–57. [Google Scholar]
- Sang, X.; Guo, Q.Z.; Pan, Y.Y. Research on land use dynamic change and prediction in Lucheng City of Shanxi Province based on TM and OLI. Remote Sens. Land Resour. 2018, 30, 125–131. [Google Scholar]
- Li, Q.P.; Lu, R.C.; Liang, B.K. Construction of land use information mapping in land border areas of Guangxi. Soil Water Conserv. Res. 2016, 23, 210–215. [Google Scholar]
- Wen, W.D. Analysis of industrial restructuring in resource-based cities—Jiaozuo City as an example. J. Henan Univ. 2002, 2, 84–87. [Google Scholar]
- Guo, P.; Zhou, W.; Yuan, T. Analysis of spatial and temporal changes in land use and driving factors in declining resource cities. Soil Water Conserv. Res. 2016, 23, 191–198. [Google Scholar]
- Zhong, H.X. The chronic problem of illegal mining in Jiaozuo City, Henan Province is difficult to be eliminated. China Environ. Monit. 2021, 5, 72–74. [Google Scholar]
- Li, R.P.; Lu, X.H. A study on the expansion of rural residential bases and the driving mechanism. In Proceedings of the 2009 Annual Academic Conference of the Chinese Land Institute Anhui Procince, Hefei, China, 19 December 2009; pp. 45–51. [Google Scholar]
- Anonymous. “The 2017 Air Pollution Prevention and Control Work Program for Beijing, Tianjin, Hebei and Surrounding Areas” Released. Environ. Dev. 2017, 29, 4. [Google Scholar]
- Xu, C.L.; Ji, P.Y.; Gong, W.F. Land use change characteristics and driving forces analysis in counties of southwest China from 2000-2015--Fengjie County, Chongqing, as an example. China Agron. Bull. 2021, 37, 98–107. [Google Scholar]
- Chang, C.; Liu, X.; Chang, G.C.; Yao, X.Y. Chang Ronghua, Chang Rong. Land Use Dynamics and driving forces of cultivated land change in Mengyin County. Sci. Soil Water Conserv. China 2010, 8, 65–70. [Google Scholar]
- Müller, D.; Kuemmerle, T.; Rusu, M. Lost in transition: Determinants of post-socialist cropland abandonment in Romania. J. Land Use Sci. 2009, 4, 109–129. [Google Scholar] [CrossRef]
- Qian, F.; Chi, Y.; Lal, R. Spatiotemporal characteristics analysis of multifunctional cultivated land: A case-study in Shenyang, Northeast China. Land Degrad. Dev. 2020, 31, 1812–1822. [Google Scholar] [CrossRef]
- Guo, Y.H. A study on land use changes and socio-economic drivers in economically developed regions—Taking the southern Jiangsu region as an example. Urban Geogr. 2017, 10, 30–31. [Google Scholar]
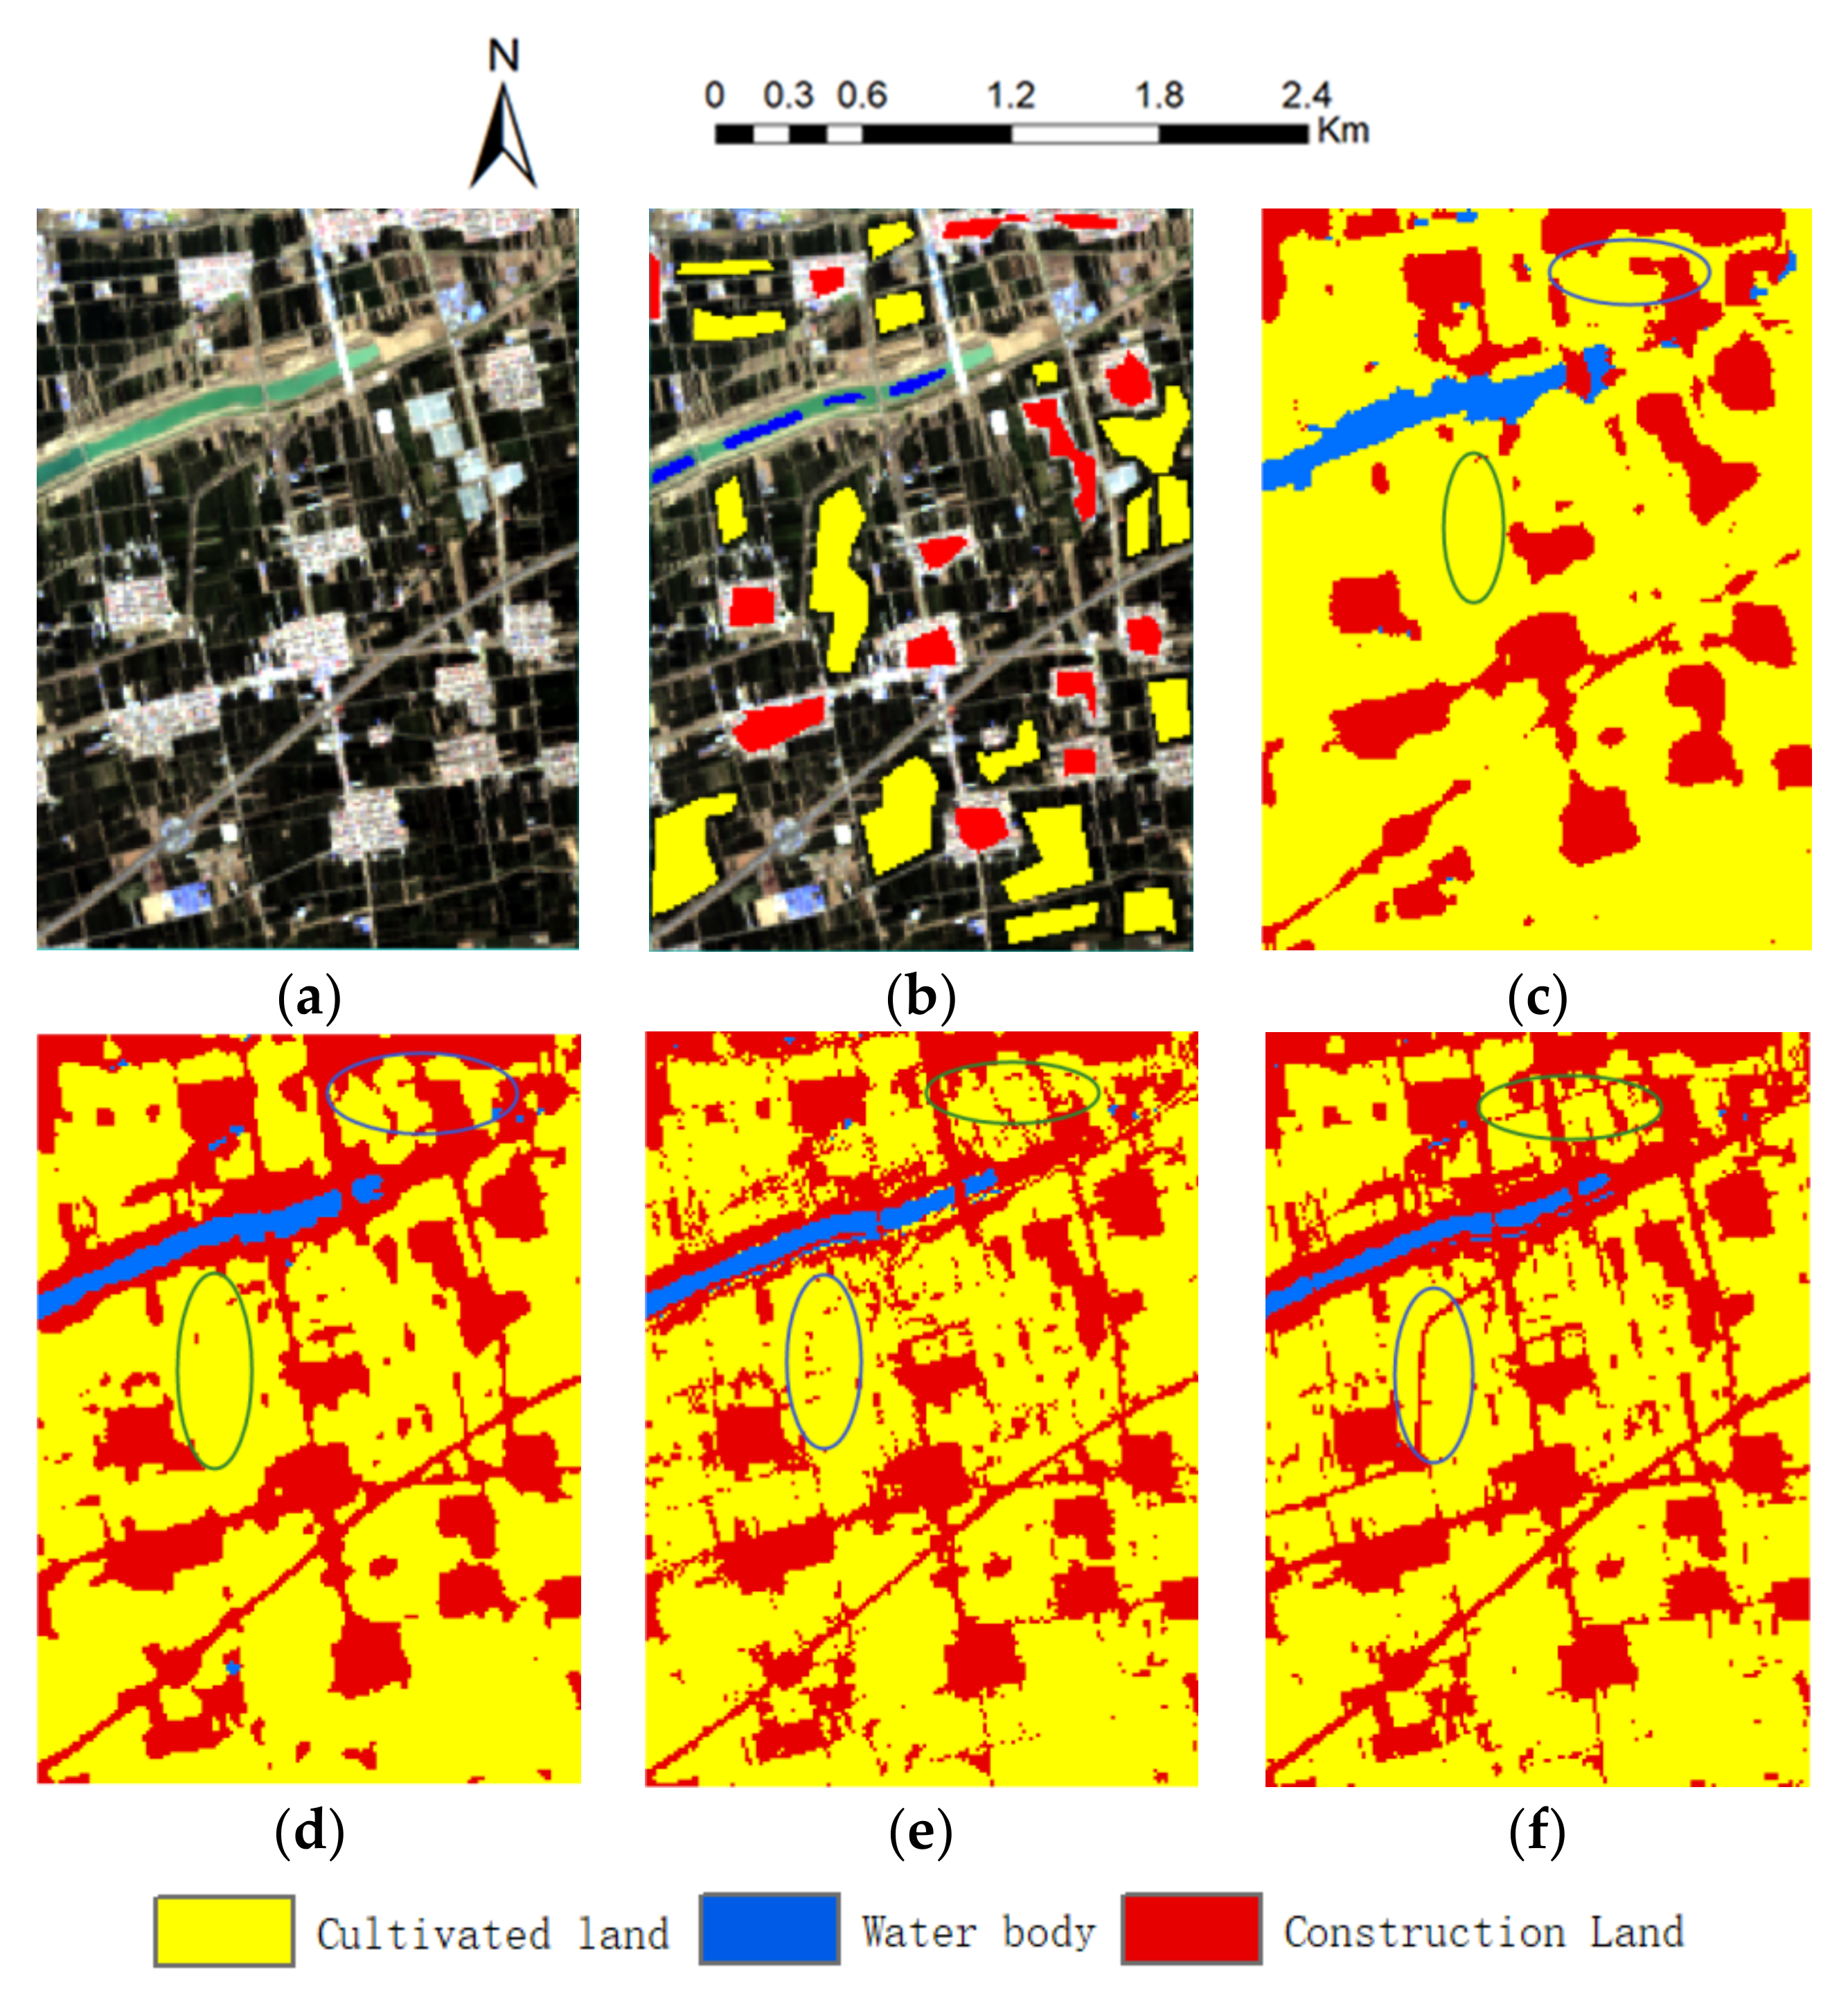
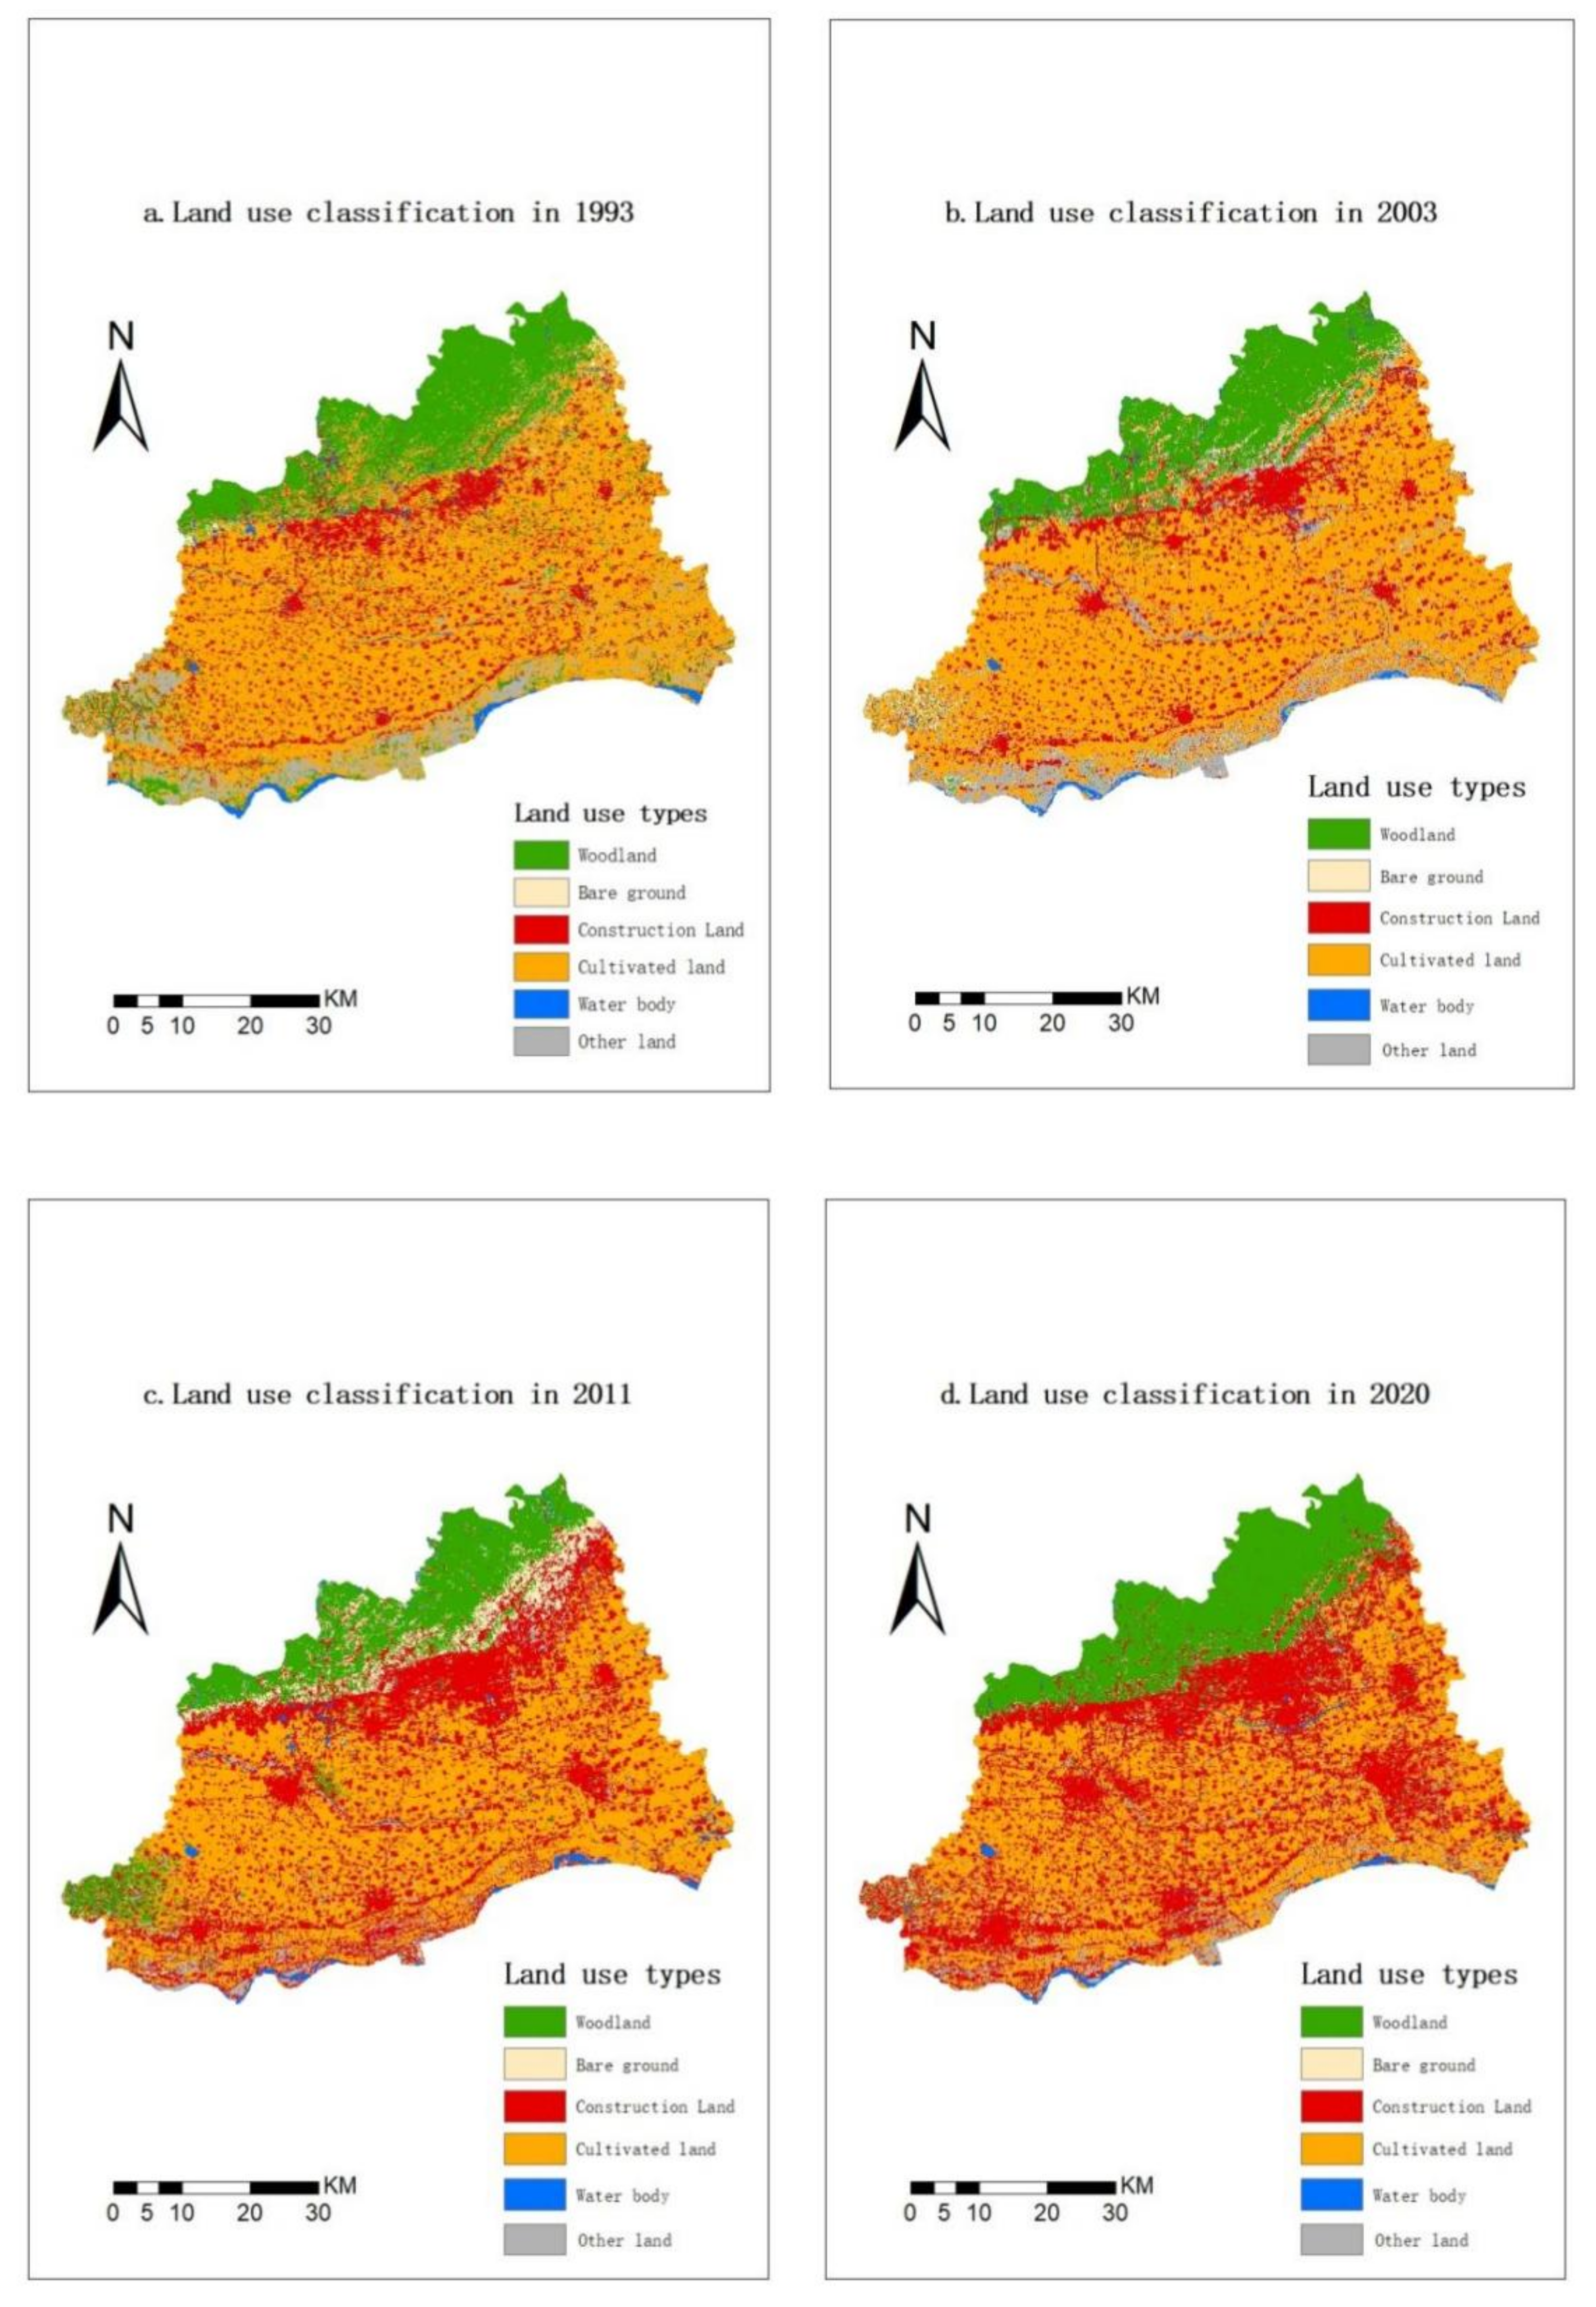
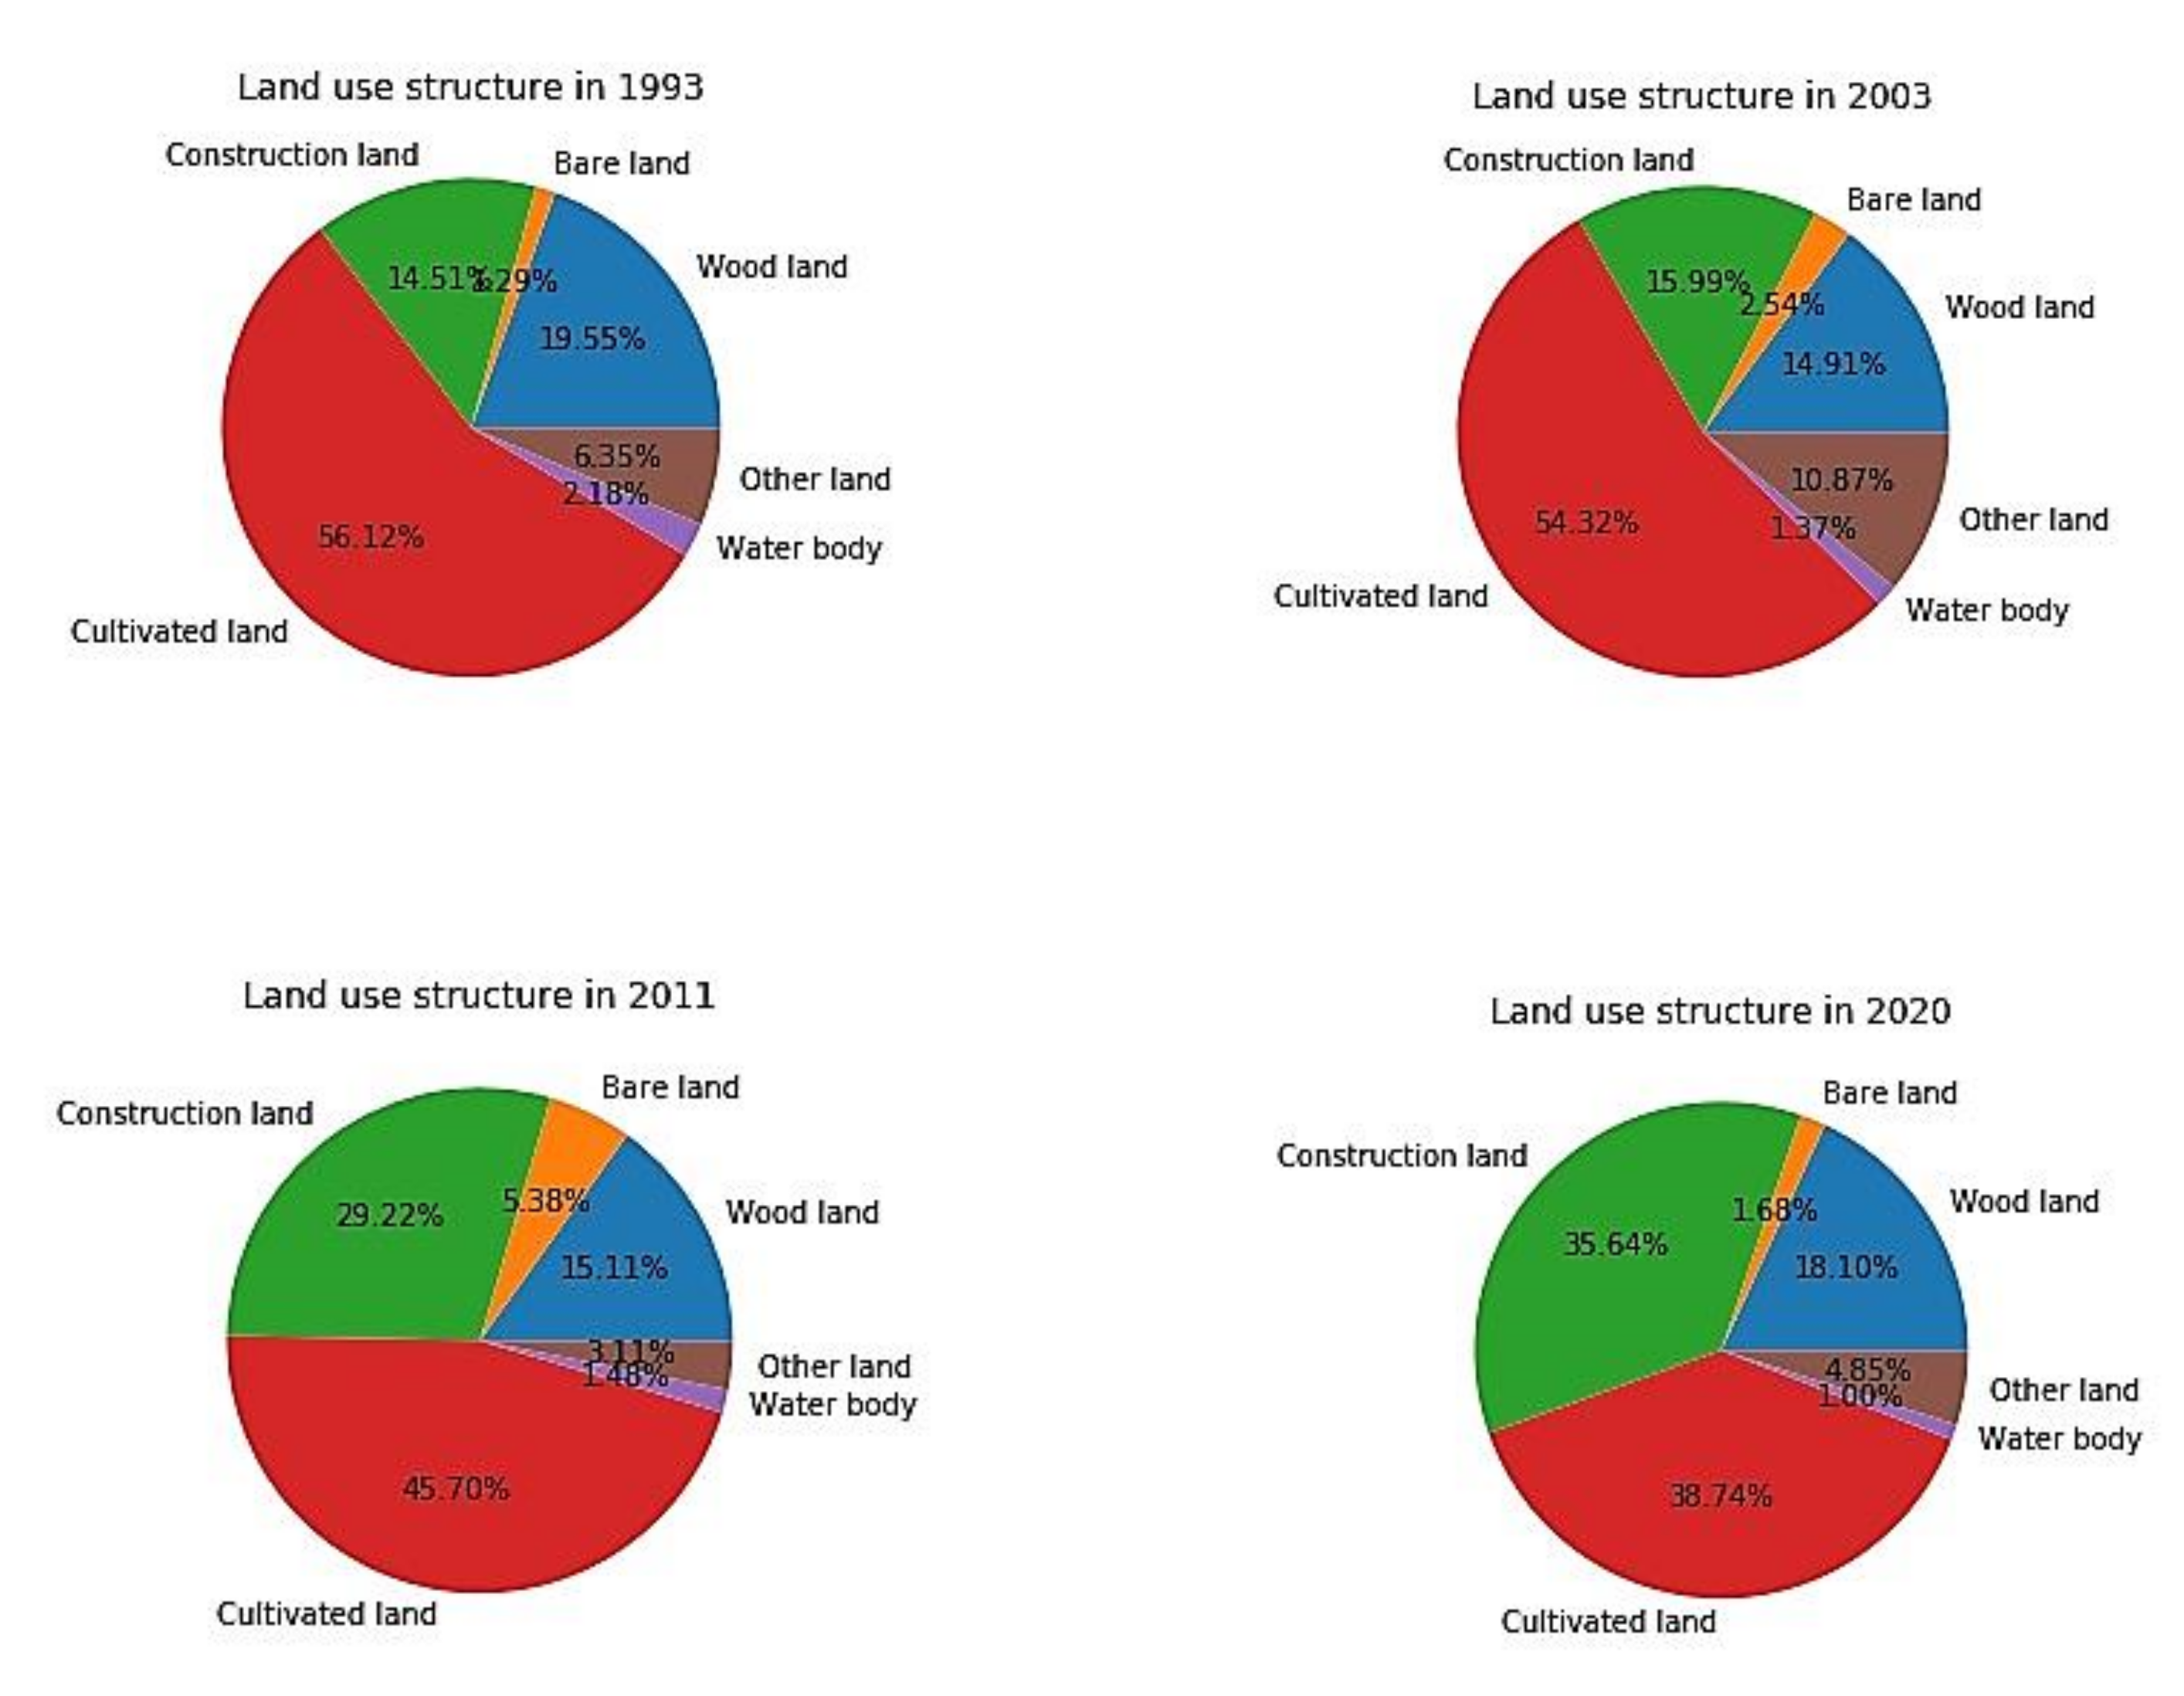

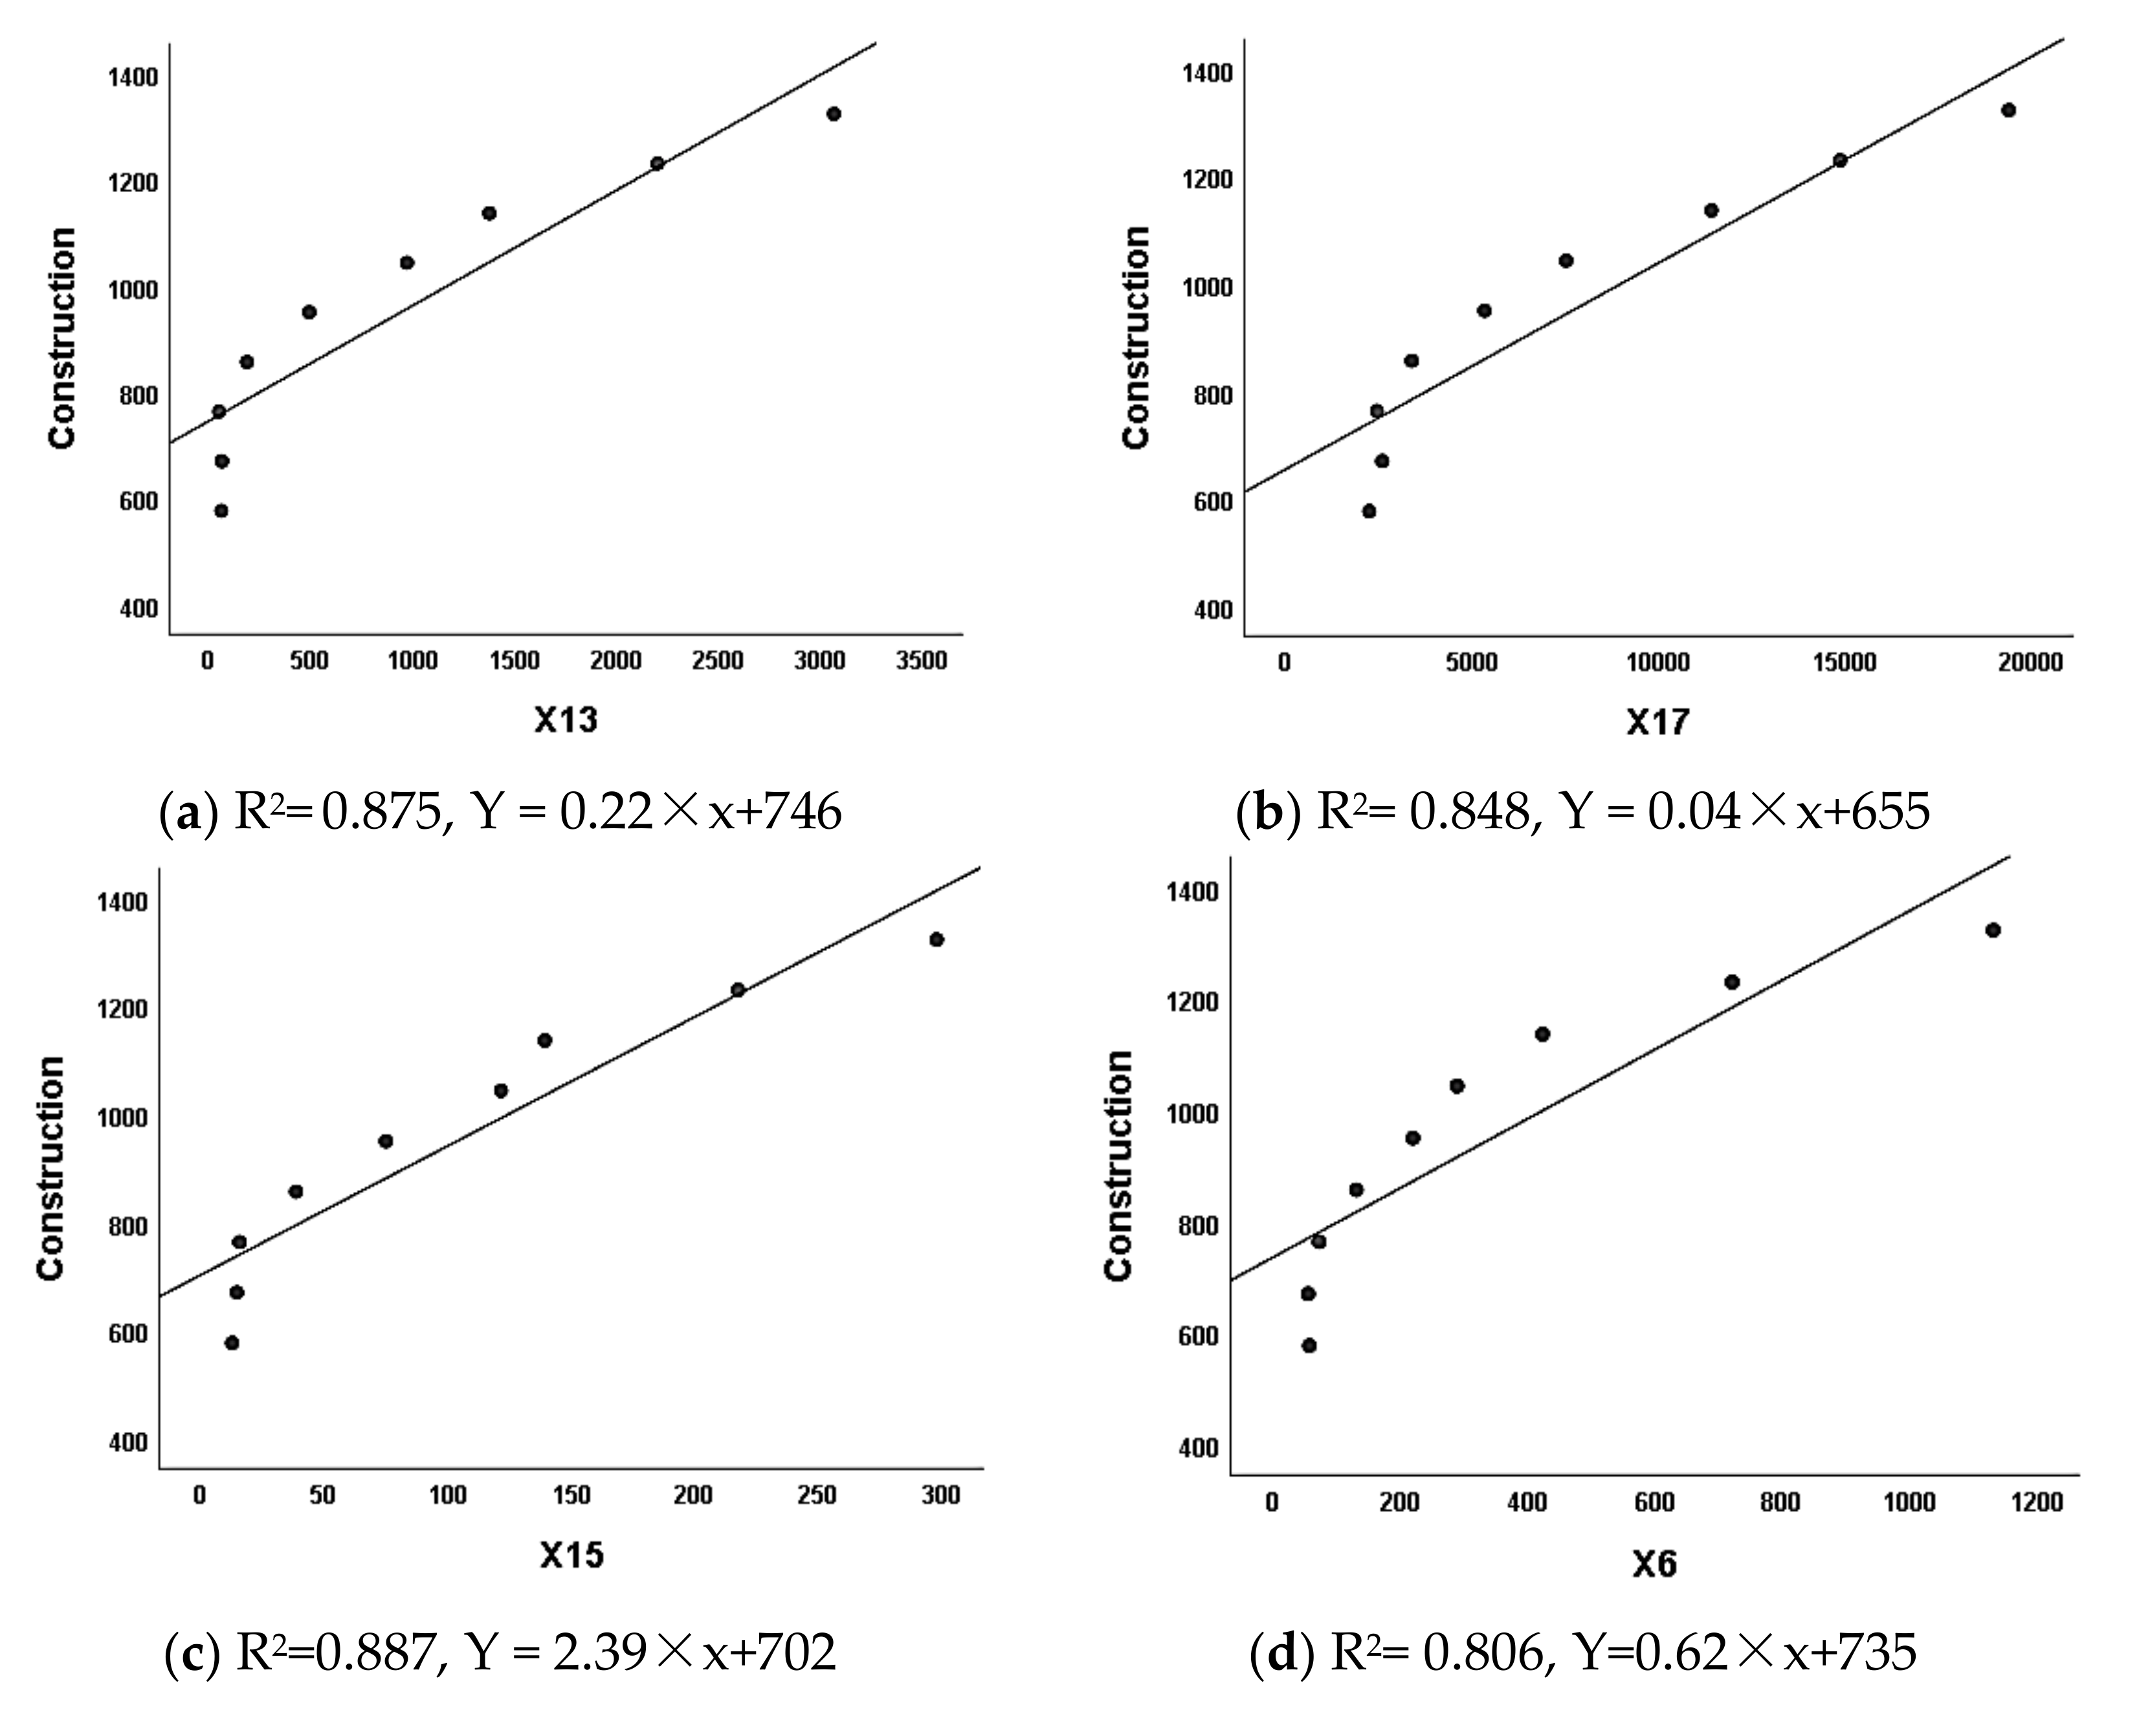
| Land Use Type | Remote Sensing Image Characteristics | Interpretive Marker |
|---|---|---|
| Woodland | Appearing red in the Nir, R and G bands | Mostly in the northern mountains. |
| Bare land | Bright color in true color band | Distributed on the periphery of construction land and cultivated land. |
| Construction land | Dark purple in the Nir, R and G bands | Mostly surrounded by arable land. |
| Cultivated land | Appearing red in the Nir, R and G bands | Distributed throughout the study area, the largest area. |
| Water body | Blue or black in in the Nir, R and G bands | Linear distribution, the characteristics are obvious. |
| Other land | Mostly brown in true color band | Concentrated in mountainous and overgrown areas. |
| SVM | 2D-CNN | HybridSN | R-IMNet * | |
|---|---|---|---|---|
| OA/% | 87.12 | 96.16 | 98.46 | 98.61 |
| Kappa | 0.82 | 0.94 | 0.97 | 0.98 |
| 1993 | 2003 | 2011 | 2020 | |
|---|---|---|---|---|
| OA/% | 94.35 | 98.49 | 99.09 | 98.61 |
| Kappa | 0.92 | 0.98 | 0.99 | 0.98 |
| Wood Land | Bare Land | Construction Land | Cultivated Land | Water Body | Other Land | Entropy Value | Degree of Equilibrium | Degree of Dominance | |
|---|---|---|---|---|---|---|---|---|---|
| 1993 Acreage /km2 | 776.79 | 51.15 | 576.80 | 2230.44 | 86.66 | 252.28 | 1.24 | 0.69 | 0.31 |
| Percentage /% | 19.55 | 1.29 | 14.51 | 56.12 | 2.18 | 6.35 | |||
| 2003 Acreage /km2 | 592.68 | 100.94 | 635.28 | 2158.85 | 54.48 | 431.85 | 1.30 | 0.73 | 0.27 |
| Percentage /% | 14.91 | 2.54 | 15.99 | 54.32 | 1.37 | 10.87 | |||
| 1993–2003 Land use dynamics | −2.37 | 9.73 | 1.01 | −0.32 | −3.71 | 7.12 | - | - | - |
| 2011 Acreage /km2 | 600.54 | 213.61 | 1161.34 | 1816.23 | 58.71 | 123.66 | 1.33 | 0.74 | 0.26 |
| Percentage /% | 15.11 | 5.38 | 29.22 | 45.70 | 1.48 | 3.11 | |||
| 2003–2011 Land use dynamics | 0.16 | 13.95 | 10.35 | −1.98 | 0.97 | −8.92 | - | - | - |
| 2020 Acreage /km2 | 719.25 | 66.72 | 1416.18 | 1539.47 | 39.62 | 192.85 | 1.31 | 0.73 | 0.27 |
| Percentage /% | 18.10 | 1.68 | 35.64 | 38.74 | 1.00 | 4.85 | |||
| 2011–2020 Land use dynamics | 2.20 | −7.64 | 2.44 | −1.69 | −3.61 | 6.22 | - | - | - |
| 1993–2020 Land use dynamics | −0.27 | 1.13 | 5.39 | −1.15 | −2.01 | −0.87 | - | - | - |
| Wood Land | Bare Land | Construction Land | Cultivated Land | Water Body | Other Land | Roll-Out Total | |
|---|---|---|---|---|---|---|---|
| Wood land | 495.50 | 42.05 | 48.70 | 98.71 | 9.98 | 81.84 | 281.28 |
| Bare land | 15.08 | 3.15 | 6.59 | 18.30 | 0.28 | 7.71 | 47.96 |
| Construction land | 29.10 | 10.06 | 330.68 | 160.76 | 6.99 | 39.21 | 246.12 |
| Cultivated land | 42.99 | 34.30 | 201.89 | 1729.59 | 15.02 | 206.65 | 500.85 |
| Water body | 4.38 | 0.69 | 29.24 | 10.80 | 21.16 | 20.38 | 65.49 |
| Other land | 5.63 | 10.70 | 18.18 | 140.67 | 1.05 | 76.05 | 176.23 |
| Roll-in total | 97.18 | 97.8 | 304.6 | 429.24 | 33.32 | 355.79 | 1317.93 |
| Wood Land | Bare Land | Construction Land | Cultivated Land | Water Body | Other Land | Roll-Out Total | |
|---|---|---|---|---|---|---|---|
| Wood land | 455.40 | 83.98 | 35.14 | 7.03 | 7.99 | 3.14 | 137.29 |
| Bare land | 25.28 | 26.34 | 28.70 | 15.95 | 0.47 | 4.21 | 74.61 |
| Construction land | 15.99 | 14.83 | 539.30 | 48.15 | 8.28 | 8.74 | 95.99 |
| Cultivated land | 67.73 | 43.65 | 344.14 | 1641.82 | 13.90 | 47.59 | 517.01 |
| Water body | 6.26 | 1.56 | 21.37 | 2.65 | 18.00 | 4.64 | 36.48 |
| Other land | 29.87 | 43.25 | 192.70 | 100.64 | 10.07 | 55.32 | 376.53 |
| Roll-in total | 145.13 | 187.27 | 622.05 | 174.42 | 40.71 | 68.32 | 1237.91 |
| Wood Land | Bare Land | Construction Land | Cultivated Land | Water Body | Other Land | Roll-Out Total | |
|---|---|---|---|---|---|---|---|
| Wood land | 481.44 | 13.52 | 56.29 | 40.51 | 1.34 | 7.44 | 119.10 |
| Bare land | 139.83 | 11.43 | 37.56 | 15.01 | 0.84 | 8.94 | 202.18 |
| Construction land | 68.78 | 19.22 | 881.73 | 120.66 | 9.92 | 61.03 | 279.61 |
| Cultivated land | 14.68 | 19.55 | 374.92 | 1317.96 | 6.14 | 82.98 | 498.27 |
| Water body | 9.83 | 0.59 | 21.42 | 6.42 | 16.08 | 4.37 | 42.63 |
| Other land | 4.69 | 2.39 | 44.26 | 38.91 | 5.31 | 28.09 | 95.56 |
| Roll-in total | 237.81 | 55.27 | 534.45 | 221.51 | 23.55 | 164.76 | 1237.35 |
| Factors | Indicators |
|---|---|
| Demographic factors | X1 total population at the end of the year, X2 non-agricultural population |
| Economic Factors | X3 gross regional product, X4 primary industry. X5 secondary industry, X6 tertiary industry, X7 industrial value added |
| Agricultural structure | X8 grain production, X9 oilseed production, X10 cotton production, X11 vegetable production, X12 total meat production |
| Policy Factors | X13 social fixed asset investment, X14 fiscal budget revenue, X15 fiscal budget expenditure |
| Social Development Level | X16 total retail sales of social consumer goods, X17 per capita net income of farmers |
| Factor | Component 1 | Component 2 | Factor | Component 1 | Component 2 |
|---|---|---|---|---|---|
| X13 | 0.995 | 0.056 | X4 | 0.923 | 0.341 |
| X17 | 0.990 | 0.107 | X9 | 0.912 | 0.315 |
| X15 | 0.990 | 0.111 | X8 | 0.856 | 0.322 |
| X6 | 0.989 | −0.013 | X1 | 0.827 | 0.525 |
| X16 | 0.986 | 0.117 | X2 | 0.816 | 0.398 |
| X3 | 0.981 | 0.179 | X11 | 0.455 | 0.846 |
| X7 | 0.964 | 0.239 | X12 | −0.073 | 0.940 |
| X14 | 0.961 | 0.261 | X10 | −0.896 | −0.247 |
| X5 | 0.946 | 0.291 |
| 1 | 2 | 3 | 4 | 5 | 6 | 7 | 8 | 9 | |
|---|---|---|---|---|---|---|---|---|---|
| X13 | 60.98 | 63.53 | 50.20 | 187.16 | 491.33 | 970.82 | 1374.04 | 2198.01 | 3064.28 |
| X17 | 2238 | 2586 | 2445 | 3374 | 5326 | 7512 | 11400 | 14851 | 19374 |
| X15 | 12.88 | 14.76 | 15.85 | 38.63 | 75.03 | 121.55 | 139.20 | 217.34 | 297.60 |
| X6 | 57.37 | 55.53 | 72.28 | 131.14 | 219.76 | 289.03 | 423.27 | 721.1 | 1131.2 |
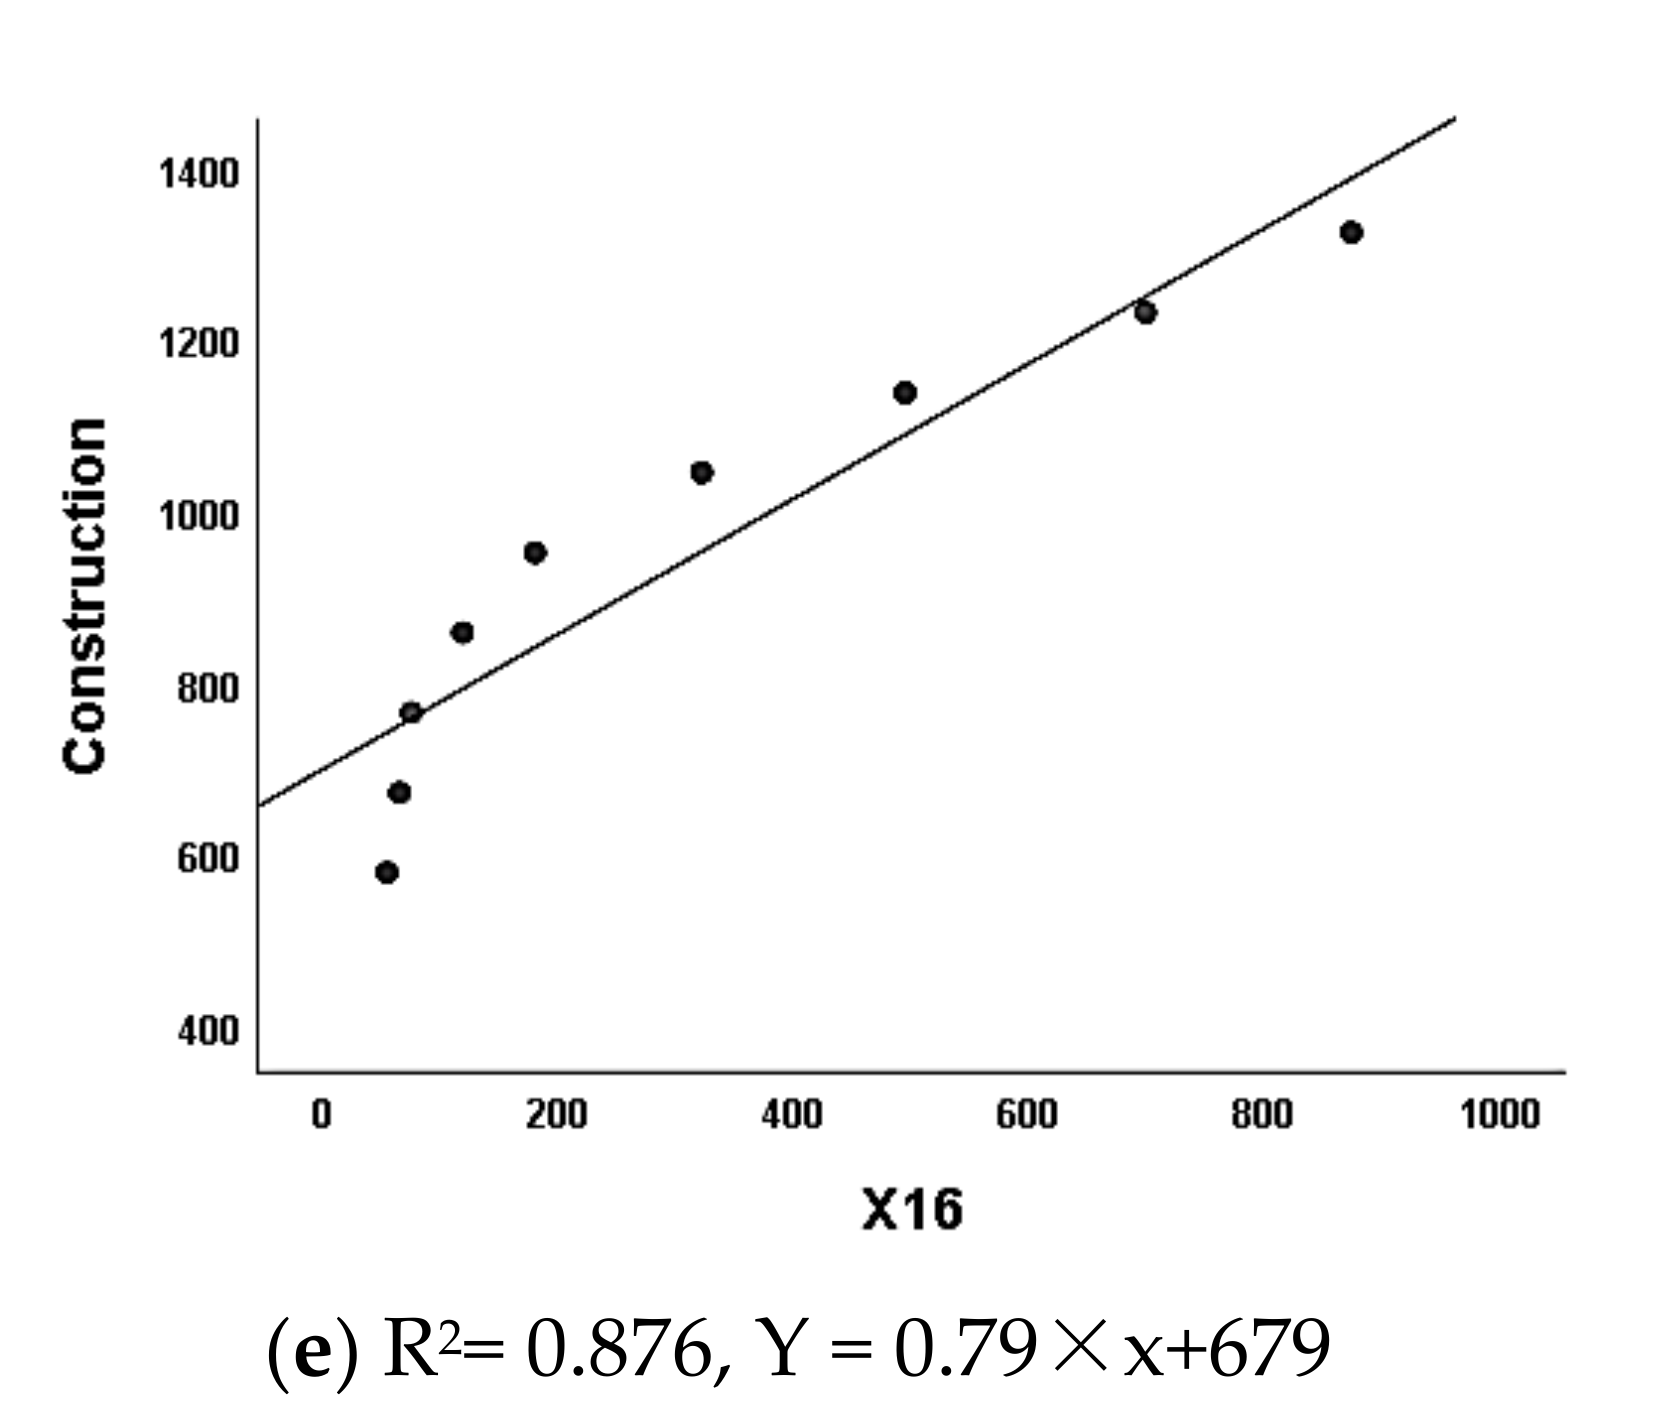
| X16 | 54.55 | 65.23 | 75.1 | 118.8 | 180.38 | 321.84 | 494.7 | 698.92 | 873.55 |
Publisher’s Note: MDPI stays neutral with regard to jurisdictional claims in published maps and institutional affiliations. |
© 2022 by the authors. Licensee MDPI, Basel, Switzerland. This article is an open access article distributed under the terms and conditions of the Creative Commons Attribution (CC BY) license (https://creativecommons.org/licenses/by/4.0/).
Share and Cite
Wang, C.; Zhang, Y.; Wu, X.; Yang, W.; Qiang, H.; Lu, B.; Wang, J. R-IMNet: Spatial-Temporal Evolution Analysis of Resource-Exhausted Urban Land Based on Residual-Intelligent Module Network. Remote Sens. 2022, 14, 2185. https://doi.org/10.3390/rs14092185
Wang C, Zhang Y, Wu X, Yang W, Qiang H, Lu B, Wang J. R-IMNet: Spatial-Temporal Evolution Analysis of Resource-Exhausted Urban Land Based on Residual-Intelligent Module Network. Remote Sensing. 2022; 14(9):2185. https://doi.org/10.3390/rs14092185
Chicago/Turabian StyleWang, Chunyang, Yingjie Zhang, Xifang Wu, Wei Yang, Haiyang Qiang, Bibo Lu, and Jianlong Wang. 2022. "R-IMNet: Spatial-Temporal Evolution Analysis of Resource-Exhausted Urban Land Based on Residual-Intelligent Module Network" Remote Sensing 14, no. 9: 2185. https://doi.org/10.3390/rs14092185
APA StyleWang, C., Zhang, Y., Wu, X., Yang, W., Qiang, H., Lu, B., & Wang, J. (2022). R-IMNet: Spatial-Temporal Evolution Analysis of Resource-Exhausted Urban Land Based on Residual-Intelligent Module Network. Remote Sensing, 14(9), 2185. https://doi.org/10.3390/rs14092185


