
An Integration of Linear Model and ‘Random Forest’ Techniques for Prediction of Norway Spruce Vitality: A Case Study of the Hemiboreal Forest, Latvia

 , and
, and 
Abstract
:
1. Introduction
2. Materials and Methods
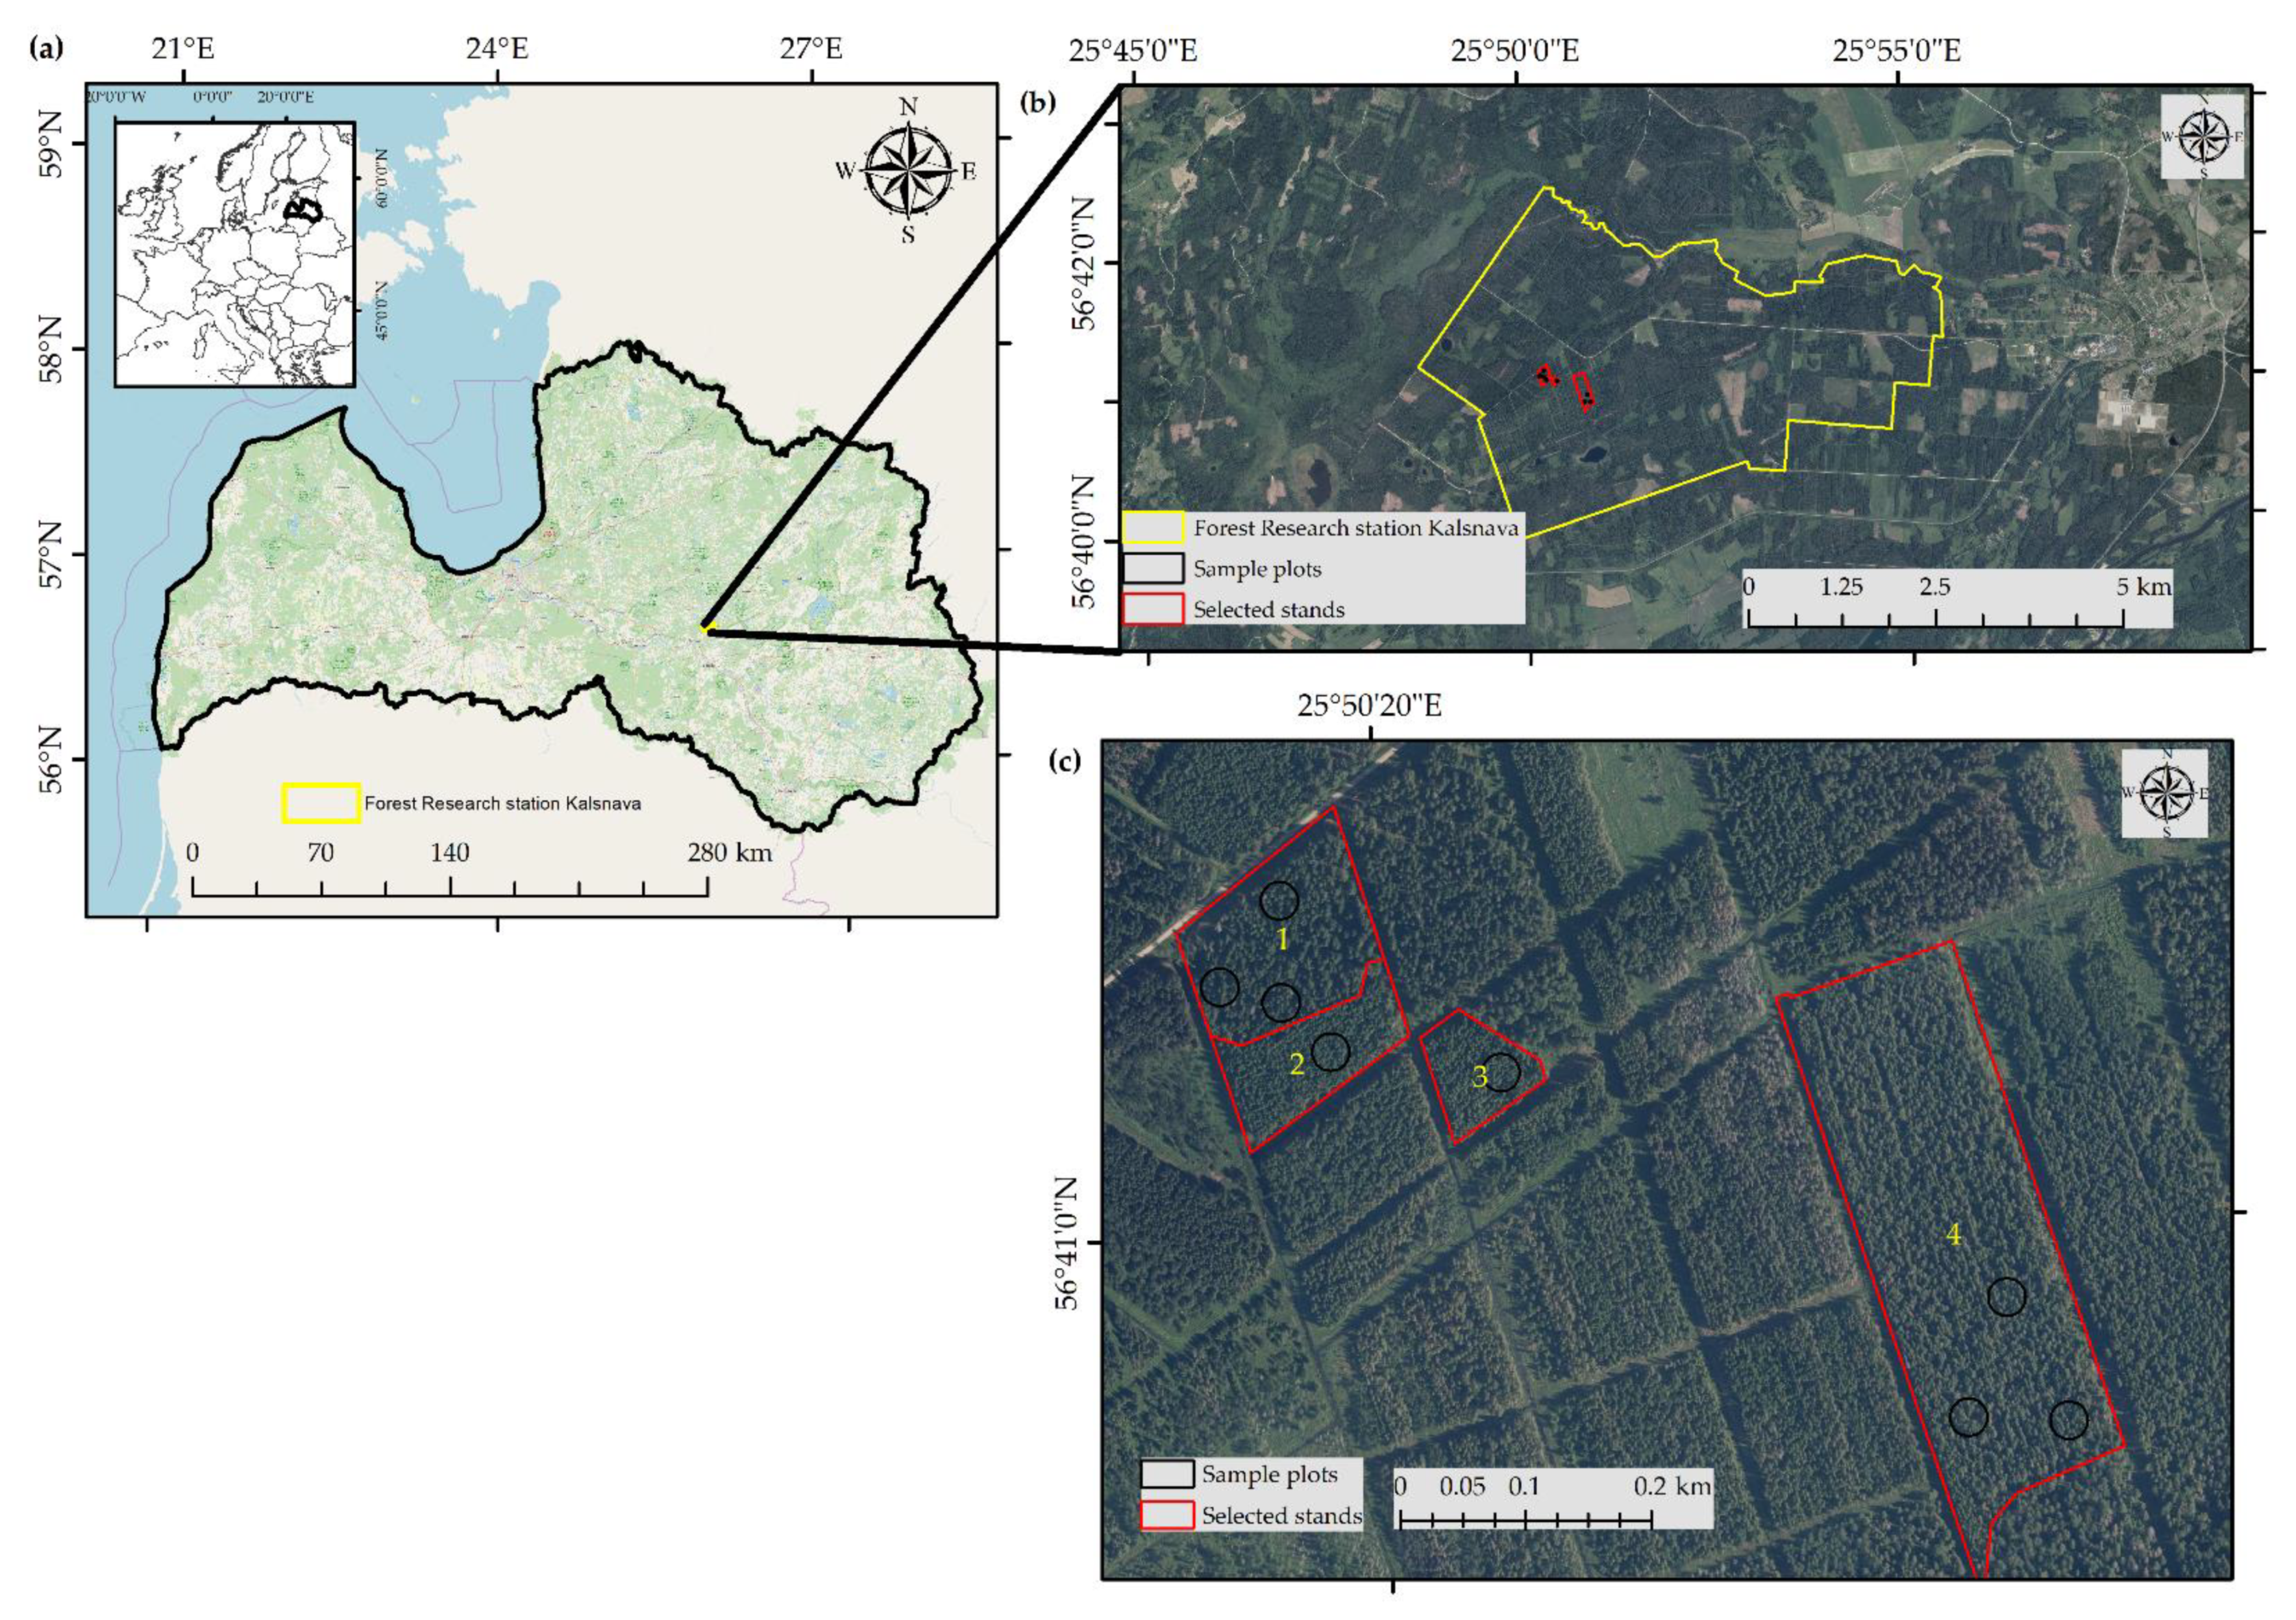
2.1. Study Area
2.2. Field Sampling
2.3. Data Acquisition
2.4. Photogrammetric Processing
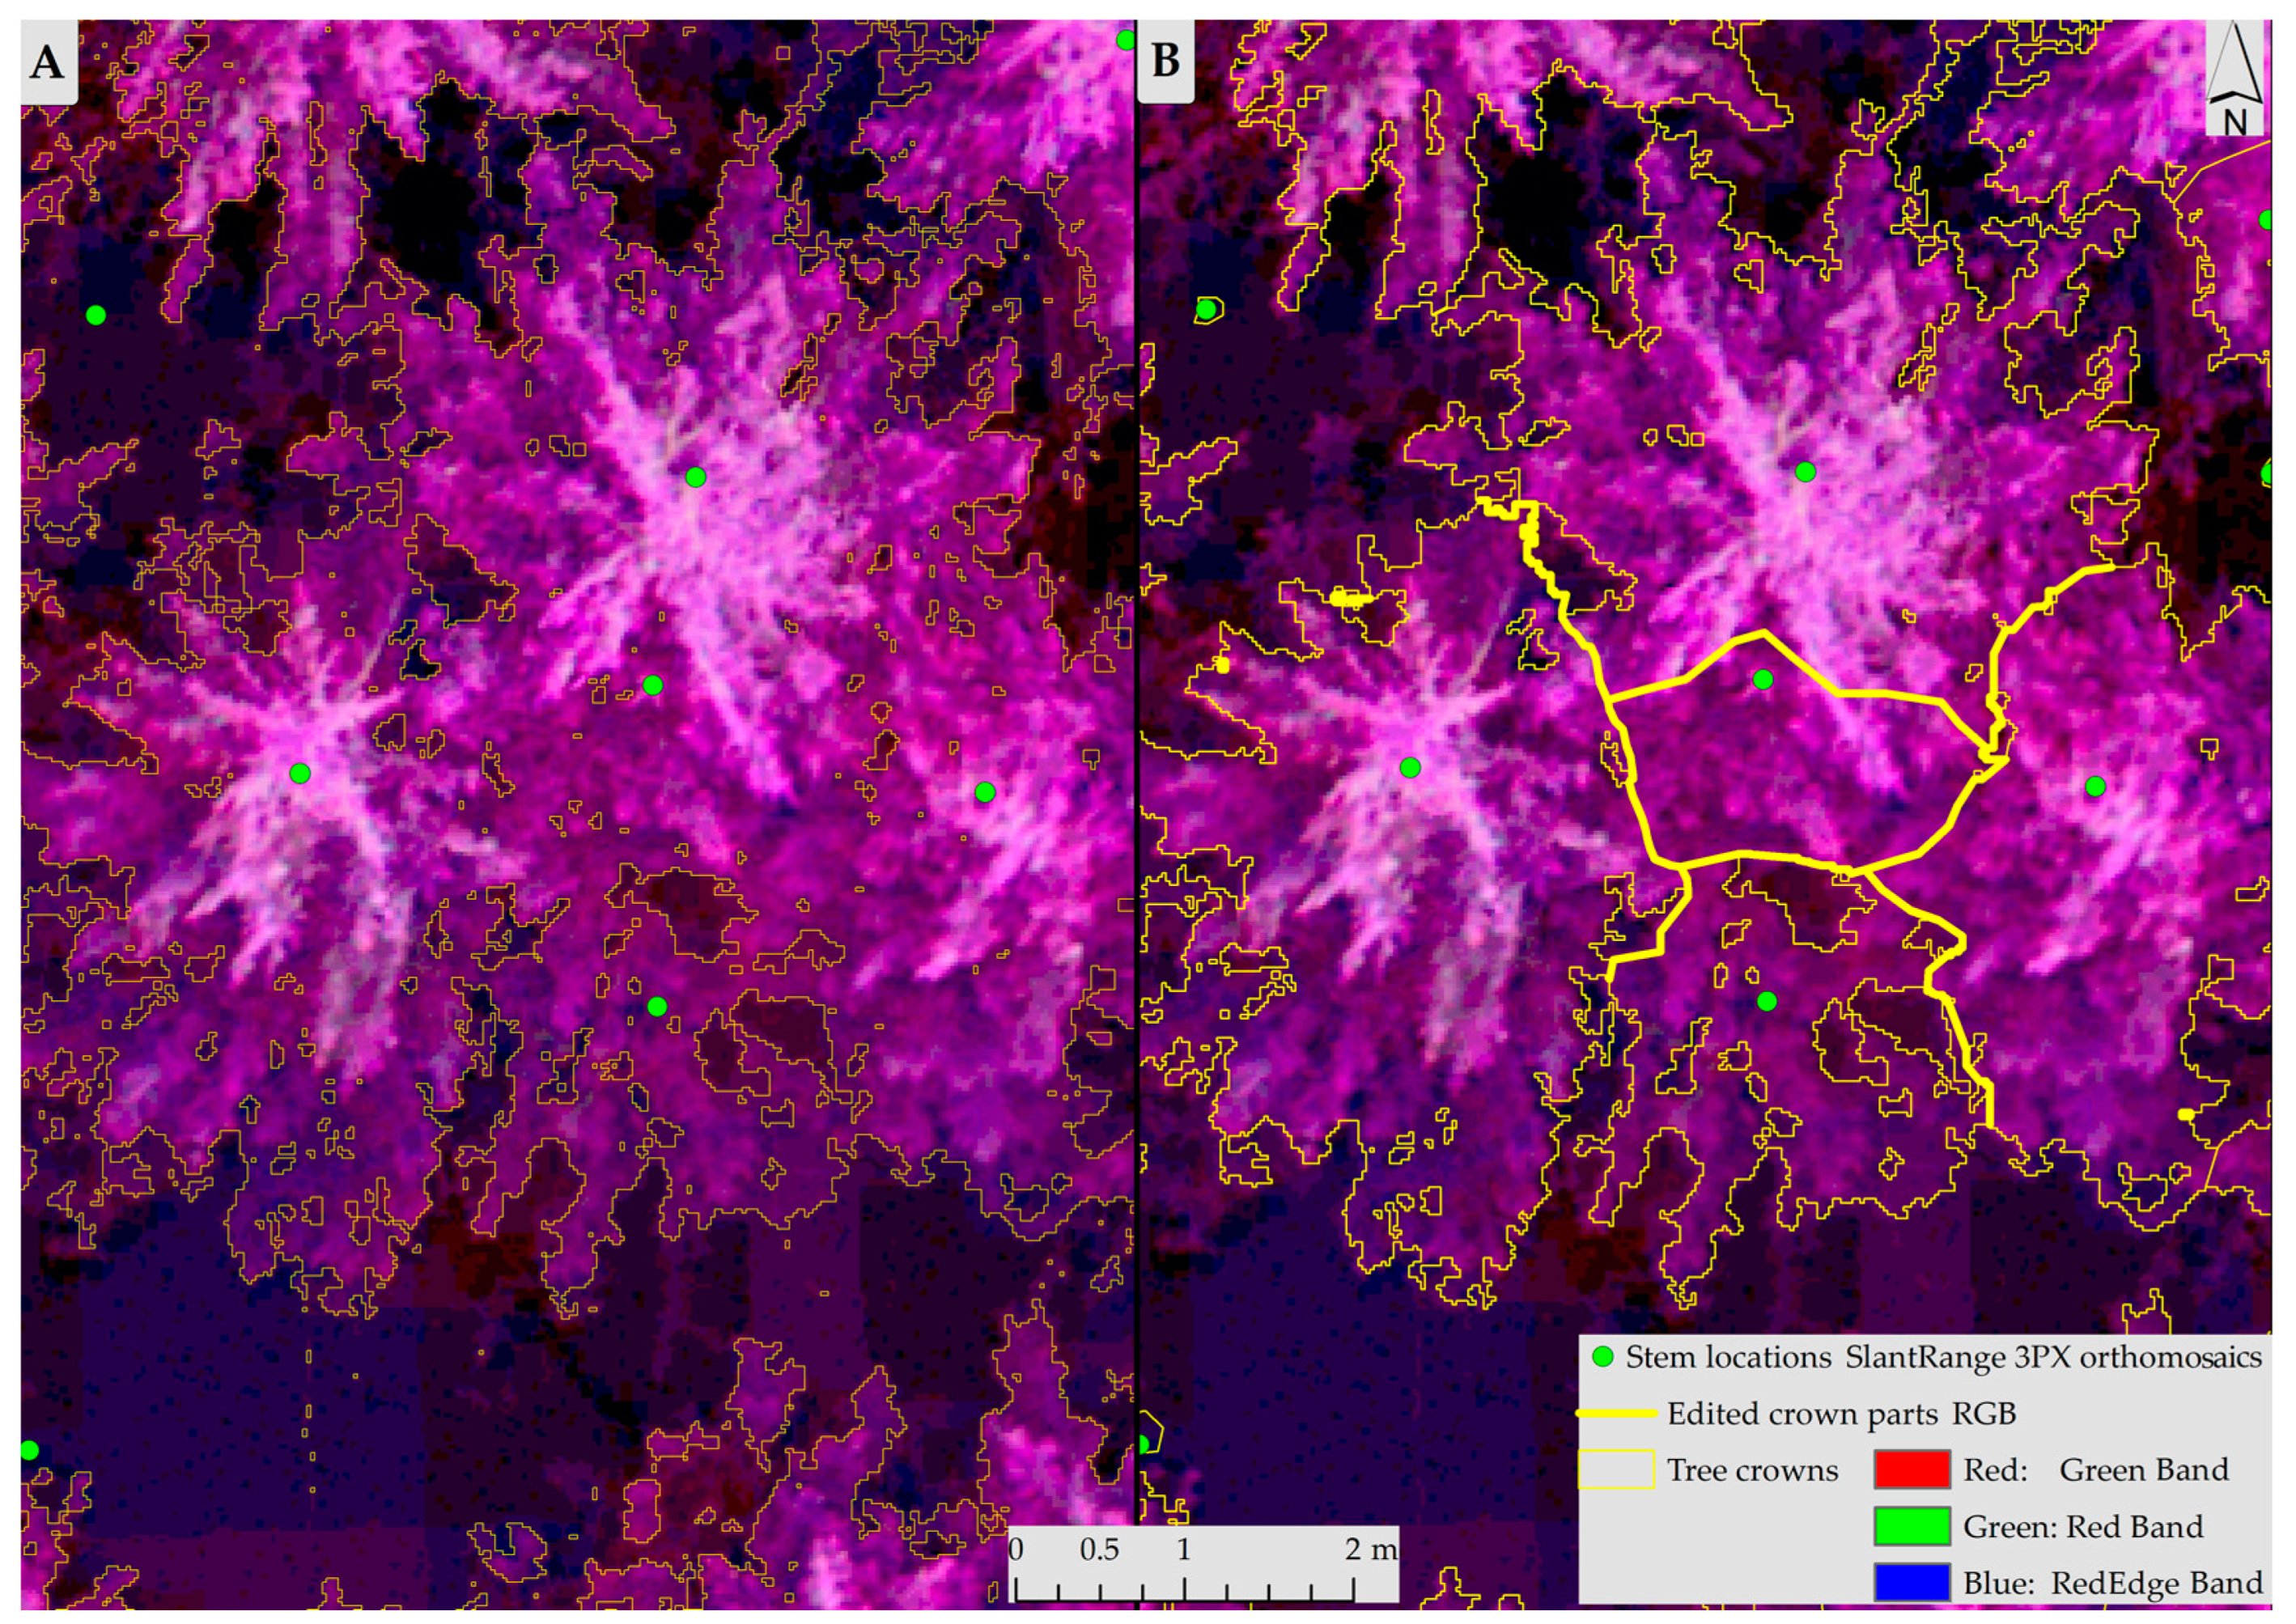
2.5. Individual Tree Crown Masks
2.6. Vegetation Indices and Statistical Analysis
2.7. Validation and Forest Mapping
3. Results and Discussion
3.1. Spectral Reflectance of Vegetation Health and Monitoring of One Vegetation Season
3.2. Validation and Mapping of the Vegetation Indices
4. Conclusions
Author Contributions
Funding
Data Availability Statement
Acknowledgments
Conflicts of Interest
References
- Schelhaas, M.J.; Nabuurs, G.J.; Hengeveld, G.; Reyer, C.; Hanewinkel, M.; Zimmermann, N.E.; Cullmann, D. Alternative forest management strategies to account for climate change-induced productivity and species suitability changes in Europe. Reg. Environ. Chang. 2015, 15, 1581–1594. [Google Scholar] [CrossRef] [Green Version]
- Moore, J.R.; Watt, M.S. Modelling the influence of predicted future climate change on the risk of wind damage within New Zealand’s planted forests. Glob. Chang. Biol. 2015, 21, 3021–3035. [Google Scholar] [CrossRef] [PubMed]
- State Forest Service. State Forest Register Data; Dauagvpils universitātes akadēmiskais apgāds: Daugavpils, Latvia, 2018. [Google Scholar]
- SUAS 2018 Forest Statistics 2018—Official Statistics of Sweden; Swedish University of Agricultural Sciences: Uppsala, Sweden, 2018; 143p.
- Lībiete, Z.; Donis, J.; Jansons, J.; Zālītis, P. Egļu vienvecuma tīraudžu augšanas potenciāls un tā izmaiņas. In Vienvecuma Egļu Meži Latvijā; Jansons, J., Ed.; Dauagvpils universitātes akadēmiskais apgāds “Saule”: Daugavpils, Latvia, 2019; pp. 11–54. ISBN 978-9984-14-853-3. [Google Scholar]
- Jansons, Ā.; Bāders, E.; Zeltiņš, P.; Gailis, A.; Šņepsts, G.; Katrevičs, J. Meža selekcijas potenciāls egļu audžu ražības paaugstināšanā. In Vienvecuma Egļu Meži Latvijā; Jansons, J., Ed.; Dauagvpils Universitātes Akadēmiskais Apgāds “Saule”: Daugavpils, Latvia, 2019; pp. 99–118. ISBN 978-9984-14-853-3. [Google Scholar]
- Intergovernmental Panel on Climate Change (IPCC). Climate Change 2014: Synthesis Report. In Contribution of Working Groups I, II and III to the Fifth Assessment Report of the Intergovernmental Panel on Climate Change; Core Writing Team, Pachauri, R.K., Meyer, L.A., Eds.; IPCC: Geneva, Switzerland, 2014. [Google Scholar]
- McDowell, N.G.; Michaletz, S.T.; Bennett, K.E.; Solander, K.C.; Xu, C.; Maxwell, R.M.; Middleton, R.S. Predicting chronic climate-driven disturbances and their mitigation. Trends Ecol. Evol. 2018, 33, 15–27. [Google Scholar] [CrossRef] [PubMed]
- Rieksts-Riekstiņš, R.; Zeltiņš, P.; Baliuckas, V.; Brūna, L.; Zaļuma, A.; Kāpostiņš, R. Pinus sylvestris Breeding for Resistance against Natural Infection of the Fungus Heterobasidion annosum. Forests 2020, 11, 23. [Google Scholar] [CrossRef] [Green Version]
- Jansons, A.; Zeltins, P.; Donis, J.; Neimane, U. Long-term effect of Lophodermium needle cast on the growth of Scots pine and implications for financial outcomes. Forests 2020, 11, 718. [Google Scholar] [CrossRef]
- Shakoor, N.; Lee, S.; Mockler, T.C. High throughput phenotyping to accelerate crop breeding and monitoring of diseases in the field. Curr. Opin. Plant Biol. 2017, 38, 184–192. [Google Scholar] [CrossRef]
- Gano, B.; Dembele, J.S.B.; Ndour, A.; Luquet, D.; Beurier, G.; Diouf, D.; Audebert, A. Using UAV Borne, Multi-Spectral Imaging for the Field Phenotyping of Shoot Biomass, Leaf Area Index and Height of West African Sorghum Varieties under Two Contrasted Water Conditions. Agronomy 2021, 11, 850. [Google Scholar] [CrossRef]
- Tao, X.; Li, Y.; Yan, W.; Wang, M.; Tan, Z.; Jiang, J.; Luan, Q. Heritable variation in tree growth and needle vegetation indices of slash pine (Pinus elliottii) using unmanned aerial vehicles (UAVs). Ind. Crops Prod. 2021, 173, 114073. [Google Scholar] [CrossRef]
- Anderson, K.; Gaston, K.J. Lightweight unmanned aerial vehicles will revolutionize spatial ecology. Front. Ecol. Environ. 2013, 11, 138–146. [Google Scholar] [CrossRef] [Green Version]
- Emery, W.; Camps, A. Introduction to Satellite Remote Sensing: Atmosphere, Ocean, Land and Cryosphere Applications; Elsevier: Amsterdam, The Netherlands, 2017; ISBN 978-0-12-809259-0. [Google Scholar]
- Roy, P.S.; Behera, M.D.; Srivastav, S.K. Satellite Remote Sensing: Sensors, Applications and Techniques. Proc. Natl. Acad. Sci. USA India Sect. A Phys. Sci. 2017, 87, 465–472. [Google Scholar] [CrossRef] [Green Version]
- White, J.C.; Coops, N.C.; Wulder, M.A.; Vastaranta, M.; Hilker, T.; Tompalski, P. Remote Sensing Technologies for Enhancing Forest Inventories: A Review. Can. J. Remote Sens. 2016, 42, 619–641. [Google Scholar] [CrossRef] [Green Version]
- Guimarães, N.; Pádua, L.; Marques, P.; Silva, N.; Peres, E.; Sousa, J.J. Forestry Remote Sensing from Unmanned Aerial Vehicles: A Review Focusing on the Data, Processing and Potentialities. Remote Sens. 2020, 12, 1046. [Google Scholar] [CrossRef] [Green Version]
- Chianucci, F.; Disperati, L.; Guzzi, D.; Bianchini, D.; Nardino, V.; Lastri, C.; Rindinella, A.; Corona, P. Estimation of Canopy Attributes in Beech Forests Using True Colour Digital Images from a Small Fixed-Wing UAV. Int. J. Appl. Earth Obs. Geoinform. 2016, 47, 60–68. [Google Scholar] [CrossRef] [Green Version]
- Zhang, C.; Kovacs, J.M. The application of small unmanned aerial systems for precision agriculture: A review. Precis. Agric. 2012, 13, 693–712. [Google Scholar] [CrossRef]
- Lehmann, J.R.K.; Nieberding, F.; Prinz, T.; Knoth, C. Analysis of unmanned aerial system-based CIR images in forestry—A new perspective to monitor pest infestation levels. Forests 2015, 6, 594–612. [Google Scholar] [CrossRef] [Green Version]
- Minařík, R.; Langhammer, J. Use of a multispectral UAV photogrammetry for detection and tracking of forest disturbance dynamics. Int. Arch. Photogramm. Remote Sens. Spat. Inf. Sci.-ISPRS Arch. 2016, 41, 711–718. [Google Scholar] [CrossRef] [Green Version]
- Modica, G.; Messina, G.; De Luca, G.; Fiozzo, V.; Praticò, S. Monitoring the vegetation vigor in heterogeneous citrus and olive orchards. A multiscale object-based approach to extract trees’ crowns from UAV multispectral imagery. Comput. Electron. Agric. 2020, 175, 105500. [Google Scholar] [CrossRef]
- Ortiz, S.; Breidenbach, J.; Kändler, G. Early detection of bark beetle green attack using TerraSAR-X and RapidEye data. Remote Sens. 2013, 5, 1912–1931. [Google Scholar] [CrossRef] [Green Version]
- Fahse, L.; Heurich, M. Simulation and analysis of outbreaks of bark beetle in-festations and their management at the stand level. Ecol. Modell. 2011, 222, 1833–1846. [Google Scholar] [CrossRef]
- Carter, G.A.; Knapp, A.K. Leaf optical properties in higher plants: Linking spectral characteristics to stress and chlorophyll concentration. Am. J. Bot. 2001, 88, 677–684. [Google Scholar] [CrossRef] [Green Version]
- Wulder, M.A.; White, J.C.; Benz, B.; Alvarez, M.F.; Coops, N.C. Estimating the probability of mountain pine beetle red-attack damage. Remote Sens. Environ. 2006, 101, 150–166. [Google Scholar] [CrossRef]
- Masaitis, G.; Mozgeris, G.; Augustaitis, A. Spectral reflectance properties of healthy and stressed coniferous trees. iForest 2013, 6, 30–36. [Google Scholar] [CrossRef]
- Abdulridha, J.; Batuman, O.; Ampatzidis, Y. UAV-based remote sensing technique to detect citrus canker disease utilizing hyperspectral imaging and machine learning. Remote Sens. 2019, 11, 1373. [Google Scholar] [CrossRef] [Green Version]
- Feret, J.-B.; François, C.; Asner, G.P.; Gitelson, A.A.; Martin, R.E.; Bidel, L.P.; Ustin, S.L.; Le Maire, G.; Jacquemoud, S. PROSPECT-4 and 5: Advances in the leaf optical properties model separating photosynthetic pigments. Remote Sens. Environ. 2008, 112, 3030–3043. [Google Scholar] [CrossRef]
- Du, L.; Gong, W.; Shi, S.; Yang, J.; Sun, J.; Zhu, B.; Song, S. Estimation of rice leaf nitrogen contents based on hyperspectral LIDAR. Int. J. Appl. Earth Obs. Geoinf. 2016, 44, 136–143. [Google Scholar] [CrossRef]
- Dawson, T.P.; Curran, P.J.; Plummer, S.E. Liberty—Modeling the effects of leaf biochemical concentration on reflectance spectra. Remote Sens. Environ. 1998, 65, 50–60. [Google Scholar] [CrossRef]
- Chaves, M. Effects of water deficits on carbon assimilation. J. Exp. Bot. 1991, 42, 1–16. [Google Scholar] [CrossRef]
- Lichtenthaler, H.K. The stress concept in plants: An introduction. Ann. N. Y. Acad. Sci. 1998, 851, 187–198. [Google Scholar] [CrossRef]
- Niemann, K.O.; Visintini, F. Assessment of potential for remote sensing detection of bark beetle-infested areas during green attack: A literature review. In Mountain Pine Beetle Initiative Working Paper 2005–2; Natural Resources Canada, Canadian Forest Service: Ottawa, ON, Canada, 2005. [Google Scholar]
- Panigada, C.; Rossini, M.; Meroni, M.; Cilia, C.; Busetto, L.; Amaducci, S.; Boschetti, M.; Cogliati, S.; Picchi, V.; Pinto, F. Fluorescence, PRI and canopy temperature for water stress detection in cereal crops. Int. J. Appl. Earth Obs. Geoinform. 2014, 30, 167–178. [Google Scholar] [CrossRef]
- Dash, J.P.; Watt, M.S.; Pearse, G.D.; Heaphy, M.; Dungey, H.S. Assessing very high resolution UAV imagery for monitoring forest health during a simulated disease outbreak. ISPRS J. Photogramm. Remote Sens. 2017, 131, 1–14. [Google Scholar] [CrossRef]
- Xing, N.; Huang, W.; Xie, Q.; Shi, Y.; Ye, H.; Dong, Y.; Wu, M.; Sun, G.; Jiao, Q. A transformed triangular vegetation index for estimating winter wheat leaf area index. Remote Sens. 2020, 12, 16. [Google Scholar] [CrossRef] [Green Version]
- Latvia’s State Forests Map Server (LVM GEO 2022). Ortofoto Map 7 Edition. Available online: https://www.lvmgeo.lv/dati (accessed on 23 December 2021).
- Westoby, M.J.; Brasington, J.; Glasser, N.F.; Hambrey, M.J.; Reynolds, J.M. “Structure-from-motion” photogrammetry: A low-cost, effective tool for geoscience applications. Geomorphology 2012, 179, 300–314. [Google Scholar] [CrossRef] [Green Version]
- Ke, Y.; Quackenbush, L.J. A review of methods for automatic individual tree-crown detection and delineation from passive remote sensing. Int. J. Remote Sens. 2011, 32, 4725–4747. [Google Scholar] [CrossRef]
- ESRI. ArcGIS Desktop: Release 10; Environmental Systems Research Institute: Redlands, CA, USA, 2021. [Google Scholar]
- Tuominen, J.; Haapanen, R.; Lipping, T.; Kuosmanen, V. Remote Sensing of Forest Health; INTECH Open Access Publisher: Rijeka, Croatia, 2009. [Google Scholar]
- Adamczyk, J.; Osberger, A. Red-edge vegetation indices for detecting and assessing disturbances in Norway spruce dominated mountain forests. Int. J. Appl. Earth Obs. Geoinform. 2015, 37, 90–99. [Google Scholar] [CrossRef]
- Junttila, S.; Näsi, R.; Koivumäki, N.; Imangholiloo, M.; Saarinen, N.; Raisio, J.; Holopainen, M.; Hyyppä, H.; Hyyppä, J.; Lyytikäinen-Saarenmaa, P.; et al. Multispectral Imagery Provides Benefits for Mapping Spruce Tree Decline Due to Bark Beetle Infestation When Acquired Late in the Season. Remote Sens. 2022, 14, 909. [Google Scholar] [CrossRef]
- Lyon, J.G.; Yuan, D.; Lunetta, R.S.; Elvidge, D. A change detection experiment using vegetation indices. Photogramm. Eng. Remote Sens. 1998, 64, 143–150. [Google Scholar]
- Motohka, T.; Nasahara, K.N.; Oguma, H.; Tsuchida, S. Applicability of Green-Red Vegetation Index for Remote Sensing of Vegetation Phenology. Remote Sens. 2010, 2, 2369–2387. [Google Scholar] [CrossRef] [Green Version]
- Cicek, H.; Sunohara, M.; Wilkes, G.; McNairn, H.; Pick, F.; Topp, E.; Lapen, D.R. Using vegetation indices from satellite remote sensing to assess corn and soybean response to controlled tile drainage. Agric. Water Manag. 2010, 98, 261–270. [Google Scholar] [CrossRef]
- Gitelson, A.A.; Merzlyak, M.N.; Chivkunova, O.B. Optical properties and non-destructive estimation of anthocyanin content in plant leaves. Photochem. Photobiol. 2001, 74, 38–45. [Google Scholar] [CrossRef]
- Gitelson, A.A.; Chivkunova, O.B.; Merzlyak, M.N. Nondestructive estimation of anthocyanins and chlorophylls in anthocyanic leaves. Am. J. Bot. 2009, 96, 1861–1868. [Google Scholar] [CrossRef]
- Ramoelo, A.; Skidmore, A.; Cho, M.A.; Schlerf, M.; Mathieu, R.; Heitkonig, I. Regional estimation of savanna grass nitrogen using the red-edge band of the spaceborne RapidEye sensor. Int. J. Appl. Earth Obs. Geoinf. 2012, 19, 151–162. [Google Scholar] [CrossRef]
- Tilling, A.K.; O’Leary, G.J.; Ferwerda, J.G.; Jones, S.D.; Fitzgerald, G.J.; Rodriguez, D.; Belford, R. Remote sensing of nitrogen and water stress in wheat. Field Crops Res. 2007, 104, 77–85. [Google Scholar] [CrossRef]
- Albetis, J.; Jacquin, A.; Goulard, M.; Poilvé, H.; Rousseau, J.; Clenet, H.; Dedieu, G.; Duthoit, S. On the Potentiality of UAV Multispectral Imagery to Detect Flavescence dorée and Grapevine Trunk Diseases. Remote Sens. 2019, 11, 23. [Google Scholar] [CrossRef] [Green Version]
- Barati, S.; Rayegani, B.; Saati, M.; Sharifi, A.; Nasri, M. Comparison the accuracies of different spectral indices for estimation of vegetation cover fraction in sparse vegetated areas. Egypt. J. Remote Sens. Space Sci. 2011, 14, 49–56. [Google Scholar] [CrossRef] [Green Version]
- Laird, N.M.; Ware, J.H. Random-Effects Models for Longitudinal Data. Biometrics 1982, 38, 963–974. [Google Scholar] [CrossRef]
- Bennington, C.C.; Thayne, W.V. Use and Misuse of Mixed Model Analysis of Variance in Ecological Studies. Ecology 1994, 75, 717–722. [Google Scholar] [CrossRef]
- Nakagawa, S.; Schielzeth, H. A general and simple method for obtaining R2 from generalized linear mixed-effects models. Methods Ecol. Evol. 2013, 4, 133–142. [Google Scholar] [CrossRef]
- Pinheiro, J.C.; Bates, D.M. Mixed-Effects Models in S and S-Plus. In Statistics and Computing; Springer: New York, NY, USA, 2000. [Google Scholar]
- Burnham, K.; Anderson, D. Model Selection and Inference: A Practical Information Theoretic Approach; Springer: Berlin/Heidelberg, Germany; New York, NY, USA, 1998. [Google Scholar] [CrossRef] [Green Version]
- Lenth, R.V.; Hervé, M. lsmeans: Least-Squares Means. Available online: http://CRAN.R-project.org/package=lsmeans (accessed on 20 December 2021).
- R Core Team. A Language and Environment for Statistical Computing; R Foundation for Statistical Computing: Vienna, Austria, 2022. [Google Scholar]
- Breiman, L. Random Forests. Mach. Learn. 2001, 45, 123–140. [Google Scholar] [CrossRef] [Green Version]
- Dietterich, T.G. An experimental comparison of three methods for constructing ensembles of decision trees: Bagging, boosting, and randomization. Mach. Learn. 2000, 40, 139–157. [Google Scholar] [CrossRef]
- Kantola, T.; Vastaranta, M.; Yu, X.; Lyytikainen-Saarenmaa, P.; Holopainen, M.; Talvitie, M.; Kaasalainen, S.; Solberg, S.; Hyyppa, J. Classification of defoliated trees using tree-level airborne laser scanning data combined with aerial images. Remote Sens. 2010, 2, 2665–2679. [Google Scholar] [CrossRef] [Green Version]
- Liaw, A.; Wiener, M. Classification and Regression by randomForest. R News 2002, 2, 18–22. [Google Scholar]
- Kuhn, M. Building predictive models in R using the caret package. J. Stat. Softw. 2008, 28, 1–26. [Google Scholar] [CrossRef] [Green Version]
- Middleton, E.M.; Chan, S.S.; Rusin, R.J.; Mitchell, S.K. Optical Properties of Black Spruce and Jack Pine Needles at BOREAS Sites in Saskatchewan, Canada. Can. J. Remote Sens. 1997, 23, 108–119. [Google Scholar] [CrossRef]
- Glenn, E.P.; Huete, A.R.; Nagler, P.L.; Nelson, S.G. Relationship between remotely-sensed vegetation indices, canopy attributes and plant physiological processes: What vegetation indices can and cannot tell us about the landscape? Sensors 2008, 8, 2136–2160. [Google Scholar] [CrossRef] [PubMed] [Green Version]
- Dash, J.P.; Pearse, G.D.; Watt, M.S. UAV Multispectral Imagery Can Complement Satellite Data for Monitoring forest Health. Remote Sens. 2018, 10, 1216. [Google Scholar] [CrossRef] [Green Version]
- Eitel, J.U.H.; Vierling, L.A.; Litvak, M.E.; Long, D.S.; Schulthess, U.; Ager, A.A.; Krofcheck, D.J.; Stoscheck, L. Broadband, red-edge information from satellites improves early stress detection in a New Mexico conifer woodland. Remote Sens. Environ. 2011, 115, 3640–3646. [Google Scholar] [CrossRef]
- Demarez, V. Seasonal variation of leaf chlorophyll content of a temperate forest. Inversion of the PROSPECT model. Int. J. Remote Sens. 1999, 20, 879–894. [Google Scholar] [CrossRef]
- Rautiainen, M.; Lukeš, P.; Homolová, L.; Hovi, A.; Pisek, J.; Mõttus, M. Spectral Properties of Coniferous Forests: A Review of In Situ and Laboratory Measurements. Remote Sens. 2018, 10, 207. [Google Scholar] [CrossRef] [Green Version]
- Moorthy, I.; Miller, J.R.; Noland, T.L. Estimating chlorophyll concentration in conifer needles with hyperspectral data: An assessment at the needle and canopy level. Remote Sens. Environ. 2008, 112, 2824–2838. [Google Scholar] [CrossRef]
- Xie, Q.; Dash, J.; Huang, W.; Peng, D.; Qin, Q.; Mortimer, H.; Casa, R.; Pignatti, S.; Laneve, G.; Pascucci, S.; et al. Vegetation Indices Combining the Red and Red-Edge Spectral Information for Leaf Area Index Retrieval. IEEE J. Sel. Top. Appl. Earth Obs. Remote Sens. 2018, 11, 1482–1493. [Google Scholar] [CrossRef] [Green Version]
- Kharuk, V.I.; Im, S.T.; Dvinskaya, M.L.; Golukov, A.S.; Ranson, K.J. Climate-induced mortality of spruce stands in Belarus. Environ. Res. Lett. 2015, 10, 125006. [Google Scholar] [CrossRef] [Green Version]
- Seidl, R.; Blennow, K. Pervasive growth reduction in Norway Spruce forests following wind disturbance. PLoS ONE 2012, 7, e33301. [Google Scholar] [CrossRef] [PubMed] [Green Version]
- Krisans, O.; Saleniece, R.; Rust, S.; Elferts, D.; Kapostins, R.; Jansons, A.; Matisons, R. Effect of Bark-Stripping on Mechanical Stability of Norway Spruce. Forests 2020, 11, 357. [Google Scholar] [CrossRef] [Green Version]
- Flexas, J.; Bota, J.; Galmes, J.; Medrano, H.; Ribas-Carbo, M. Keeping a posi-tive carbon balance under adverse conditions: Responses ofphotosynthesis and respiration to water stress. Physiol. Plant. 2006, 127, 343–352. [Google Scholar] [CrossRef]
- Gates, D.M. Biophysical Ecology; Springer: Berlin/Heidelberg, Germany, 1980. [Google Scholar]
- Näsi, R.; Honkavaara, E.; Lyytikäinen-Saarenmaa, P.; Blomqvist, M.; Litkey, P.; Hakala, T.; Viljanen, N.; Kantola, T.; Tanhuanpää, T.; Holopainen, M. Using UAV-Based Photogrammetry and Hyperspectral Imaging for Mapping Bark Beetle Damage at Tree-Level. Remote Sens. 2015, 7, 15467–15493. [Google Scholar] [CrossRef] [Green Version]
- Chen, J.; Jönsson, P.; Tamura, M.; Gu, Z.; Matsushita, B.; Eklundh, L. A simple method for reconstructing a high-quality NDVI time-series data set based on the Savitzky-Golay filter. Remote Sens. Environ. 2004, 91, 332–344. [Google Scholar] [CrossRef]
- Evans, J.S.; Murphy, M.A.; Holden, Z.A.; Cushman, S.A. Modeling Species Distribution and Change Using Random Forest. In Predictive Species and Habitat Modeling in Landscape Ecology; Drew, C., Wiersma, Y., Huettmann, F., Eds.; Springer: New York, NY, USA, 2011; pp. 139–159. [Google Scholar] [CrossRef]


| SlantRange 3PX Bands | Peak Wavelength (nm) | Bandwidth (nm) |
|---|---|---|
| Green | 550 | 40 |
| Red | 650 | 40 |
| Red-edge | 710 | 20 |
| NIR | 850 | 100 |
| INDEX | Formula | Reference |
|---|---|---|
| NDVI | (NIR − Red)/(NIR + Red) | [46] |
| GRVI | (Green − Red)/(Green + Red) | [47] |
| GNDVI | (NIR − Green)/(NIR + Green) | [48] |
| DVI | NIR − Red | [46] |
| SAVI | (NIR − Red) × 1.5/(NIR + Red + 0.5) | [46] |
| ARI | (1/Green) − (1/RedEdge) | [49] |
| MARI | (1/Green) − (1/RedEdge) × NIR | [50] |
| RGI | Red/Green | [51] |
| MACI | NIR/Green | [50] |
| ACI | Green/NIR | [50] |
| CI | (NIR/RedEdge) − 1 | [50] |
| NDRE | (NIR − RedEdge)/(NIR + RedEdge) | [52] |
| REGI | (RedEdge − Green)/(RedEdge + Green) | [53] |
| RERI | (RedEdge − Red)/(RedEdge + Red) | [53] |
| NLI | (NIR2 + Red/NIR2 − Red) | [54] |
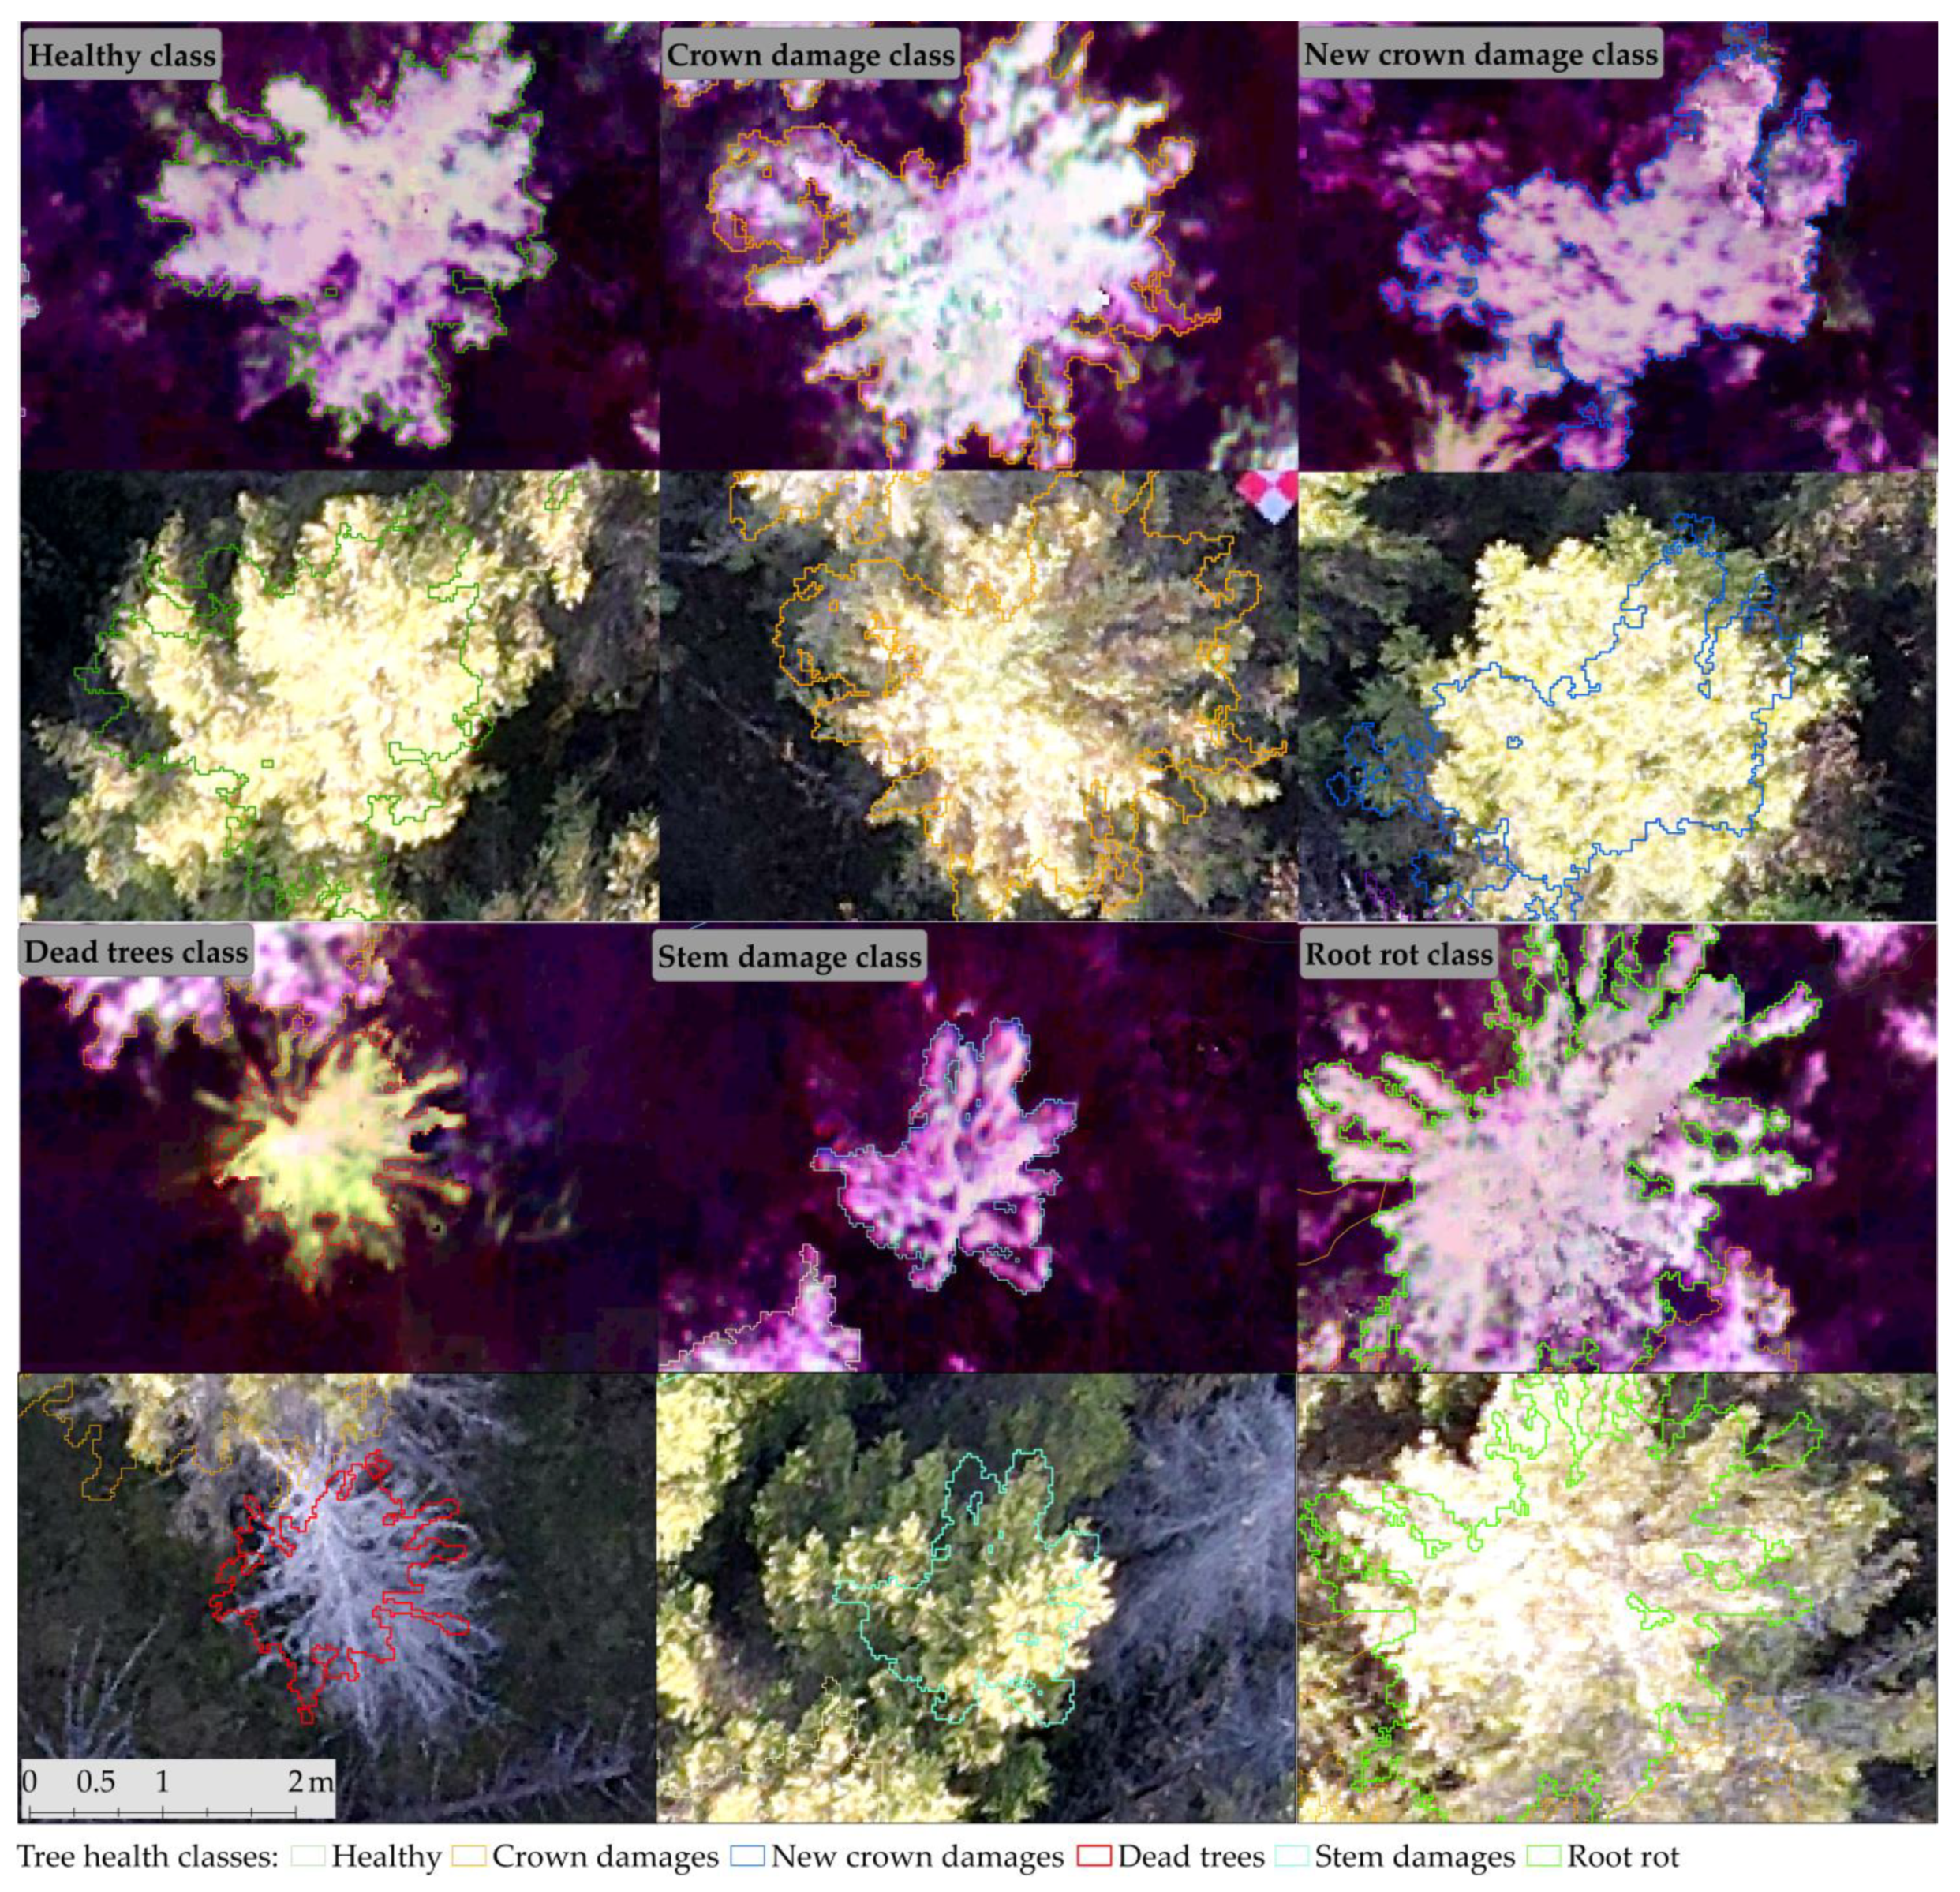
| Tree Health Class | Description |
|---|---|
| Healthy | Individuals with no outward signs of stresses (e.g., drought induced decline) |
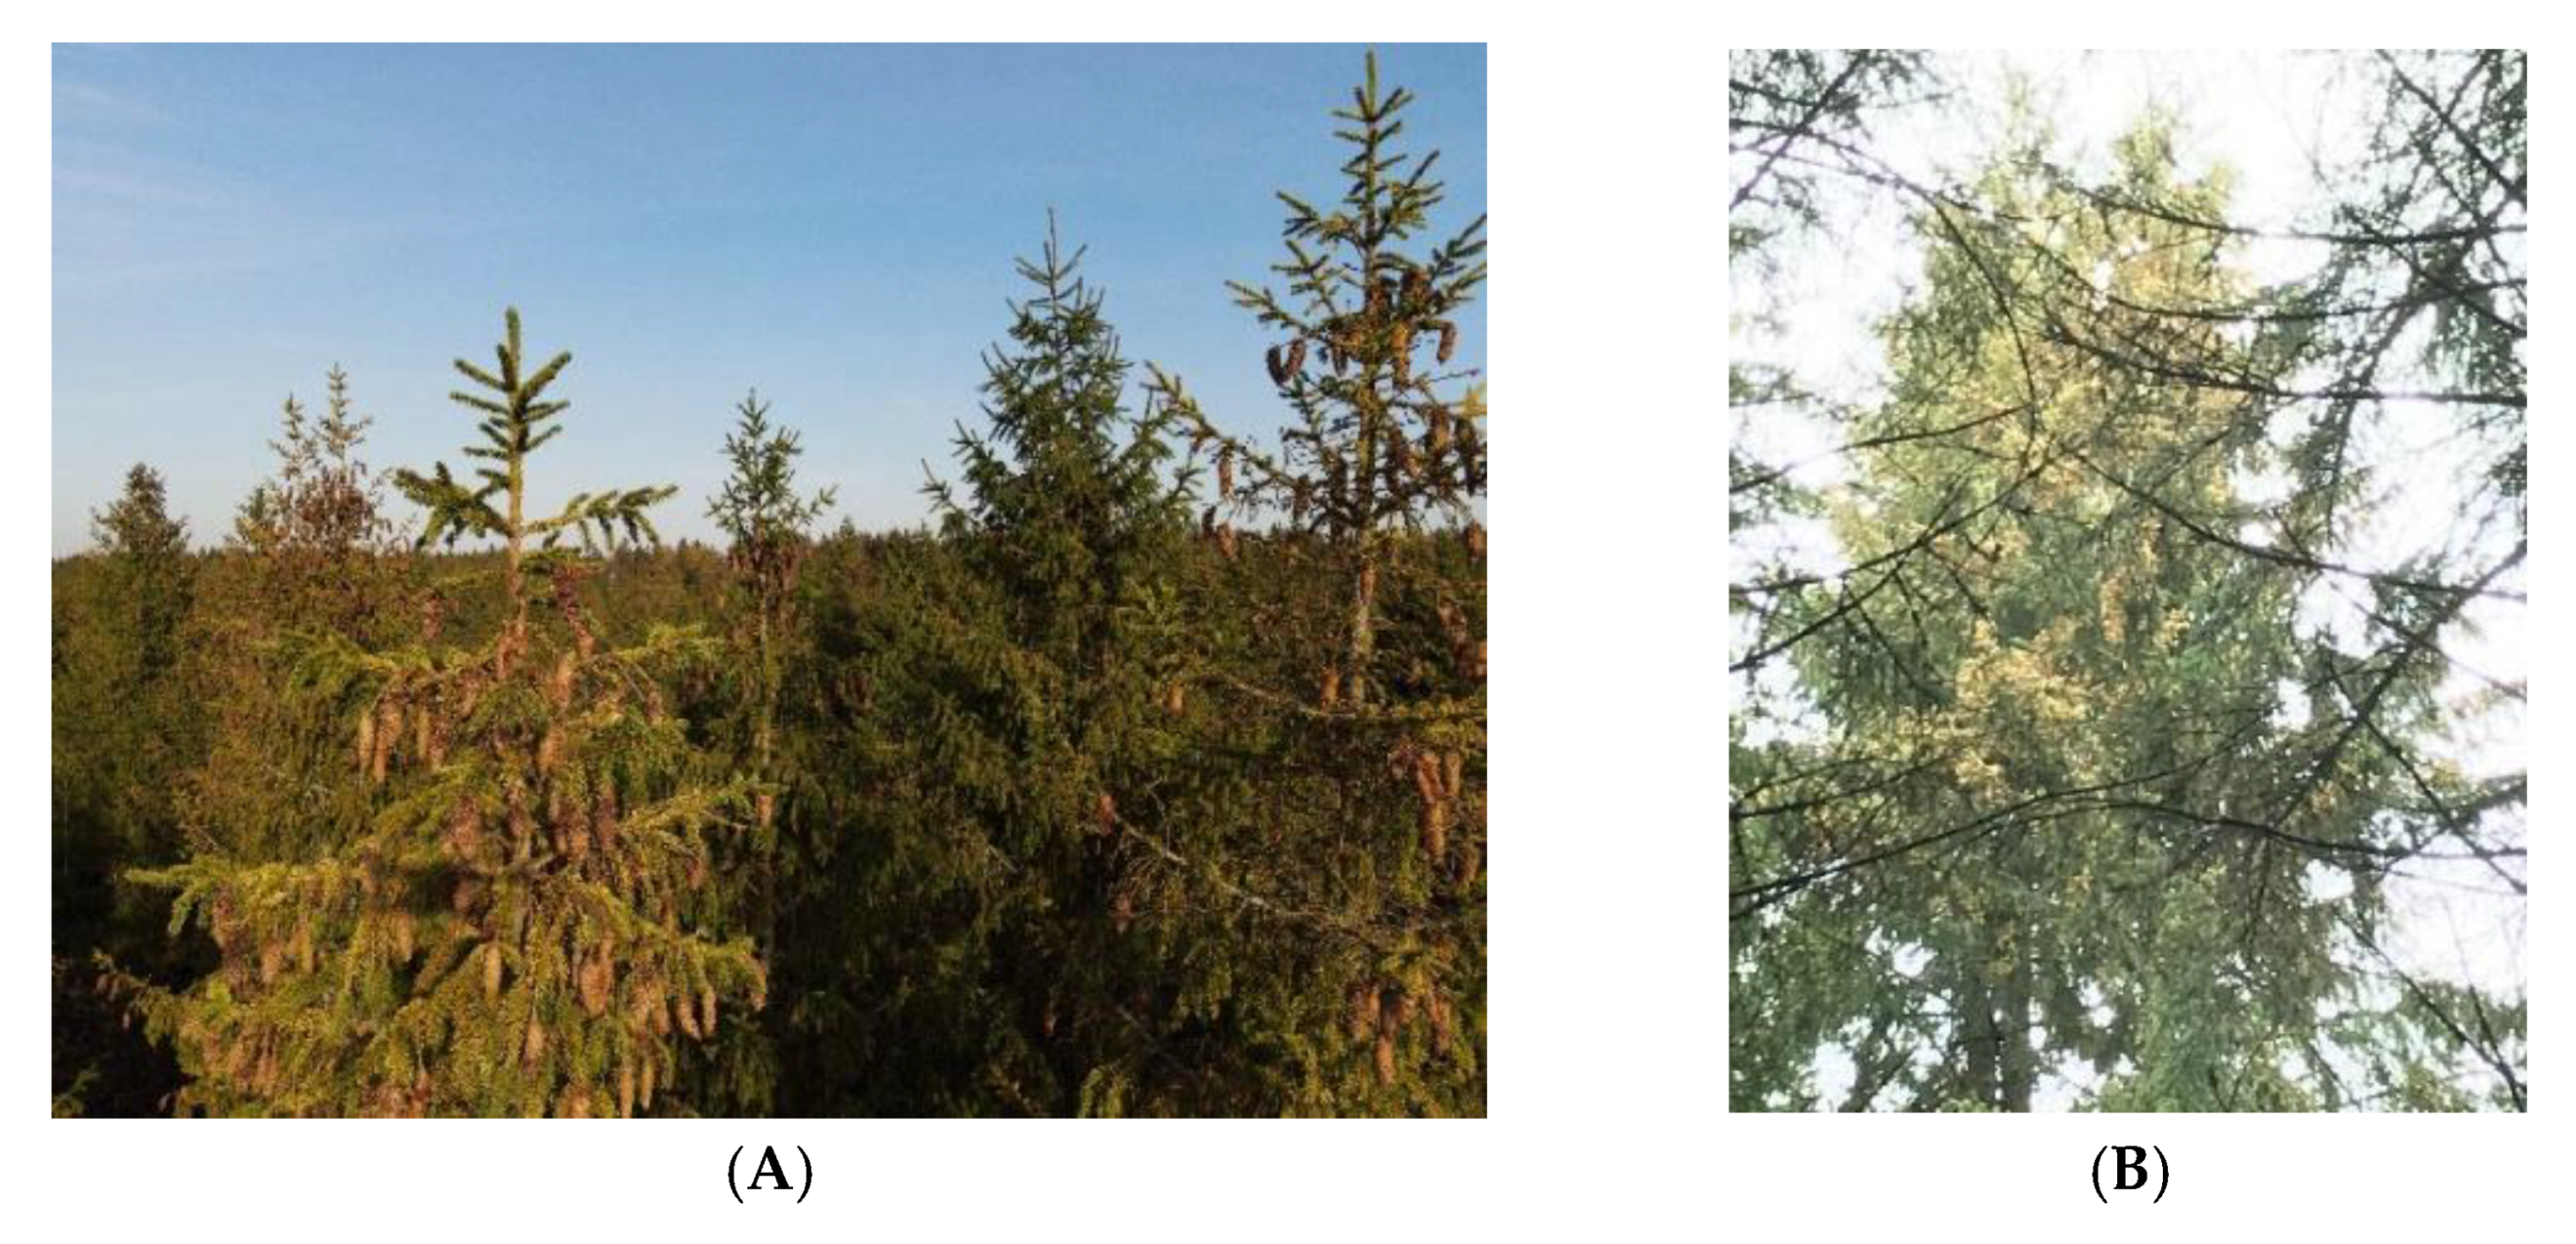
| Crown damage | Trees with noticeable damage to crown (e.g., yellowish green, yellow needles and brownish treetops) |
| New crown damage | We created a New tree crown damage class for those healthy trees that were newly damaged in the autumn (after visual examination in October 2021) |
| Dead trees | Trees with complete loss of green foliage |
| Stem damage | Individuals with bark-stripping wounds (greater than 10 cm in width and greater than 20 cm in length) on tree stem and/or with stem cracks |
| Root rot | Included those trees whose increment cores were decayed and trees with severe dieback symptoms (was determined by performing a control drilling) |
| Vegetation Indices | Fixed Factors | Random Factors | Model p Value | Marginal R2 | Conditional R2 | ||||||
|---|---|---|---|---|---|---|---|---|---|---|---|
| Variable | Chisq | Df | p Value | Variable | Variance of Stand | Residual Variance | ICC | ||||
| NDRE | Tree health classes | 261.8 | 5 | <0.001 | Stand | 0.002454 | 0.005756 | 0.30 | <0.001 | 0.26 | 0.49 |
| Flight campaign | 767.8 | 2 | <0.001 | ||||||||
| Tree health classes × Flight campaign | 143.1 | 10 | <0.001 | ||||||||
| NDVI | Tree health classes | 767.8 | 5 | <0.001 | Stand | 0.005104 | 0.006315 | 0.45 | <0.001 | 0.34 | 0.60 |
| Flight campaign | 293.4 | 2 | <0.001 | ||||||||
| Tree health classes × Flight campaign | 77.2 | 10 | <0.001 | ||||||||
| RGI | Tree health classes | 306.4 | 5 | <0.001 | Stand | 0.005241 | 0.007716 | 0.40 | <0.001 | 0.36 | 0.55 |
| Flight campaign | 709.5 | 2 | <0.001 | ||||||||
| Tree health classes × Flight campaign | 38.3 | 10 | <0.001 | ||||||||
| CI | Tree health classes | 191.2 | 5 | <0.001 | Stand | 0.1905 | 0.4611 | 0.29 | <0.001 | 0.27 | 0.49 |
| Flight campaign | 534.7 | 2 | <0.001 | ||||||||
| Tree health classes × Flight campaign | 99.3 | 10 | <0.001 | ||||||||
| Location | Tree Health Group | DBH, cm | H, m | Age, Years | Crown Mean Area, m2 |
|---|---|---|---|---|---|
| Stand 1 | Healthy | 26.9 | 22.4 | 38 | 4.49 |
| Crown damage | 26.6 | 22.3 | 38 | 4.38 | |
| New crown damage | 28.7 | 22.9 | 38 | 6.06 | |
| Dead trees | 21.2 | 19.7 | – 1 | 0.88 | |
| Stem damage | 28.9 | 22.7 | 37 | 5.26 | |
| Root rot | 27.4 | 21.9 | 44 | 5.28 | |
| Stand 2 | Healthy | 18.5 | 16.7 | 26 | 3.60 |
| Crown damage | 16.2 | 14.9 | 29 | 3.45 | |
| New crown damage | 18.8 | 17.0 | 26 | 3.97 | |
| Stem damage | 19.0 | 17.1 | 26 | 3.65 | |
| Root rot | 20.5 | 17.7 | 27 | 3.39 | |
| Stand 3 | Healthy | 15.5 | 14.5 | 26 | 3.28 |
| Crown damage | 16.2 | 14.9 | 29 | 3.45 | |
| New crown damage | 18.2 | 15.6 | 26 | 4.68 | |
| Stem damage | 16.0 | 14.7 | 26 | 3.32 | |
| Root rot | 13.6 | 13.7 | 26 | 2.65 | |
| Stand 4 | Healthy | 14.6 | 12.6 | 25 | 2.49 |
| Crown damage | 16.7 | 12.8 | 27 | 3.83 | |
| New crown damage | 18.4 | 14.4 | 22 | 3.55 | |
| Dead trees | 12.2 | 11.4 | 25 | 1.10 | |
| Stem damage | 14.6 | 12.7 | 25 | 3.17 | |
| Root rot | 18.1 | 13.7 | 26 | 3.16 |
| Site | Flight Campaign | Classification Accuracy, % | Kappa Coefficient | OOB Error, % |
|---|---|---|---|---|
| Stand 1 | Beginning of vegetation season | 38.4 (76.1) * | 0.16 (0.39) | 59.0 (13.3) |
| Post drought | 34.4 (88.1) | 0.09 (0.70) | 56.3 (16.8) | |
| End of the vegetation season | 56.8 (75.6) | 0.34 (0.50) | 54.5 (26.6) | |
| Beginning of vegetation season | 47.4 (81.3) | 0.21 (0.48) | 56.8 (14.5) | |
| Stand 2 & Stand 3 | Post drought | 45.6 (83.6) | 0.20 (0.54) | 55.2 (18.1) |
| End of the vegetation season | 47.0 (77.1) | 0.19 (0.45) | 52.9 (22.8) | |
| Stand 4 | Beginning of vegetation season | 41.6 (85.1) | 0.20 (0.59) | 62.1 (16.3) |
| Post drought | 42.4 (89.6) | 0.19 (0.71) | 58.7 (15.8) | |
| End of the vegetation season | 47.0 (71.1) | 0.20 (0.40) | 50.5 (28.8) |
| Class | Sensitivity | Class Error | ||||
|---|---|---|---|---|---|---|
| Beginning of Vegetation Season | Post Drought | End of Vegetation Season | Beginning of Vegetation Season | Post Drought | End of Vegetation Season | |
| Crown damage | 0.57 (0.58) * | 0.38 (0.68) | 0.52 (0.64) | 0.46 (0.33) | 0.55 (0.42) | 0.51 (0.41) |
| New crown damage | 0.20 | 0.13 | 0.10 | 0.85 | 0.81 | 0.96 |
| Dead tree | 1.00 | 0.50 | 0.17 | 0.25 | 0.58 | 0.46 |
| Stem damage | 0.16 | 0.22 | 0.15 | 0.90 | 0.80 | 0.90 |
| Root rot | 0.04 | 0.00 | 0.07 | 0.82 | 0.95 | 0.83 |
| Healthy tree | 0.63 | 0.69 | 0.76 | 0.37 (0.08) | 0.31 (0.08) | 0.29 (0.16) |
Publisher’s Note: MDPI stays neutral with regard to jurisdictional claims in published maps and institutional affiliations. |
© 2022 by the authors. Licensee MDPI, Basel, Switzerland. This article is an open access article distributed under the terms and conditions of the Creative Commons Attribution (CC BY) license (https://creativecommons.org/licenses/by/4.0/).
Share and Cite
Bāders, E.; Romāns, E.; Desaine, I.; Krišāns, O.; Seipulis, A.; Donis, J.; Jansons, Ā. An Integration of Linear Model and ‘Random Forest’ Techniques for Prediction of Norway Spruce Vitality: A Case Study of the Hemiboreal Forest, Latvia. Remote Sens. 2022, 14, 2122. https://doi.org/10.3390/rs14092122
Bāders E, Romāns E, Desaine I, Krišāns O, Seipulis A, Donis J, Jansons Ā. An Integration of Linear Model and ‘Random Forest’ Techniques for Prediction of Norway Spruce Vitality: A Case Study of the Hemiboreal Forest, Latvia. Remote Sensing. 2022; 14(9):2122. https://doi.org/10.3390/rs14092122
Chicago/Turabian StyleBāders, Endijs, Edžus Romāns, Iveta Desaine, Oskars Krišāns, Andris Seipulis, Jānis Donis, and Āris Jansons. 2022. "An Integration of Linear Model and ‘Random Forest’ Techniques for Prediction of Norway Spruce Vitality: A Case Study of the Hemiboreal Forest, Latvia" Remote Sensing 14, no. 9: 2122. https://doi.org/10.3390/rs14092122
APA StyleBāders, E., Romāns, E., Desaine, I., Krišāns, O., Seipulis, A., Donis, J., & Jansons, Ā. (2022). An Integration of Linear Model and ‘Random Forest’ Techniques for Prediction of Norway Spruce Vitality: A Case Study of the Hemiboreal Forest, Latvia. Remote Sensing, 14(9), 2122. https://doi.org/10.3390/rs14092122