1. Introduction
According to the Koala Expert Panel instituted by the Queensland (QLD) Government in 2017 [
1], the iconic Australian koala (
Phascolarctos cinereus) is increasingly threatened in Queensland due to the loss of habitat, climate change, and other pressures. The habitat that remains as the Anthropocene advances needs to be carefully managed by both public and private land managers. Ecologists are increasingly concerned that koala habitats need to be assessed for species refugia from the increasing prevalence of bushfires and other climate change-related environmental risks [
2].
Long-term koala conservation is founded on the persistence of a habitat of appropriate composition, structure, and quality. However, the Eucalyptus communities upon which koalas depend change over time in response to environmental, successional, and anthropogenic influences, often working together as a set of complex interacting pressures. The effective conservation management of this species requires an understanding that habitat pressures are acting at a landscape or regional scale over most of the koala’s range. Consequently, habitat condition assessments can be logistically difficult and expensive.
The QLD Government, Department of Environment and Science (DES) funded an applied research project to comprehensively revise a koala habitat toolbox for koala habitat management stakeholders. The resultant document [
3] was developed by adapting, with permission, an earlier guide [
4] which was prepared with the support of the Ecological Assessment Unit of the Queensland Parks and Wildlife Service (QPWS). A new section has been added to the toolbox—a step-by-step guide to process satellite images to derive a sequence of maps representing vegetation health proxies [
5] for koala habitat management decisions. The image processing concepts and map derivation processes selected for the toolbox are utilised for natural resource and agricultural vegetation health trend applications. Based on stakeholder demand, the toolbox needed image processing techniques based on well-established methods for rapid landscape-level habitat health checks, without requiring spatial science specialist training or equipment, and at low cost.
The paper describes the selection process of remotely sensed vegetation health trend proxies, satellite instruments and image processing software. The methods and data used to compare two candidate satellite instruments follow. The results section documents the regression analysis of fieldwork-measured and image-derived parameters. Finally, some discussion on the topic and a conclusion are offered.
The three objectives of the applied image validation project are briefly noted here and further described in the following paragraphs:
To identify the most appropriate remote sensing tools for the landscape-scale assessment of koala habitat conditions and changes.
To develop a rapid koala habitat health check to enable a qualitative assessment of local habitat condition as a trigger for the quantitative evaluation and potential management intervention; and
To compile a suitable koala habitat management toolbox.
1.1. Objective 1—Investigate Remotely Sensed Habitat Condition Indices
A literature review examined existing and emerging satellite remotely sensed vegetation indices that underpin a rapid assessment of trends in landscape-scale vegetation health. The user requirements for this stage indicated that the satellites imagery component was to be, where possible, free of charge for both satellite imagery and the software to process that imagery. Furthermore, the processes needed to be designed so that spatial science training for a habitat manager was not required.
The applied research outputs for this objective were documented satellite image and spatial analysis processes for: (1) koala habitat dynamics observation to support environmental management decisions; (2) field-tested image accuracy assessment, and (3) maps of vegetation health trends suitable for comparing koala habitat vegetation structure under different El-Nino Southern Oscillation (ENSO) states—thus a potential pointer to koala habitat future under changing climate conditions.
1.2. Objective 2—Koala Habitat Health Check
This component of the project focused on developing a stakeholder-friendly rapid assessment tool for monitoring koala habitat health. The approach was to modify the (then) Department of National Parks, Sport and Racing Health Checks for Key Natural Values [
6]. The guided methodology has been rolled out across the conservation estate of several stakeholders. The health check framework was modified to reflect the range of koala habitats in Queensland, focusing on Southeast (SEQ) and Central Queensland (CQ) habitat types in remnant and non-remnant landscapes.
The research output was a field guide detailing a range of koala habitat health checks incorporating key koala habitat values applicable to non-remnant and remnant landscapes. The research outcomes will have the capacity for private and public land managers and stakeholders to: (1) undertake a rapid assessment of koala habitat and track habitat health; and (2) provide a trigger for more detailed investigation ahead of management intervention.
1.3. Objective 3—Habitat Management Toolbox
This project component sought expert input to validate a suite of recommended intervention methods for achieving or retrieving key koala habitat values within the koala habitat health check field guide. The review accounted for existing silvicultural and natural resource management options. The toolbox review intended to ensure that it could be applied to remnant lands, non-remnant lands and production forests—both private and in conservation tenure, relying on visual signs of habitat condition. Thus, the initial koala habitat health checks were ‘road-tested’ by a range of professional and community stakeholders to refine the methods.
The research outcome was a validated field guide summarising management techniques appropriate to different land classes, tailored to manage key habitat issues. The future research outputs will be an improved management of koala habitat and an improved quality of habitat.
1.4. Image Acquisition and Processing Considerations
It has long been known that satellite remote sensing provides a cost-effective assessment of vegetation health by utilising the radiometric characteristics of both passive and active instruments over a large area [
7]. Xie et al. [
8] noted that ‘the technology of remote sensing offered a practical and economical means to study vegetation cover change, especially over a large area’. In the past decade, commercial and government space agencies have launched medium, high, and very high-resolution optical imagery instruments onboard earth monitoring satellites. These instruments include designed characteristics suited to monitoring biota phenological conditions. Some of these instruments are capable of ultra-high (around 1-metre) spatial resolution—a tree crown delineation scale. These capabilities provide a rich source of spatial data for koala habitat assessment. User experience suggests that the critical success factor to stakeholder take-up of satellite remote sensing is well-designed image processing recipes, so that stakeholders can utilise the measurement capability on offer.
The research aimed to keep the cost of deriving vegetation health maps as low as possible, by selecting relatively simple processing steps while retaining the goal of accurate information provision for koala habitat managers. There are many vegetation health proxies in the remote sensing literature—not all of them meet these requirements.
The satellite instrument selection necessarily traded off spatial resolution (pixel size), temporal resolution (revisit cycle) and spectral resolution with image acquisition costs. The selection considered the instrument design specification of reflectance measurement bands suitable for constructing the chosen vegetation health indices. The choice of a practical imager considered image acquisition logistics and vegetation index mapping complexity. The considered satellite instrument design characteristics are listed in
Appendix A.
The project team reviewed a selection of image processing software that were: (1) capable of producing the maps required; (2) relatively easy to use by habitat managers without requiring spatial science skills; and (3) preferably free of cost.
In terms of satellite image data retrieval, this paper uses the term ‘reflectance’. Reflectance is the ratio of the solar radiation incident at the earth’s surface (irradiance) and that light reflected by the earth’s surface (radiance) or items on that surface [
9]. Reflectance values vary based on: (1) the characteristics of the land cover—colour, roughness, aspect, and other characteristics; (2) the angle of the sun, the angle of the instrument, time of day; and (3) atmospheric interference. The term ‘top-of-atmosphere reflectance’ (or at-sensor reflectance) refers to the amount of light energy measured at the satellite sensor. The term ‘bottom-of-atmosphere’ reflectance (or at-ground reflectance) refers to the measurement of light energy on the ground—which means reflectance correction for light extinction by molecular or particulate reflection or absorption through the atmosphere (hence the term ‘atmospheric correction’).
To meet stakeholder requirements, we ensured that image providers have made essential image corrections [
9]. These are radiometric corrections (for instrument error), geometric corrections (to ensure the image maps to the actual terrain) and atmospheric corrections.
2. Materials and Methods
2.1. Biophysical Parameters Selection
The remote sensing science literature describes a wide range of vegetation health indices derived from the mathematical manipulation of reflectance measurements from specified electromagnetic radiation spectrum band divisions. Much of the related literature discussing optical, multispectral, satellite-derived forestry or agriculture vegetation health describes experiences from the United States, Europe, and China. A number of studies for remotely sensed
Eucalypt assemblages in an Australian context were consulted [
10,
11]. In particular, koala habitat assemblage characteristics that frame the original koala habitat manager’s toolbox [
3] informed the selection of vegetation health proxies: (1) open woodland species of
Eucalyptus and
non-Eucalyptus foliage for food, shelter and social behaviour; (2) tree size in the 40–80 cm diameter size class with well-developed crowns; (3) a preference for riparian vegetation with relatively fertile soil and higher leaf water content during dryer conditions. The knowledge synthesis suggested that the following vegetation health indices derived from satellite instruments were suitable using the selection criteria so far established:
Normalised Difference Vegetation Index (NDVI)—a numerical dimensionless indicator of plant ‘greenness’ or photosynthetic activity that uses the visible and near-infrared bands of the electromagnetic spectrum [
12].
Normalised Difference Red-Edge Index (NDRE)—similar to NDVI but suitable for detecting plant foliar stress earlier than NDVI and a consequence of satellite radiometric design incorporating a ‘red-edge spectral capability [
13].
Leaf Area Index (LAI)—a dimensionless quantity that characterises plant canopies—the one-sided green leaf area per unit ground surface area in broadleaf canopies [
14]. LAI is a vegetation health index related to climate feedback [
15].
Equivalent Water Thickness (EWT) is a leaf moisture proxy using a mid-infrared band available on some imagers for characterising moisture absorption [
16].
Other indices and vegetation health proxies exist, particularly permutations and combinations of those noted above. Some indices require further complex biophysical parameter database collection (or ‘look-up’ tables). Some indices require complicated algorithms from specialist software. These would not meet an aim of the ‘toolbox’ to document practical vegetation index maps for non-spatial science habitat managers, preferably free of charge. In an Australian remote sensing service context, these include: (1) the Fraction of Photo-synthetically Absorbed Radiation (FPAR) index—the fraction of absorbed photo-synthetically active radiation that a plant canopy absorbs for photosynthesis and growth [
17]; and (2) foliage projective cover (FPC)—the percentage of ground area occupied by the vertical projection of foliage [
11].
The literature notes that some indices, and linear equation derivations of the indices, for which equation coefficients vary, are suited to certain tree families or genera. The indices noted above are, within limitations, reasonably generic, easily calculated, used widely, and suitable for monitoring koala habitat health.
The chosen vegetation health indices are further described below, noting the electromagnetic radiation spectrum wavelength classification for each. This detail provides the satellite band specifications required in selecting a suitable instrument for koala habitat health monitoring:
NDVI—satellite band ratio of red (R) and near-infrared (NIR) band reflectance [
12,
18]:
NDRE—satellite band ratio of NIR reflectance and another NIR reflectance where the band radiometric wavelength is close to the R band (known as a ‘red-edge’ or RE band) reflectance [
13]:
LAI—there are many algorithms for calculating the LAI vegetation index [
19,
20,
21]. The LAI used in the present study is the modified simple ratio (MSR) that can be linearly related to LAI [
22]:
EWT—this index is constructed from satellite short-wave infra-red (SWIR) reflectance located at electromagnetic energy wavelengths known to be absorbed by water (~1.6 µm) [
16]:
2.2. Satellite Imager Selection
Government programs or commercial entities operate many earth monitoring satellite imagers. Each satellite has specifically designed characteristics and consequently varying spatial, temporal, and radiometric specifications. Often, the trauma of launch and ongoing technical failures in space causes agencies to deprecate these design characteristics. The selection of instruments becomes a trade-off of design and operating instrument characteristics. Furthermore, some operating agencies (primarily commercial) charge for output image products—and some are free of charge. Not surprisingly, the finer spatial resolution image products generally incur a charge through third-party commercial providers.
The requirements for image outputs for the koala habitat manager’s toolbox included: (1) inexpensive (or indeed ‘free of cost’) imagery; (2) a reasonable time revisit cycle to obtain images at a user-selected time that are free of cloud; (3) radiometric capabilities capable of deriving the vegetation health proxies; and (4) a spatial resolution that suitably represents a given koala habitat region. The trade-off of these parameters eliminates several potentially useful instruments noted further in
Table A1 of
Appendix A.
For example, ultra-high spatial resolution imagers (such as the Maxar WorldView or GeoEye series) were not further considered. While having, in some cases, sub-metre spatial resolution, the image products are expensive—and are subject to a prenegotiated image acquisition tasking process not suitable for the stakeholders. Satellite images from such instruments cannot reliably be ordered ‘off-the-shelf’ for a given place and time without prearranged instrument tasking. Furthermore, some of these instruments do not have a short-wave infrared (SWIR) band suitable for deriving EWT maps.
Long-standing, free-of-charge products from NASA and the United States Geological Service (USGS) satellite image stores have suitable revisit times and radiometric specifications—but their spatial resolutions of 30-m (LandSat) and 250-m to 1-km (MODIS) are not optimal for the scale of koala habitats. At this resolution, the reflectance values of individual pixels are the average values from a mix of land-cover components within a given pixel. An image processing technique in the literature known as ‘pixel un-mixing’ requires advanced knowledge and, arguably, are techniques that are not suitable for the koala habitat manager’s toolbox.
Appendix A, documents sensor characteristics for three satellite systems that seem to match the user requirements: (1) Maxar RapidEye; (2) the European Space Agency (ESA) Sentinel-2; and (3) from France, the SPOT series of satellites. RapidEye and SPOT images incur an expense, whereas Sentinel-2 images are free of charge.
The ESA Sentinel-2 program is two satellites, which combined allow for a 5-day revisit cycle. The relatively short 5-day revisit cycle is helpful for vegetation mapping because of the reflectance changes brought about by phenological phases [
23]. Sentinel-2 has appropriate radiometric characteristics, a moderate 10-m spatial resolution and, importantly, these are free-of-charge. The Multi-spectral Instrument (MSI) onboard Sentinel-2 has, amongst its 12 bands, three red-edge bands useful for landscape-scale vegetation monitoring [
23], and the suitable short-wave infrared bands for generating EWT maps. Band 5 (703.8 nm) was selected for the NDRE map derivation, and Band 11 (1613 nm) was selected for EWT map derivation, where the 20-m pixels were resampled in SNAP to 10-m spatial resolution. The Sentinel-2 radiometric and spatial resolution specifications are noted in
Table A3 of
Appendix A.
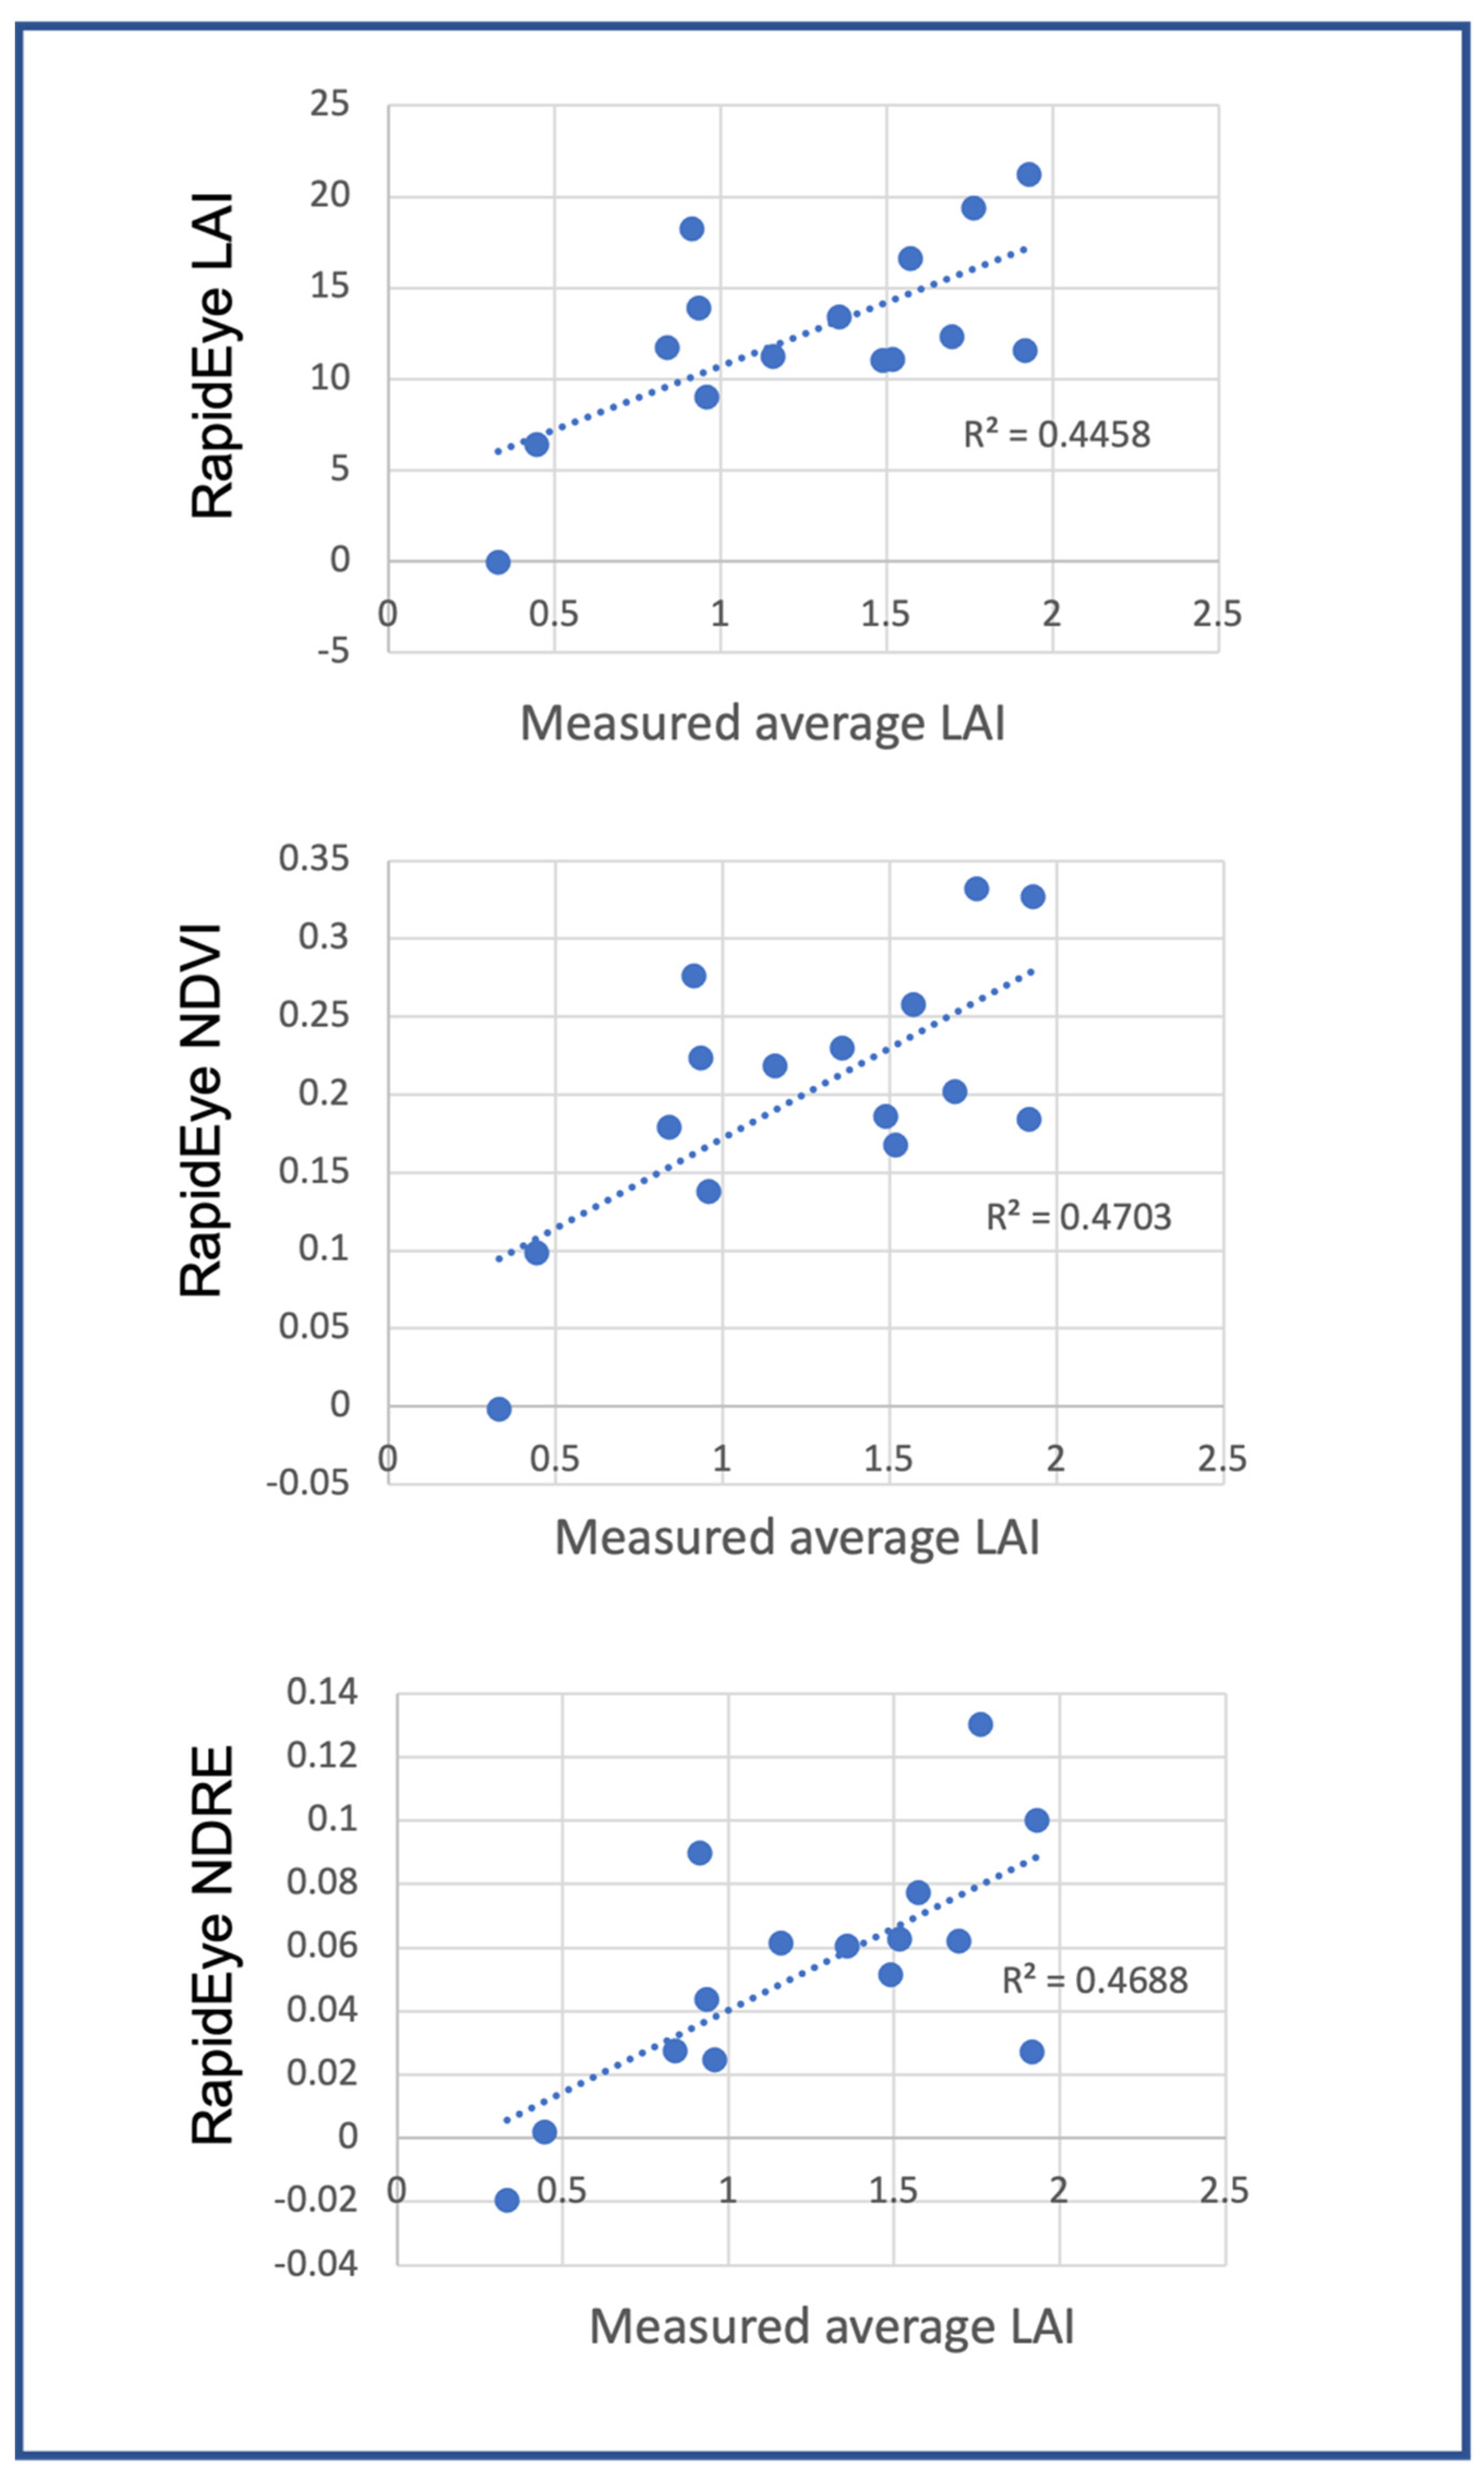
The Maxar RapidEye suite of five instruments also allows for an adequate revisit cycle (5 days), practical radiometric resolution (although without the moisture-absorbing short-wave infrared band), and a 5-m spatial resolution (
Table A2 of
Appendix A). RapidEye images can be procured at a reasonable cost. The present project compares RapidEye images to evaluate if the 5-m spatial resolution provides vegetation mapping benefits over the Sentinel-2 10-m resolution images—and thus justifies the cost.
2.3. Image Processing Software Selection
Several sophisticated software programs exist to process multi-band satellite reflectance images into maps of vegetation indices; among others, geographic information systems (GIS) such as ESRI ArcGIS; and bespoke satellite image processing programs such as Erdas Imagine, Harris Technologies ENVI, and an object-oriented image processing approach known as eCognition. All these ‘industrial strength’ image processing platforms incur a considerable cost per license. There are function-rich GIS platforms free of charge—but operators require a high level of training and experience to use them for satellite image processing. Not all koala habitat managers wish to master a fully fledged GIS. None of these packages meet the ‘user requirements’ aim of preferably being free of charge and simple to use.
The ESA Copernicus Program provides a satellite image processing software system free of charge. The ‘Sentinel Application Platform’ (SNAP) is a functionally rich application capable of deriving the vegetation indices chosen specifically for the ESA Sentinel constellation of satellite imagers.
SNAP is available for a Microsoft Windows, Linux or Apple MacOS operating system platform.
SNAP requires some experience and training to use—consequently, the Koala Habitat Manager’s Toolbox guides users in: (1) the creation of a Copernicus user account; (2) downloading and installing SNAP, and (3) step-by-step guidance to derive the selected vegetation index maps.
2.4. Methods—Vegetation Health Indices Field Measurements
In a field campaign visiting four koala habitats in Queensland, selected vegetation health indices were measured. The fieldwork data were collected using established processes developed by the Australian remote sensing research community. The northern Australian drier season dates were chosen to maximise the likelihood that field campaign days would align with cloud-free satellite imagery acquisition.
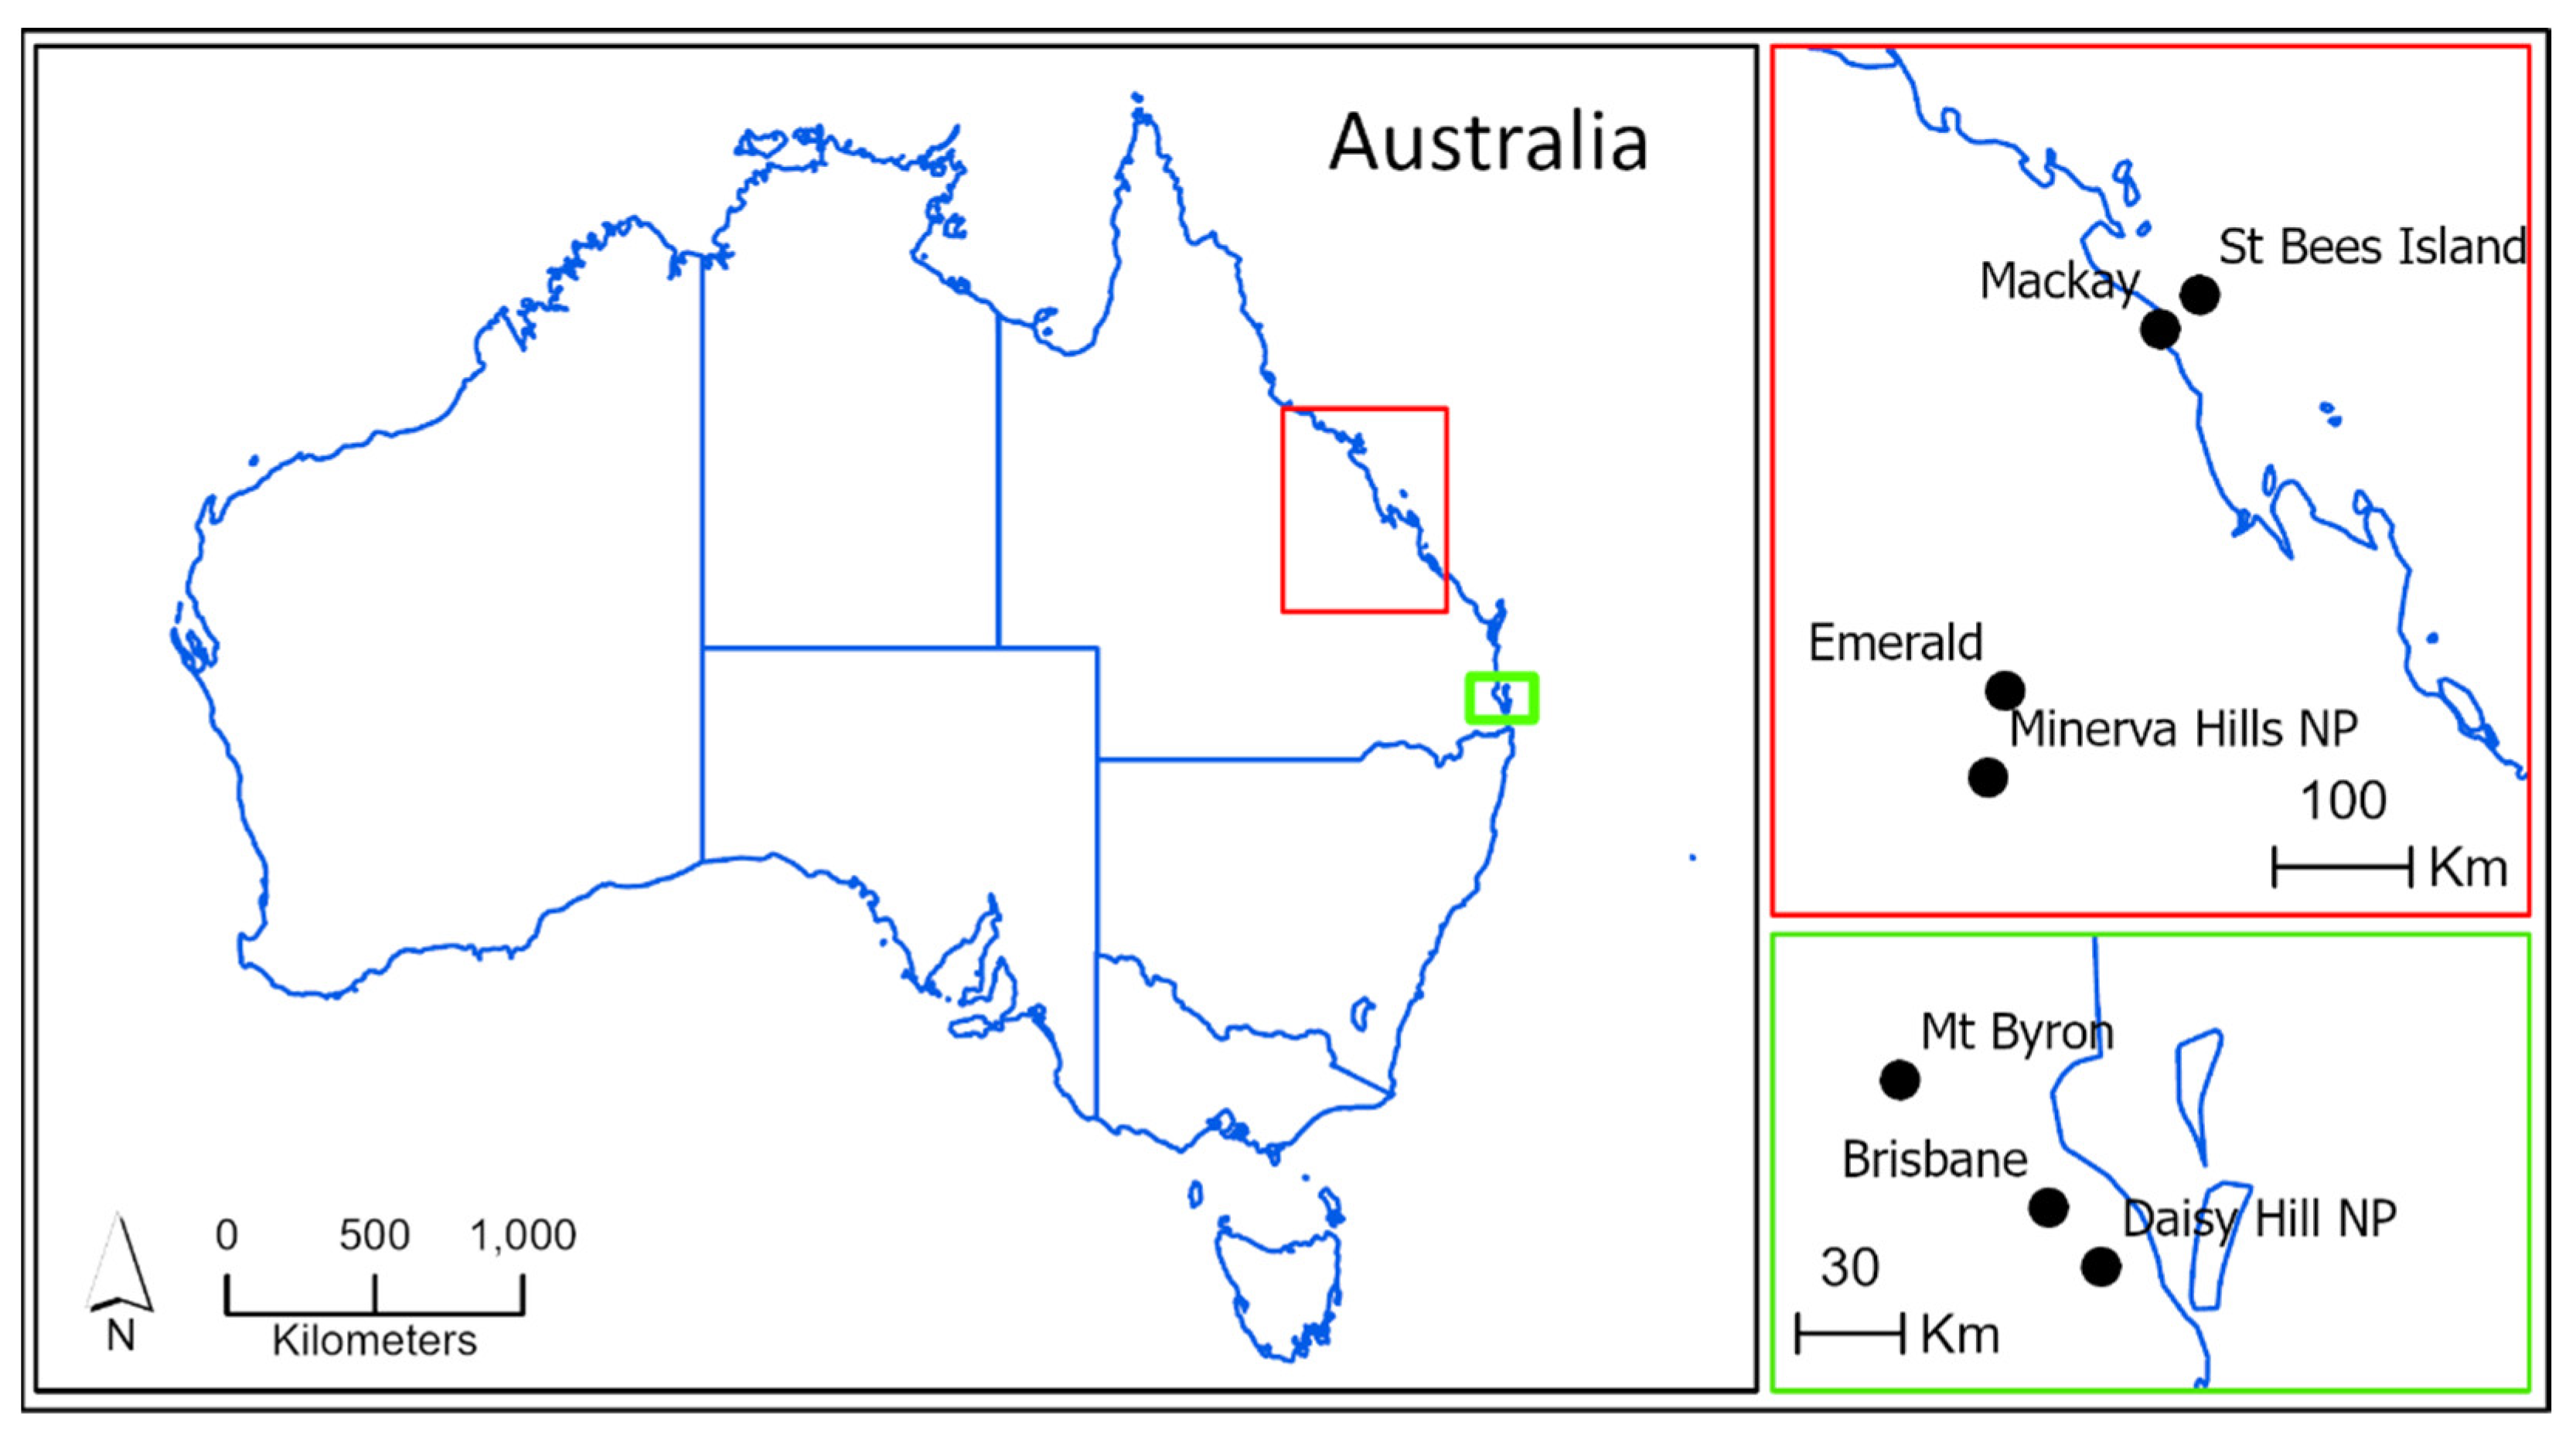
The four fieldwork sites (
Figure 1) were visited as follows:
July 2018—St Bees Island (off the coast near Mackay CQ).
August 2018—Minerva Hills National Park (near Emerald CQ).
August 2018—Daisy Hill Conservation Park (south of the City of Brisbane).
August 2018—private property ‘Hollow Log’ in the vicinity of Mt Byron and D’Aguilar National Park (northwest of the City of Brisbane).
Procedures for gathering biophysical parameter map ground-truthing data were designed according to documented practices of the satellite remote sensing community. Field data collection processes vary according to the target satellite spatial resolution to be compared. For example, when ground-truthing the 30-m pixel sizes of LandSat, Held et al. [
11] recommend a specific star transect design. For instruments of finer spatial resolution, weighted averages of clustered field measurements are recommended [
24].
At each of the four koala habitat field locations, 25 groups of five separate measurements were obtained for LAI and EWT (physical leaf collection described further below). The five measurements were obtained within a radius of 20 m from a location defined by a Global Positioning System (GPS)-measured latitude/longitude—to account for the Sentinel-2 pixel size (RGB and NIR bands at 10-m and the TIR band at 20-m spatial resolution). The 25 sites were distributed throughout the koala habitat region. The measurements were obtained between 10:00 and 14:00 h so that they related to the approximate mid-day satellite overpass of Sentinel-2 and RapidEye. The satellite images themselves were acquired plus/minus seven days of the field site visit dates to ensure consistent validation given phenology time frames, but also to maximise the acquisition of images on cloud-free days, a characteristic of optical satellite instruments.
Note that the satellite NDVI and NDRE maps are not validated with field site measurements because NDVI and NDRE are indirect plant photosynthetic health proxies; and the technical means for obtaining ‘similar to satellite’ NDVI/NDRE field measurements is difficult. There are handheld spectroradiometers for field measuring NDVI/NDRE, but they are either: individual leaf measurements; or multispectral band quantities that are a ground-level ‘looking up’ measurement rather than the satellite sun-illuminated measurement—the measurements are not the same. Another method of ground-truthing NDVI is to use a Remotely Piloted Aerial System (RPAS) [
25]. In general terms, NDVI/NDRE are well known and well-tested proxies of vegetation health—and it is better to field measure biophysical parameters such as LAI [
26,
27].
Each measurement site was recorded with a Global Positioning System (GPS) location. The GPS was a Garmin GPSMAP 64 with an accuracy of ±3 m, generally given the number of positional satellites available.
LAI values were collected with an ACCUPAR LP-80 canopy density meter. The LP-80 calculates LAI in real-time. The LP-80 instrument operator acquired a reference above-canopy light measurement at each cluster before making the five per cluster below-canopy measurements. These measurements were taken at an instrument height of approximately 1.3-m from the ground to limit lower biota storey light interactions. The operator was careful to exclude any shadow of themselves falling on the LP-80 measurement antenna.
The project used the method to store and analyse water content in leaves from Jin et al. [
28]. Five potential koala food trees were selected in a cluster, as previously described. Ten leaves were collected as close to the top of the canopy as possible using a telescopic pole saw.
Leaves were placed in a plastic zip-lock bag after the empty bag had been weighed. Leaves and bags were weighed using an analytical balance. A few drops of water were poured into the bag, and leaves were refrigerated at 4 °C with a field refrigerator to avoid desiccation and decomposition before analysis in the laboratory.
The ten leaves from each tree were placed into a paper bag after weighing the empty bag. Leaves inside the paper bag were weighed after being oven-dried at 60 °C until the weight plateau had been reached. The paper bag was weighed again when the leaves were still warm.
The leaf water content (LWC) was calculated using the formula:
where:
Wf = fresh weight;
Wd = dry weight.
2.5. Satellite Image Processing
Maxar RapidEye multispectral images were sourced as geometric, radiometric, and atmospherically corrected images through the Maxar image selection website. A suitable cloud-free image was available for the Minerva Hills NP location on the 30 July 2018. This date is the day before the Minerva Hills NP field trip commenced—and within the seven days between field measurements and imagery acquisition recommended by Grabska et al. [
23].
The ESA all-band Sentinel-2 multispectral images were sourced from the Copernicus Program data repository as geometric, radiometric, and atmospherically rectified images (Level-2A). Some of the Sentinel-2 images in the repository at the date of access, were only available at Level-1C processing (missing the step of being atmospherically corrected). In these cases, the atmospheric correction of an image was obtained from the ESA SNAP SEN2COR software addition. The atmospheric correction of images is required for the time series analysis of vegetation health maps [
12], and the SNAP process at this step is relatively simple—just time-consuming.
The multi-band RapidEye images were processed into NDVI, NDRE, LAI maps using the SNAP software processing the equations noted in the literature review section. Since RapidEye does not have a TIR band, an EWT map could not be created for this instrument.
The multi-band Sentinel-2 images were processed into NDVI, NDRE, LAI, and EWT maps using the SNAP software processing of index equations noted in the literature review section. SNAP contains an automated Sentinel-2 LAI map production routine—although no documentation could be found to ascertain the algorithm that has been coded by ESA, despite a written request. This SNAP function makes for easier LAI processing by a koala habitat manager—and comparisons with the LAI equation indicated map parity.
The difference between wet and dry season Sentinel-2 based vegetation health maps is created with a simple arithmetic difference operation in the ESA SNAP software. This process can be used to compare vegetation health trends for ENSO climate states—during the years identified as El-Nino, La-Nina and ENSO neutral conditions by climate studies [
29,
30].
The various SNAP satellite images, vegetation health indexes and map production routines were written up as ‘recipes’ in the Koala Habitat Manger’s Toolbox.
2.6. Field and Map Correlation
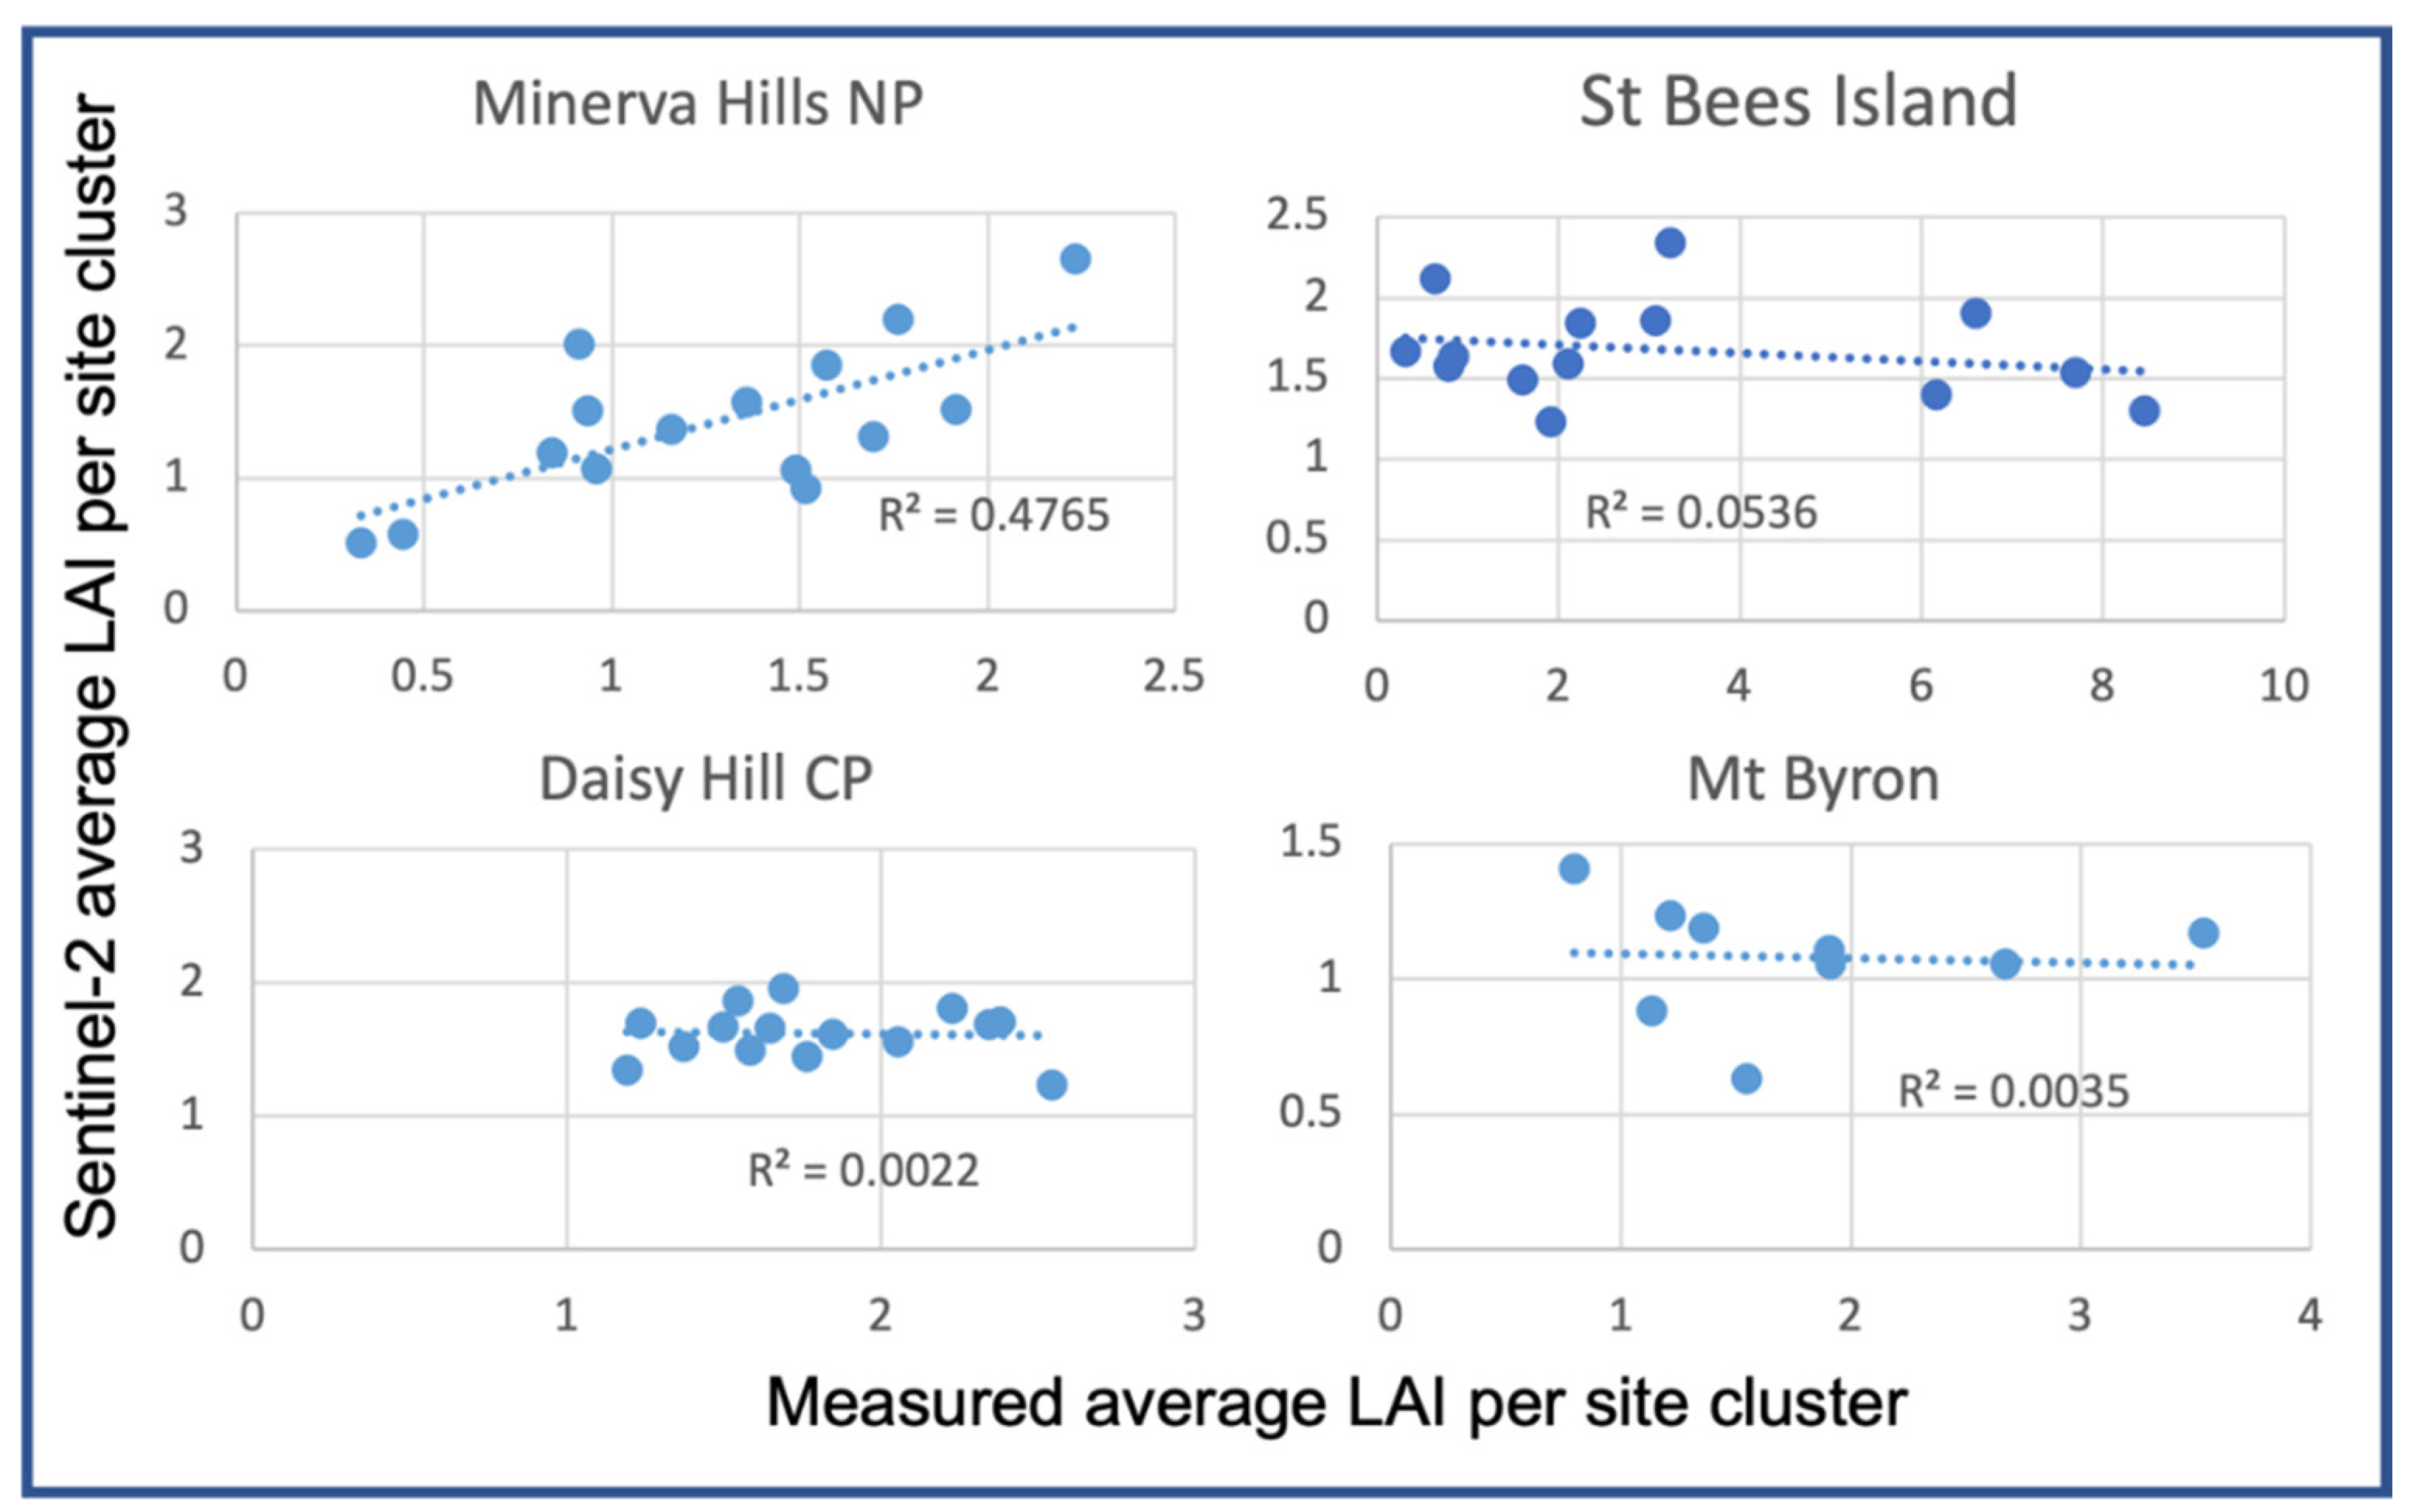
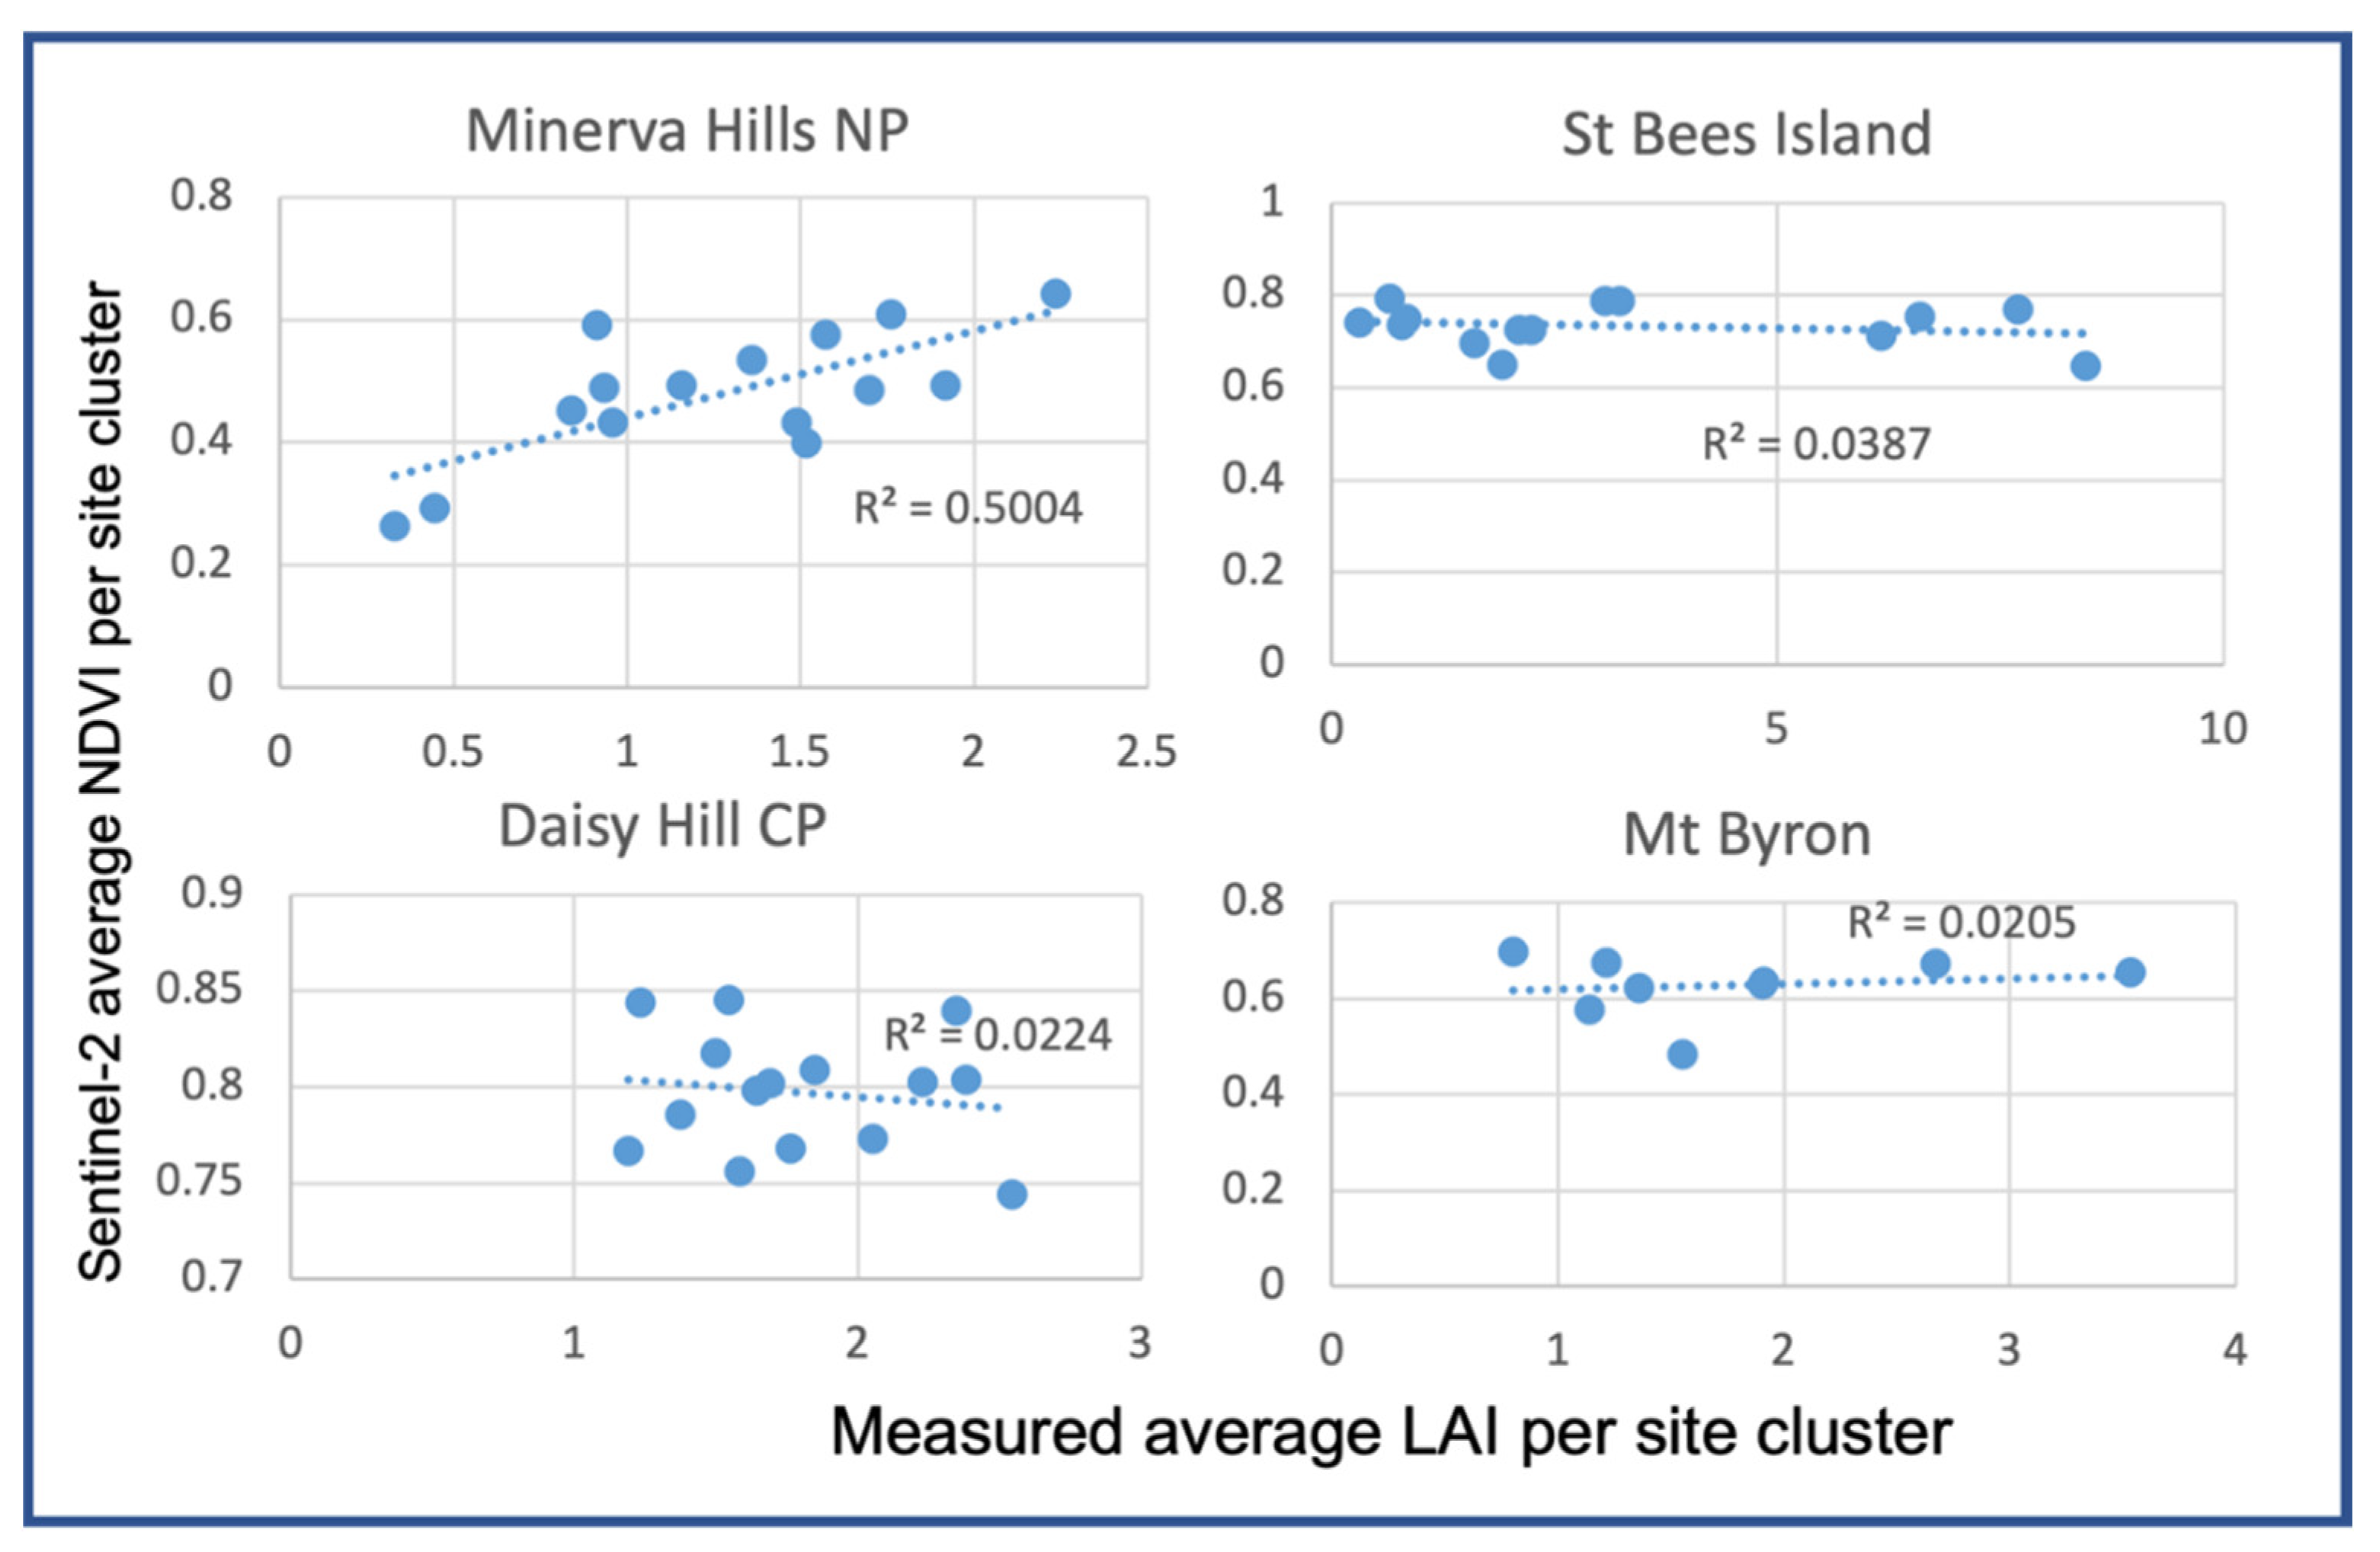
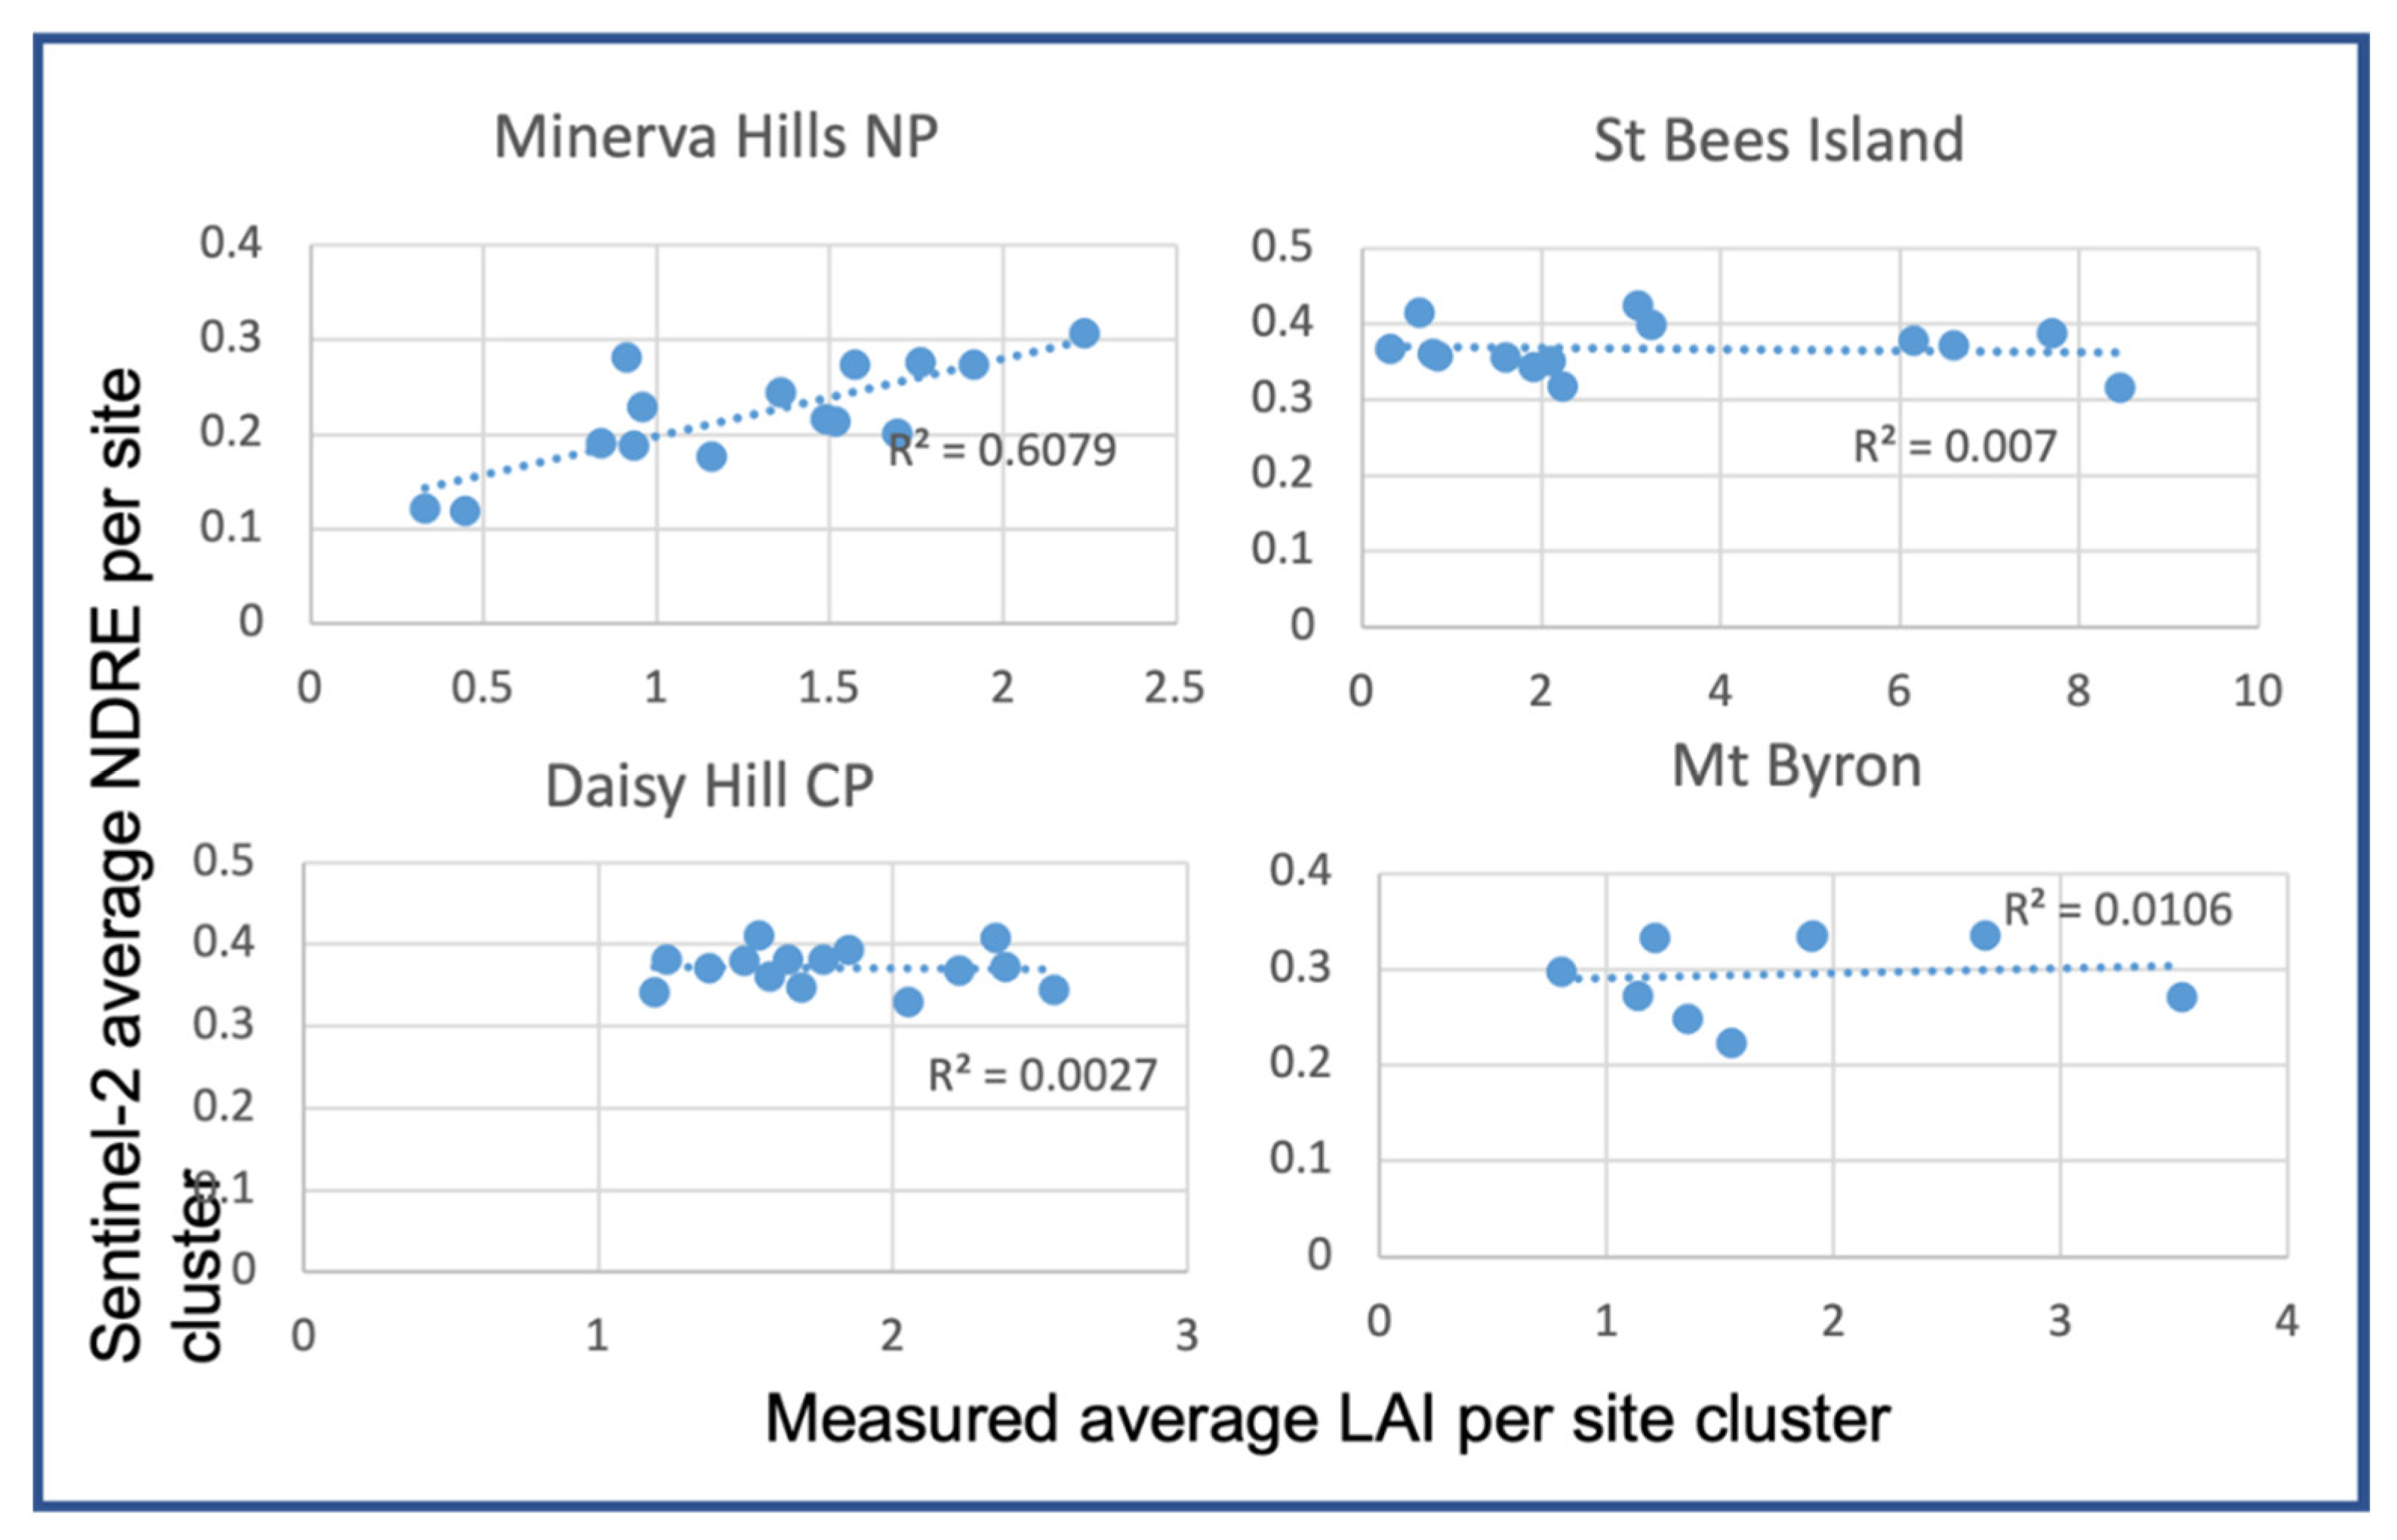
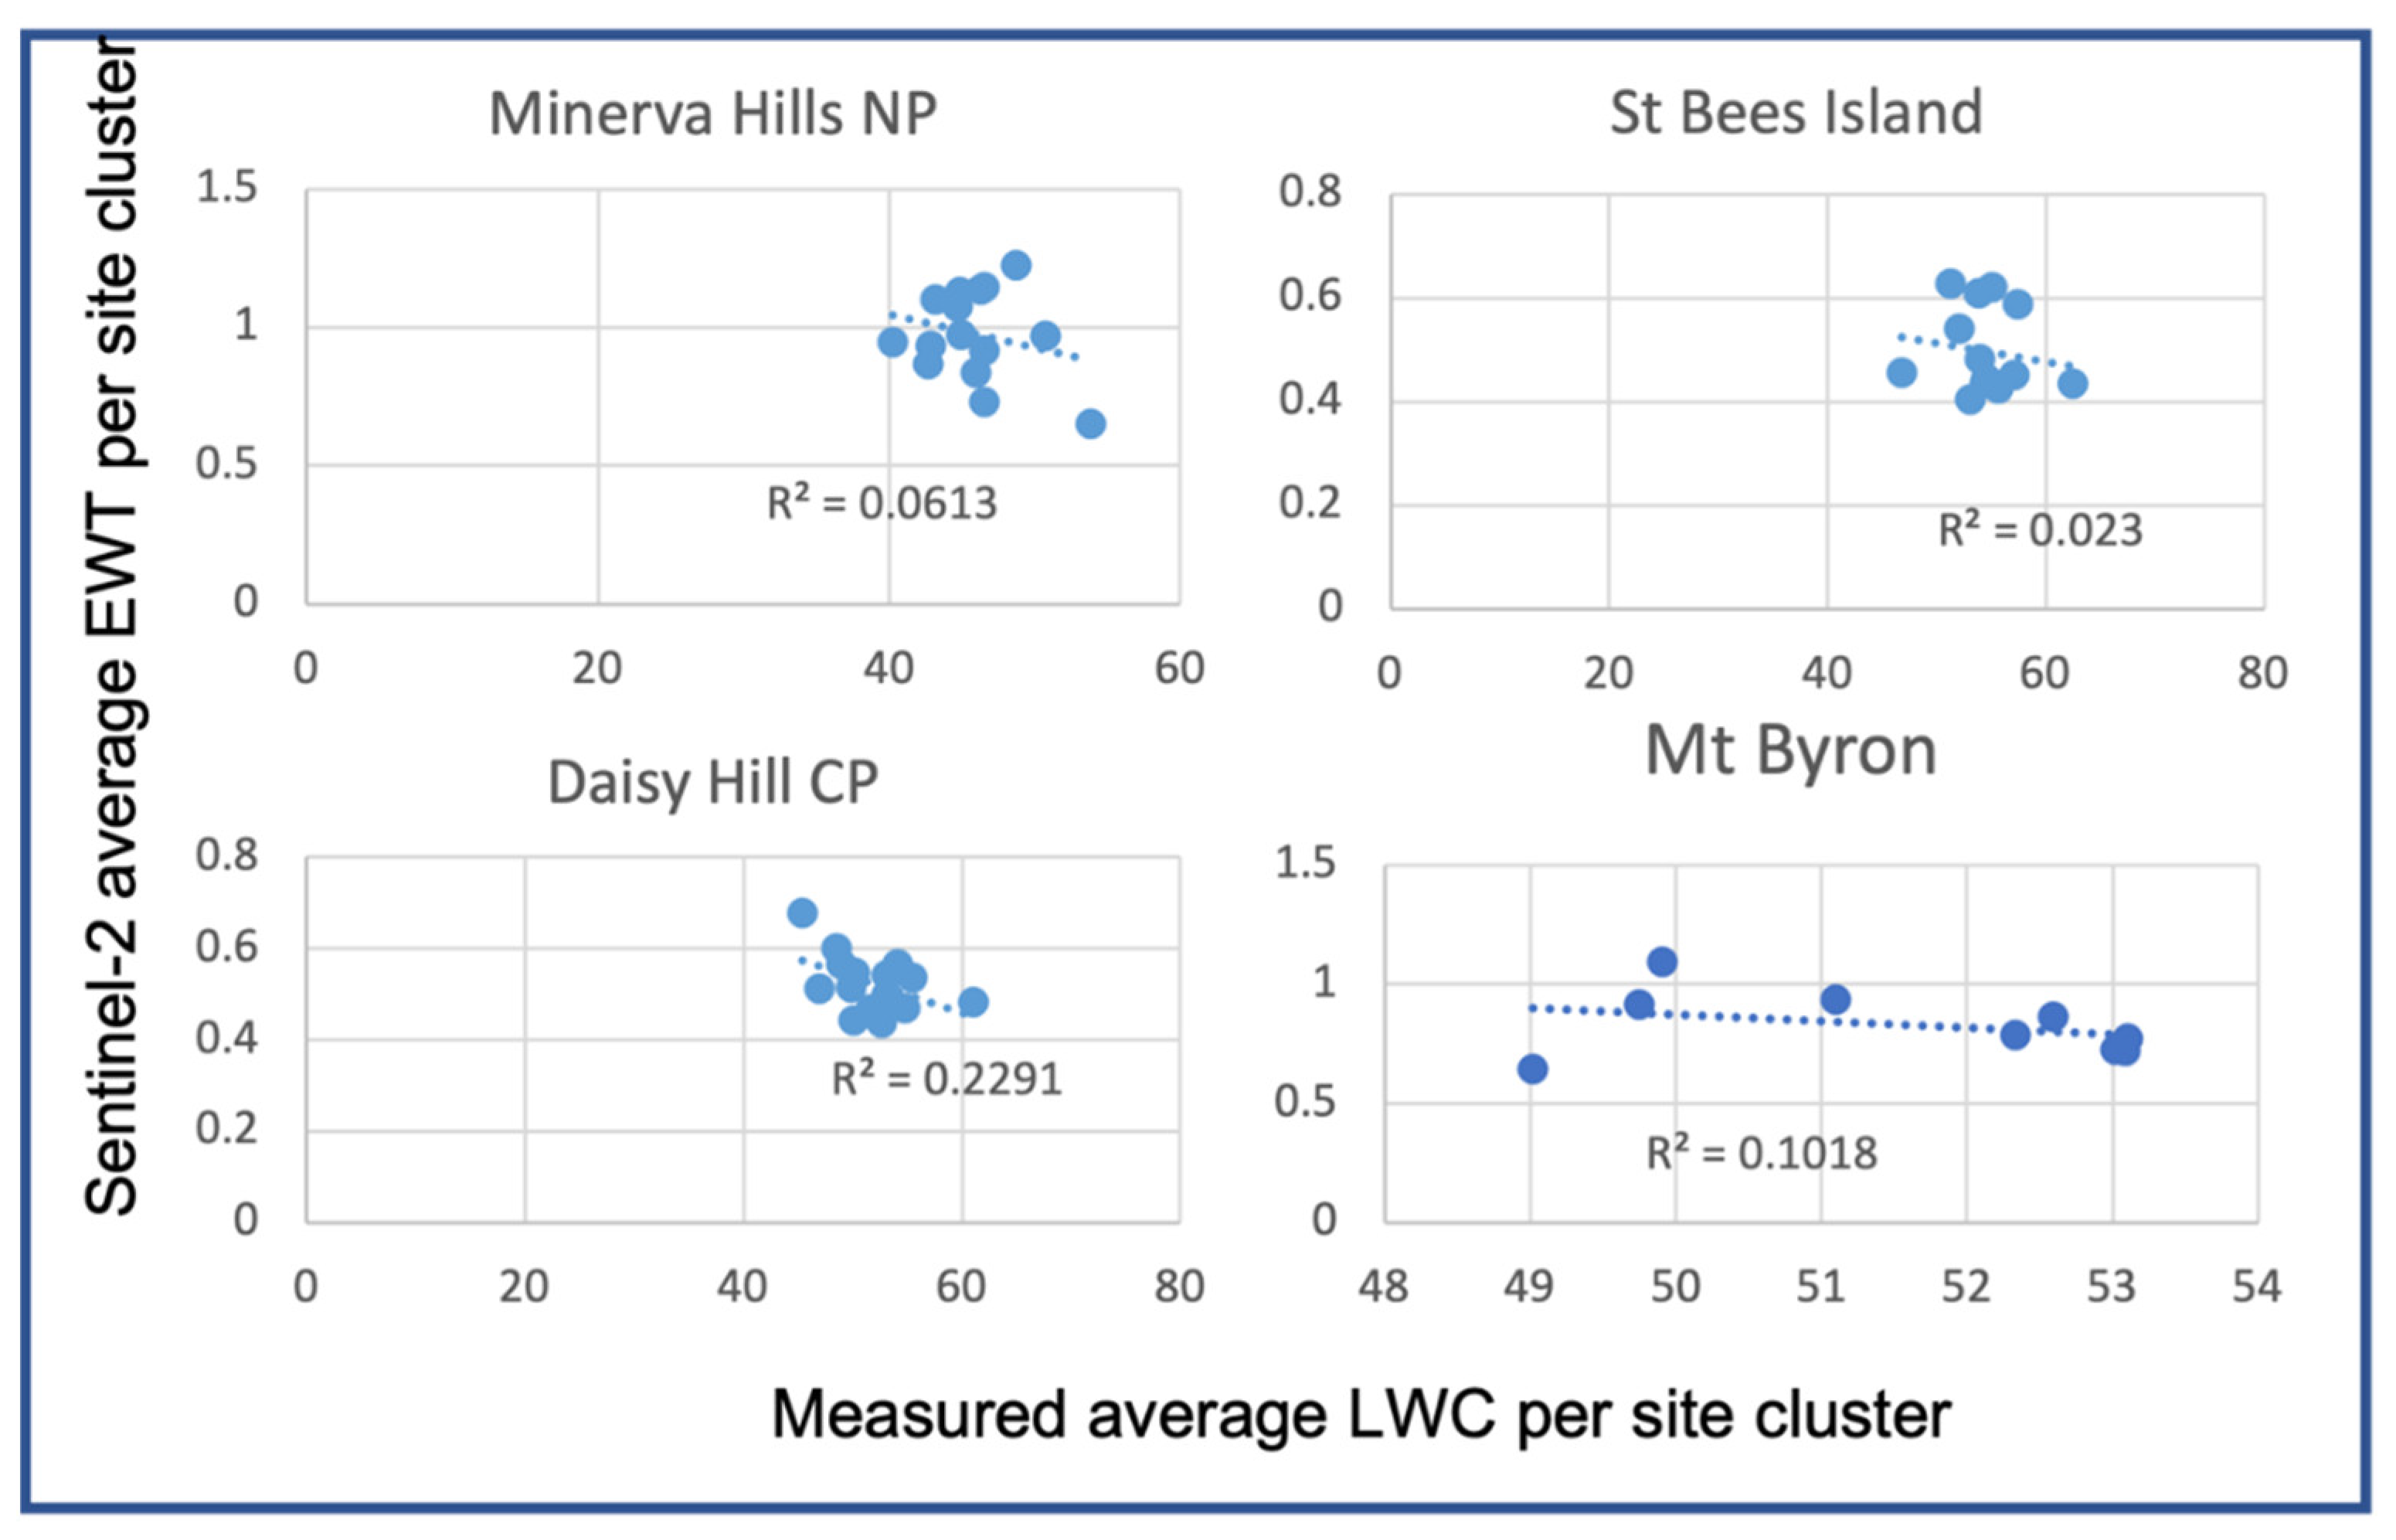
The field measurements of LAI and LWC were compared with the satellite-derived vegetation health indices, LAI and EWT respectively, at the same location in the maps, as averaged values per cluster, using Pearson’s linear correlation analysis.
A proprietary Geographic Information System (GIS) ESRI ArcGIS Desktop was used to compare the SNAP produced maps with the field-measured parameters. The GeoTIFF maps were loaded into ArcGIS, as were the field measurement data as GIS point shapefiles. The mapping- and field-collected data were explored with summary statistics to review adherence to Gaussian analysis prerequisites. No further data detrending or transformation processes were required to achieve a normal distribution of the individual datasets. Note that we did not undertake specific probability interval tests, as the focus of the comparison was a ‘fit for purpose’ assessment to meet the user requirements of a habitat manager’s toolkit—not a validation of Sentinel-2 imagery perse, since that verification has been assessed in the literature (
Section 2.2).
A GIS ‘extract to points’ process was used to create a data file of measurements for correlation analysis. The Pearson correlation coefficient and scatter plot line fitting were carried out in Microsoft Excel.
4. Discussion
The image processing ‘recipes’ have been written up in the koala habitat managers’ toolbox—and are reasonably straightforward enough to be used by non-spatial science-trained image users.
Several stakeholder meetings were undertaken to review and test the koala habitat manager’s toolbox, including the satellite image-derived vegetation health index processing ‘recipes’ [
5]. The project reached out to a range of Government, not-for-profit, and university-based koala habitat research staff seeking comment on the draft koala habitat manager’s toolbox.
The applied research into the free-of-charge derivation of satellite remotely sensed imagery of koala habitat health indices has identified that the ESA Sentinel-2 multispectral instrument and SNAP image processing software is suitable for the temporal analysis of vegetation health proxies; NDVI, NDRE, LAI, and EWT. While a linear correlation analysis of these indices from field-measured and the satellites derived maps was generally inconclusive; the stakeholder user requirements of: (1) capability to observe vegetation health to trigger closer inspection and possible management intervention; (2) at a suitable temporal resolution; (3) free of cost (images and image processing software); and (4) ease of use for abinitio satellite image processing practitioners, were met. In discussions with the stakeholders, we noted that the image sets were deemed useful to experienced habitat managers who knew their real estate well.
One of the reasons for the lack of correlation comparing satellite NDVI and LAI in three of the four sites is conjectured to be an artefact of the Sentinel-2 pixel size of 10-m. The single value of reflectance in a 10 m × 10 m pixel represents the average irradiance/radiance ratio of possibly several shrub and tree species and various landcover elements, if the canopy has gaps or is otherwise thin. The stakeholders of the koala habitat managers’ toolbox indicated that the temporal resolution and cost factors outweigh the less-than-ideal spatial resolution, especially for establishing seasonal or inter-annual trends in vegetation health.
The clustering of the satellite EWT and measured LWC leaf moisture comparisons at three of the four field sites (St Bees Island, Minerva Hills National Park and Daisy Hill Conservation Park) evident in
Appendix C Figure A6 suggests that a strong relationship between the satellite proxy and the biophysical measure may well be established based on less heterogeneous species assamblages. This aspect, with respect to satellite imager spatial resolution, deserves further research. Furthermore, as discussed in the present
Section 2.1, we note that the use of Sentinel-2 NDVI, LAI, and EWT as proxies for monitoring habitat health trends has a strong foundation in the literature.
In comparison, the literature notes that ultra and very high spatial resolution imagers exhibit far stronger Pearson correlation coefficients compared with field-measured vegetation health proxies with fine spatial resolution satellite platforms (Ikonos, WorldView, GeoEye, and others) and hosted instruments, because each pixel represents much fewer plant species or the ground cover diversity of reflectance [
18]. These studies improve confidence in the use of the vegetation indices. As discussed, these images are expensive to both acquire and process to a limited number of vegetation indices (i.e., not EWT, and sometimes not NDRE) and do not provide phenological useful revisit times. Hyper-spectral instruments, principally those hosted on airborne platforms rather than a satellite, provide radiometric bands sufficient for EWT maps—but require logistically expensive campaigns to acquire a limited suite of images suitable for time series analysis. The airborne hyperspectral compact airborne spectrographic imager (CASI) has been used to derive very useful maps of vegetation health proxies of koala habitat, as well as a valuable capacity to map vegetation species [
10].
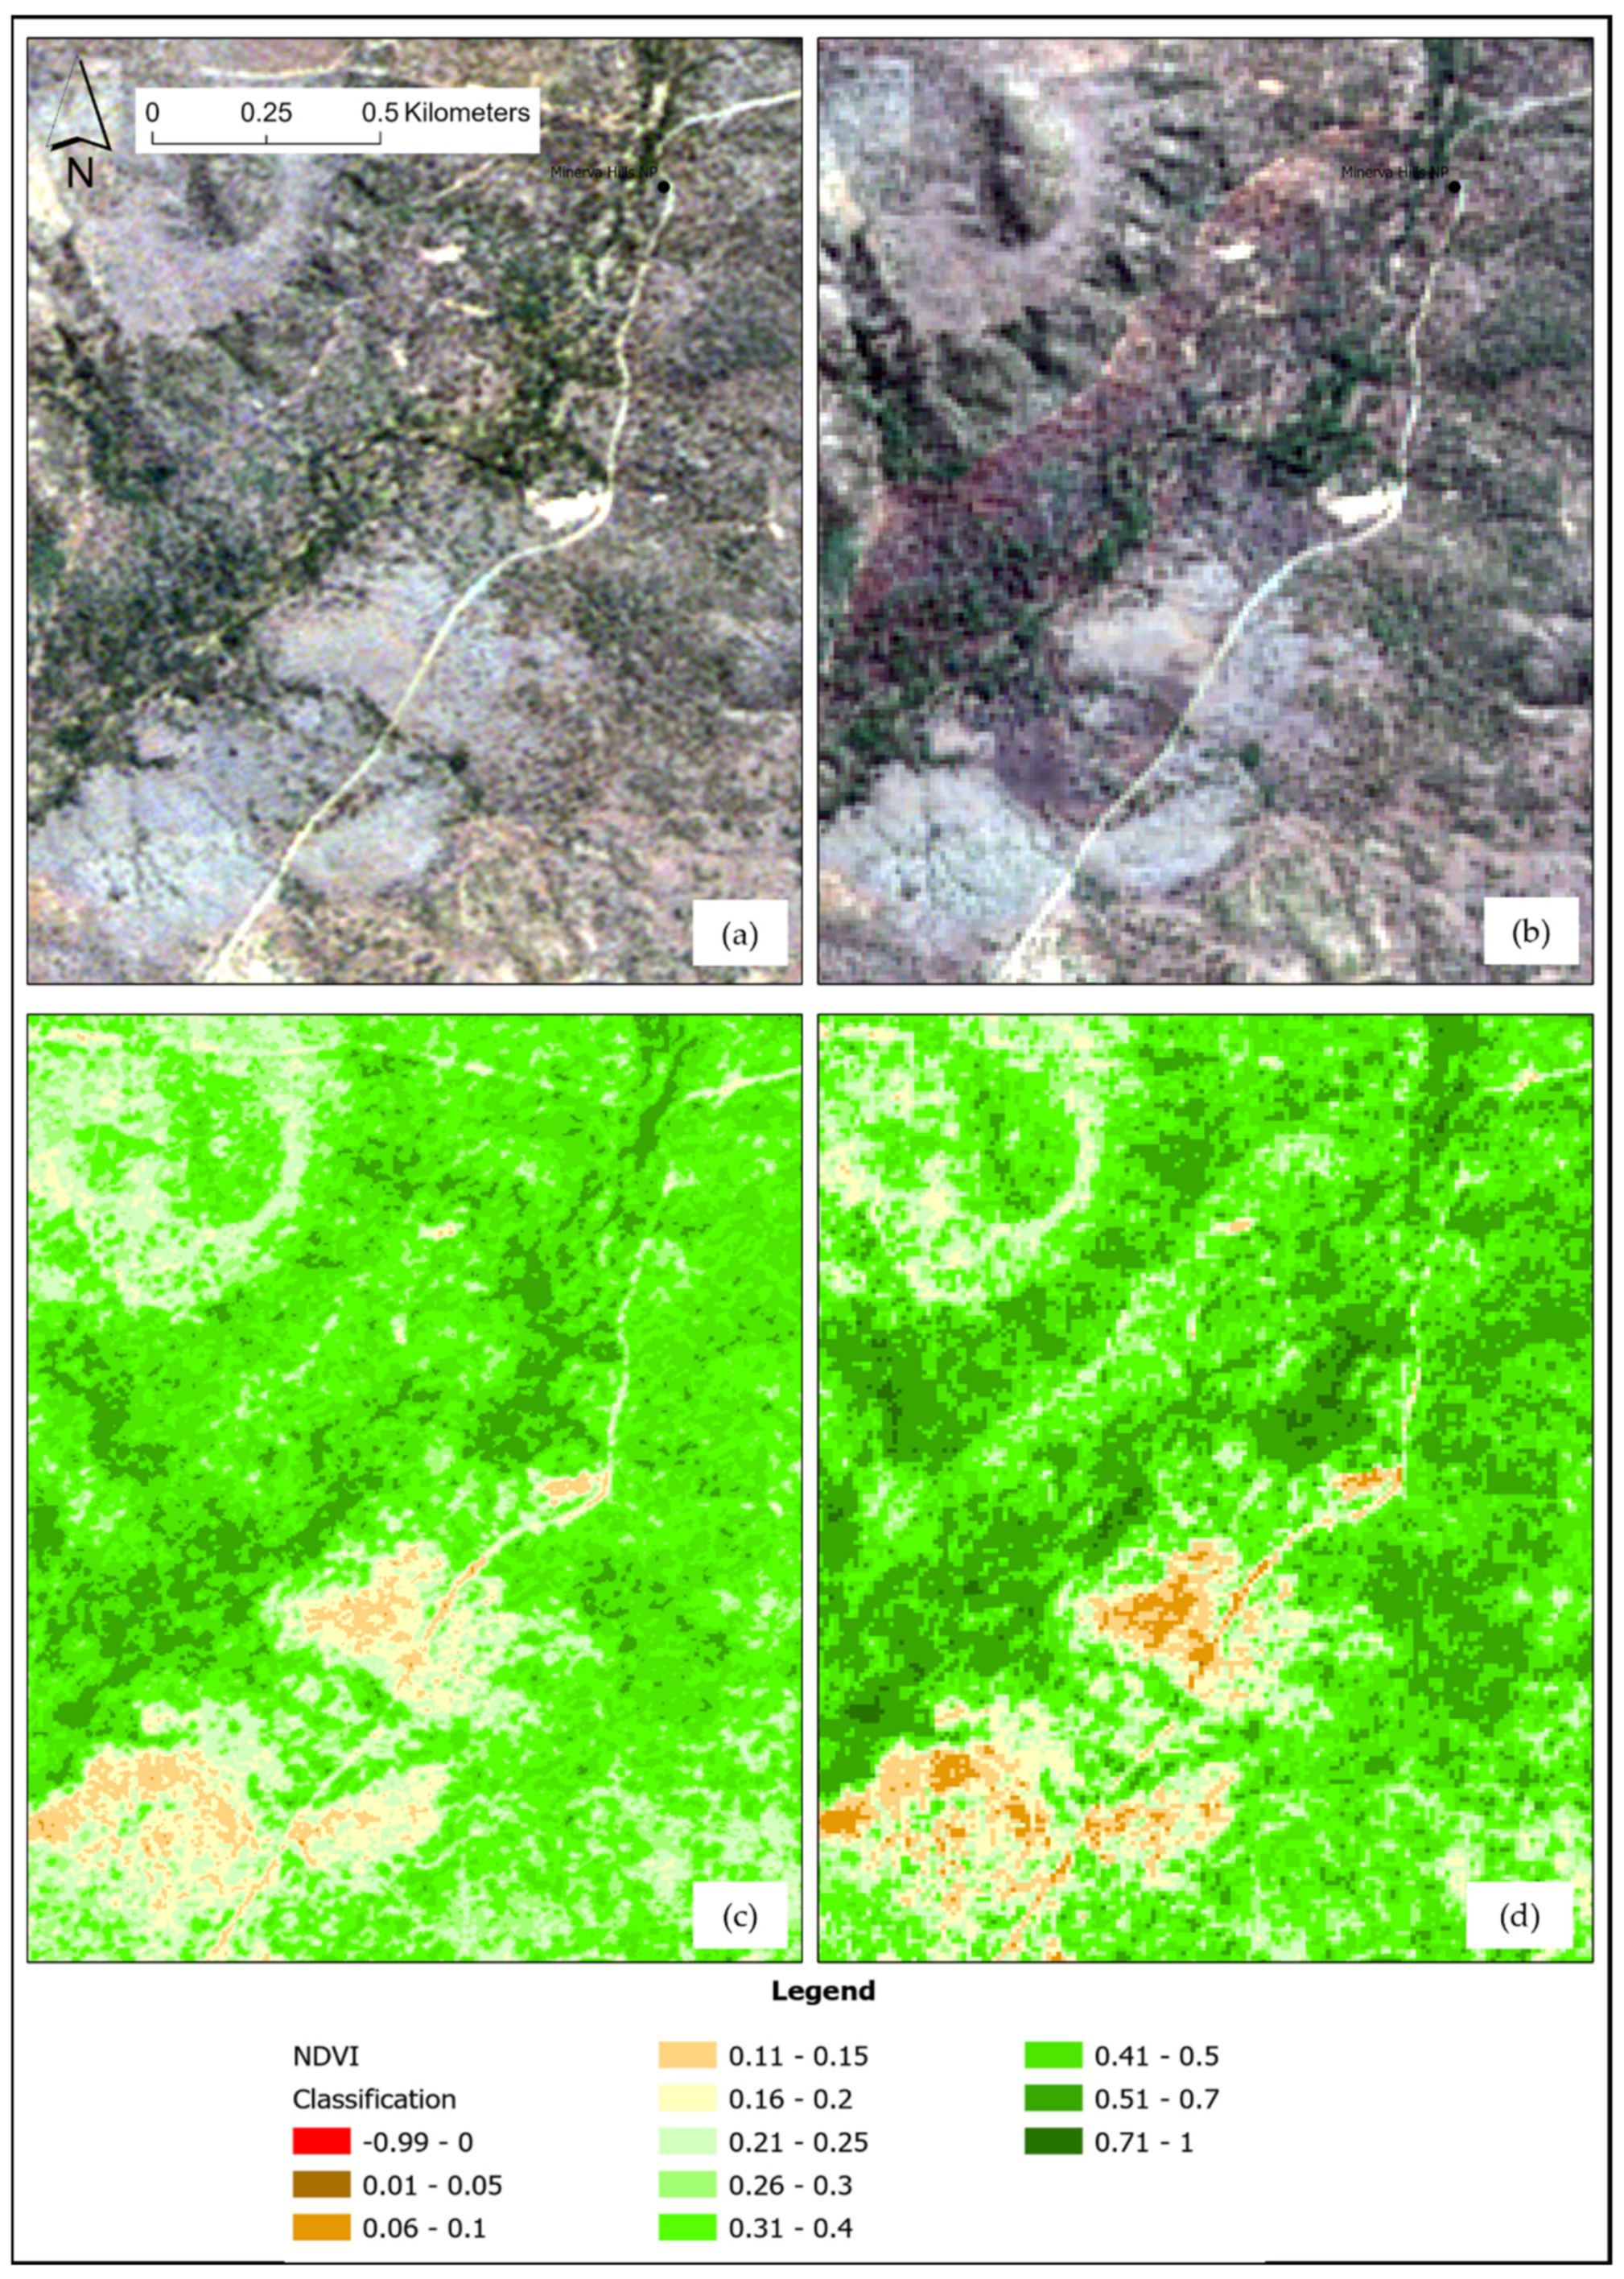
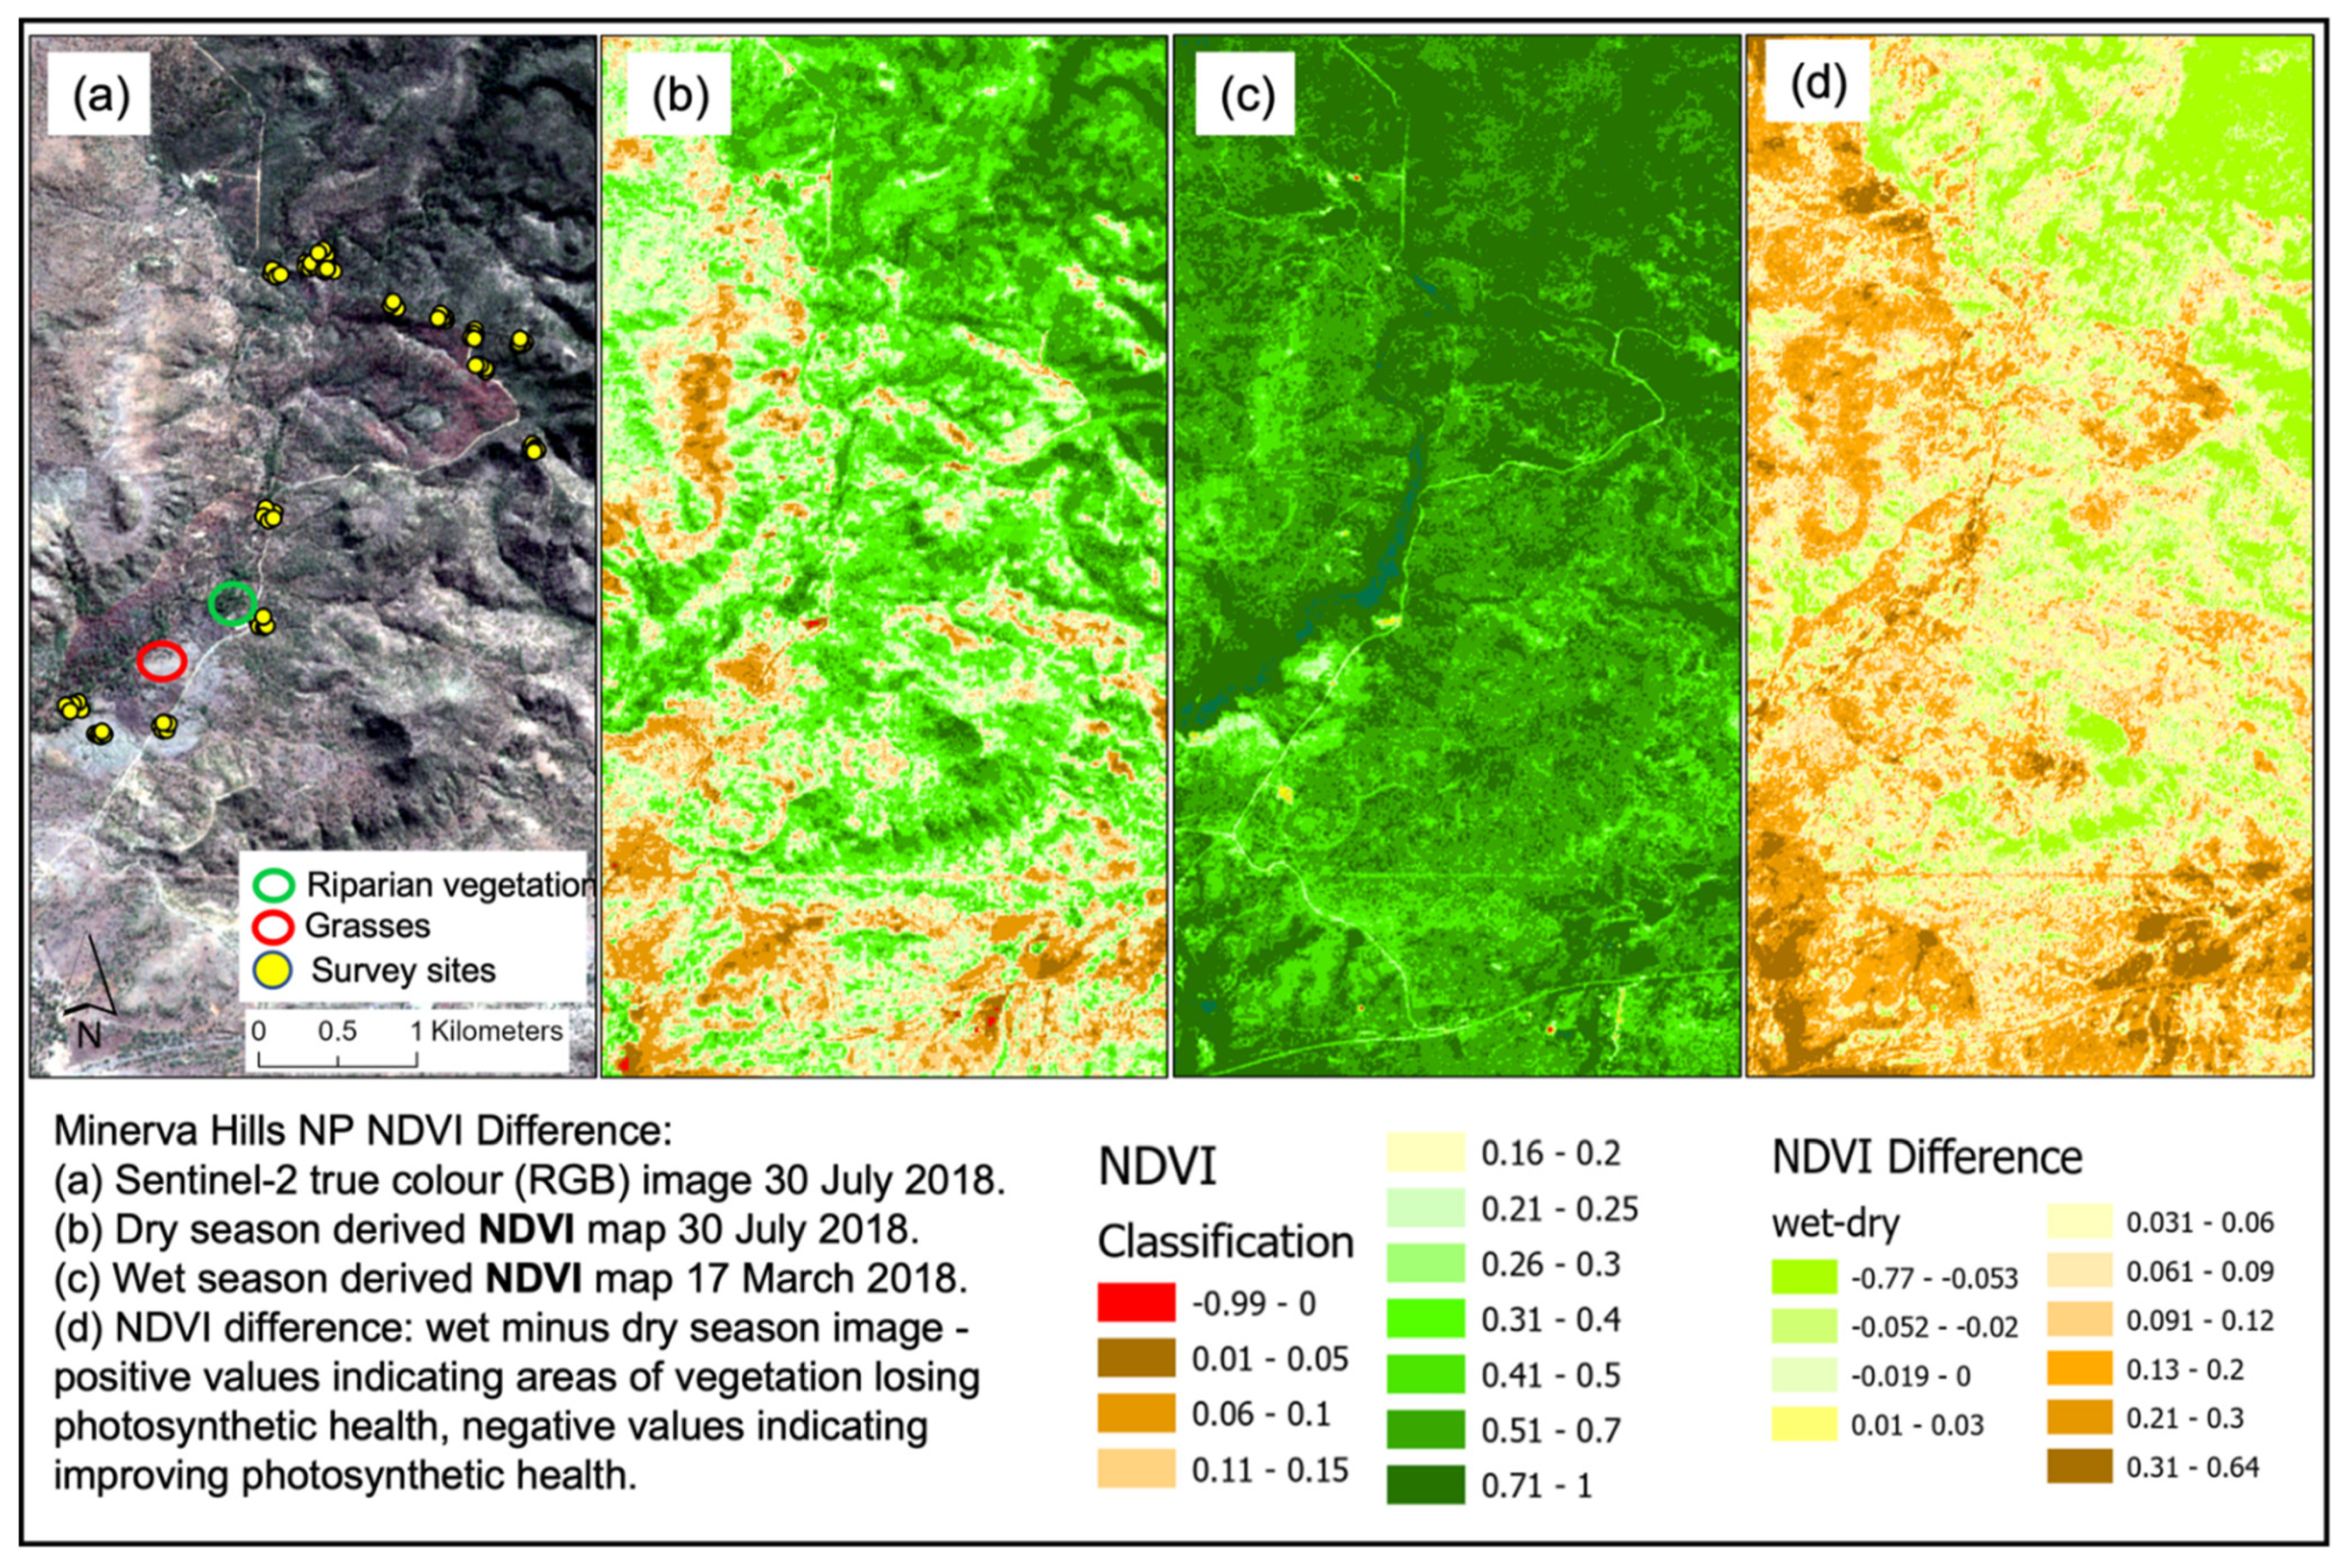
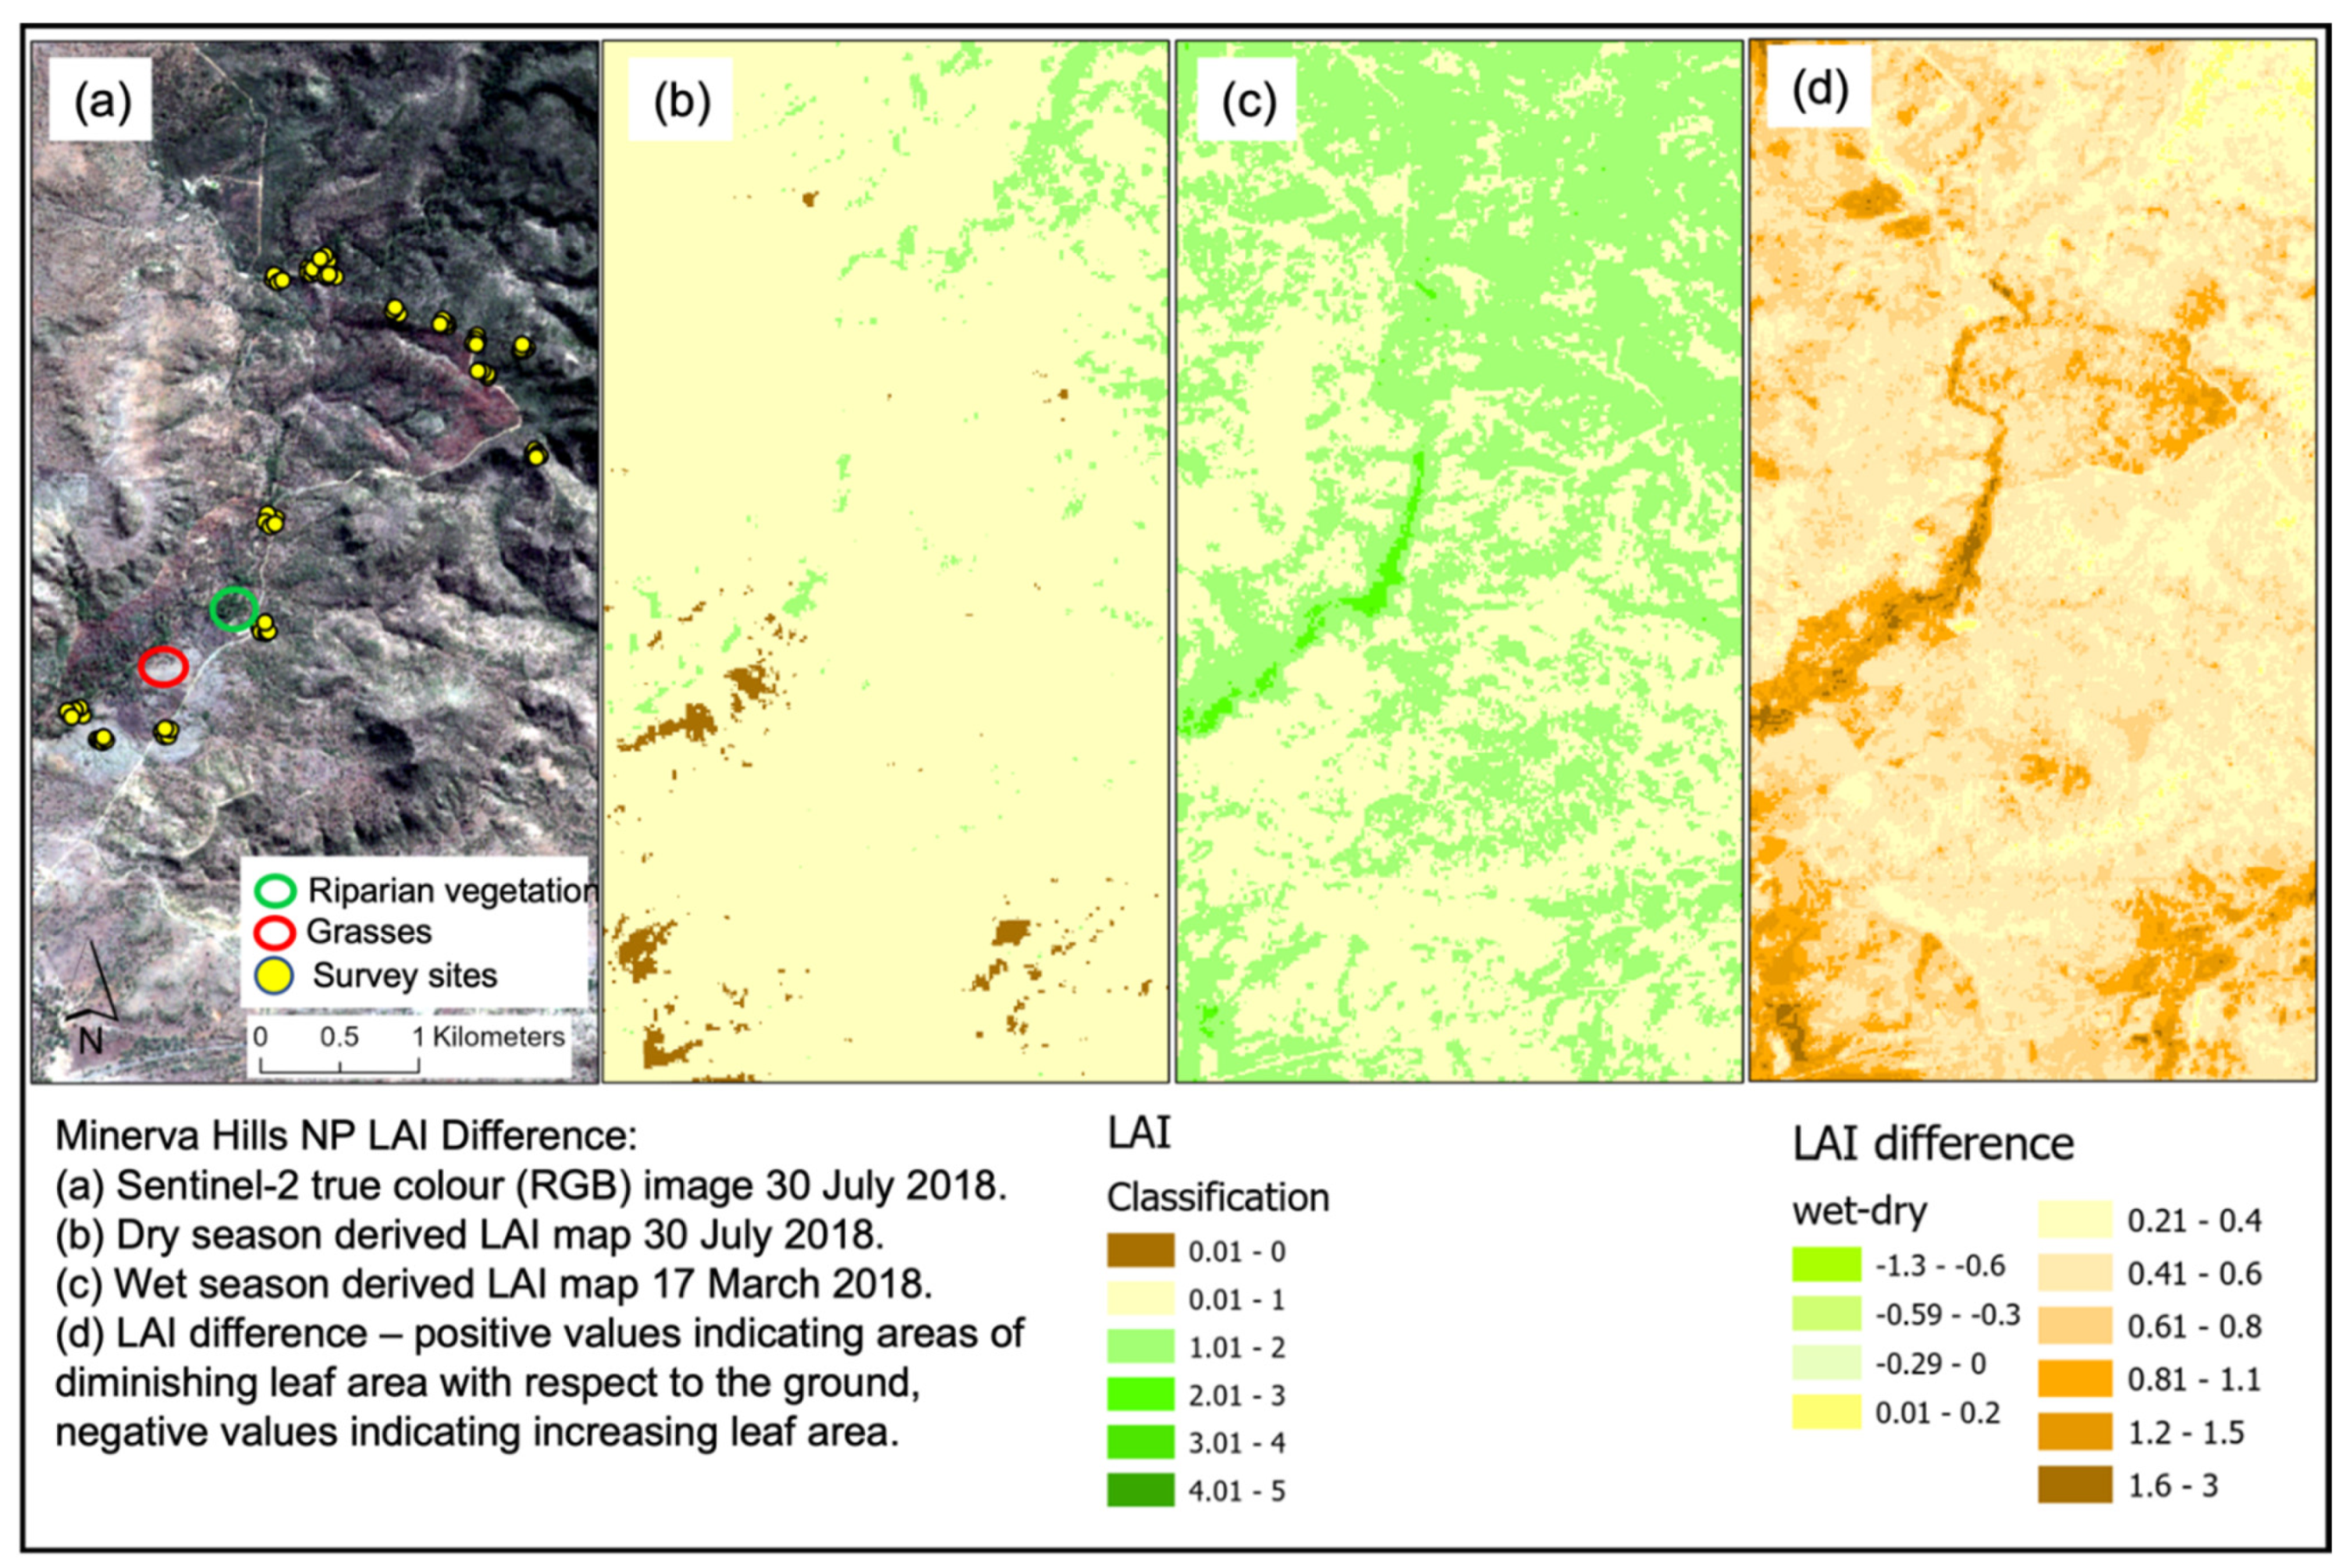
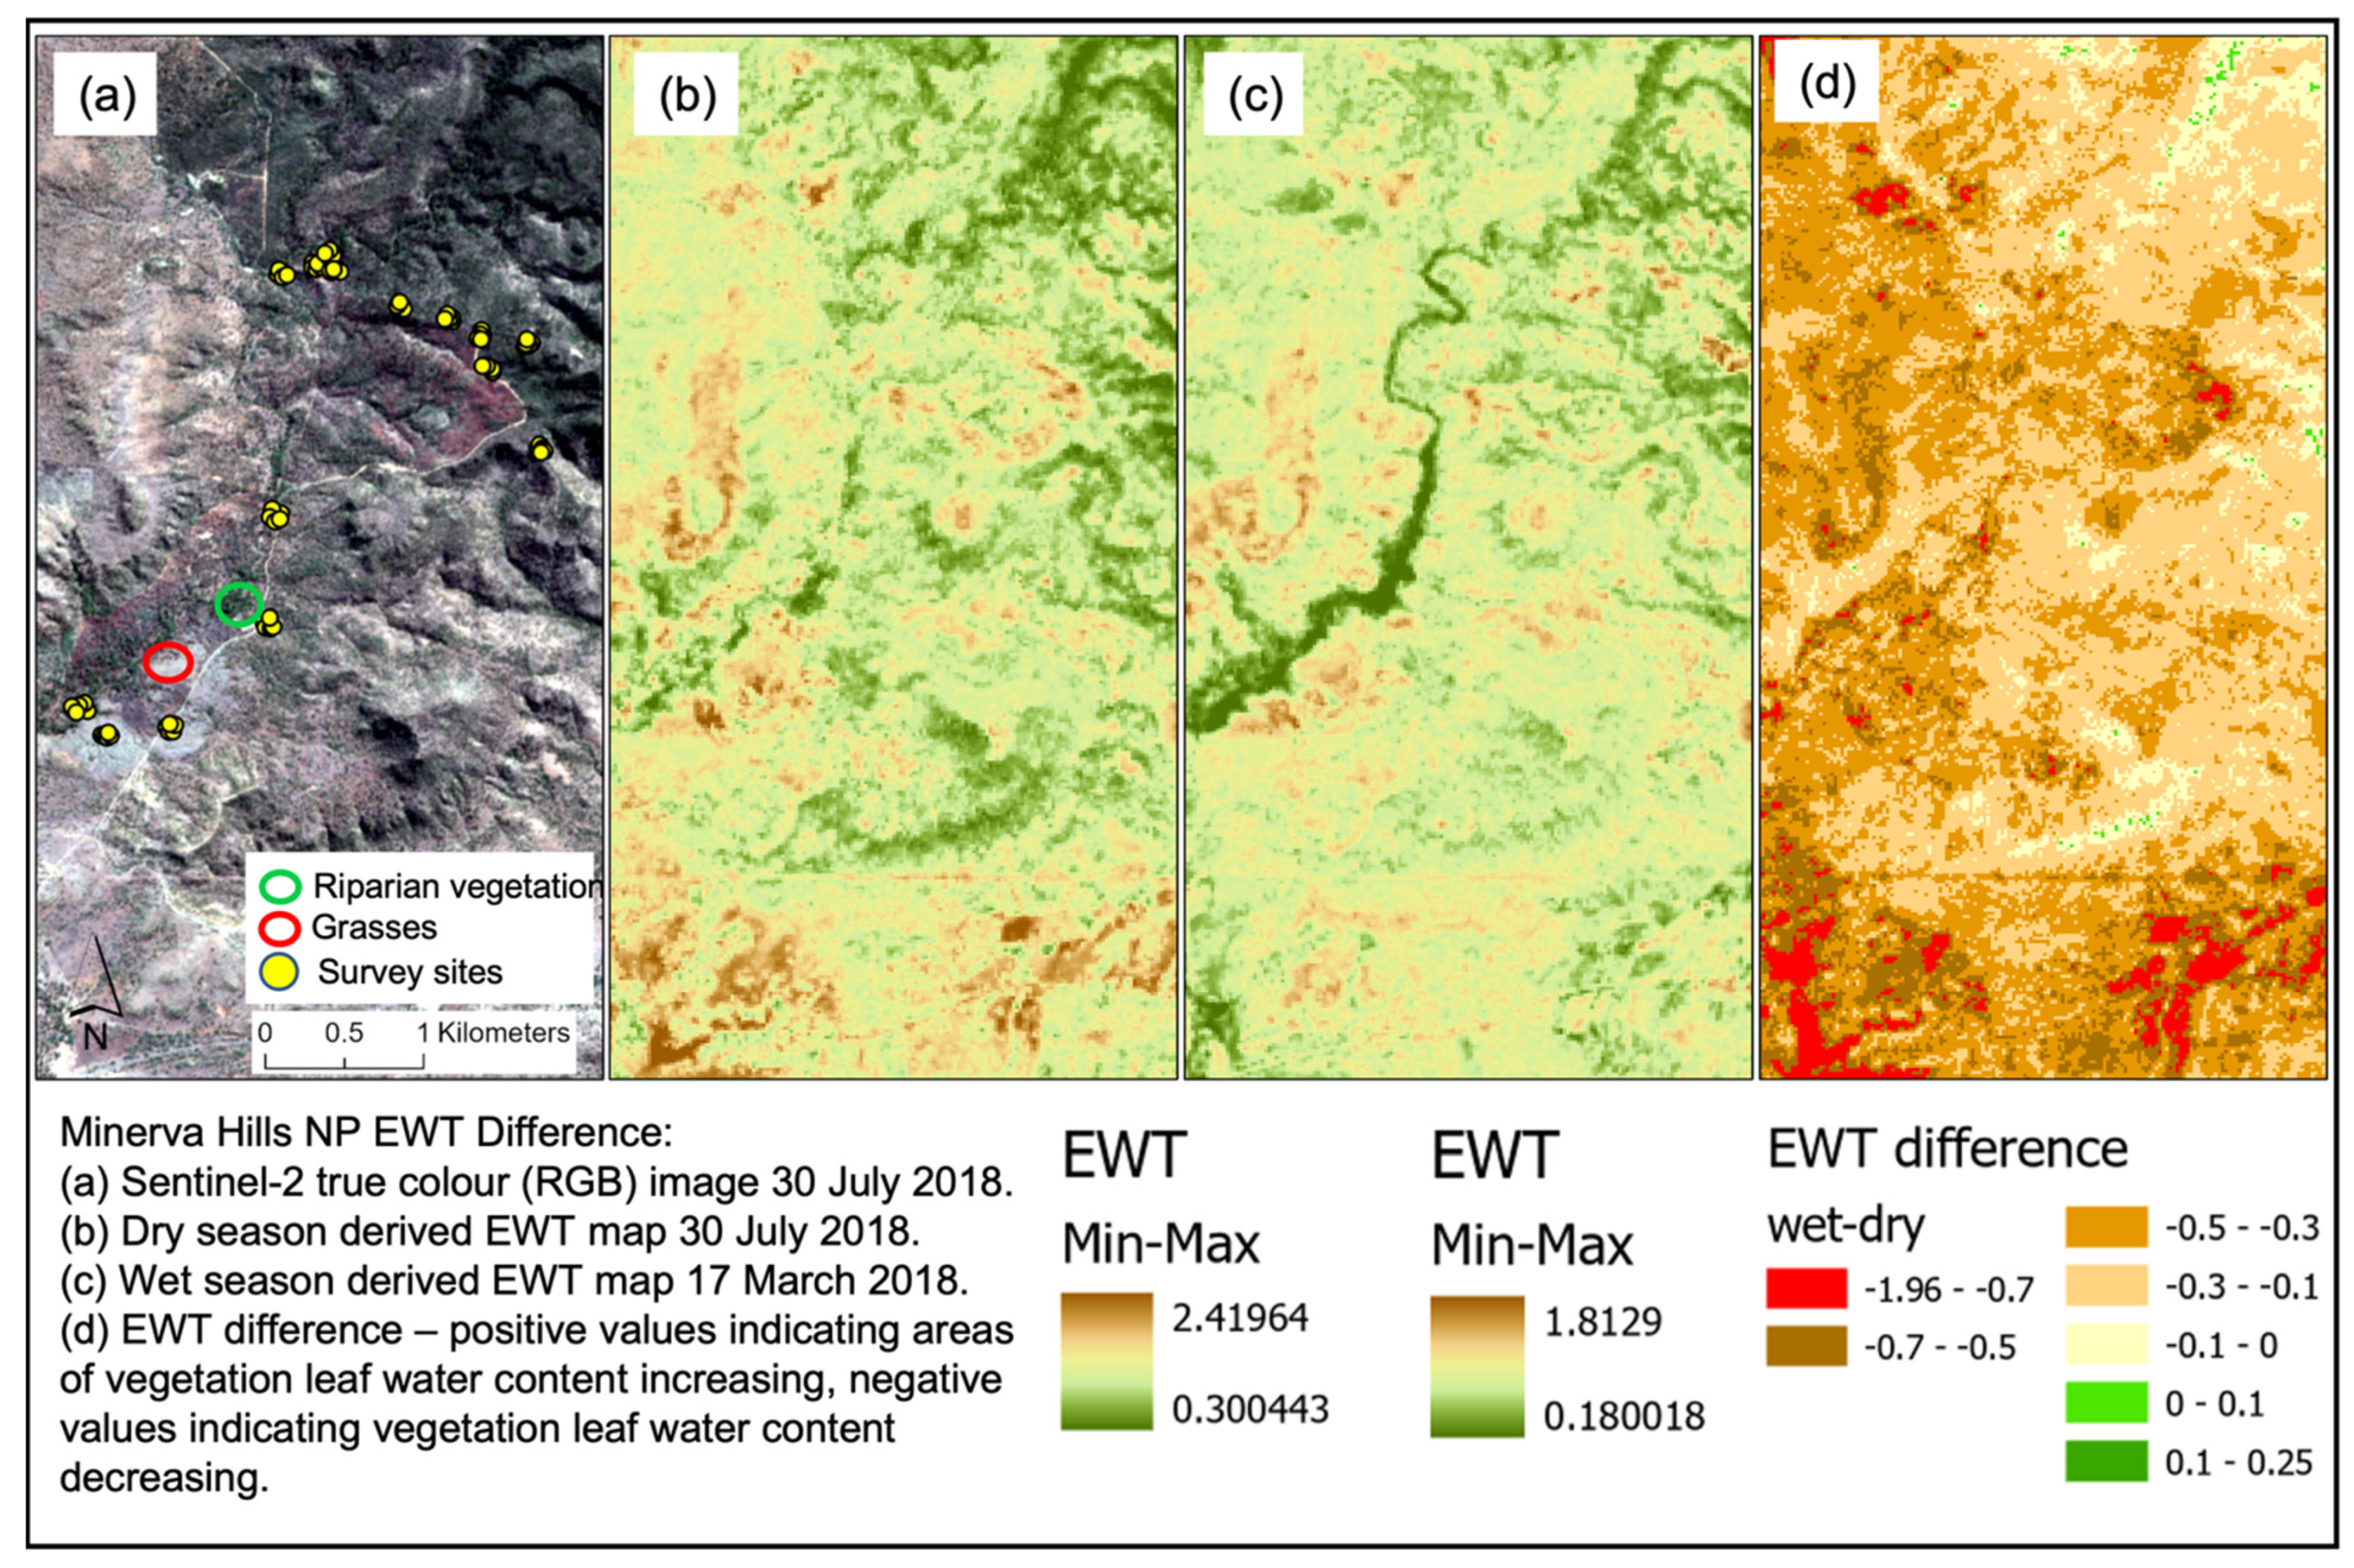
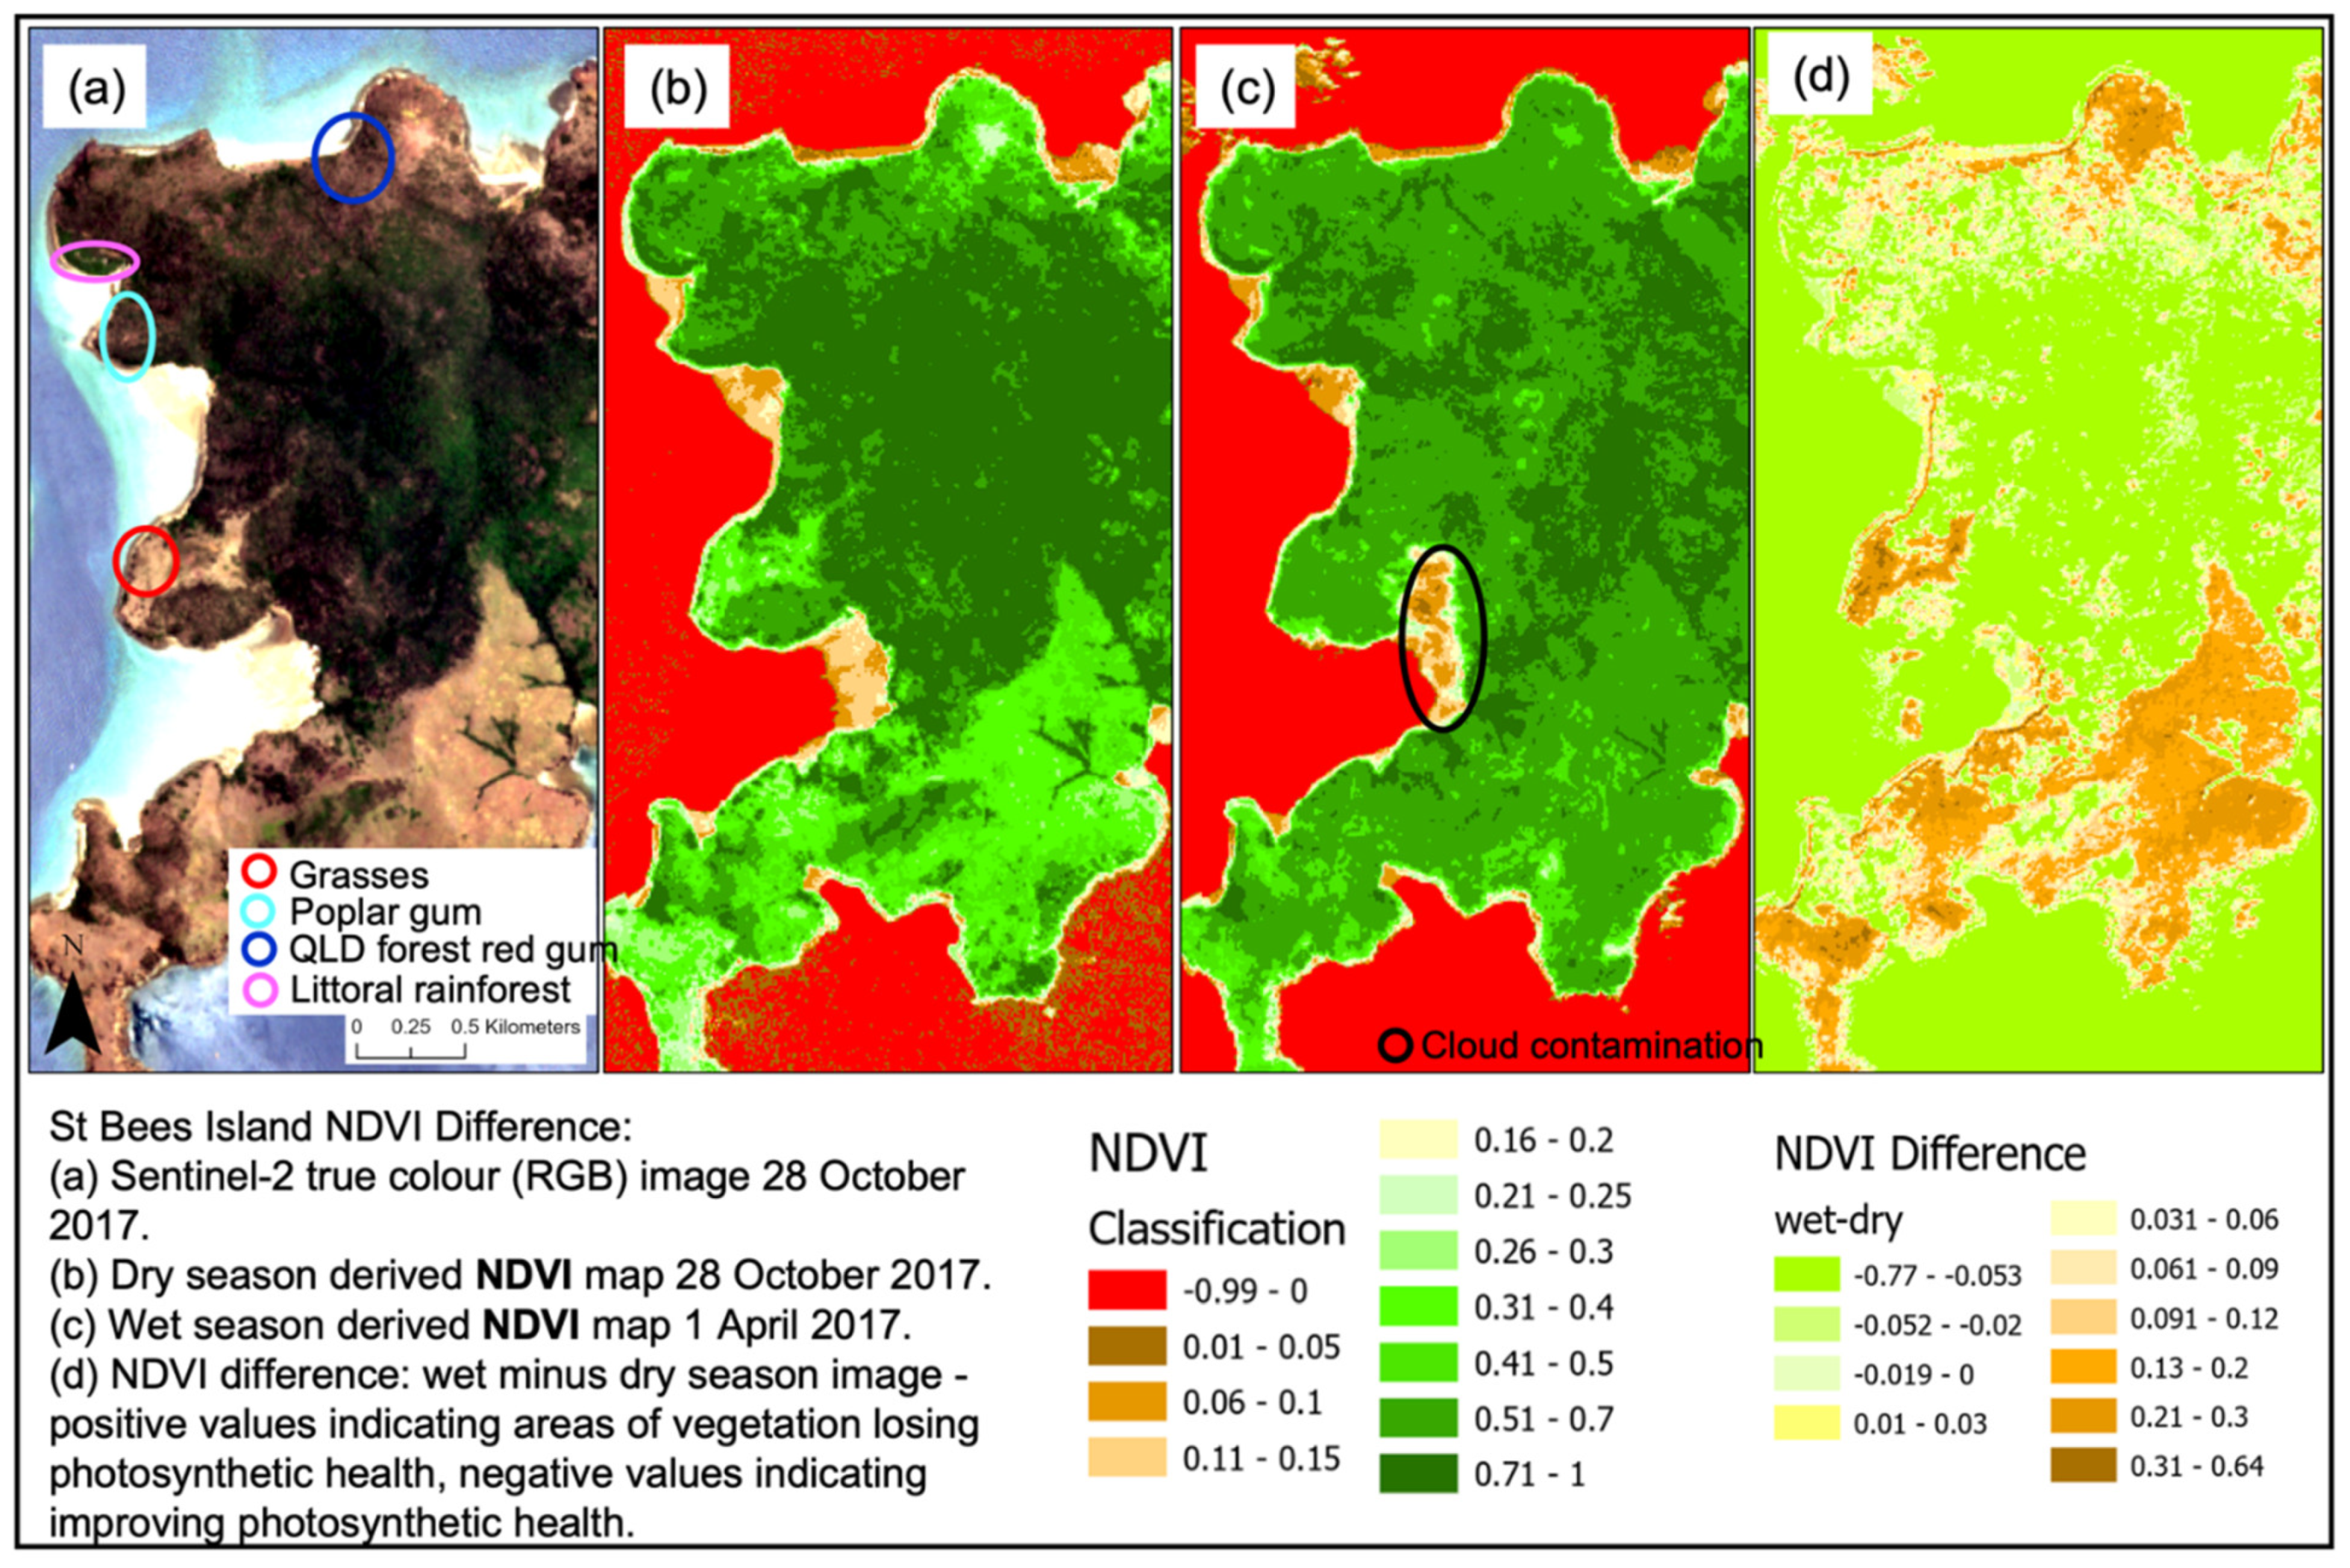
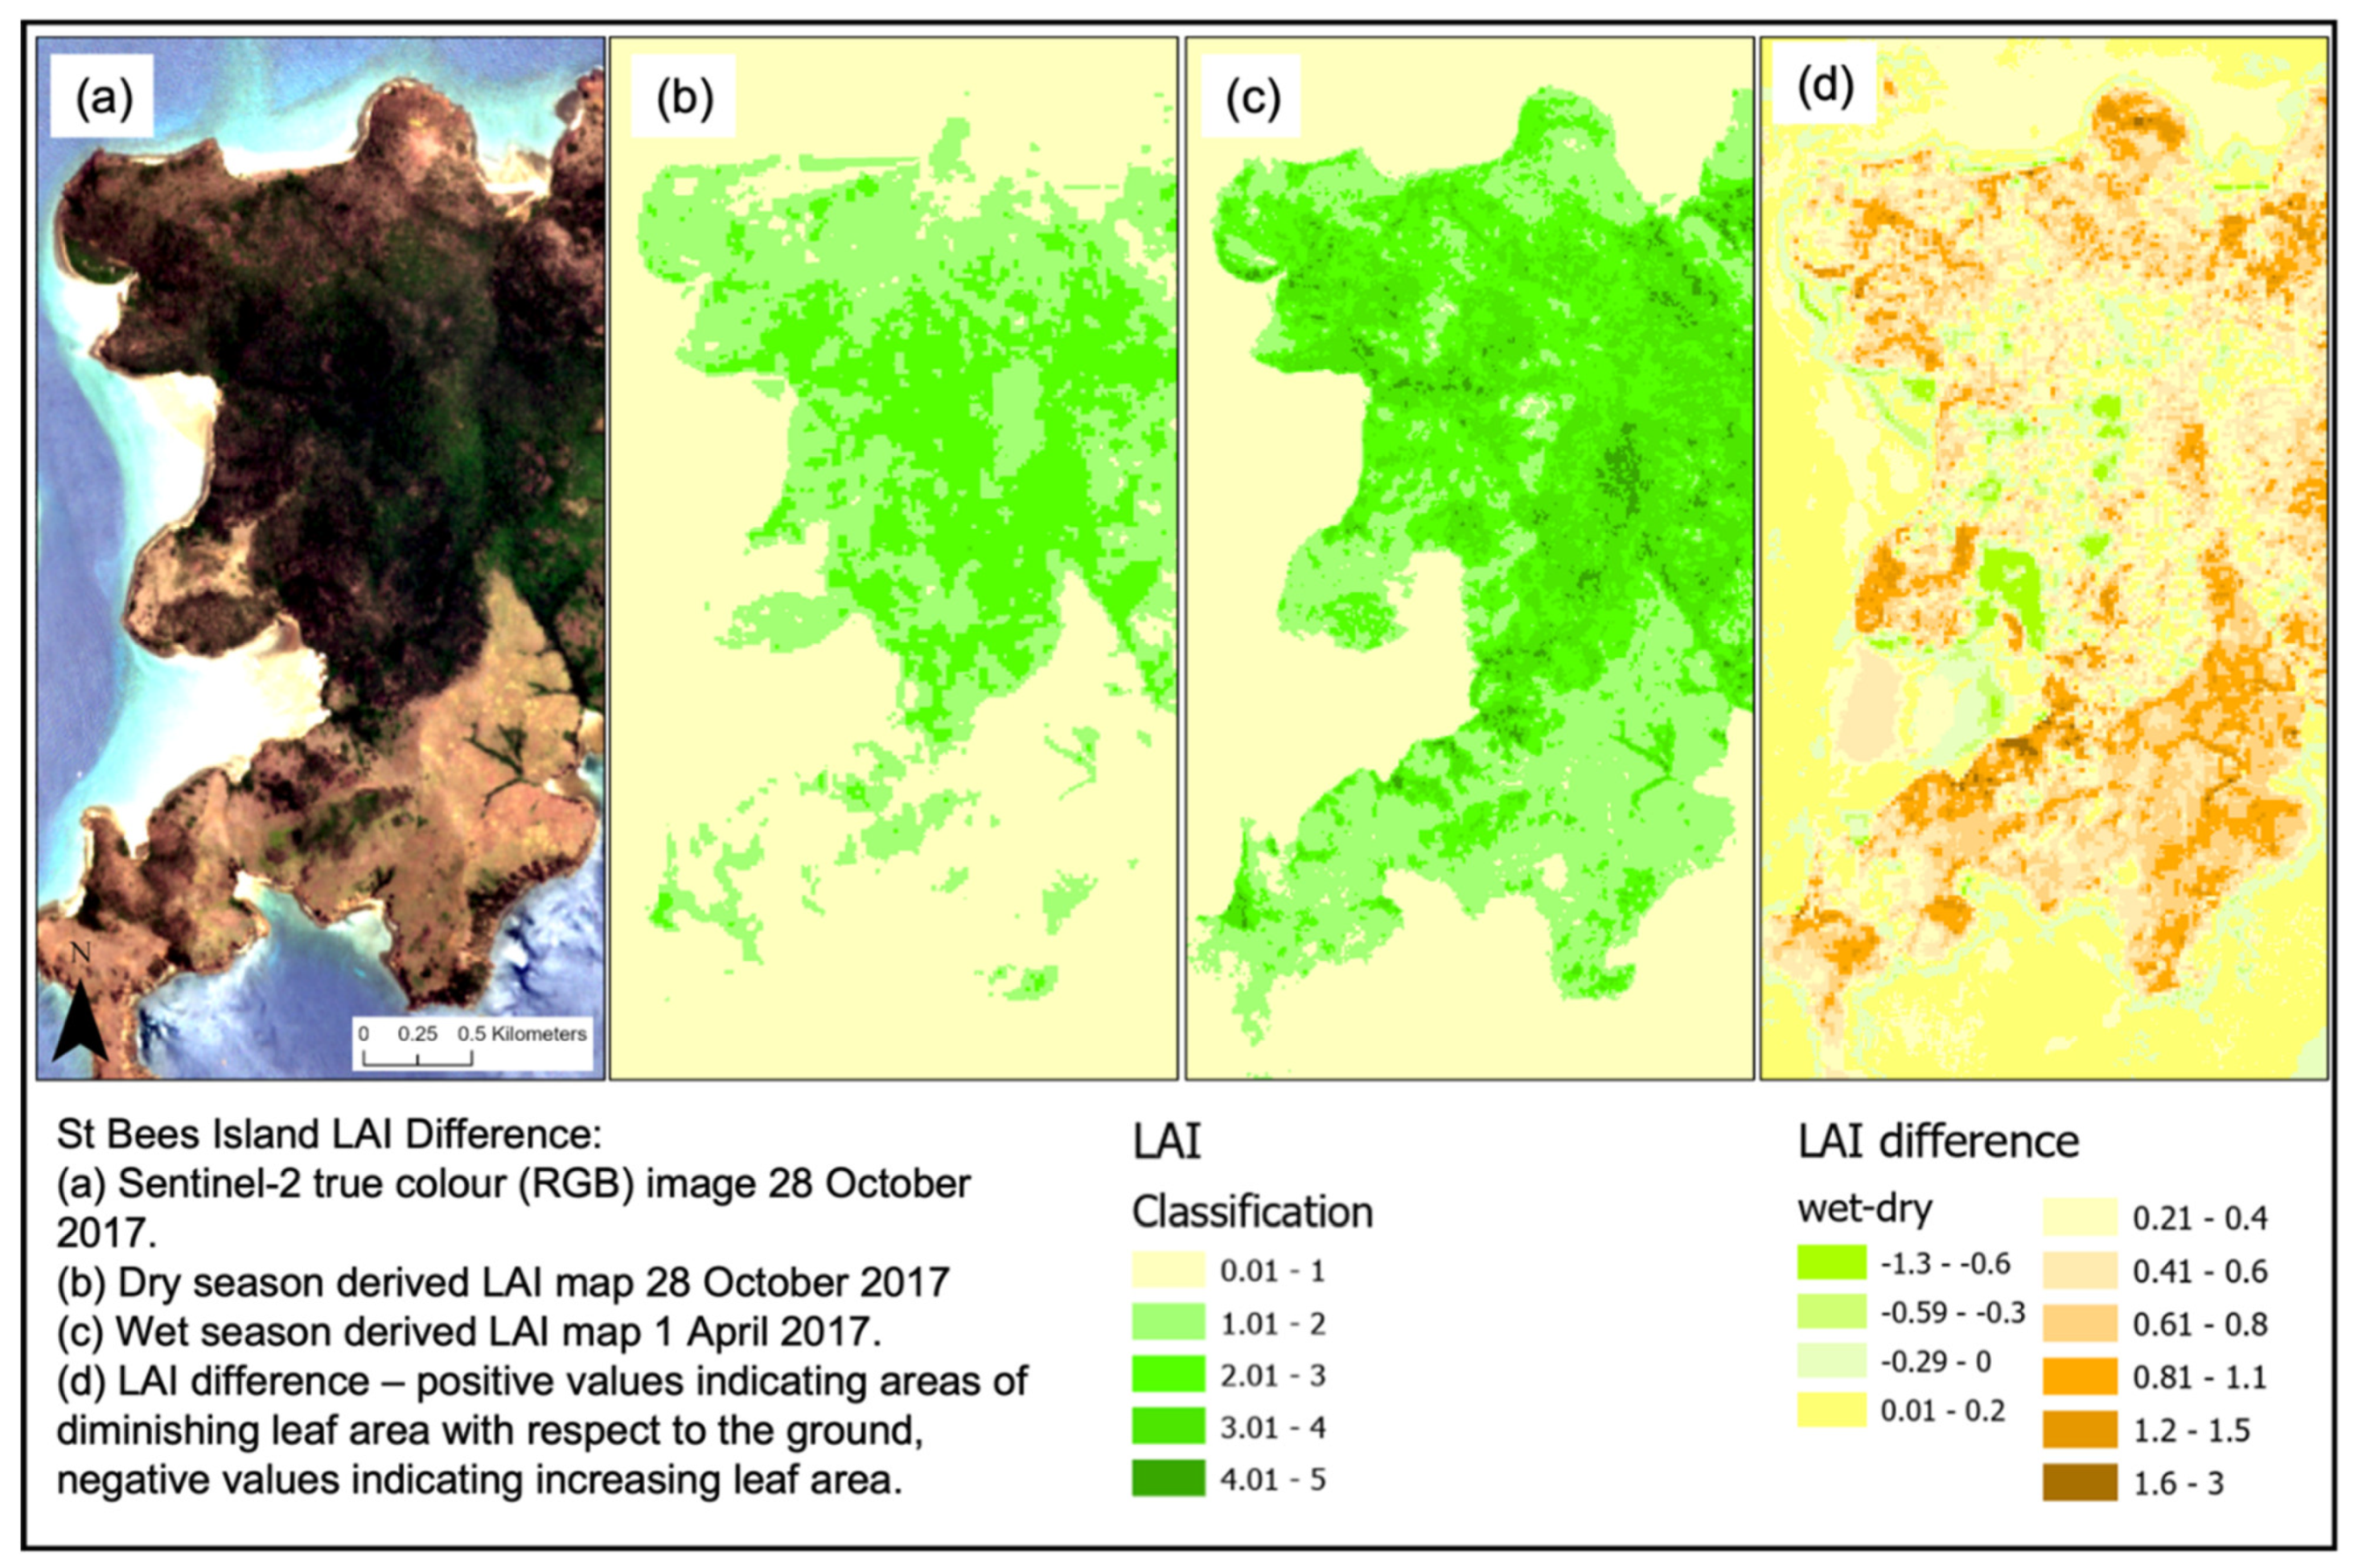
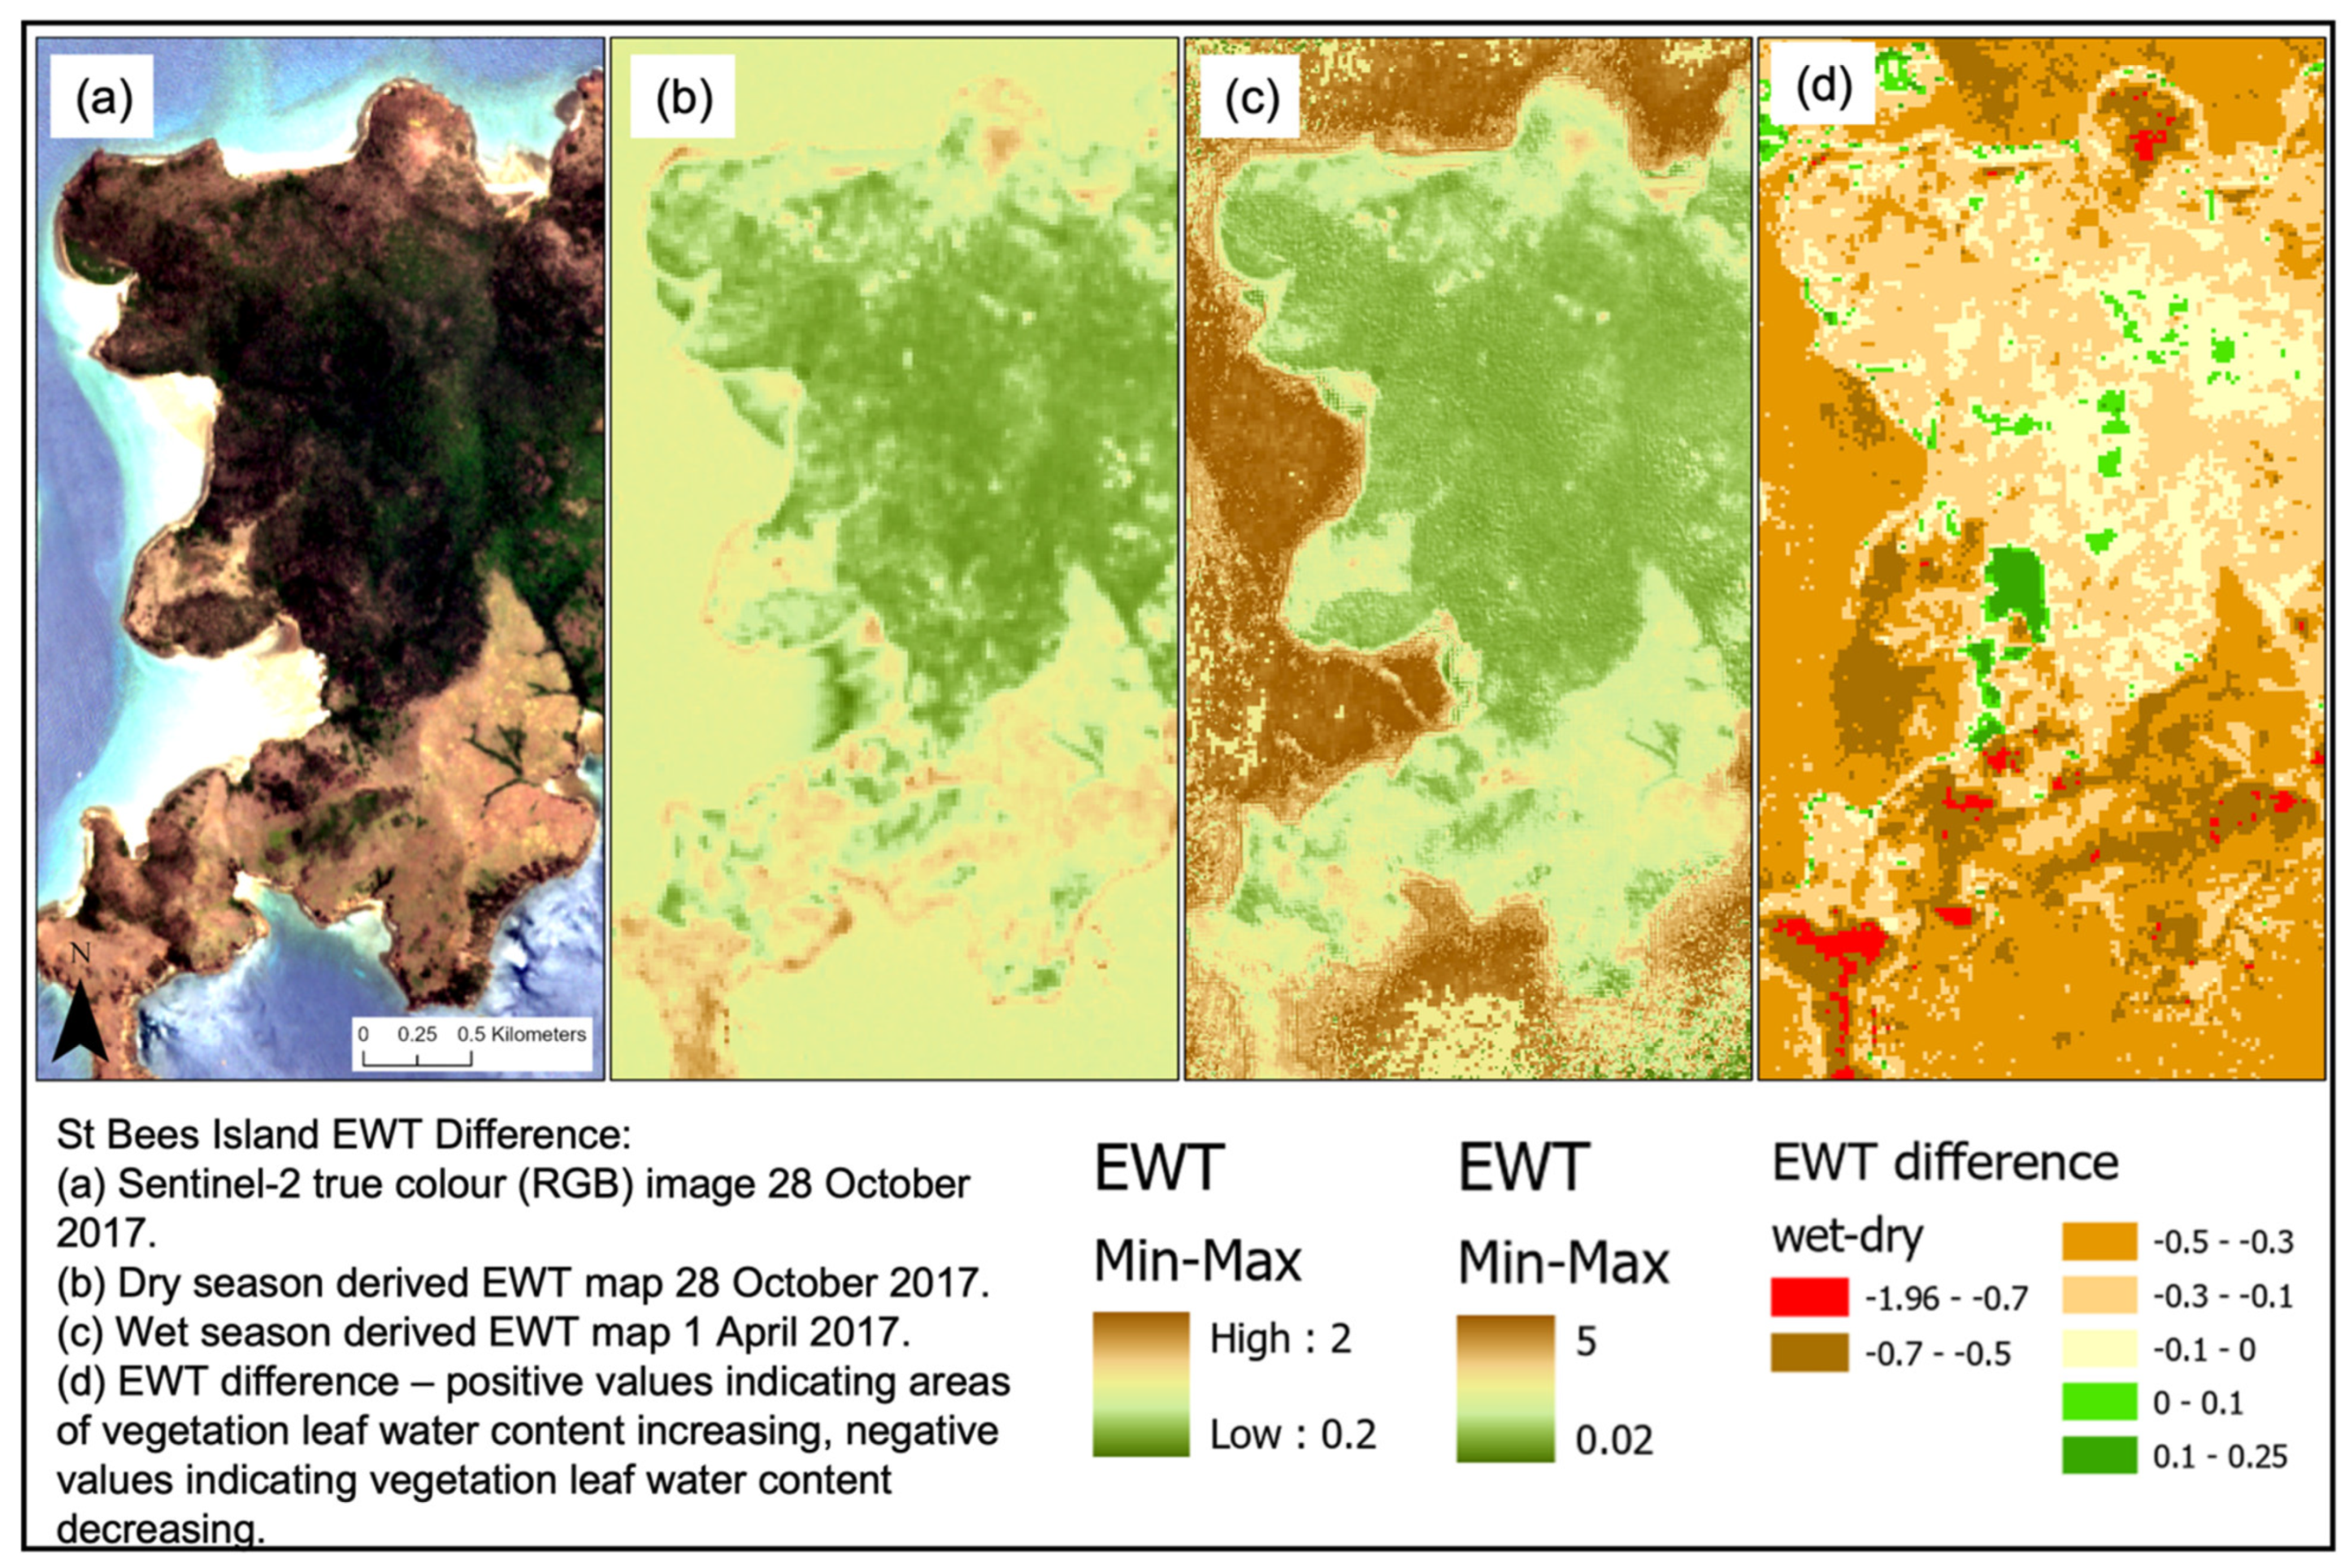
Arguably the most helpful habitat manager’s assessment from the satellite imagery is comparing images over time to understand the trend of habitat health. While a simple two image time series is shown in this present report (
Appendix D), Nouri et al. [
12] document a three image time-series analysis process called the ‘vegetation recovery rate’ (VRR). On a per-pixel basis, three vegetation index maps for three different dates (N0, N1 and N2) are processed using the ratio:
The resultant map indicates the trend in vegetation health as a single index beyond a subjective map inspection—and would be a helpful extension of the Koala Habitat Manager’s Toolbox at a later document update.
The time series analysis of vegetation indices can be similarly compared between periods of ENSO climate variation—La Nina (trending wetter for the central east of Australia), neutral, and El Nino periods. The two time/date images of
Appendix D show what type of image data would result, although limited to the Sentinel-2 archive beginning in early 2016.
A future update of the koala habitat manager’s toolbox could include recent research by Zhang et al. [
31]. They detail a process to derive leaf water content maps from the algebraic ratio of two shortwave infrared bands. Their results suggest better-correlated results than the EWT calculation undertaken in this present report.
Optical satellite remote sensing images have several limitations. This study highlights the trade-off of spatial resolution with instrument revisit schedules and their design parameters around spectral wavelengths. Ultra or very high spatial resolution images provide tree-crown scale image fidelity—but are expensive, with limited temporal and radiometric characteristics. Optical instruments also suffer from cloud contamination. The closer to tropical regions, the more likely a given image on a required date will have cloudy pixels, thus hampering vegetation health mapping.
A careful review of the
Appendix D images and maps will indicate that terrain shadow creates skewed vegetation index values—an artefact of land aspect light interaction and thus varying degrees of insolation available to be measured by the satellite. The remote sensing literature includes terrain shadow correction images [
9], but these require advanced processing not available in SNAP. Furthermore, an experienced habitat manager will soon subjectively correct their assessment of vegetation health for this anomaly as a matter of experience.
For this present research project, RPAS-hosted instruments have been intentionally left out of the project scope. On the one hand, RPAS offers unprecedented spatial resolution and can be deployed to suit the monitoring requirements of a habitat manager. On the other, using an RPAS to cover the same spatial extent as a satellite would be an arduous, expensive, and long-term project commitment. Furthermore, the use of RPAS does not meet the financial user requirements perspective inherent in this present study. The hardware and image processing software is expensive, as is operator training and (in Australia) Civil Aviation Safety Authority accreditation. Furthermore, the availability of RPAS payload instrumentation with shortwave infrared bands to map EWT is limited.
