1. Introduction
Space syntax includes both a set of theories and tools for describing, analysing and understanding the spatial configuration of cities, buildings and spaces. The initial question posed by space syntax was whether the arrangement of urban forms had an impact on levels of street use, thereby developing an objective measurement investigating the complex relationship between the static, spatial attributes of cities and the dynamic patterns of human activity. At present, empirical studies have proven positive correlations between spatial configuration and the presence of pedestrians, proposing alternative approaches and measurements for walking via space syntax terms [
1,
2,
3,
4,
5]. While using space syntax to investigate the patterns of pedestrian movement and walking behaviour is useful, it is often criticised as reductive and embodied in the premise that physics can explain almost everything [
6]. Given this, we argue that such studies which focus on the relationship between static spatial configuration and dynamic pedestrian behaviour, characterise walkable space as ordered, measurable and unified, meaning that space is considered on the basis of a particular logic and rationale, but which may fail to take account of people’s heterogeneous actions and behaviours in daily living.
Recent studies note that street vendors as a characteristic feature of many neighbourhoods frequently appropriate spaces where many people regularly walk, particularly in many cities of the Global South [
7,
8,
9,
10,
11]. The ubiquitous phenomenon of street vending attunes to time-related demands of a heterogeneous pedestrian body, leading to ever-changing spatial attributes, and its spatial distribution can be seen as an alternative way of mapping and understanding pedestrian movement [
11,
12]. In other words, mapping street vending locations appears to be another way of subjectively understanding pedestrians and walking behaviour, which can be compared with the quantitative and objective approach of space syntax. Therefore, we are intrigued by understanding the nuance between the two phenomena of spatial configuration and street vending distribution in relation to pedestrian movement.
Apart from investigating pedestrian movement, space syntax is used in obtaining an understanding of economic activity and land use value in a place. Prior to space syntax, most pedestrian movement models were thought to depend on the notion of ‘attractors’, such as shops and retail malls [
13]. However, the proposition of ‘natural movement theory’ indicates that the configuration of the urban grid is the primary generator for human movement if other things are equal [
14]. Hillier (1996) further proposed that urban spatial configuration impacts land-use distribution by attracting movement-seeking activities [
15]. Land-uses, in turn, attract more movement, leading to a ‘spiral of multiplier effects’ [
16] (p. 5) or a ‘positive feedback loop’ [
15] (p. 53). This cyclical process is called ‘movement economy’. For instance, one study in Santiago indicates that street market locations were almost three times more likely to be found in streets with the highest Integration/Choice values than the rest of the city on a global scale [
17]. Another study in Beijing suggests that most food markets (89 out of 183) were registered at locally well-integrated streets (top 10% highest axial integration); with 12 markets directly opening onto streets with the top 20% highest Integration value within the middle-scale network [
18].
Street vendors not only relate to pedestrian movement but also belong to urban economic activities. Some studies note that street vendors can perceive alternative features of physical settings in a specific place (e.g., time-related demands of emerging pedestrians), and they focus on local demands to operate an ephemeral and transient market space at the local scale [
19,
20,
21,
22]. Namely, the static built environment and regular land use become uncertain and ever-changing caused by the temporal appearance of street vendors. As a result, we argue that space syntax can be used to analyse the informal, fluctuating economy of street vending, and that analysis at different scales might produce novel meanings nuanced to spatio-cultural identities. The mobile and temporary nature of street vending can be an alternative way of understanding spatial configuration and pedestrian movement in relation to the social logic of transient space.
In addition, the meanings and concerns of space syntax differ from conventional walkability research, and these differences have been rarely discussed. First, Hillier et al. (1993) argue that the street network is the primary generator of pedestrian movement [
14], while Cervero and Kockelman (1997) consider that three environmental factors of ‘Density, Diversity and Design’ mainly impact walking behaviour [
23]. As with other mainstream studies on walkability, the latter theory purports that the correlations of walking behaviour to spatial attributes are multiple and complex, including different environmental factors and socio-demographic characteristics at the neighbourhood scale [
24,
25]. Hillier et al. (1993), however, principally focus on the interdependent relationships between streets within a large network [
14]. They contend that places are not local entities; instead, they are influenced by or connected to different areas through a larger street network in a holistic way [
15]. For example, Baran et al. (2008) found clear relationships between the number of recreational walking trips and the spatial configuration of a network, suggesting that walking behaviour may be impacted beyond the local scale [
26]. Therefore, the two fields for investigating pedestrians have different foci which tend to operate at different scales.
Secondly, the two fields use some similar terms but with diverse implications in measuring environmental factors. For instance, space syntax studies measure street connectivity as how many streets directly link to a given street. Hillier and Iida (2005) have evidenced that people prefer high-centrality streets with less angular changes and topological turns (i.e., less cognitive efforts) when moving from one place to another, rather than the short distance between interconnected nodes within a particular area [
27]. However, Mecredy et al. (2011) note that a walkable neighbourhood often has numerous intersections with a short distance (i.e., high street connectivity) [
28]. As such, it is possible to confuse two neighbourhoods if both have the same sum of turns, but the intensity and distance of intersections between the two differ. Also, Ratti (2004) critically argues that most people who are familiar with their nearby living environment would probably prefer the shortest path for walking over longer, more circuitous but well-connected pathways [
29]. Thus, it appears that findings based on space syntax analysis need to be supplemented by the perspective and experience of walking on behalf of local residents.
Besides, Pafka et al. (2020) raise the issue that most students consider space syntax as an end in itself rather than part of a broader approach to urban analysis [
6]. Furthermore, as a result of an incomplete understanding of its theory, they can often confuse measures, particularly the key terms of Integration and Choice. Integration represents the potential of a street to act as a potential destination from other streets in the network (i.e., how easily one can travel to that space). In contrast, Choice calculates the potential for streets to act as part of a route between an origin and destination with the least possible angular deviation [
30]; or in effect, ‘how much traffic is typically liable to pass through that space’? In space syntax theory, the former is also called ‘closeness centrality’ representing potential ‘to-movement’, and the latter is termed ‘betweenness centrality’ indicating potential ‘through-movement’. These terms have different names but the same meanings, which are often confused by students and less experienced practitioners. Furthermore, Vaughan et al. (2010) noticed that the locations where the Integration and Choice values closely corresponded were the ‘active centres’, in which movement-seeking activities tended to be situated in generating a large population as having a ‘co-presence’ [
31]. This is called ‘combined centrality’ in our study. We aim to avoid unnecessary jargon and interpret our results through the perspective of real-life situations and local everyday life, to understand better how city life emerges via space syntax in line with the insights in the ‘Social Logic of Space’.
In China, compared with large cities, small cities are often overlooked by the central government as a result of their large number and typically less important position [
32]. Hence, small cities often develop more organically according to the real-time needs of local residents; in addition, informal spatial practices, such as street vending, are usually less controlled by the local government [
33]. There is a need to investigate the spatial logic of street vending distribution in low-tier Chinese cities, where the urban form is more spontaneous than in big cities, and the government has less intervention or control over street vending locations. Also, we are aware that even in the same city, this situation might be more intensified in suburban areas, compared with the city centre. Namely, the social logic of spatial practice needs to be further distinguished between urban and suburban areas in the same city.
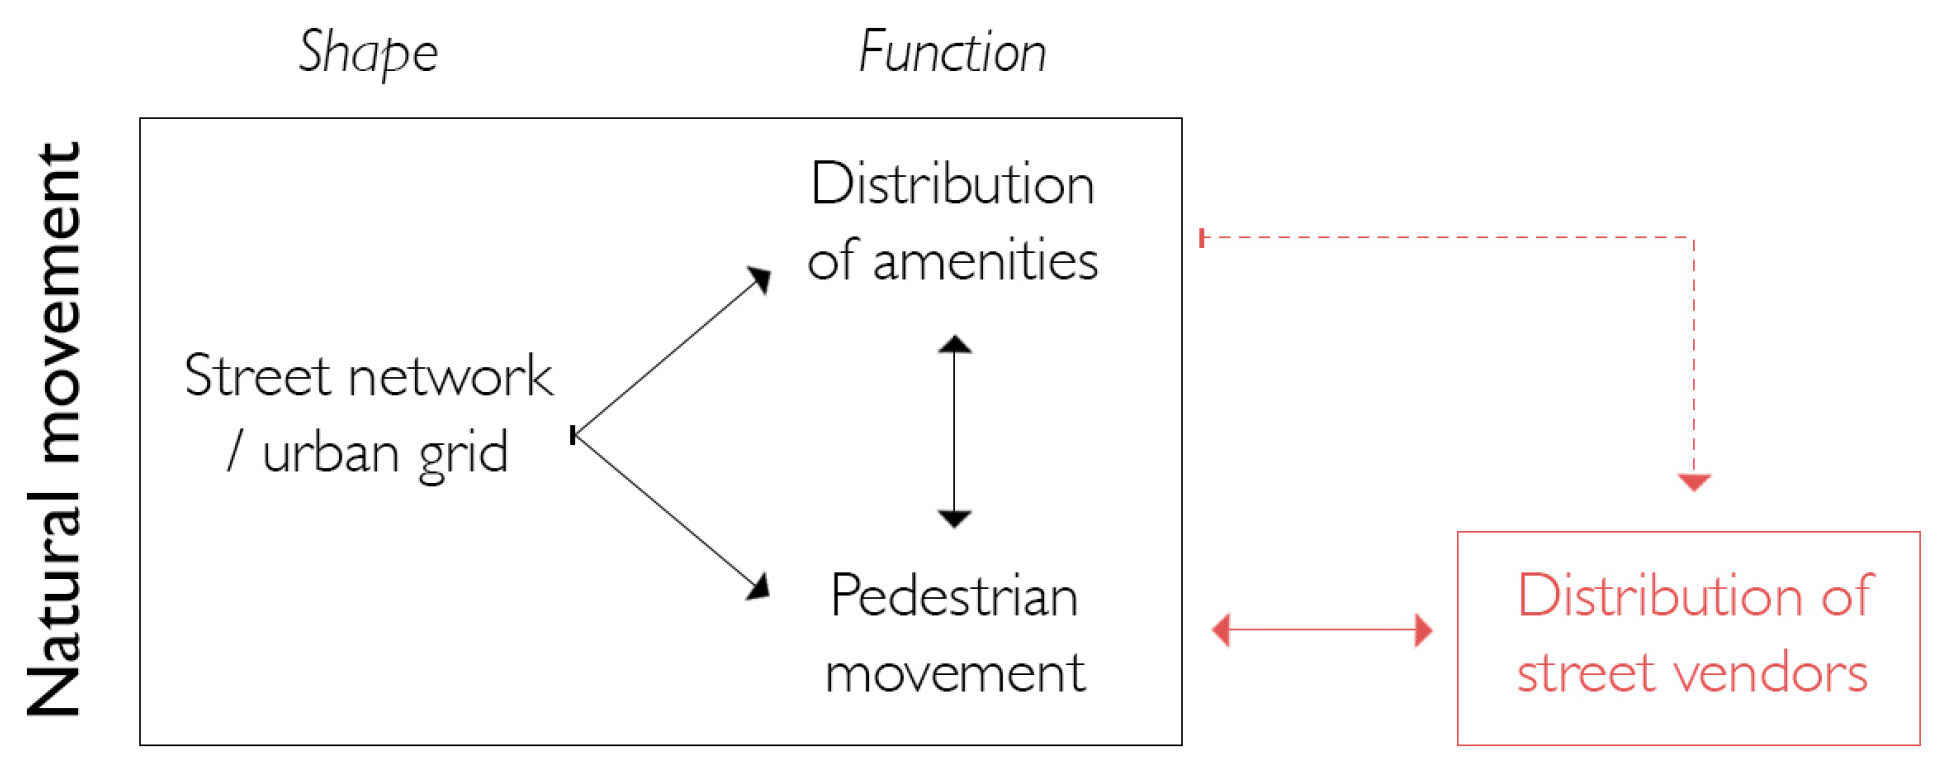
Based on the principle that street vending as an informal economic activity is likely to be produced by a high pedestrian movement that is related to the high integration of the street network, this study unpacks an understanding of spatial practice generated by studies of space syntax and street vending distribution in a low-tier Chinese city, Yuncheng. In turn, it then explores how these outcomes relate to each other and to walking behaviour (
Figure 1). By focusing on two representative spaces in urban and suburban areas, the nuanced roles of the static built environment and the heterogeneous demands of the people present can be explored through a ‘real-life’ perspective. The findings can be interpreted and discussed in relation to socio-spatial dimensions to make practical suggestions for policy-making and urban design. The key research questions are: how does the street network impact the emergence of street vendors and pedestrians and what are the nuanced relationships between vendors, pedestrians and the spatial network configuration they are a part of?
3. Results
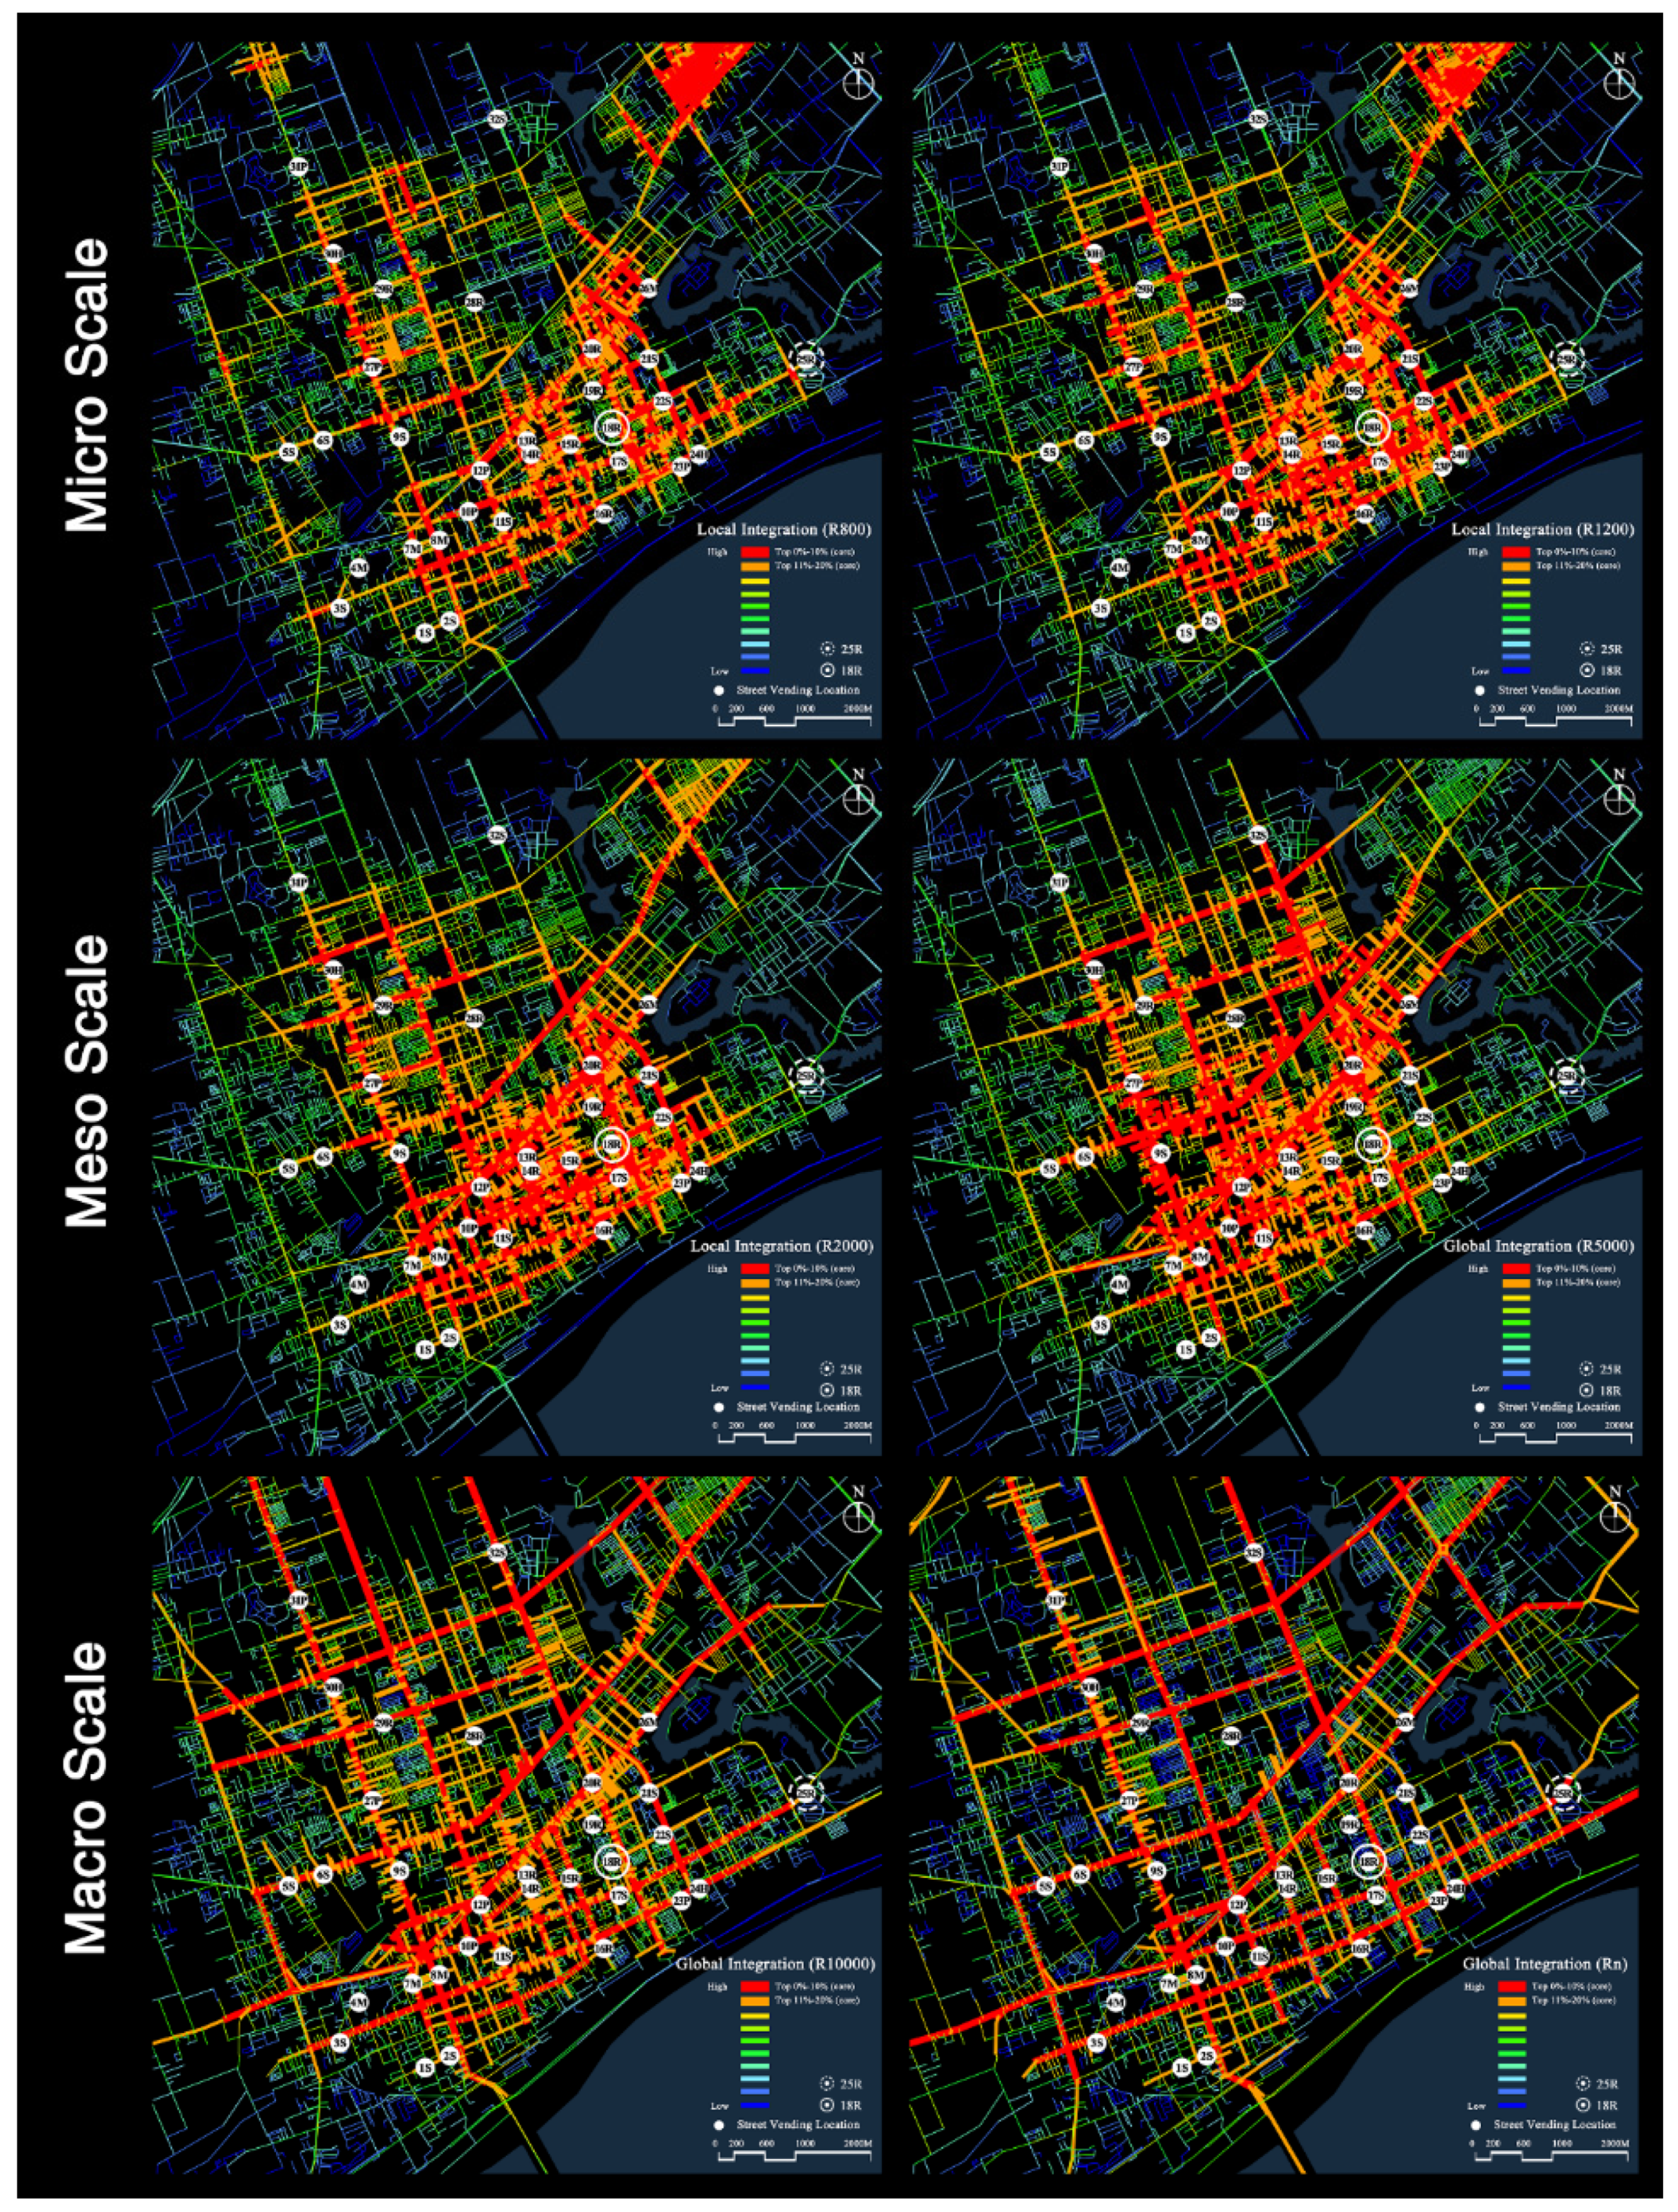
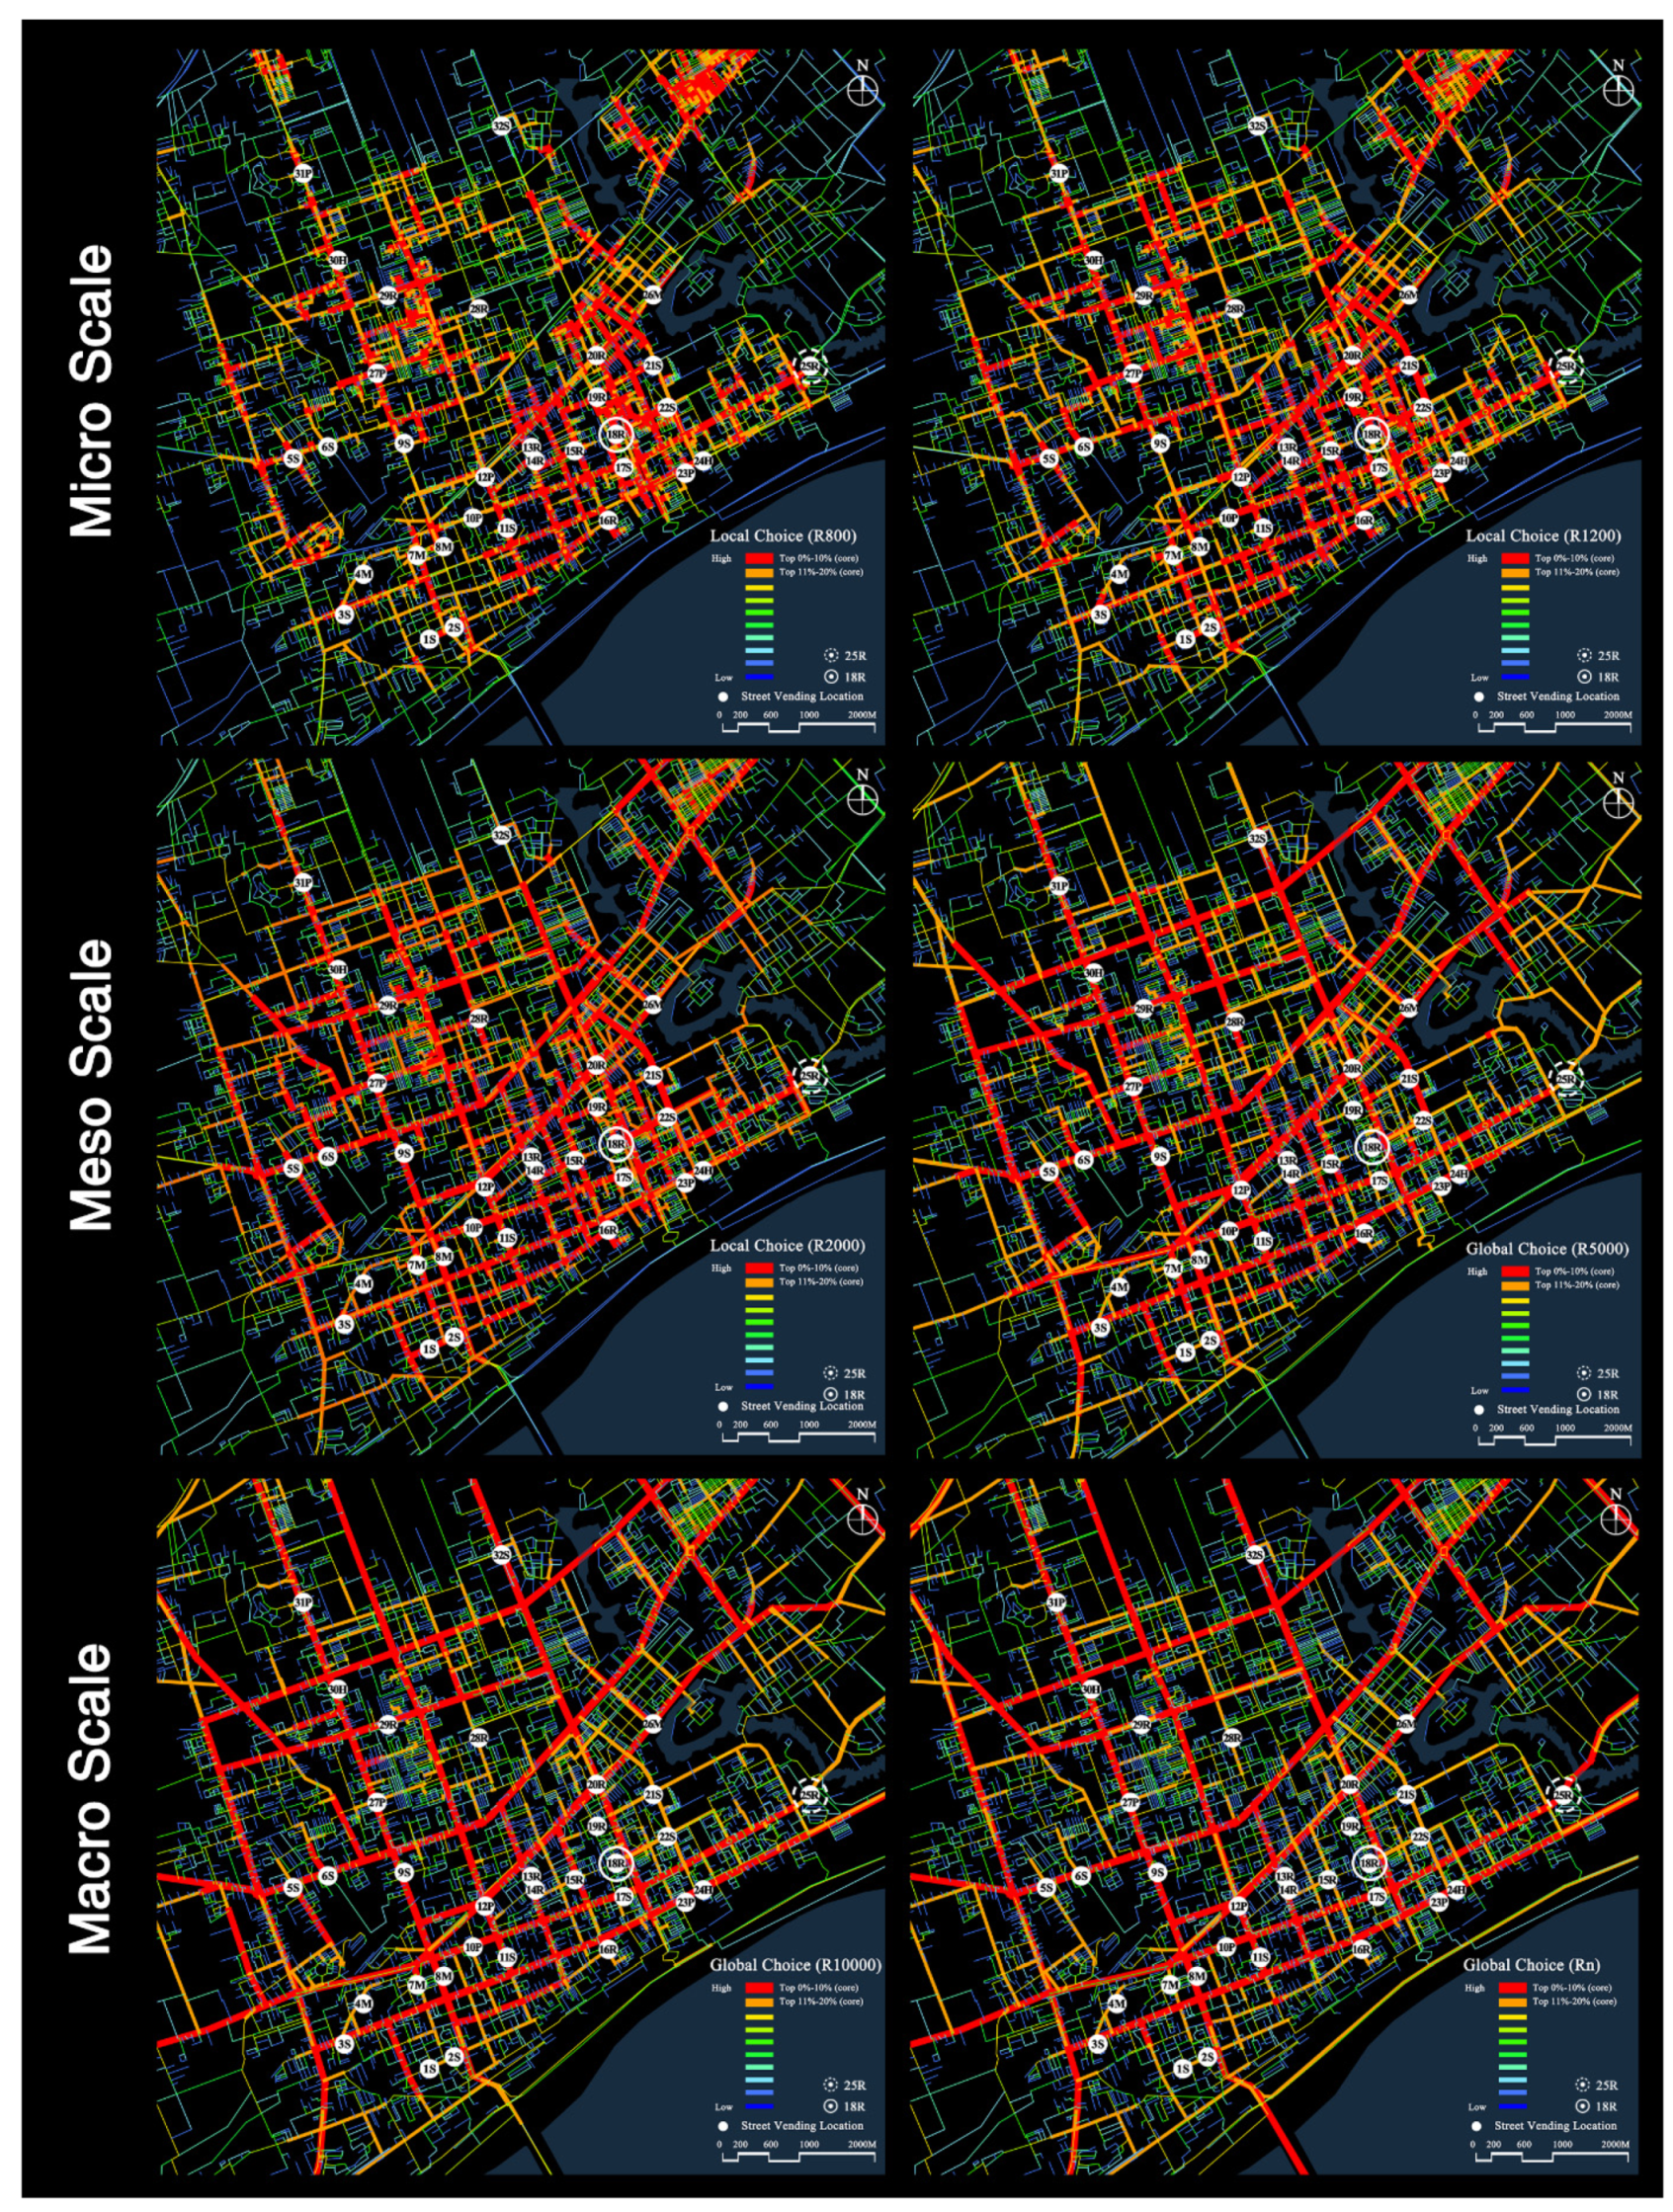
This map of street vending distribution is respectively overlapped with the space syntax ‘Integration’ and ‘Choice’ properties at six key radii (
Figure A1 and
Figure A2). In the two figures, the warmer coloured street segments are more integrated (or more accessible), while the colder coloured ones are more segregated within the system. The top 10% and 20% spatial cores at different scales were highlighted with thicker red and orange lines, respectively. The results show that all street spaces around three use classes of schools, markets and hospitals were highly attractive for street vendors. Some street vendors were also attracted to streets near parks and squares. It is worth noting that street vending activities were not concentrated in some areas but were seemingly evenly distributed throughout the whole city. Compared with other parts of the city, residential areas in the east were more likely to accommodate street vending practices. Furthermore,
Figure A1 and
Figure A2 illustrate that most street vending locations are to be found at the ‘Integration’ and ‘Choice’ spatial cores, particularly at the meso- and macro-scales.
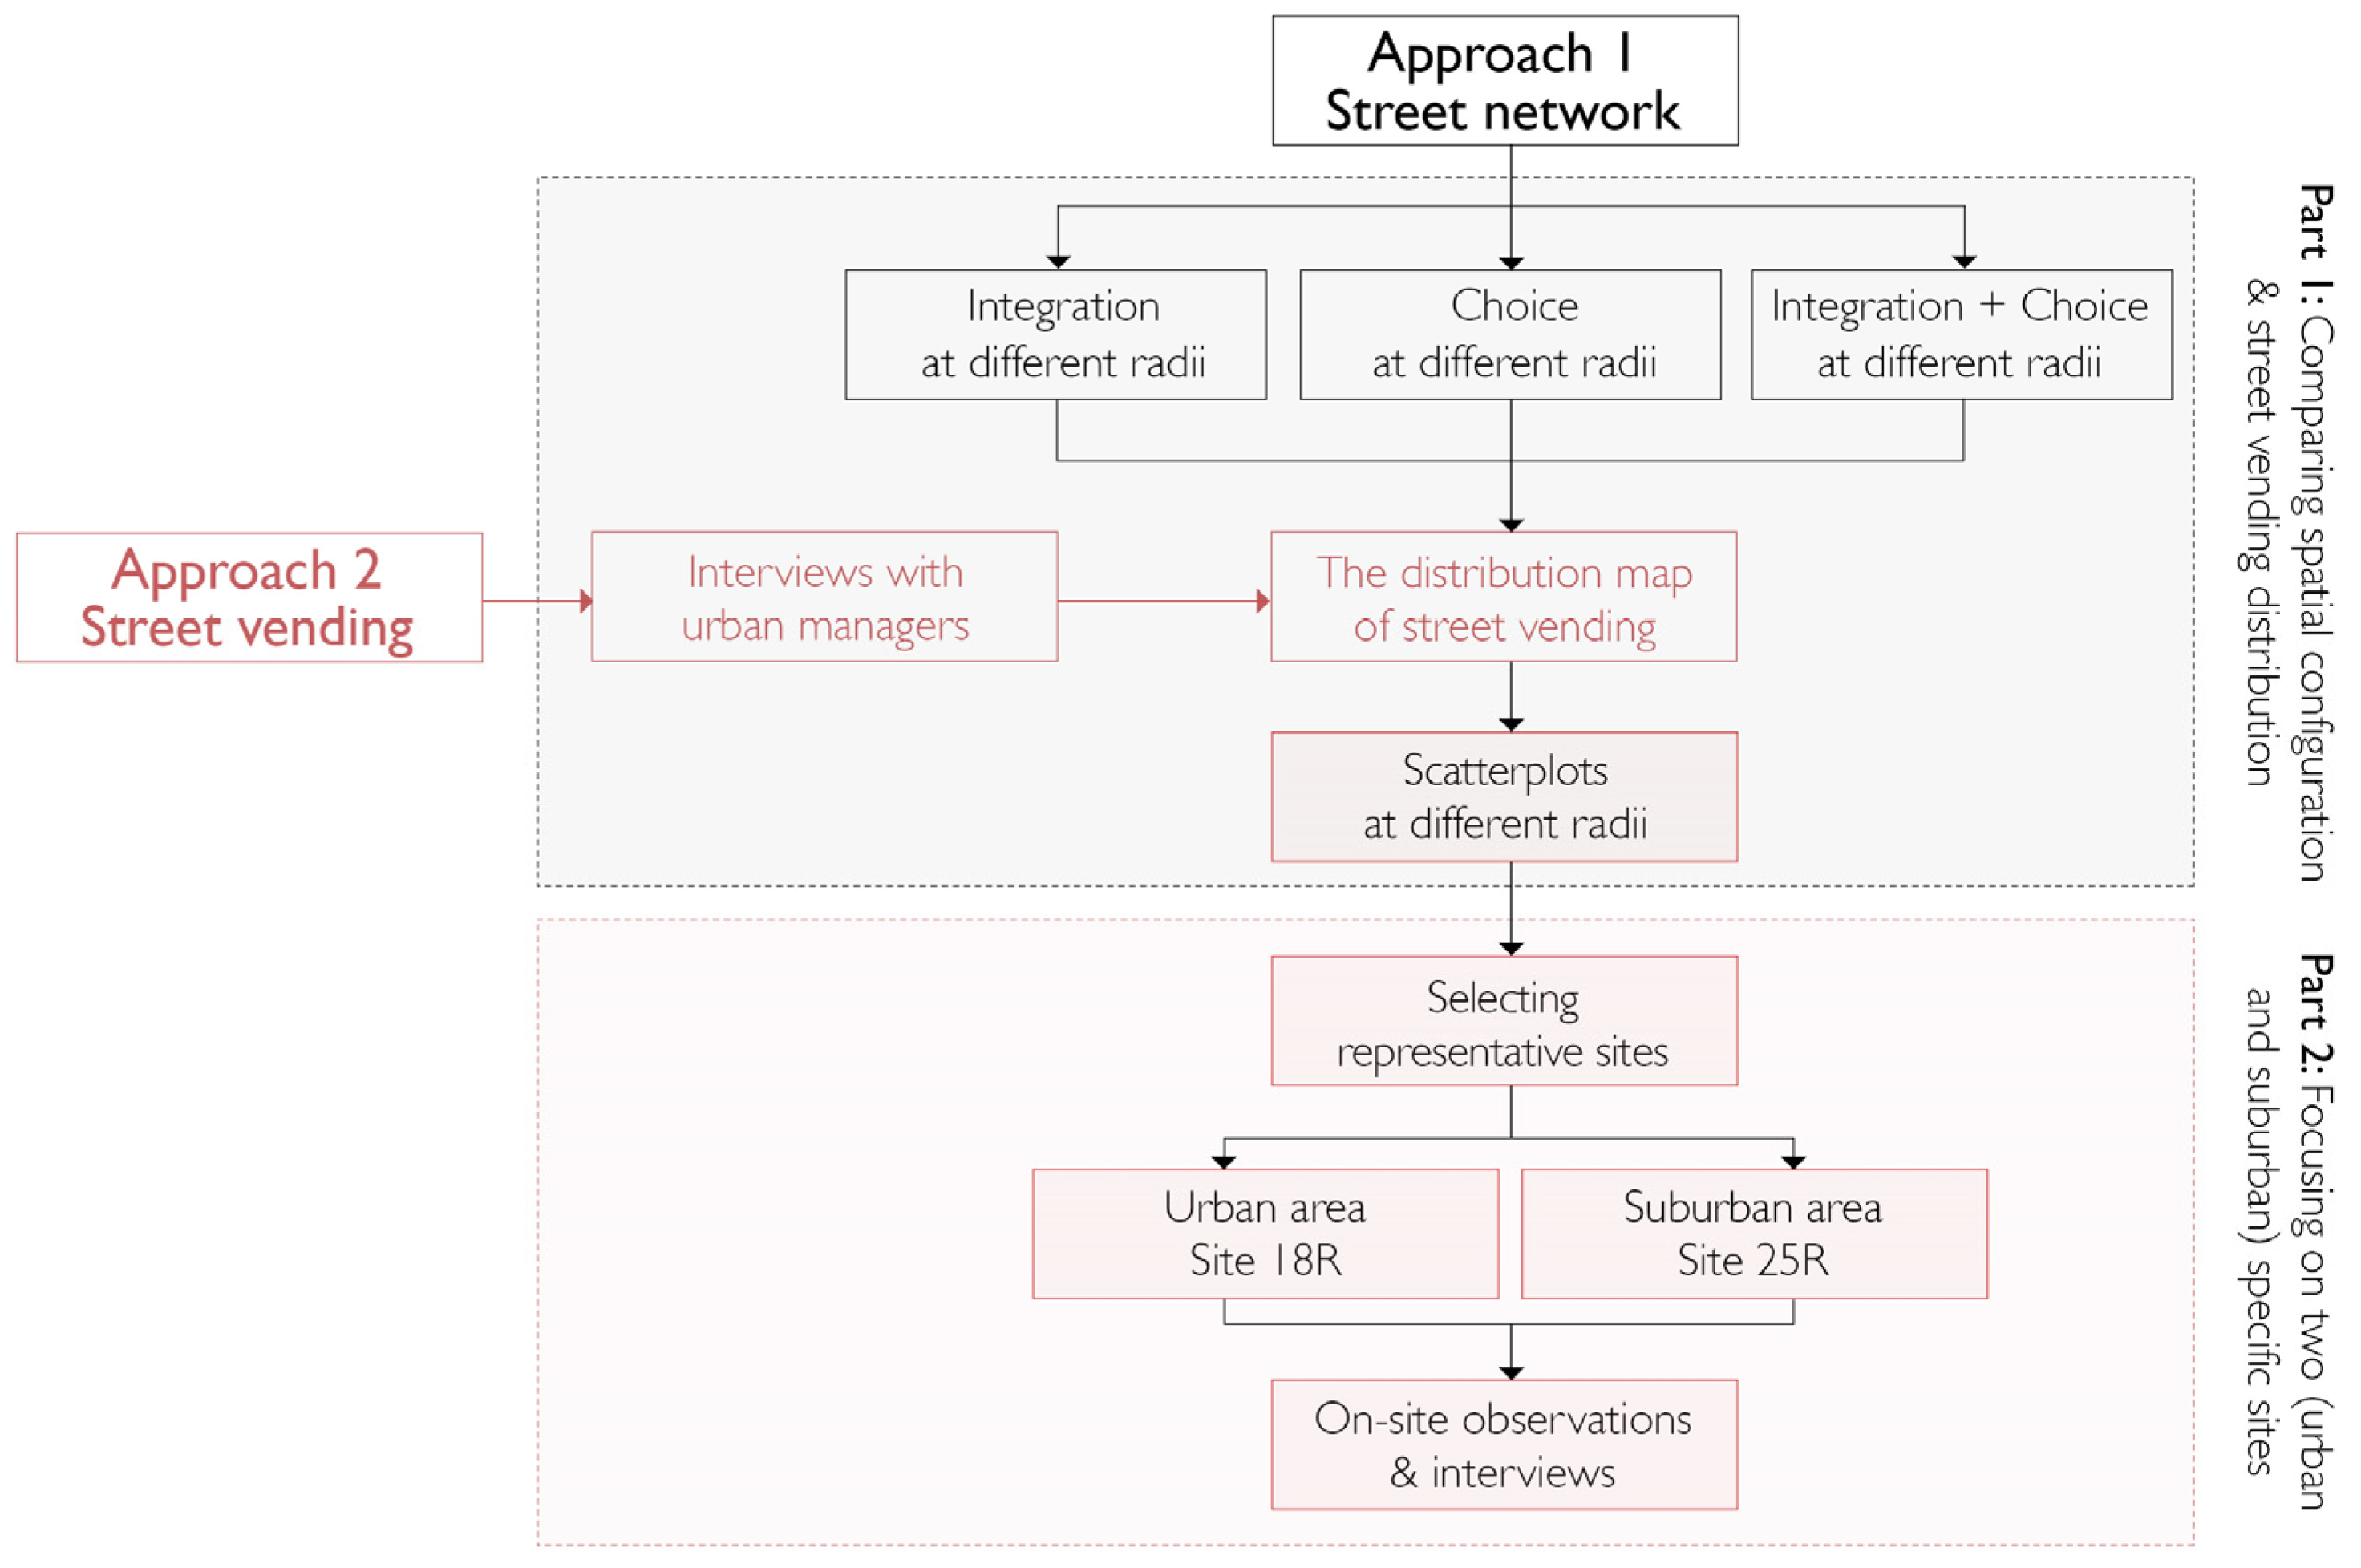
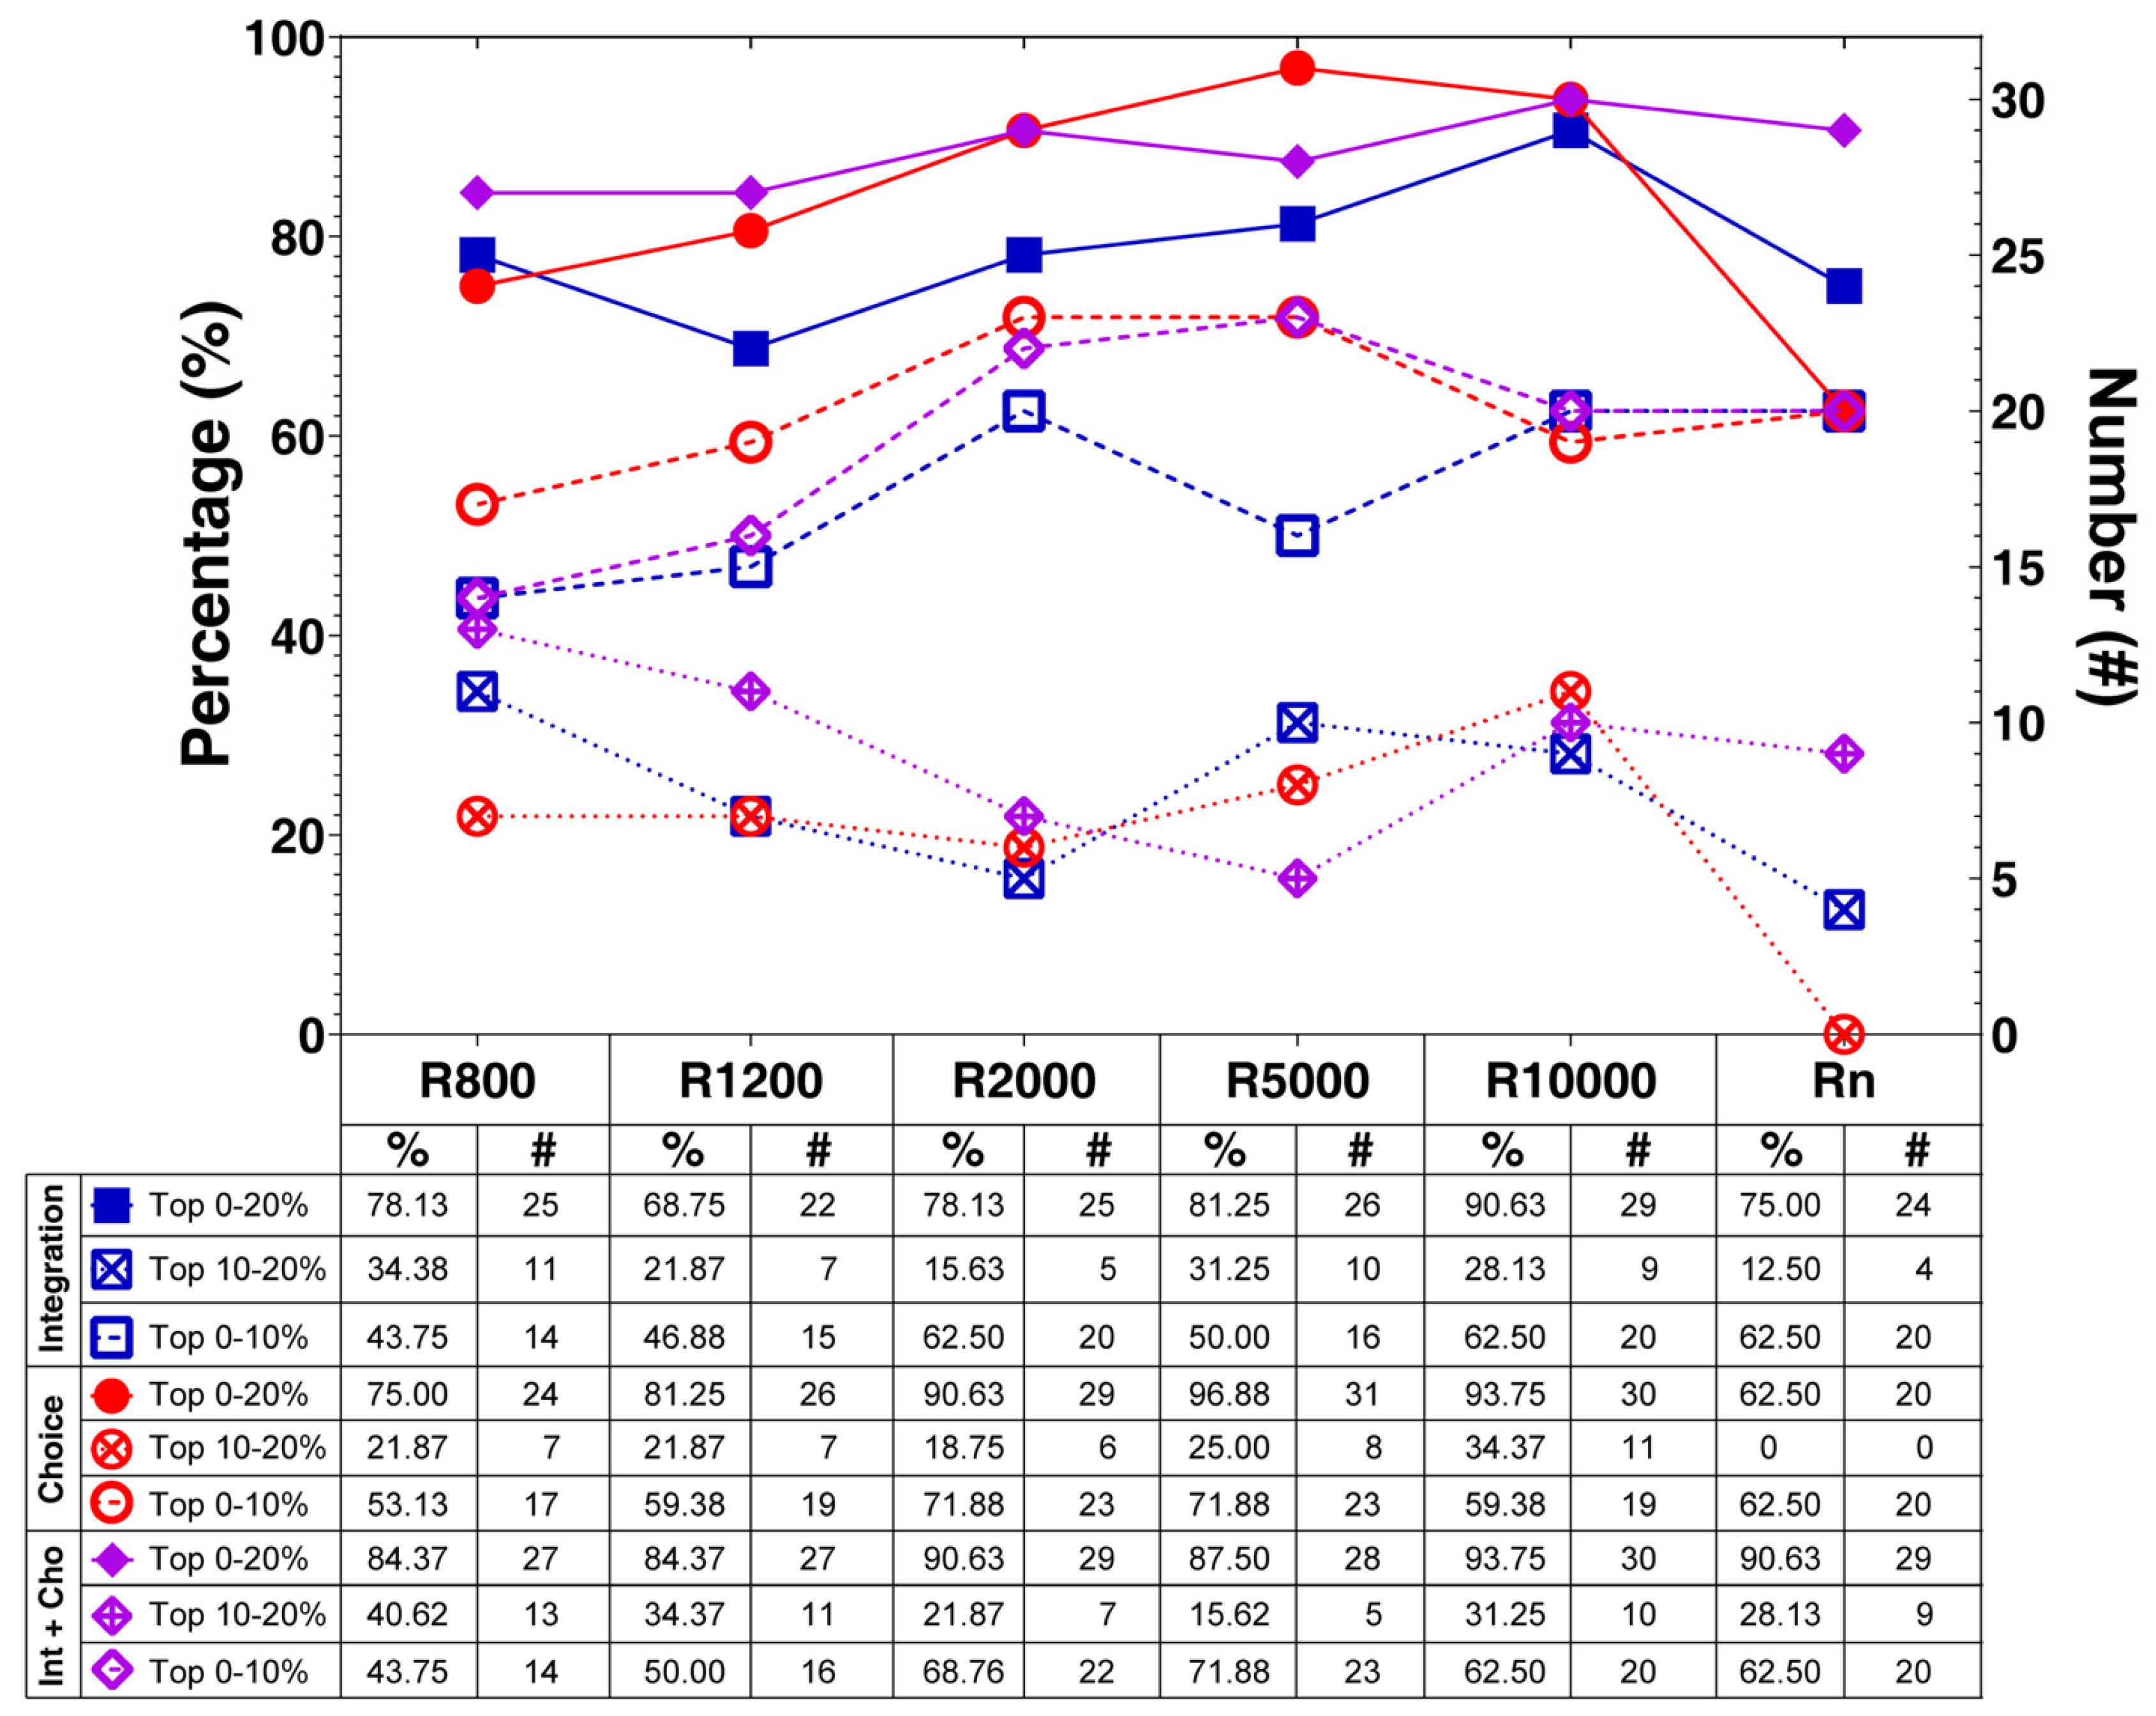
More specifically, the relationships between the street vending locations and the Top 10% and 20% Integration, Choice and Combined Centrality cores at six radii are further analysed in statistical terms (
Figure 3). In general, the percentages in the Top 0–10% cores at six radii are higher than those in the Top 10–20% cores, implying that the former has a better prediction power for vending locations, although this difference is small at the micro-scale. More than 62.5% of popular locations for street vending were situated in the Top 0–20% cores across all radii, with up 90% of them on the R10,000 radius. At the same radii, the prediction power of Choice is generally stronger than that of Integration. The percentages of vending locations in the total Choice cores at radii of 2000, 5000 and 10,000 m even reached 90%, 96% and 93%, respectively. Furthermore, at least 84.37% of street vending locations were distributed in the ‘Top 0–20%’ of Combined Centrality cores across all radii, meaning that street vendors prefer to choose locations where they can benefit from high ‘to- and through-movement’ flows simultaneously at different scales.
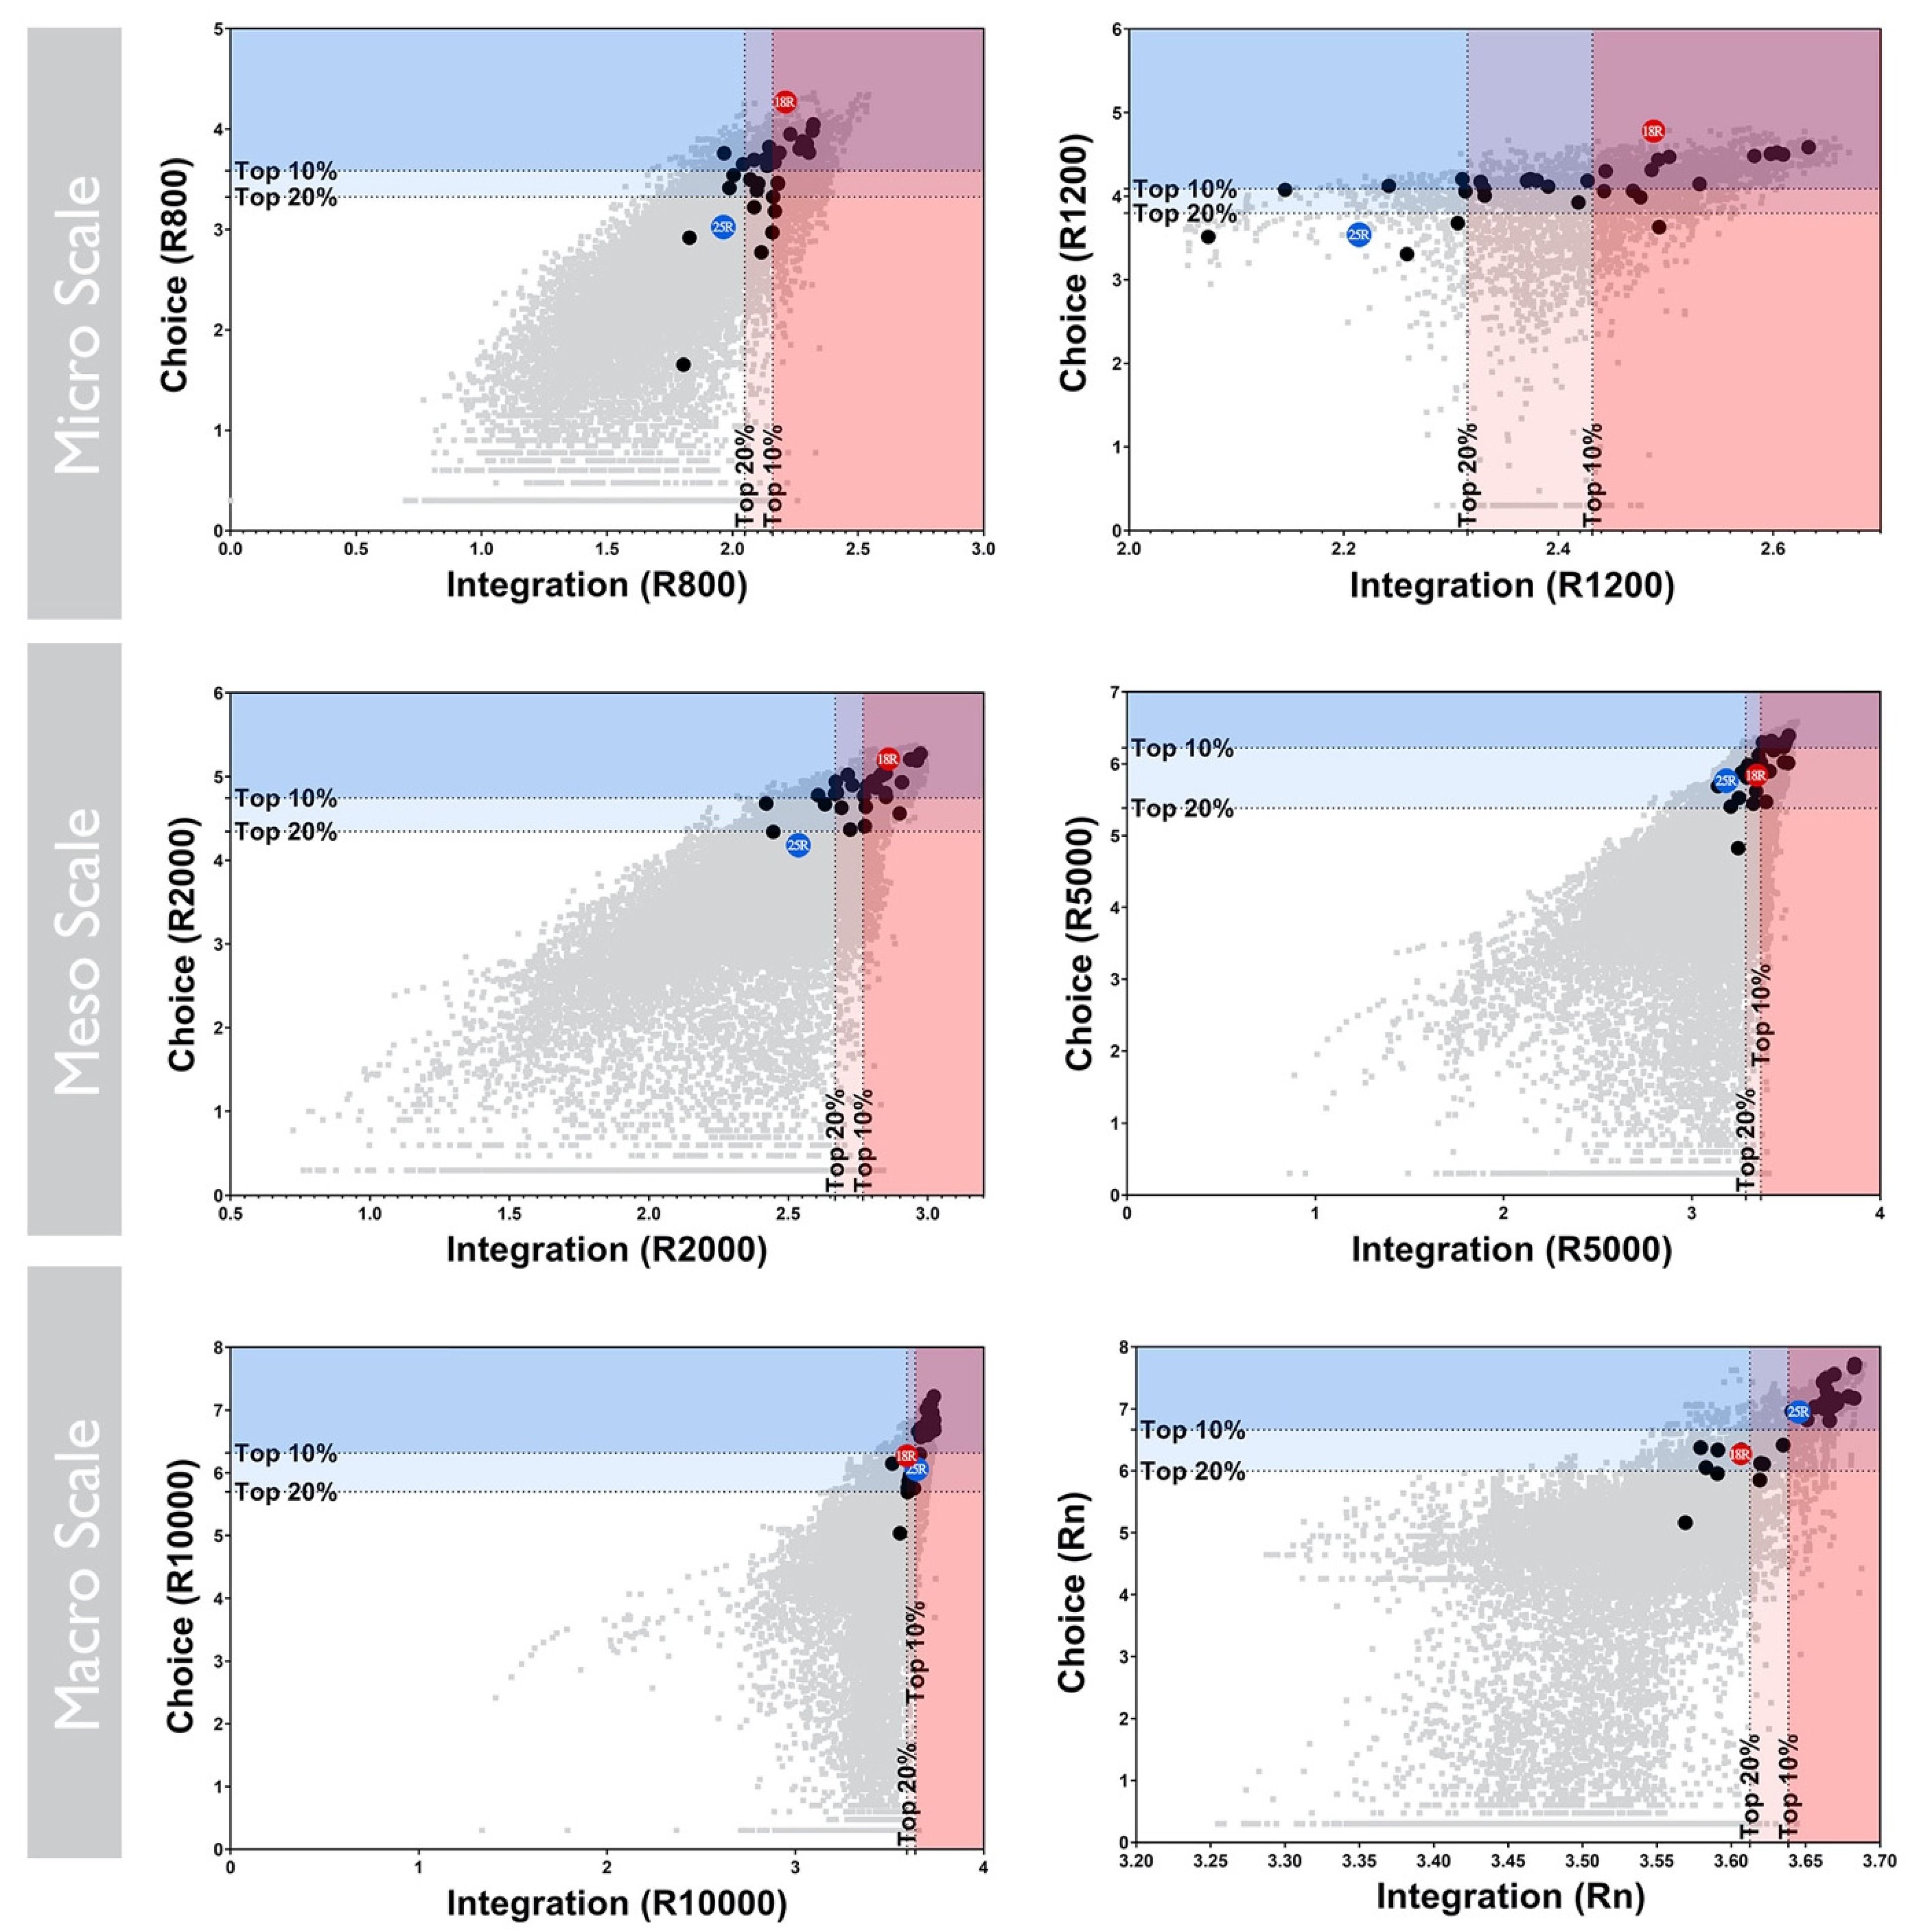
Figure 4 demonstrates the scatterplots of Integration and Choice at six radii, particularly the Top 10% and 20% spatial cores. The street segments with street vendors were highlighted in black (along with two comparative cases selected for further study in red and blue circles), while the dots in grey were the other streets in the city. The areas in the Top 10% and 20% cores of Integration and Choice were marked as red and blue squares in the scatterplots for better visual inspection. It clearly shows that most street vendors were found within the ‘core’ area: either Integration, Choice, or both. By comparing different radii, the slope of R1200 is the flattest, and that of R10,000 is the steepest; the vending locations at R1200 are more dispersed, and those at R10,000 are denser.
In more detail, although the two selected cases share the same land-use category (residential), they demonstrate an opposite pattern (
Figure 4). As shown in the scatterplots, street vending at 25R (the blue dot) is initially outside of the spatial core at R800, R1200 and R2000, and only climbs into the spatial core zone at the larger scale. By way of contrast, 18R (the red dot) is within the core at the three small radii but becomes less relevant at the wider-city scale. Simply put, when the radii increase from local to global, Site 25R gradually moves towards the spatial core, while Site 18R moves away, suggesting a different ‘spatial logic’.
To further investigate the different ‘spatial logic’ in everyday life terms, 53 sampled participants were interviewed at the two representative sites. 45% of the participants were female, and the numbers of pedestrians and street vendors were 31 and 22 respectively (
Table 1). Pedestrians at 18R were younger than those at 25R, while street vendors at 18R were older. The standard deviation for age at 18R was higher than at 25R, indicating that the ages of people present in the city centre were more differential than those in the peri-urban areas. The fine-grained narratives produced by on-site observations and interviews at the two specific streets are presented below, to enrich the quantitative findings and provide an in-depth understanding of spatial configuration in relation to specific spatial characteristics as well as the distinct social logic in urban and suburban areas.
4. Discussion
Returning to our research questions presented of how does the street network impact the emergence of street vendors and pedestrians and what are the nuanced relationships between vendors, pedestrians and the spatial network configuration they are a part of? Our findings provide empirical evidence of how the street network is associated with the distribution of street vending at six different radii. Our answers include two parts: (1) space syntax and street vending distribution as two different approaches of understanding pedestrians at the city level; (2) based on the on-site observation and interview materials at specific sites, the nuances among them are further discussed at the street level. Through the lens of street vending, the contrasting research methods employed in this study act in a complementary way. We shall discuss the results of all methods and the nuanced outcomes and meanings generated within three key categories of measurements, scales and site specifics.
4.1. Traditional Measurements but Novel Meanings
For the 32 street vending locations identified by this study, our results showed that the prediction powers of ‘through-movement’ were generally stronger than those of ‘to-movement’, particularly within the Top 10% of spatial cores (
Figure 3). However, in theory, street vendor locations are highly related to pedestrian movement, leading to a close relationship with ‘to-movement’. For example, previous studies indicate that Integration, representing potential ‘to-movement’, can be applied to predict pedestrian movement, while Choice, demonstrating potential ‘through-movement’, is more related to commercial land use [
1,
2,
14]. These inconsistent results suggest that street vending locations might be more associated with economic activities than pedestrian movement, although both aspects influenced them.
In addition, one interviewee said: “I can always buy some food and drinks from vendors when I need them. They are everywhere”. This reveals that coupled with mobility and uncertainty features, most local people consider street vending locations as non-destinations (i.e., not for to-movement). Consistent with a previous study in Changchun, China, Wang et al. (2014) distinguish the nuanced associations of Integration and Choice with different types of commercial activity [
45]. They noticed that specialty stores prefer to-movement, and department stores and supermarkets favour through-movement. One explanation is that because specialty stores sell a specific range of merchandise (e.g., medicines), they are the necessary destination when the demand for those goods arise. We found that, unlike specialty stores, most street vendors who sell low-cost products and commodities for basic, daily needs (e.g., vegetables, fruits and breakfast/snacks), are more suited to through-movement with a non-destination-based purpose. Also, it is worth noting that due to the street vending locations in our studies being identified by urban managers (i.e., unmanageable areas with recurring vendors), some locations with both few and also high mobile vendor numbers are potentially excluded from our study, meaning that the through-movement (or Choice measurement) could be more clearly associated with the distribution of street vendors in actuality. This suggests that the through-movement measurement can be used in predicting suitable spaces for designing temporary street markets, which could meet people’s everyday demands and promote urban regeneration, especially with the rise of the street vending economy in many Chinese cities.
Our study found that compared with individual measurements of Integration and Choice among the top 10% and 20% spatial cores, the prediction powers of ‘Combined Centrality’ for street vending locations are not always higher (
Figure 3). This is inconsistent with the concept of ‘movement economy’, namely, Integration and Choice coincide to capture the areas of highest through- and to-movement potential [
15,
16,
46]. Despite previous studies highlighting that the location of greatest overlap is likely to be where the potential is highest for the products of urban movement economies to take root [
31,
47], the potential difference between the overlap locations and vending locations indicate that street vendors have their own knowledge and complex ‘cognitive map’ of the city. This suggests that street vending locations are not simply related to pedestrian movement or economic activity, thus deserving a more detailed examination of the spatial network configuration and related demands.
Furthermore, established land uses in a given area may be inherently a response to the street network as suggested in the ‘movement economy’ theory, but Chinese city planners and governors have the power to plan land uses and build amenities, based on their assumptions and experiences in a top-down way [
48]. As a result, there is a gap between urban planning practice and the actual needs of local people on a daily basis, particularly in the provision of public amenities such as school breakfast provision. However, it is possible to argue that this situation provides a great opportunity for street vendors to more flexibly earn their living by filling this service gap. Besides, although commercial land uses are impacted by the street network over a longer time, they are relatively static in the shorter term, leading to clear associations with Integration, Choice or Centrality, compared with time-related and complex practices of street vending.
More specifically, the interviewees noted that different types of street vending locations have nuanced meanings. For example, street vendors near the local school know the school opening and closing times (i.e., predictable and regular pedestrian flow) and a neighbourhood shortcut between the school building and a local residential area; and are thus able to identify when and where the highest through-movement will occur. Compared with schools, neighbourhood parks and squares can experience substantial footfall during non-working hours such as evenings and weekends, but pedestrian flows are less predictable during these times leading to commercial uncertainty for street vendors. This particular nuance may also explain why street vending locations are more associated with Choice than Integration, and the prediction powers of Combined Centrality are not consistently higher than those of the two individual measurements. Furthermore, the findings suggest that additional research of street vendors and pedestrians through the lens of spatial configuration is required firstly to examine the number and different types of vendors and pedestrians but also to investigate the ‘stay duration’ for long- and short-term vendors in relation to environmental features. This could uncover the complex temporality and heterogeneity of street spaces through the lens of daily activities, providing an alternative way of understanding neighbourhood environments.
4.2. Alternative Understanding of Scales
Among the six selected radii, the high-level relations of Integration, Choice and Combined Centrality with street vending distribution are generally at R2000, R5000 and R10,000 (
Figure 3). The results are consistent with earlier studies that have shown the significance of prediction power for small markets a larger scale [
18]. However, street vending also closely interacts with pedestrians and other groups of people, suggesting that it carries not only an economic dimension but also a social one with dynamic features. In terms of pedestrians, due to walking distance, the spatial configuration serves as the basis for pedestrian movement at local and micro-scales [
1,
46], in line with the radii of 800m and 1200 m in our study. The inconsistent findings suggest that although in our hypothesis street vendors closely trace pedestrian movement, the two groups of street users have distinct concerns and socio-spatial demands. For example, unlike street vendors, most pedestrians prefer to walk a shorter distance wherever possible and tend to select the most convenient paths for their journeys whether via major roads or inner neighbourhood streets and alleyways [
46,
49]. They are also often related to ‘adjacent locations’ for to-movement at the local scale [
1].
The potential reasons why there is better prediction power for street vendors at middle and larger scales has been further uncovered by on-site observation and interviews. Firstly, street vending practices need to balance accessibility and multiple practical restrictions, as highlighted by the interview comments: ‘(Street vending can have a) negative impact on nearby store businesses’, the need for ‘sufficient space for the showcase’ and ‘avoiding urban manager patrols’ and so on. This finding is in line with existing studies that clearly illustrate that street vending locations tend to be near prosperous areas [
21]; vendors usually emerge in hidden spaces but keep close to the major roads or the key entrances of large public spaces [
20]. Secondly, although street vendors emerge temporarily, they often stay for a longer duration of time and sometimes appear repeatedly at the same spot, compared with pedestrians who are passing quickly by. As a result, street vendors prefer to select a relatively comfortable spot from a wide range, such as a shaded location by trees or buildings. In short, street vendors must calibrate these complex factors over a large area when selecting a location in which to vend. Vending distribution is more typically related to a syntactic analysis at middle and larger scales than at small scales when compared with pedestrian movement. This also implies that in space syntax studies, the prediction power at different scales is likely related to the complexity levels of a vending location.
4.3. A New Paradox at Two Specific Sites
A less well-connected street generates less walking movement flow and fewer economic activities [
15,
50], theoretically leading to fewer street vendors. Nevertheless, we found several extreme cases, for example, 18R (cul-de-sac urban area) and 25R (suburban area) were relatively poorly connected to other streets but generated a high prevalence of street vendor activities and numerous pedestrians. These unexpected findings are in line with a few previous studies: Koohsari et al. (2013) found that participants who lived around less integrated streets in Melbourne reported more walking within public open spaces than participants who lived around more integrated streets [
3]. In modern urban planning, pedestrians are likely to emerge in the inner neighbourhood spaces and public open spaces, while motorised transportation uses the major roads which are often peripheral [
46,
49]. We conducted on-site observation and interviews to better understand the quantitative findings in these different contexts and uncovered a fine-grained picture of nuanced socio-spatial narratives. In going beyond the quantitative evidence, the researchers participated in rich discussions with participants on the practices of everyday life around street networks, spatial characteristics, street vending and pedestrians.
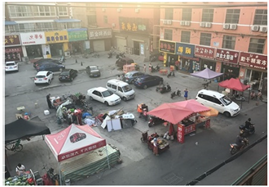
Why does a cul-de-sac attract many street vendors and pedestrians at Site 18R? Through observation, we found that due to there being fewer public spaces around this location and a high population density, a cul-de-sac without heavy vehicle and traffic movement (e.g., safer with fewer competing amenities) had been transformed into a type of de facto public open space that is popular with nearby residents and street vendors. One respondent at 18R noted: “I am living here because it has a low rental cost, and the everyday expenses are also low”. This indicates that the rental costs and land values in a segregated cul-de-sac tend to be lower than in nearby areas such as high streets, in line with the ‘movement economy’ theory [
15]. In fact, this also signifies that the apparent disadvantage of living in a less integrated area can be seen as an advantage for low-income families and young people in the city centre [
11]. With many job opportunities in the city centre, these people need to look for an adjacent residential area with lower Integration and Choice as a suitable place to live. The economic needs of these particular social groups and the feature of high-density residential areas correlate with street vendor activity often becoming part of a regular pattern of activity at the same spots at the same times often over a number of years. This provides an alternative understanding of the socio-economic demands of lower-income groups and their inhabitation of less well-connected streets via the ‘movement economy’ theory.
At 25R, the suburban area also engages many vendors and pedestrians (
Figure 4), which is inconsistent with many existing studies. In theory, due to suburban areas often lacking amenities and with low Integration, the surrounding streets are typically less active with fewer pedestrians [
1,
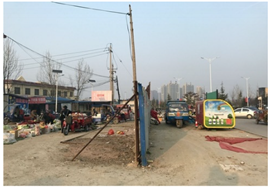
20]. Through observation, we found that the lack of amenities around Site 25R has provided an opportunity for street vendors to ‘fill the gap’ by serving many residents’ basic everyday needs with a wide range of daily provisions, generating pedestrians and vending clients in large numbers and making the area more interesting and active. Besides, taking into account a typical feature of suburban areas, in that many residents at 25R work in other parts of the city, the prediction of space syntax at the macro- and meso-scales of the city (i.e., R5000, R10,000 and Rn) is higher than those at the micro-scales of the neighbourhood.
It is also worth noting that compared with 25R, the prediction power at 18R is better at the local scales and less relevant at the global scales (
Figure 4). One study has shown that the activity territory of low-income people in China is small [
51], suggesting that for most residents working and living at 18R (an urban village) home to work commuting would be a relatively short distance. This indicates that Site 18R being located in an inner-city neighbourhood is more dependent on local pedestrian movement with a smaller range of everyday activities. However, 25R located in the suburban area largely relies on global movement with working and playing activities that most likely connect with other parts of the city. The difference suggests that although the results at 18R and 25R were both unexpected, the reasons for the unexpected outcomes differ in relation to different social logics of space. This implies that the space syntax approach needs to be supplemented with qualitative engagements in different situations and local contexts in real-life terms, and this complementary method can be used in policy-making and urban design in order to improve the adaptability and suitability of a context-specific neighbourhood.
4.4. Limitations and Future Studies
This research has limitations and needs to be further studied. First, the street vending distribution and the areas where street vendors might operate are dynamic, for example, they could be examined in different seasons of the year (i.e., when there is ripe produce available). Some areas not noted by urban managers might temporarily have street vendors, which potentially has an impact on the findings. Secondly, the number of street vendors and pedestrians at particular streets at different times needs to be accounted for, requiring further examination of the nuanced associations of Centrality of the street network. Finally, this study has only focused on one city, and further subtle distinctions need to be studied in other places within different cities, which may provide further insight on different numbers, types and timing of street vending, related spatial properties, walking behaviour and volumes of pedestrian movement.
5. Conclusions
This study offers a novel approach to examining the street vending phenomenon by adopting space syntax. It explores the relationships between spatial configuration and street vending distribution, uncovers how the two concepts relate to pedestrian movement, and reflects on the cultural specifics of this, in Chinese cities. Firstly, our study clarified the relevant terms of space syntax to avoid jargon and proposed an idea of investigating the relationship between street vendors, pedestrians and the street network. Secondly, we developed a complementary methodology to examine associations, including quantitative and qualitative data at the city and street levels. Thirdly, we discussed three critical themes (traditional measurements with novel meanings, an alternative understanding of scales, and an uncovered paradox at specific sites), deciphering the findings through the lens of daily living. This study provides a prediction approach (i.e., through-movement at the middle and larger scales) for street vending locations and proposes practical suggestions for policy-making and urban design within local contexts.
As street networks are much more costly to change once established, the relationships between spatial configuration. Vendors and pedestrians deserve to be further studied in different local contexts with different patterns of everyday life. For instance, less integrated areas can be seen as providing an advantage for low-income families by generating lower rental and living costs within the city centre; or the opportunity for street vendors to solve the issue of the lack of amenities by serving basic everyday needs in suburban areas. The new knowledge produced by the complementary methods employed in this study can help with practical suggestions for urban policy-making and design.
