
Vertical Ground Displacements and Its Impact on Erosion along the Karachi Coastline, Pakistan


Abstract
:1. Introduction
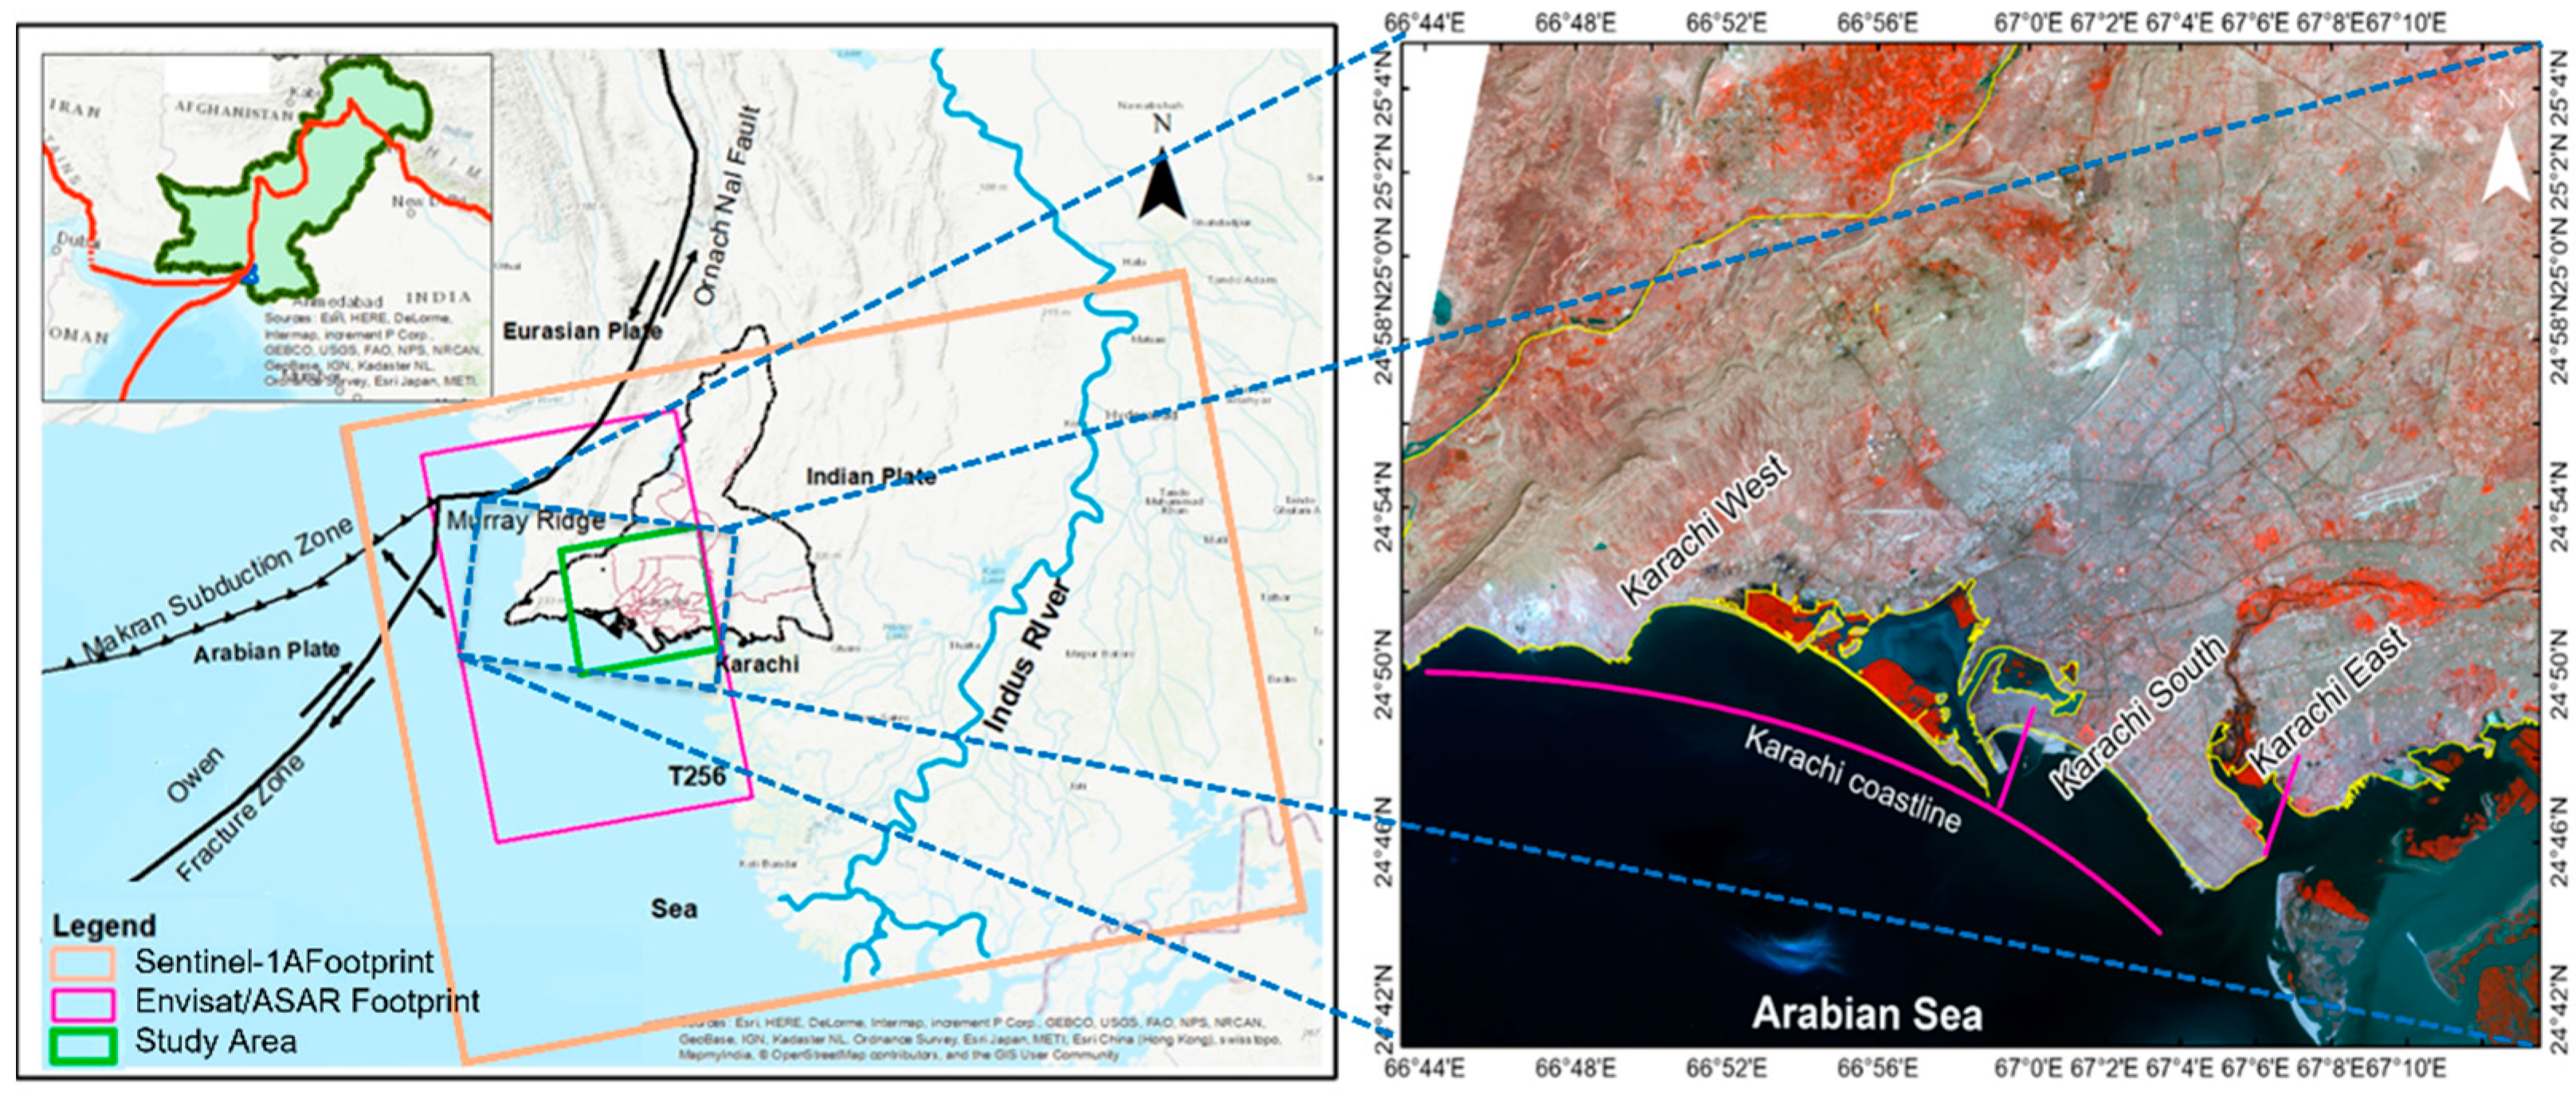
2. Study Area
3. Materials and Methods
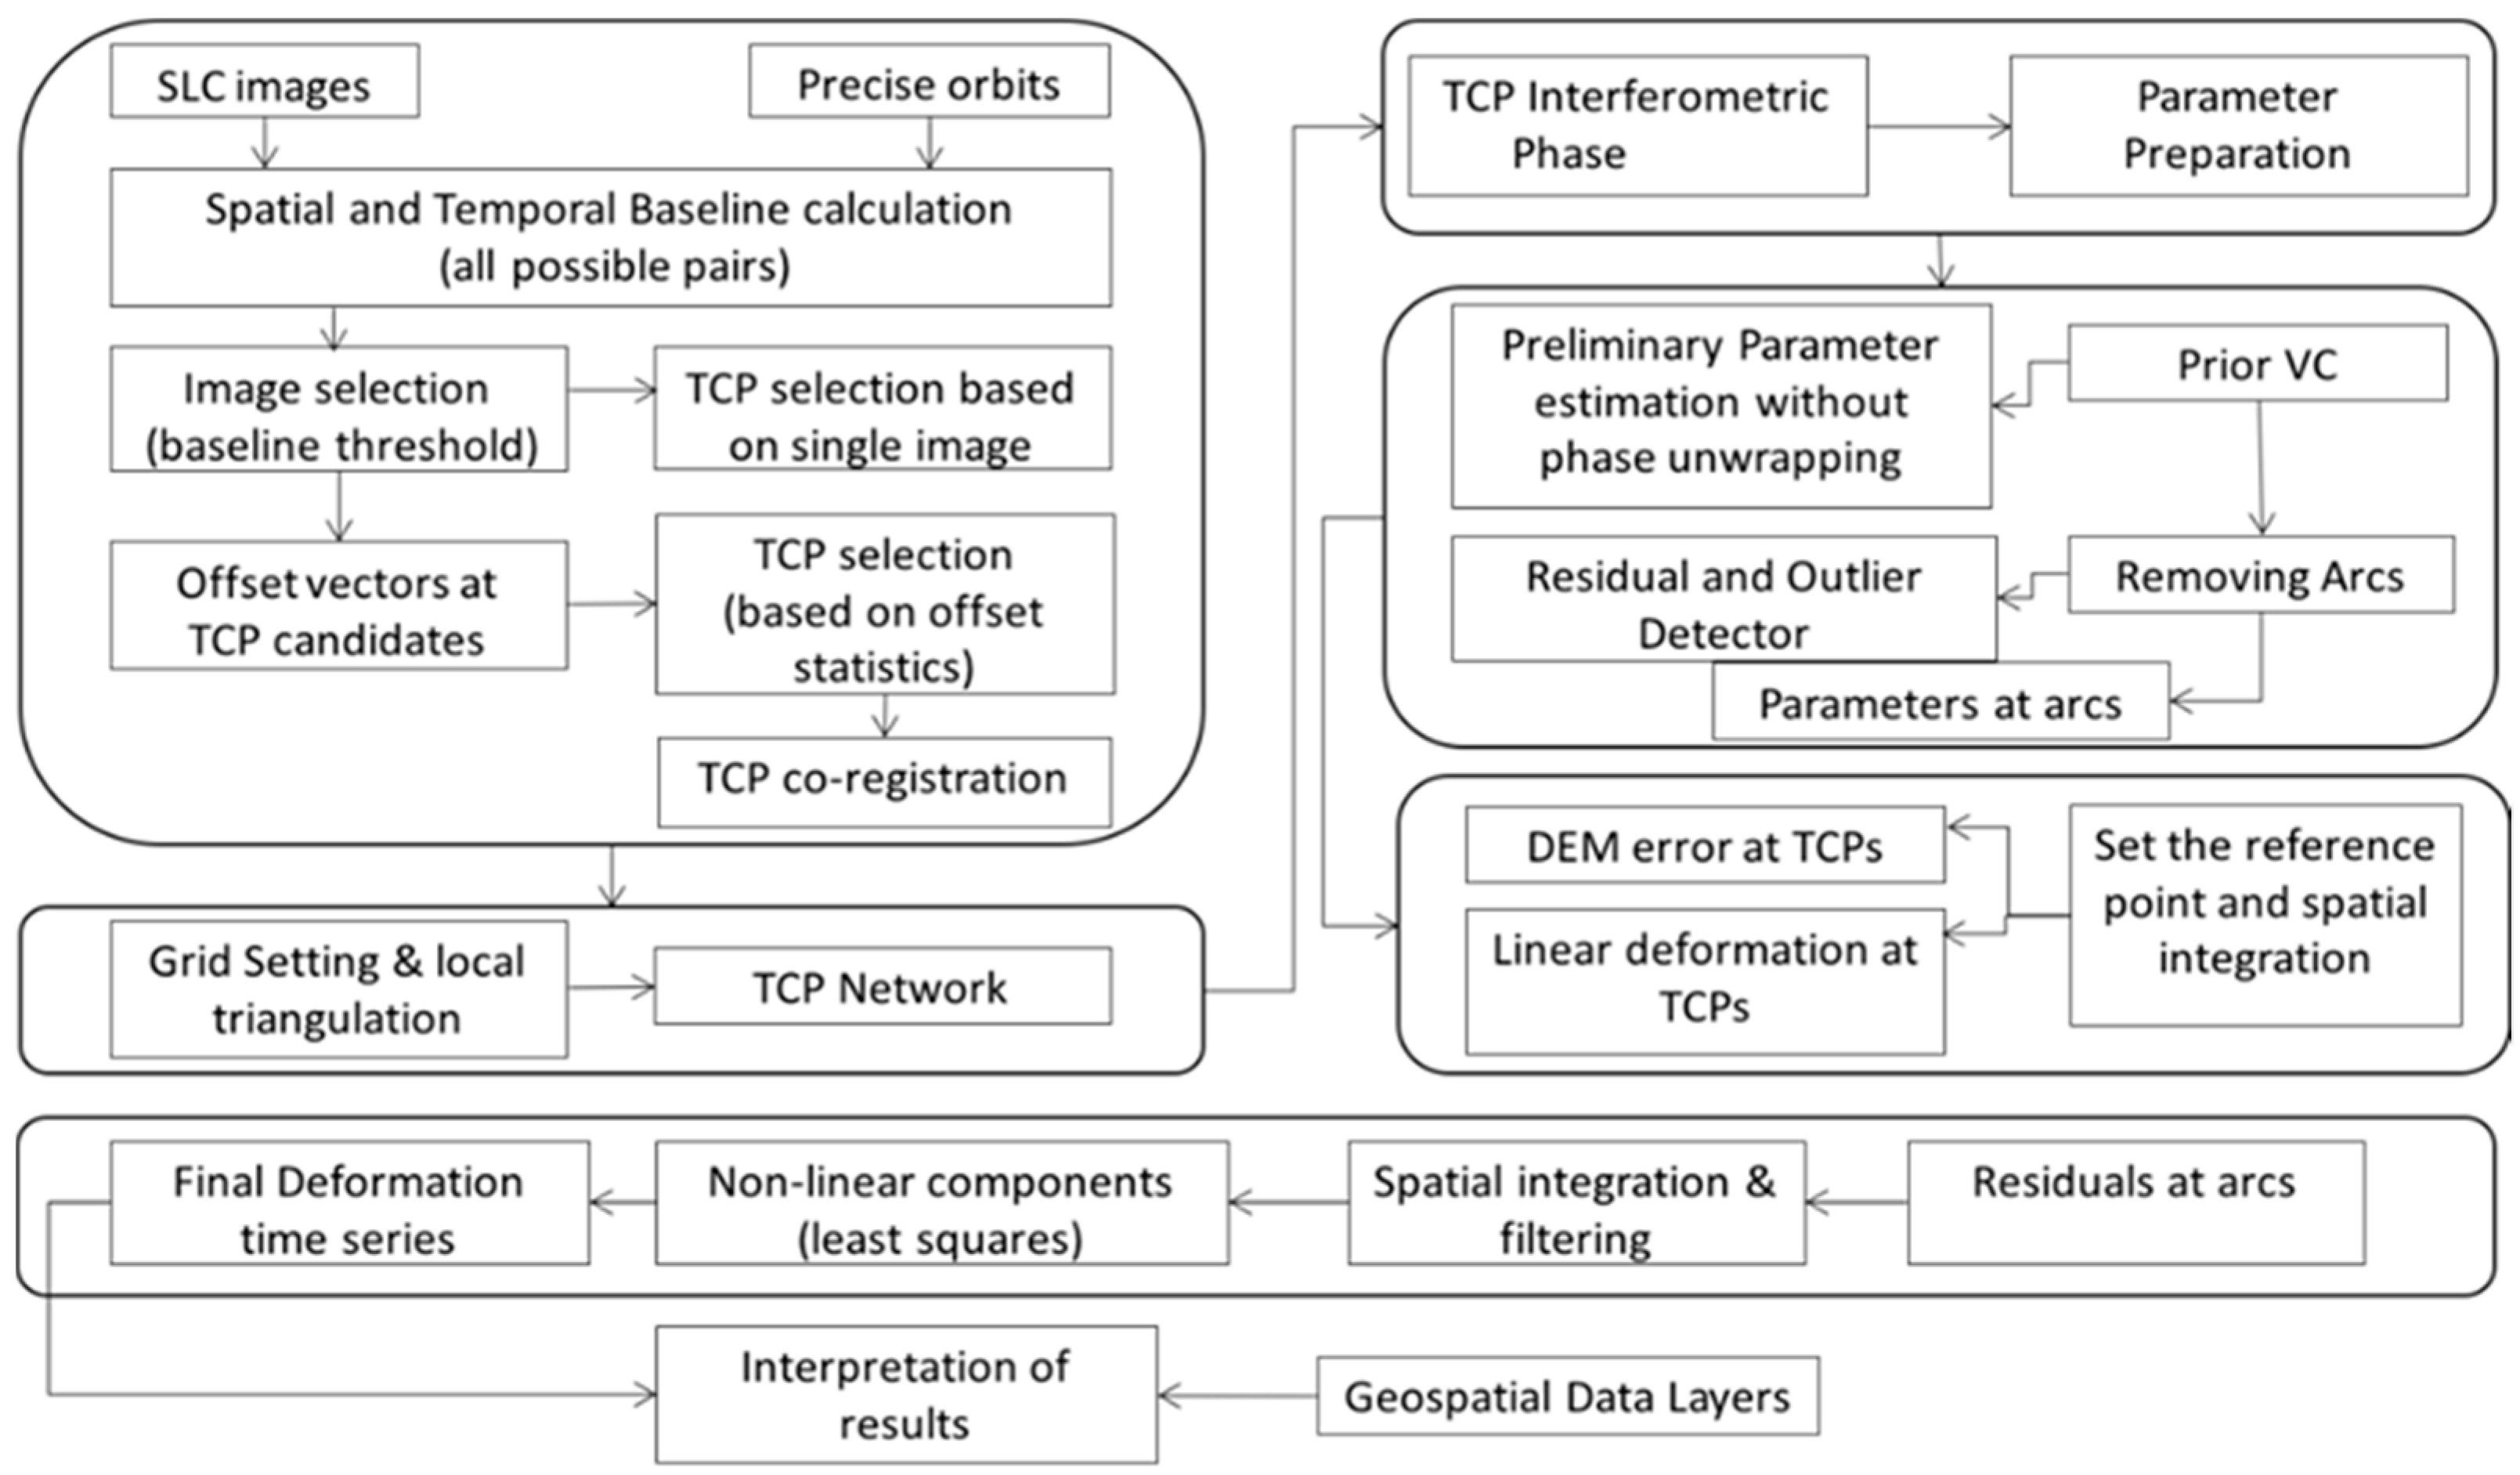
3.1. Vertical Ground Displacement Detection Using TCPInSAR
3.2. Coastline Change Estimation Using DSAS
4. Results
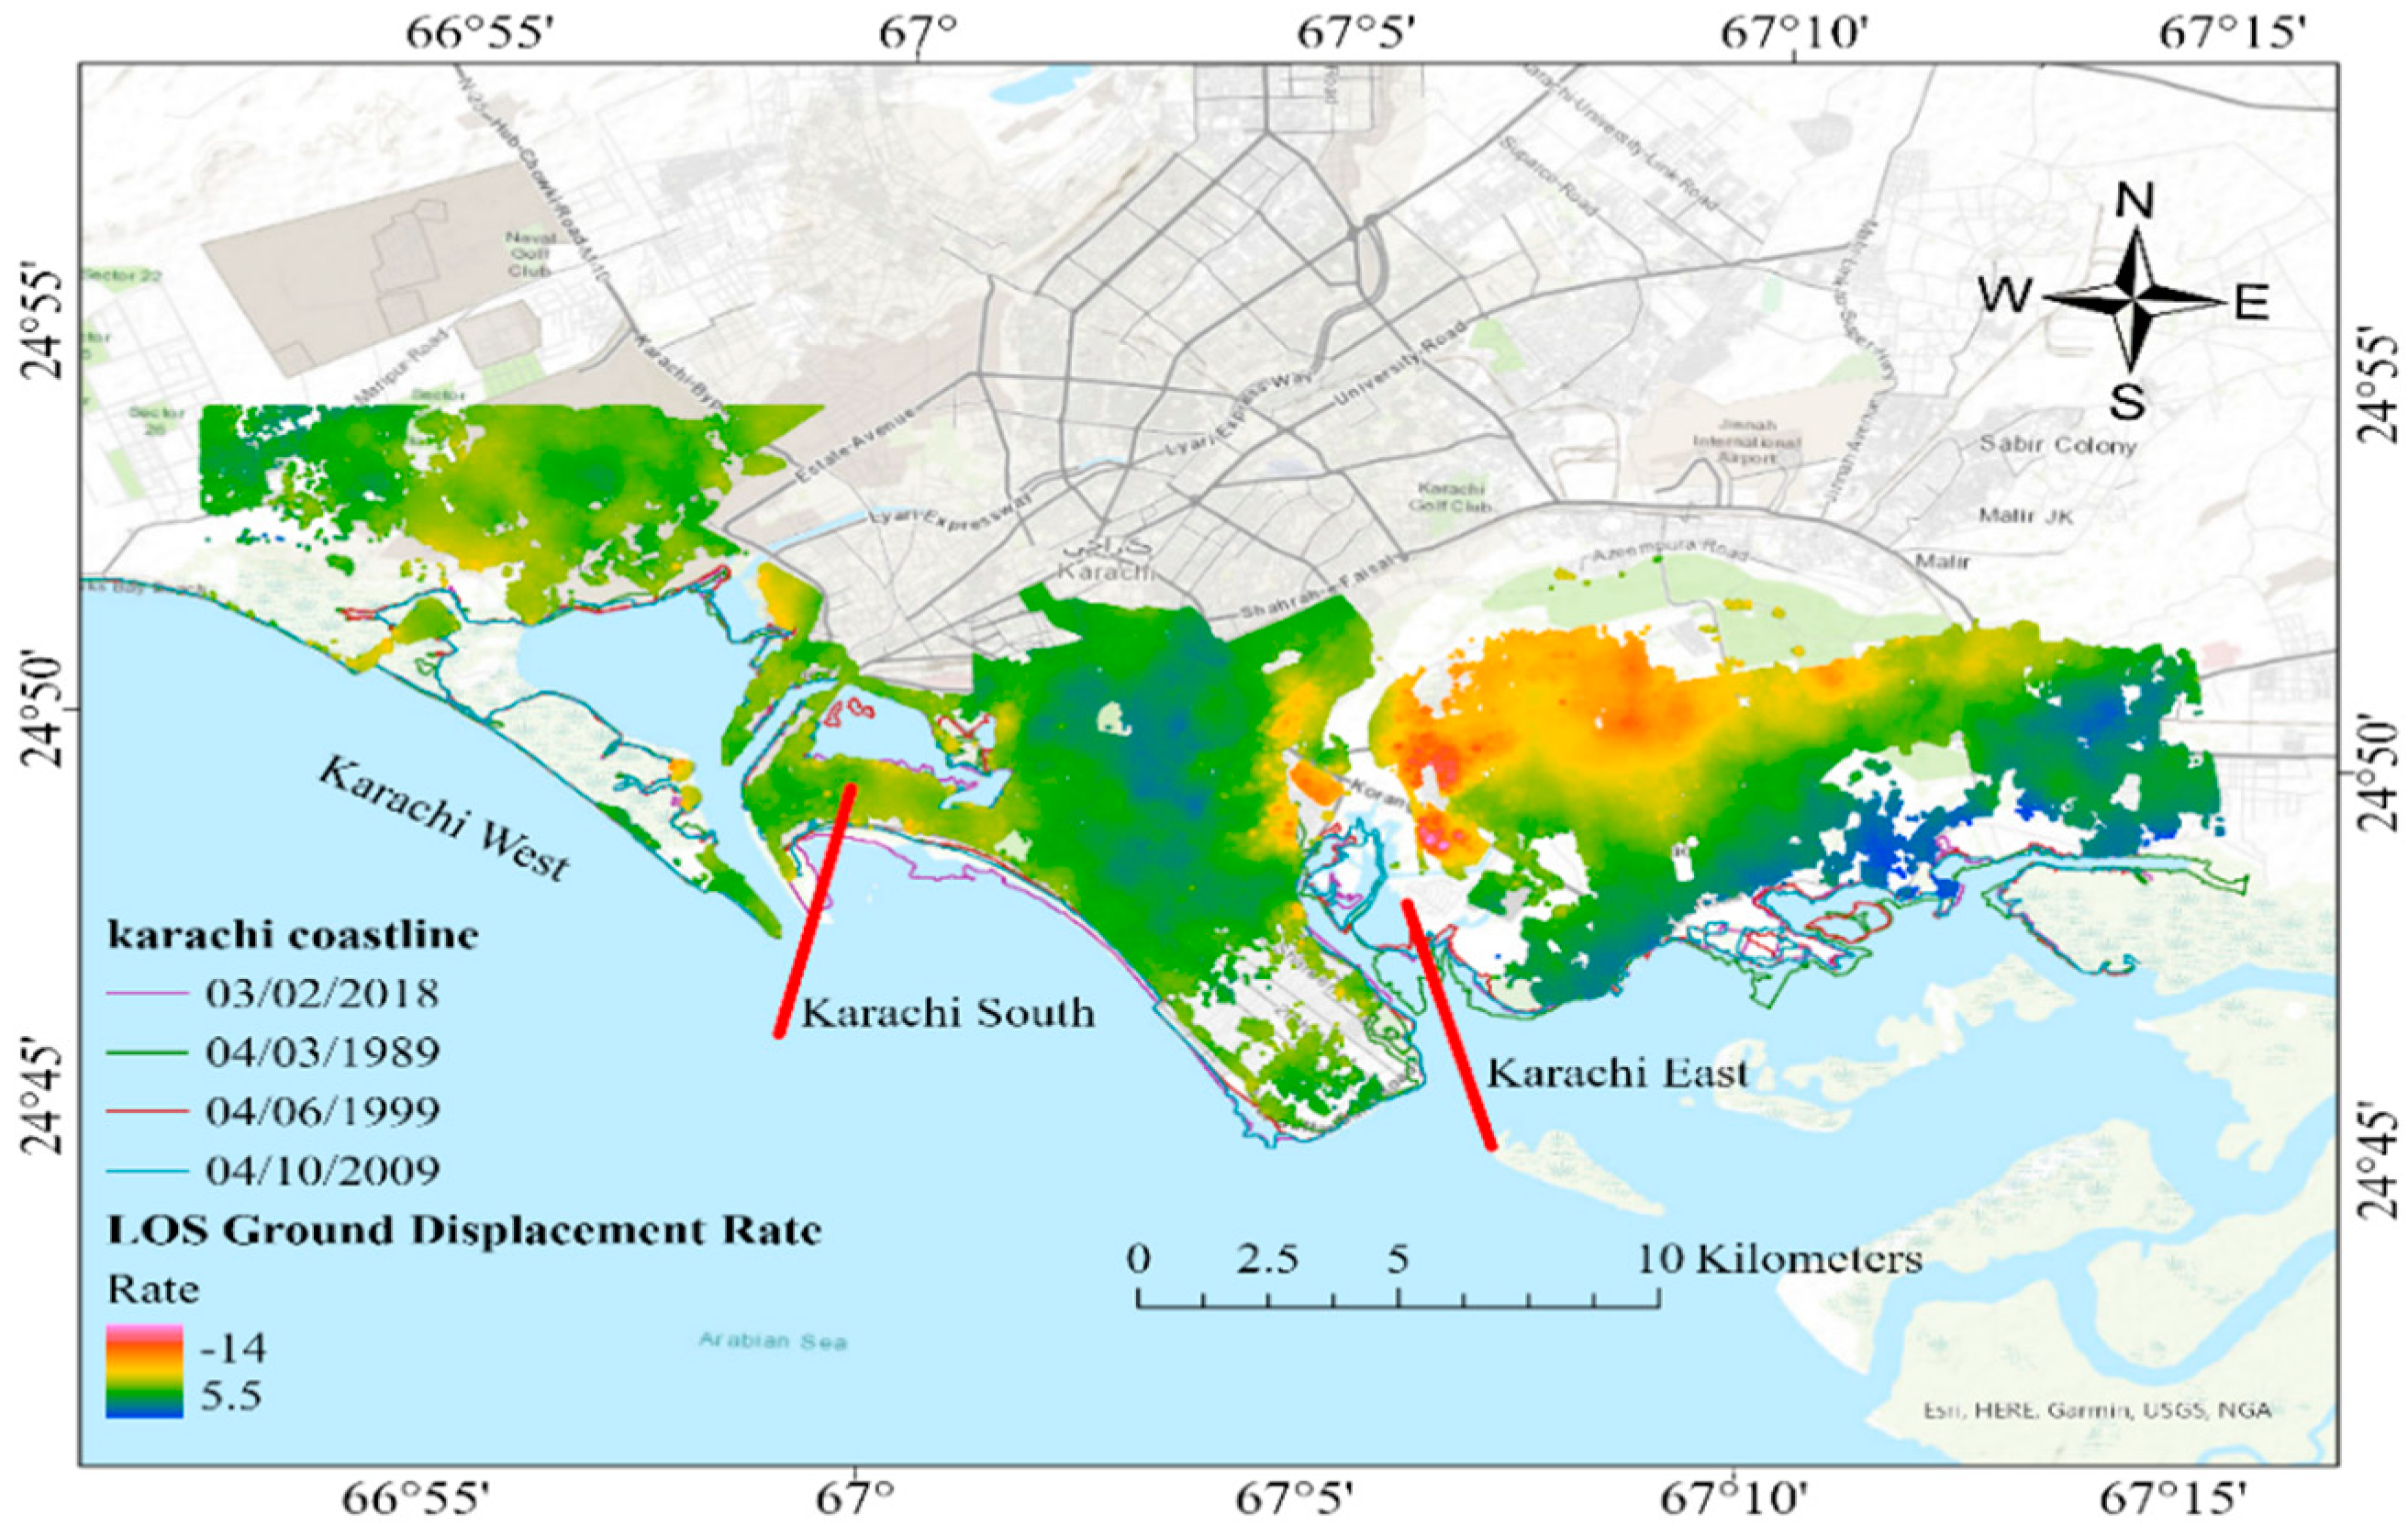
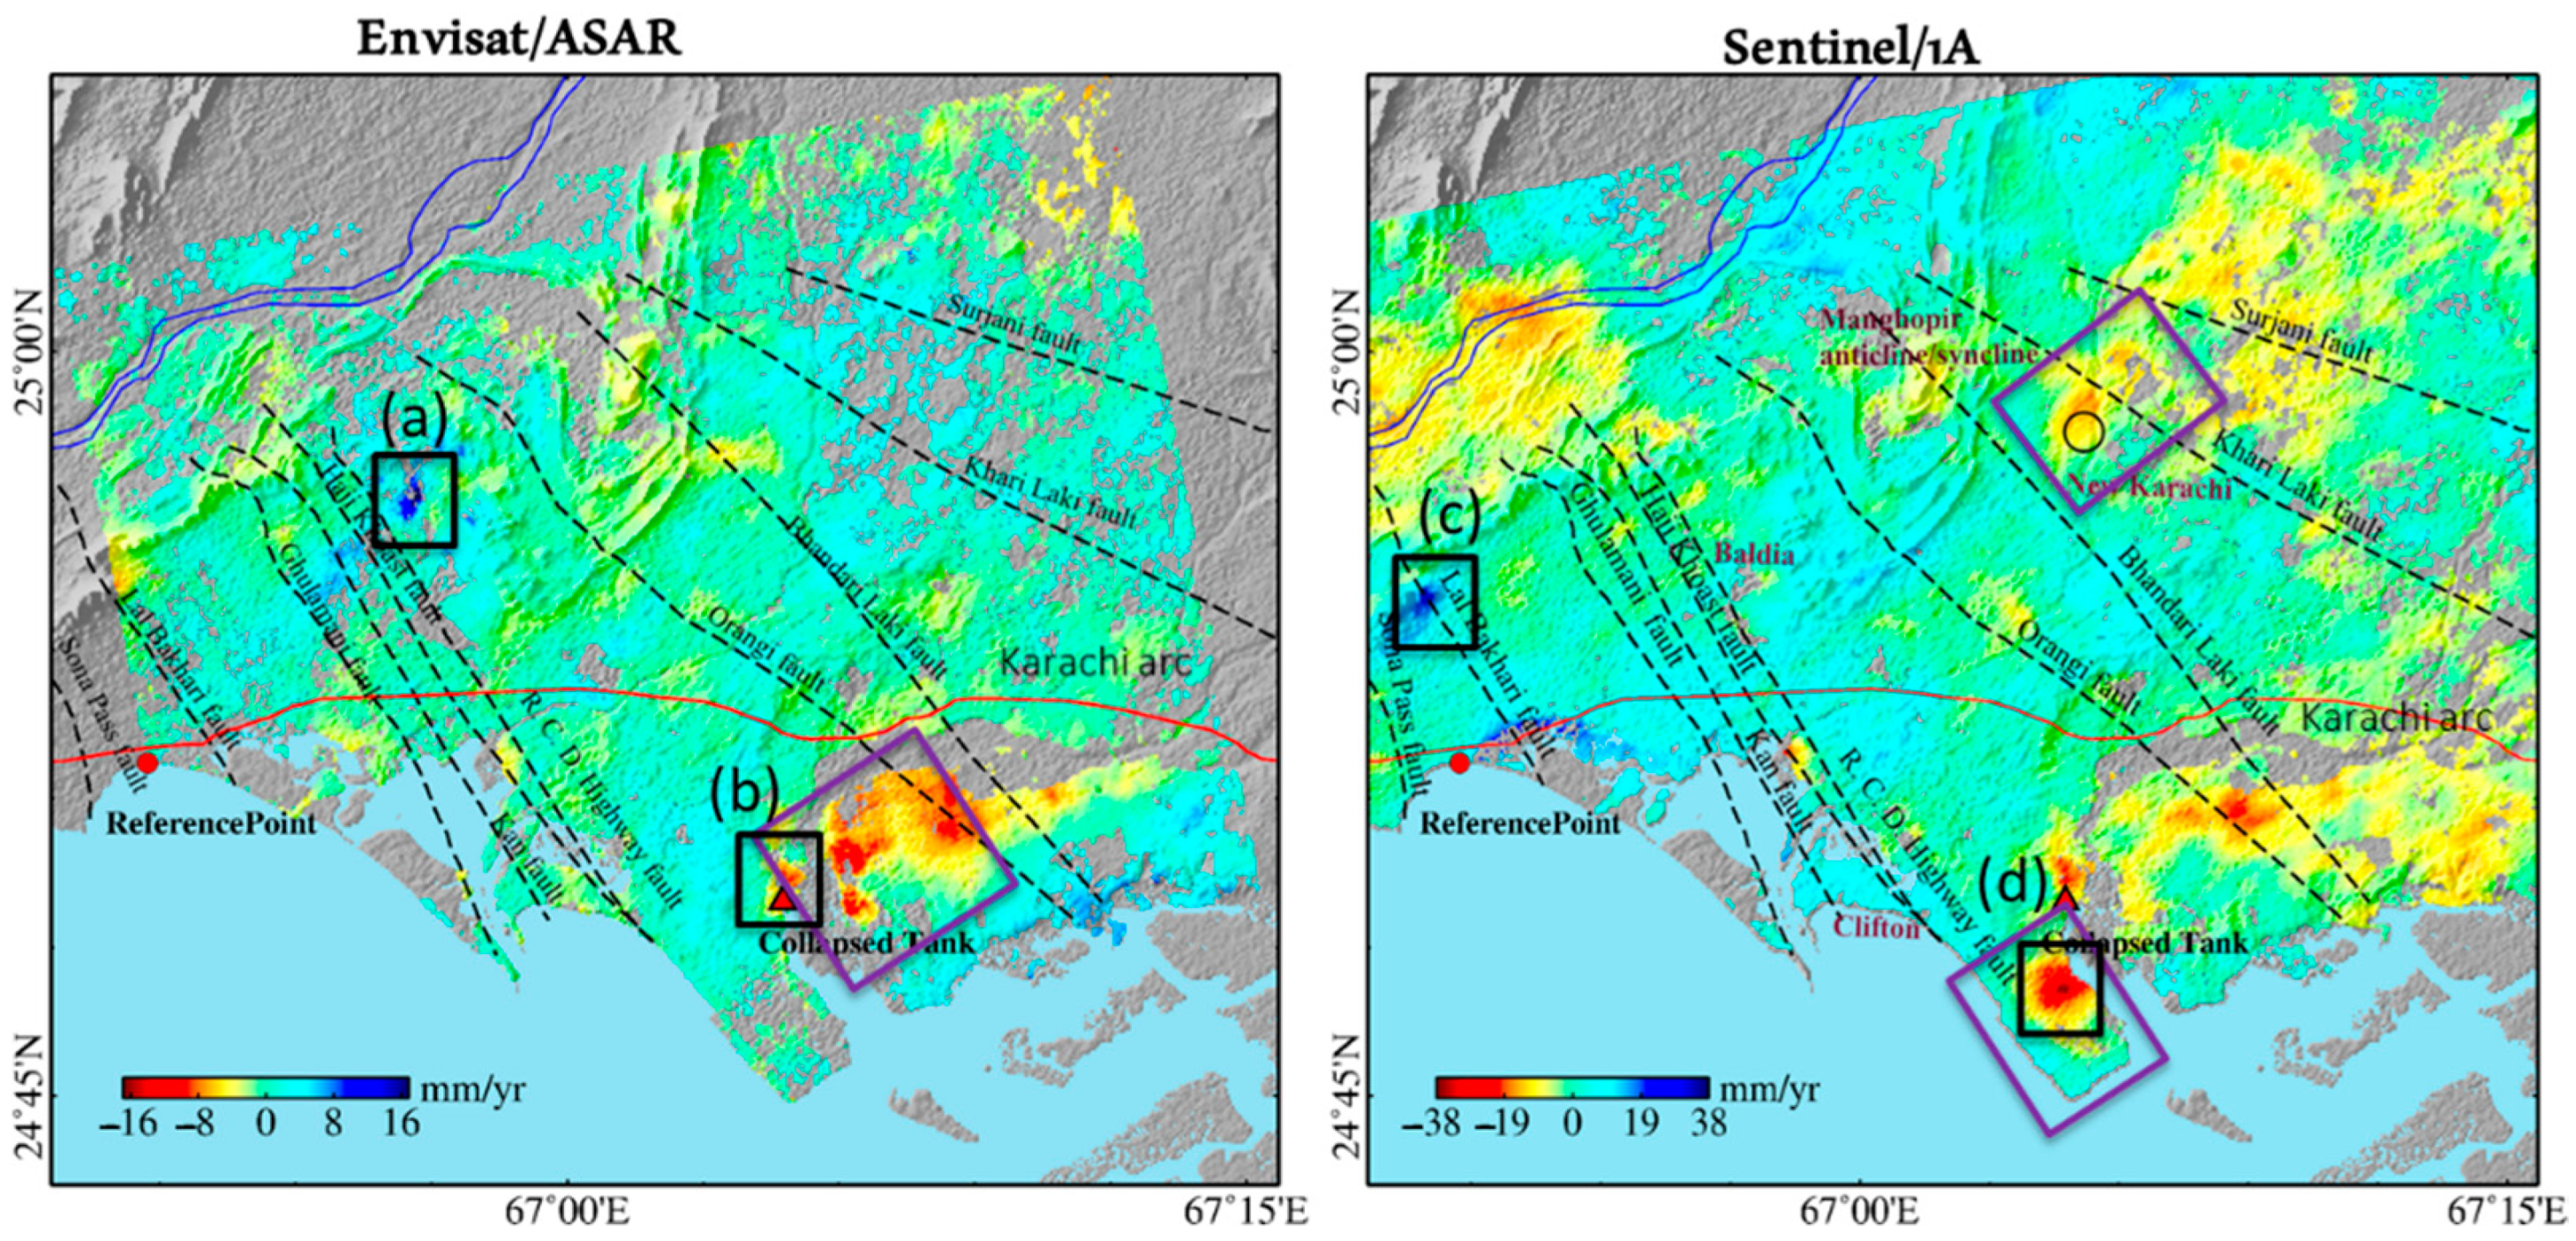
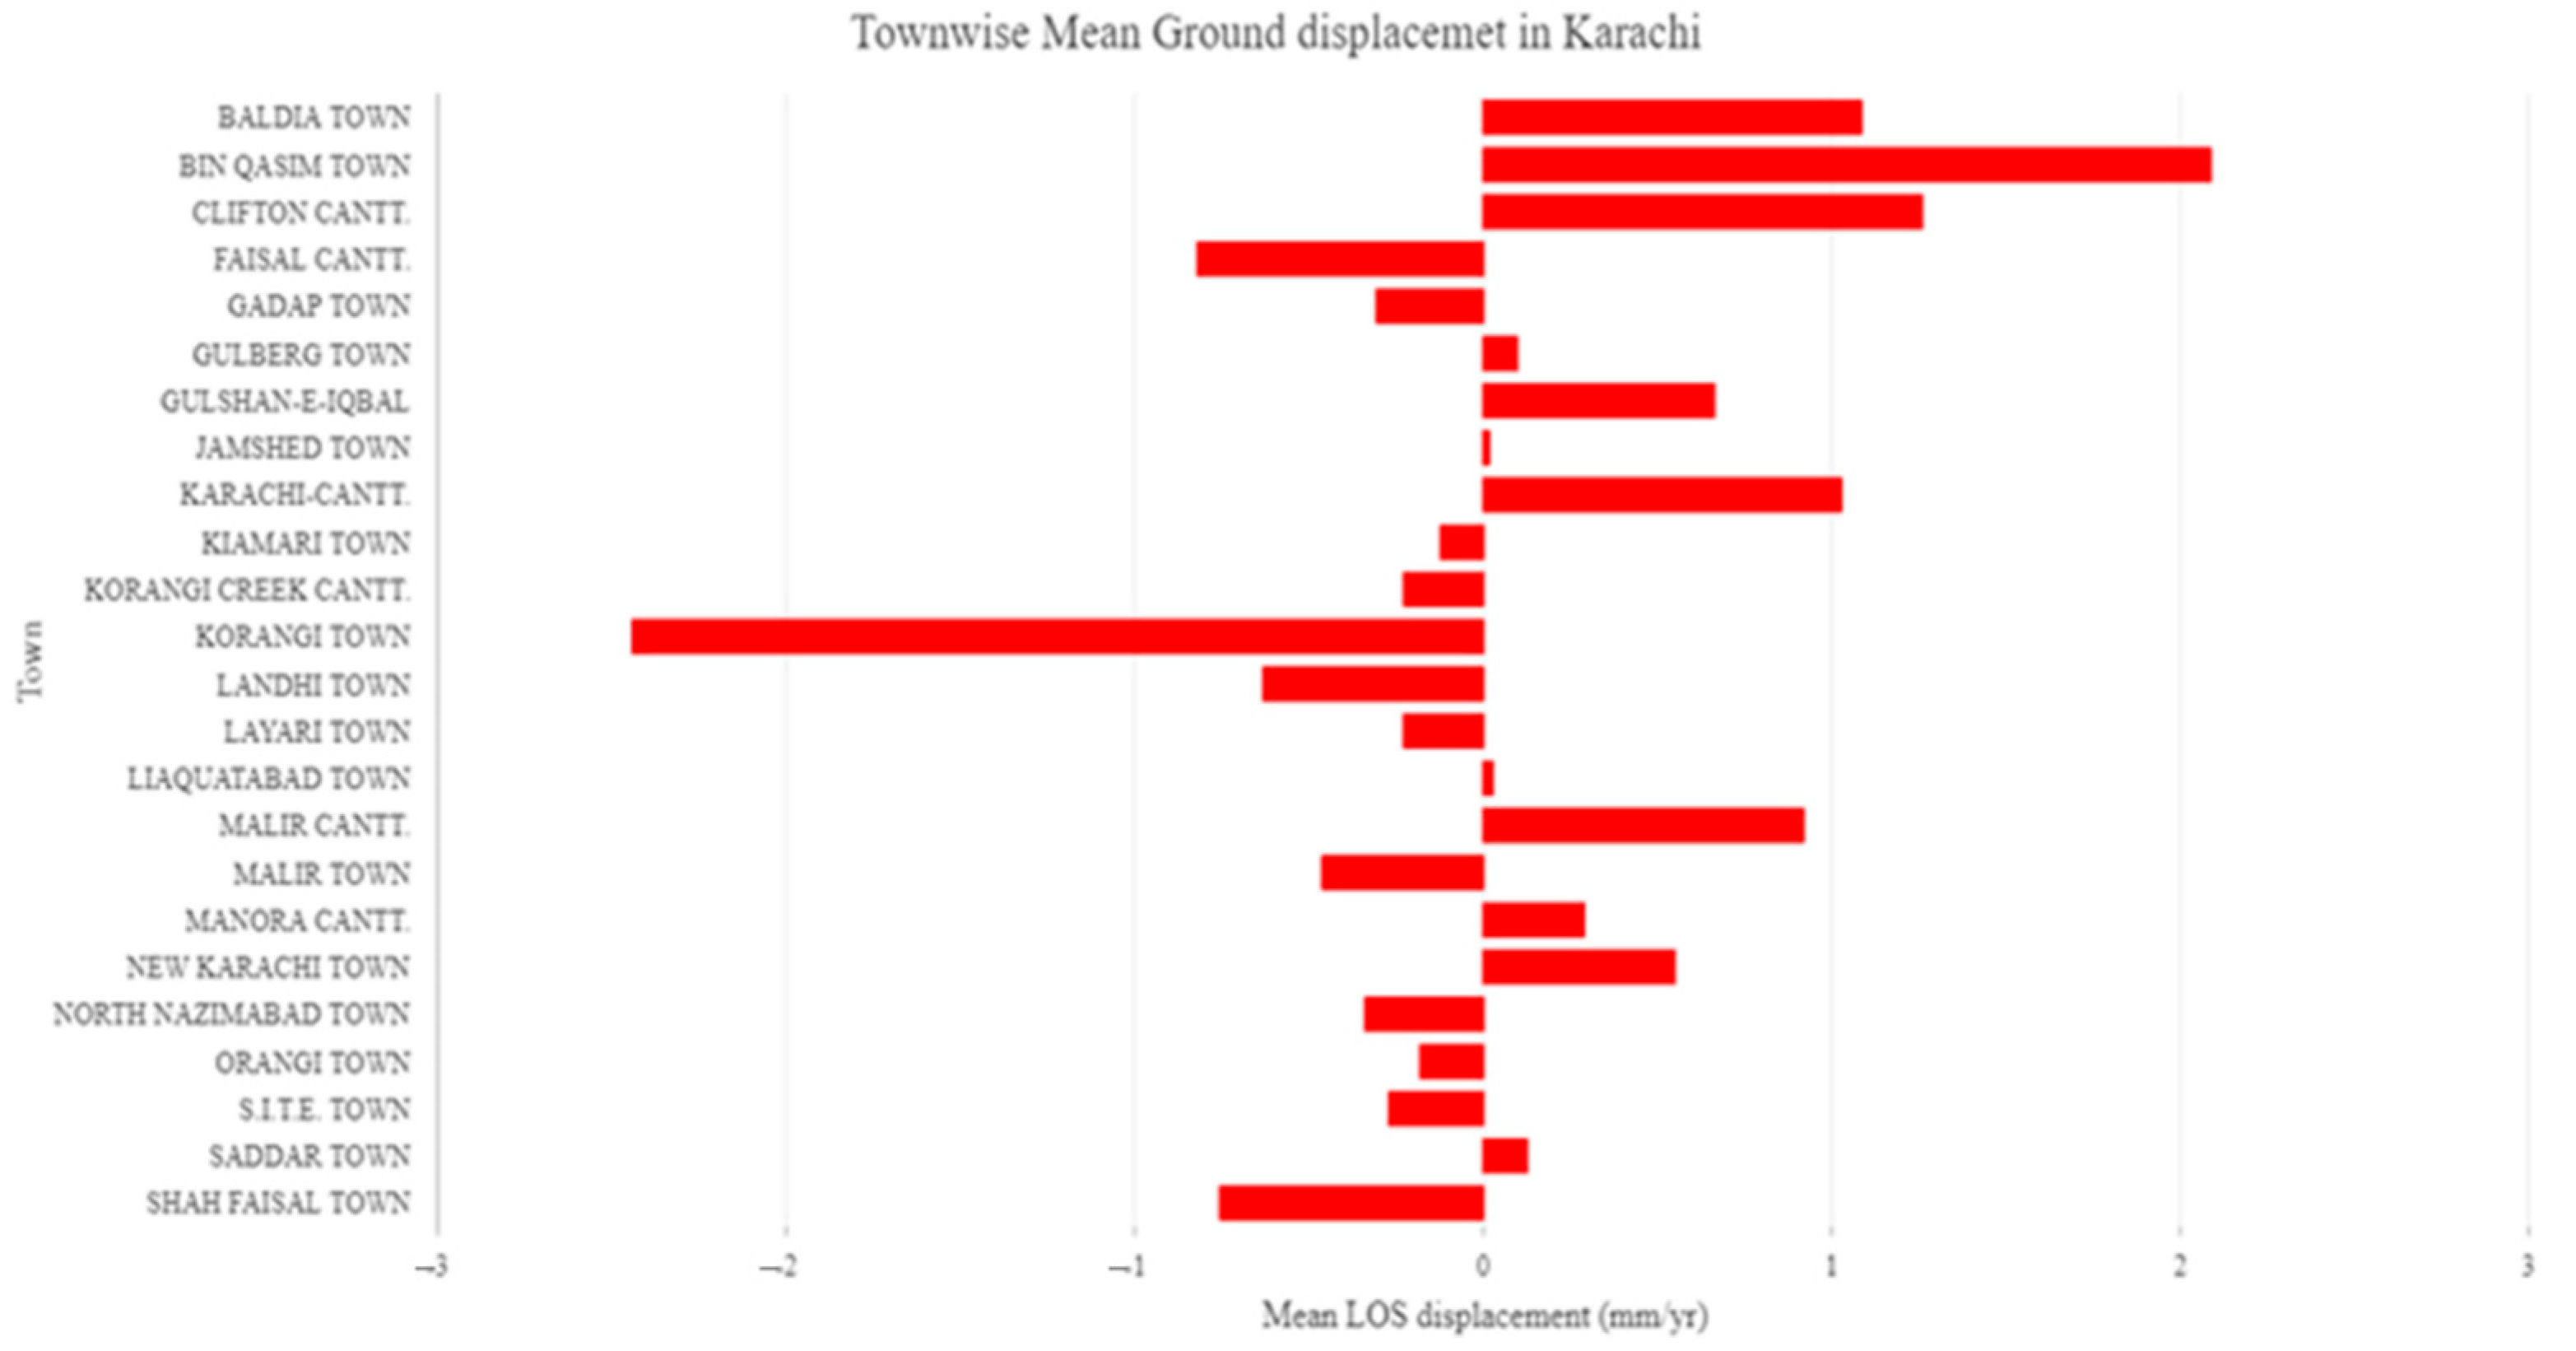
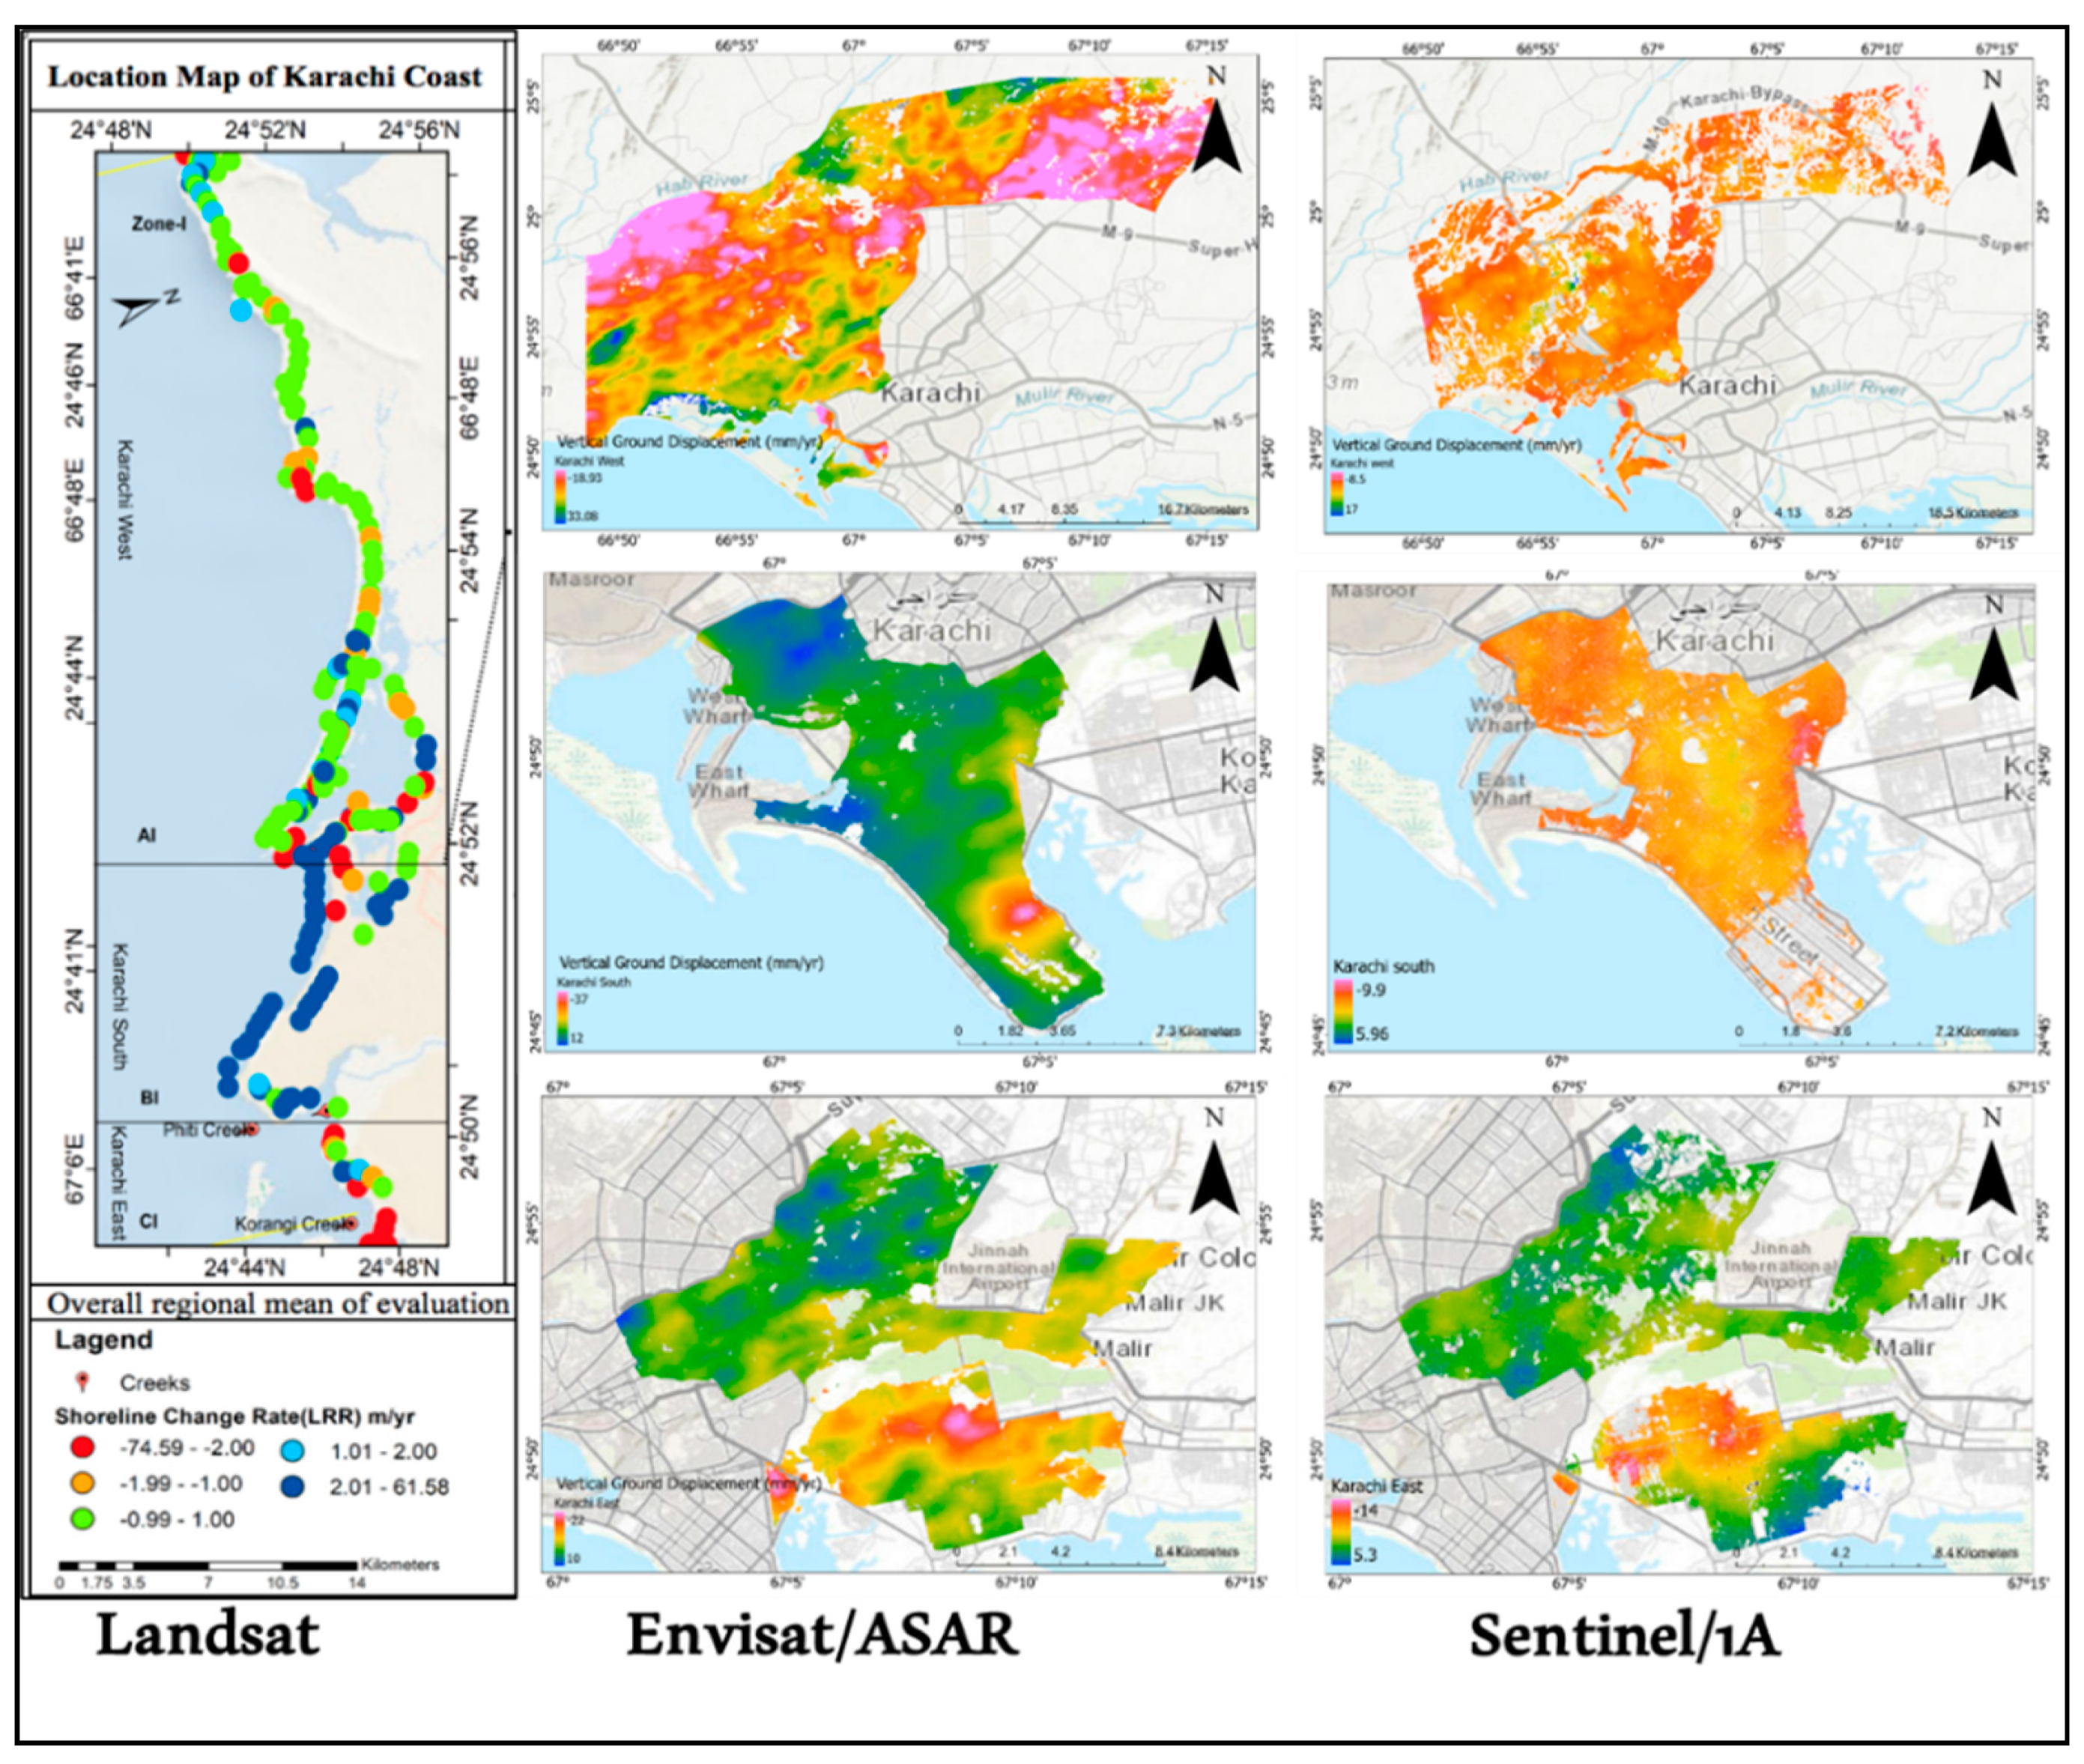
4.1. Displacement along the Karachi Coast (2004–2016)
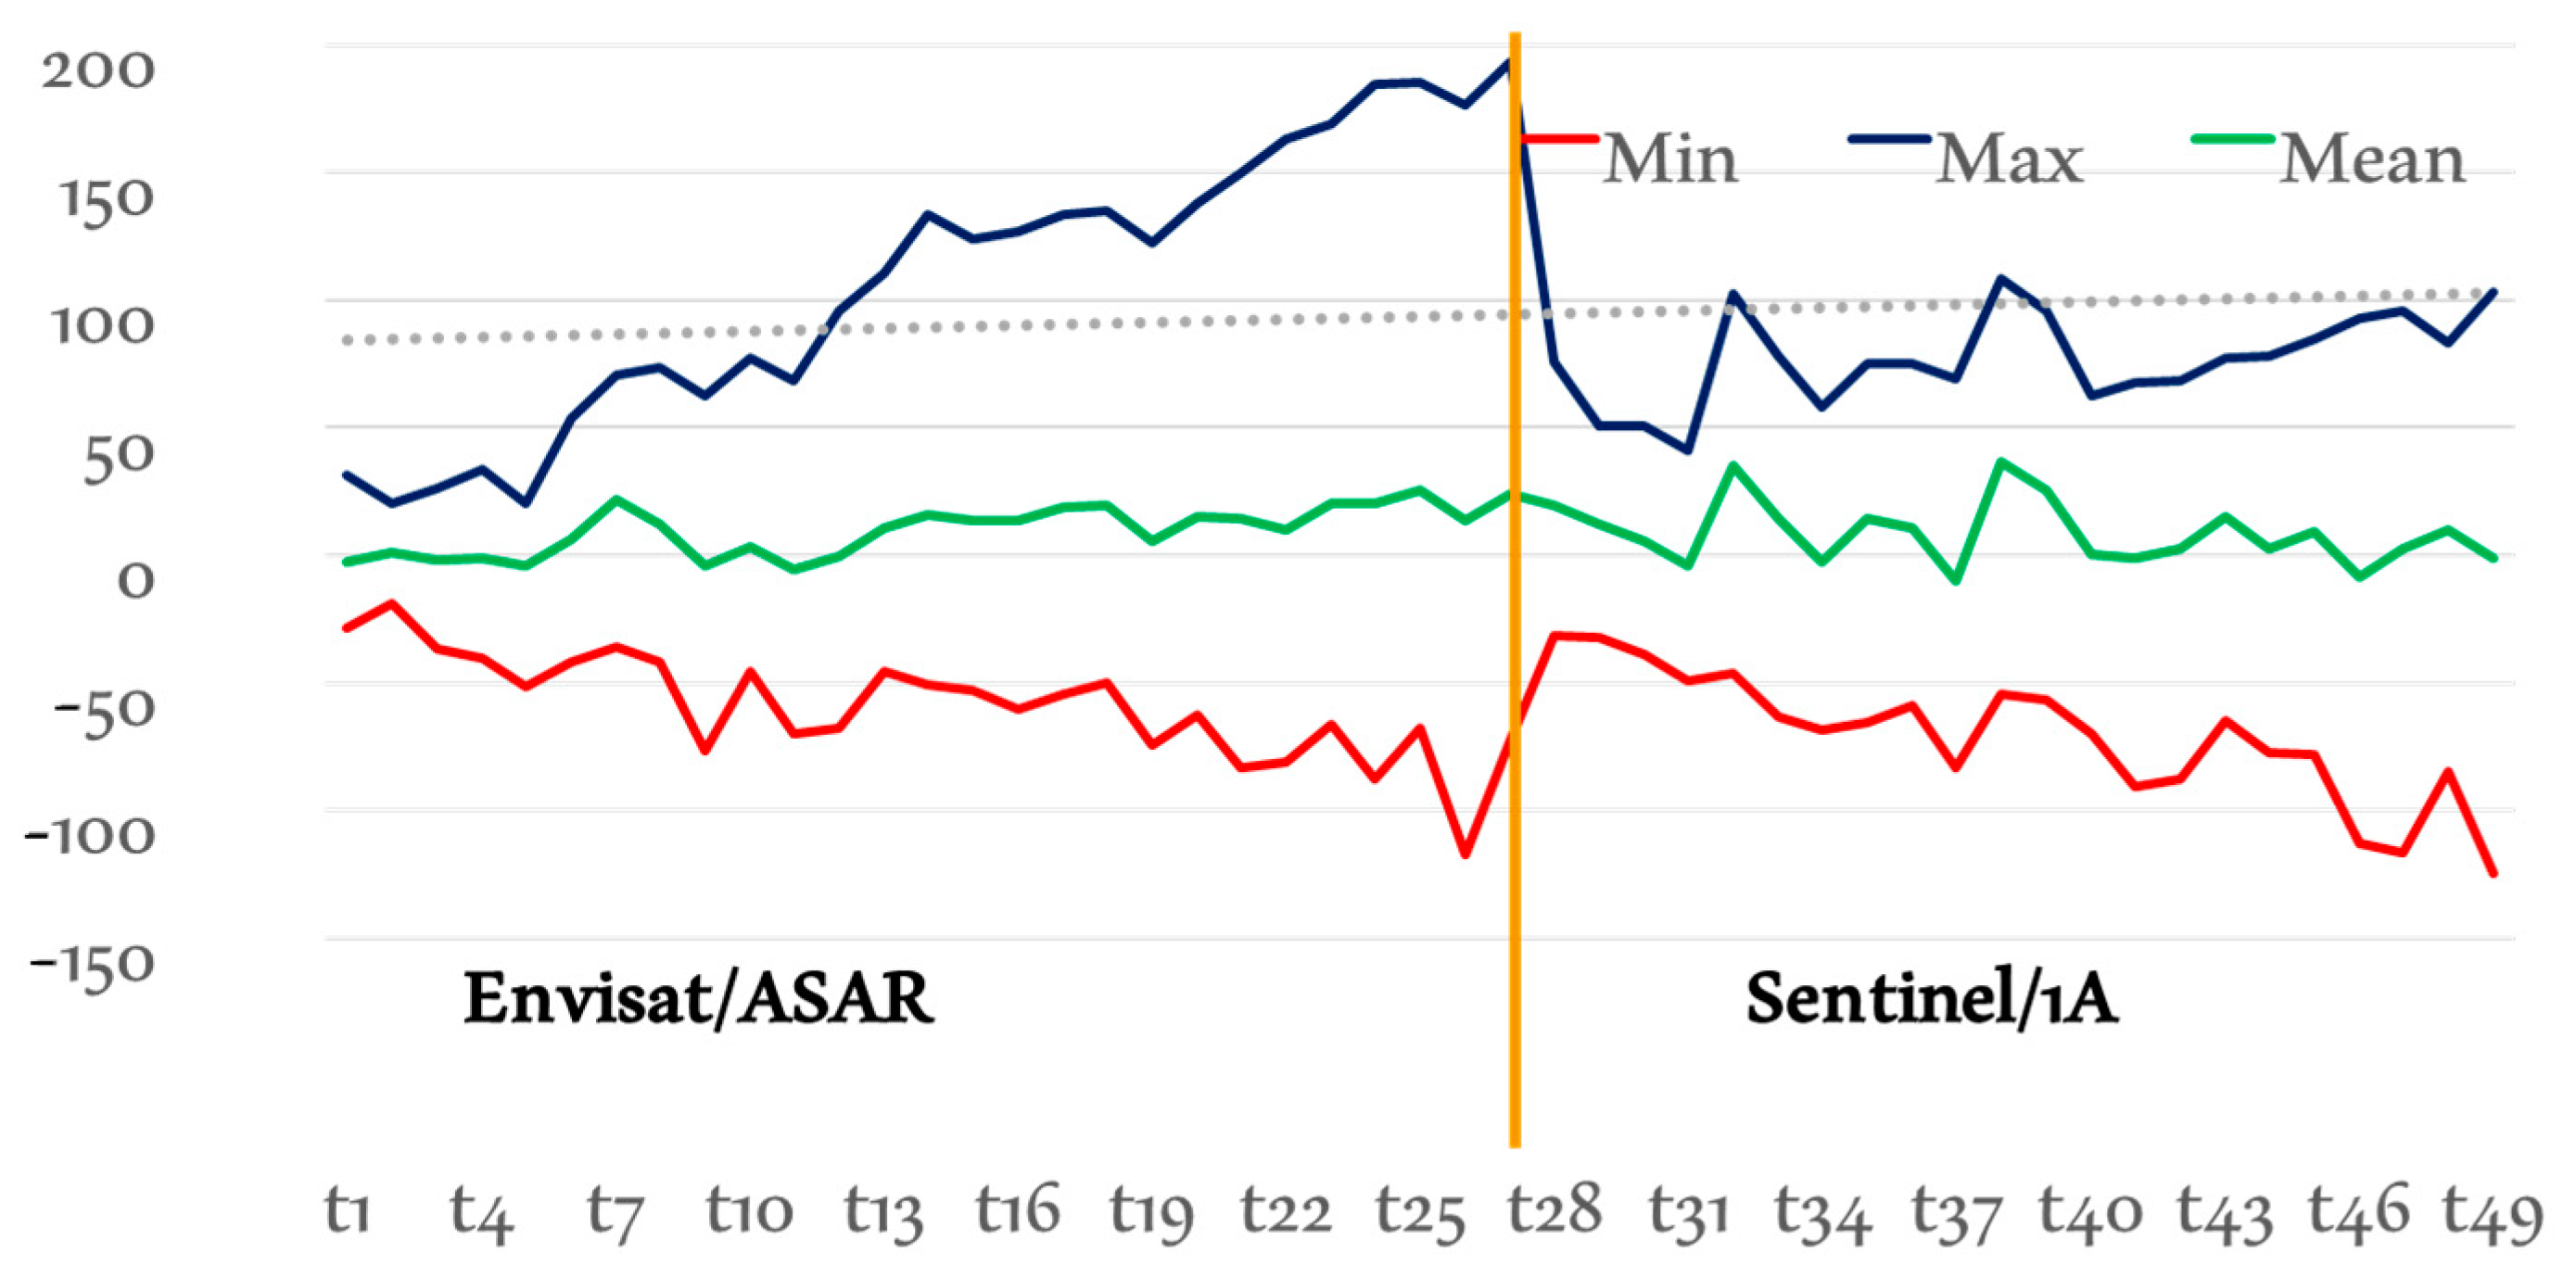
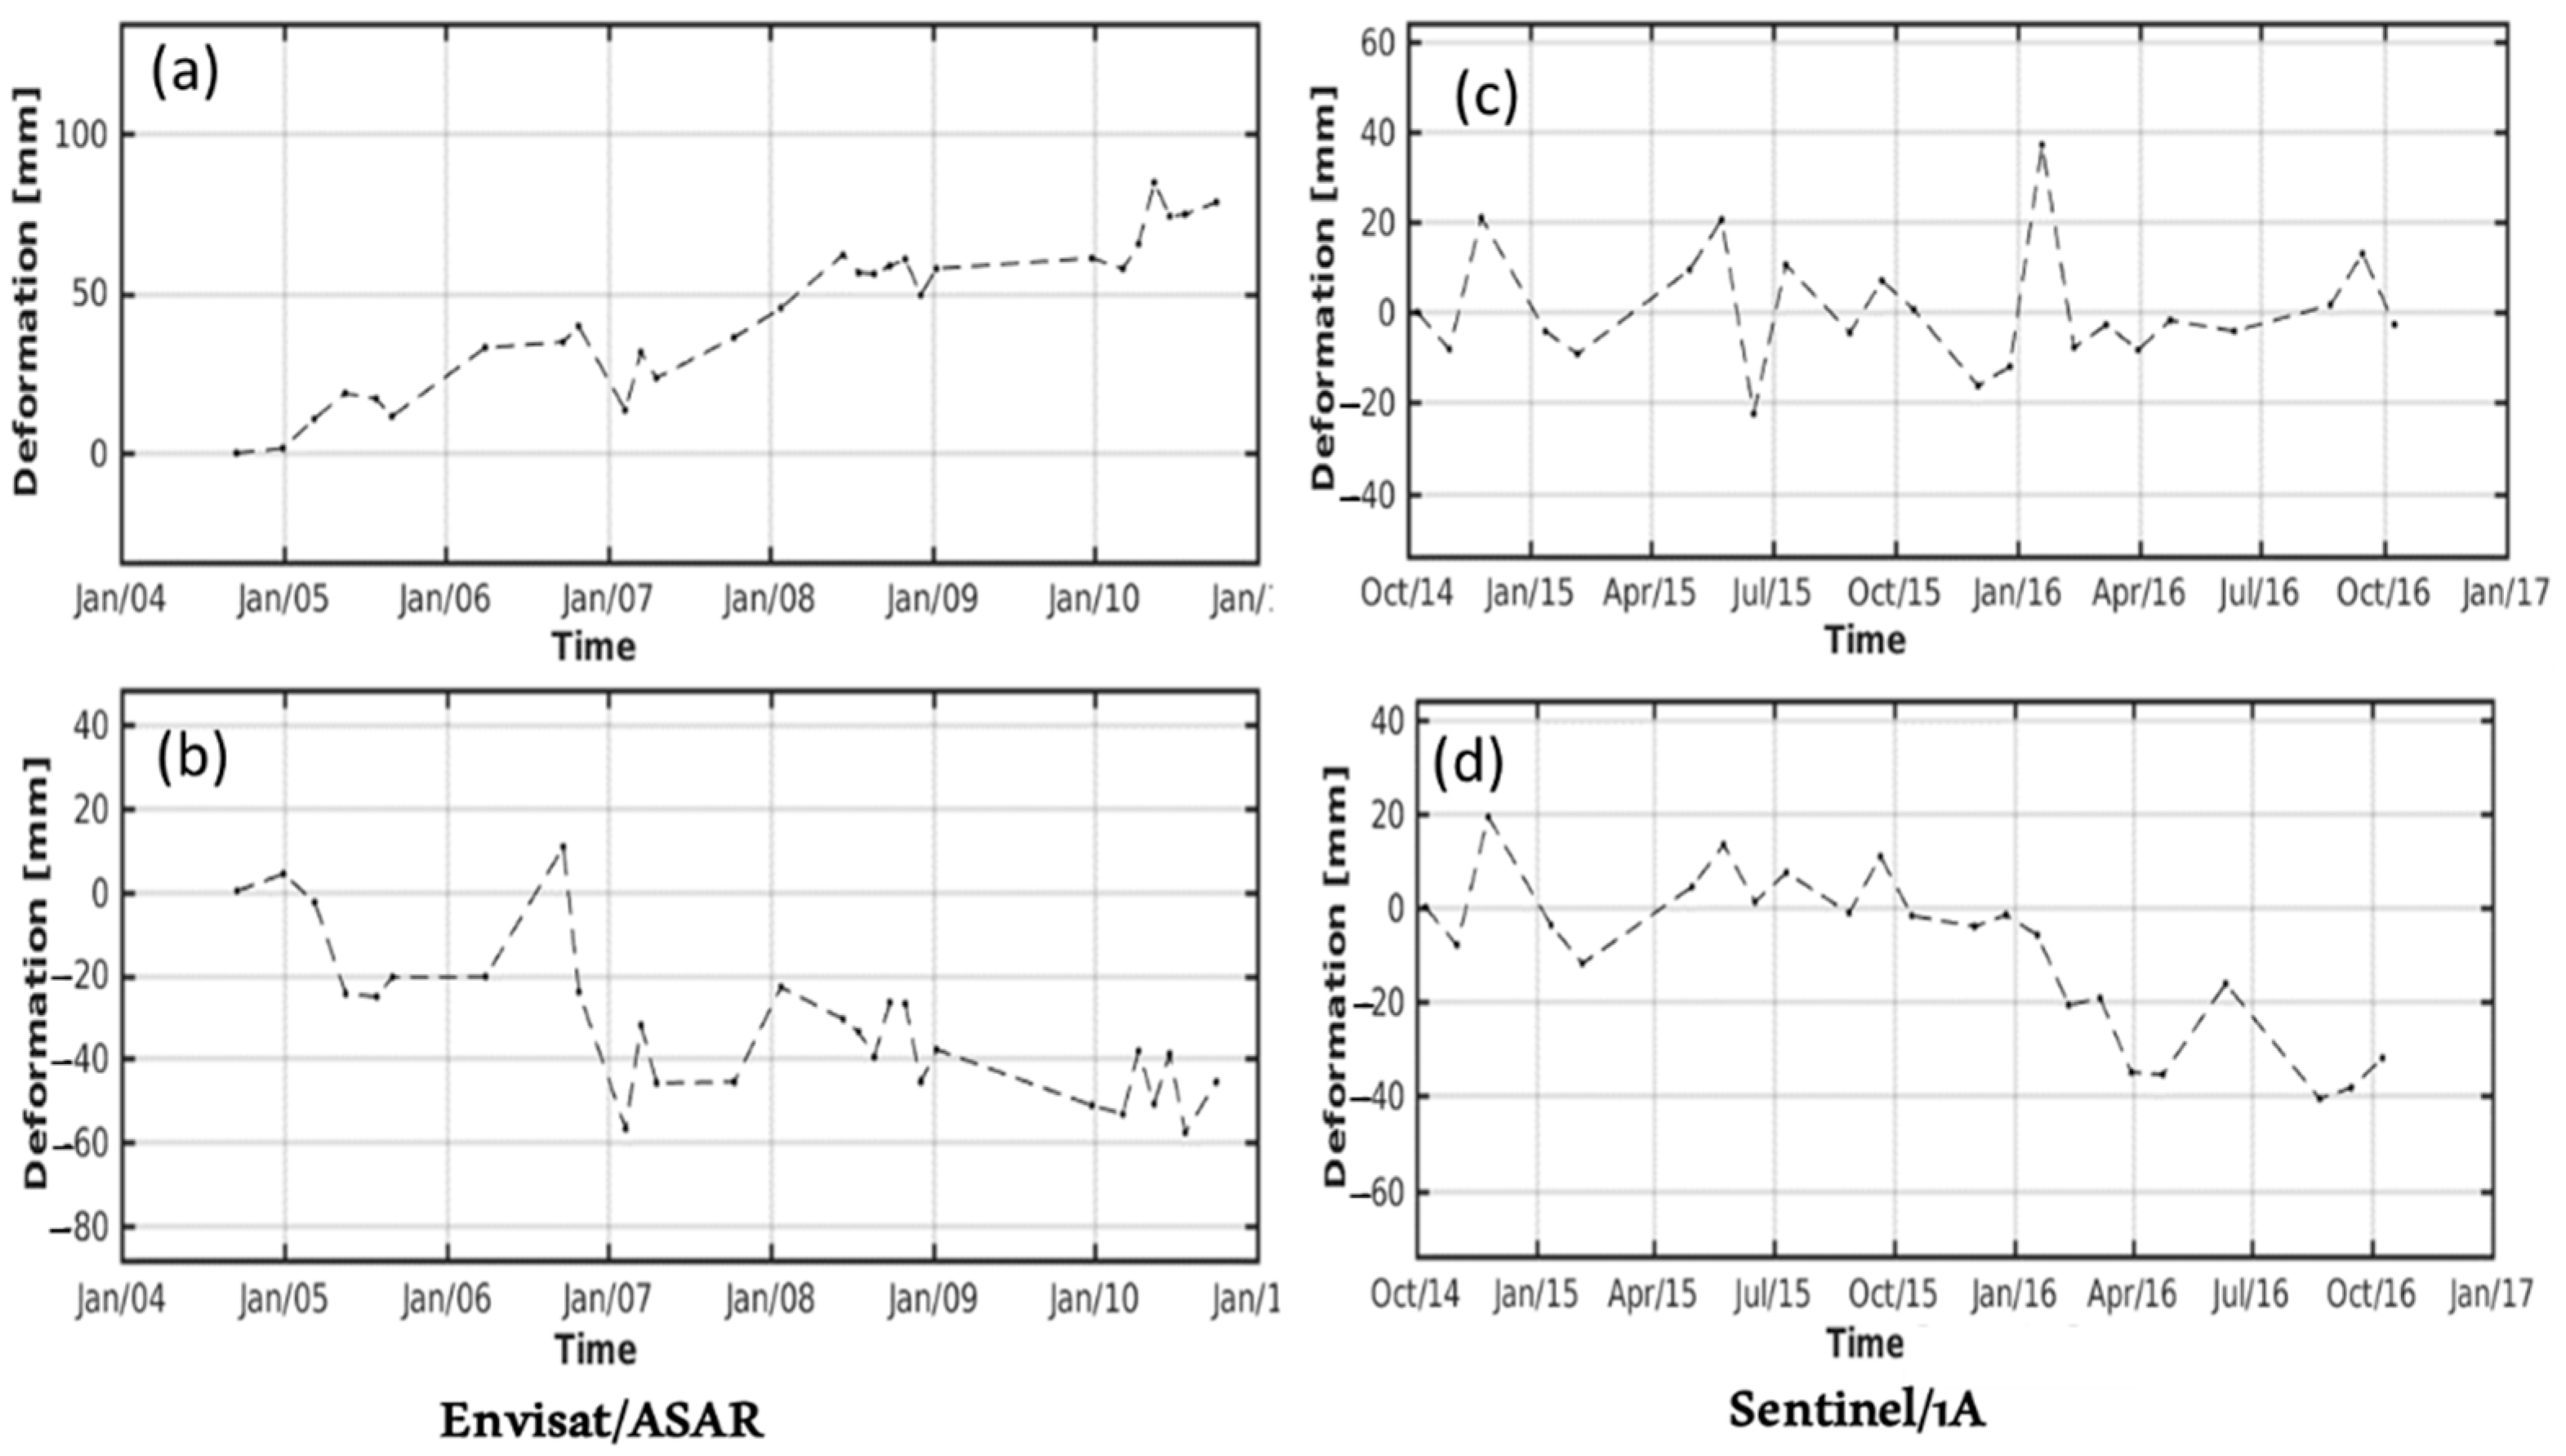
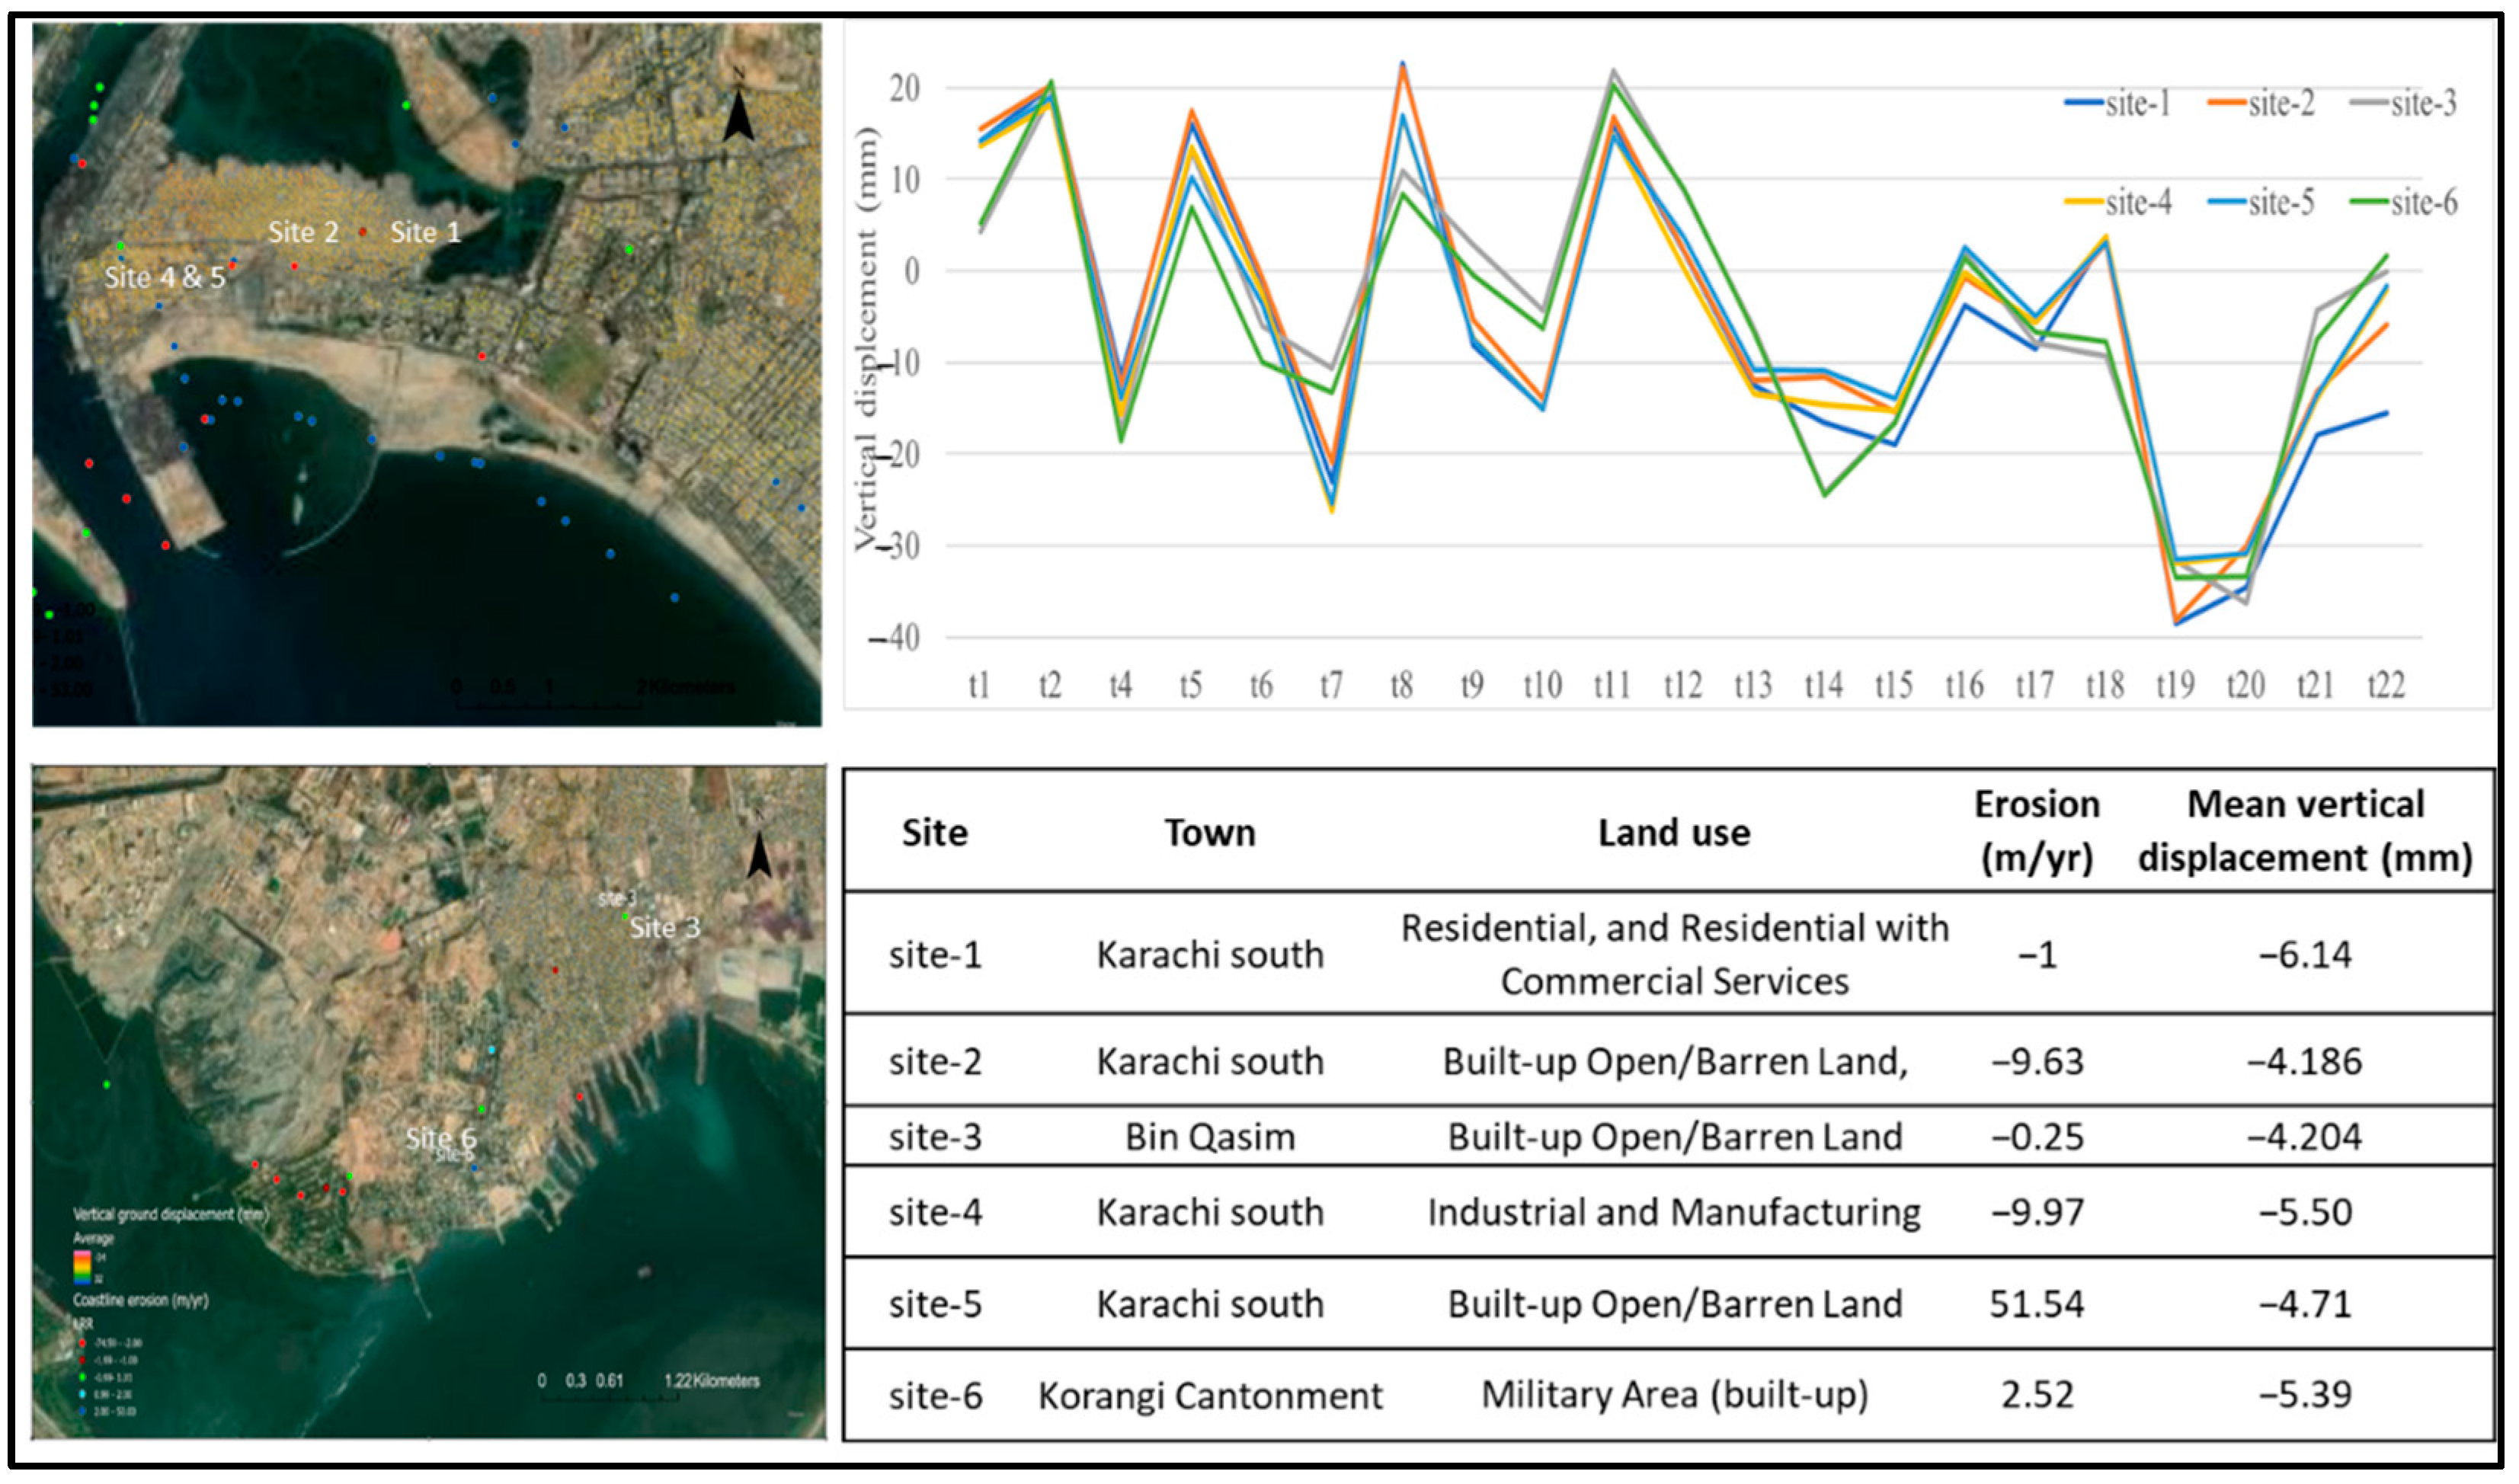
4.1.1. Vertical Ground Displacement Time Series
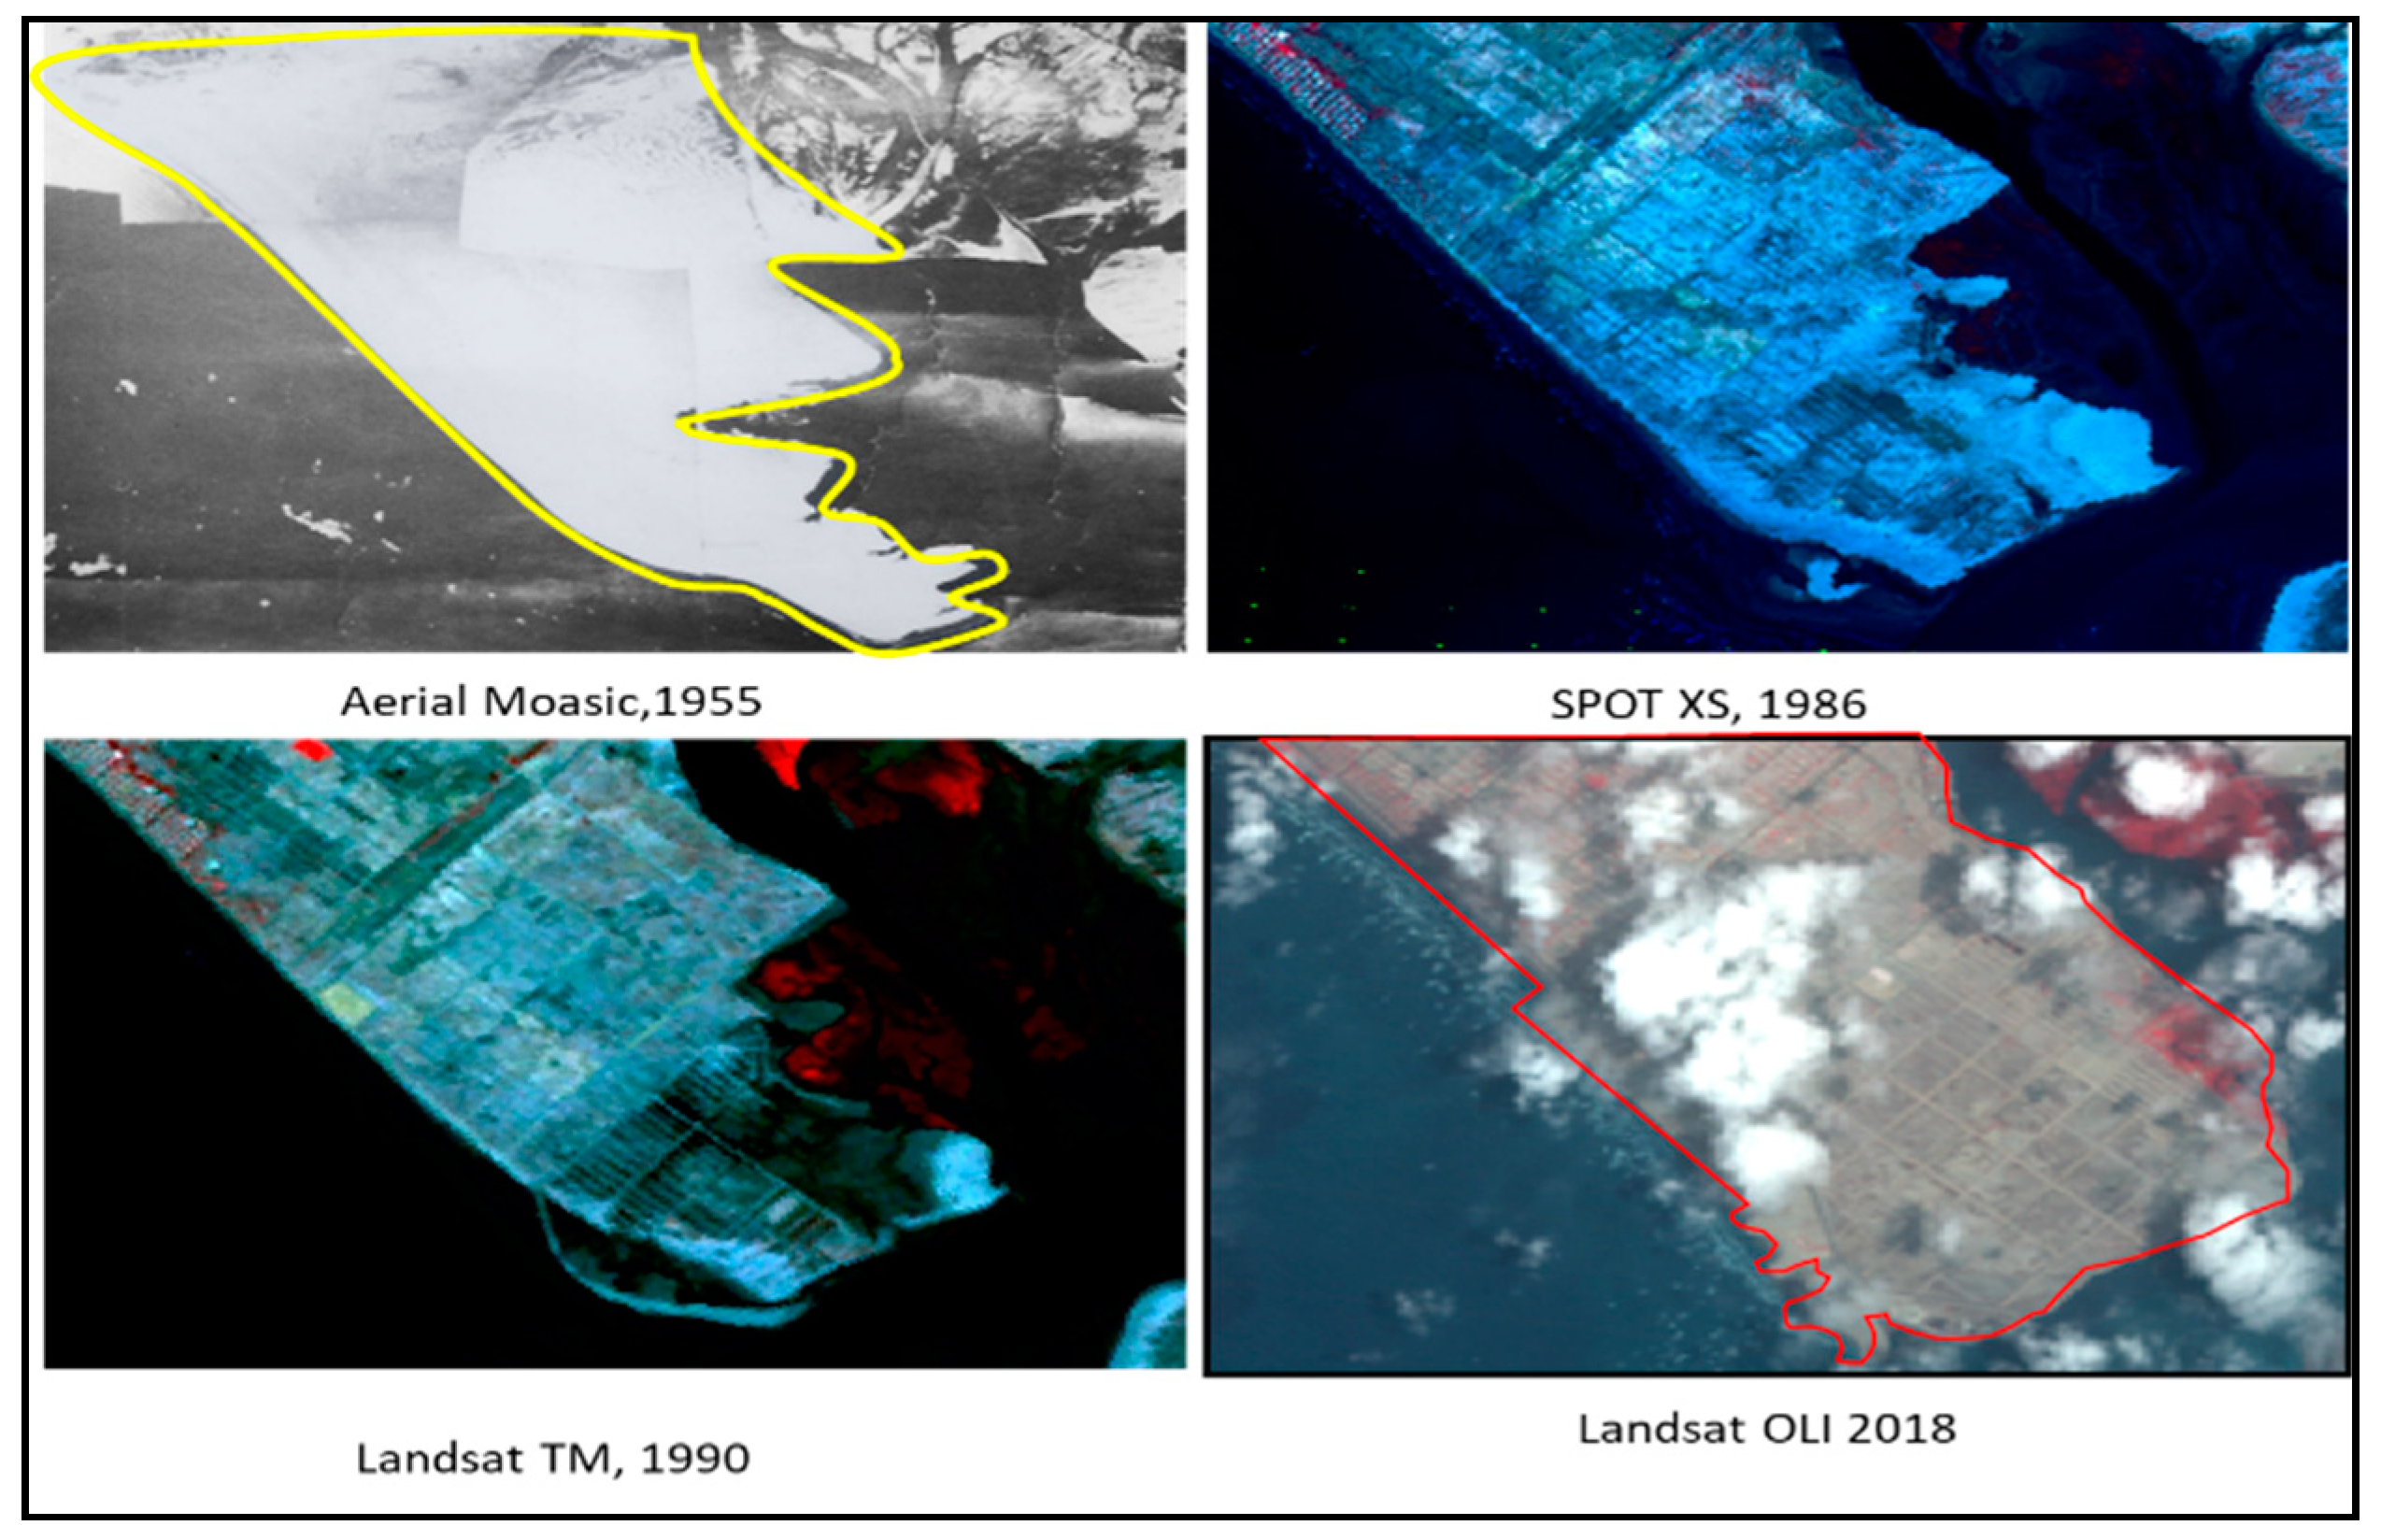
4.2. Erosion Rate along the Karachi Coast (1989–2018)
4.3. Influence of Ground Displacement on Coastal Erosion in Karachi
5. Discussion
5.1. Potential Factors Inducing Ground Displacement
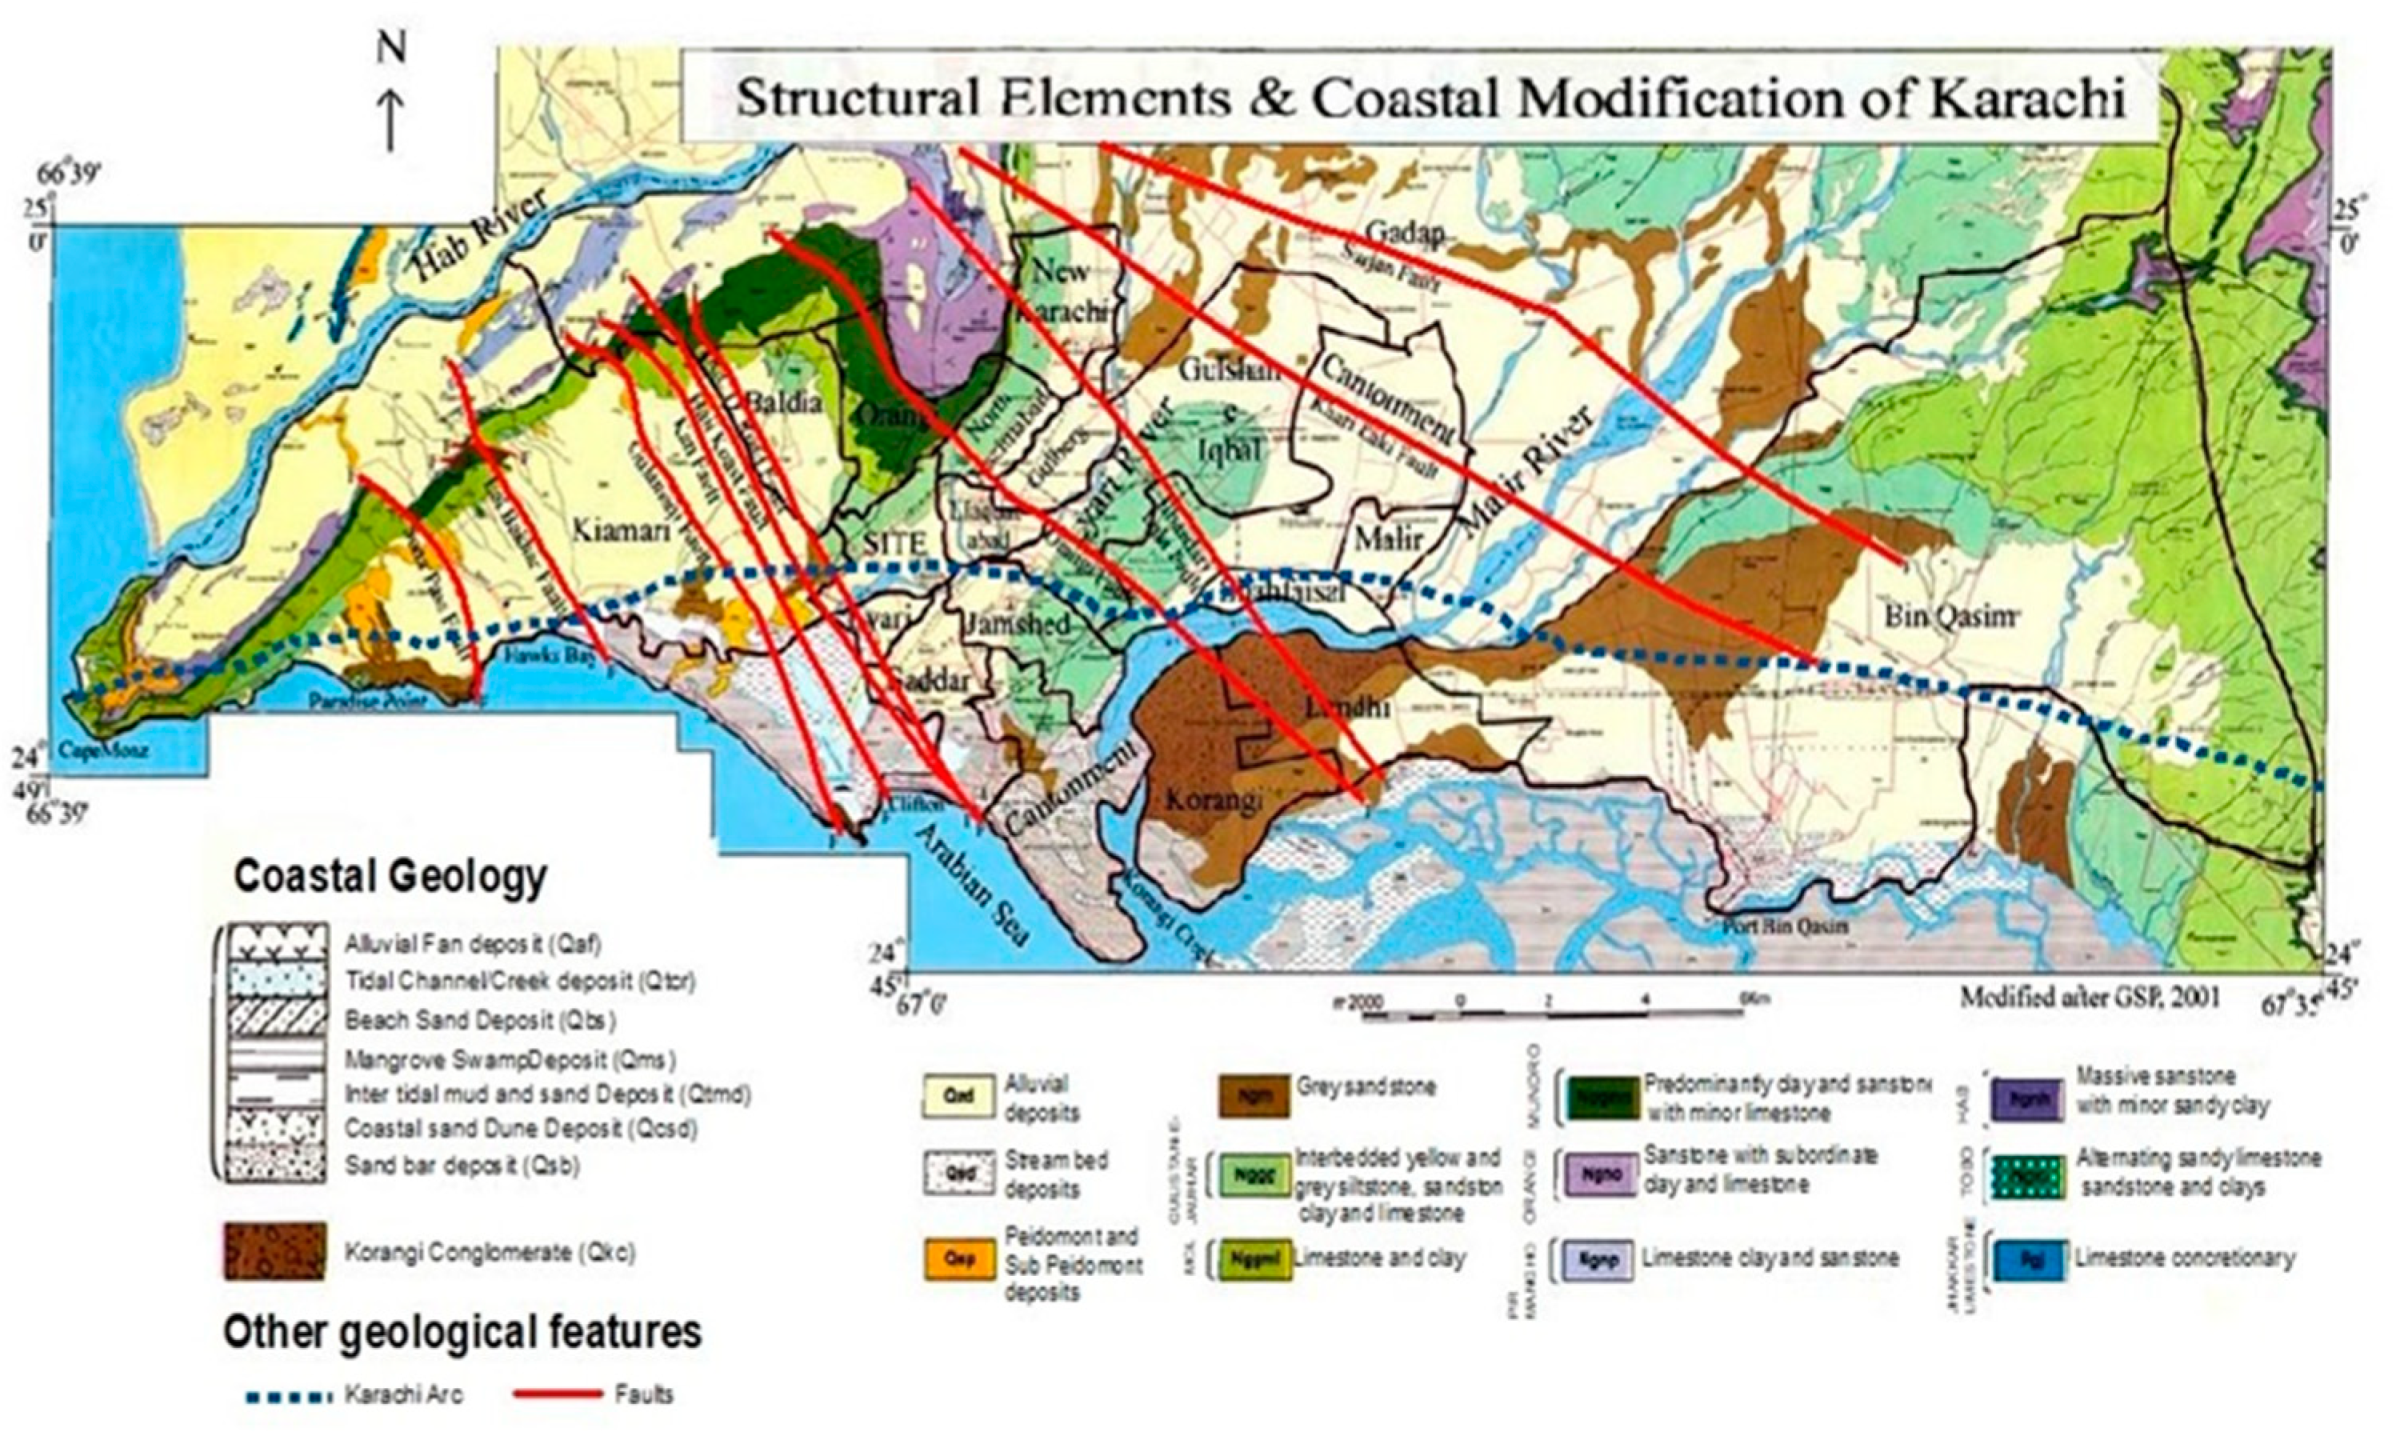
5.1.1. Role of Geology and Lithology
5.1.2. Unregulated and Excessive Groundwater Extraction
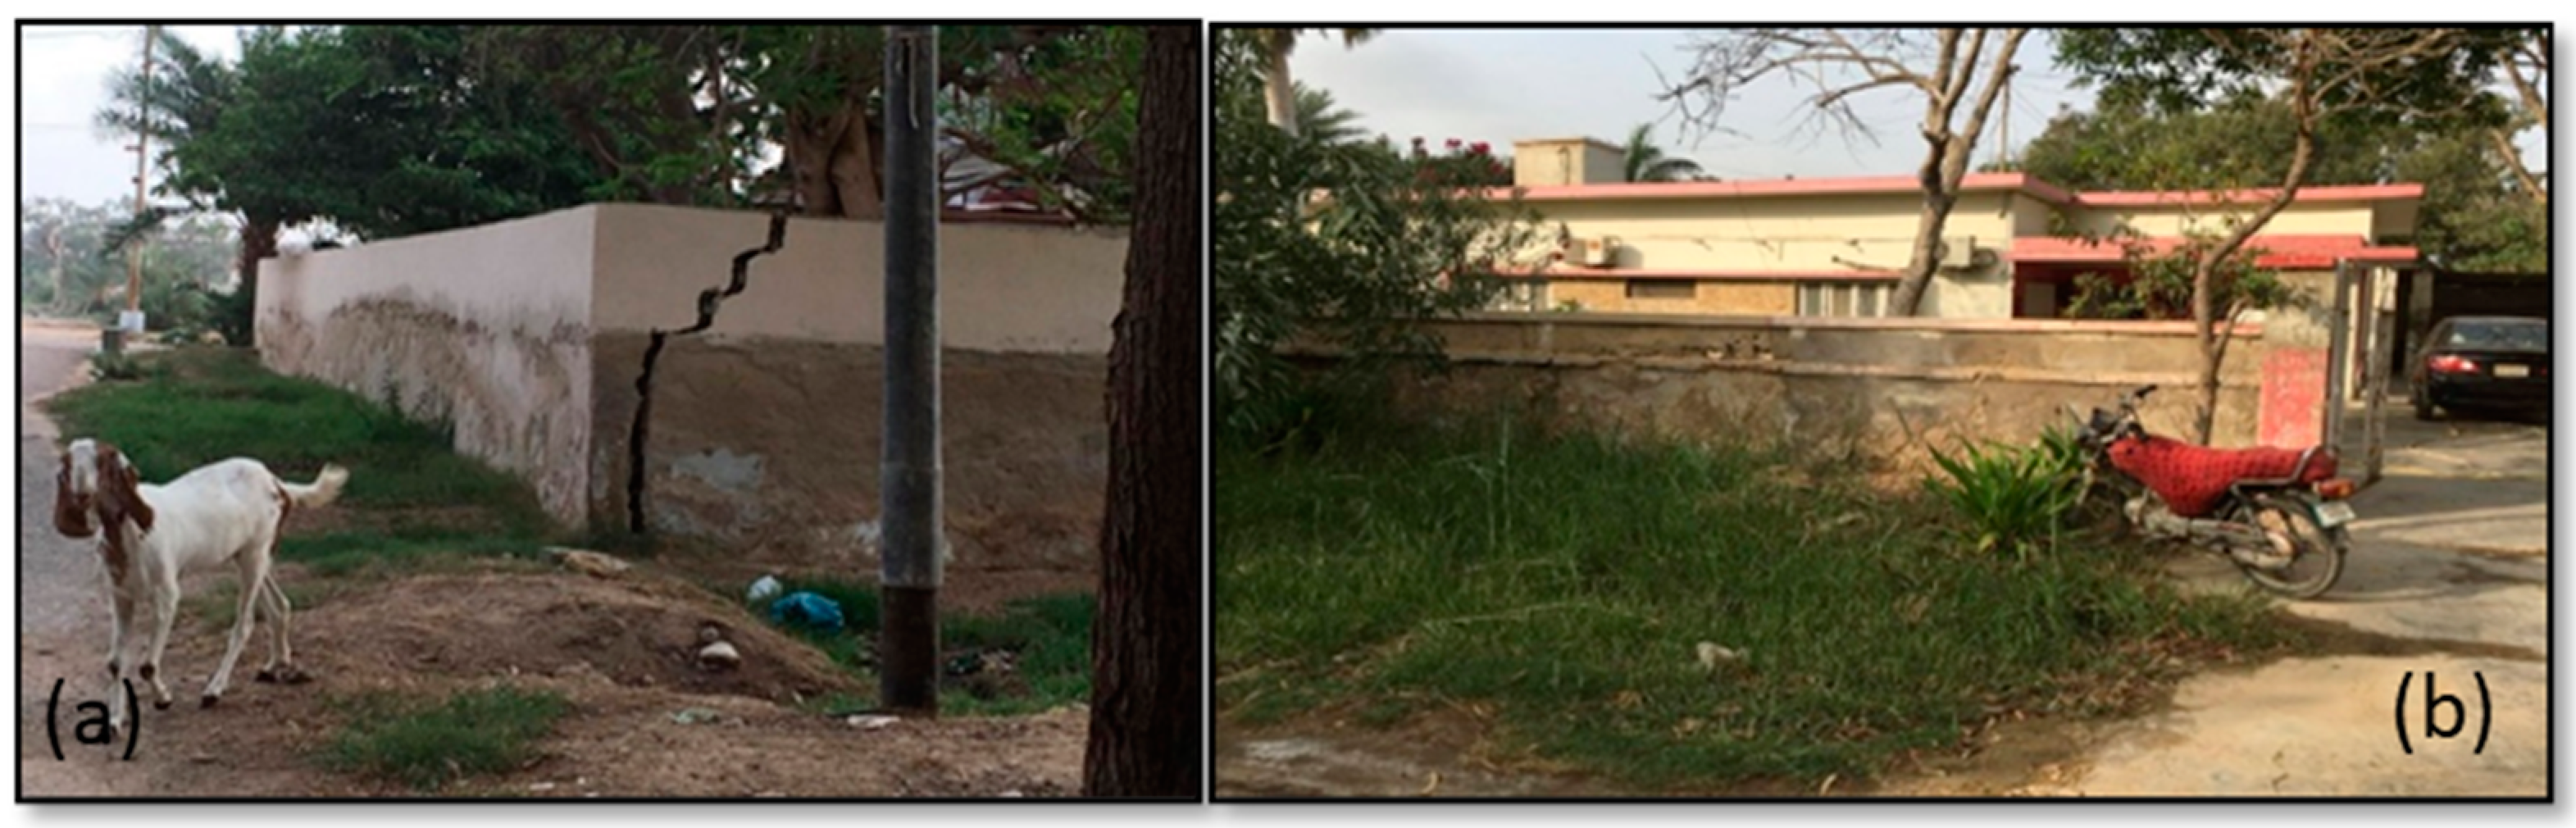
5.1.3. Structural Damage Due to Failed Sewerage System
5.1.4. Land Reclamation
5.1.5. Liquefaction
6. Limitation and Way Forward
7. Conclusions
Supplementary Materials
Author Contributions
Funding
Data Availability Statement
Acknowledgments
Conflicts of Interest
References
- Kontgis, C.; Schneider, A.; Ozdogan, M.; Kucharik, C.; Tri, V.P.D.; Duc, N.H.; Schatz, J. Climate Change Impacts on Rice Productivity in the Mekong River Delta. Appl. Geogr. 2019, 102, 71–83. [Google Scholar] [CrossRef]
- Syvitski, J.P.; Kettner, A.J.; Overeem, I.; Giosan, L.; Brakenridge, G.R.; Hannon, M.; Bilham, R. Anthropocene Metamorphosis of the Indus Delta and Lower Floodplain. Anthropocene 2013, 3, 24–35. [Google Scholar] [CrossRef]
- Syvitski, J.P.M.; Kettner, A.J.; Overeem, I.; Hutton, E.W.H.; Hannon, M.T.; Brakenridge, G.R.; Day, J.; Vörösmarty, C.; Saito, Y.; Giosan, L.; et al. Sinking Deltas Due to Human Activities. Nat. Geosci. 2009, 2, 681–686. [Google Scholar] [CrossRef]
- Dai, Z.; Mei, X.; Darby, S.; Lou, Y.; Li, W. Fluvial Sediment Transfer in the Changjiang (Yangtze) River-Estuary Depositional System. J. Hydrol. 2018, 566, 719–734. [Google Scholar] [CrossRef] [Green Version]
- Aucelli, P.P.C.; Di Paola, G.; Incontri, P.; Rizzo, A.; Vilardo, G.; Benassai, G.; Buonocore, B.; Pappone, G. Coastal Inundation Risk Assessment Due to Subsidence and Sea Level Rise in a Mediterranean Alluvial Plain (Volturno Coastal Plain—Southern Italy). Estuar. Coast. Shelf Sci. 2017, 198, 597–609. [Google Scholar] [CrossRef]
- Milliman, J.D.; Haq, B.U. Sea-Level Rise and Coastal Subsidence: Causes, Consequences, and Strategies; Springer Science & Business Media: Berlin/Heidelberg, Germany, 2013; Volume 2. [Google Scholar]
- Kanwal, S.; Ding, X.; Sajjad, M.; Abbas, S. Three Decades of Coastal Changes in Sindh, Pakistan (1989–2018): A Geospatial Assessment. Remote Sens. 2020, 12, 8. [Google Scholar] [CrossRef] [Green Version]
- Do, A.T.; de Vries, S.; Stive, M.J.F. Beach Evolution Adjacent to a Seasonally Varying Tidal Inlet in Central Vietnam. J. Coast. Res. 2018, 34, 6–25. [Google Scholar] [CrossRef] [Green Version]
- Duc, D.M.; Nhuan, M.T.; Van Ngoi, C. An Analysis of Coastal Erosion in the Tropical Rapid Accretion Delta of the Red River, Vietnam. J. Southeast Asian Earth Sci. 2012, 43, 98–109. [Google Scholar] [CrossRef]
- Duc, D.M.; Yasuhara, K.; Hieu, N.M.; Lan, N.C. Climate Change Impacts on a Large-Scale Erosion Coast of Hai Hau District, Vietnam and the Adaptation. J. Coast. Conserv. 2017, 21, 47–62. [Google Scholar] [CrossRef]
- Khan, F.A.; Khan, T.M.A.; Ahmed, A.N.; Afan, H.A.; Sherif, M.; Sefelnasr, A.; El-Shafie, A. Complex Extreme Sea Levels Prediction Analysis: Karachi Coast Case Study. Entropy 2020, 22, 549. [Google Scholar] [CrossRef]
- Kidwai, S.; Ahmed, W.; Tabrez, S.M.; Zhang, J.; Giosan, L.; Clift, P.; Inam, A. The Indus Delta—Catchment, River, Coast, and People. Coasts Estuaries 2019, 2019, 213–232. [Google Scholar]
- Kanwal, S.; Ding, X.; Sajjad, M.; Nazeer, M.; Zia, I. Remote Sensing of Narrowing Barrier Islands along the Coast of Pakistan over Past 30 Years. J. Mar. Sci. Eng. 2021, 9, 295. [Google Scholar] [CrossRef]
- Bilham, R.; Lodi, S.; Hough, S.; Bukhary, S.; Khan, A.M.; Rafeeqi, S.F.A. Seismic Hazard in Karachi, Pakistan: Uncertain Past, Uncertain Future. Seismol. Res. Lett. 2007, 78, 601–613. [Google Scholar] [CrossRef] [Green Version]
- Fattahi, H.; Amelung, F.; Chaussard, E.; Wdowinski, S. Coseismic and Postseismic Deformation Due to the 2007 M5.5 Ghazaband Fault Earthquake, Balochistan, Pakistan. Geophys. Res. Lett. 2015, 42, 3305–3312. [Google Scholar] [CrossRef]
- Panhwar, M.H. Seepage of Water of the River Indus and Occurrence of Fresh Ground Water in Sindh. The Indus River: Biodiversity, Resources, Humankind; Oxford University Press: Delhi, India, 1999; pp. 180–197. [Google Scholar]
- Rahman, A.-U.; Khan, A.N.; Shaw, R. Disaster Risk Reduction Approaches in Pakistan; Springer: Tokyo, Japan, 2015. [Google Scholar]
- Amin, G.; Shahzad, M.I.; Jaweria, S.; Zia, I. Measuring Land Deformation in a Mega City Karachi-Pakistan with Sentinel SAR Interferometry. Geocarto Int. 2021, 1–15. [Google Scholar] [CrossRef]
- Kanwal, S.; Ding, X.; Zhang, L. Measurement of Vertical Deformation in Karachi Using Multi-Temporal Insar. In Proceedings of the IEEE International Geoscience and Remote Sensing Symposium (IGARSS 2018), Valencia, Spain, 23–27 July 2018. [Google Scholar]
- Shi, X.; Liao, M.; Li, M.; Zhang, L.; Cunningham, C. Wide-Area Landslide Deformation Mapping with Multi-Path ALOS PALSAR Data Stacks: A Case Study of Three Gorges Area, China. Remote Sens. 2016, 8, 136. [Google Scholar] [CrossRef] [Green Version]
- Wang, H.; Wright, T.J.; Yu, Y.; Lin, H.; Jiang, L.; Li, C.; Qiu, G. InSAR Reveals Coastal Subsidence in the Pearl River Delta, China. Geophys. J. Int. 2012, 191, 1119–1128. [Google Scholar] [CrossRef] [Green Version]
- Tomás, R.; Li, Z.; Liu, P.; Singleton, A.; Hoey, T.; Cheng, X. Spatiotemporal Characteristics of the Huangtupo Landslide in the Three Gorges Region (China) Constrained by Radar Interferometry. Geophys. J. Int. 2014, 197, 213–232. [Google Scholar] [CrossRef] [Green Version]
- Tosi, L.; Teatini, P.; Strozzi, T. Natural versus Anthropogenic Subsidence of Venice. Sci. Rep. 2013, 3, 2710. [Google Scholar] [CrossRef] [Green Version]
- Wang, J.; Gao, W.; Xu, S.; Yu, L. Evaluation of the Combined Risk of Sea Level Rise, Land Subsidence, and Storm Surges on the Coastal Areas of Shanghai, China. Clim. Chang. 2012, 115, 537–558. [Google Scholar] [CrossRef]
- Hamid, G. Geotechnical Evaluation of Rocks and Soils of Karachi Area and Their Impact on Urbanization. Ph.D. Thesis, University of Karachi, Karachi, Pakistan, 2011. [Google Scholar]
- Gehlot, S.; Ketelaar, V.B.H.; Verbree, E.; Hanssen, R.F. Conceptual Framework for PS-InSAR Deformation Interpretation Assisted by Geo-Information Technology. High Resolut. Earth Imaging Geospat. Inf. 2005, 17–20. [Google Scholar]
- Zhang, L.; Lu, Z.; Ding, X.; Jung, H.-S.; Feng, G.; Lee, C.-W. Mapping Ground Surface Deformation Using Temporarily Coherent Point SAR Interferometry: Application to Los Angeles Basin. Remote Sens. Environ. 2012, 117, 429–439. [Google Scholar] [CrossRef]
- Soergel, U. Radar Remote Sensing of Urban Areas; Springer Science & Business Media: Berlin/Heidelberg, Germany, 2010; Volume 15. [Google Scholar]
- Liu, G.; Jia, H.; Nie, Y.; Li, T.; Zhang, R.; Yu, B.; Li, Z. Detecting Subsidence in Coastal Areas by Ultrashort-Baseline TCPInSAR on the Time Series of High-Resolution TerraSAR-X Images. IEEE Trans. Geosci. Remote Sens. Lett. 2013, 52, 1911–1923. [Google Scholar] [CrossRef]
- Sun, Q.; Zhang, L.; Ding, X.; Hu, J.; Liang, H. Investigation of Slow-Moving Landslides from ALOS/PALSAR Images with TCPInSAR: A Case Study of Oso, USA. Remote Sens. 2014, 7, 72–88. [Google Scholar] [CrossRef]
- Zhang, Y.; Zhang, J.; Wu, H.; Lu, Z.; Guangtong, S. Monitoring of Urban Subsidence with SAR Interferometric Point Target Analysis: A Case Study in Suzhou, China. Int. J. Appl. Earth Obs. Geoinf. 2011, 13, 812–818. [Google Scholar] [CrossRef]
- Zhang, L. Temporarily Coherent Point SAR Interferometry; The Hong Kong Polytechnic University: Hong Kong, China, 2012. [Google Scholar]
- Zhang, L.; Ding, X.; Lu, Z.; Jung, H.-S.; Hu, J.; Feng, G. A Novel Multitemporal InSAR Model for Joint Estimation of Deformation Rates and Orbital Errors. IEEE Trans. Geosci. Remote Sens. 2013, 52, 3529–3540. [Google Scholar] [CrossRef] [Green Version]
- Ashrafianfar, N.; Busch, W.; Dehghani, M.; Haghighatmehr, P. Differential SAR Interferometric Technique for Land Subsidence Monitoring Due to Groundwater Over-Exploitation in the Hashtgerd. In Proceedings of the ‘Fringe 2009 Workshop’, Frascati, Italy, 30 November–4 December 2009. [Google Scholar]
- Han, J.-Y. Interferometric Synthetic Aperture Radar Observation of Vertical Land Displacement in the Vicinity of the All-American Canal at the United States and Mexico Border; ProQuest: Salt Lake City, UT, USA, 2008; Volume 69-03, p. 1535. [Google Scholar]
- Deledalle, C.-A.; Denis, L.; Tupin, F.; Reigber, A.; Jager, M. NL-SAR: A Unified Nonlocal Framework for Resolution-Preserving (Pol)(In)SAR Denoising. IEEE Trans. Geosci. Remote Sens. 2015, 53, 2021–2038. [Google Scholar] [CrossRef] [Green Version]
- Zhang, L.; Ding, X.; Lu, Z. Deformation Rate Estimation on Changing Landscapes Using Temporarily Coherent Point InSAR. In Proceedings of the Fringe Conference, Frascati, Italy, 19–23 September 2011. [Google Scholar]
- Wang, Q.; Zhao, Q.; Ding, J.; Fedotov, A.A.; Badenko, V.; Liu, M.; Pepe, A. Investigation of the Ground Displacement in Saint Petersburg, Russia, Using Multiple-Track Differential Synthetic Aperture Radar Interferometry. Int. J. Appl. Earth Obs. Geoinf. 2020, 87, 102050. [Google Scholar] [CrossRef]
- Xu, W.; Wu, S.; Materna, K.; Nadeau, R.; Floyd, M.; Funning, G.; Chaussard, E.; Johnson, C.W.; Murray, J.R.; Ding, X.; et al. Interseismic Ground Deformation and Fault Slip Rates in the Greater San Francisco Bay Area from Two Decades of Space Geodetic Data. J. Geophys. Res. Solid Earth 2018, 123, 8095–8109. [Google Scholar] [CrossRef]
- Armenio, E.; De Serio, F.; Mossa, M. Analysis of Data Characterizing Tide and Current Fluxes in Coastal Basins. Hydrol. Earth Syst. Sci. 2017, 21, 3441–3454. [Google Scholar] [CrossRef] [Green Version]
- Nassar, K.; Mahmod, W.E.; Fath, H.; Masria, A.; Nadaoka, K.; Negm, A. Shoreline Change Detection using DSAS Technique: Case of North Sinai Coast, Egypt. Mar. Georesources Geotechnol. 2019, 37, 81–95. [Google Scholar] [CrossRef]
- Niamatullah, M.; Imran, M. Structural Geometry and Tectonics of Southern Part of Karachi Arc—A Case Study of Pirmangho & Lalji Area. In Proceedings of the PAPG/SPE Annual Technical Conference, Islamabad, Pakistan, 17–18 November 2009. [Google Scholar]
- Sarwar, G.; Alizai, A. Riding the Mobile Karachi Arc, Pakistan: Understanding Tectonic Threats. J. Himal. Earth Sci. 2013, 46, 9–24. [Google Scholar]
- Sarwar, G. Earthquakes and the Neo-Tectonic Framework of the Kutch-Hyderabad-Karachi Triple Junction Area, Indo-Pakistan. Pak. J. Hydrocarb. Res. 2004, 14, 35–40. [Google Scholar]
- Luijendijk, A.; Hagenaars, G.; Ranasinghe, R.; Baart, F.; Donchyts, G.; Aarninkhof, S. The State of the World’s Beaches. Sci. Rep. 2018, 8, 6641. [Google Scholar] [CrossRef]
- Sengupta, D.; Chen, R.; Meadows, M.E. Building beyond Land: An Overview of Coastal Land Reclamation in 16 Global Megacities. Appl. Geogr. 2018, 90, 229–238. [Google Scholar] [CrossRef]
- Gómez, J.; Kwoll, E.; Walker, I.; Shirzaei, M. Vertical Land Motion as a Driver of Coastline Changes on a Deltaic System in the Colombian Caribbean. Geosciences 2021, 11, 300. [Google Scholar] [CrossRef]
- Ellouz-Zimmermann, N.; Lallemant, S.J.; Castilla, R.; Mouchot, N.; Leturmy, P.; Battani, A.; Buret, C.; Cherel, L.; Desaubliaux, G.; Deville, E.; et al. Offshore Frontal Part of the Makran Accretionary Prism: The Chamak Survey (Pakistan). In Thrust Belts and Foreland Basins; Springer: Berlin, Germany, 2007; pp. 351–366. [Google Scholar] [CrossRef]
- Jafari, F.; Javadi, S.; Golmohammadi, G.; Karimi, N.; Mohammadi, K. Numerical Simulation of Groundwater Flow and Aquifer-System Compaction Using Simulation and InSAR Technique: Saveh Basin, Iran. Environ. Earth Sci. 2016, 75, 833. [Google Scholar] [CrossRef]
- Jafari, F.; Javadi, S.; Karimi, N. Forecasting of Subsidence Due to Groundwater over Exploitation using MODFLOW and Interferometry Technique in Radar Imagery. In Proceedings of the 36th IAHR World Congress, The Hague, The Netherlands, 28 June–3 July 2015. [Google Scholar]
- EMC. Environmental Impact Assessment (EIA) "Ferere Excellency—A High Density Zone of Civil Lines, Karachi" Residential Cum Commercial Project; EMC Paksitan Pvt. Ltd.: Karachi, Pakistan, 2017. [Google Scholar]
- Khan, A.; Raza, S.A.; Fatima, A.; Haider, S.W. Assessment of Groundwater Quality in Coastal Region a Case Study of Qayyumabad, Karachi, Pakistan. Asian Rev. Environ. Earth Sci. 2020, 7, 9–17. [Google Scholar] [CrossRef]
- JICA. The Study on Water Supply and Sewerage System in Karachi in the Islamic Republic of Pakistan; Japan International Cooperation Agency: Tokyo, Japan, 2008.
- Lodi, S.H.; Sultan, W.; Bukhary, S.S.; Rafeeqi, S.F.A. Liquefaction Potential along the Coastal Regions of Karachi. J. Himal. Earth Sci. 2015, 48, 89–98. [Google Scholar]
- KMC; Environmental Impact Assessment (EIA). Grade Separated Traffic Improvement Plan from Park Tower Intersection to A.T. Naqvi Roundabout; Environemtnal Management Consultatns: Karachi, Pakistan, 2014. [Google Scholar]
- EMC. Environmental Impact Assessment Report "Royal Marina Tower" Residential Building Project; Environemtnal Management Consultatns: Karachi, Pakistan, 2017. [Google Scholar]
- Mahmud, S.A.; Sheikh, S.A. Earthquake Shocks and Liquefaction Threat to Dha and Clifton Areas, Karachi Pakistan. A Case Study. In Geotechnical Engineering for Disaster Mitigation and Rehabilitation; Springer: Berlin/Heidelberg, Germany, 2008. [Google Scholar]
- Ilyas, F. Concern over 100 High-Rises under Construction in Karachi. Dawn, 28 May 2016. [Google Scholar]
- Liu, G.; Jia, H.; Zhang, R.; Li, Z.; Chen, Q.; Luo, X.; Cai, G. Ultrashort-Baseline Persistent Scatterer Radar Interferometry for Subsidence Detection. ISPRS Ann. Photogramm. Remote Sens. Spat. Inf. Sci. 2012, I-7, 41–48. [Google Scholar] [CrossRef] [Green Version]


| Zone | Sites | Envisat/ASAR | Sentinel/1A | Trend | ||||
|---|---|---|---|---|---|---|---|---|
| (Towns) | Min | Max | Mean | Min | Max | Mean | ||
| West Karachi | Baldia, S.I.T.E, Orangi | −10.81 | 24.04 | −0.21 | −18.93 | 33.082 | 0.58 |  |
| South Karachi | Kiamari, Saddar, Layari, Clifton, DHA, Manora | −9.92 | 5.96 | 0.797 | −37.96 | 12.792 | 0.46 |  |
| East Karachi | Shah Faisal, Korangi, Landhi, Korangi Creek Cantonment, Gulshan e Iqbal, Jamshed | −15.62 | 6.57 | −1.04 | −22.44 | 10.929 | −1.83 |  |
| Malir | Bin Qasim, Malir Cantonment, Gadap | −18.49 | 10.90 | 1.061 | −16.03 | 11.78 | −3.35 |  |
| Central Karachi | North Nazimabad, New Karachi, Gulberg, Liaqatabad | −5.28 | 5.86 | 0.134 | −16.23 | 12.683 | −0.97 |  |
| Section | Coastline Change Rate (m/yr)—Landsat | Coastal Zone Displacement Rate (m/yr)—TCPInSAR | Mean Sea Level (mm/yr) | ||||
|---|---|---|---|---|---|---|---|
| Min | Max | Mean | Min | Max | Mean | ||
| West Karachi | −0.43 | −4.112 | 2.168 | −0.33 | −7.14 | 8.60 | 1.9 |
| South Karachi | 8.34 | −74.59 | 62.04 | 0.22 | −5.8 | 2.92 | |
| East Karachi | −2.43 | −10.66 | 2.5 | 2.1 | −13.95 | 7.7 | |
Publisher’s Note: MDPI stays neutral with regard to jurisdictional claims in published maps and institutional affiliations. |
© 2022 by the authors. Licensee MDPI, Basel, Switzerland. This article is an open access article distributed under the terms and conditions of the Creative Commons Attribution (CC BY) license (https://creativecommons.org/licenses/by/4.0/).
Share and Cite
Kanwal, S.; Ding, X.; Wu, S.; Sajjad, M. Vertical Ground Displacements and Its Impact on Erosion along the Karachi Coastline, Pakistan. Remote Sens. 2022, 14, 2054. https://doi.org/10.3390/rs14092054
Kanwal S, Ding X, Wu S, Sajjad M. Vertical Ground Displacements and Its Impact on Erosion along the Karachi Coastline, Pakistan. Remote Sensing. 2022; 14(9):2054. https://doi.org/10.3390/rs14092054
Chicago/Turabian StyleKanwal, Shamsa, Xiaoli Ding, Songbo Wu, and Muhammad Sajjad. 2022. "Vertical Ground Displacements and Its Impact on Erosion along the Karachi Coastline, Pakistan" Remote Sensing 14, no. 9: 2054. https://doi.org/10.3390/rs14092054
APA StyleKanwal, S., Ding, X., Wu, S., & Sajjad, M. (2022). Vertical Ground Displacements and Its Impact on Erosion along the Karachi Coastline, Pakistan. Remote Sensing, 14(9), 2054. https://doi.org/10.3390/rs14092054