
Combining Spectral, Spatial-Contextual, and Structural Information in Multispectral UAV Data for Spruce Crown Delineation


Abstract
:1. Introduction
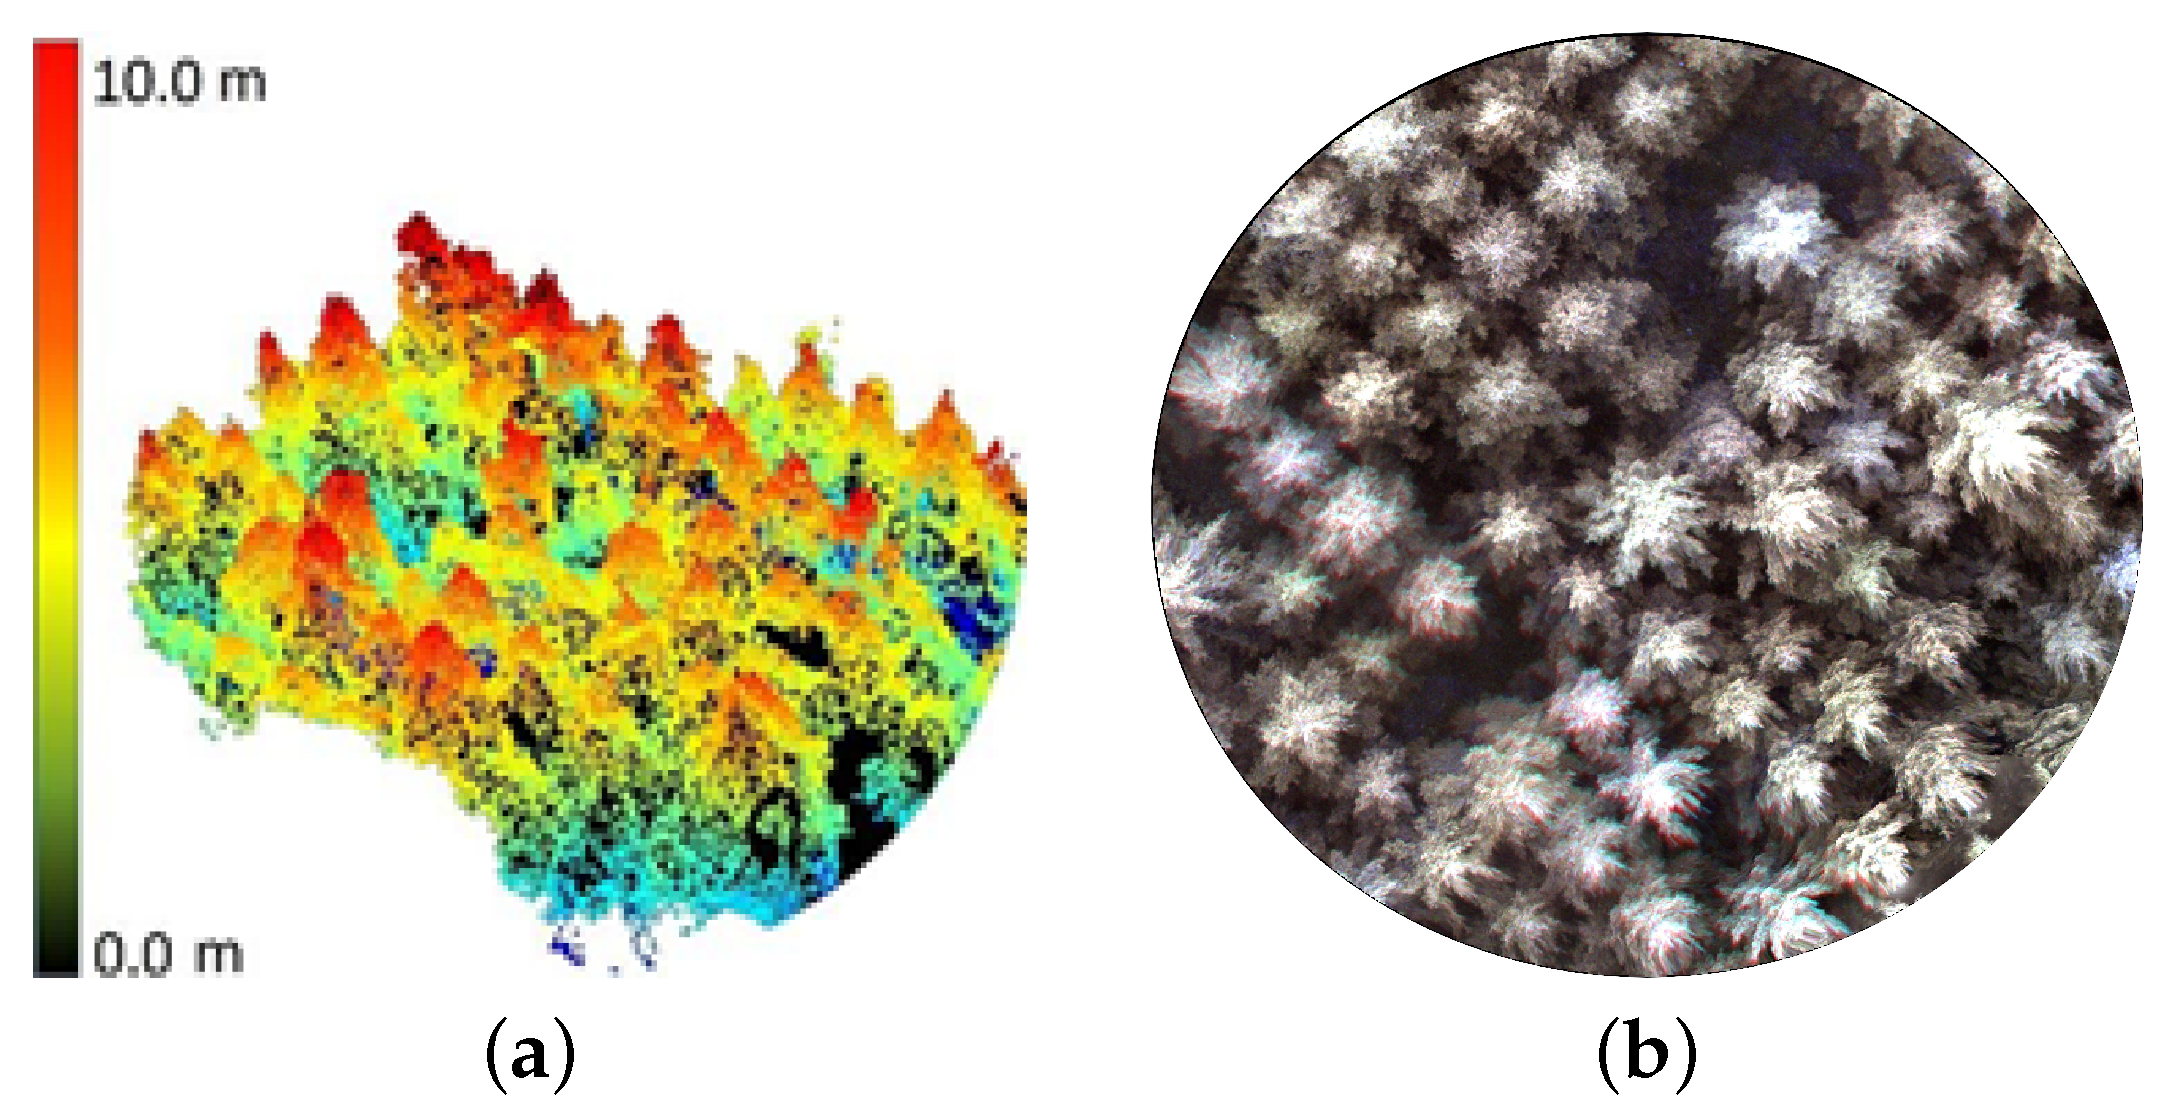
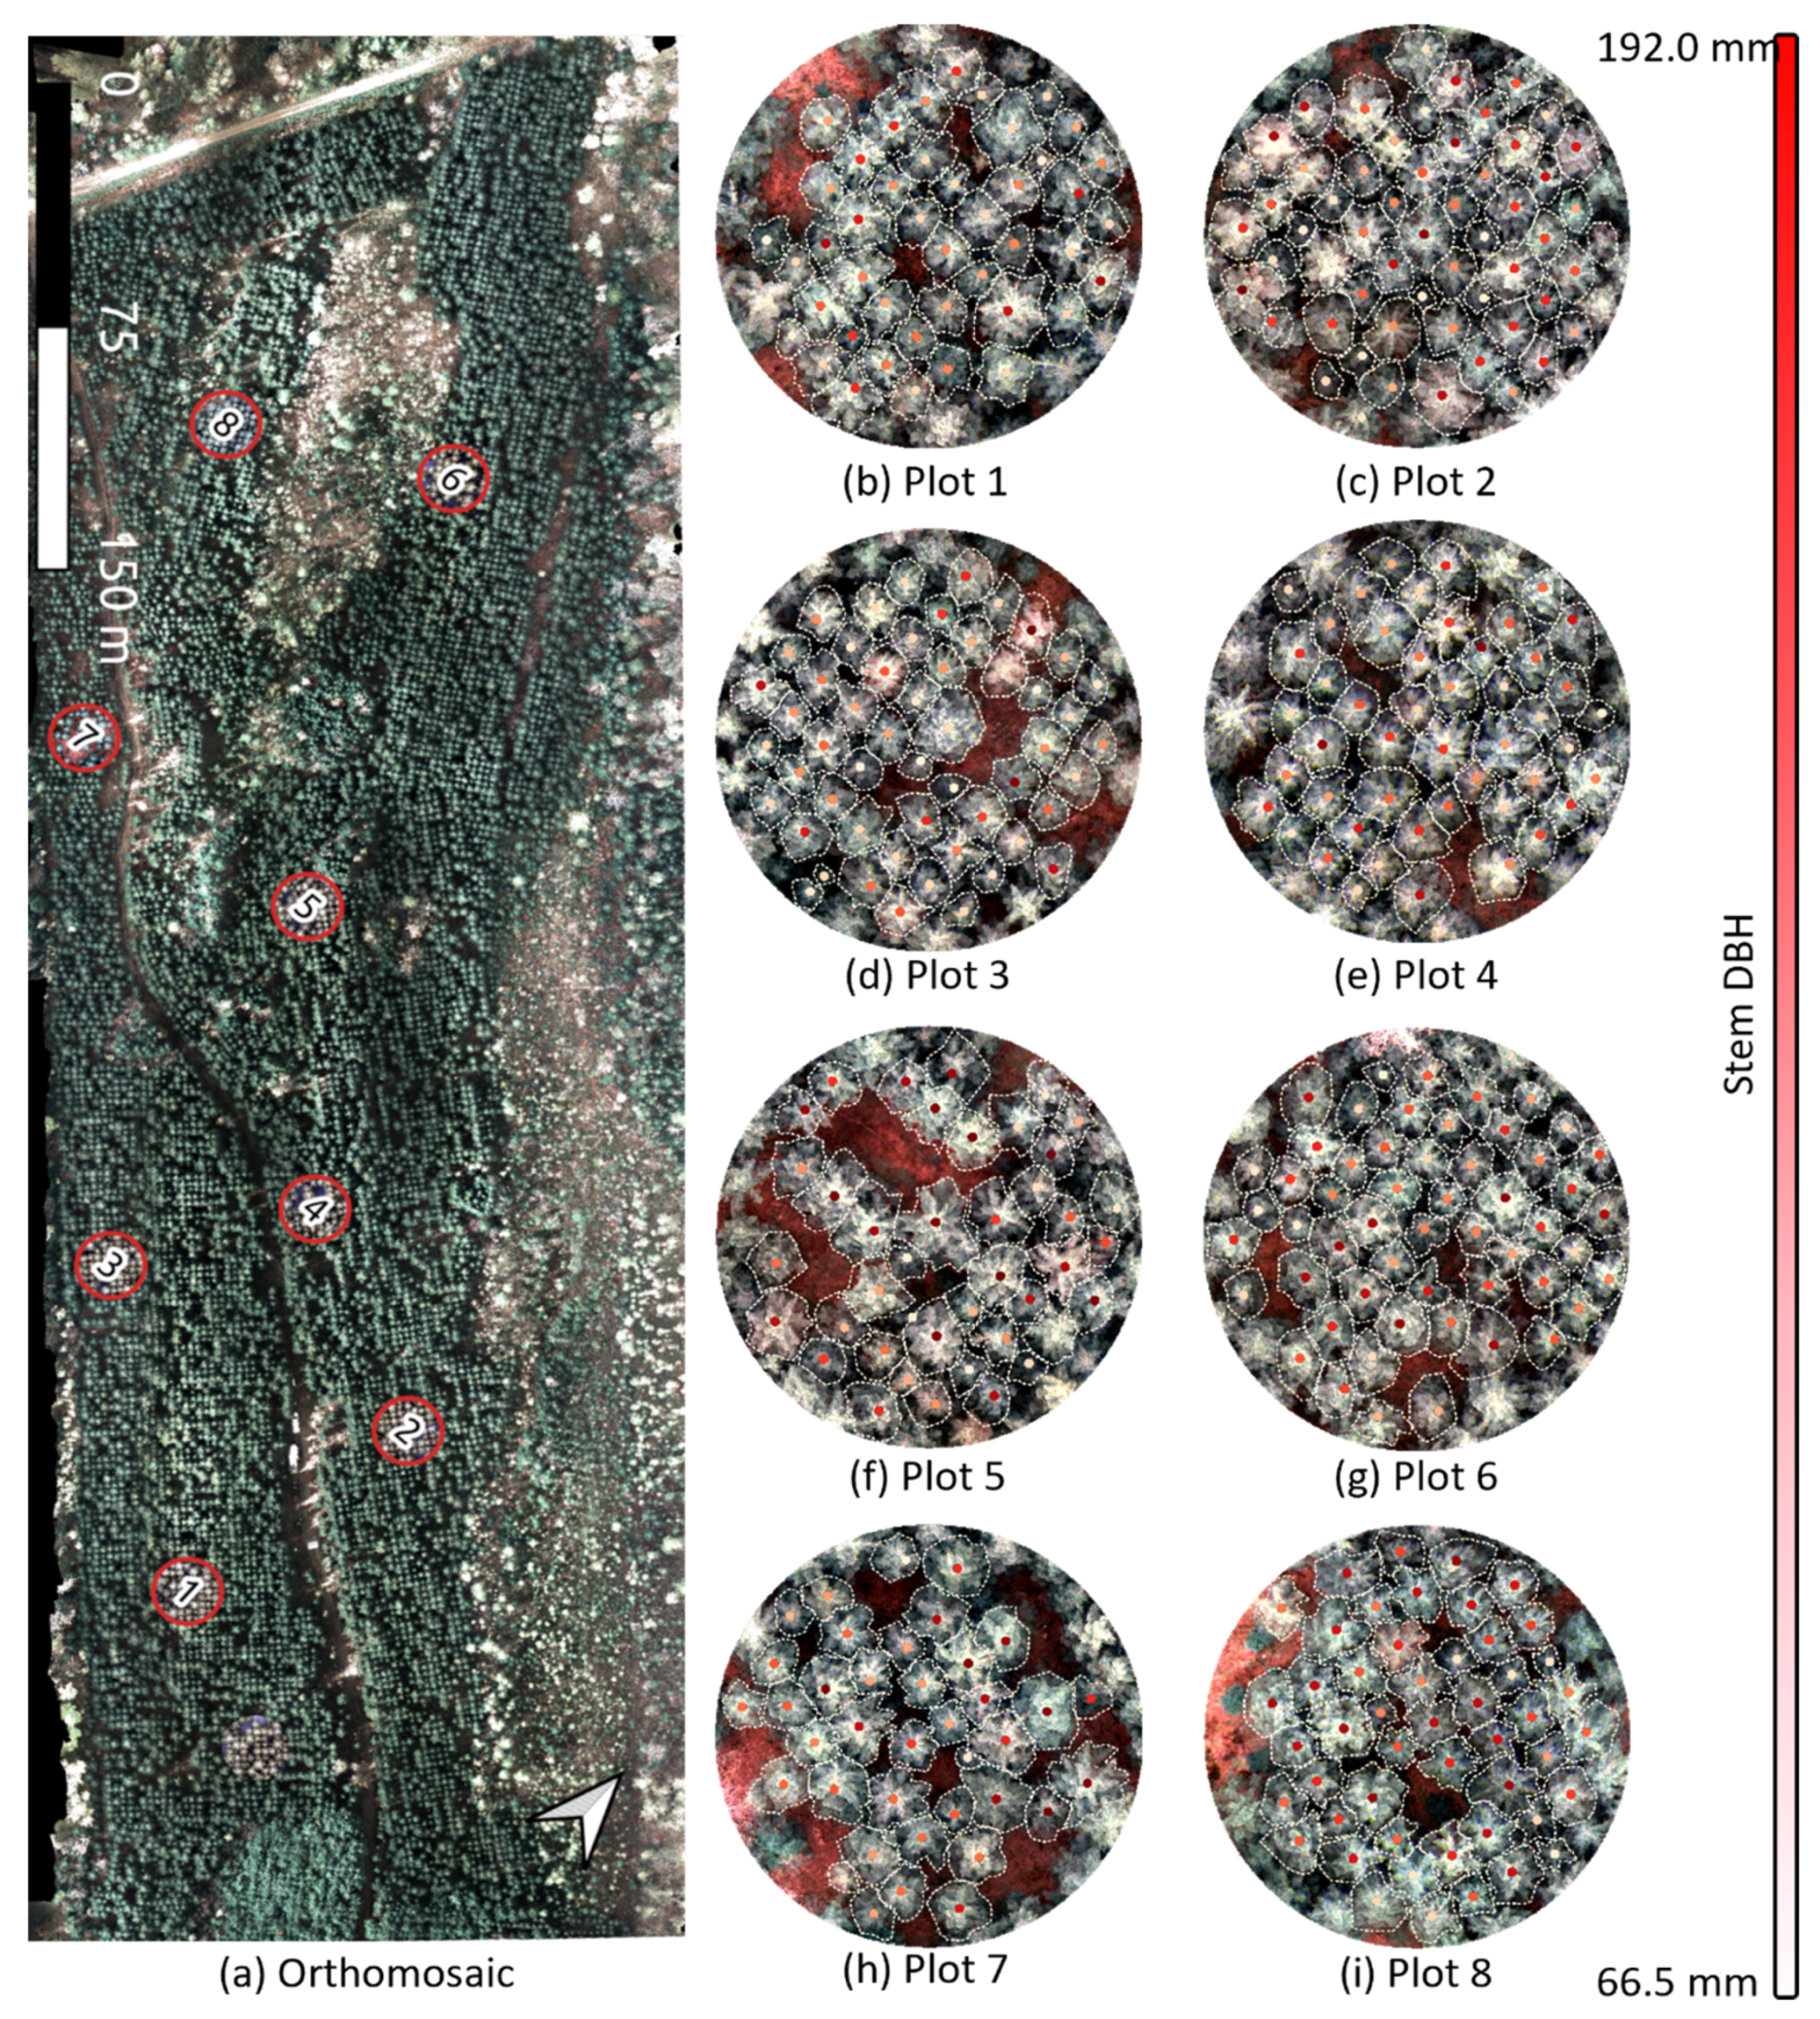
2. Study Area and Data Description
2.1. Reference Data
2.2. Remote Sensing Data
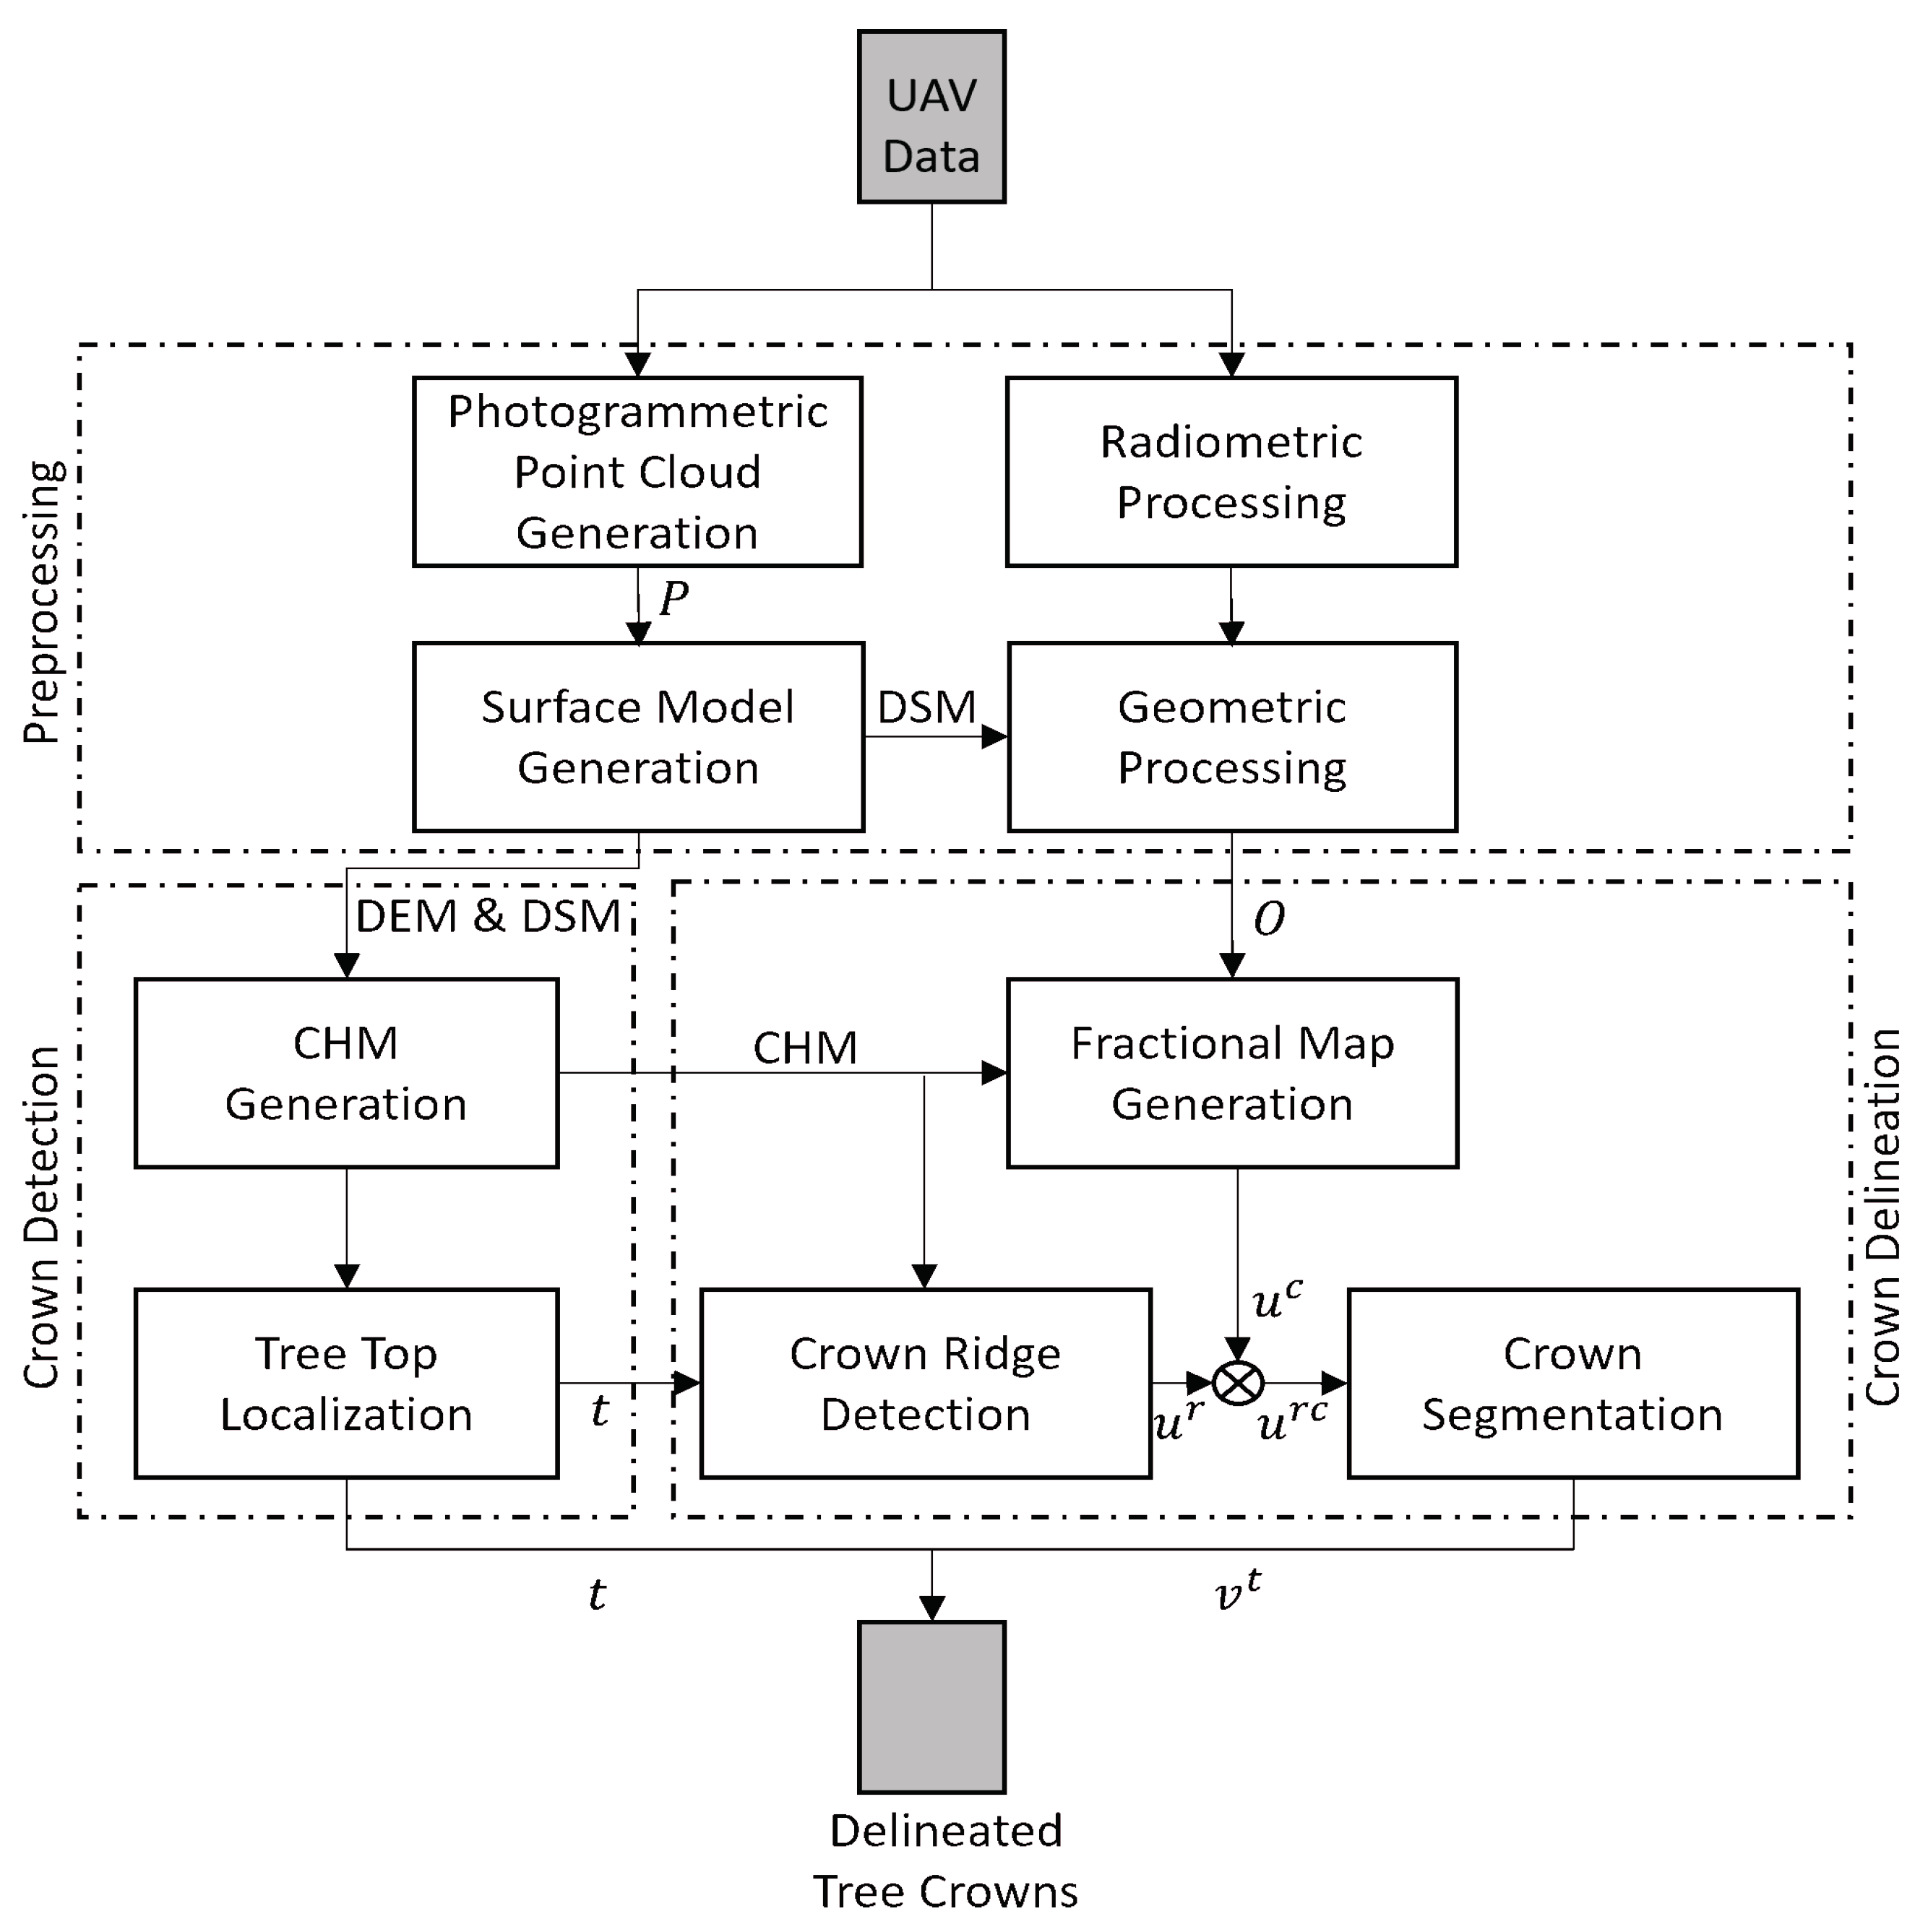
3. Methodology
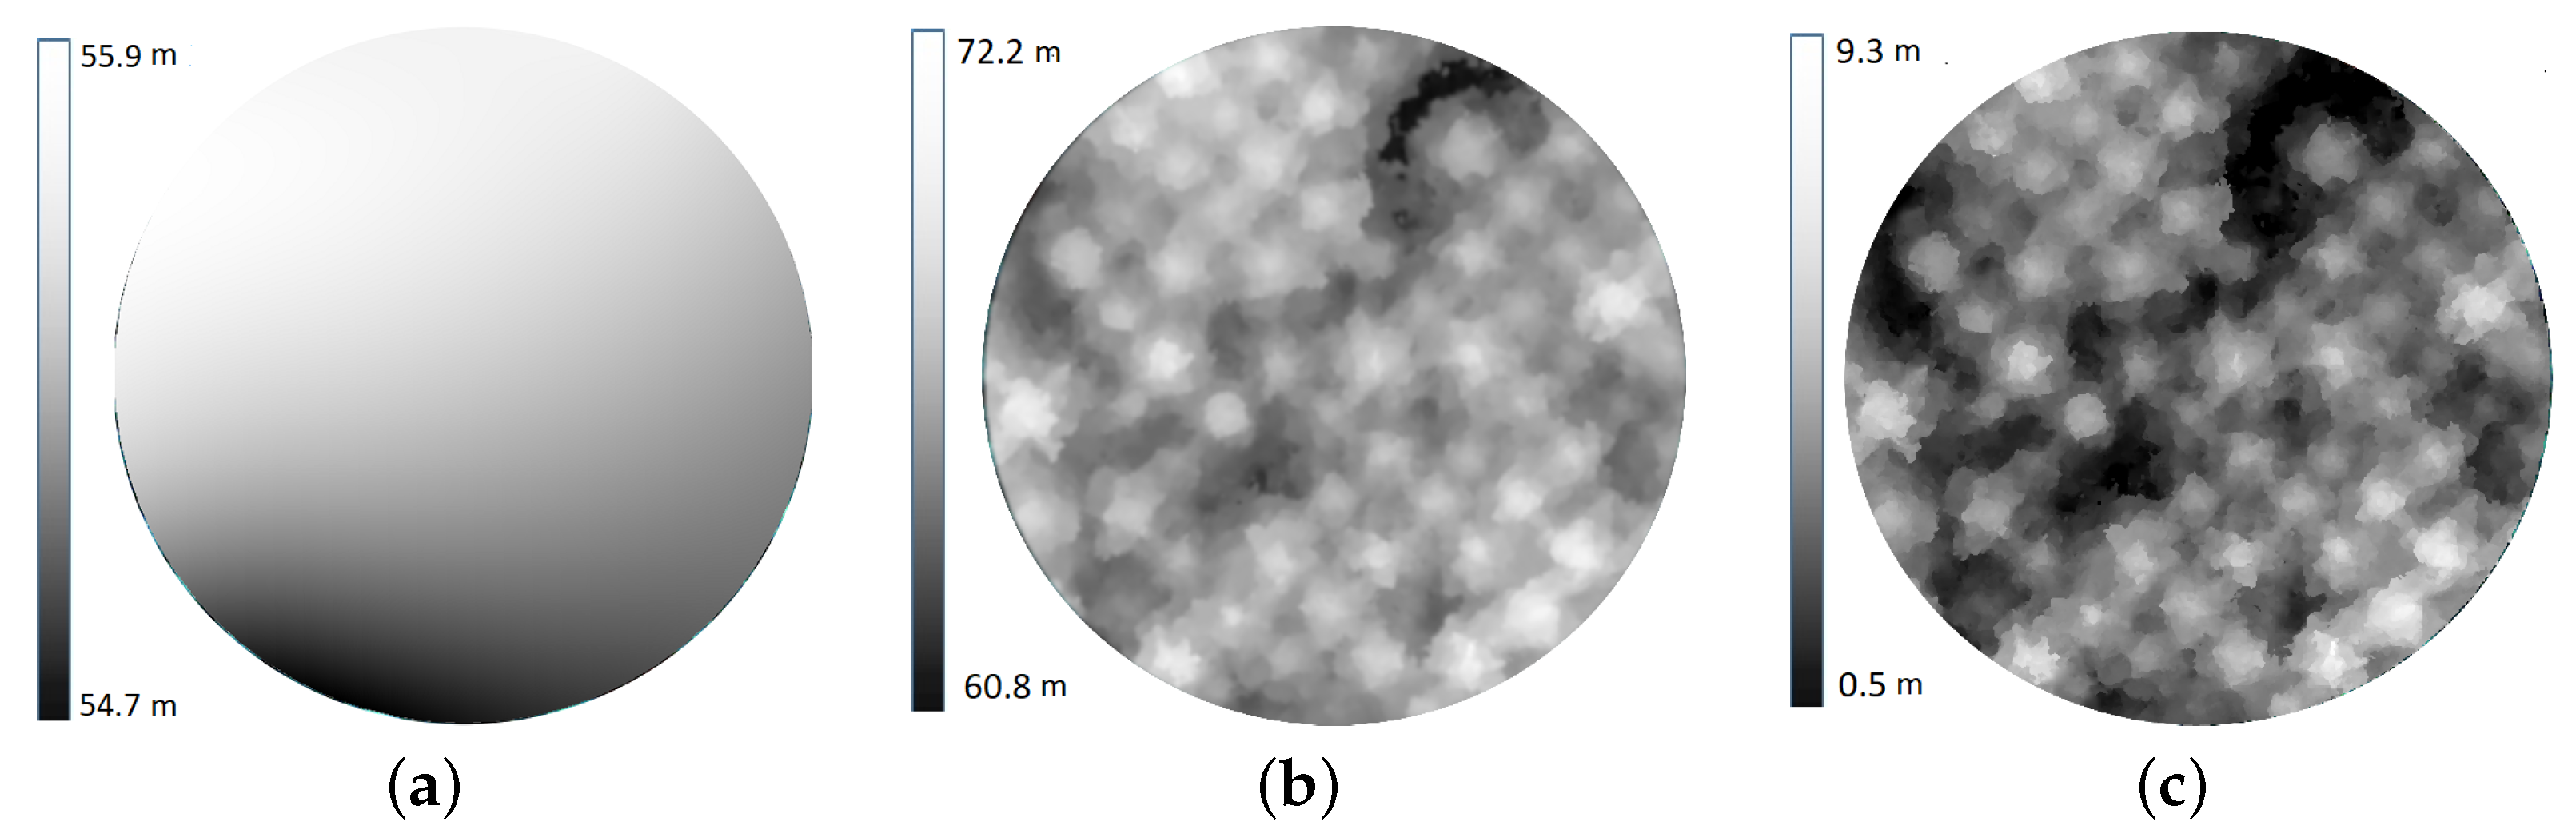
3.1. Preprocessing
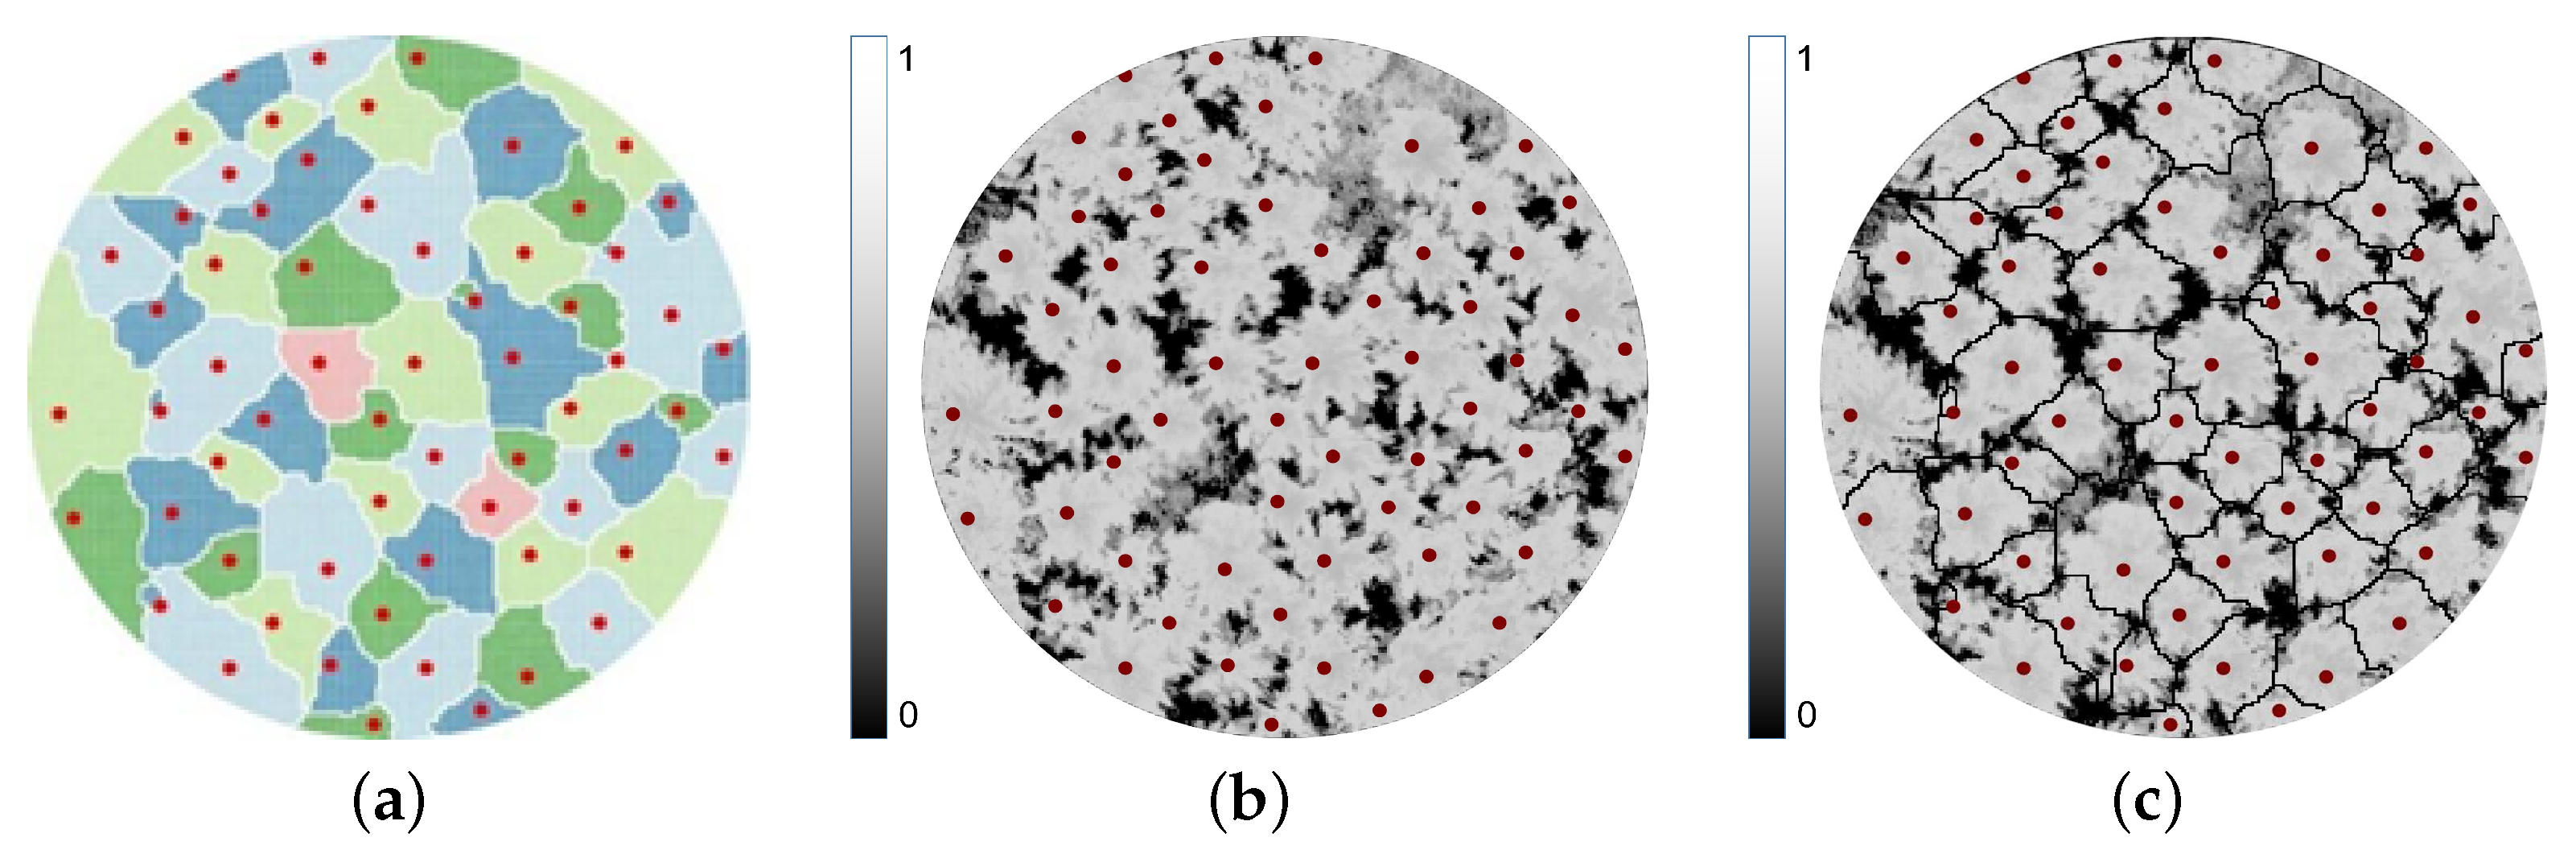
3.2. Crown Detection
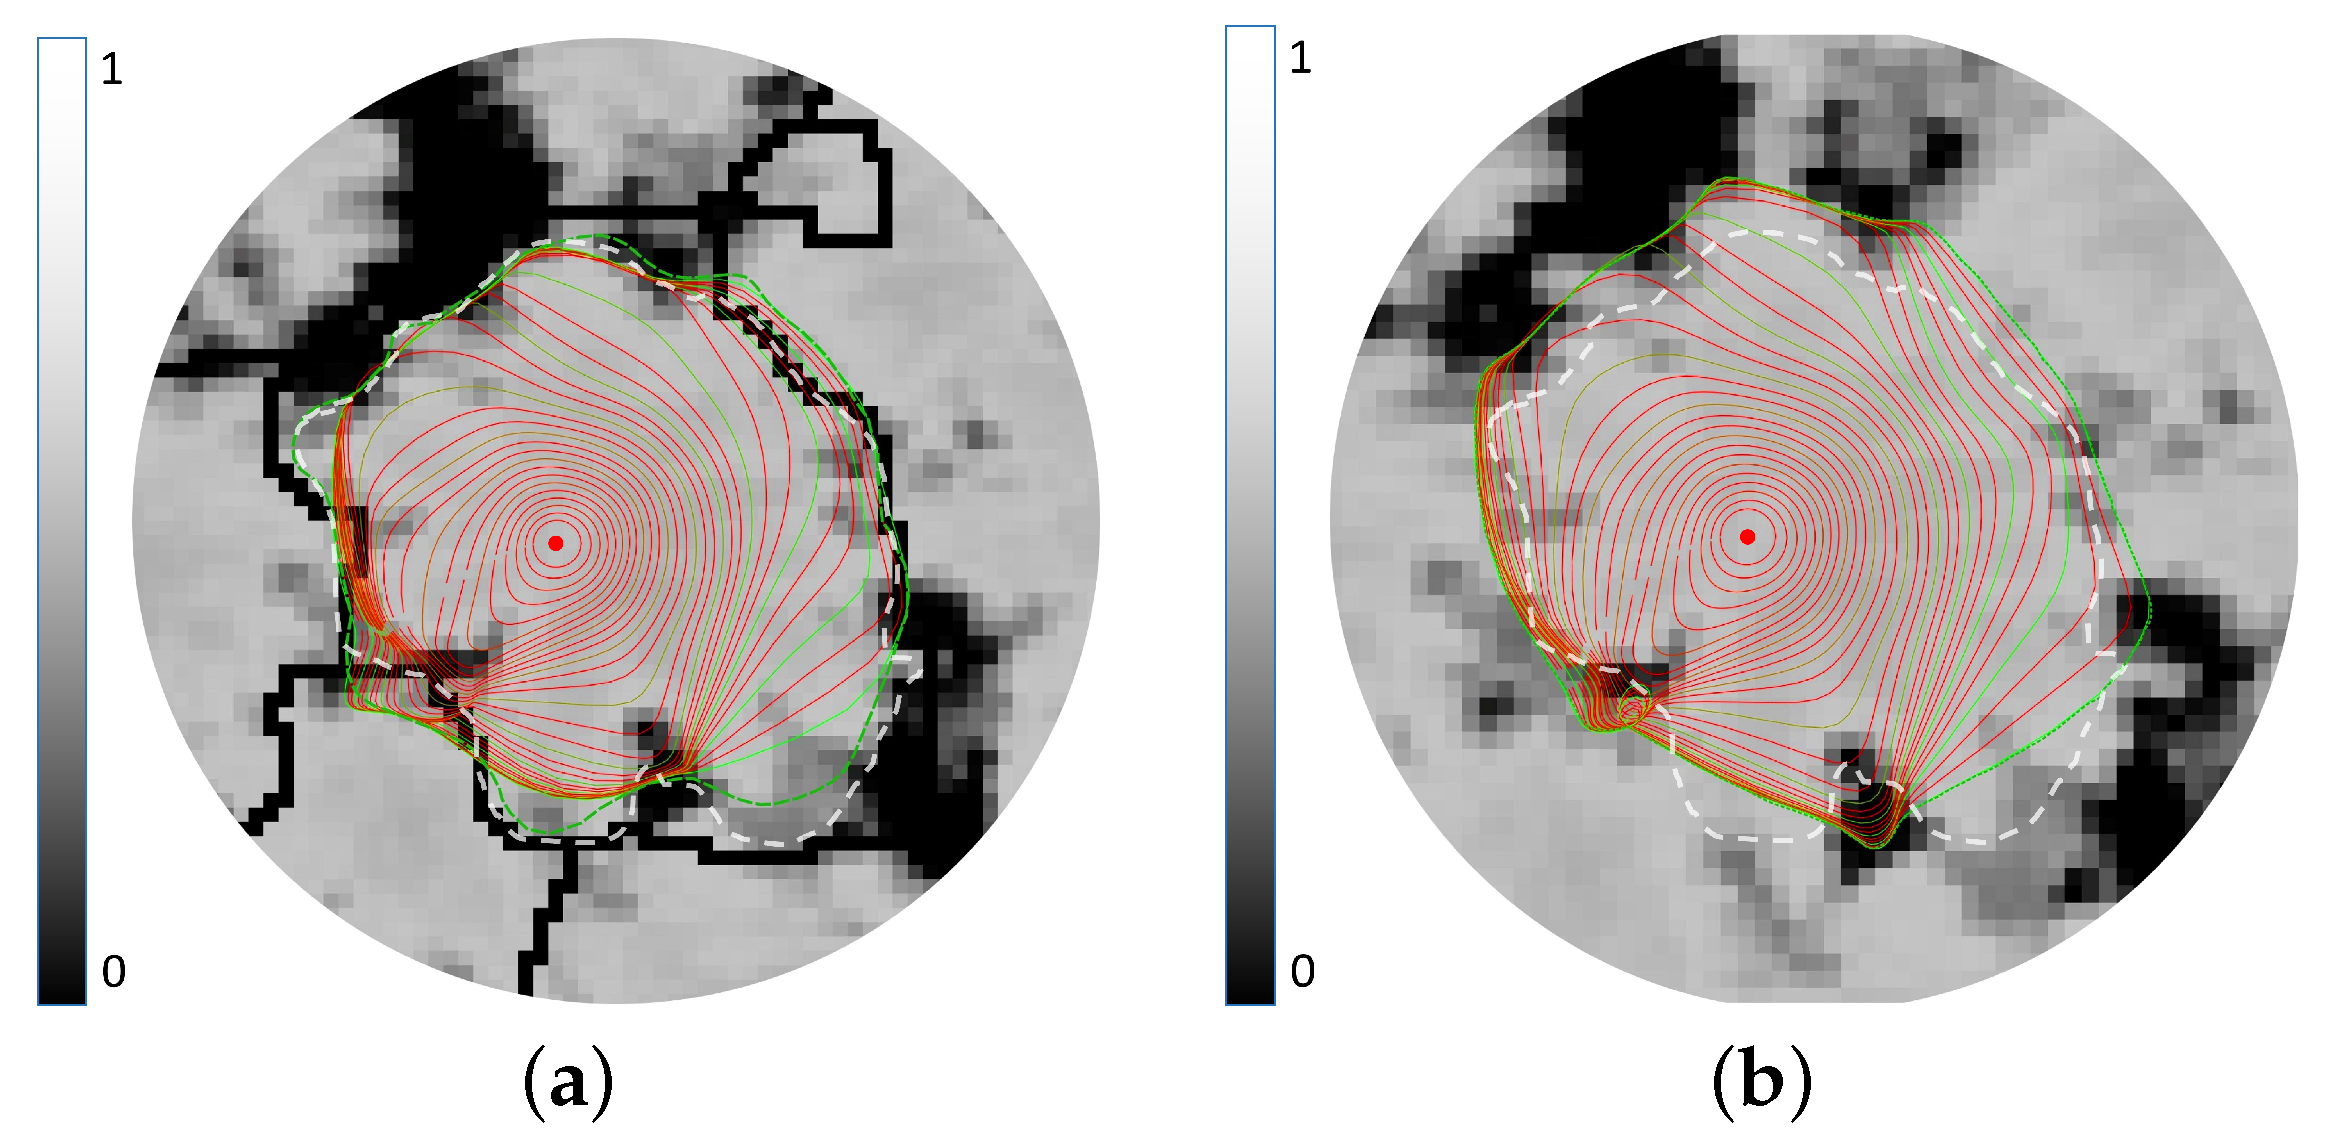
3.3. Crown Delineation
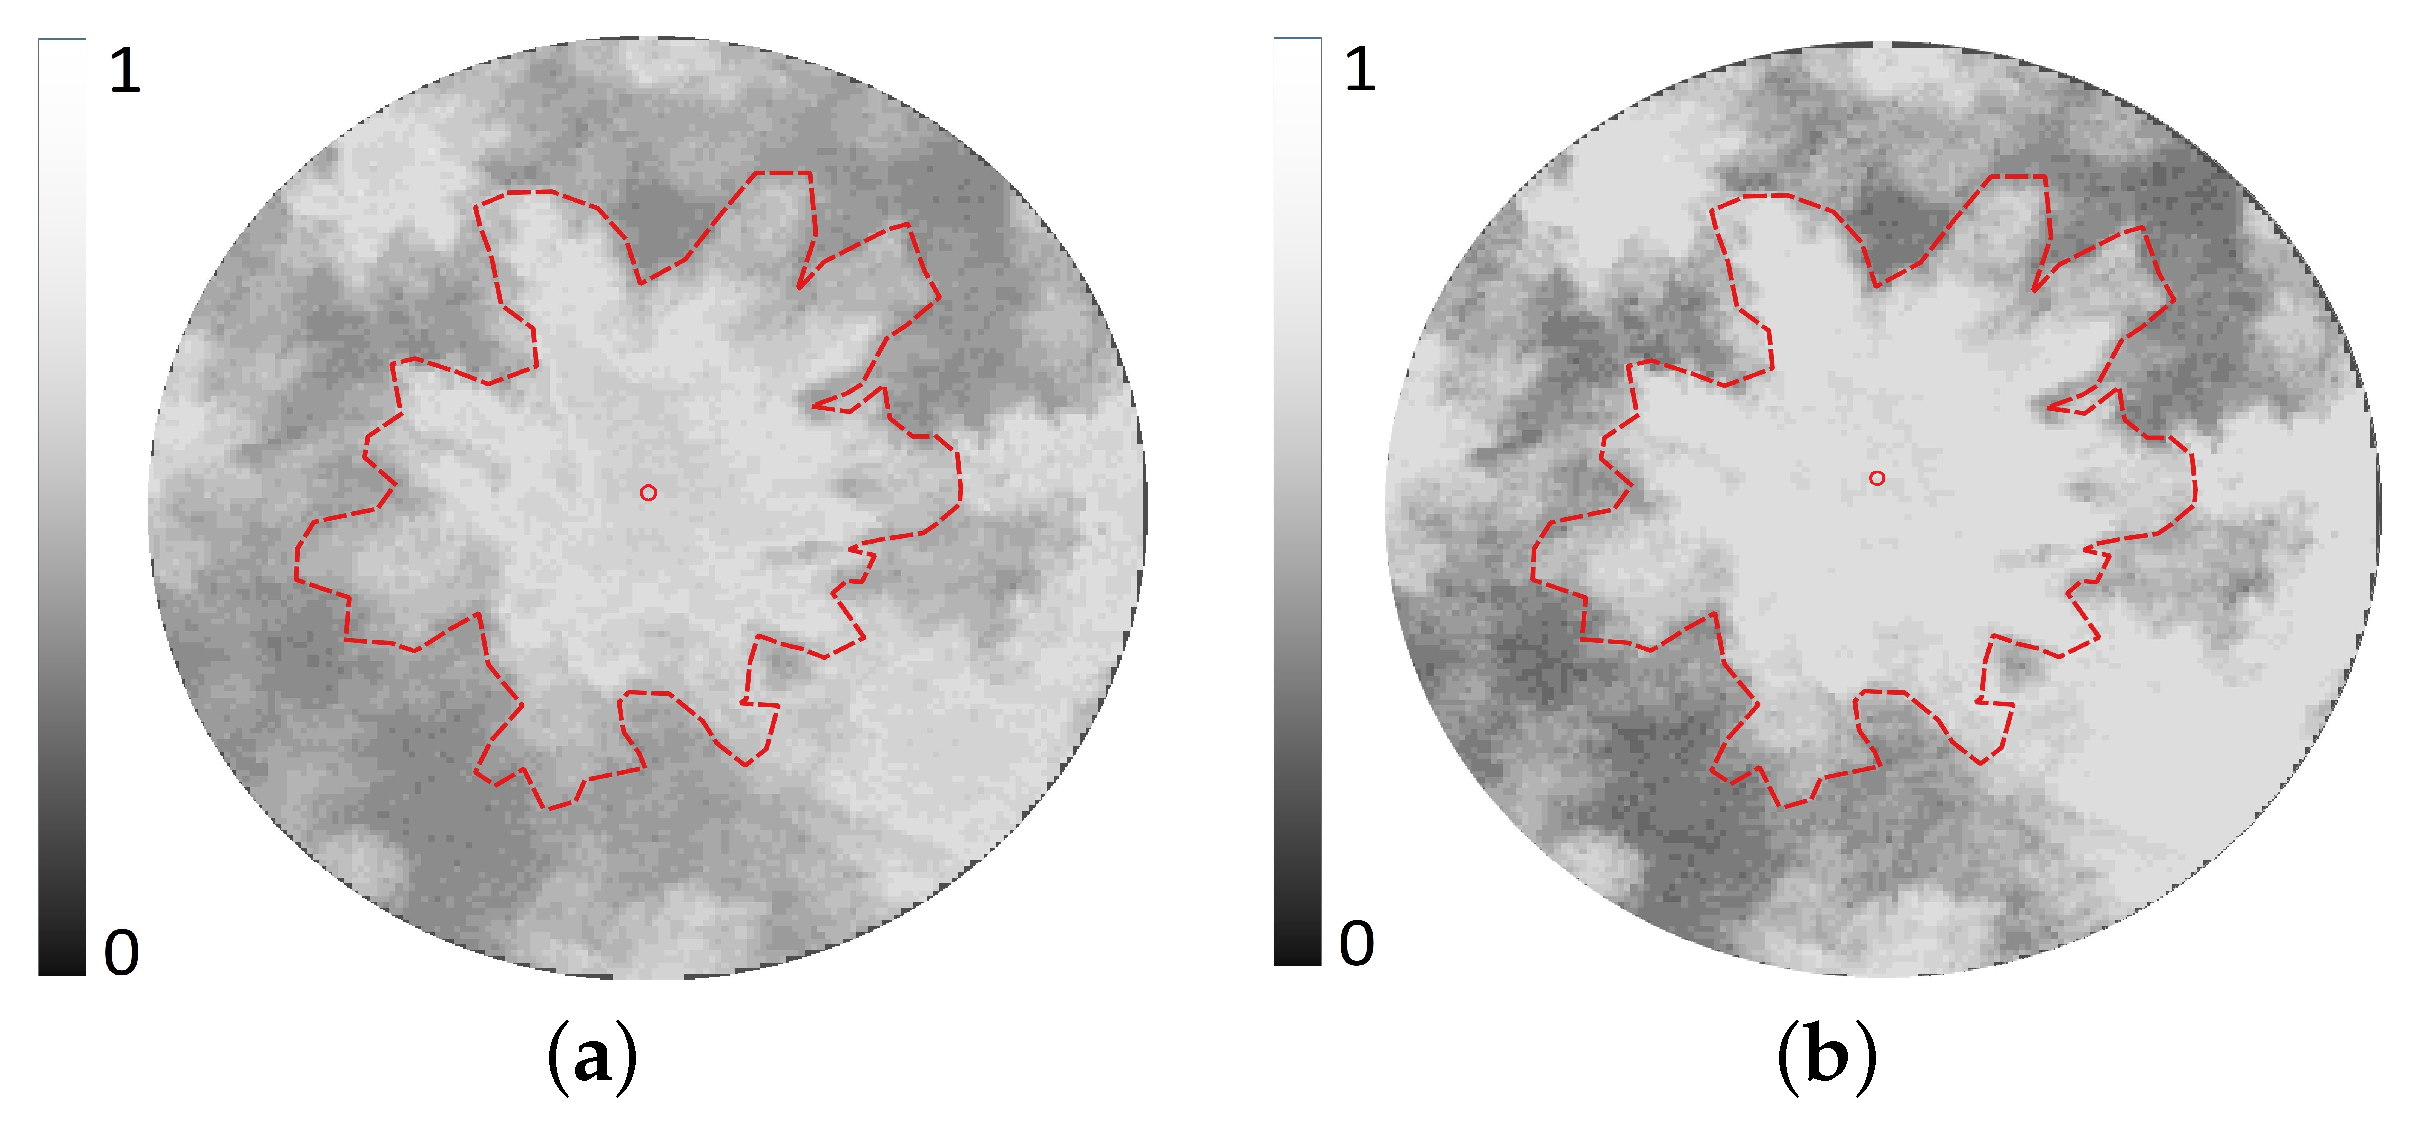
3.3.1. Fractional Map Generation
3.3.2. Crown Ridge Detection
3.3.3. Crown Segmentation
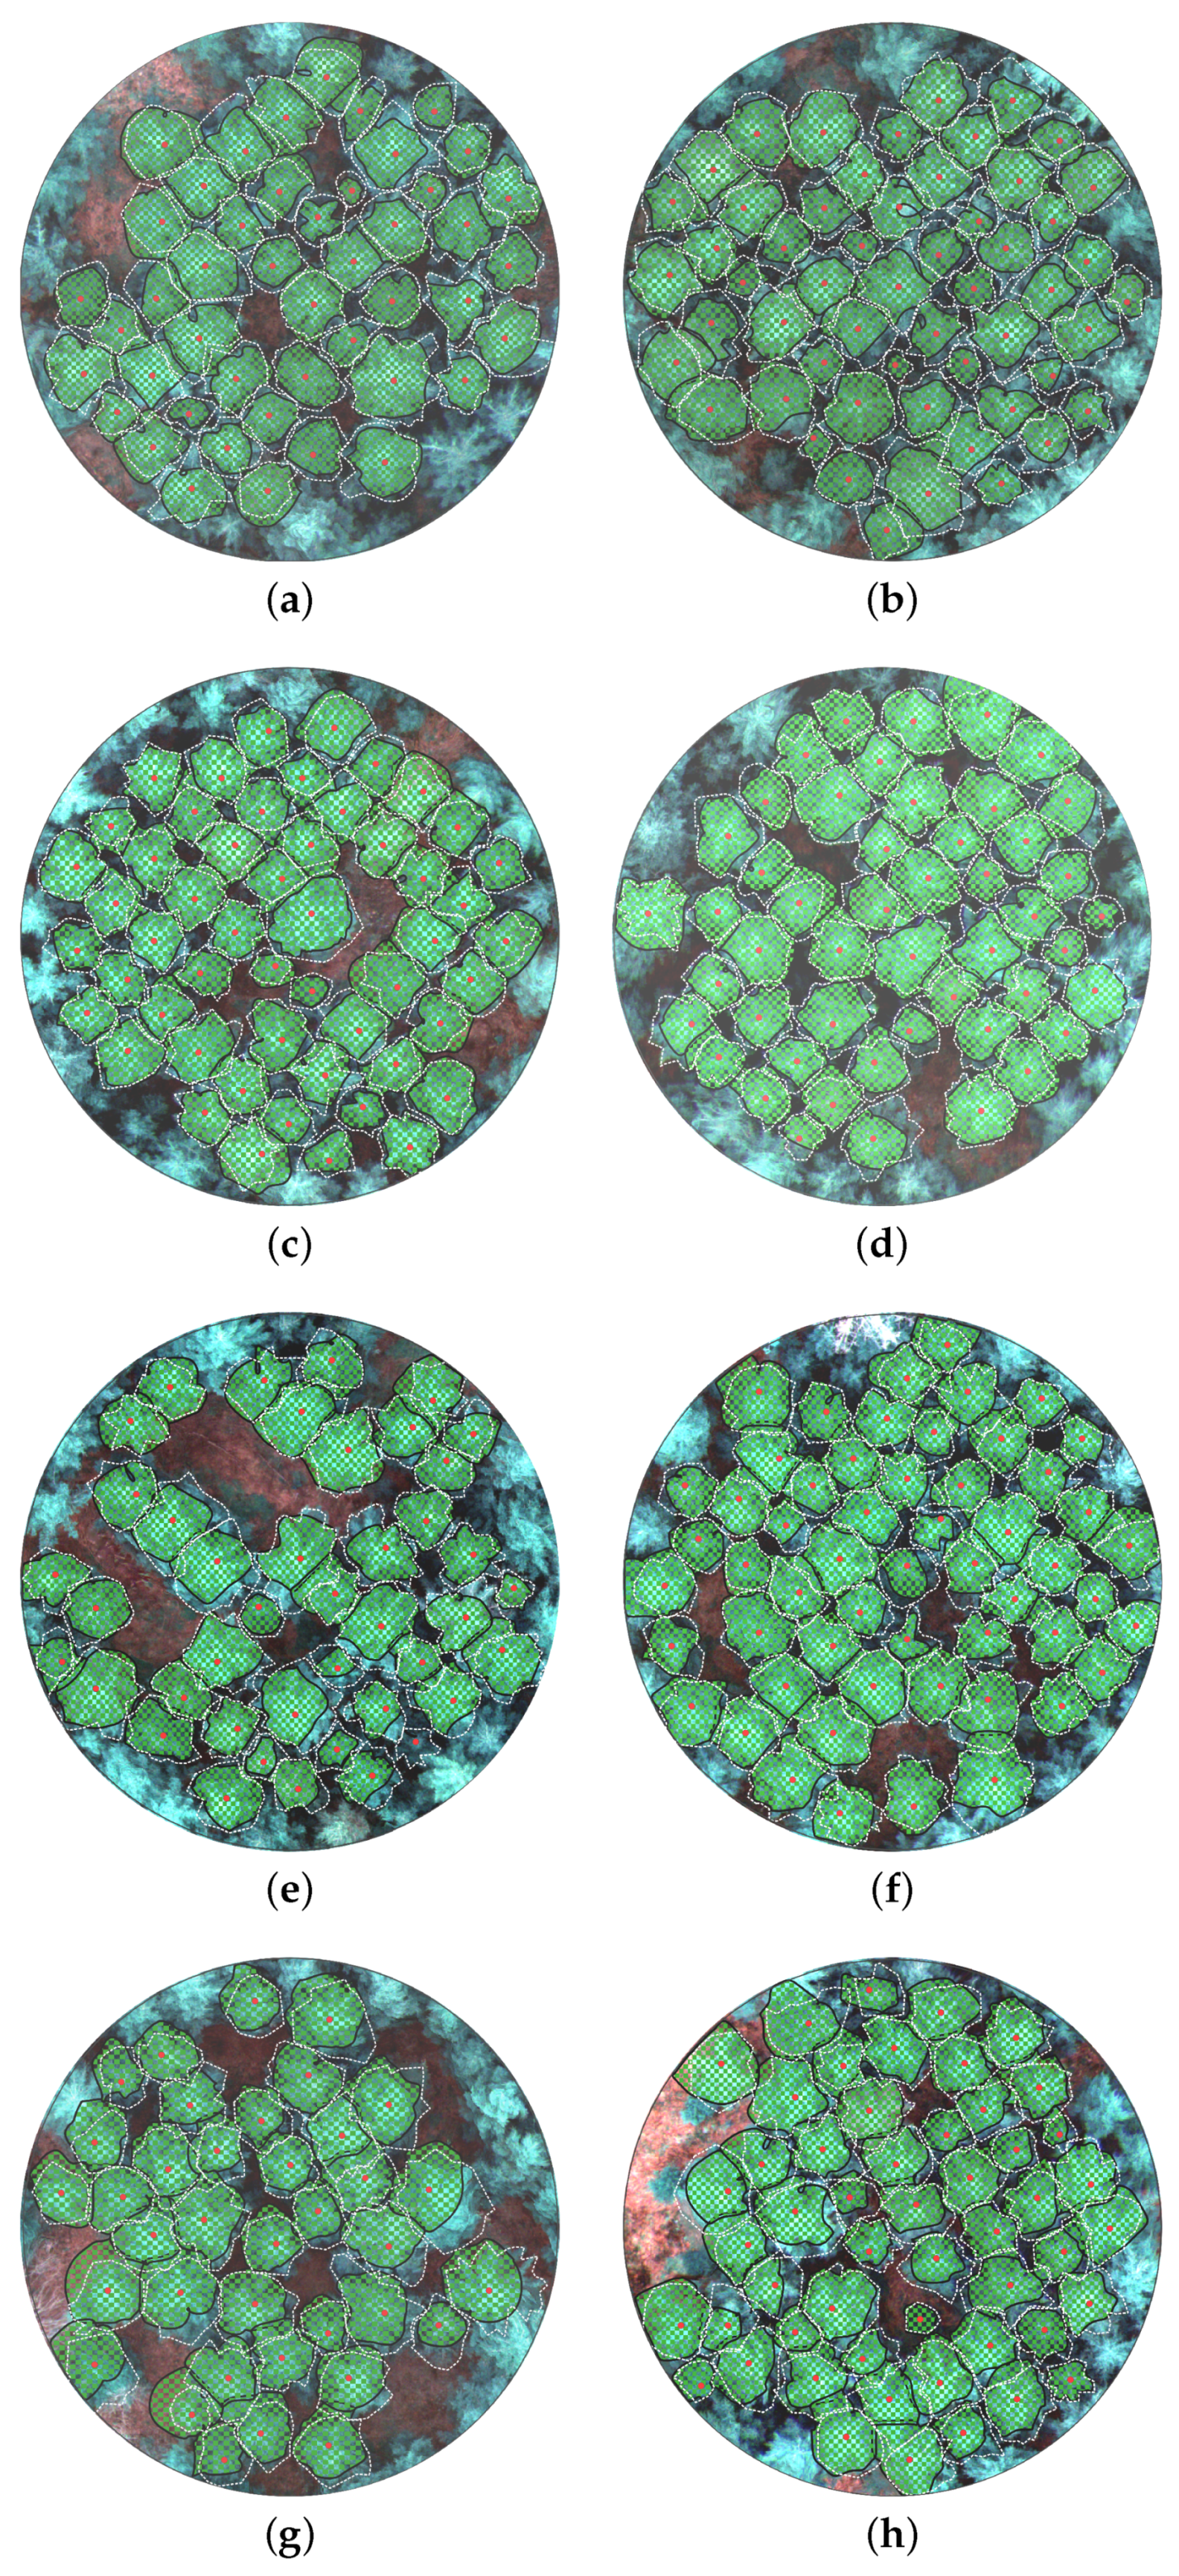
4. Results
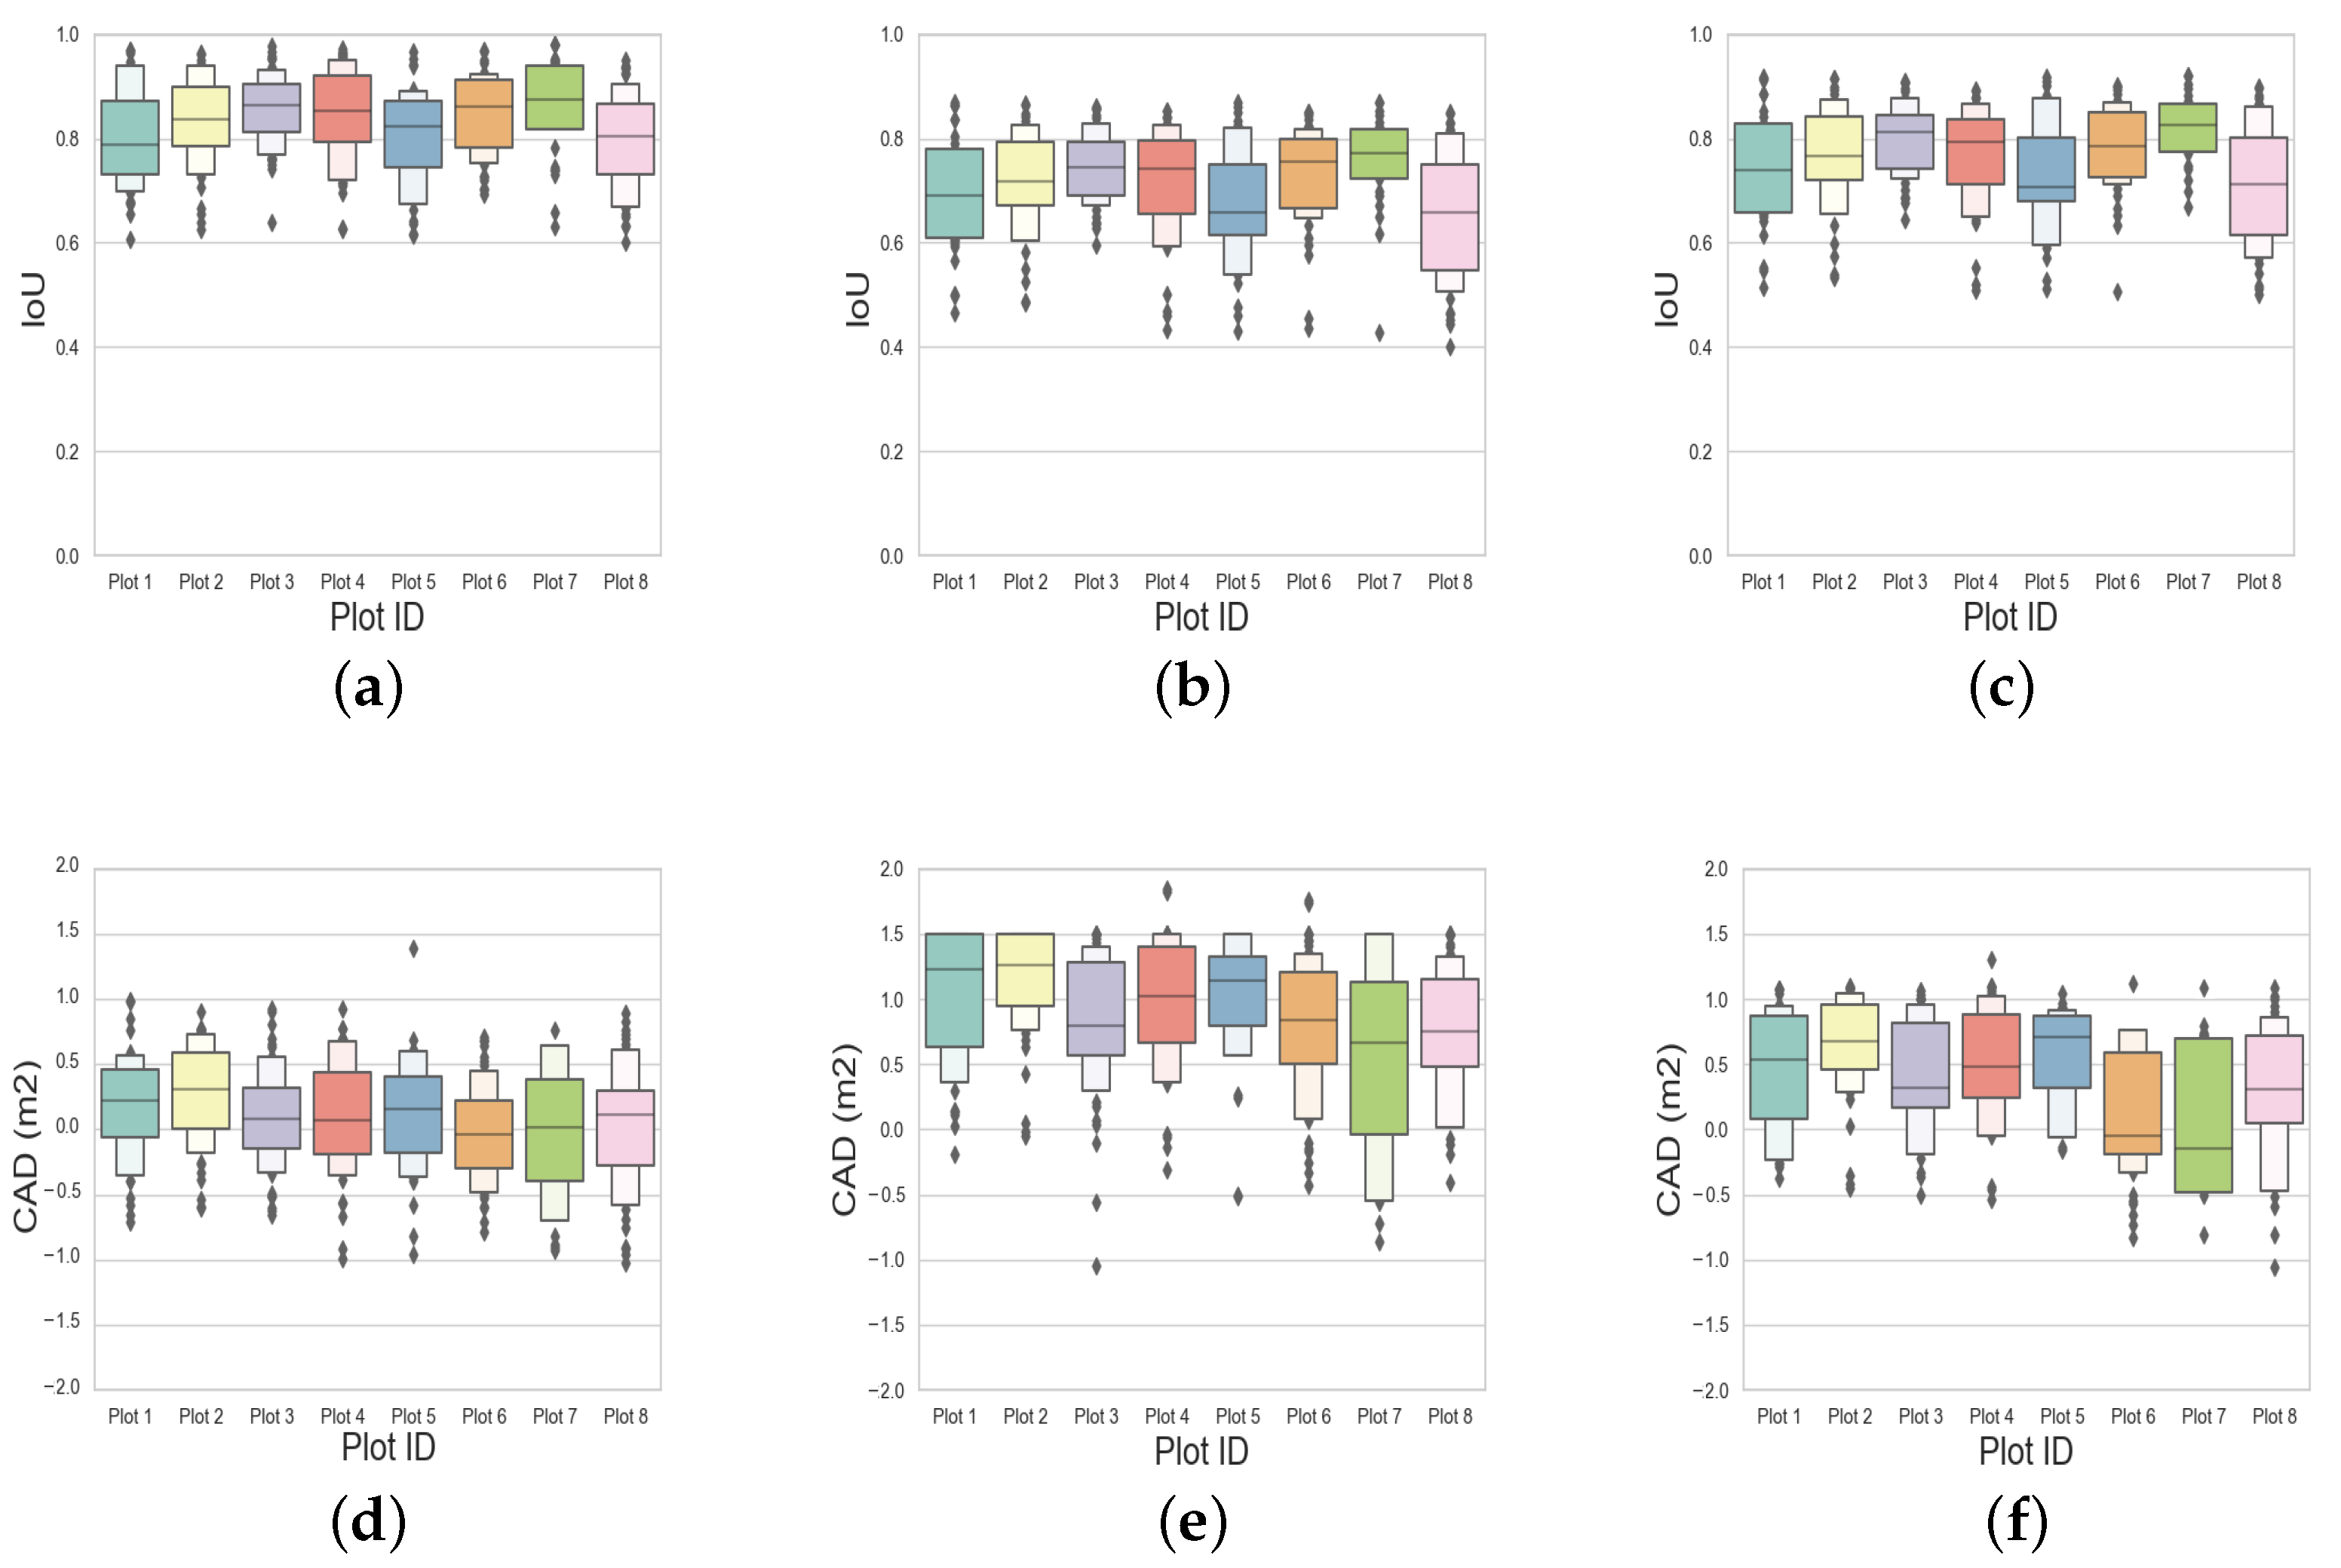
4.1. Assessing Crown Delineation Accuracy
4.2. Performance Validation Using DBH Estimates
5. Discussion
6. Conclusions
Author Contributions
Funding
Institutional Review Board Statement
Informed Consent Statement
Data Availability Statement
Acknowledgments
Conflicts of Interest
References
- Burley, J. Encyclopedia of Forest Sciences; Academic Press: Cambridge, MA, USA, 2004. [Google Scholar]
- Jahan, N.; Gan, T.Y. Developing a gross primary production model for coniferous forests of northeastern USA from MODIS data. Int. J. Appl. Earth Obs. Geoinf. 2013, 25, 11–20. [Google Scholar] [CrossRef]
- Dalponte, M.; Coomes, D.A. Tree-centric mapping of forest carbon density from airborne laser scanning and hyperspectral data. Methods Ecol. Evol. 2016, 7, 1236–1245. [Google Scholar] [CrossRef] [PubMed] [Green Version]
- Tang, L.; Shao, G. Drone remote sensing for forestry research and practices. J. For. Res. 2015, 26, 791–797. [Google Scholar] [CrossRef]
- Dyck, B. Precision forestry—The path to increased profitability. In Proceedings of the 2nd International Precision Forestry Symposium, Seattle, WA, USA, 15–17 July 2003; pp. 3–8. [Google Scholar]
- D’Odorico, P.; Besik, A.; Wong, C.Y.; Isabel, N.; Ensminger, I. High-throughput drone-based remote sensing reliably tracks phenology in thousands of conifer seedlings. New Phytol. 2020, 226, 1667–1681. [Google Scholar] [CrossRef]
- Nevalainen, O.; Honkavaara, E.; Tuominen, S.; Viljanen, N.; Hakala, T.; Yu, X.; Hyyppä, J.; Saari, H.; Pölönen, I.; Imai, N.N.; et al. Individual tree detection and classification with UAV-based photogrammetric point clouds and hyperspectral imaging. Remote Sens. 2017, 9, 185. [Google Scholar] [CrossRef] [Green Version]
- Zarco-Tejada, P.J.; Diaz-Varela, R.; Angileri, V.; Loudjani, P. Tree height quantification using very high resolution imagery acquired from an unmanned aerial vehicle (UAV) and automatic 3D photo-reconstruction methods. Eur. J. Agron. 2014, 55, 89–99. [Google Scholar] [CrossRef]
- Peña, J.M.; de Castro, A.; Torres-Sánchez, J.; Andújar, D.; Martín, C.S.; Dorado, J.; Fernández-Quintanilla, C.; López-Granados, F. Estimating tree height and biomass of a poplar plantation with image-based UAV technology. AIMS Agric. Food 2018, 3, 313–326. [Google Scholar] [CrossRef]
- Zhang, D.; Liu, J.; Ni, W.; Sun, G.; Zhang, Z.; Liu, Q.; Wang, Q. Estimation of Forest Leaf Area Index Using Height and Canopy Cover Information Extracted From Unmanned Aerial Vehicle Stereo Imagery. IEEE J. Sel. Top. Appl. Earth Obs. Remote Sens. 2019, 12, 471–481. [Google Scholar] [CrossRef]
- Wong, C.Y.; D’Odorico, P.; Arain, M.A.; Ensminger, I. Tracking the phenology of photosynthesis using carotenoid-sensitive and near-infrared reflectance vegetation indices in a temperate evergreen and mixed deciduous forest. New Phytol. 2020, 226, 1682–1695. [Google Scholar] [CrossRef] [PubMed]
- Näsi, R.; Honkavaara, E.; Lyytikäinen-Saarenmaa, P.; Blomqvist, M.; Litkey, P.; Hakala, T.; Viljanen, N.; Kantola, T.; Tanhuanpää, T.; Holopainen, M. Using UAV-based photogrammetry and hyperspectral imaging for mapping bark beetle damage at tree-level. Remote Sens. 2015, 7, 15467–15493. [Google Scholar] [CrossRef] [Green Version]
- De Araujo Barbosa, C.C.; Atkinson, P.M.; Dearing, J.A. Remote sensing of ecosystem services: A systematic review. Ecol. Indic. 2015, 52, 430–443. [Google Scholar] [CrossRef]
- Isabel, N.; Holliday, J.A.; Aitken, S.N. Forest genomics: Advancing climate adaptation, forest health, productivity, and conservation. Evol. Appl. 2020, 13, 3–10. [Google Scholar] [CrossRef] [PubMed] [Green Version]
- Mohan, M.; Silva, C.A.; Klauberg, C.; Jat, P.; Catts, G.; Cardil, A.; Hudak, A.T.; Dia, M. Individual tree detection from unmanned aerial vehicle (UAV) derived canopy height model in an open canopy mixed conifer forest. Forests 2017, 8, 340. [Google Scholar] [CrossRef] [Green Version]
- Wallace, L.; Lucieer, A.; Watson, C.S. Evaluating tree detection and segmentation routines on very high resolution UAV LiDAR data. IEEE Trans. Geosci. Remote Sens. 2014, 52, 7619–7628. [Google Scholar] [CrossRef]
- Popescu, S.C.; Wynne, R.H.; Nelson, R.F. Measuring individual tree crown diameter with lidar and assessing its influence on estimating forest volume and biomass. Can. J. Remote Sens. 2003, 29, 564–577. [Google Scholar] [CrossRef]
- Gougeon, F.A. A crown-following approach to the automatic delineation of individual tree crowns in high spatial resolution aerial images. Can. J. Remote Sens. 1995, 21, 274–284. [Google Scholar] [CrossRef]
- Brandtberg, T.; Walter, F. Automated delineation of individual tree crowns in high spatial resolution aerial images by multiple-scale analysis. Mach. Vis. Appl. 1998, 11, 64–73. [Google Scholar] [CrossRef]
- Meyer, F.; Maragos, P. Multiscale morphological segmentations based on watershed, flooding, and eikonal PDE. In Proceedings of the International Conference on Scale-Space Theories in Computer Vision, Corfu, Greece, 26–27 September 1999; pp. 351–362. [Google Scholar]
- Wulder, M.; Niemann, K.O.; Goodenough, D.G. Local maximum filtering for the extraction of tree locations and basal area from high spatial resolution imagery. Remote Sens. Environ. 2000, 73, 103–114. [Google Scholar] [CrossRef]
- Hung, C.; Bryson, M.; Sukkarieh, S. Multi-class predictive template for tree crown detection. ISPRS J. Photogramm. Remote Sens. 2012, 68, 170–183. [Google Scholar] [CrossRef]
- Schonberger, J.L.; Frahm, J.M. Structure-from-motion revisited. In Proceedings of the IEEE Conference on Computer Vision and Pattern Recognition, Las Vegas, NV, USA, 27–30 June 2016; pp. 4104–4113. [Google Scholar]
- Harwin, S.; Lucieer, A. Assessing the accuracy of georeferenced point clouds produced via multi-view stereopsis from unmanned aerial vehicle (UAV) imagery. Remote Sens. 2012, 4, 1573–1599. [Google Scholar] [CrossRef] [Green Version]
- Huang, H.; Li, X.; Chen, C. Individual tree crown detection and delineation from very-high-resolution UAV images based on bias field and marker-controlled watershed segmentation algorithms. IEEE J. Sel. Top. Appl. Earth Obs. Remote Sens. 2018, 11, 2253–2262. [Google Scholar] [CrossRef]
- Kattenborn, T.; Sperlich, M.; Bataua, K.; Koch, B. Automatic single tree detection in plantations using UAV-based photogrammetric point clouds. Int. Arch. Photogramm. Remote Sens. Spat. Inf. Sci. 2014, 40, 139. [Google Scholar] [CrossRef] [Green Version]
- Leckie, D.; Gougeon, F.; Hill, D.; Quinn, R.; Armstrong, L.; Shreenan, R. Combined high-density lidar and multispectral imagery for individual tree crown analysis. Can. J. Remote Sens. 2003, 29, 633–649. [Google Scholar] [CrossRef]
- Wang, L.; Gong, P.; Biging, G.S. Individual tree-crown delineation and treetop detection in high-spatial-resolution aerial imagery. Photogramm. Eng. Remote Sens. 2004, 70, 351–357. [Google Scholar] [CrossRef] [Green Version]
- Erikson, M. Segmentation of individual tree crowns in colour aerial photographs using region growing supported by fuzzy rules. Can. J. For. Res. 2003, 33, 1557–1563. [Google Scholar] [CrossRef]
- Jing, L.; Hu, B.; Noland, T.; Li, J. An individual tree crown delineation method based on multi-scale segmentation of imagery. ISPRS J. Photogramm. Remote Sens. 2012, 70, 88–98. [Google Scholar] [CrossRef]
- Gomes, M.F.; Maillard, P. Detection of Tree Crowns in Very High Spatial Resolution Images; InTech: London, UK, 2016. [Google Scholar]
- Brandtberg, T.; Warner, T. High-spatial-resolution remote sensing. In Computer Applications in Sustainable Forest Management; Springer: Berlin/Heidelberg, Germany, 2006; pp. 19–41. [Google Scholar]
- Suárez, J.C.; Ontiveros, C.; Smith, S.; Snape, S. Use of airborne LiDAR and aerial photography in the estimation of individual tree heights in forestry. Comput. Geosci. 2005, 31, 253–262. [Google Scholar] [CrossRef]
- Bousquet, J.; Gérardi, S.; de Lafontaine, G.; Jaramillo-Correa, J.P.; Pavy, N.; Prunier, J.; Lenz, P.; Beaulieu, J. Spruce Population Genomics; Springer: Berlin/Heidelberg, Germany, 2021. [Google Scholar]
- Kalliovirta, J.; Tokola, T. Functions for estimating stem diameter and tree age using tree height, crown width and existing stand database information. Silva Fenn. 2005, 39, 227–248. [Google Scholar] [CrossRef] [Green Version]
- Lappi, J. Metsäbiometrian Menetelmiä [Methods of Forest Biometrics, in Finnish]; Silva Carelica 24; University of Joensuu: Kuopio, Finland, 1993. [Google Scholar]
- Eltner, A.; Schneider, D. Analysis of different methods for 3D reconstruction of natural surfaces from parallel-axes UAV images. Photogramm. Rec. 2015, 30, 279–299. [Google Scholar] [CrossRef]
- Ullman, S. The interpretation of structure from motion. Proc. R. Soc. Lond. Ser. B Biol. Sci. 1979, 203, 405–426. [Google Scholar]
- Puliti, S.; Ørka, H.O.; Gobakken, T.; Næsset, E. Inventory of small forest areas using an unmanned aerial system. Remote Sens. 2015, 7, 9632–9654. [Google Scholar] [CrossRef] [Green Version]
- Monnet, J.M.; Mermin, E.; Chanussot, J.; Berger, F. Tree top detection using local maxima filtering: A parameter sensitivity analysis. In Proceedings of the 10th International Conference on LiDAR Applications for Assessing Forest Ecosystems, Freiburg, Germany, 14–17 September 2010. [Google Scholar]
- Dutta, A. Fuzzy c-Means Classification of Multispectral Data Incorporating Spatial Contextual Information by Using Markov Random Field; ITC: Enschede, The Netherlands, 2009. [Google Scholar]
- Gonzalez, R.C.; Woods, R.E.; Eddins, S.L. Digital Image Processing Using MATLAB; Pearson Education: Chennai, India, 2004; Chapter 11. [Google Scholar]
- Lürig, C.; Kobbelt, L.; Ertl, T. Hierarchical solutions for the deformable surface problem in visualization. Graph. Model. 2000, 62, 2–18. [Google Scholar] [CrossRef] [Green Version]
- Xu, C.; Prince, J.; Flow, G.V. A new external force for snakes. In Proceedings of the 1997 IEEE Computer Society Conference on Computer Vision and Pattern Recognition, San Juan, PR, USA, 17–19 June 1997; pp. 66–71. [Google Scholar]


| Plot | Number | Tree Height (m) | Crown Diameter (m) | DBH (mm) | ||||||
|---|---|---|---|---|---|---|---|---|---|---|
| ID | of Trees | Max | Min | Mean | Max | Min | Mean | Max | Min | Mean |
| Plot 1 | 46 | 8.4 | 6.6 | 3.3 | 1.4 | 6.6 | 2.4 | 66.5 | 172.2 | 119.5 |
| Plot 2 | 55 | 8.9 | 6.7 | 3.6 | 1.5 | 6.7 | 2.9 | 62.3 | 186.4 | 112.9 |
| Plot 3 | 52 | 10.0 | 7.8 | 4.9 | 1.6 | 7.8 | 3.4 | 78.5 | 168.0 | 119.1 |
| Plot 4 | 49 | 9.3 | 6.8 | 4.6 | 1.1 | 6.8 | 3.8 | 67.4 | 192.0 | 130.2 |
| Plot 5 | 41 | 9.1 | 6.9 | 4.3 | 1.7 | 6.9 | 3.3 | 70.6 | 162.3 | 123.9 |
| Plot 6 | 55 | 9.3 | 7.4 | 5.4 | 1.2 | 7.4 | 2.9 | 70.0 | 170.1 | 124.7 |
| Plot 7 | 33 | 8.4 | 7.5 | 6.2 | 1.1 | 7.5 | 2.7 | 70.5 | 187.3 | 138.0 |
| Plot 8 | 52 | 9.3 | 7.6 | 5.1 | 1.4 | 7.6 | 3.1 | 80.4 | 160.5 | 130.8 |
| Parameter | Value |
|---|---|
| Bands CW, FWHM (nm) | B1: 528, 5; B2: 570, 17; B3: 645, 17; B4: 680, 10; B5: 900, 20 |
| Focal length (mm) | 5.4 |
| Pixel Size (m) | 3.75 |
| HFOV () | 47.2 |
| Bit depth (bits) | 12 |
| Nominal speed (m/) | 4 |
| Altitude (m) | 26 |
| GSD/band @ 60 m (cm) | 4 |
| Average flight duration (min) | 25 |
| Plot | S3-ITD | WS-ITD | BF-ITD | |||
|---|---|---|---|---|---|---|
| ID | IoU | CAD () | IoU | CAD () | IoU | CAD () |
| Plot 1 | 0.79 | 0.25 | 0.75 | 1.20 | 0.73 | 0.51 |
| Plot 2 | 0.83 | 0.32 | 0.76 | 1.31 | 0.78 | 0.63 |
| Plot 3 | 0.85 | 0.12 | 0.77 | 0.72 | 0.81 | 0.28 |
| Plot 4 | 0.84 | 0.10 | 0.77 | 1.13 | 0.79 | 0.48 |
| Plot 5 | 0.82 | 0.23 | 0.65 | 1.26 | 0.75 | 0.73 |
| Plot 6 | 0.85 | −0.08 | 0.74 | 0.87 | 0.78 | −0.05 |
| Plot 7 | 0.81 | 0.11 | 0.64 | 0.74 | 0.75 | 0.24 |
| Plot 8 | 0.87 | 0.04 | 0.78 | 0.69 | 0.82 | −0.12 |
| Image Entropy | Method | ME (cm) | MAE (cm) | RMSE (cm) |
|---|---|---|---|---|
| S3-ITD | −0.80 | 4.42 | 5.24 | |
| Group 1 (0–3) | WS-ITD | 1.14 | 6.16 | 7.65 |
| BF-ITD | −1.20 | 5.25 | 6.35 | |
| S3-ITD | −1.20 | 4.90 | 5.90 | |
| Group 2 (3–6) | WS-ITD | 1.30 | 6.61 | 8.85 |
| BF-ITD | −2.83 | 7.45 | 7.40 | |
| S3-ITD | −2.87 | 5.94 | 8.80 | |
| Group 3 (≥6) | WS-ITD | −2.24 | 6.55 | 10.90 |
| BF-ITD | −2.78 | 7.25 | 8.96 |
Publisher’s Note: MDPI stays neutral with regard to jurisdictional claims in published maps and institutional affiliations. |
© 2022 by the authors. Licensee MDPI, Basel, Switzerland. This article is an open access article distributed under the terms and conditions of the Creative Commons Attribution (CC BY) license (https://creativecommons.org/licenses/by/4.0/).
Share and Cite
Harikumar, A.; D’Odorico, P.; Ensminger, I. Combining Spectral, Spatial-Contextual, and Structural Information in Multispectral UAV Data for Spruce Crown Delineation. Remote Sens. 2022, 14, 2044. https://doi.org/10.3390/rs14092044
Harikumar A, D’Odorico P, Ensminger I. Combining Spectral, Spatial-Contextual, and Structural Information in Multispectral UAV Data for Spruce Crown Delineation. Remote Sensing. 2022; 14(9):2044. https://doi.org/10.3390/rs14092044
Chicago/Turabian StyleHarikumar, Aravind, Petra D’Odorico, and Ingo Ensminger. 2022. "Combining Spectral, Spatial-Contextual, and Structural Information in Multispectral UAV Data for Spruce Crown Delineation" Remote Sensing 14, no. 9: 2044. https://doi.org/10.3390/rs14092044
APA StyleHarikumar, A., D’Odorico, P., & Ensminger, I. (2022). Combining Spectral, Spatial-Contextual, and Structural Information in Multispectral UAV Data for Spruce Crown Delineation. Remote Sensing, 14(9), 2044. https://doi.org/10.3390/rs14092044